


Abstract
The high penetration of renewable energy introduces strong uncertainty into power system operating conditions, making it difficult for conventional planning methods to effectively satisfy N-1 security verification requirements. To address this issue, this paper proposes an N-1 security-constrained 8760-hour power flow generation method (N-1-SC-8760-PFGM), formulated as a mixed-integer nonlinear programming (MINLP) problem. To overcome the computational intractability of direct solution, an energy-power-reactive power co-optimization method is developed based on objective consistency and solution path coordination. By employing a consistency-oriented objective function, a pre-embedded N-1 constraint mechanism, and a “verification–augmentation–re-optimization” solution strategy, the proposed method overcomes the limitations of traditional sequential optimization approaches, such as stage-wise independent objectives, insufficient coordination of N-1 constraints, and the lack of iterative re-optimization mechanisms during operating state adjustments. Case studies on modified IEEE 39-bus and IEEE 300-bus systems demonstrate that the proposed method achieves superior convergence and computational efficiency compared with conventional decomposition-based methods, and can efficiently generate full-year power flow profiles that satisfy N-1 security constraints.
1. Introduction
The high penetration of renewable energy introduces significant diversity and uncertainty into power system operating scenarios, leading to operational challenges such as difficulty in meeting operational assessment requirements and increasing curtailment of wind and solar power [1,2,3]. Although these challenges manifest as operational feasibility issues, the underlying cause is the inadequacy of planning schemes to accommodate the diverse operating conditions associated with high renewable penetration [4,5,6]. Therefore, to fundamentally address these operational challenges, it is necessary to revisit the planning stage and develop more refined and forward-looking planning strategies.
Current planning approaches are typically based on representative or sampled scenarios [7], which are insufficient to effectively address N-1 security verification requirements under massive and highly fluctuating renewable generation scenarios [8]. As a result, planning schemes often exhibit insufficient security margins and frequent curtailment in actual operation [9,10,11]. To overcome this limitation, it is essential to develop an N-1 security-constrained 8760-hour power flow generation method, which can realistically reflect system operational risks and investment effectiveness under contingency conditions.
Essentially, N-1-SC-8760-PFGM aims to identify a set of feasible power flow solutions that satisfy physical constraints such as power balance and branch flow limits, and can thus be formulated as a constraint satisfaction problem [12,13,14]. To ensure that the generated time-series power flows approximate realistic dispatch solutions, appropriate optimization objectives—such as economic efficiency, reliability, and renewable energy utilization—can be incorporated, thereby transforming the problem into an optimization framework. However, this transformation introduces significant computational challenges due to the large-scale, nonlinear, and mixed-integer nature of the problem.
To address these challenges, existing solution approaches can be broadly categorized into two types: holistic optimization based on simplified models and multi-stage sequential decomposition methods. The former includes techniques such as dimensionality reduction, linearization, and branch-and-bound [15], but generally suffers from trade-offs between model simplification and accuracy, accumulated linearization errors, and scalability limitations, leading to coarse and unrealistic results. The latter decomposes the original time-series simulation problem into sequential stages, including energy balance (EB), power balance (PB), reactive power optimization (RPO), N-1 verification (N1V), and N-1 security-constrained operating state adjustment (N1A) [16]. Although this approach reduces computational complexity at each stage, it has inherent drawbacks:
- Lack of global consistency: The objective functions of subproblems are difficult to align with the global objective, and locally optimal solutions obtained in each stage may deviate from the global optimum [17].
- Insufficient coordination among stages: There is a lack of coupling between variables and constraints across subproblems. For example, N-1 constraints are often neglected in the energy and power balance stages, making it difficult to obtain feasible solutions in subsequent N1A stages. Moreover, the absence of a closed-loop iterative mechanism in N1A prevents effective re-optimization [18].
The inherent deficiencies of the above-mentioned conventional pathway essentially stem from its shortcomings in decomposition structure, objective alignment mechanism, N-1 constraint handling approach, and 8760-hour implementation capability. To clearly position the contributions of the proposed method, Table 1 provides a systematic comparison between the proposed method and conventional SCUC/SCOPF, EB–PB–RPO–N1V–N1A sequential decomposition, contingency screening methods, and full-year time-series simulation methods.
Table 1.
Comparison of Proposed Method with Conventional Approaches.
As shown in Table 1, existing methods either suffer from contradictions between decomposition structure and global consistency, or fail to consider N-1 constraints, or cannot support refined 8760-hour full-year simulations. To overcome the above limitations, this paper proposes a coordinated optimization method integrating energy balance, power balance, and reactive power optimization under N-1 security constraints. By constructing a unified objective and a coordinated solution pathway with feedback mechanisms, the proposed method enables efficient generation of 8760-hour power flow time series while ensuring N-1 security.
The main contributions of this work are summarized as follows:
- A consistency-oriented stage objective function is designed. The objective function of each subproblem is aligned with the minimization of the global operational cost. In the RPO stage, penalty terms on variable adjustments are incorporated to prevent locally optimal solutions from compromising global consistency.
- A security margin enhancement mechanism with pre-embedded N-1 constraints is developed. N-1 constraints are explicitly incorporated into the power balance stage using DC power flow, while the reactive power optimization stage ensures accurate satisfaction of N-1 security requirements using AC power flow. This mechanism guides power balance decisions to reserve sufficient regulatory headroom for reactive power optimization, alleviating the difficulty in satisfying N-1 constraints caused by insufficient inter-stage coordination in conventional methods.
- A closed-loop iterative mechanism within the PB and RPO stages is constructed. Following the solution logic of “check-supplement-reoptimize”, N-1 constraints are dynamically incorporated into the optimization model within the PB and RPO stages, triggering re-optimization and thereby improving overall solution efficiency.
The remainder of this paper is organized as follows. Section 2 introduces the N-1-SC-8760-PFGM problem and its mathematical formulation. Section 3 discusses the limitations of conventional multi-stage sequential decomposition methods and presents the proposed coordinated optimization approach in detail. Section 4 validates the proposed method on modified IEEE 39-bus and IEEE 300-bus systems, analyzing its convergence, computational efficiency, and capability for detailed time-series simulation. Section 5 concludes the paper.
2. Materials and Methods
The N-1 security criterion adopted in this paper is the transmission line N-1 contingency criterion. The contingency set includes all AC transmission lines whose outage would not result in system islanding. Following the outage of any single line in the contingency set, no overload occurs on the remaining system equipment. Based on this, the N-1-SC-8760-PFGM problem aims to generate a set of feasible power flow solutions over 8760 consecutive hourly periods by minimizing the total system operating cost and maximizing renewable energy utilization. The generated solutions must simultaneously satisfy instantaneous physical constraints, temporal coupling constraints, and N-1 security constraints. This process determines the unit commitment status, active and reactive power outputs, voltage levels, and energy storage operation strategies throughout the entire year, thereby providing full time-series operational data for refined power system planning evaluation [24]. The physical constraints involved in this problem span multiple dimensions, including system security, equipment operation limits, and contingency protection requirements, as summarized in Table 2. Due to the strong coupling among these constraints, the N-1-SC-8760-PFGM problem becomes a highly challenging optimization problem.
Table 2.
Constraints of the N-1-SC-8760-PFGM Problem.
The objective function and constraints of the problem are formulated as follows.
2.1. Objective Function
The objective function of the N-1-SC-8760-PFGM problem is given as follows [25]:
where denotes the start-up and shut-down cost of synchronous generators, denotes the generation cost of synchronous generators, and denotes the penalty cost for renewable energy curtailment.
where and denote the start-up and shut-down costs of unit ; denotes the active power output of generating unit at time period ; denotes the curtailed power of renewable energy at node during time period ; and denotes the penalty coefficient for renewable energy curtailment.
2.2. Constraints
Referring to Table 1, the mathematical formulations and descriptions of the physical constraints in the N-1-SC-8760-PFGM problem are summarized in Table 3 [26,27,28,29,30].
Table 3.
Mathematical Formulation of N-1-SC-8760-PFGM Constraints.
3. Reformulation Methods
In solving the N-1-SC-8760-PFGM problem, it is common to decompose it into a sequential solution framework consisting of a MILP model for energy balance and power balance, and an NLP model for reactive power optimization. This section first reviews conventional decomposition methods and then proposes a new approach based on objective consistency and solution coordination.
3.1. Conventional Method
Conventional methods decompose the original problem into a sequential optimization pathway denoted as “EB–PB–RPO–N1V–N1A.” In this framework, the EB stage performs a preliminary check of the annual energy totals for 8760-hour wind and solar generation and load demand, assessing whether the system may experience long-term energy deficits or surpluses, thereby avoiding unnecessary computations in subsequent stages [31,32]. The objective of this stage is to minimize the generation cost of synchronous units and the penalty cost for renewable energy curtailment. Subject to constraints including system active power balance and the upper/lower output limits of generation resources, the generation energy, active power output of each power source, and the operating states of energy storage systems are determined. The active power balance constraints employed in this stage constitute a simplified representation of the AC power flow constraints in the original problem. The resulting model is formulated as follows:
Among them, denotes the net active power injection at bus during time ; denotes total system load at time period ; represents the total number of buses in the system.
Additionally, an additional energy balance constraint needs to be added to the constraints.
where denotes the energy output of each generator, and denotes the corresponding power output of each generator.
Based on the above, the optimization model for the EB stage is formulated as follows:
In the PB stage, DC power flow is used for optimization, with the addition of DC branch active power transmission limits derived from a linear approximation of the AC power flow model of the original problem.
where denotes the DC active power flow on branch at time period , and denotes the corresponding maximum transmission limit.
The PB stage aims to minimize the operating cost, generator start-up and shut-down costs, and penalty cost for renewable energy curtailment, while determining the real-time power generation under line, unit and other constraints to achieve system active power balance [33,34]. The optimization model is formulated as follows:
The RPO stage optimizes reactive power distribution based on the active power outputs, aiming to minimize network losses. Under the constraints of AC power flow, voltage security, and other related constraints, reactive power outputs are adjusted to ensure system voltage security [35]. The corresponding optimization model is formulated as follows:
Here, the objective function represents the minimization of network losses, and L denotes the set of all transmission lines in the system.
The N1V stage verifies, on an hourly basis, whether each operating snapshot satisfies the safety constraints given in Equations (S3) and (S5) under the anticipated contingency set. If a snapshot fails the verification, the N1A stage is initiated, in which control variables such as generator outputs and reactive power compensation are adjusted to restore compliance with the N-1 security constraints. If these adjustments are ineffective, the snapshot is deemed infeasible. In the N1A stage, the objective is to minimize network losses. Compared with the RPO stage, the constraint set is augmented with AC power flow equations and branch transmission limits under N-1 contingencies. The corresponding optimization model is formulated as follows:
By comparing the constraint conditions of the optimization models in Equations (5) and (7)–(9), it can be seen that the constraints in the subsequent stages are added to and modified based on those in the previous stage. The specific steps of the sequential optimization pathway are as follows:
Step 1-1 (input): Input the network topology, generator and line static parameters, as well as 8760-hour dynamic data including renewable generation and load.
Step 1-2 (EB): Minimize subject to the constraints in Equation (5) to determine the variables , , , and . The results are then passed to the PB stage.
Step 1-3 (PB): Minimize subject to the constraints in Equation (7) to determine the variables , , , , , , and . The results are then passed to the RPO stage.
Step 1-4 (RPO): Minimize network losses subject to the constraints in Equation (8) to determine the variables , , , , and . The results are then passed to the N1V stage.
Step 1-5 (N1V): Check whether any branch violates limits or fails to converge under N-1 contingencies. If no violations occur and the power flow converges, proceed to Step 1-7 to output the 8760-hour operating schedule; otherwise, proceed to Step 1-6.
Step 1-6 (N1A): Add N-1 security constraints based on the RPO stage and adjust the operating schedule according to the model in Equation (9). If a feasible 8760-hour operating schedule satisfying N-1 security exists, proceed to Step 1-7 and output the results; otherwise, report infeasibility.
Step 1-7 (output): Output the 8760-hour operating schedule satisfying all security constraints, or indicate infeasibility.
The above method provides a feasible pathway for solving the N-1-SC-8760-PFGM problem to some extent, but it exhibits clear inconsistencies with the global objective and a lack of stage coordination. First, the objective functions of each stage are independent: the EB stage focuses on operating costs and promoting renewable energy utilization, the PB stage aims to minimize operating costs, start-up and shut-down costs, and penalties for renewable energy curtailment, while the RPO stage targets network loss minimization. The RPO stage is not effectively aligned with the overall objective of minimizing the total system operating cost, which may lead to local optima and prevent achieving a globally optimal solution over the entire planning horizon. Second, the N-1 security constraints are only enforced in the later verification stage and are not considered in advance during the PB active power dispatch. This delayed propagation of constraints can result in insufficient security margins in the early-stage operating schedule, limiting the adjustment space after violations are detected in subsequent verification, and making it difficult to converge to a globally feasible solution.
3.2. Proposed Method
To address the limitations of conventional solution pathways, the original problem is decomposed into three stages: energy balance, N-1 security-constrained active power balance, and N-1 security-constrained reactive power dispatch, forming a new sequential optimization pathway. The EB stage follows the same optimization logic as in conventional methods, while improvements are proposed in the PB and RPO stages.
First, the N-1 security constraints for transmission lines are linearly approximated into a DC power flow form and incorporated in advance into the PB stage, guiding the PB stage to generate an active power dispatch scheme that satisfies N-1 contingency requirements. The additional constraints introduced in this stage are as follows:
The objective function and constraint set for this stage are formulated as follows:
Second, in the RPO stage, the reactive power objective function is designed with a consistency-oriented approach, taking the global operating cost, power adjustment amounts, and voltage deviations as objectives. This ensures that the sub-objectives are aligned with the total cost minimization of the original problem. At the same time, the N-1 security constraints are incorporated in advance at the RPO stage to mitigate infeasibility issues during subsequent verification. The corresponding optimization model is formulated as follows:
Here, denotes the active power transferred from the PB stage to the RPO stage, is the penalty factor for power deviation, and is the penalty factor for voltage deviation.
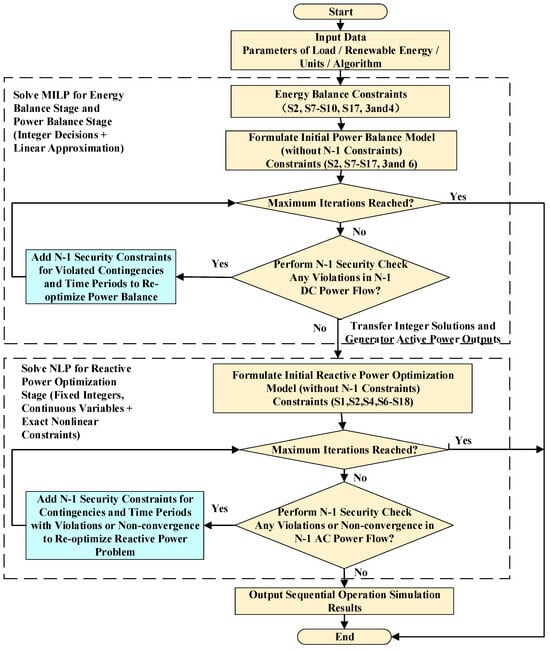
Furthermore, in the initial PB and RPO stages, the N-1 security constraints are not embedded as fixed constraints. Instead, a “verification–augmentation–re-optimization” solution logic is adopted, allowing the N-1 security constraints to be dynamically incorporated into the model during the optimization process. Based on this approach, the sequential optimization pathway of the proposed method proceeds as follows:
Step 2-1 (input): Same as Step 1-1 (input).
Step 2-2 (EB): Same as Step 1-2 (EB).
Step 2-3 (PB): Perform optimization using the model in Equation (7) for the initial state to determine the initial values of , , , , , , and . The results are then passed to the N-1 DC power flow verification (N1V-DC).
Step 2-4 (N1V-DC): Check whether any branch exceeds its DC power flow limits under N-1 contingencies. If no violations occur, proceed to Step 2-5; otherwise, incorporate the N-1 constraints into Step 2-3 and re-optimize PB using the model in Equation (11).
Step 2-5 (RPO): Perform initial optimization using as the objective and subject to the constraints in Equations (S1), (S2), (S4) and (S6)–(S18) to determine the initial values of , , , , and . The results are then passed to the N-1 AC power flow verification (N1V-AC).
Step 2-6 (N1V-AC): Check whether any power flow fails to converge or any AC branch exceeds its limits under N-1 contingencies. If the power flow converges and no violations occur, proceed to Step 2-7 to output the 8760-hour operating schedule; otherwise, incorporate the N-1 constraints into Step 2-5 and re-optimize N-1RPO using the model in Equation (12).
Step 2-7 (output): Output the 8760-hour operating schedule satisfying all security constraints, or report infeasibility.
By comparing Equations (8) and (12), it can be seen that the proposed method redesigns the objective function of the RPO stage based on a consistency-oriented approach. Meanwhile, the constraints of the original problem are reformulated according to solution coordination principles. Specifically, DC N-1 contingencies are considered during unit commitment and active power dispatch, while AC N-1 contingencies are incorporated during reactive power and voltage regulation. As a result, the N-1 security constraints are substantially shifted forward in the optimization process, as shown in Table 4.
Table 4.
Constraint Sets at Each Stage of the Proposed Optimization Pathway.
The EB stage of the MILP model uses only energy storage-related variables and power generation variables. Based on the EP stage, the PB stage of the MILP model additionally introduces the start-up/shut-down states and action variables of synchronous generators. In contrast, the RPO stage of the NLP model mainly involves variables related to voltage, reactive power, and susceptance. The utilization of the original problem’s control variables in each stage is summarized in Table 5.
Table 5.
Decision Variables at Each Stage of the Optimization Process.
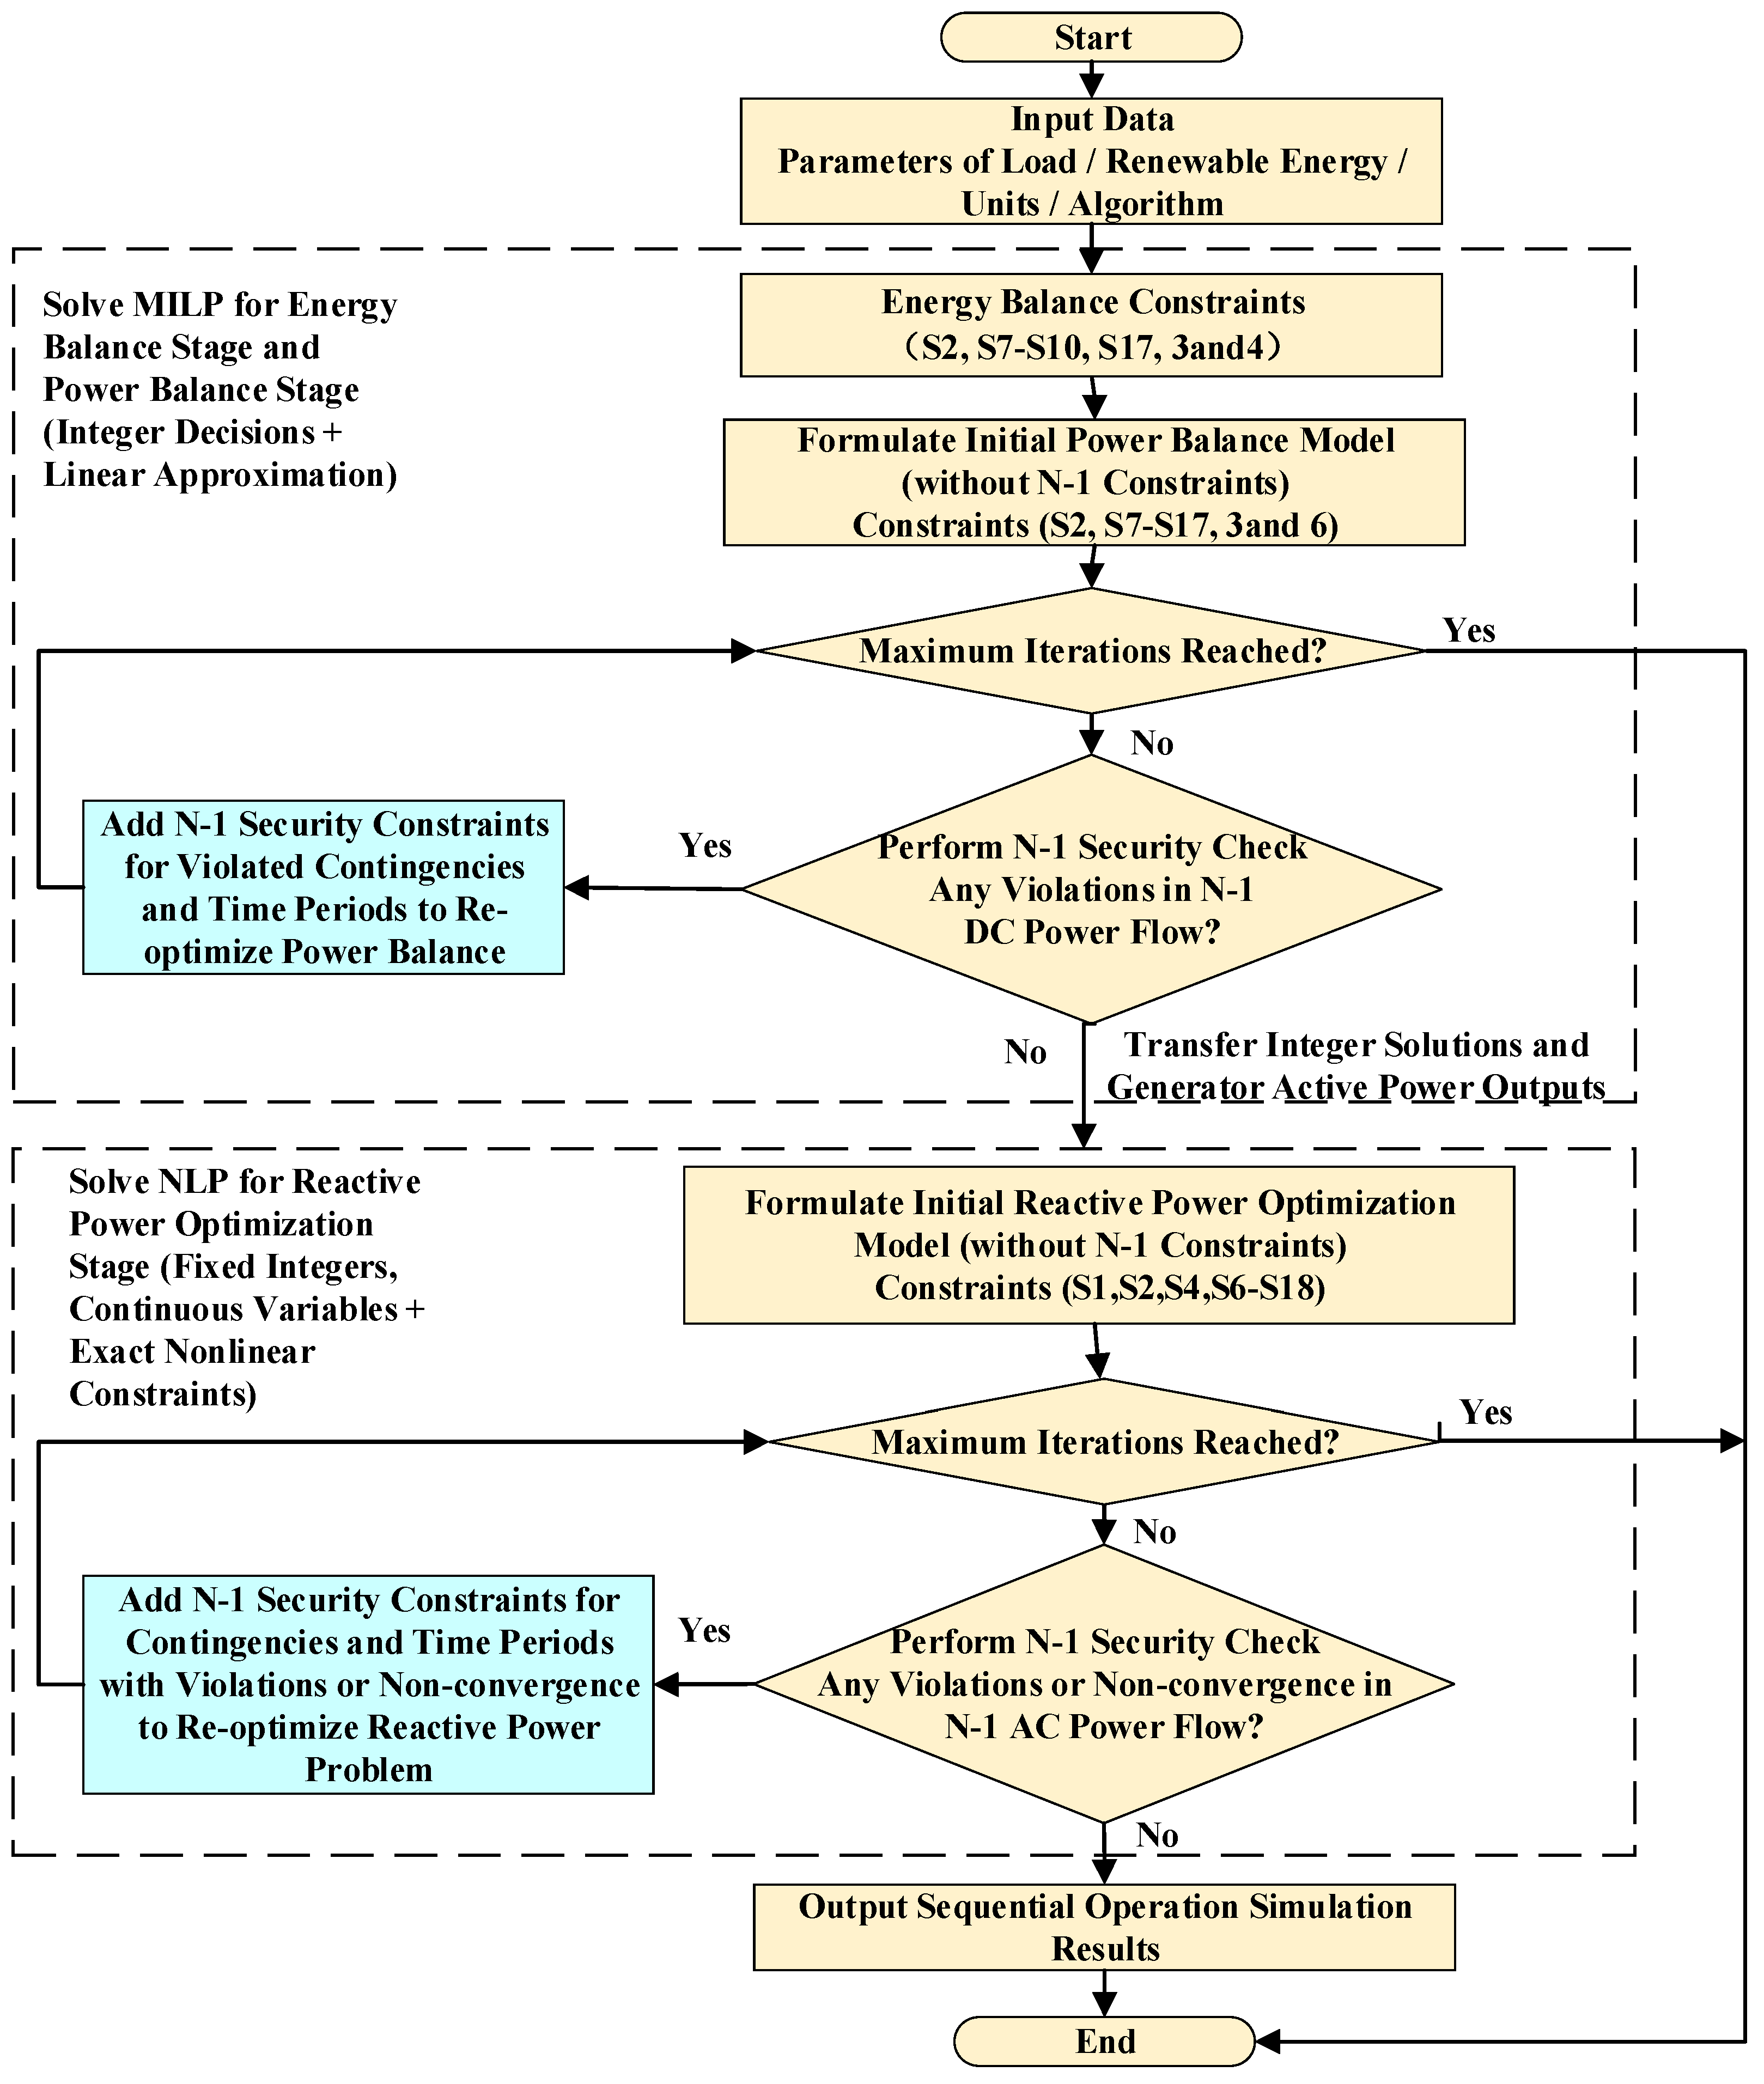
Meanwhile, the solution pathway incorporates a two-stage closed-loop “verification–augmentation–re-optimization” strategy, significantly reducing the iterative computational burden of N1A in conventional approaches. The iterative process terminates when either of the following conditions is satisfied: (i) all N-1 contingencies in the current anticipated contingency set have completed safety verification, and no new constraint violations are introduced; or (ii) the maximum number of iterations is reached, in which case the algorithm terminates and outputs the current result. In the first stage, a closed loop is established between the PB stage and the N-1 DC power flow verification (N1V-DC), where the PB-stage active power plan is checked by N1V-DC. If any violations occur, additional constraints are incorporated and PB is re-optimized to ensure N-1 DC security of the active power schedule. In the second stage, a closed loop is established between the RPO stage and the N-1 AC power flow verification (N1V-AC). If N1V-AC detects power flow divergence or branch limit violations, constraints are augmented and RPO is re-optimized to achieve coordinated N-1 security for both active and reactive power schedules. The specific workflow of the method proposed in this paper is shown in Figure 1.
Figure 1.
Flowchart of the sequential decomposition framework of the EB-PB-RPO method proposed in this paper.
3.3. Theoretical Property Analysis
This section analyzes the theoretical properties of the proposed decomposition and solution framework, mainly covering the upper bound of the number of augmented constraints, the correlation with classical constraint generation algorithms, and the feasibility demonstration of the final solution.
- Upper Bound of the Number of Augmented Constraints: Let the number of system buses be N, the total number of transmission lines participating in the N-1 security check be L, and the number of transmission lines under N-1 contingencies be C. Then, over T time periods, the theoretical upper bound of the number of augmented N-1 security constraints in the PB stage is , and that in the RPO stage is .
- Correlation with Classical Constraint Generation Algorithms: The proposed N-1 constraint dynamic augmentation strategy shares similarities with the feasible cut concept in Benders decomposition. Both approaches identify infeasible solutions and add constraints to eliminate invalid solutions. The difference lies in that the proposed method does not require computing dual variables of subproblems; instead, it directly augments constraints based on security violation results, thereby simplifying the solution procedure. This method belongs to a deterministic decomposition strategy based on dynamic constraint augmentation, which can stably obtain high-quality feasible solutions satisfying N-1 security constraints within a reasonable computation time, aligning with the engineering application requirements of power system planning and dispatching.
- Feasibility Analysis of the Final Solution: If the algorithm terminates due to the absence of security violations, the active power dispatch solution has passed the DC power flow security check under all anticipated contingencies, and the reactive power optimization results also satisfy the AC power flow constraints under all N-1 fault scenarios. Therefore, the obtained solution fully complies with all N-1 security constraints specified in the original MINLP model and possesses feasibility for the original problem.
4. Case Studies
To validate the effectiveness and engineering applicability of the proposed method, case studies are conducted based on modified IEEE 39-bus and IEEE 300-bus systems with high renewable penetration. The former is used to evaluate the solution feasibility and computational efficiency of the proposed method for the 8760-hour power flow generation problem under N-1 constraints compared with conventional sequential decomposition methods, while the latter is used to assess the method’s adaptability in larger systems.
4.1. Test Systems and Experimental Setup
- (1)
- Modified IEEE 39-Bus System
The modified system includes five thermal synchronous generators (located at buses 39, 31, 35, 37, and 38), 34 AC transmission lines (33 of which are configured with N-1 security without causing islanding), a wind farm connected at buses 32 and 33, PV plants at buses 36 and 30, and electrochemical energy storage systems at buses 34 and 23. Based on the base load of the IEEE 39-bus system and publicly available load datasets, a representative daily load profile was constructed. This daily profile was then scaled using weekly and monthly fluctuation factors to generate a 8760-hour annual load sequence that captures both seasonal and weekly variations. The system’s maximum, minimum, and annual average loads are set to 4178 MW, 2298 MW, and 2975 MW, respectively. The capacity allocation at each bus and the integration design for wind, solar, and storage are listed in Table 6, forming a system with high renewable penetration.
Table 6.
Modified IEEE 39-Bus System Configuration.
Hourly generation profiles for wind and PV units are obtained by multiplying hourly capacity factors with their rated capacities, followed by daily, weekly, and seasonal adjustments to generate an 8760-hour annual power generation time series with volatility and intermittency. Electrochemical energy storage systems are connected at buses 34 and 23, with a 4-h discharge duration at rated power. These settings ensure that the system realistically reflects operating conditions under high renewable generation penetration.
- (2)
- Modified IEEE 300-Bus System
The IEEE 300-bus standard system is modified by integrating renewable generation nodes as the second test case. This system contains 69 synchronous generators, 29 capacitor banks, 293 AC transmission lines, and 304 AC tie lines. The annual 8760-hour load profile has an average of 14,638 MW, a minimum of 10,738 MW, and a maximum of 22,113 MW, with a total annual electricity consumption of approximately 128.23 TWh. The daily load curves exhibit a typical double-peak pattern. The total installed capacity of the synchronous generators is 26,537 MVA, providing sufficient peaking capability.
- (3)
- Solution Methods and Comparison Setup
The experiments were conducted on the Business Operating System platform [36,37]. The EP and PB problems are solved using the Gurobi, while RPO and N1A are solved using the interior point method. Convergence is evaluated based on the number of iterations in the interior point method and the satisfaction of the N-1 security constraints. the conventional sequential decomposition method (EB-PB-RPO-N1V-N1A) and the proposed improved method are used as two comparative schemes. Both methods use the same initial operating conditions, solver parameters, and convergence criteria.
4.2. Case Study Results for the IEEE 39-Bus System
The effectiveness and engineering applicability of the proposed method are validated from two perspectives: convergence and operational indicators. In addition, the system’s energy dispatch and power flow generation results are analyzed to demonstrate the advantages of the proposed method in high-resolution simulation.
- (1)
- Algorithm Effectiveness
By setting different upper limits for the interior-point method iterations, the convergence performance of the conventional sequential decomposition method and the proposed improved algorithm is compared, with particular emphasis on the N-1 pass rate. The critical lower voltage limit adopted in this paper is a commonly used engineering value of 0.9 p.u. The results of all performance indices are presented in Table 7.
Table 7.
Algorithm Effectiveness.
As shown in Table 7, under 200 interior-point iterations, the conventional method requires 171 min of computation time, while the N-1 pass rate is only 56.21% and the AC power flow convergence rate is merely 62.36%. The root cause is that N-1 constraints are not embedded in the PB stage and the objective functions among different stages are inconsistent, resulting in insufficient security margins in the active power dispatch scheme and causing feasible operating sections to be misjudged as infeasible. Although increasing the iteration limit prolongs the computation time (reaching 339 min at 1000 iterations), it still cannot fundamentally resolve the problem. In contrast, the proposed method achieves both a 100% N-1 pass rate and a 100% AC power flow convergence rate with only 200 iterations and 28 min of computation time. In particular, the average number of newly added N-1 constraints is reduced from 4059 in the conventional method to 8.003, corresponding to a reduction ratio of 99.804%, which is the key reason for the substantial improvement in computational efficiency. The results demonstrate that the proposed objective-consistency design, N-1 constraint pre-embedding mechanism, and the “screening–augmentation–reoptimization” strategy can effectively ensure coordination consistency among all optimization stages, significantly improving solution stability and security feasibility while reducing the model scale.
From the perspective of engineering applications, the proposed method shortens the computation time for generating and security-checking the full 8760-hour annual power flow scenarios to only 28 min, enabling planners to evaluate more planning schemes within the same time frame and thereby significantly improving planning efficiency and decision-making quality. In terms of system security, even with 1000 interior-point iterations, the conventional method achieves an N-1 pass rate of only 90.94%. This implies that, during actual operation, the planning scheme would face security risks under N-1 contingencies for approximately 793 h per year, potentially causing branch overloads, voltage violations, or even cascading failures. In contrast, the proposed method achieves a 100% N-1 pass rate over all 8760 hourly operating conditions, eliminating such hidden security risks and providing planners with a reliable planning scheme capable of safe operation under N-1 contingencies at any time throughout the year, demonstrating significant engineering safety value and practical applicability.
In addition, due to the convergence difficulties of the conventional method, the economic indices in Table 7 are calculated based on the power balance results. Since different interior-point iteration limits do not affect the power balance outcomes, the economic indices of the conventional method remain unchanged. From the economic perspective, the annual production cost of the proposed method is 1,740,912,873 RMB, which is slightly higher than the 1,738,566,856 RMB of the conventional method, while the total operating cost increases by only about 0.13%. This indicates that the proposed method can significantly improve system security and reliability at only a small additional economic cost, achieving a good balance between security and economy. Meanwhile, the proposed method attains an energy storage utilization rate of 52.02%, indicating that it can more effectively exploit the flexible regulation capability of energy storage systems, thereby improving renewable energy accommodation and system operational flexibility.
From the perspective of network operating conditions, under the proposed method, the maximum branch loading rate is 78.34%, the average branch loading rate is 24.49%, and the minimum voltage stability margin is 0.055. These results indicate that the overall power flow distribution is relatively balanced, sufficient transmission margins are maintained, and the operating point remains at a safe distance from the voltage stability boundary, demonstrating favorable static voltage stability performance. This further verifies that the proposed method can simultaneously satisfy N-1 security constraints while maintaining adequate operational security margins and supporting renewable-energy-friendly integration.
- (2)
- Algorithm adaptability
To further validate the adaptability of the proposed algorithm, this paper constructs different calculation scenarios for the 8760-hour time-series simulation based on the Monte Carlo method. Table 8 presents the calculation results for five different 8760-hour time-series simulation scenarios.
Table 8.
Algorithm adaptability.
As shown in Table 8, the proposed algorithm can successfully solve all five different 8760-hour operation scenarios, demonstrating that the algorithm has certain adaptability to different calculation scenarios.
To further validate the stability of the proposed algorithm, 20 independent simulation tests were conducted under fixed input data and solver parameter settings. The results show that, within a numerical precision of 0.001, the algorithm consistently converges to the same solution, verifying the good solution stability of the proposed method.
- (3)
- Case Study Results for the IEEE 39-Bus System
To further validate the high-resolution simulation capability of the proposed method, the system’s annual operating characteristics are visualized based on the N-1 compliant solutions.
Figure 2 shows the generation composition of all types of power sources over the full 8760-hour year, with an inset magnifying an 80-h period to highlight short-term variations. As observed in the inset, the load curve exhibits a typical double-peak pattern. Thermal generators provide smooth output, stably serving the baseload with load factors maintained within reasonable limits, while sufficient spinning reserves are reserved for N-1 contingencies. Wind generation displays pronounced fluctuations, and PV generation exhibits periodic patterns. The storage units respond rapidly to sudden drops in wind output or load spikes (e.g., hours 4220 and 4245) and charge during periods of high PV or wind output (e.g., hours 4243 and 4270). These results demonstrate that the proposed method can optimize the coordinated scheduling of generation, storage, and load across all time scales, ensuring that all 8760 h satisfy N-1 security constraints while enabling hourly tracking of the system’s power balance adjustments.
Figure 2.
Stacked Area Plot of Power Generation over 8760 h for the 39-Bus System.
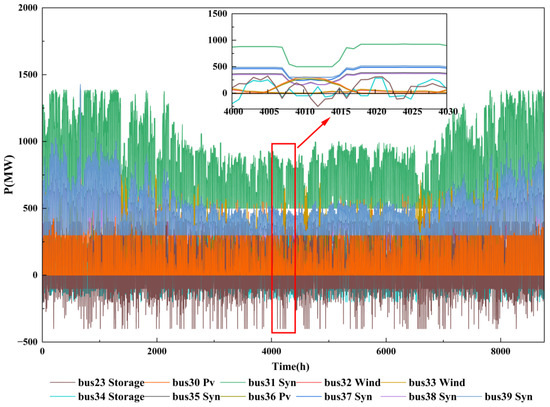
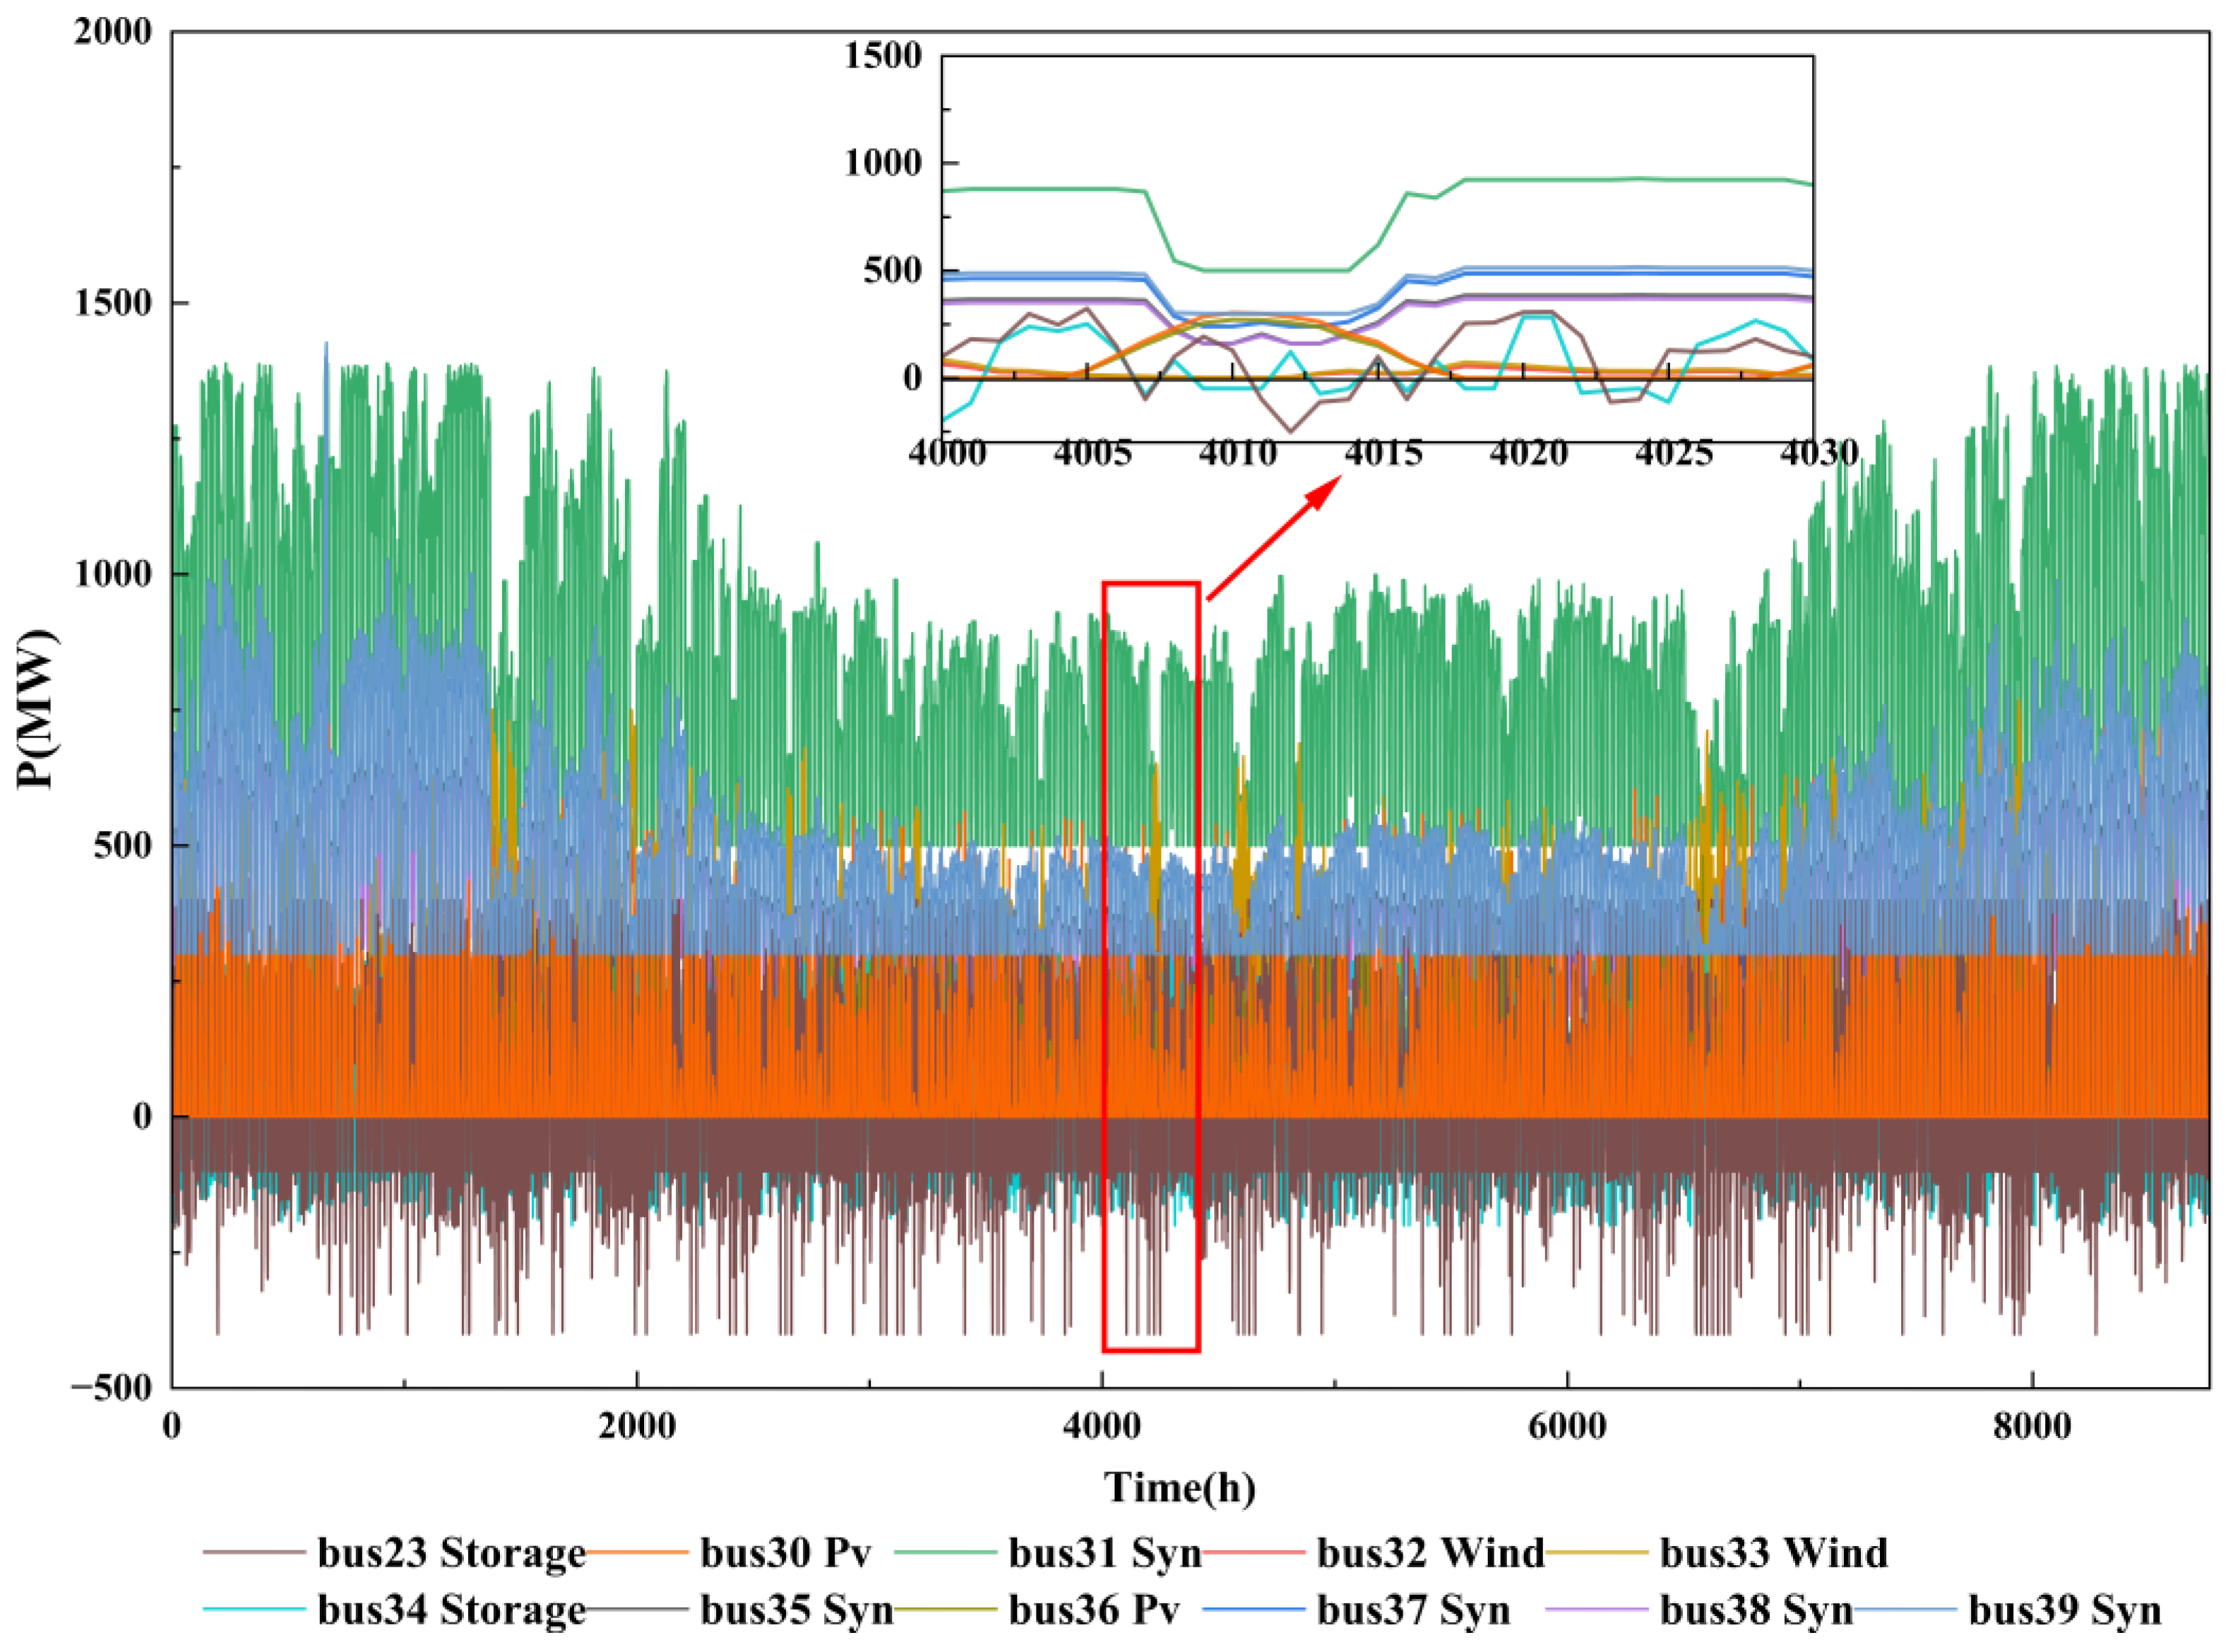
Figure 3 presents the active power output of 11 generation nodes in the IEEE 39-bus system over the full 8760-hour year. As shown, the output characteristics of each node are closely related to its generation type. The system includes five thermal generators, all operating well below their rated capacities; this low-load operation reserves sufficient spinning reserves for N-1 contingencies. The two wind and two PV units exhibit strong fluctuations, particularly at bus 30, where output varies dramatically throughout the year. Storage nodes dynamically adjust their charge and discharge strategies according to the system load. These node-level output patterns validate the effectiveness of the proposed method. First, by embedding N-1 DC constraints in the power balance stage, the generator commitment is guided to maintain low load factors, reserving adequate security margins for subsequent contingency scenarios. Second, storage units automatically adjust their charge and discharge power based on system supply–demand conditions, smoothing net load fluctuations and demonstrating the optimization of storage strategies in the power balance stage. Finally, the coordinated operation of all nodes confirms that stage-wise objectives are aligned with minimizing total system operating costs, resulting in an economically reasonable allocation among thermal, renewable, and storage generation.
Figure 3.
Active Power Output of Selected Generators for the 39-bus system.
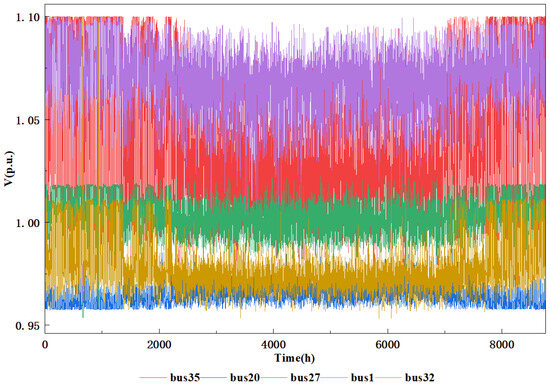
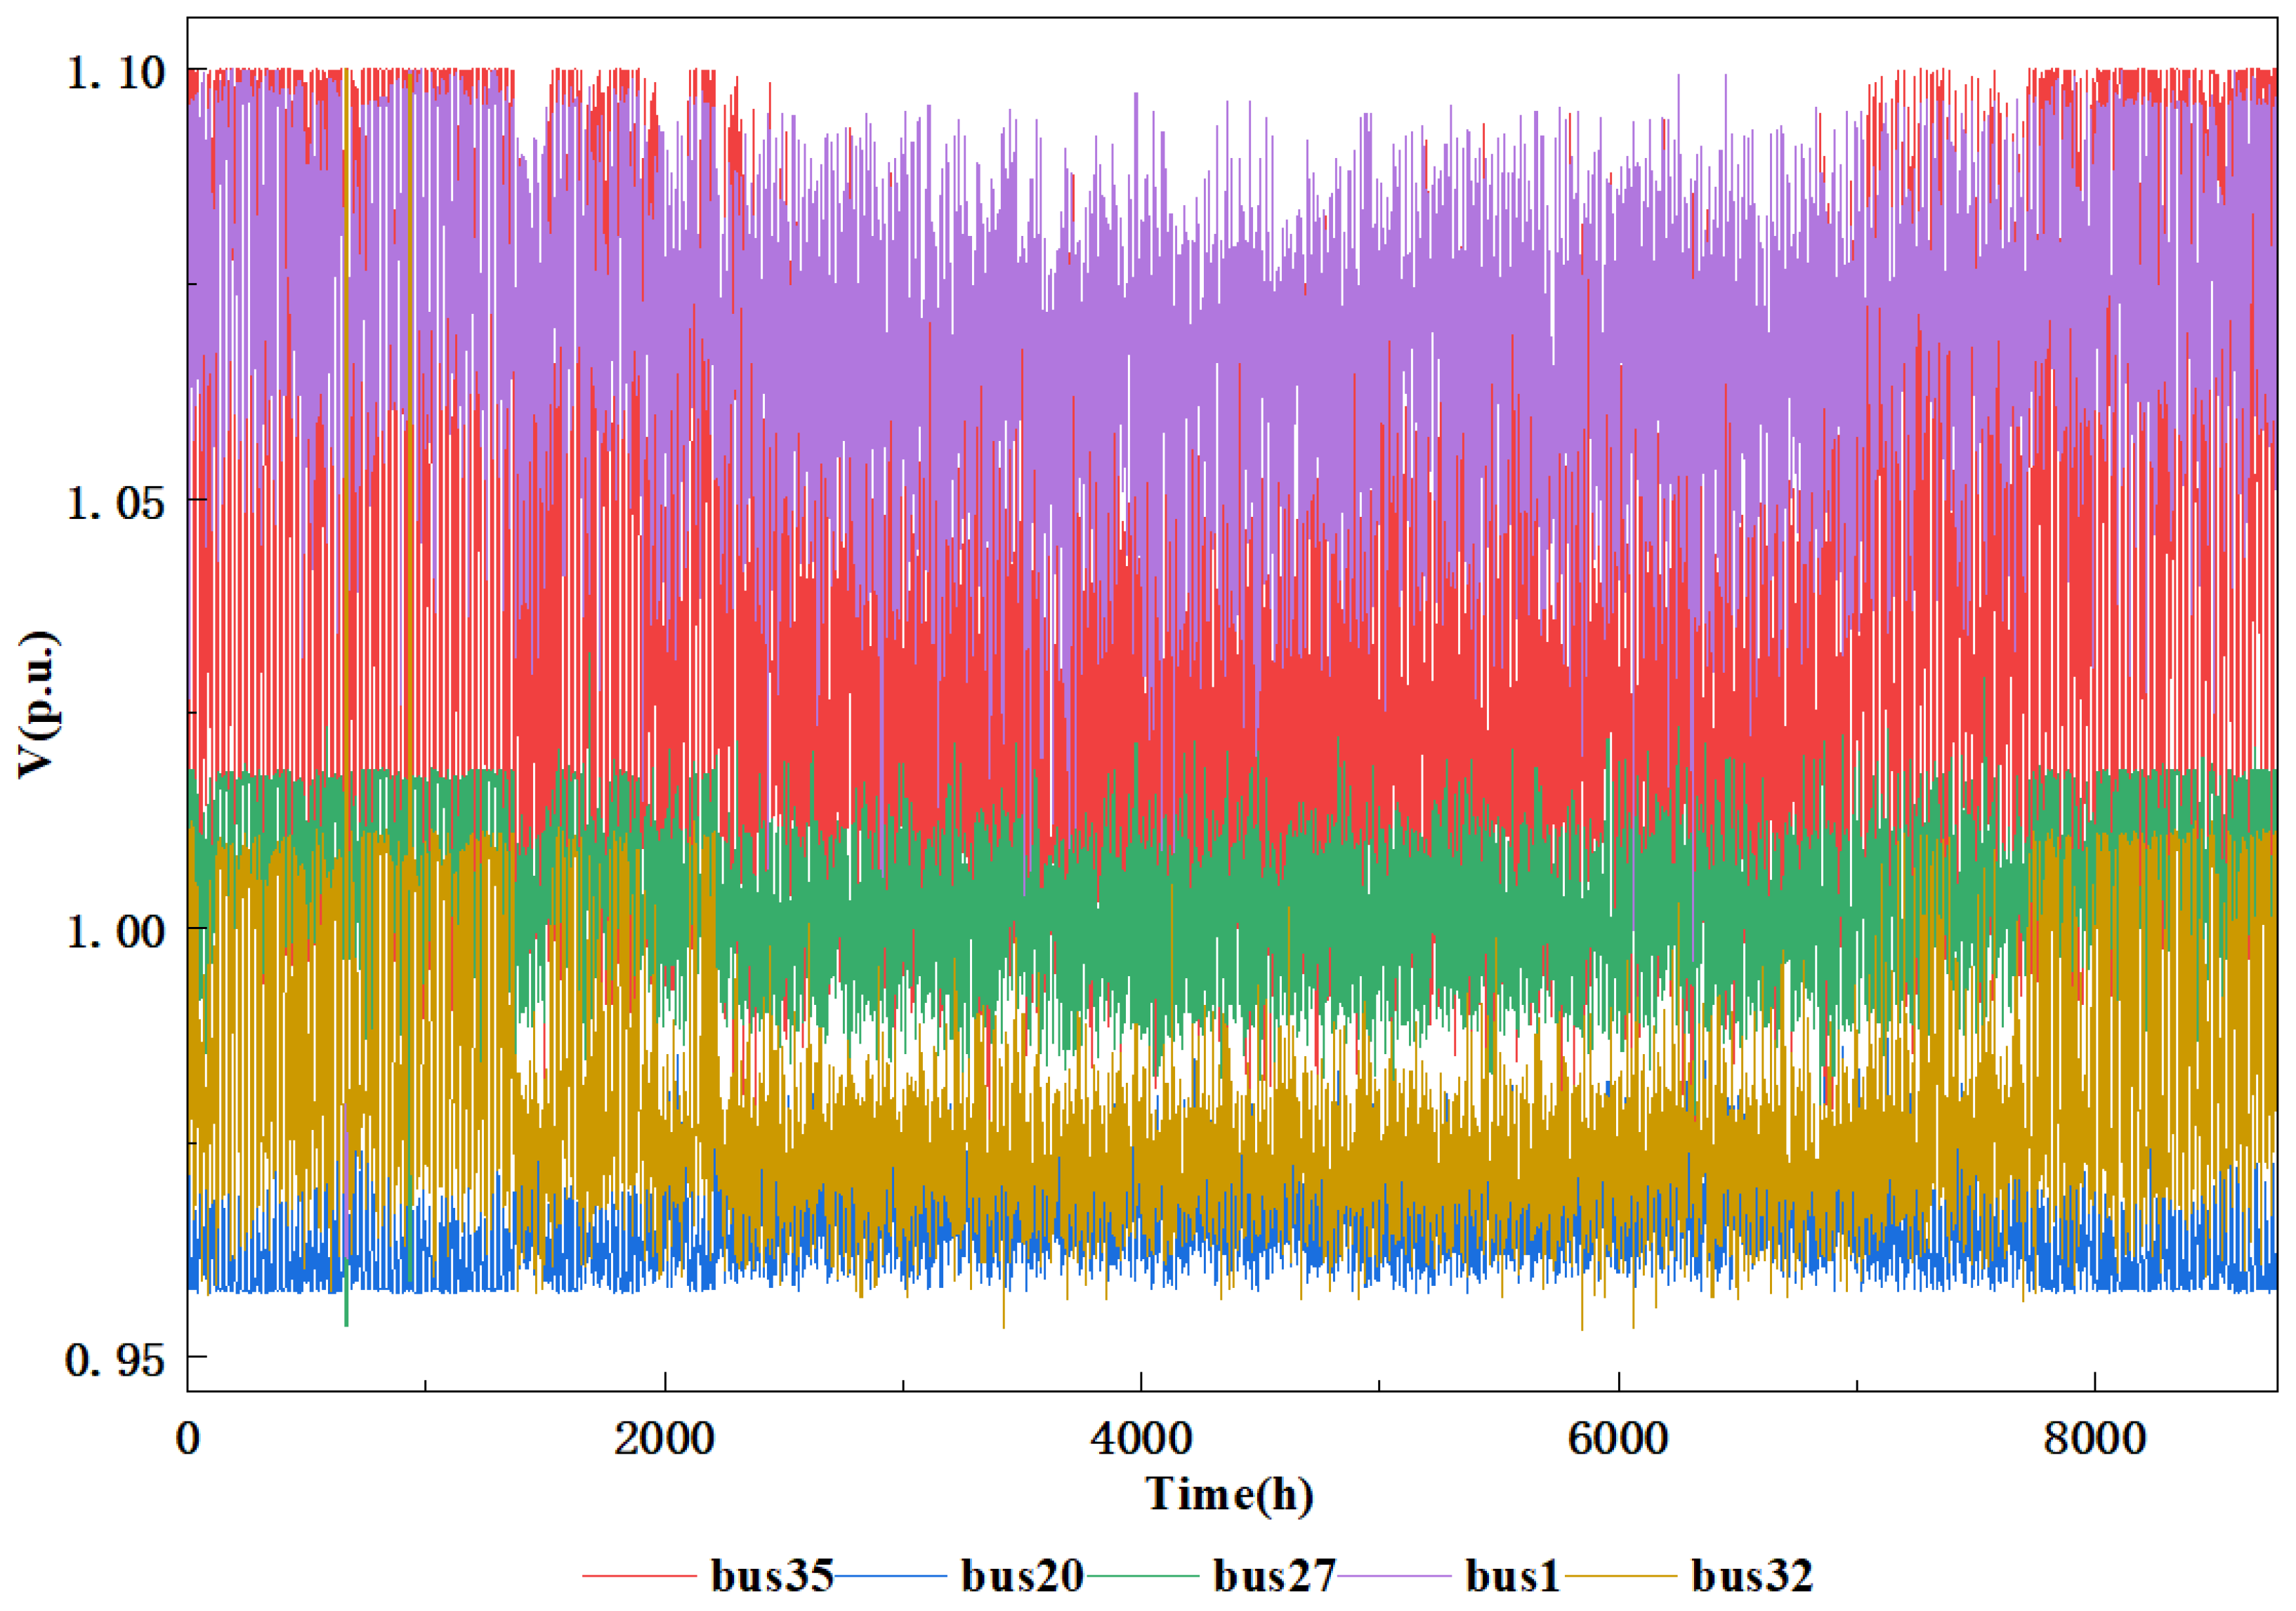
Figure 4 shows the voltage magnitude variations at five representative nodes in the IEEE 39-bus system over the full 8760-hour year. The voltage at bus 1 remains stable between 1.04 and 1.10 p.u.; bus 35 exhibits fluctuations influenced by nearby PV nodes; voltages at bus 20 and bus 27 remain stable within 0.96–1.02 p.u., comfortably within the safe range. At bus 32, which has wind integration, voltage fluctuates between 0.95 and 1.02 p.u., approaching the lower limit multiple times but never violating it. All node voltages remain within the 0.95–1.10 p.u. security limits. These results indicate that, under N-1-compliant operation, the reactive power optimization stage of the proposed method effectively maintains voltage security.
Figure 4.
Voltage Magnitudes at Selected Buses for the 39-Bus System.
4.3. Case Study Results for the IEEE 300-Bus System
For the IEEE 300-bus system, the proposed method is applied to perform N-1 security-constrained power flow generation over all 300 buses for the full 8760-hour year. For N-1 contingencies, lines whose outage would not cause islanding are selected, resulting in a total of 279 N-1 events. In the case study, the proposed method achieves converged power flows and passes all N-1 verifications.
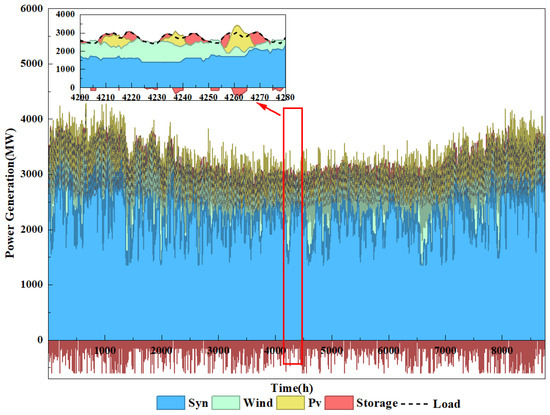
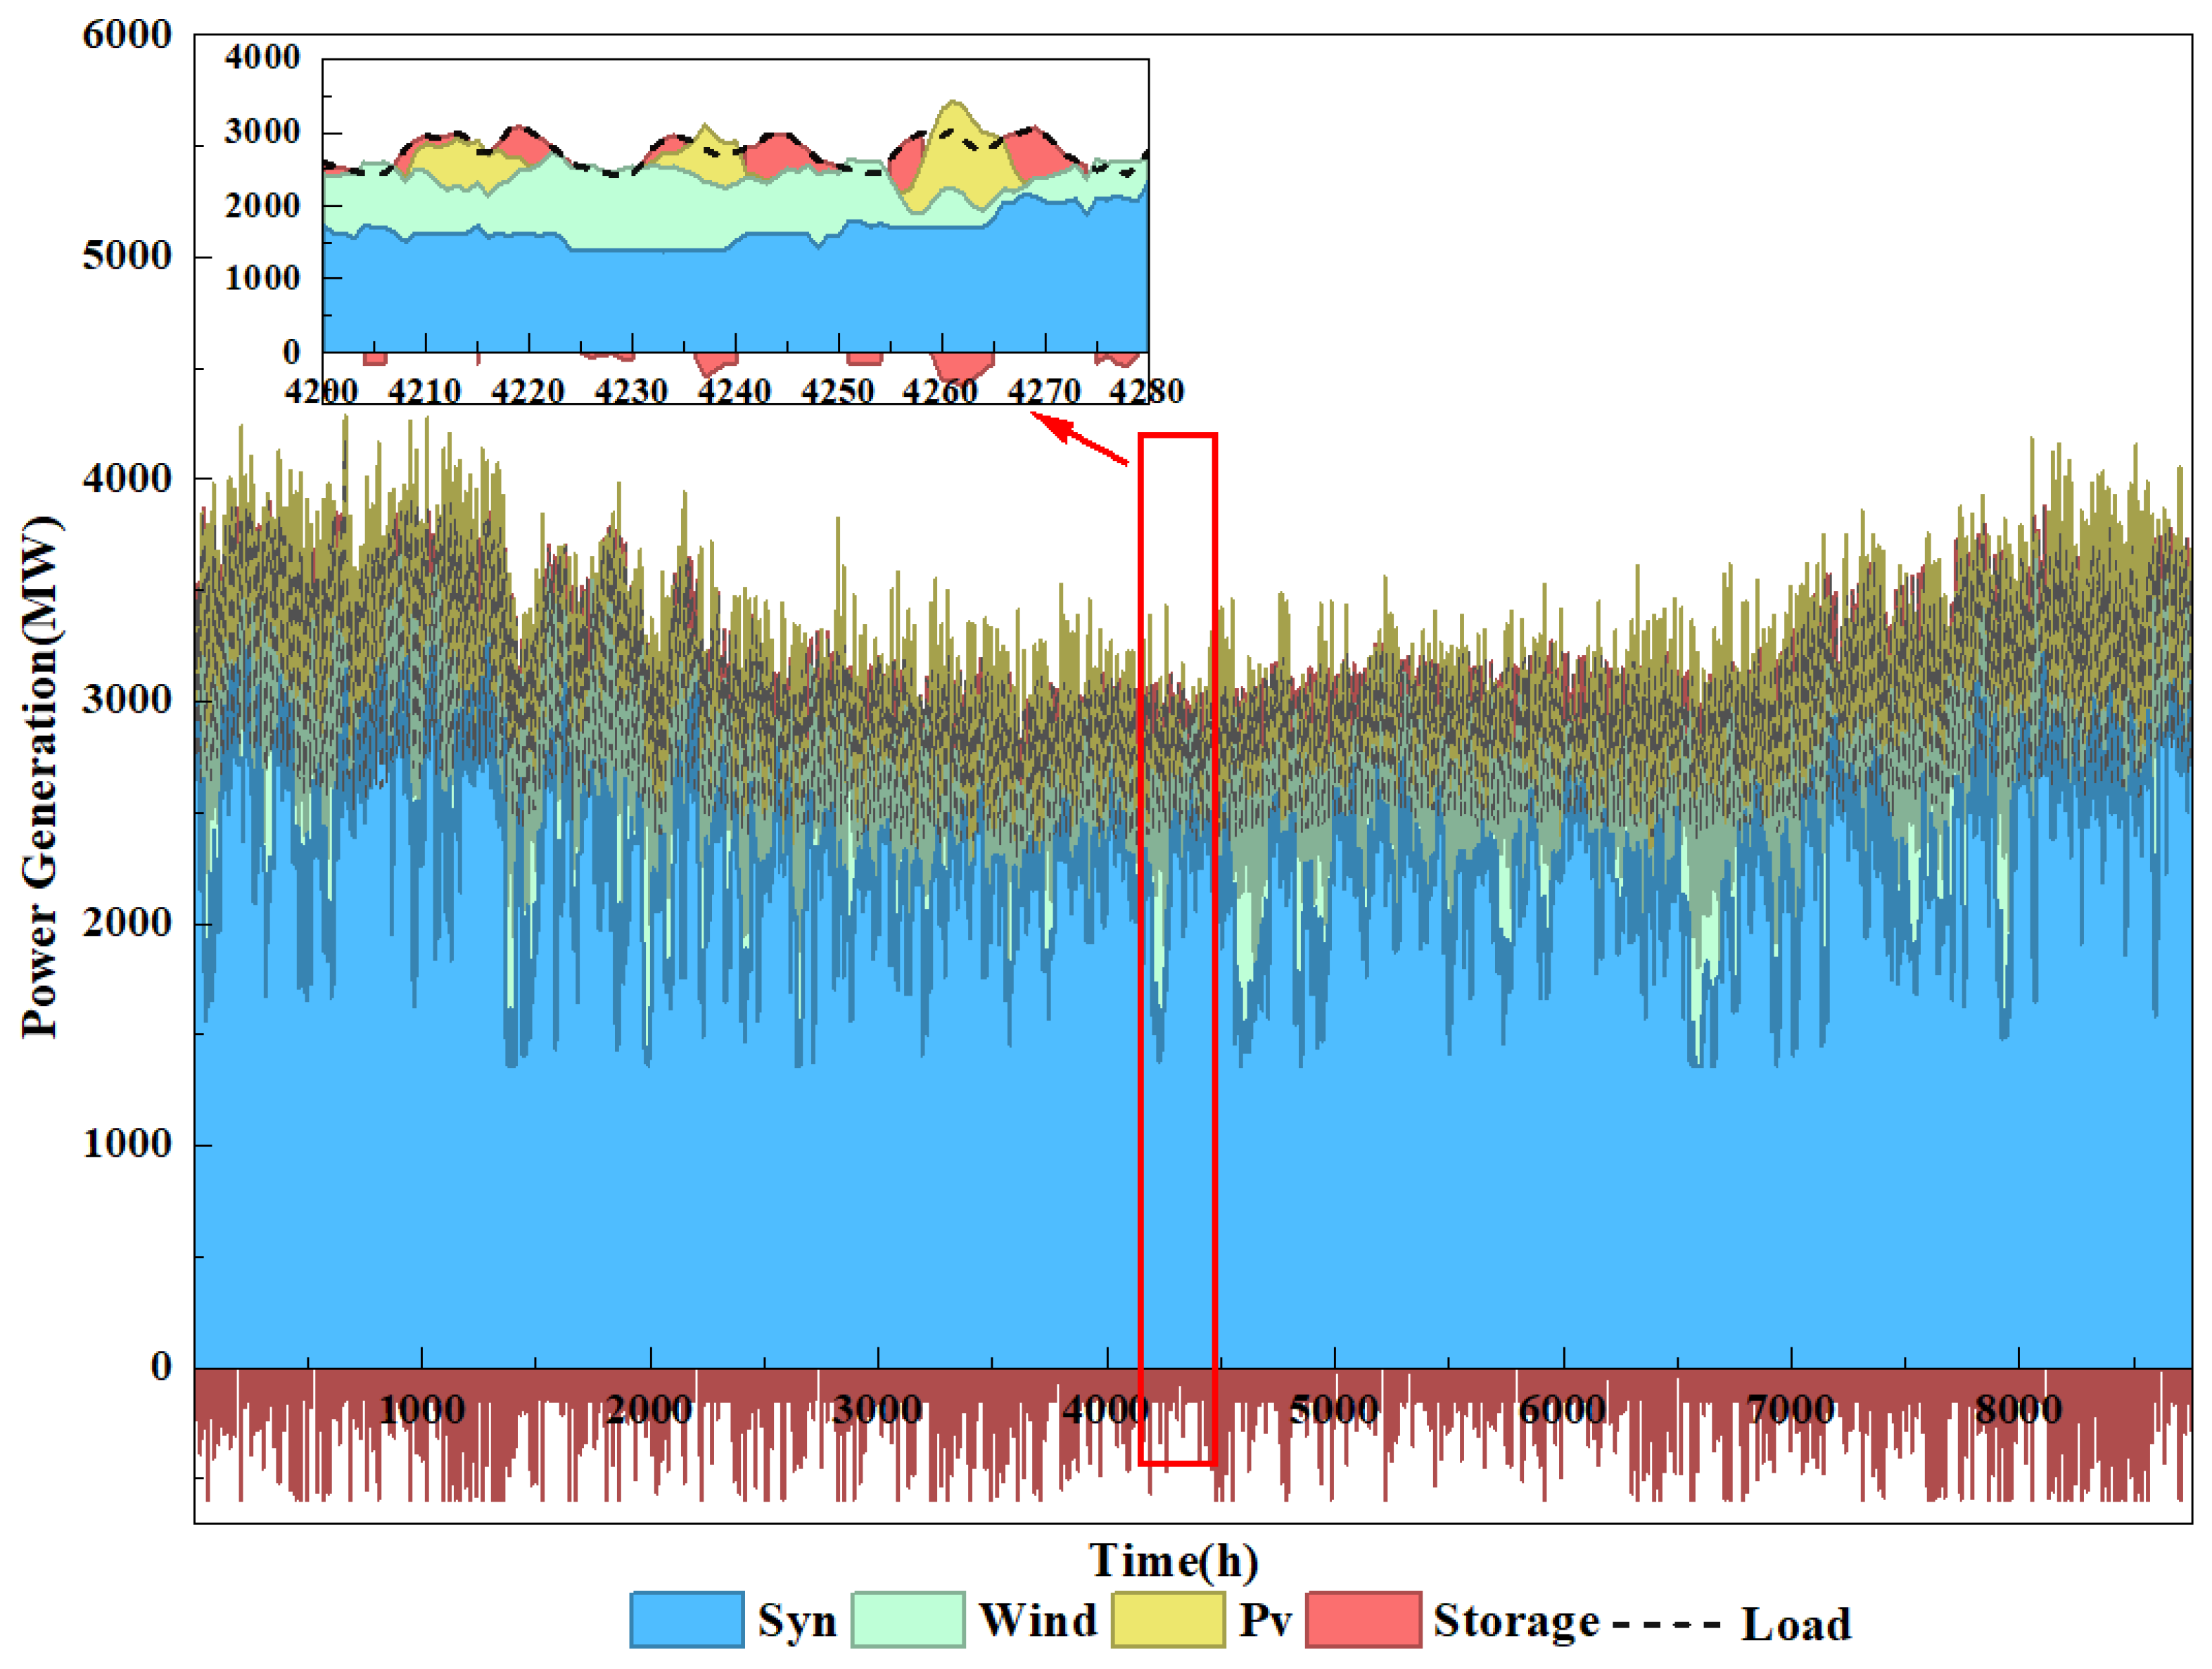
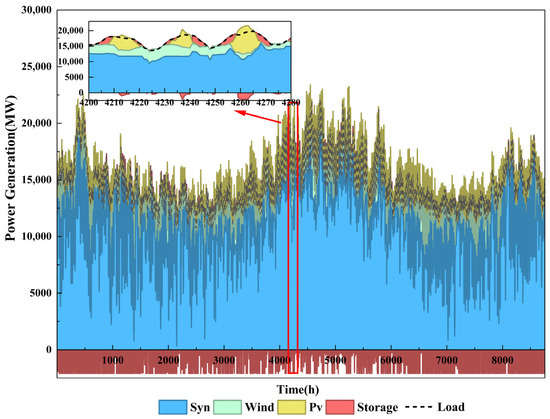
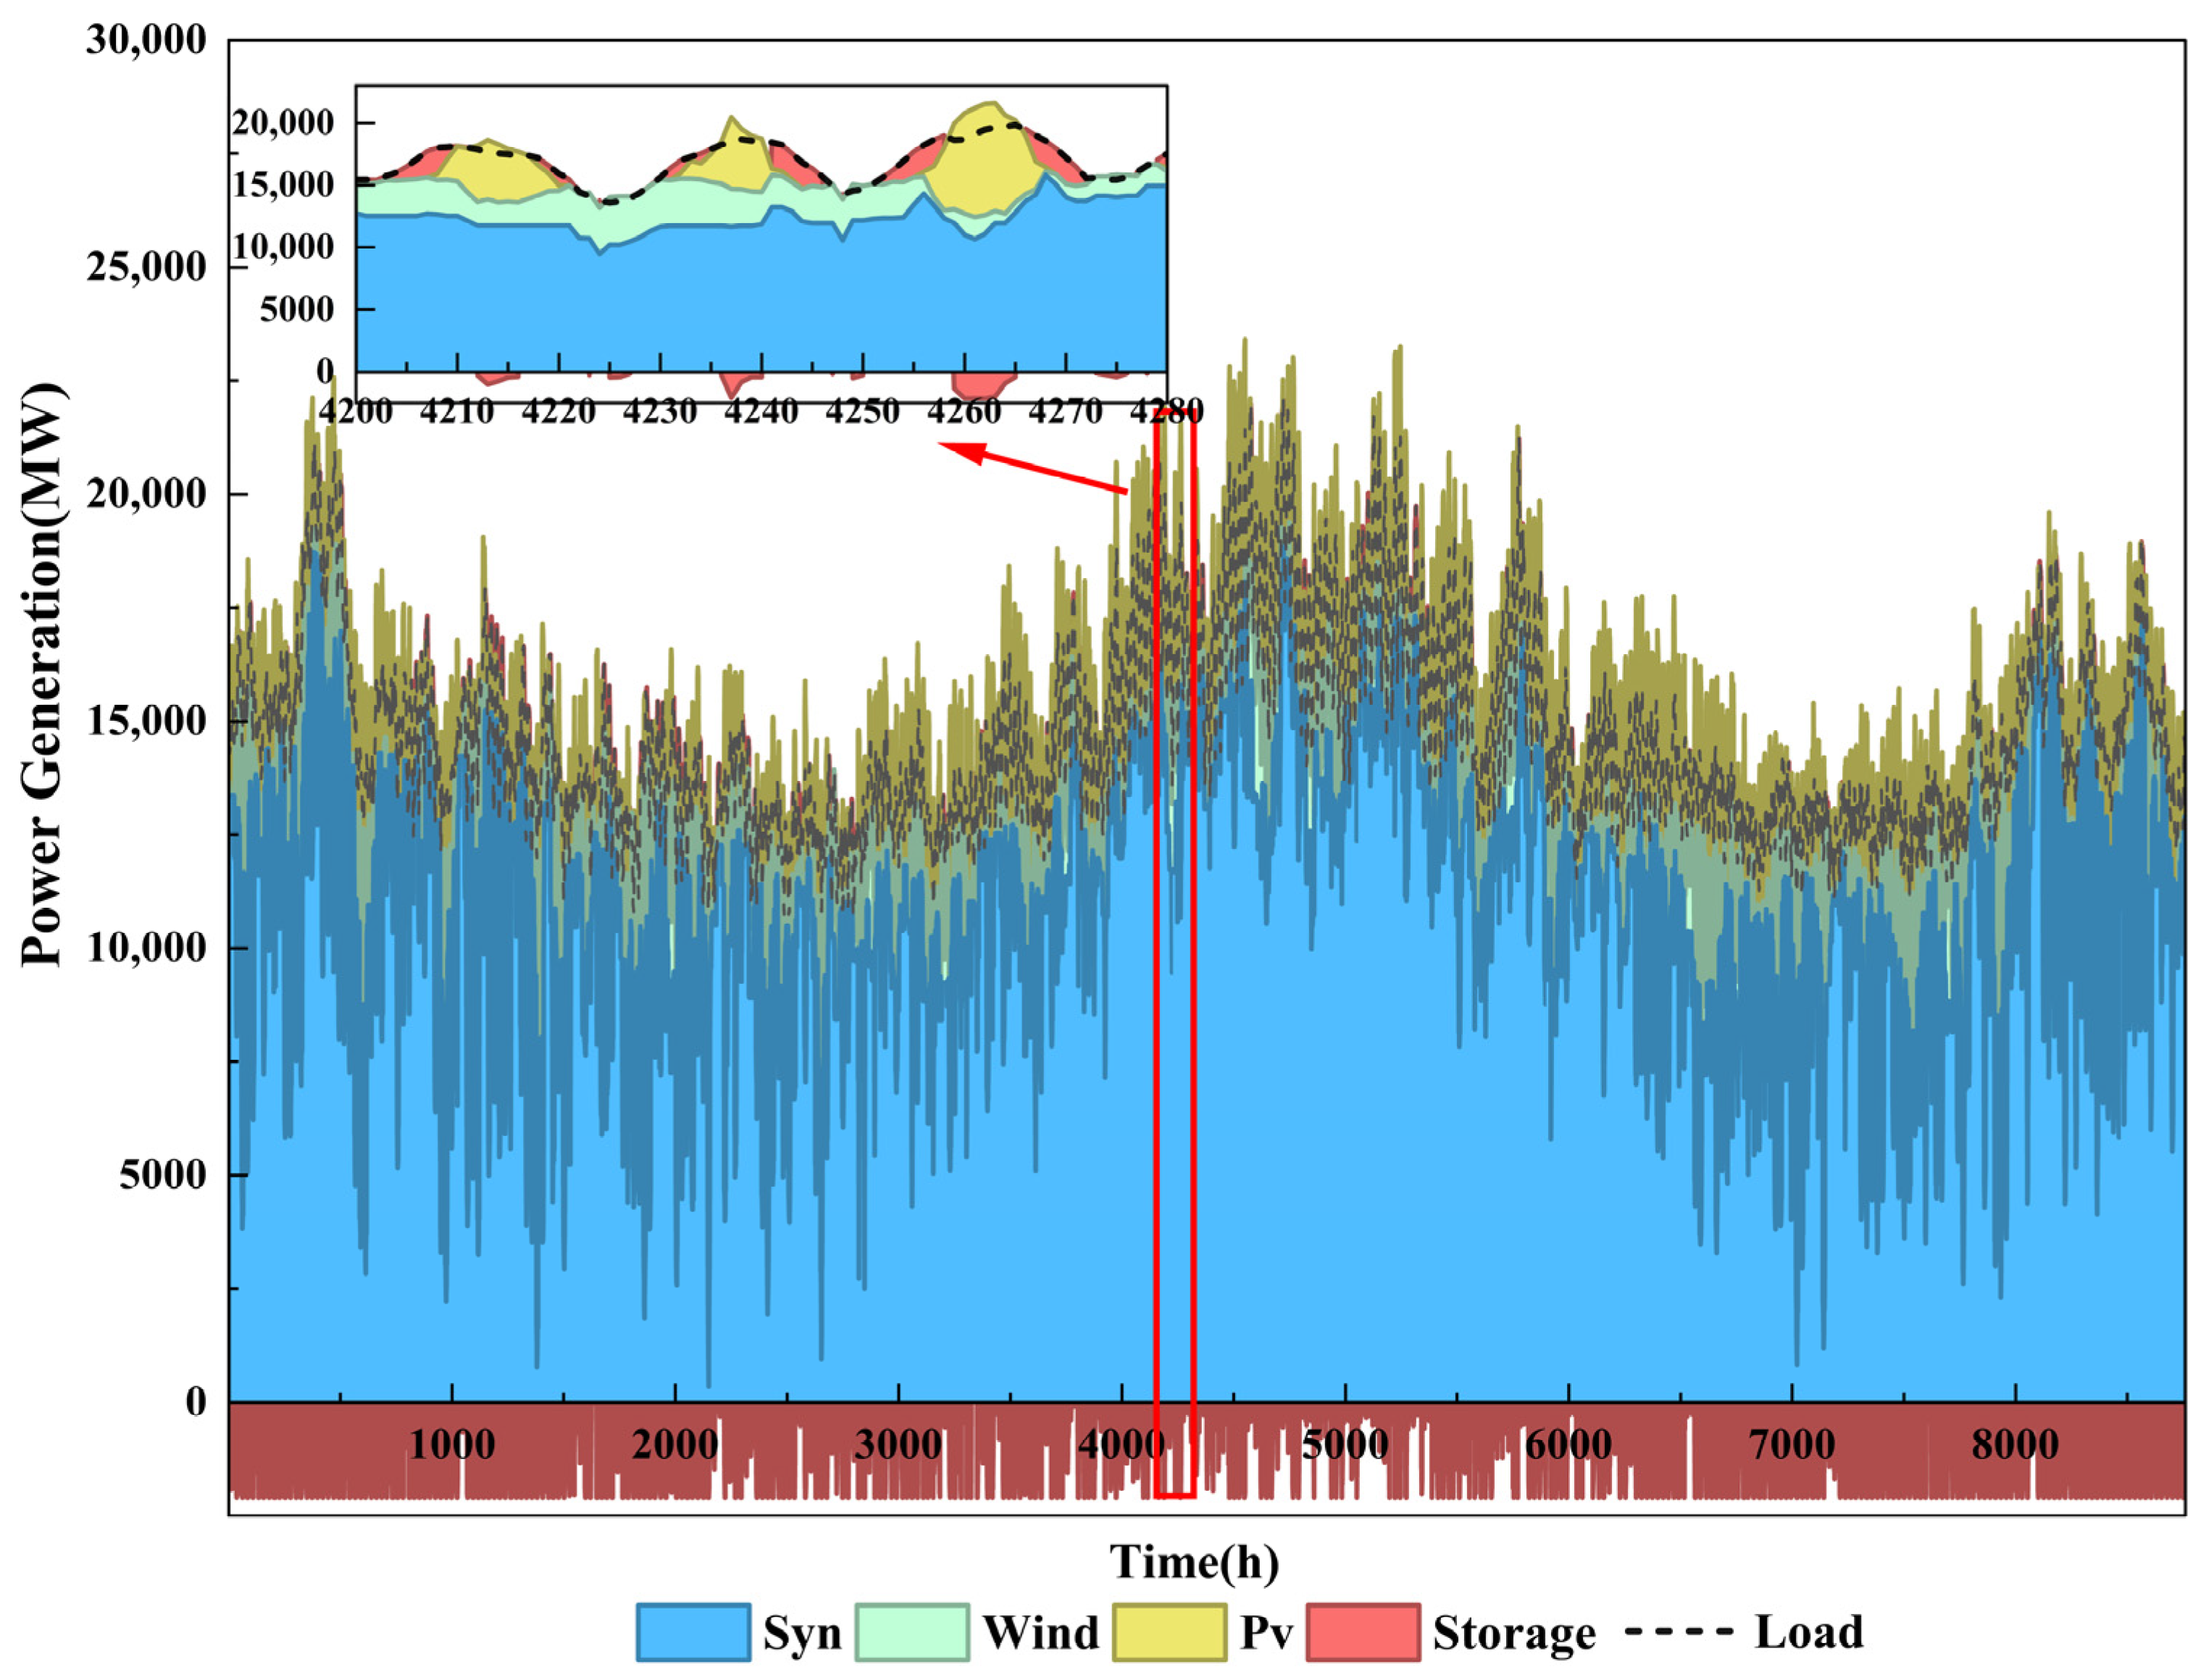
Figure 5 shows the generation composition of all types of power sources over the 8760-hour year after N-1 verification, with an inset magnifying hours 4200–4280 to highlight short-term variations. These results demonstrate the adaptability of the proposed method in large-scale systems, with all 279 N-1 events successfully verified, while enabling hourly tracking of the system’s power balance adjustments.
Figure 5.
Stacked Area Plot of Power Generation over 8760 h for the 300-Bus System.
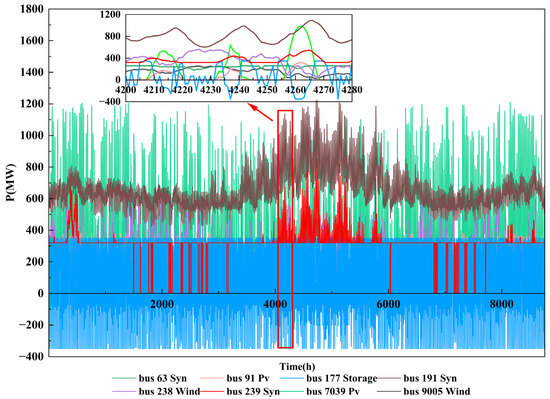
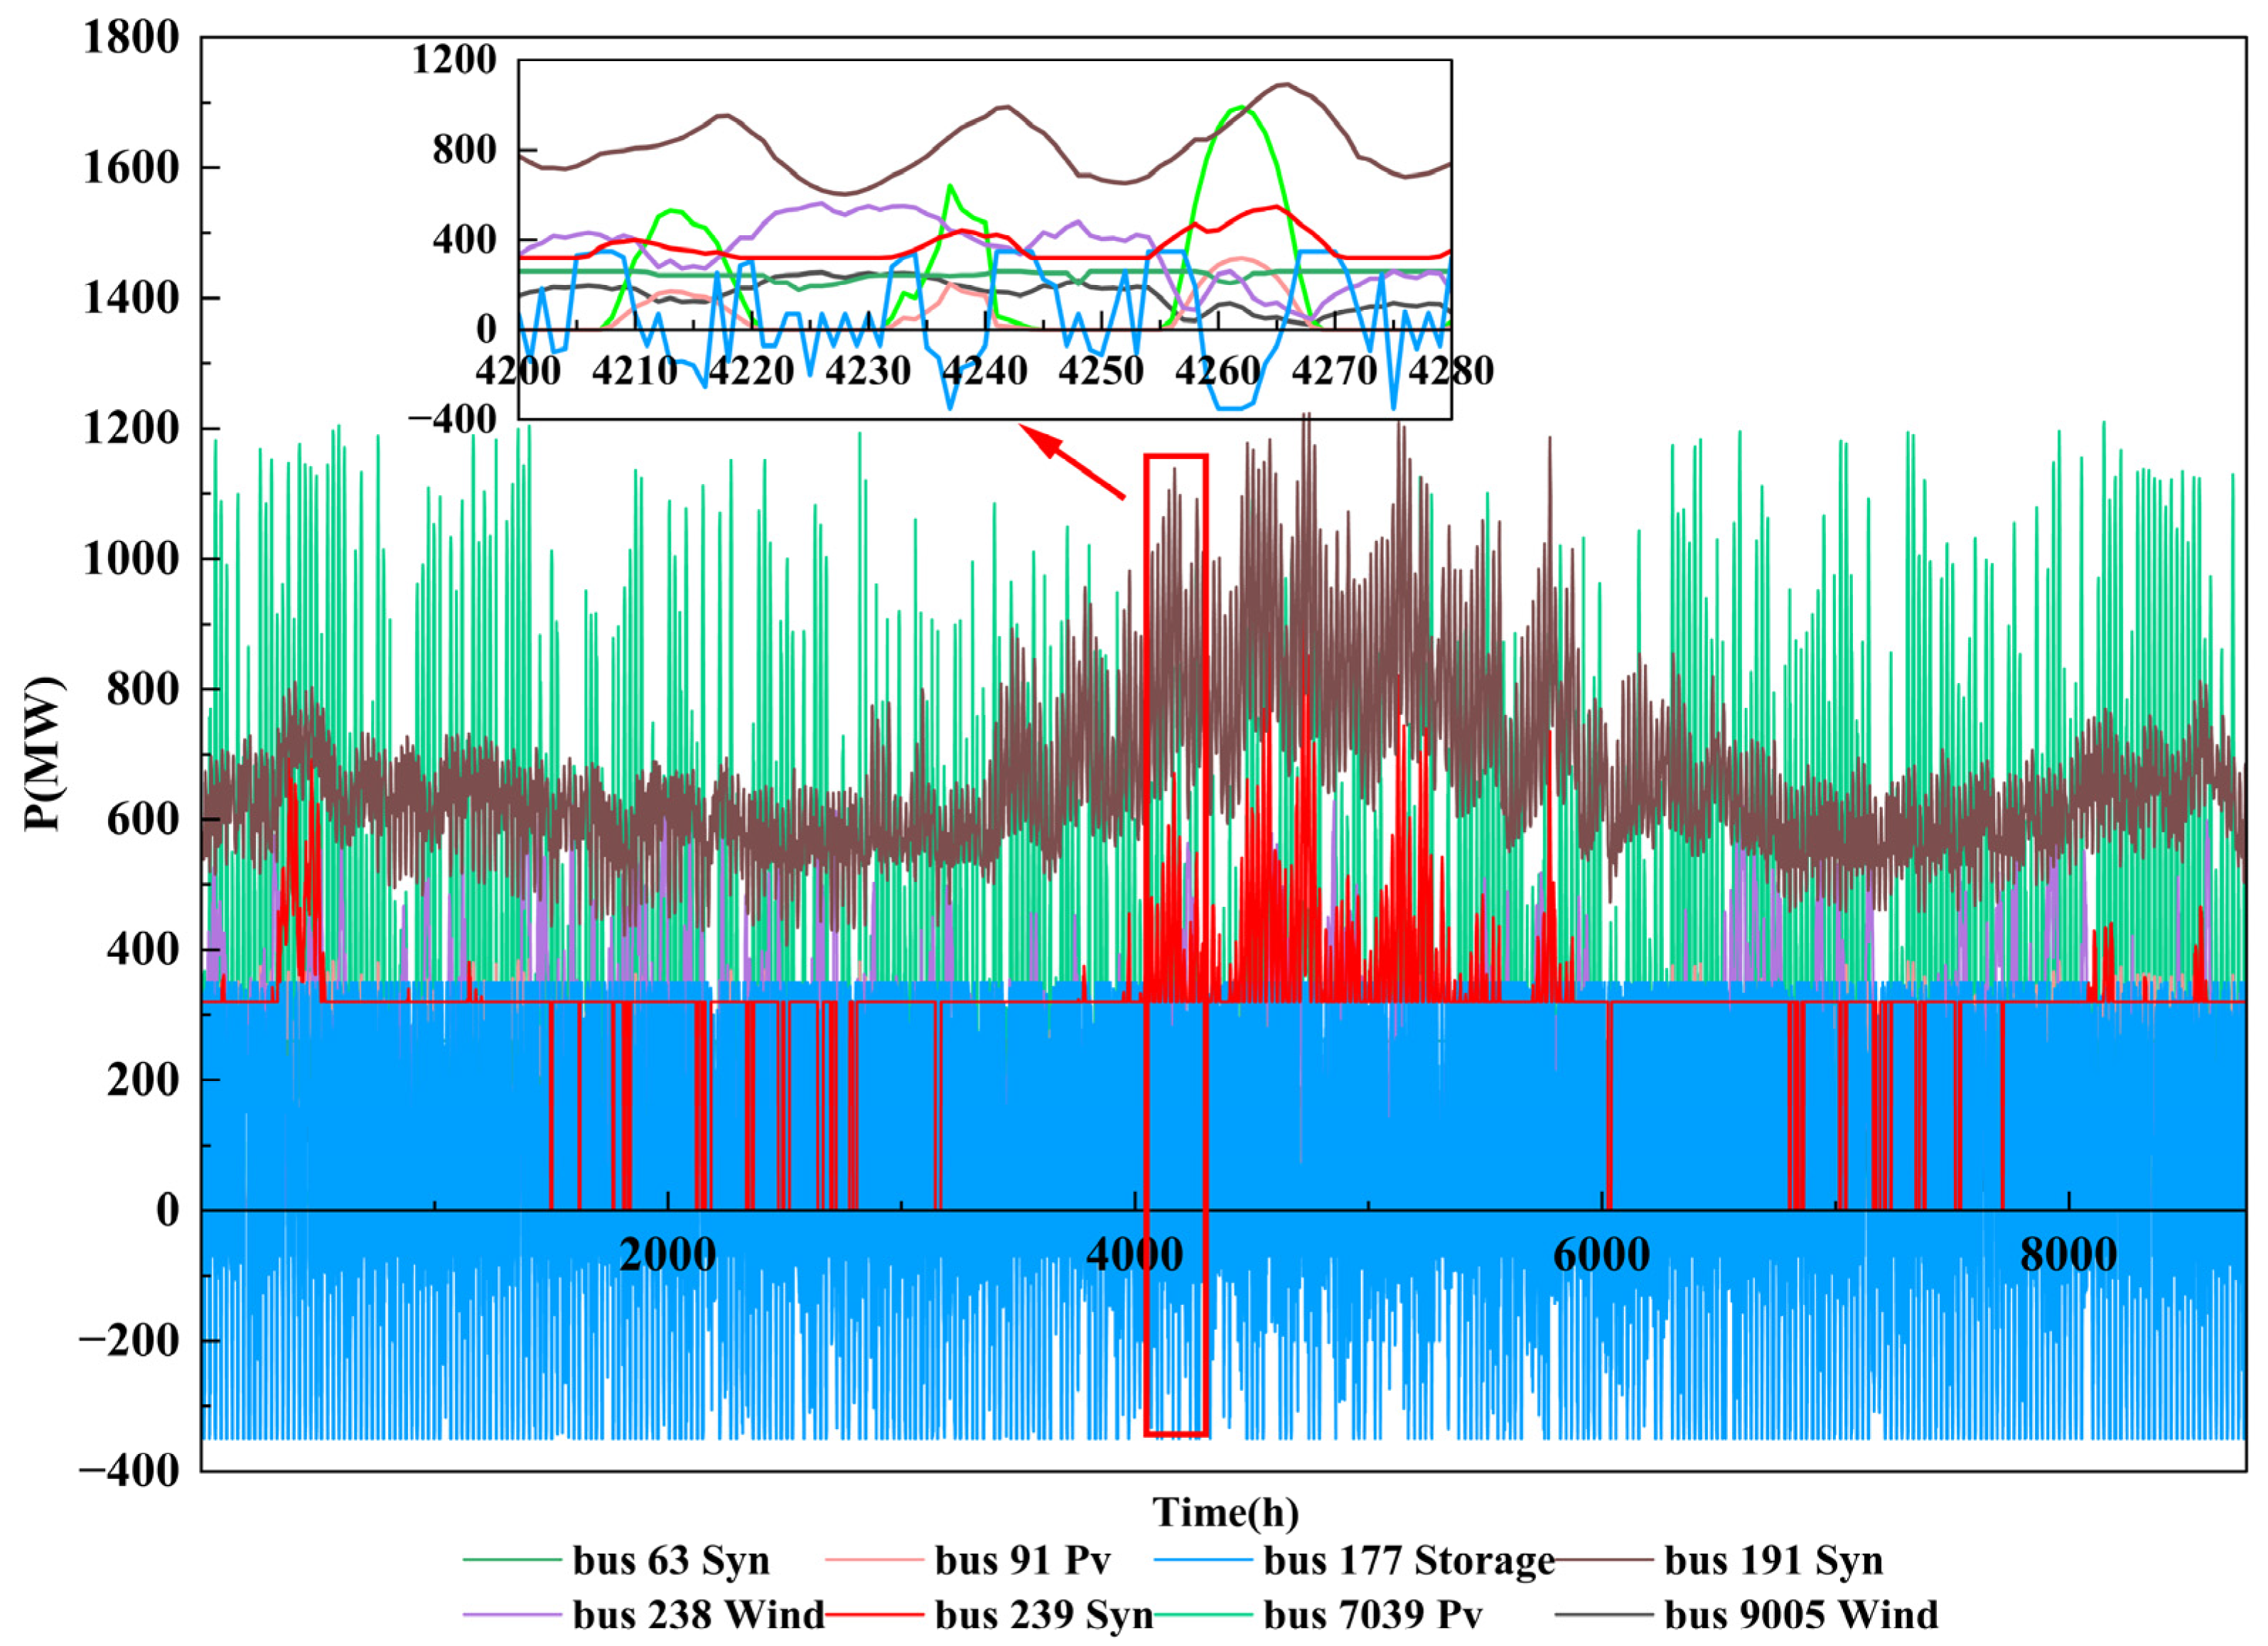
In the energy and power balance stages, following the N-1 verification and closed-loop correction, the output of selected generators is shown in Figure 6. As observed, different generation nodes exhibit distinct output characteristics. The synchronous generators at buses 191 and 239 reach their peak output simultaneously around hour 4100, providing system load-following support. The wind generator at bus 238 fluctuates between 0 MW and 800 MW, showing pronounced intermittency and variability. The PV generation at bus 7039 experiences substantial fluctuations throughout the year; in response, the storage at bus 177 continuously charges and discharges to balance system power. This output allocation strategy follows economic dispatch principles: large-capacity generators supply the baseload to reduce start-up and shut-down costs, wind and PV output according to actual resource availability, and storage operates flexibly based on system supply–demand conditions. These results validate the effectiveness of the proposed power balance stage in optimizing generator commitment and output allocation.
Figure 6.
Active Power Output of Selected Generators for the 300-Bus System.
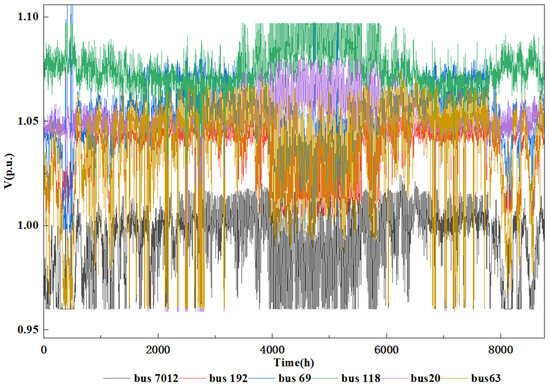
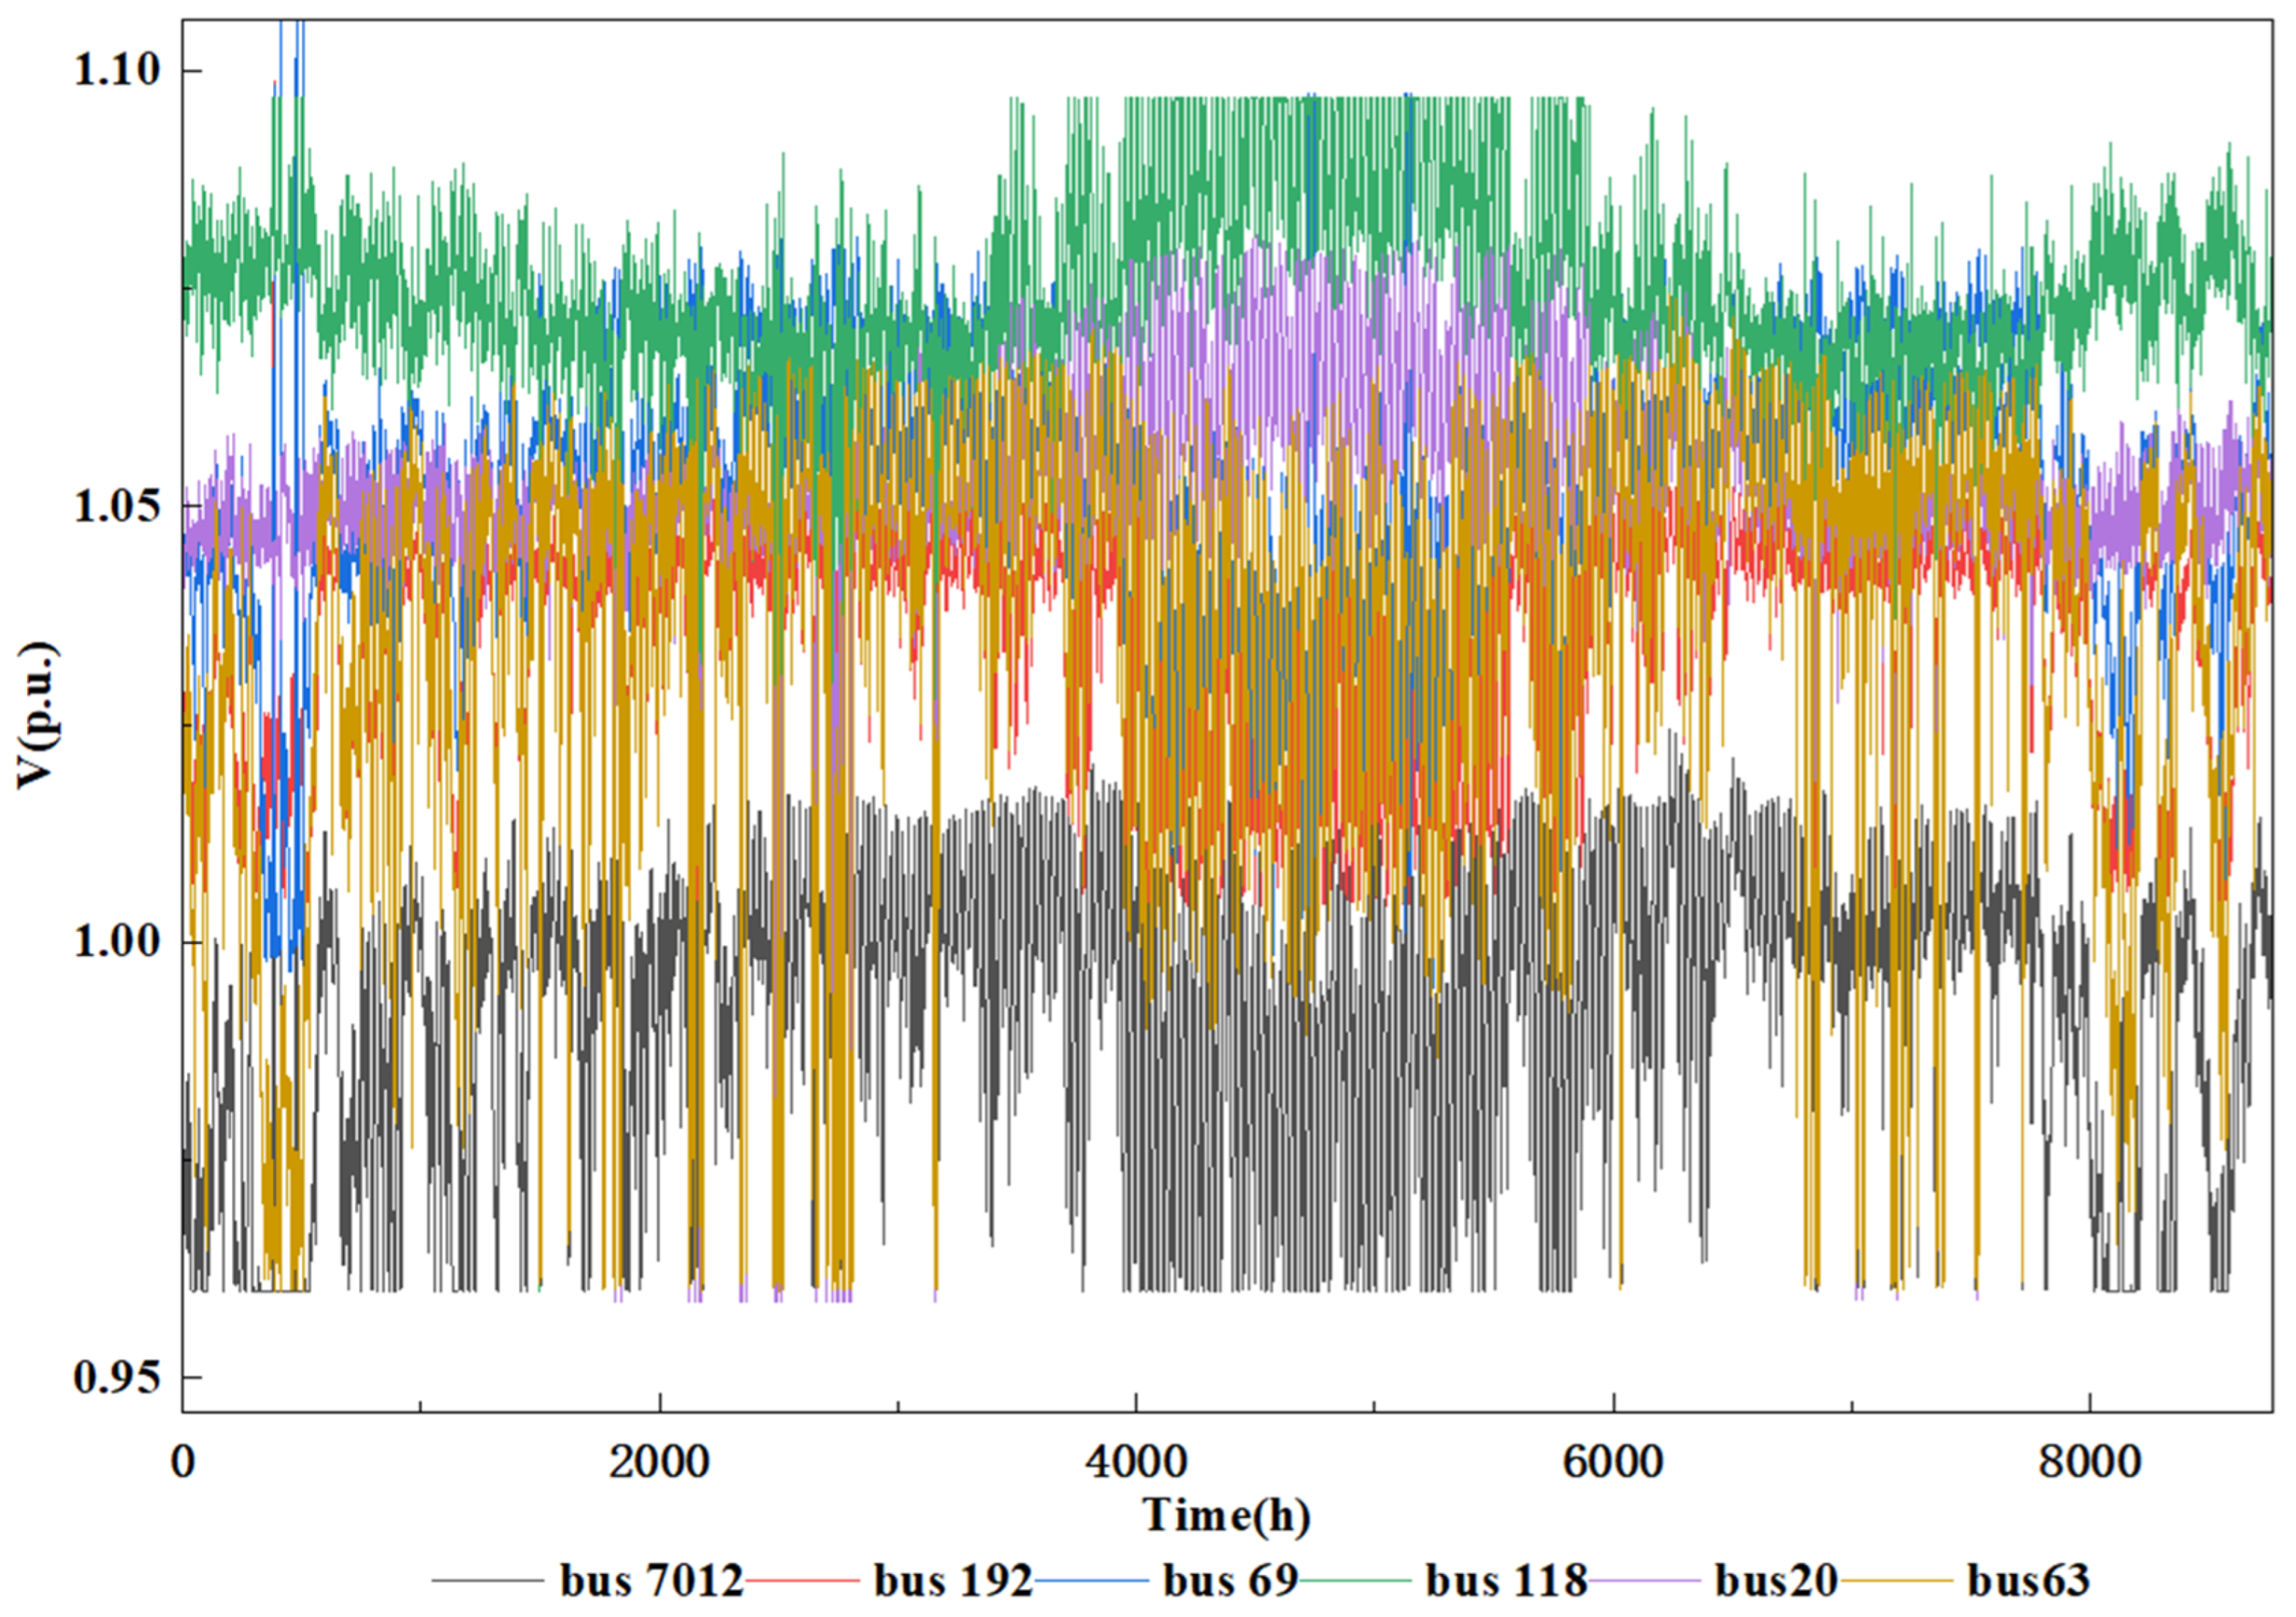
For reactive power optimization, after closed-loop N-1 verification, the AC power flows converge, and the voltage magnitudes at selected buses are shown in Figure 7. During the process, a few nodes slightly exceed limits, for which relaxation variables are introduced. For example, the voltage at bus 69 slightly surpasses the safety threshold during peak load periods but remains within an acceptable range. The voltage at bus 118 remains stable between 1.05 and 1.10 p.u. throughout the year, indicating that the reactive power compensation is appropriately configured and the node has strong voltage support. Bus 7012 is a low-voltage node, with voltages approaching the lower limit during multiple periods, yet remaining above 0.95 p.u. with no severe violations. Other nodes, including bus 63, bus 192, and bus 20, exhibit moderate voltage fluctuations, ranging between 0.98 and 1.03 p.u., entirely within the safe limits and providing substantial security margins. These results validate the effectiveness of the proposed method in reactive power optimization and voltage regulation with respect to voltage security.
Figure 7.
Voltage Magnitudes at Selected Buses for the 300-Bus System.
Based on the above results, the proposed method demonstrates not only advantages in small-scale systems but also the capability to perform 8760-hour power flow generation under N-1 security constraints in larger systems. The results maintain adequate security margins, consistent with expectations, validating the adaptability of the proposed method for large-scale systems.
5. Conclusions
This study addresses the critical challenge of annual 8760-hour power flow generation under N-1 security constraints for planning assessment. The proposed method ensures objective consistency and employs a highly coordinated solution pathway, effectively solving the 8760-hour N-1 security-constrained power flow problem. Based on theoretical analysis and case studies, the main conclusions are as follows:
- Consistency Assurance: The proposed method achieves consistency through the design of stage-wise objective functions. In the reactive power optimization stage, the objective minimizes operating cost while incorporating penalties for power adjustments and voltage violations. This effectively avoids the objective drift observed in conventional sequential methods and ensures that the subproblem solutions remain aligned with the global objective of the original problem.
- Coordination Enhancement: The two-stage closed-loop “verification–augmentation–re-optimization” mechanism enables the pre-positioning and dynamic augmentation of N-1 security constraints. DC N-1 constraints are incorporated in advance in the power balance stage, reserving sufficient regulation margin for subsequent reactive power dispatch. AC N-1 constraints are pre-positioned in the reactive power optimization stage, mitigating infeasibility issues caused by failed verifications.
- Computational Feasibility: Case studies on the IEEE 39-bus and 300-bus systems demonstrate that the proposed method can efficiently and reliably generate 8760-hour power flow snapshots that satisfy N-1 security constraints. Compared with conventional methods, the proposed approach significantly reduces computation time while improving solution feasibility.
Although the proposed method performs well in the test systems, it still has the following limitations that warrant further research in future work:
- Model applicability: This paper only considers N-1 outages of transmission lines, without covering other components such as generators and transformers. Future work can extend the contingency set to multi-type equipment.
- Convex relaxation techniques: The reactive power optimization stage in this paper solves non-convex AC power flow equations, resulting in a heavy computational burden. The convex relaxation method proposed in [38] can transform the non-convex AC-OPF into a convex optimization problem, significantly improving solution efficiency. Introducing such techniques into the proposed framework is an important direction for enhancing computational performance in future work.
- Engineering application challenges: When applying the proposed method to real-world power system planning, the number of decision variables and constraints in the MILP and NLP subproblems increases dramatically as the system scale grows, which may lead to challenges such as super-linear growth of solution time, excessive memory consumption, and even convergence difficulties. In addition, differences in source-load configurations (e.g., renewable energy penetration rate, load characteristics) and network topologies (e.g., complexity of loop networks, redundancy of transmission lines) across different systems may also affect the convergence performance of the algorithm. Future work will focus on addressing the above challenges to enhance the engineering applicability of the proposed method.
Author Contributions
Conceptualization, J.Z.; methodology, S.L. and J.H.; software, J.H.; validation, S.L. and K.H.; formal analysis, K.H. and X.L.; investigation, K.H. and X.Z.; resources, W.J., X.Z. and J.Z.; data curation, H.C.; writing—original draft preparation, W.J. and S.L.; writing—review and editing, J.H.; visualization, H.C.; supervision, J.Z.; project administration, W.J. and X.L.; funding acquisition, X.L. All authors have read and agreed to the published version of the manuscript.
Funding
This work was supported by the Science and Technology Project of Central China branch of State Grid Corporation of China under 521400250004.
Data Availability Statement
The original contributions presented in this study are included in the article. Further inquiries can be directed to the corresponding author.
Conflicts of Interest
Authors Weigang Jin, Xiongguang Zhao, and Xu Ling are employed by the Central China branch of the State Grid Corporation of China. The remaining authors declare that the research was conducted in the absence of any commercial or financial relationships that could be construed as a potential conflict of interest. The authors declare that this study received funding from the Central China branch of the State Grid Corporation of China. The funder’s role in this study was as follows: the funder participated in the study design, data collection, analysis and interpretation, manuscript writing, and the decision to submit the paper for publication.
Nomenclature
| Abbreviations | |||
| MINLP | Mixed-Integer Nonlinear Programming | EB | Energy Balance |
| MILP | Mixed-Integer Linear Programming | PB | Power Balance |
| NLP | Nonlinear Programming | RPO | Reactive Power Optimization |
| SCUC | Security-Constrained Unit Commitment | N1A | N-1 Adjustment |
| SCOPF | Security-Constrained Optimal Power Flow | N1V | N-1 Verification |
| N-1-SC-8760-PFGM | N-1 security-constrained 8760-hour power flow generation method | ||
| Indices | |||
| IPM Iterations | Total accumulated iterations executed by the Interior Point Method (IPM) | ||
| Computation Time | Total time elapsed from model initialization to solution convergence | ||
| N-1 Pass Rate | Ratio of time periods passing the N-1 security check to total periods | ||
| Annual Production Cost | Start-up/shut-down costs plus generation costs of synchronous units | ||
| Total Operation Cost | Annual production cost plus penalty costs for wind and PV curtailment | ||
| Wind Curtailment Rate | Proportion of curtailed wind energy to the total available wind energy | ||
| PV Curtailment Rate | Proportion of curtailed photovoltaic (PV) energy to the total available PV energy | ||
| ESS Utilization Rate | Proportion of time periods the Energy Storage System (ESS) is in discharging states | ||
| Max Branch Loading Rate | Maximum ratio of transmitted power to capacity limits among all branches | ||
| Avg Branch Loading Rate | Average ratio of transmitted power to capacity limits across all branches | ||
| Min Voltage Margin | Ratio of the difference between actual voltage and critical lower limit to the critical lower limit | ||
| ACPF Convergence Rate | Proportion of time periods with successfully converged AC Power Flow (ACPF) | ||
| Avg Added N-1 Constraints/Period | Average number of newly generated N-1 security constraints per time period | ||
| Sets | |||
| C | N-1 contingency set | L | Set of transmission lines/Set of branches |
| Binary Variables | |||
| Commitment status/On-off status of unit in period | Cold start-up action/indicator of unit in period | ||
| Start-up indicator of unit in period | Shut-down action/indicator of unit | ||
| Charging/discharging status of energy storage in period (1 for charging, 0 for discharging) | ni,t | On/off status of reactive power compensators i in period t | |
| Continuous Variables | |||
| AC active power flow of branch in period | Voltage magnitude at node in period | ||
| c | Active power output of generating unit in period | Voltage phase angle at node in period | |
| AC reactive power flow of branch in period | Conductance of branch | ||
| Reactive power output of power source/energy storage/reactive power device in period | Susceptance of branch | ||
| DC active power flow of branch in period | Total system load in period | ||
| Net active power injection at node in period | Power generation of each power source | ||
| Power curtailment at renewable energy integration node in period | Charging power of energy storage in period | ||
| Active power flow of branch in period under N-1 contingency | Discharging power of energy storage in period | ||
| Reactive power flow of branch in period under N-1 contingency | Stored energy level/Capacity of energy storage at the end of period | ||
| Active power output of renewable energy device in period | |||
| Parameters | |||
| AC Active power transmission limit of branch under N-1 contingency | Lower limit of node voltage | ||
| DC Active power transmission limit of branch under N-1 contingency | Upper limit of node voltage | ||
| DC active power transmission limit of branch | Minimum capacity limit of energy storage | ||
| AC active power transmission limit of branch | Maximum capacity limit of energy storage | ||
| Maximum active power output of unit | Lower limit of reactive power output | ||
| Minimum active power output of unit | Upper limit of reactive power output | ||
| Ramp-up rate limit of unit | Start-up cost of unit | ||
| Start-up ramp rate limit of unit | Total number of system nodes/buses | ||
| Ramp-down rate limit of unit | Upper limit of discharging power of energy storage | ||
| Shut-down ramp rate limit of unit | Lower limit of discharging power of energy storage | ||
| Lower limit of active power output of renewable energy device | Upper limit of charging power of energy storage | ||
| Upper limit of active power output of renewable energy device | Lower limit of charging power of energy storage | ||
| Quadratic cost coefficient of unit operation | Shut-down cost of unit | ||
| Linear cost coefficient of unit operation | Penalty coefficient for renewable energy curtailment | ||
| Constant cost coefficient of unit operation | NG | Number of thermal power units | |
| Minimum down-time limit of unit | Nnew | Number of renewable energy integration nodes | |
| Minimum up-time limit of unit | Spinning reserve requirement in period | ||
| Cold start-up time limit of unit | |||
References
- Hou, Q.; Du, E.; Zhang, N.; Kang, C. Impact of high renewable penetration on the power system operation mode: A data-driven approach. IEEE Trans. Power Syst. 2020, 35, 731–741. [Google Scholar] [CrossRef] [Scilit]
- Riaz, S.; Marzooghi, H.; Verbic, G.; Chapman, A.C.; Hill, D.J. Generic demand model considering the impact of prosumers for future grid scenario analysis. IEEE Trans. Smart Grid 2019, 10, 819–829. [Google Scholar] [CrossRef] [Scilit]
- Li, J.; Zhou, J.; Chen, B. Review of wind power scenario generation methods for optimal operation of renewable energy systems. Appl. Energy 2020, 280, 115992. [Google Scholar] [CrossRef] [Scilit]
- Xiao, L.; Zeng, X.; Wang, C.; Li, B.; Xia, J.; Huang, J.; Xiong, H. Scheduling strategy for power systems with multiple energy storage systems considering renewable energy and load uncertainty. In Proceedings of the 2025 4th International Conference on Green Energy and Power Systems (ICGEPS), Hangzhou, China, 11–13 April 2025; pp. 25–31. [Google Scholar] [CrossRef] [Scilit]
- Deng, X.; Lv, T. Power system planning with increasing variable renewable energy: A review of optimization models. J. Clean. Prod. 2020, 246, 118962. [Google Scholar] [CrossRef] [Scilit]
- Xu, J.; Wang, B.; Sun, Y.; Xu, Q.; Liu, J.; Cao, H.; Jiang, H.; Lei, R.; Shen, M. A day-ahead economic dispatch method considering extreme scenarios based on wind power uncertainty. CSEE J. Power Energy Syst. 2019, 5, 224–233. [Google Scholar] [CrossRef] [Scilit]
- Salman, U.T.; Shafiq, S.; Al-Ismail, F.S.; Khalid, M. A review of improvements in power system flexibility: Implementation, operation and economics. Electronics 2022, 11, 581. [Google Scholar] [CrossRef] [Scilit]
- Chen, D.; Wan, C.; Song, Y.; Liu, H.; Wang, F. N-1 security-constrained coordinated scheduling of integrated electricity and natural gas system considering gas dynamics and wind power uncertainty. IET Renew. Power Gener. 2021, 15, 1408–1421. [Google Scholar] [CrossRef] [Scilit]
- Kermani, M.; Chen, P.; Göransson, L.; Bongiorno, M. A comprehensive optimal energy control in interconnected microgrids through multiport converter under N−1 criterion and demand response program. Renew. Energy 2022, 199, 957–976. [Google Scholar] [CrossRef] [Scilit]
- Ovaere, M.; Proost, S. Optimal electricity transmission reliability: Going beyond the N-1 criterion. Energy J. 2018, 39, 211–234. [Google Scholar] [CrossRef] [Scilit]
- Pourahmadi, F.; Jooshaki, M.; Hosseini, S.H. A dynamic programming-based heuristic approach for optimal transmission switching problem with N-1 reliability criterion. In Proceedings of the 2016 International Conference on Probabilistic Methods Applied to Power Systems (PMAPS), Beijing, China; IEEE: Piscataway, NJ, USA, 2016; pp. 1–7. [Google Scholar] [CrossRef] [Scilit]
- Risi, B.-G.; Riganti-Fulginei, F.; Laudani, A. Modern techniques for the optimal power flow problem: State of the art. Energies 2022, 15, 6387. [Google Scholar] [CrossRef] [Scilit]
- Tuncer, D.; Kocuk, B. An MISOCP-based decomposition approach for the unit commitment problem with AC power flows. IEEE Trans. Power Syst. 2023, 38, 3388–3400. [Google Scholar] [CrossRef] [Scilit]
- Zhang, C.; Wang, D.; Zhang, W.; He, L.; Zhou, K.; Li, J.; Zhu, L.; Zhou, B.; Zhou, Q.; Shuai, Z. A novel optimal power flow method considering interval uncertainties under high renewable penetration based on security limits definition. IEEE Trans. Sustain. Energy 2026, 17, 926–938. [Google Scholar] [CrossRef] [Scilit]
- Marano-Marcolini, A.; Capitanescu, F.; Martinez-Ramos, J.L.; Wehenkel, L. Exploiting the use of DC SCOPF approximation to improve iterative AC SCOPF algorithms. IEEE Trans. Power Syst. 2012, 27, 1459–1466. [Google Scholar] [CrossRef] [Scilit]
- Wang, H.; Tan, Y.; Cao, Y.; Li, Y.; Liao, C. An N-1 short-time security constrained dispatch for hybrid AC/DC power systems: Chance constrained approach. In Proceedings of the 2020 IEEE 4th Conference on Energy Internet and Energy System Integration (EI2), Wuhan, China; IEEE: Piscataway, NJ, USA, 2020; pp. 1467–1472. [Google Scholar] [CrossRef] [Scilit]
- Zhou, B.; Jiang, R.; Shen, S. Frequency stability-constrained unit commitment: Tight approximation using Bernstein polynomials. IEEE Trans. Power Syst. 2024, 39, 5907–5919. [Google Scholar] [CrossRef] [Scilit]
- Platbrood, L.; Capitanescu, F.; Merckx, C.; Crisciu, H.; Wehenkel, L. A generic approach for solving nonlinear-discrete security-constrained optimal power flow problems in large-scale systems. IEEE Trans. Power Syst. 2014, 29, 1194–1203. [Google Scholar] [CrossRef] [Scilit]
- Valencia-Zuluaga, T.; Agudelo-Martinez, D.; Arango-Angarita, D.; Acosta-Urrego, C.; Rivera, S.; Rodriguez-Medina, D.; Gers, J. A fast decomposition method to solve a security-constrained optimal power flow (SCOPF) problem through constraint handling. IEEE Access 2021, 9, 52812–52824. [Google Scholar] [CrossRef] [Scilit]
- Feng, C.; Shao, C.; Wang, B.; Wang, X. Heuristic benders decomposition efficiency improvement for SCUC. CSEE J. Power Energy Syst. 2021, 7, 889–892. [Google Scholar] [CrossRef] [Scilit]
- Chen, Y.; Du, Q.; Liu, H.; Cheng, L.; Younis, M.S. Improved proximal policy optimization algorithm for sequential security-constrained optimal power flow based on expert knowledge and safety layer. J. Mod. Power Syst. Clean Energy 2024, 12, 742–753. [Google Scholar] [CrossRef] [Scilit]
- Liu, P.; Wu, Z.; Gu, W.; Yu, P.; Du, J.; Luo, X. A novel acceleration strategy for N-1 contingency screening in distribution system. In Proceedings of the 2020 IEEE Power & Energy Society General Meeting (PESGM), Montreal, QC, Canada; IEEE: Piscataway, NJ, USA, 2020; pp. 1–5. [Google Scholar] [CrossRef] [Scilit]
- Guo, G.; Wang, D.; Ma, B.; Liu, D.; Zhou, J.; Wu, X.; Yu, Z. Annual time-series production simulation model with multiregional interconnections based on optimized cycle decomposition. In Proceedings of the 2025 2nd International Conference on Smart Grid and Artificial Intelligence (SGAI), Changsha, China; IEEE: Piscataway, NJ, USA, 2025; pp. 690–695. [Google Scholar] [CrossRef] [Scilit]
- Cheng, X.; Wu, T.; Zheng, M.; Jin, C.; Wu, W.; Zuo, Z. Comprehensive evaluation indices and method for power supply planning with complex power structure. In Proceedings of the 2020 IEEE 4th Conference on Energy Internet and Energy System Integration (EI2), Wuhan, China; IEEE: Piscataway, NJ, USA, 2020; pp. 1559–1564. [Google Scholar] [CrossRef] [Scilit]
- Al-Shafei, A.; Amjady, N.; Zareipour, H.; Cao, Y. Power system transition planning: A planner-oriented optimization model. Energies 2026, 19, 1070. [Google Scholar] [CrossRef] [Scilit]
- Huang, W.; Qu, D.; Wu, C.; Hu, K.; Qiu, T.; Wei, W.; Yin, G.; Jia, X. A two-tier planning approach for hybrid energy storage systems considering grid power flexibility in new energy high-penetration grids. Energies 2025, 18, 4986. [Google Scholar] [CrossRef] [Scilit]
- Shojaei, A.H.; Ghadimi, A.A.; Miveh, M.R.; Mohammadi, F.; Jurado, F. Multi-objective optimal reactive power planning under load demand and wind power generation uncertainties using ε-constraint method. Appl. Sci. 2020, 10, 2859. [Google Scholar] [CrossRef] [Scilit]
- Wang, K.; Wang, Y.; Gao, J.; Liang, Y.; Ma, Z.; Liu, H.; Li, Z. Multi-objective optimization of energy storage station configuration in power grids considering the flexibility of thermal load control. Energies 2025, 18, 2527. [Google Scholar] [CrossRef] [Scilit]
- Luo, J.; Teng, F.; Bu, S. Stability-constrained power system scheduling: A review. IEEE Access 2020, 8, 219331–219343. [Google Scholar] [CrossRef] [Scilit]
- Zhang, W.; Li, F.; Tolbert, L.M. Review of reactive power planning: Objectives, constraints, and algorithms. IEEE Trans. Power Syst. 2007, 22, 2177–2186. [Google Scholar] [CrossRef] [Scilit]
- Wu, M.; Shi, J.; Wen, H.; Qiu, Y.; Guo, C. Research on power and energy balance of new power system under low carbon emission path. Energy Rep. 2022, 8, 197–207. [Google Scholar] [CrossRef] [Scilit]
- Su, H.-I.; Gamal, A.E. Modeling and analysis of the role of energy storage for renewable integration: Power balancing. IEEE Trans. Power Syst. 2013, 28, 4109–4117. [Google Scholar] [CrossRef] [Scilit]
- Nanou, S.I.; Psarros, G.N.; Papathanassiou, S.A. Network-constrained unit commitment with piecewise linear AC power flow constraints. Electr. Power Syst. Res. 2021, 195, 107125. [Google Scholar] [CrossRef] [Scilit]
- Siregar, R.H.; Akhyar, A.; Lubis, R.S.; Hadi, M.N. Optimal power flow-assisted unit commitment with multi-level load variation analysis in renewable-based power systems. Energies 2025, 18, 6340. [Google Scholar] [CrossRef] [Scilit]
- Shi, Z.; Xiang, Y.; Lai, H.; Huang, D.; Zang, Y.; Qu, H. Reactive power optimization control strategy for regional power grid with photovoltaic power station. In Proceedings of the 2025 IEEE 12th Joint International Information Technology and Artificial Intelligence Conference (ITAIC), Chongqing, China; IEEE: Piscataway, NJ, USA, 2025; pp. 1161–1165. [Google Scholar] [CrossRef] [Scilit]
- Zhang, J.; Hu, J.; Luo, Y.; Tao, S.; Yuan, W.; Liu, Y. Domain-Specific Cloud Business Operating System for New Power Systems: Concept, Key Technologies and Initial Applications. Smart Energy Syst. Res. 2026, 2, 10004. [Google Scholar] [CrossRef] [Scilit]
- Xiao, X.; Li, T.; Zhou, Q.; Li, T.; Wu, S.; Zhang, J.; Hu, J.; Peng, Y.; Huang, Z. Scenario-Sequential Simulation and Renewable Energy Planning Applications Based on Business Operating System. In 2026 IEEE PES International Meeting (PES IM), Hong Kong; IEEE: Piscataway, NJ, USA, 2026; pp. 1–5. [Google Scholar] [CrossRef] [Scilit]
- Liang, Z.; Chung, C.Y.; Zhang, W.; Wang, Q.; Lin, W.; Wang, C. Enabling high-efficiency economic dispatch of hybrid AC/DC networked microgrids: Steady-state convex bi-directional converter models. IEEE Trans. Smart Grid 2025, 16, 45–61. [Google Scholar] [CrossRef] [Scilit]

Disclaimer/Publisher’s Note: The statements, opinions and data contained in all publications are solely those of the individual author(s) and contributor(s) and not of MDPI and/or the editor(s). MDPI and/or the editor(s) disclaim responsibility for any injury to people or property resulting from any ideas, methods, instructions or products referred to in the content. |
© 2026 by the authors. Licensee MDPI, Basel, Switzerland. This article is an open access article distributed under the terms and conditions of the Creative Commons Attribution (CC BY) license.