


Abstract
To enable fine-grained electricity management on the user side under the dual-carbon strategy and address the inherent limitations of traditional non-intrusive load monitoring (NILM) methods in multi-load parallel operation scenarios, this paper proposes a novel synergistically optimized framework. The framework sequentially integrates three core modules to tackle the key challenges of load identification: SSA-VMD-based load quantity estimation, CNN-LSTM-Attention-based current separation, and GAF-ResNet18-based load recognition. First, the Sparrow Search Algorithm optimizes Variational Mode Decomposition parameters, combined with Pearson-PCA, to accurately estimate the number of operating loads in mixed-power signals without prior knowledge. Second, a hybrid CNN-LSTM-Attention model extracts deep spatial-temporal features from the aggregated current spectrogram, enabling high-fidelity separation and reconstruction of individual load current waveforms. Third, the separated current signals are transformed into Gramian Angular Field images and classified by a ResNet18 network for robust load identification. The framework’s efficacy is rigorously validated on both the public PLAID dataset and a self-constructed laboratory dataset, covering diverse dual-load and triple-load operating conditions. Results demonstrate that the method achieves R2 coefficients exceeding 0.9 for current waveform reconstruction and maintains load recognition accuracy above 91% across all test cases, significantly improving identification performance under complex electricity consumption conditions. This high-performance load disaggregation provides critical data support for advanced grid applications, including demand response, load forecasting, and distribution network planning, thereby contributing to the intelligence and efficiency of future power systems.
1. Introduction
Under the dual challenges of global climate change and energy security, promoting green and low-carbon transformation has become an important strategic direction. Statistics show that in 2024, the carbon emissions from China’s power and heat production industry will account for about 50% of the total emissions of the whole society [1]. Under the dual-carbon strategic goal, the demand to transform the energy system toward a clean, low-carbon direction is becoming increasingly urgent, placing greater demands on the user-side fine management and demand response capabilities of the low-voltage distribution system. As a key technology for fine-grained management of electric energy, power load monitoring provides accurate data support for demand response and promotes efficient coordination between the power grid and users by collecting real-time load operational status and energy consumption characteristics [2,3,4].
At present, power load monitoring is mainly divided into two technical schemes: Invasive Load Monitoring (ILM) and Non-invasive Load Monitoring (NILM) [5]. Intrusive monitoring requires a separate monitoring terminal for each electrical device. Although operational data can be obtained directly, problems such as complex equipment deployment, high investment costs, and a cumbersome communication architecture limit user acceptance [6]. To overcome these technical bottlenecks, the academic community has proposed a non-intrusive load-monitoring method. This method deploys the acquisition unit only to the user’s total incoming line. It uses an intelligent algorithm to analyze total power consumption data to identify the operating state of each electrical appliance [7]. Compared with invasive schemes, non-invasive monitoring has significant advantages, such as low hardware costs, flexible deployment, and easy maintenance, and offers broader engineering application prospects [8]. The potential of NILM has also been systematically reviewed for industrial settings, where multi-load parallel operation is common [9]. NILM technology can not only effectively improve energy efficiency and create economic benefits for power enterprises and users, but also has broad industrialization prospects. Among them, load identification is the core link of NILM technology. By identifying the operating conditions of indoor electrical equipment and mastering the user’s electricity consumption behavior mode, it can not only provide a basis for optimizing power production scheduling and guiding scientific electricity consumption [10], but also realize equipment fault warning and electricity safety supervision to ensure the stable operation of the power system [11,12].
In the actual load monitoring process, when the event characteristics of load switching or state changes are not obvious, the traditional event detection method often struggles to respond accurately. In addition, load power close, similar operation principles, or multi-load parallel operation in complex power consumption scenarios will also significantly affect recognition performance. In view of these technical difficulties, this study takes the load steady-state signal as the research object, focuses on overcoming the identification bottleneck in the multi-load parallel scenario, and proposes a new combined load identification method that provides theoretical support for load monitoring in a complex power consumption environment.
Hart first proposed the concept of non-intrusive load monitoring, realized load decomposition by analyzing total power changes, and clarified the basic research route of NILM [13,14,15].
In the field of non-intrusive load identification, a variety of solutions have been proposed for different technical requirements. The multi-feature objective-function PCA-ILP method is proposed in Reference [16]. The computational complexity is simplified by PCA dimension reduction, and the ILP is used to optimize the decomposition results. The balance between accuracy and efficiency is achieved in the load analysis on the power grid dispatching side, but the decomposition error exceeds 28% in the multi-load simultaneous operation scenario. In [17], active deep learning is combined with the discrete wavelet transform to reduce labeling cost via active learning, and the wavelet transform is used to extract time-domain features, effectively improving recognition accuracy in small-sample scenarios. However, it takes an average of 5–8 manual debugging to determine the best wavelet basis function. In [18], by improving the KNN algorithm’s neighbor selection strategy, recognition accuracy under small-sample conditions is significantly improved, with the added advantage of easy deployment and strong real-time performance. Still, it is more sensitive to data outliers and category imbalance. In Reference [19], the voltage-current data is innovatively reconstructed into images, and load identification is transformed into an image recognition problem, thereby reducing the need for artificial feature engineering; however, the image reconstruction process may lose some original electrical features. In [20], the Fisher-SVM feature selection method was used to reduce feature redundancy by screening key features, thereby reducing computational cost while ensuring accuracy. However, it was not adaptable to the new equipment’s characteristics. In Reference [21], the feature extraction capability was enhanced by improving the CNN architecture, thereby improving identification accuracy under complex working conditions. Still, the number of model parameters increased, making it easy to overfit. In Reference [22], a multi-feature fusion strategy is adopted to integrate multidimensional features, including current, power, and harmonics, effectively reducing the misjudgment rate for similar loads; however, the feature weight distribution is determined by human experience. In [23], a method combining high-frequency signal decomposition with improved VI trajectory coding is proposed, accurately capturing the subtle features of high-frequency devices but requiring a high hardware sampling rate. In [24], a three-dimensional voltage-current trajectory model is constructed to enable fine-grained load identification, but the model is complex and sensitive to voltage fluctuations. In Reference [25], an algorithm combining the load characteristic matrix with CBAM-BiLSTM is used to strengthen key features via the attention mechanism. The BiLSTM captures temporal dependencies, significantly improving recognition performance in the multi-device dynamic power consumption scenario. Still, the efficiency of long sequence data processing is low. In Reference [26], Athanasiadis et al. developed a lightweight real-time NILM system with high computational efficiency, targeting embedded deployment scenarios. In Reference [27], Wang et al. proposed a particle swarm optimization-attention temporal graph convolutional network that jointly optimizes hyperparameters and extracts spatio-temporal features, achieving a multi-load identification accuracy of over 95% on standard power system test benches; however, the method requires pre-defined graph structures and may not generalize well to unseen load combinations or dynamic network topologies.
Although existing research has made significant progress, several common limitations remain. Firstly, the uncertainty in load quantity and the dependence of key parameters on experience limit the accuracy of subsequent Analysis. Secondly, existing models struggle to achieve high-precision separation and strong generalization in the presence of simultaneously aliasing signals. The root cause is that the feature extraction is insufficient, and the spatio-temporal features cannot be effectively mined collaboratively. Finally, the reliance on artificial features and fixed weights results in a significant decrease in the model’s discriminant ability under combined loads.
To address the common limitations discussed above, this paper considers the scenario of residential electricity consumption. In ordinary households, the number of appliances running simultaneously on the same circuit rarely exceeds three, due to the physical constraint of circuit current capacity. Moreover, a single power strip has a limited number of outlets and is generally not allowed to be daisy-chained, so it can accommodate at most two or three appliances at a time. However, even in this scenario where only two or three appliances run simultaneously, most existing methods are designed for single appliances or rely solely on total power variations, and they struggle to handle the superposition and aliasing of multiple loads. When multiple appliances operate in parallel on the same circuit, their current waveforms superimpose and form a complex mixed signal with mutual feature interference. Conventional approaches, such as harmonic analysis, V-I trajectory, and power decomposition, often suffer from large decomposition errors and significantly reduced identification accuracy in such scenarios. Given that two or three appliances running simultaneously is a common situation in household circuits and existing methods already face clear bottlenecks, this paper focuses on this core scenario. For cases with four or more loads, although the spectral aliasing becomes even denser, such situations are rare in actual households and require different technical approaches, which are beyond the scope of this study.
Based on the above analysis, this study proposes an integrated, synergistically optimized framework that addresses the challenges of NILM in complex scenarios through a sequential, interconnected process. The three modules operate in a cascaded manner along the chain of “estimation → separation → identification,” where the output of each preceding module directly determines the input quality of the subsequent one. Errors propagate progressively through this chain: an incorrect load count estimation would misconfigure the separation channels, while distorted separated waveforms would directly compromise the final identification accuracy. As will be demonstrated in Section 5, the actual accuracy achieved by each module is sufficient to sustain the effective operation of the overall framework, with errors maintained within an acceptable range. The framework uniquely combines SSA-VMD-based load number estimation, CNN-LSTM-Attention-based current separation, and GAF-ResNet18-based load recognition, with each module designed to solve a specific problem and enable the next. The principal contributions of this study are threefold:
- (1)
- Addressing the lack of prior knowledge in load count and parameters: A load number estimation method based on SSA-VMD and PCA is proposed. By intelligently optimizing VMD parameters and eliminating spurious decomposition components via Pearson correlation analysis, this method achieves an accurate perception of the number of operating loads without requiring any prior knowledge, a critical prerequisite for effective subsequent separation.
- (2)
- Solving the signal aliasing problem in multi-load scenarios: A CNN-LSTM-Attention hybrid separation model is constructed, which synergistically integrates spatial pattern mining via convolutional layers, temporal dependence capture via LSTM, and an attention focusing mechanism to weigh salient time-frequency features. This enables high-precision separation and waveform reconstruction of multi-load currents, even under severe aliasing conditions.
- (3)
- Overcoming feature engineering limitations for robust identification: A load identification method based on Gramian Angular Field (GAF) encoding and a ResNet18 deep residual network is proposed. This approach automatically transforms one-dimensional current sequences into discriminative two-dimensional image features, eliminating the need for manual feature extraction and fixed weights, thereby significantly improving generalization capability and recognition accuracy for similar and novel loads.
The remainder of this study is organized as follows: Section 2 describes the data sources and provides a characteristic analysis of loads. Section 3 describes the load-number estimation method based on SSA-VMD and PCA. Section 4 delves into combined load-current separation and identification methods based on time-frequency characteristics and deep learning. Section 5 presents and discusses the experimental results. Section 6 concludes the paper and outlines future research directions.
2. Load Data Source and Characteristic Analysis
Load characteristic analysis is the basis of load identification. Firstly, based on PLAID and self-built laboratory datasets, this study analyzed steady-state load characteristics and selection research.
2.1. Source of Load Data
The PLAID dataset is primarily used for non-invasive load-monitoring research [28]. The dataset uses a 30 kHz sampling frequency to collect voltage and current data from more than 60 households, about 1876 appliances across more than 40 types. It provides high-quality public data for load identification research.
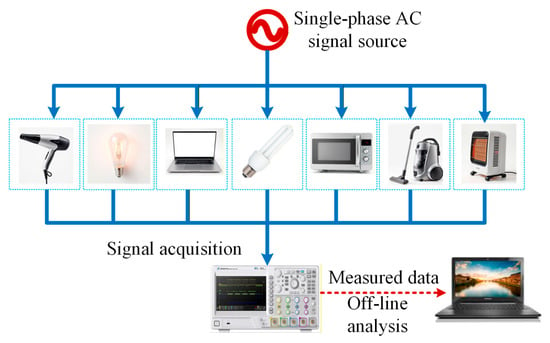
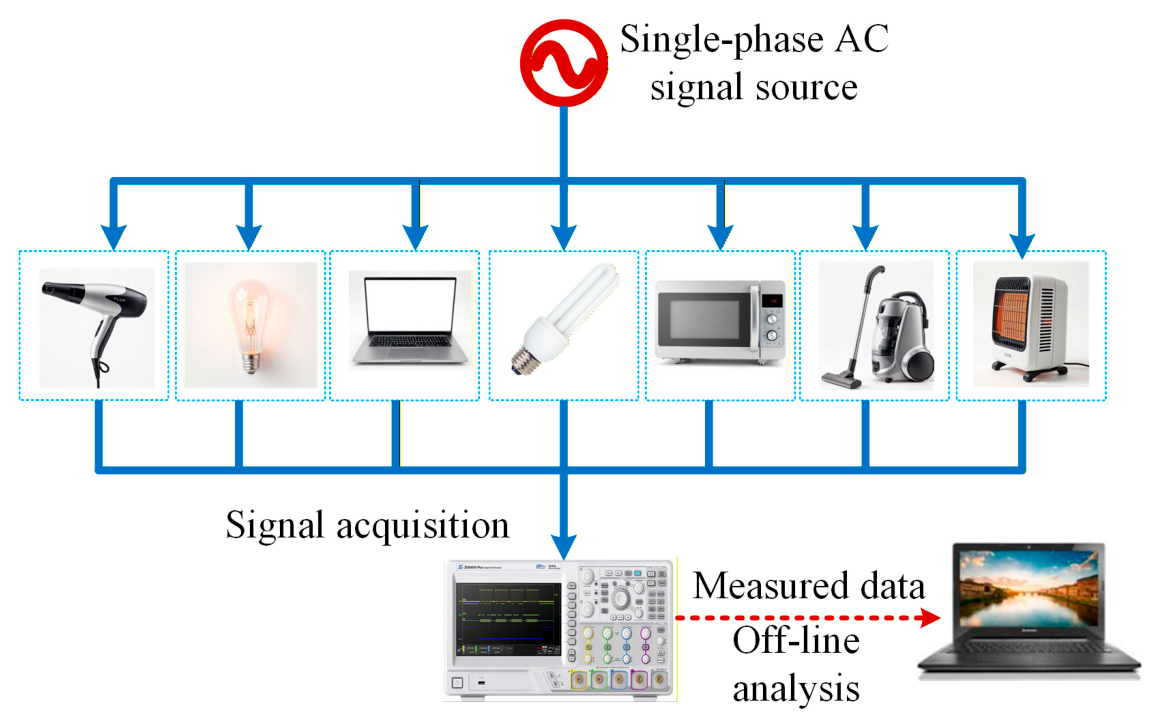
To simulate the actual non-intrusive monitoring environment and conduct physical verification, the laboratory built a steady-state load test platform, as shown in Figure 1. The platform comprises a 220 V/50 Hz AC power supply, a multi-channel load branch, and a data acquisition device. Total loop sampling is used to simulate the household point signal, with a sampling frequency of 25 kHz. In accordance with DL/T2365-2021 [29], seven typical loads, such as microwave ovens and heaters, are selected to collect data on single-load operation and multi-load parallel operation, including 21 two-load and 35 three-load combinations. The total power signal at a 1 kHz sampling rate is recorded synchronously, providing data support for subsequent research on load identification and number estimation.
Figure 1.
Different load working signal acquisition test platform.
2.2. Load Characteristics Analysis and Selection
Electrical loads are categorized as either linear or nonlinear based on their characteristics. Linear loads include resistive and inductive types. A resistive load, such as a heater, draws a current in phase with the voltage, resulting in a near-sinusoidal waveform. An inductive load, like an air conditioner or motor, draws a current that lags behind the voltage. In contrast, a nonlinear load, exemplified by a microwave oven, contains semiconductor components that distort the current waveform, introducing significant harmonic content.
These intrinsic differences define the core features usable for load identification. To achieve efficient non-intrusive identification, highly discriminative steady-state characteristics must be selected.
Conventional feature sets have limitations in multi-load parallel scenarios. While aggregate power features are easy to measure, different loads can have similar power values, and small nonlinear loads are prone to measurement deviation due to high reactive power ratios. Similarly, the V-I trajectory effectively characterizes steady-state load behavior, but loads with similar operating principles produce similar shapes and lack time-dimensional information. Furthermore, in a parallel conFigureuration, the voltage across all loads equals the grid voltage, so they cannot be differentiated.
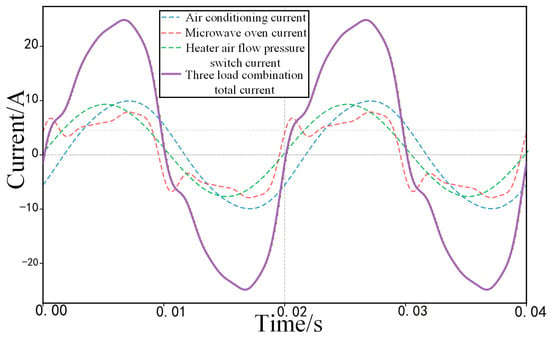
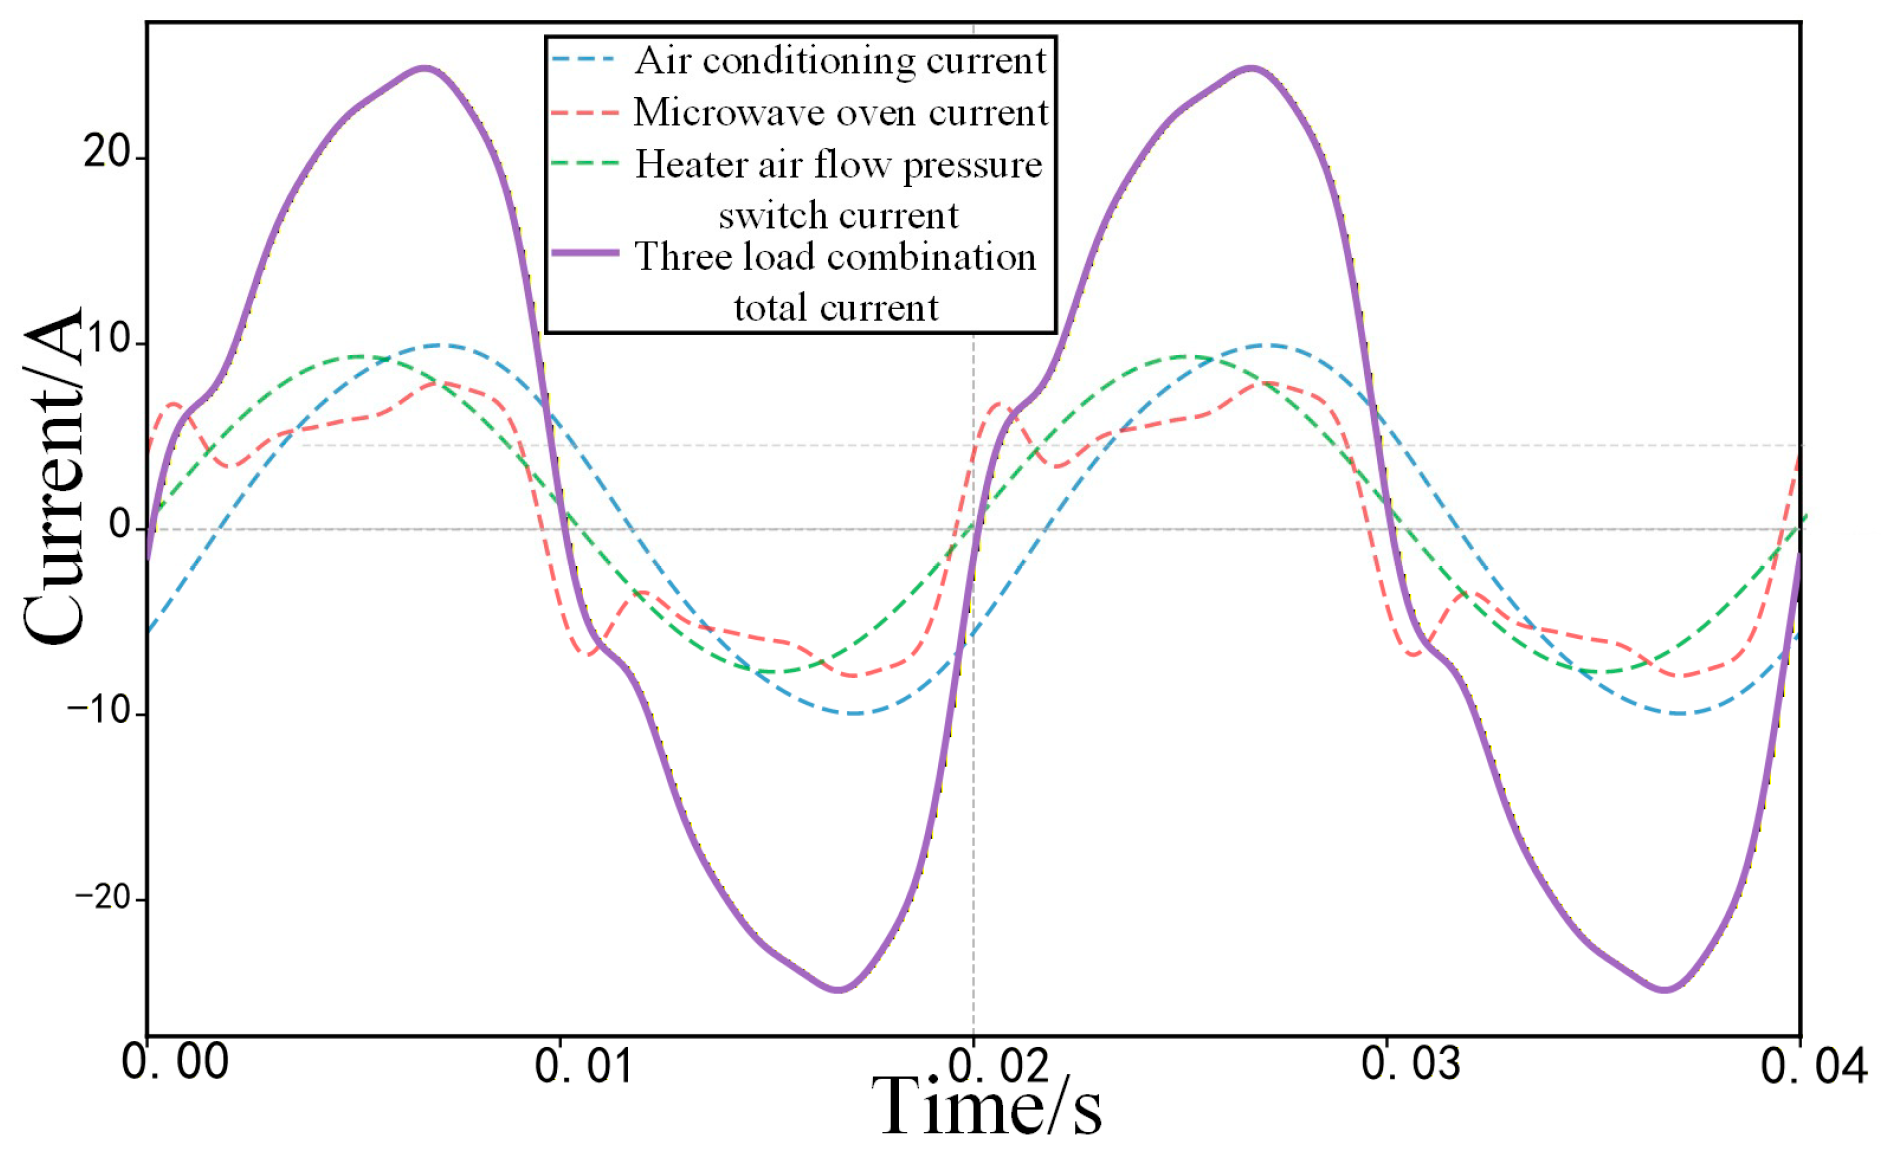
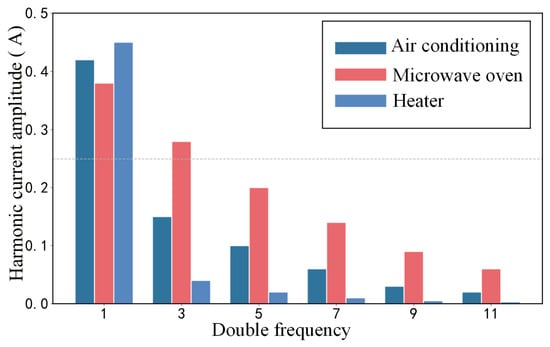
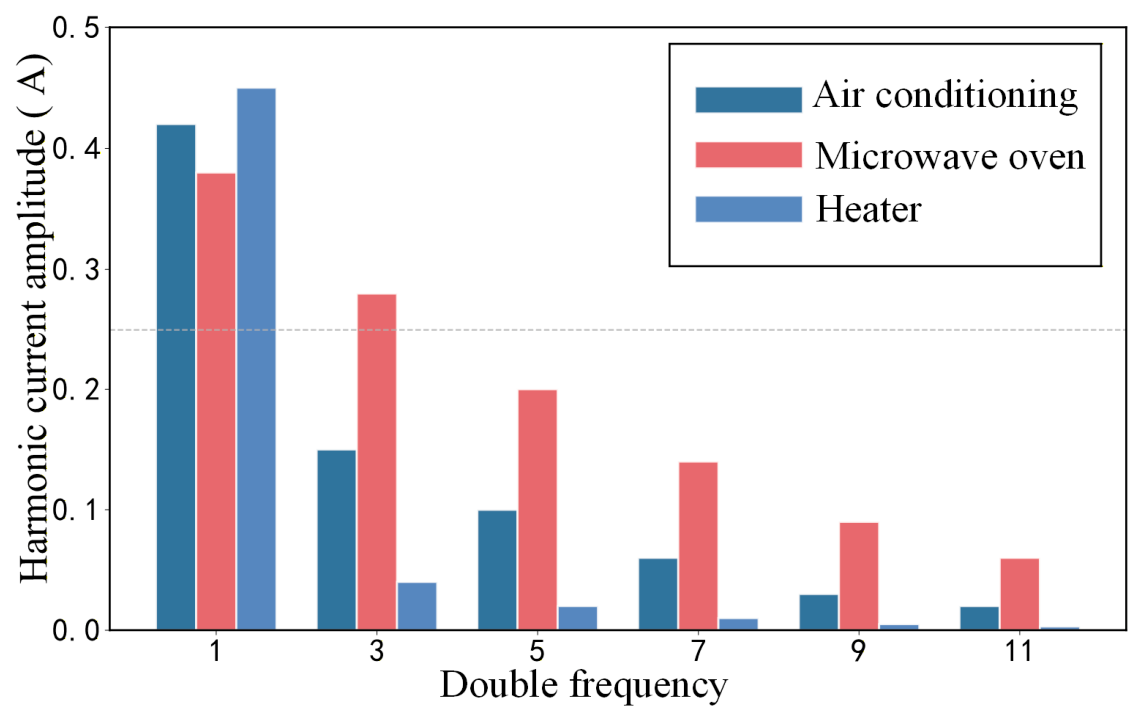
In contrast, current characteristics provide intense discrimination in both the time and frequency domains. For intuitive verification, Figure 2 and Figure 3 compare the current waveforms and harmonic spectra of three typical loads: an air conditioner (inductive linear), a microwave oven (nonlinear), and a heater (resistive linear). Time-domain analysis reveals that the linear loads (air conditioner and heater) exhibit nearly sinusoidal currents, while the nonlinear load (microwave oven) shows significant waveform distortion. Frequency-domain analysis confirms that the microwave oven generates rich harmonic components, whereas the heater and air conditioner exhibit low but distinctly different harmonic distributions.
Figure 2.
Comparison of current waveforms for typical loads.
Figure 3.
Odd harmonic content diagram of air conditioner, microwave oven, and heater.
This analysis demonstrates the superior capability of current signals for load identification. To fully describe these characteristics, additional time-domain features can be extracted via mathematical calculation, as detailed in Table 1.
Table 1.
Calculation formula of current time domain characteristics.
The analysis of load characteristics establishes the foundation for feature selection and confirms the current signal’s superiority as the core data source. The primary challenge in practical non-intrusive monitoring, however, is the inherent uncertainty regarding the number of loads operating in parallel. Accurate estimation of this load count is a critical prerequisite for effective current separation and individual appliance identification. Consequently, following the feature analysis, this study first addresses the load number estimation problem to establish a necessary foundation for the subsequent steps in the identification process.
3. Organization of the Template Estimation Method of Power Load Number Based on Adaptive Variational
To address the challenge of unknown load counts in mixed power signals—a critical limitation for identification performance in non-intrusive monitoring—this paper proposes a load-number estimation method based on an optimized Sparrow Search Algorithm-Variational Mode Decomposition (SSA-VMD). The method estimates the number of operating loads by decomposing the aggregated current signal, screening the resulting Intrinsic Mode Functions (IMFs), and calculating their cumulative variance contribution rate.
3.1. Variational Mode Decomposition Based on the Sparrow Search Algorithm
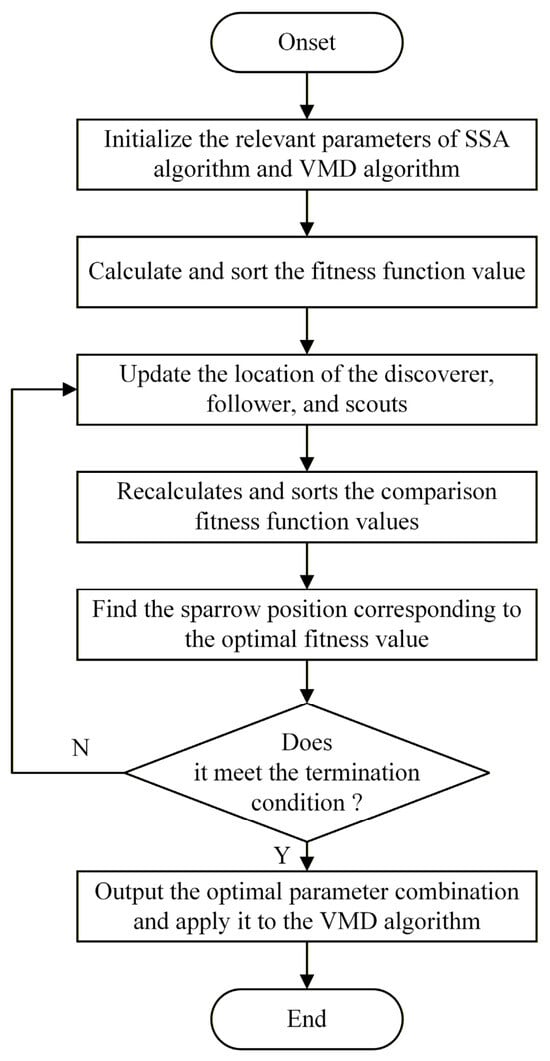
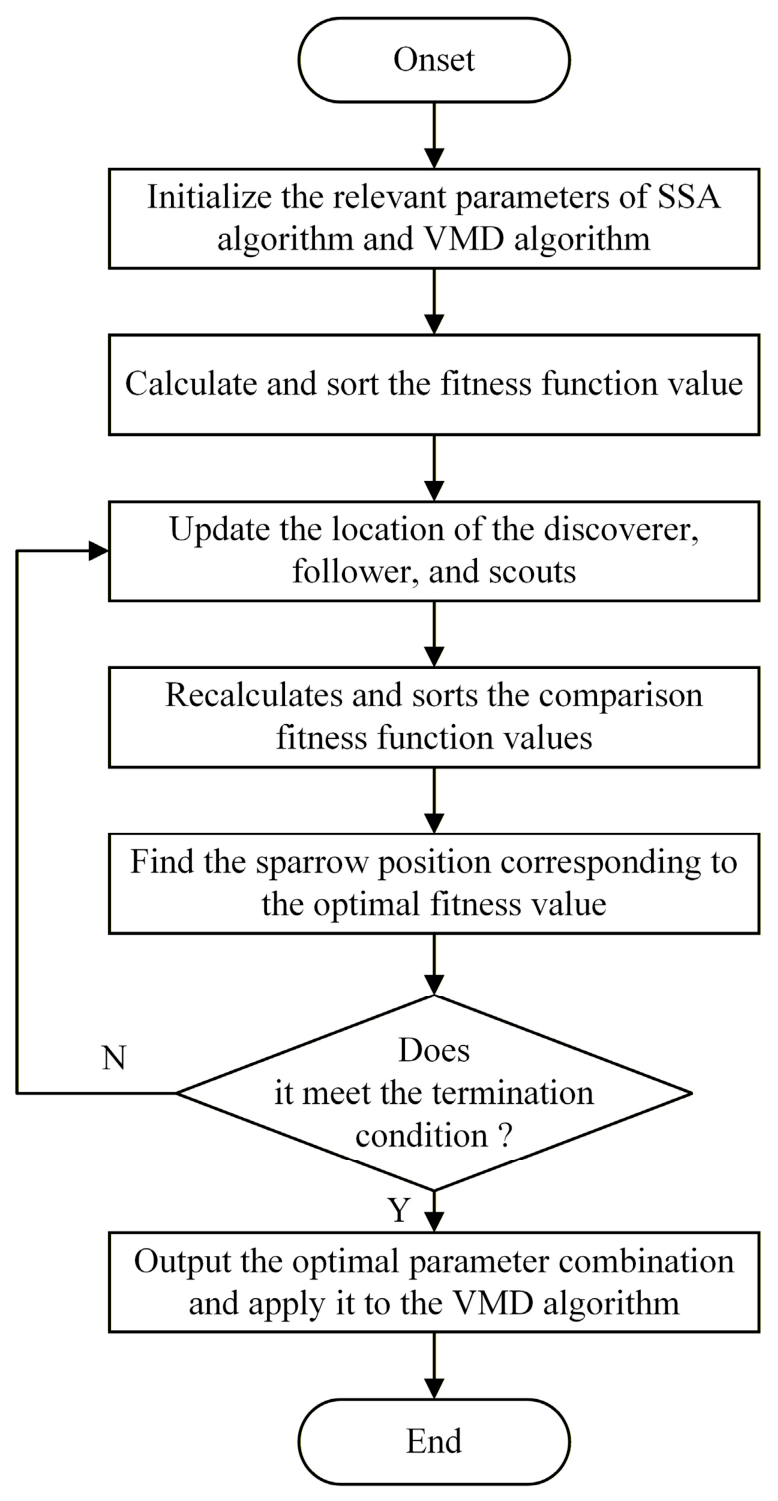
The complete algorithm flowchart is presented in Figure 4. In variational mode decomposition (VMD), the quality of the decomposition for mixed-power signals is critically dependent on key parameters such as the number of modes (K), the quadratic penalty factor (α), the discrimination accuracy (ε), and the noise tolerance (τ). These parameters are typically set empirically, making it difficult to achieve an automatically high-quality, adaptive decomposition.
Figure 4.
The algorithm flow chart of SSA optimizing VMD.
To address this parameter conFigureuration problem, this study employs the Sparrow Search Algorithm (SSA) to optimize the core VMD parameters via global search adaptively. Compared to traditional optimization algorithms, SSA exhibits superior global search capability and greater convergence stability when addressing high-dimensional parameter optimization. Here, the minimum envelope entropy is selected as the fitness function to identify the optimal parameter combination [K0,α0].
During the initialization phase of the SSA-VMD algorithm, the primary parameters are set: the number of iterations, the population size, the proportions of discoverers, followers, scouts, and the initial VMD parameter ranges. Subsequently, the fitness function value for each sparrow (individual) is calculated and sorted in ascending order. The individual with the best fitness is designated as the population discoverer.
Following the SSA’s rules, the followers and scouts are then selected, and their positions are updated accordingly. After this update, the fitness values for the entire population are recalculated and re-sorted to identify the position corresponding to the current global best fitness. Finally, the algorithm checks whether the termination condition (e.g., the maximum number of iterations) is met. If satisfied, the optimal parameter combination [K0,α0]is returned. Otherwise, the process loops back to the position update step to continue the iterative optimization.
Envelope entropy reflects the disorder of decomposed IMF envelopes. Multi-load current superposition causes aliasing and mode mixing with high entropy, while optimal VMD parameters produce smooth, low-entropy envelopes containing independent single-load features. Manual preset K and α cannot adapt to variable aliasing intensity. Thus, minimal envelope entropy is adopted as the SSA fitness function to solve the optimal [K0,α0] and acquire high-quality decomposed components for load number estimation.
In practical deployment, the SSA optimization is not intended to run continuously on every sampling window. It is triggered only periodically or when a significant change in the load composition is detected by the upstream estimation module. Once the optimal VMD parameters are determined, they can be cached and reused until the load configuration changes notably. This event-driven strategy avoids introducing sustained computational latency and makes the approach naturally compatible with online monitoring requirements.
3.2. Estimation Method of Electric Load Number Based on Pearson-PCA
Decomposing the total power signal via the optimized SSA-VMD yields K Intrinsic Mode Functions (IMFs). However, spurious IMF components can arise from the decomposition process and introduce error into subsequent load-number estimation if analyzed directly. To mitigate this, IMF components are screened using Pearson correlation analysis. Specifically, the Pearson correlation coefficient between each IMF and the original total signal is calculated to assess the relevance of each IMF. The formula is given as follows:
In the formula, p(t) represents the total power signal; represents the jth IMF component; and and represent the variance of and , respectively. represents the covariance between p(t) and . The IMF component with a correlation coefficient below 10% is considered a false component and is removed for subsequent analysis.
After IMF screening, the resulting components form the matrix Z. Principal component analysis (PCA) is then applied to Z to reduce feature dimensionality, and the cumulative variance contribution of the eigenvalues is calculated. The number of operating loads (β) is estimated using the empirical criterion that the cumulative variance reaches or exceeds 90%, a widely adopted threshold for retaining dominant information. Because the Pearson screening step has already filtered out noise-dominated and spurious components, PCA operates on signal-bearing IMFs, which makes the 90% threshold robust against unmodeled background power fluctuations.
To justify the choice of the 90% cumulative variance threshold, a sensitivity analysis was conducted using thresholds of 80%, 85%, 90%, and 95% on all 121 test cases (Experiments 1–4). The estimation accuracy for each threshold is summarized in Table 2. The 90% threshold achieves 100% accuracy, whereas lower thresholds lead to underestimation of weak loads and higher thresholds cause overestimation due to noise components. Therefore, 90% is adopted as the optimal threshold for load number estimation. The SSA-VMD-Pearson-PCA pipeline adopts two quantitative thresholds, and the complete judgment rules are specified as follows:
Table 2.
Estimation accuracy under different cumulative variance thresholds.
- IMF screening rule: The Pearson correlation coefficient between each IMF and the aggregated signal is calculated via Equation (1). IMFs with are eliminated as spurious noise components, and only IMFs satisfying are retained for PCA dimensionality reduction, with the fixed 10% threshold applied uniformly to all test samples.
- Load counting rule: PCA is carried out on the screened valid IMFs, and the variance contribution rates of eigenvalues are accumulated in descending order. The number of principal components at the first point where the cumulative variance contribution reaches 90% is defined as the number of simultaneously operating loads.
This threshold scheme is applicable to all categories of electrical loads and maintains stable performance even for low-power loads with faint signatures. IMFs decomposed from low-power loads always yield correlation coefficients above 0.1 relative to the aggregated signal, so weak load features will not be mistakenly filtered out during IMF screening. Unlike the 80% and 85% thresholds that tend to underestimate weak loads and the 95% threshold that captures noise and leads to overcounting, the 90% criterion balances estimation accuracy effectively. All dual-load and triple-load test cases containing low-power appliances achieve 100% load quantity estimation accuracy, which fully verifies the reliability of the threshold scheme under diverse load conditions.
4. Research on a Combined Load Current Separation and Identification Method Based on Time-Frequency Characteristics
Building upon the load-number estimation, this study constructs a multi-channel current-separation model to disaggregate the mixed signal. The separation process involves waveform reconstruction via time-frequency transformation and a CNN-LSTM-Attention network, followed by load classification that combines a Gramian Angular Field (GAF) encoding with a ResNet18 classifier. The efficacy of the proposed integrated method is validated on both the public PLAID dataset and a proprietary laboratory dataset, demonstrating robust performance in multi-load parallel operation scenarios.
4.1. Construction of the Combined Load Current Spectrum Diagram
The time-frequency transform for waveform reconstruction typically employs a Fourier transform to convert a finite-length current signal sequence into a two-dimensional spectrum matrix. In this matrix, the rows and columns represent the frequency and time dimensions, respectively. At the same time, each element’s value corresponds to the Amplitude of a specific frequency component at a given time.
To validate the method, a mixed current signal, denoted (t), is synthesized (aggregated or combined current). This signal is generated by superimposing the steady-state current waveforms of typical electrical appliances. The source data includes both the public PLAID dataset and waveforms collected from our laboratory platform. The combined current can be expressed as:
In the formula, t is the time corresponding to the data of the current sampling point; (t) represents the noise signal; and (t) represents the actual value of the current corresponding to the ath electrical load at time t, where a = {1, 2, … A} is the total number of electrical loads.
The aggregated current is divided into continuous segments , each of length . The Discrete Fourier Transform (DFT) is then applied to each segment to obtain the spectrogram matrix :
In this expression,denotes the -th sub-fragment in the time domain, and represents its corresponding frequency-domain DFT result. To ensure uniform input dimensions, any incomplete trailing fragments are zero-padded. During waveform reconstruction, the Inverse Discrete Fourier Transform (IDFT) is applied to the separated spectrum matrix to recover the time-domain current sequence.
Following this transformation principle, spectrum matrices are constructed for both the PLAID and laboratory datasets. For the PLAID data (60 Hz power frequency, 30 kHz sampling rate), this yields a matrix. For the laboratory-collected data (50 Hz power frequency, 25 kHz sampling rate), the process produces a matrix.
4.2. Combined Load Current Separation Method Based on CNN-LSTM-Attention
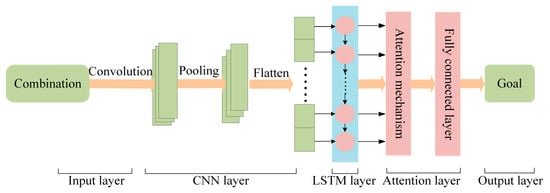
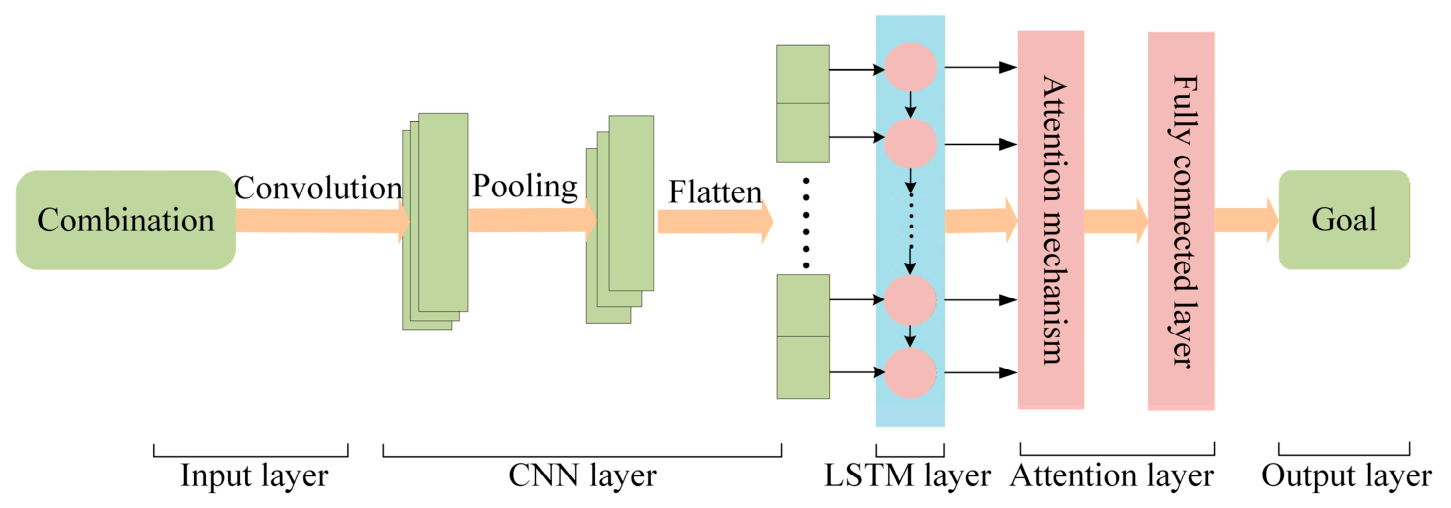
This method is based on a closed-set assumption, i.e., each output channel corresponds to known appliance types in the training set, and the test load combinations are composed of these known categories. This assumption is the fundamental prerequisite for the effective estimation of the Ideal Ratio Mask (IRM) mechanism: the IRM essentially describes the energy allocation relationship among signal components in the mixed signal, and its estimation accuracy relies on prior knowledge of target signal characteristics. Based on this assumption, when the signal components to be separated all belong to known categories, the IRM can accurately estimate the energy proportion of each component, thereby enabling high-accuracy waveform reconstruction. Within this framework, to simultaneously extract the spatial structure and temporal dynamics inherent in the current spectrum, this study constructs a hybrid CNN-LSTM-Attention model. The architecture employs a Convolutional Neural Network (CNN) to capture local spatial patterns within the spectrogram, a Long Short-Term Memory (LSTM) network to learn contextual dependencies across the time dimension, and a soft attention mechanism to adaptively weigh the importance of key frequency bands and critical time segments [30]. The complete model structure is illustrated in Figure 5.
Figure 5.
Architecture of the CNN-LSTM-Attention model for current separation.
To improve the efficiency of multi-signal parallel separation, this study constructs dual- and three-channel separation models. These models are instantiated based on the load count (β) estimated in Section 2 to handle different load-combination scenarios. The input to each model is the current amplitude spectrum of the aggregated load signal, and the output is an estimate of the target load’s Ideal Ratio Mask (IRM) [31].
The IRM concept, adapted from nspeech separation, effectively characterizes the time-frequency proportion of a target source within a mixture. It is calculated as follows:
In the formula, is the amplitude spectrum of the ith target load current signal; k denotes the number of loads in the combined current signal. Each element in the IRM matrix has a value between 0 and 1, directly representing the target load’s relative energy contribution within each time-frequency (T-F) unit. After processing by the current separation model, the estimated IRM for a target load is obtained. The target load’s amplitude spectrum,, is then reconstructed using the following formula:
In the formula, Y is the amplitude spectrum of the combined current signal. Ideally, the sum of the estimated IRMs of all target loads should be approximately 1, that is, , which ensures the completeness of the separation. During training, each output channel of the CNN-LSTM-Attention model is fixedly assigned to a distinct target appliance, and the same set of appliance types is used in both training and testing.
The sum of estimated IRMs of all target loads is theoretically close to 1. Obvious residual energy between the aggregated mixed spectrum and the sum of reconstructed load spectrums corresponds to unmodeled unknown appliances or background noise. These residual components are suppressed by the attention module during spectrum separation and excluded from subsequent GAF-based load identification.
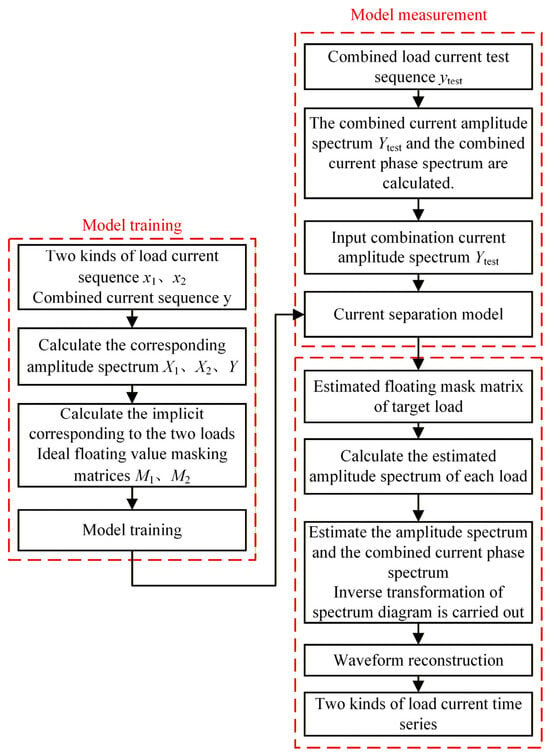
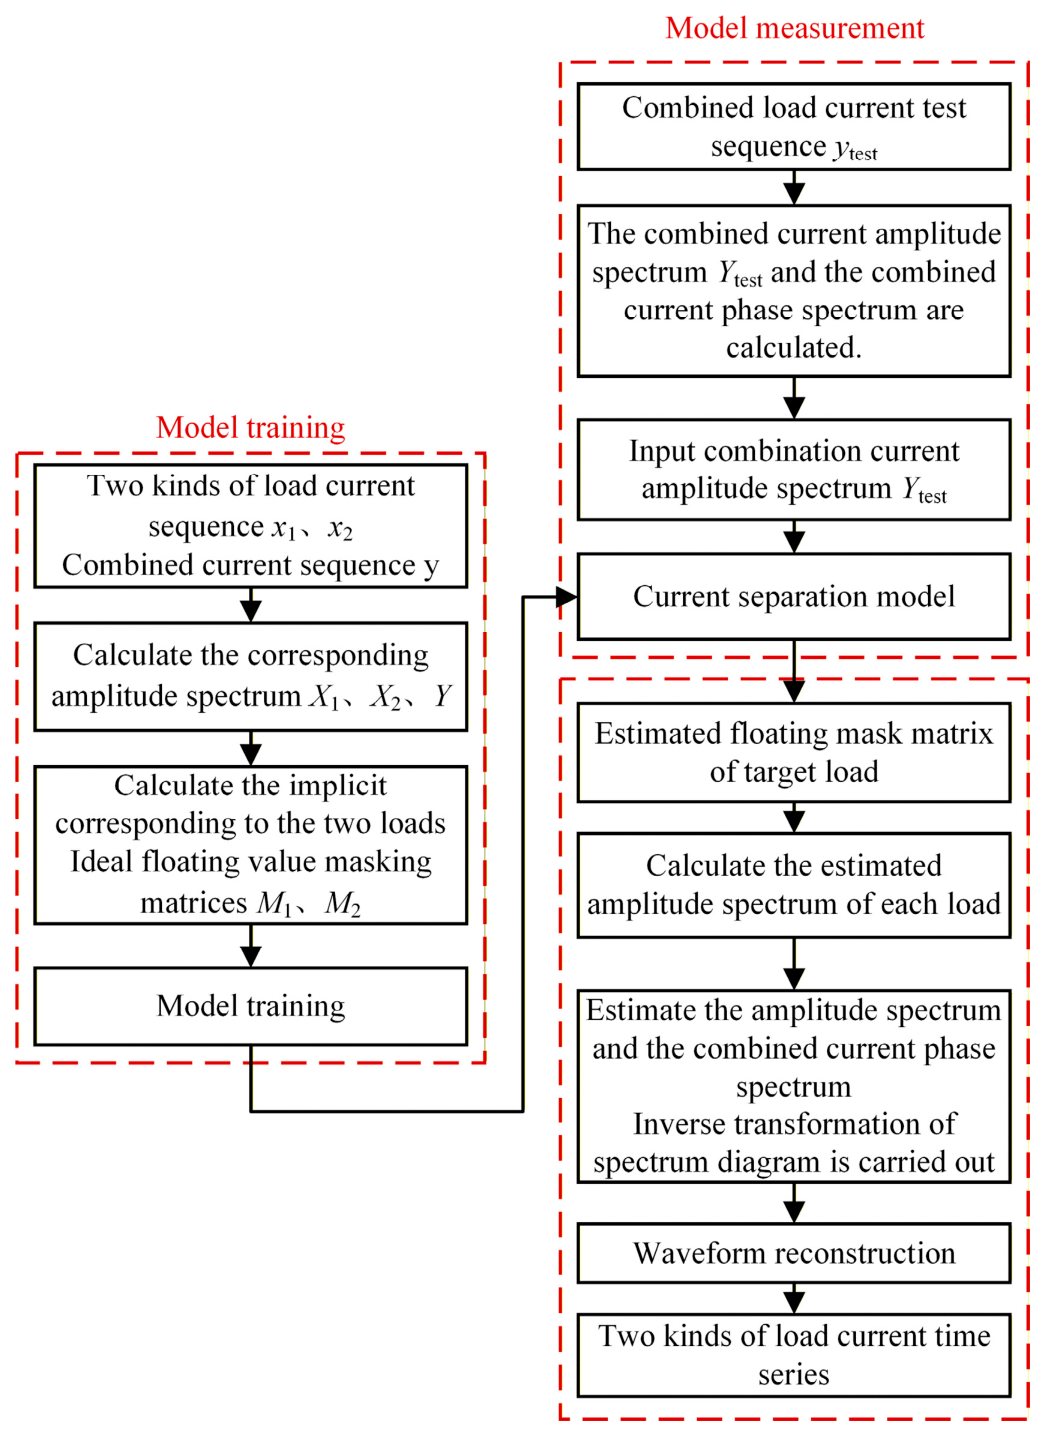
The overall separation process, illustrated in Figure 6, consists of two primary stages: (1) amplitude spectrum separation and (2) waveform reconstruction. The first stage employs the CNN-LSTM-Attention network to estimate the Ideal Ratio Mask (IRM), thereby separating the amplitude spectrum. The second stage uses the estimated IRM and the mixed signal’s phase spectrum to perform an inverse time-frequency transform, reconstructing the final time-domain waveform.
Figure 6.
Combined current separation flow.
Using two-load separation as an example, the procedure is as follows. First, the individual load currents , , and their mixture undergo time-frequency transformation to obtain their respective amplitude spectra , , and . The ideal IRM matrices and are then calculated using Equation (4). During training, Y serves as the input, with and as the training targets for model optimization.
In the test/inference phase, the mixed test current is transformed to yield its amplitude and phase spectra. The amplitude spectrum is input to the trained model to obtain the estimated IRM, which is used with Equation (5) to reconstruct the target amplitude spectrum. Finally, this reconstructed amplitude spectrum is combined with the original mixed-phase spectrum in an inverse transform to generate the separated time-domain waveform. This summation assumption is based on a closed-set scenario. In the presence of unknown appliances or strong noise, the continuous IRM masking and attention mechanism inherently suppress unknown components, and residual energy monitoring can detect model-data mismatch.
4.3. Load Current Identification Method Based on GAF
This study adopts a two-stage strategy: performing load separation first, followed by identification. This modular design enhances the system’s interpretability and flexibility.
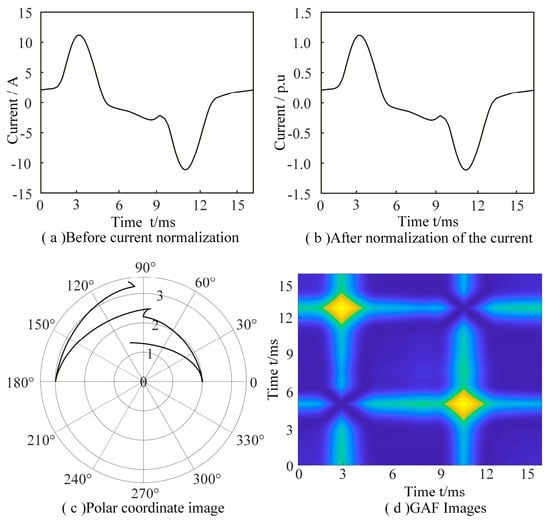
For the identification stage, one-dimensional separated current sequences are encoded into two-dimensional images using a Gramian Angular Field (GAF). This technique maps a normalized current sequence into polar coordinates and applies trigonometric functions. The resulting pixel values represent temporal correlations between data points at different times, thereby transforming temporal patterns into visual texture features.
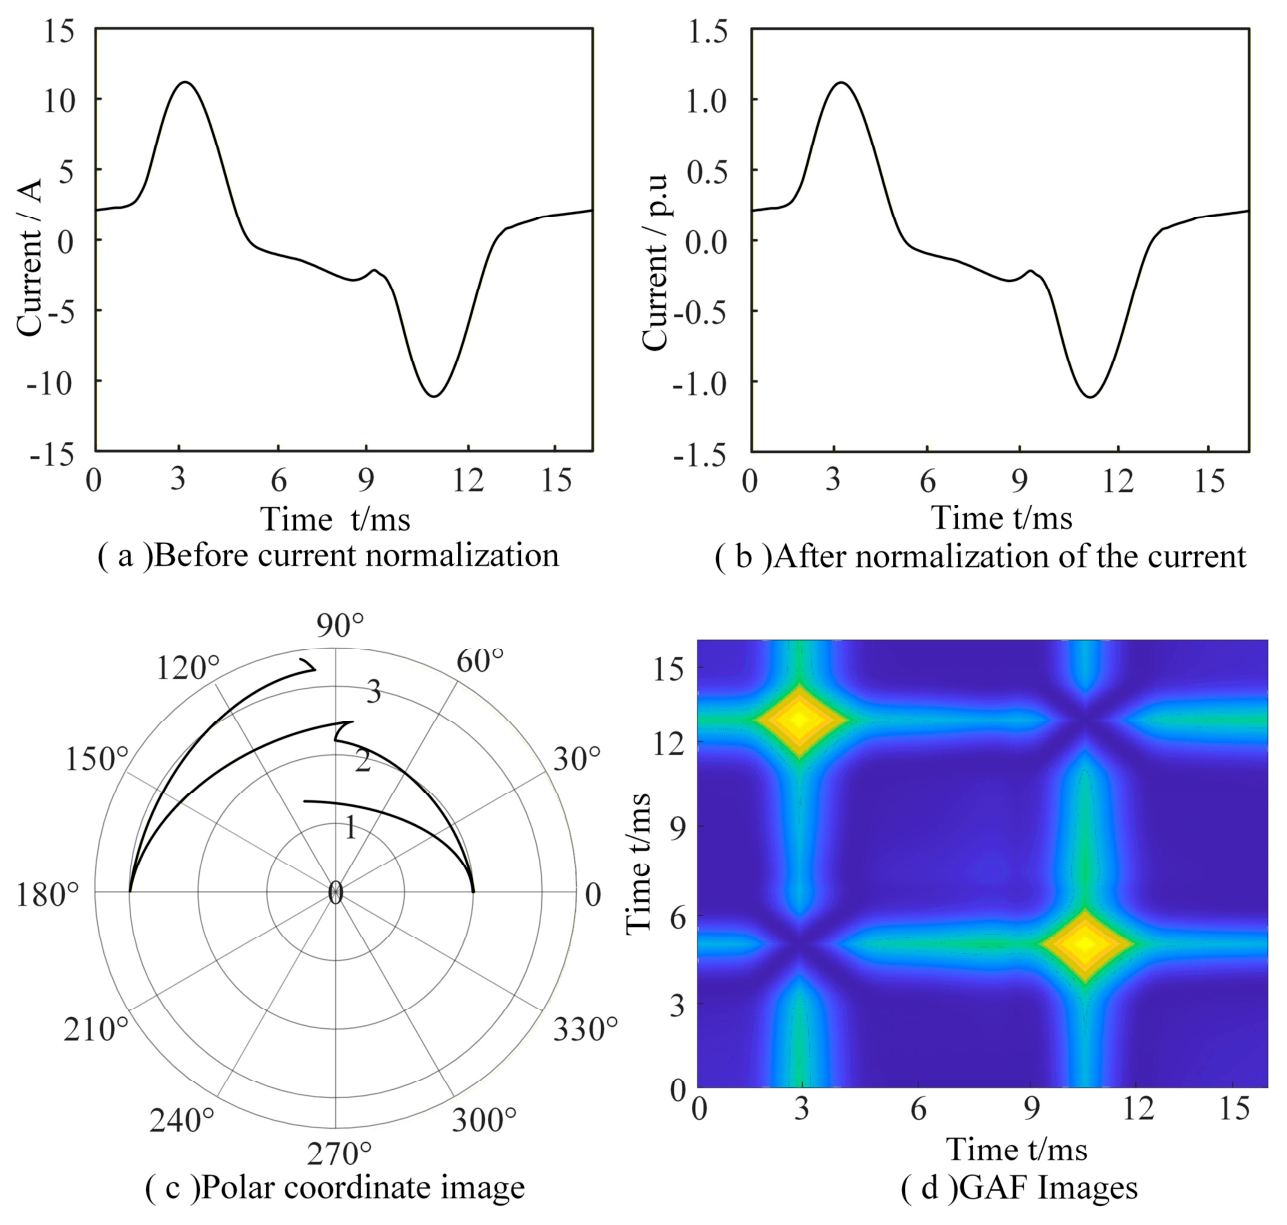
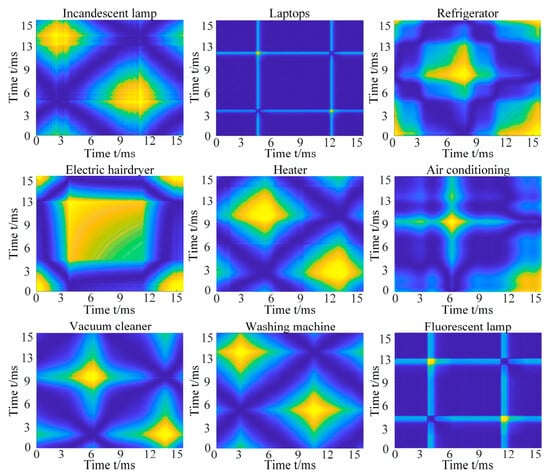
Experiments utilized both the PLAID dataset and laboratory-collected data. For each load, 500 sampling points per power-frequency cycle were used to generate 500 × 500 GAF images. Figure 7 illustrates this process using a microwave oven load from the PLAID dataset. As shown, the normalized current sequence is mapped to polar coordinates and transformed via trigonometric operations into a two-dimensional image. The symmetrical waveform of the microwave oven current corresponds to a distinct pattern of bright yellow blocks in its GAF image, effectively capturing the load’s characteristic signature. Figure 8 presents the GAF images for nine other loads from the PLAID dataset, demonstrating clear visual discrimination across different appliance types.
Figure 7.
GAF image generation process for a microwave oven load.
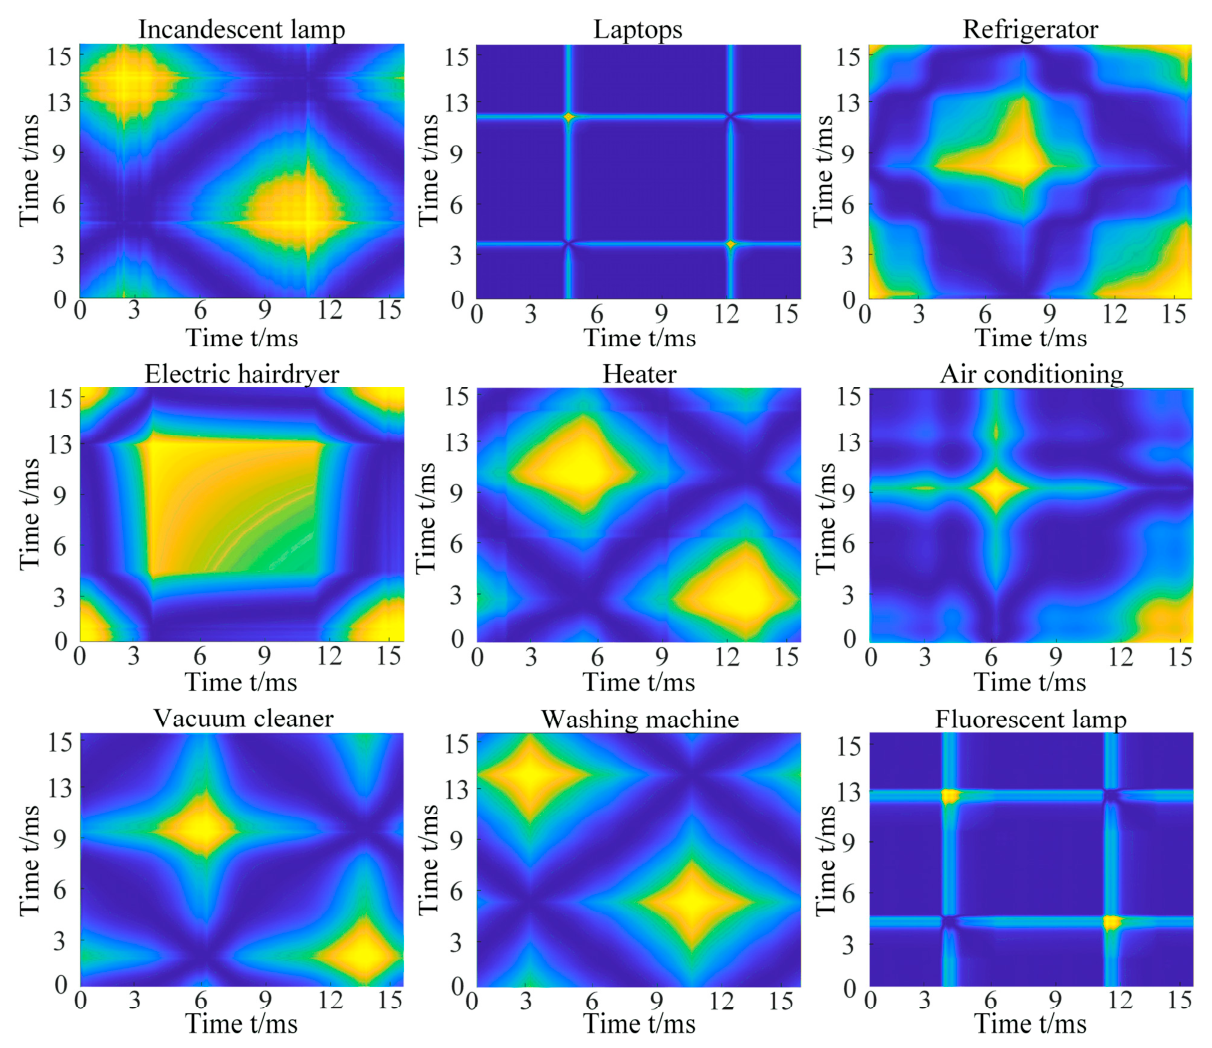
Figure 8.
GAF images of nine typical loads from the PLAID dataset.
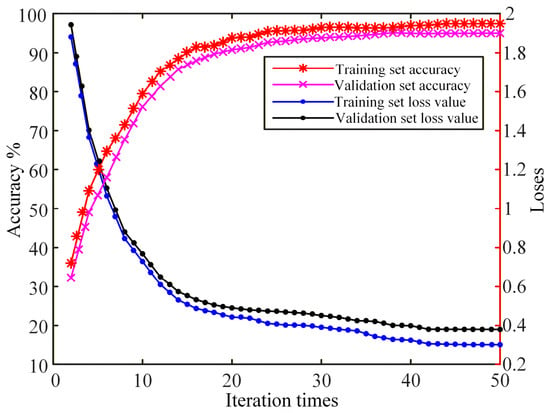
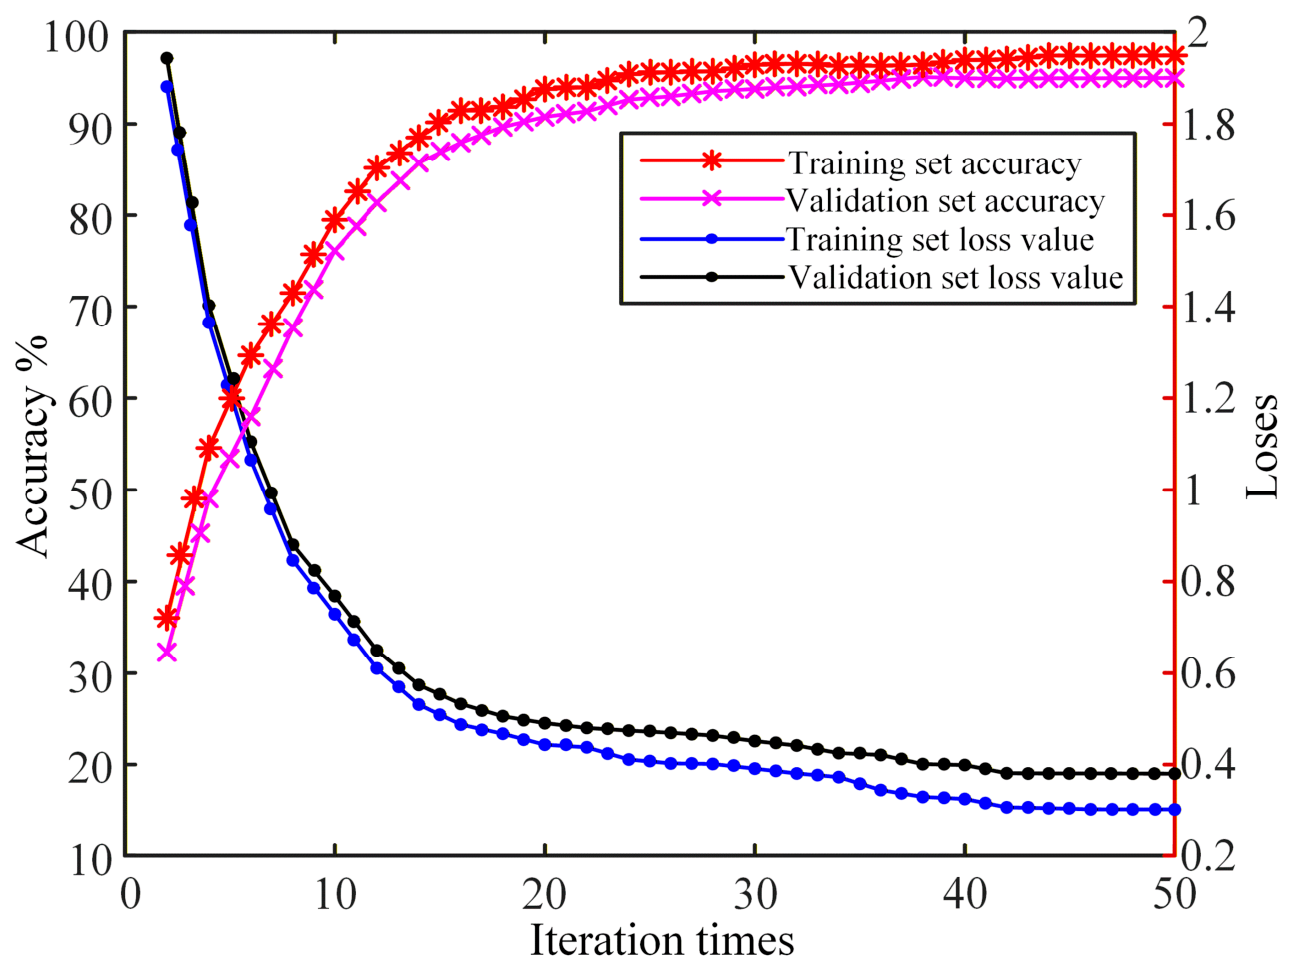
For classification, this study employs the classic ResNet18 network. A GAF image dataset was constructed from the PLAID dataset, comprising ten load types. For each type, 1000 steady-state current segments were converted into images, resulting in 1000 total samples. These images were labeled with one-hot encoding and split into training, validation, and test sets in an 8:1:1 ratio. The training hyperparameters were set as follows: 50 epochs, a batch size of 64, and a learning rate of 0.001.
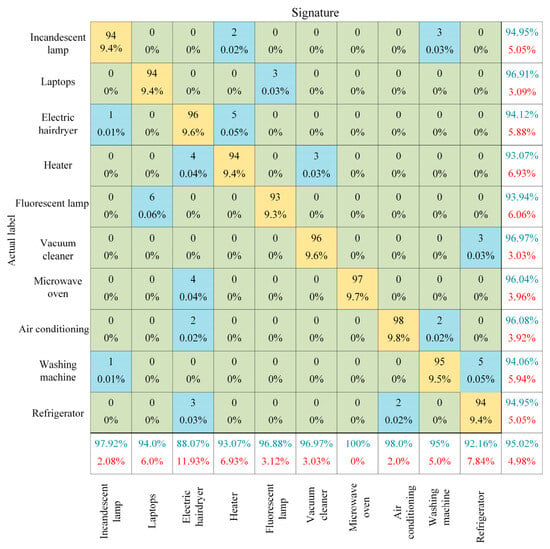
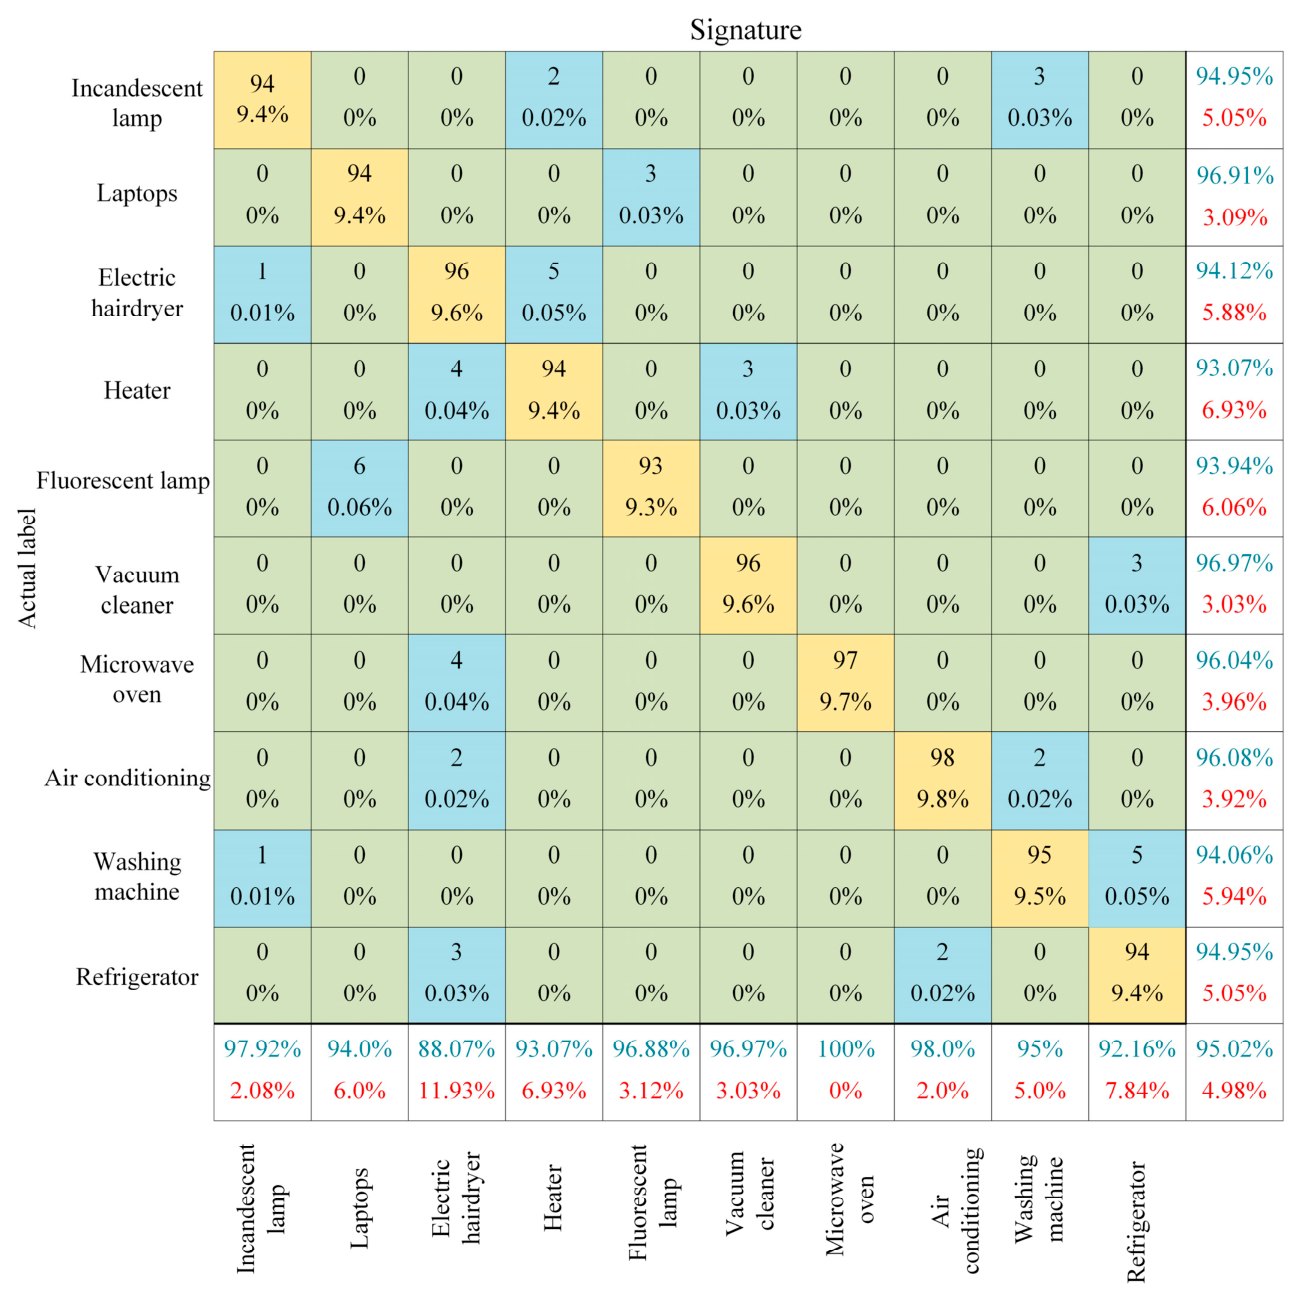
Figure 9 shows the corresponding training loss and accuracy curves. The model achieves a final training accuracy above 96%. The test set contains 1000 samples, with the number of samples per class approximately balanced. The average test set accuracy is 95.02%. The confusion matrix in Figure 10, which presents the results on the test set, reveals that most misclassifications occur between the incandescent lamp and the heater. This is attributed to both being resistive loads with nearly sinusoidal current waveforms, leading to high feature similarity. Despite this, the recognition accuracy for every individual load category exceeds 90%, confirming the overall effectiveness of the proposed method.
Figure 9.
ResNet18 model training process.
Figure 10.
GAF image dataset test results.
To further validate the advantage of GAF encoding, we compared a 1D-CNN trained on raw current waveforms with our GAF + ResNet18. As shown in Table 3, under identical training conditions of 50 epochs, a batch size of 64, and a learning rate of 0.001, the 1D-CNN achieved 89.6% accuracy, whereas GAF + ResNet18 reached 93.2%, representing a relative improvement of 3.6 percentage points. This confirms that the preserved spatial correlation in GAF effectively compensates for the loss of amplitude information.
Table 3.
Ablation study: 1D-CNN (raw waveform) vs. GAF + ResNet18.
5. Analysis of Model Recognition Results
In order to systematically verify the effectiveness and generalization ability of the proposed method, this study designed four experimental schemes based on PLAID and laboratory data sets:
Experiment 1: Based on the PLAID dataset, 45 two-load combinations were constructed;
Experiment 2: Based on the laboratory data set, 21 two-load combinations were constructed;
Experiment 3: Based on the PLAID dataset, 20 three-load combinations were constructed;
Experiment 4: Based on the laboratory data set, 35 three-load combinations were constructed.
5.1. Validation of Load Number Estimation Results
The load-number estimation method from Section 2 was applied to four experimental groups of combined load power signals. For each group, the Sparrow Search Algorithm (SSA) was first used to determine the optimal VMD parameters: the decomposition mode number K and the penalty factor α. The corresponding mixed signal was then decomposed using VMD with these optimized parameters. Subsequently, the resulting Intrinsic Mode Functions (IMFs) were screened to remove spurious components. Specifically, those with a Pearson correlation coefficient below 10% relative to the original signal were discarded based on established engineering practice. Finally, principal component analysis (PCA) was performed on the retained, validated IMFs to estimate the number of underlying loads.
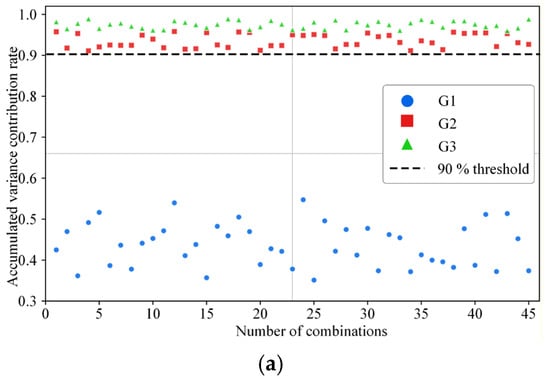
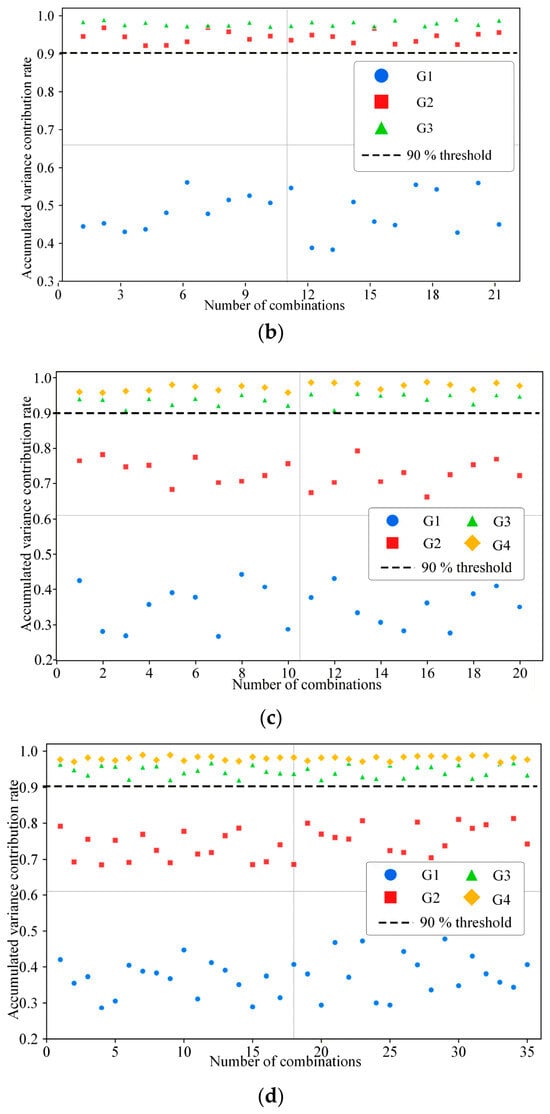
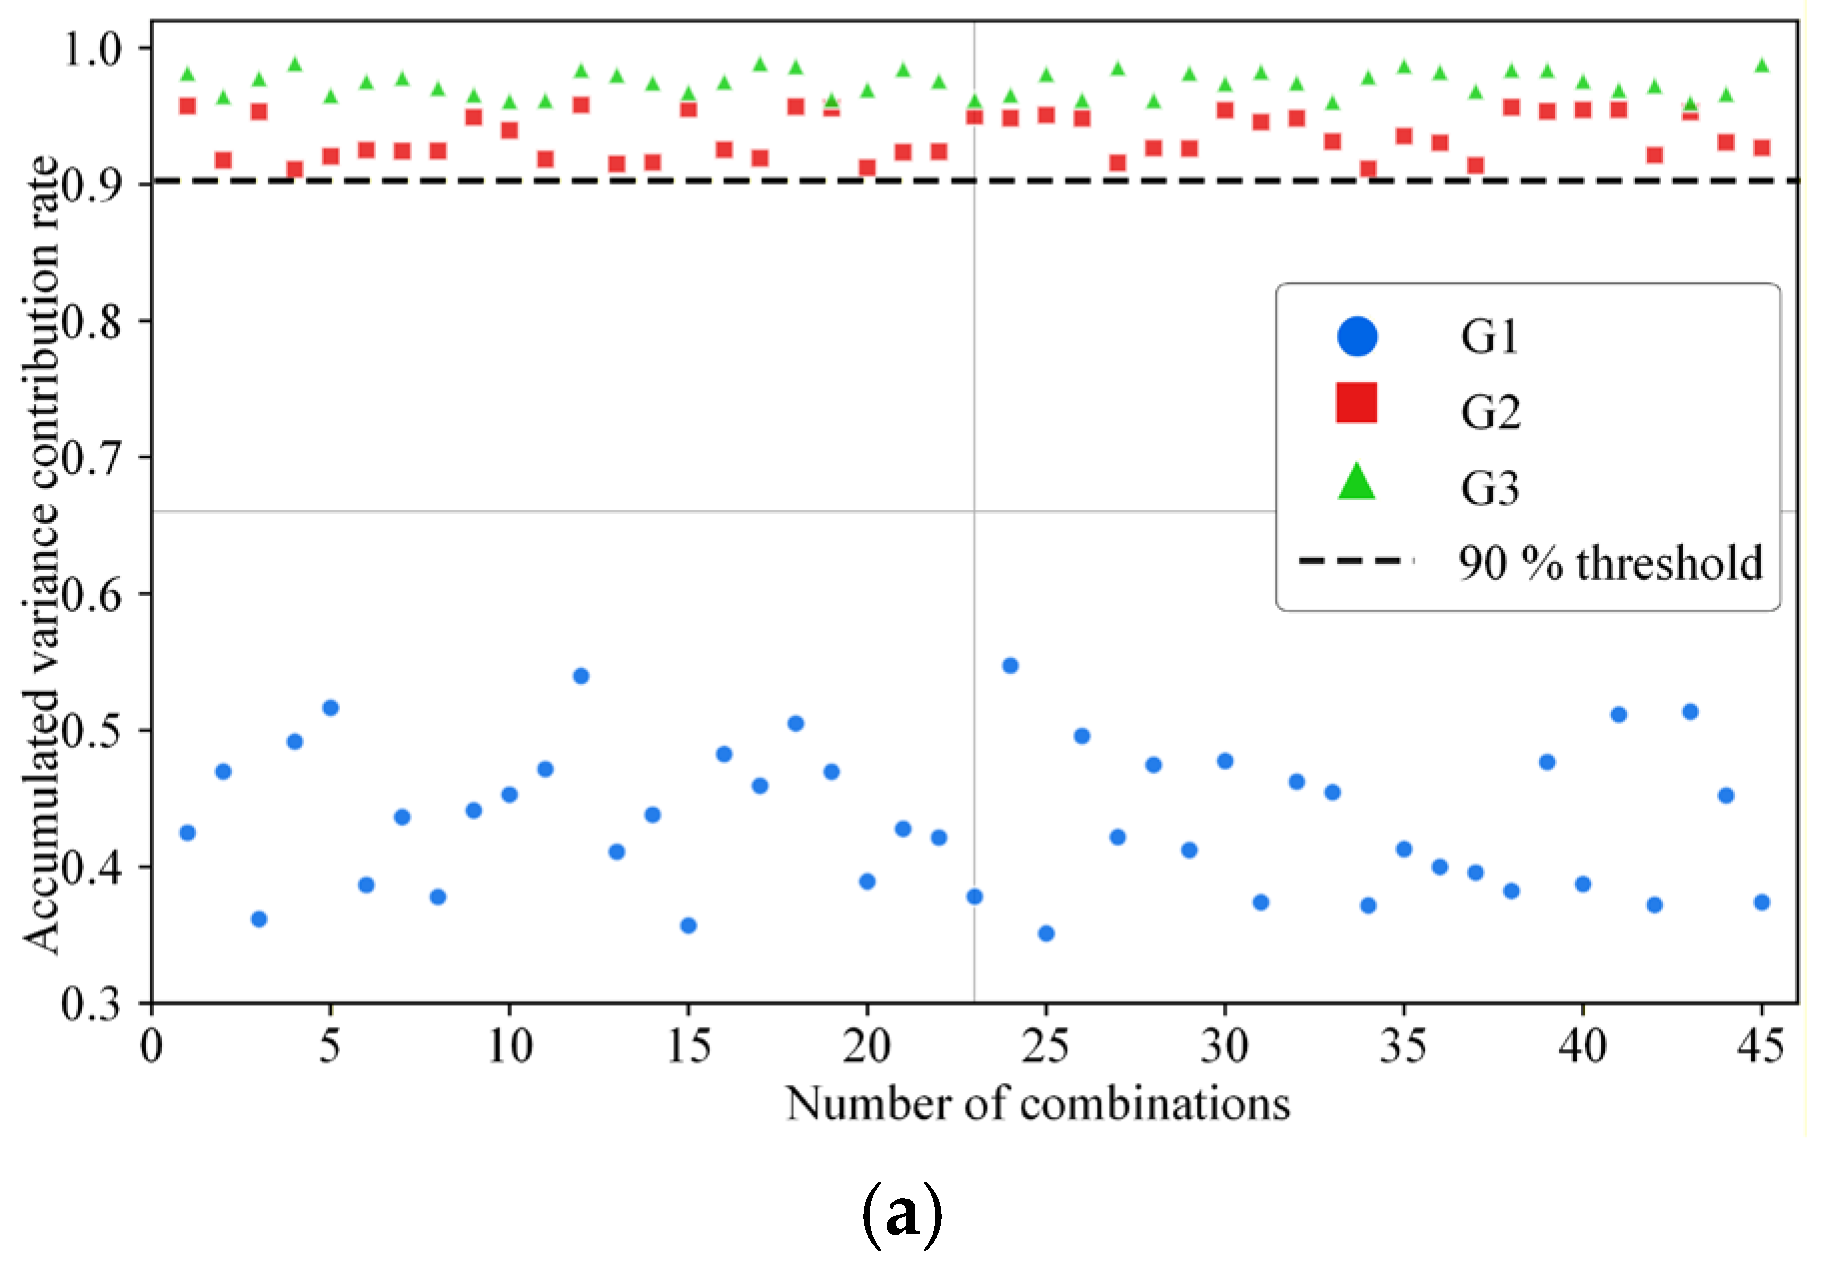
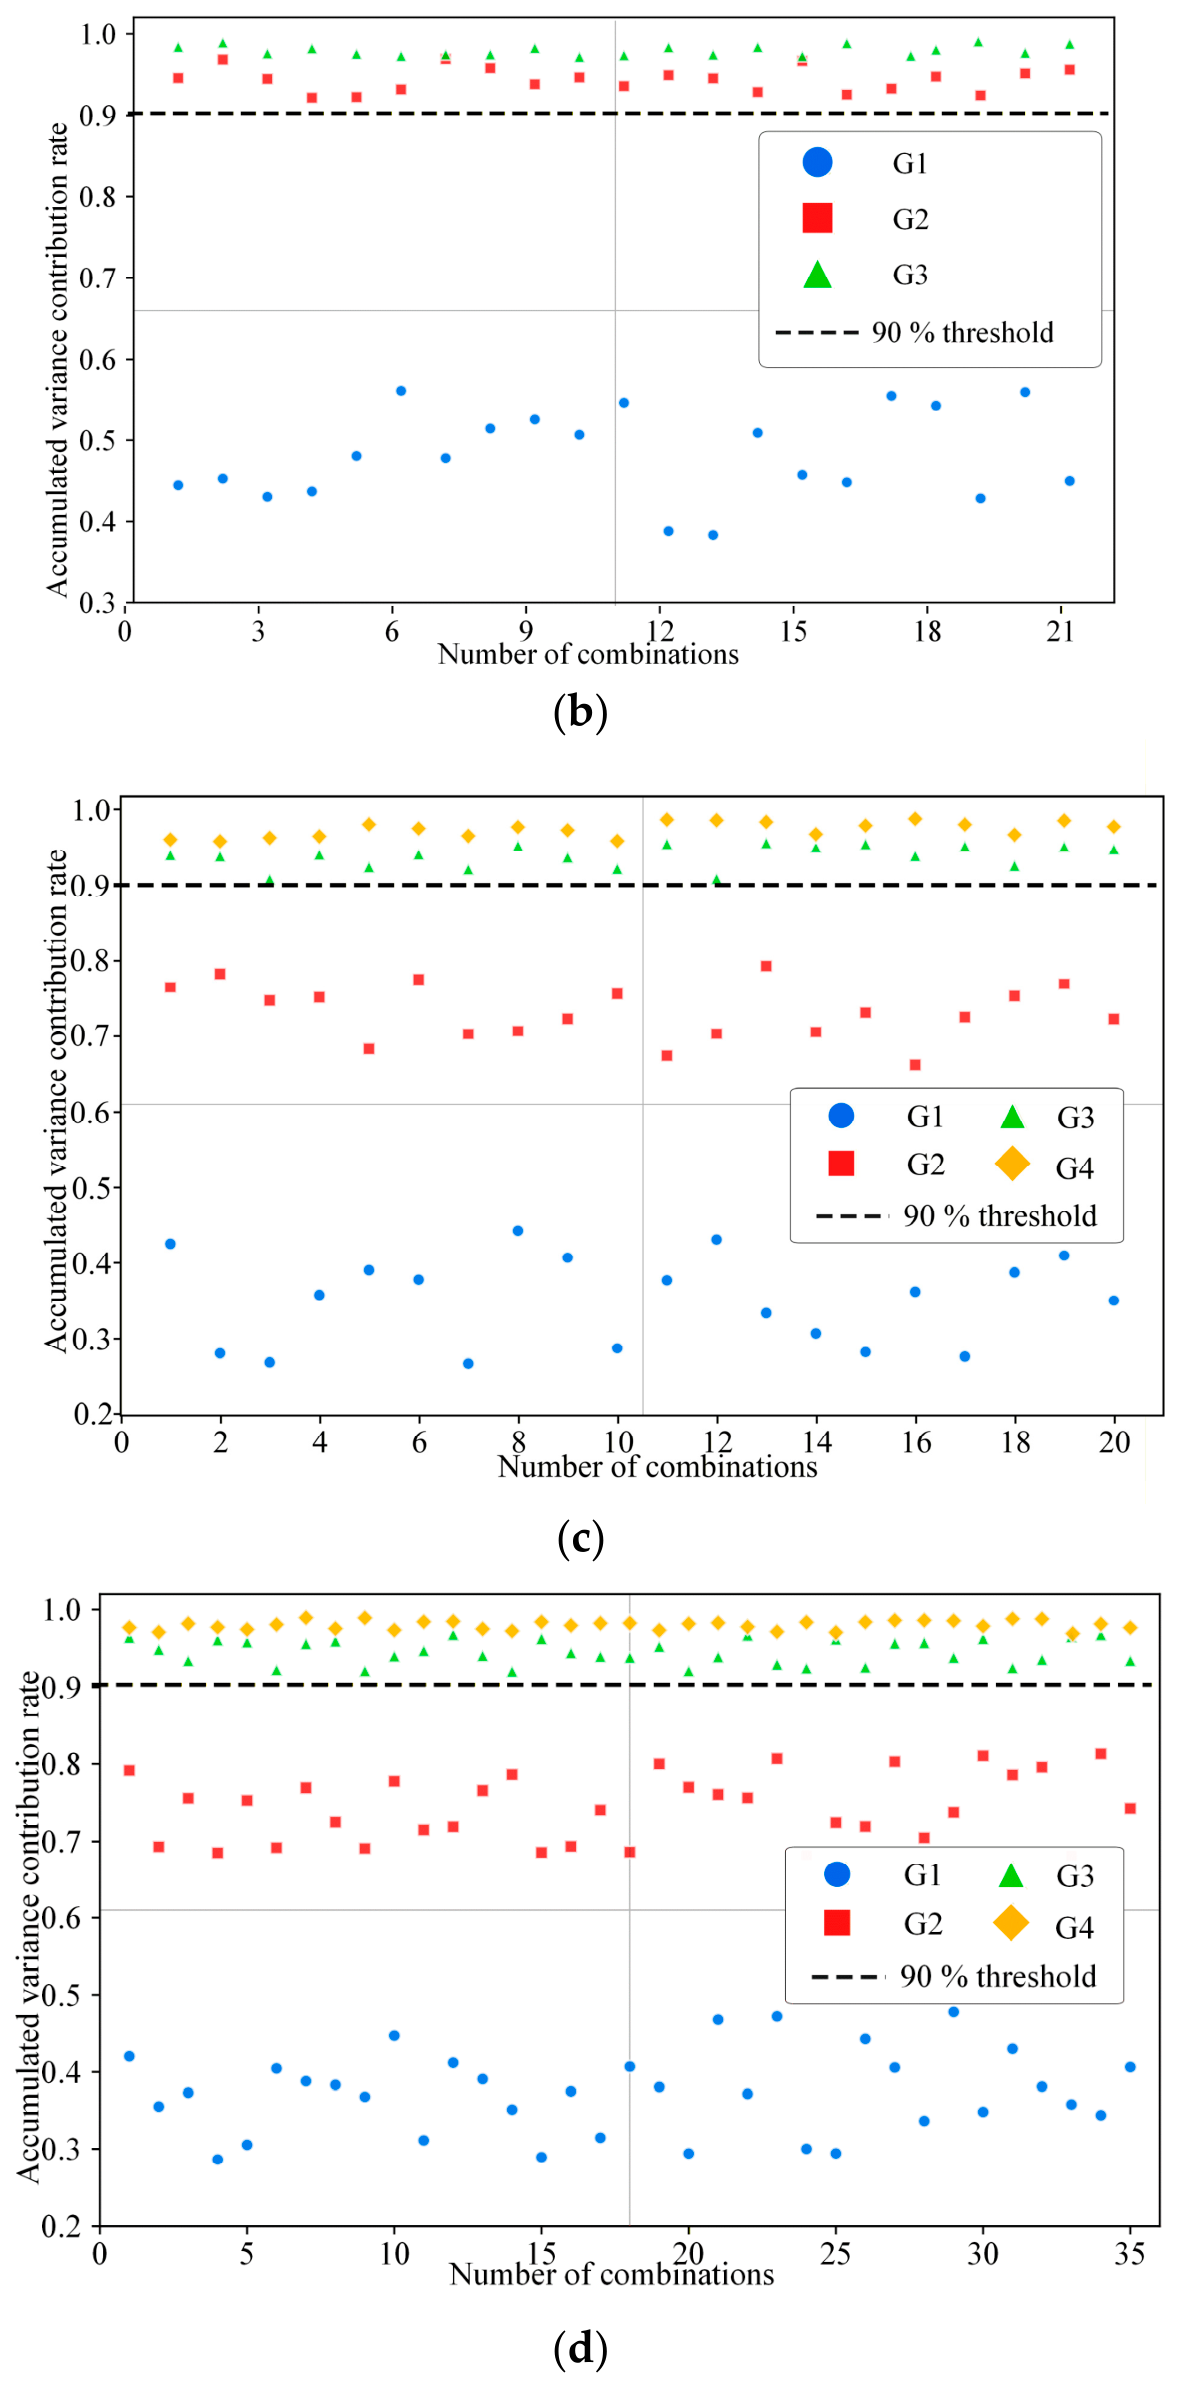
The experimental results demonstrate 100% accuracy in load-number estimation across all four experimental groups. Figure 11 shows the corresponding cumulative variance contribution rates. For each experiment, the curve exhibits a distinct inflection point. Once the number of principal components reaches the actual number of loads, the cumulative variance contribution rate consistently surpasses the 90% threshold. This result confirms that the proposed adaptive estimation method effectively eliminates the need for prior knowledge, providing a reliable foundation for the subsequent separation and identification stages and verifying the robustness of this initial step.
Figure 11.
Load number estimation results for the four experimental sets. (a) Experiment 1:45 two-load combinations based on PLAID data set; (b) Experiment 2:21 kinds of workload combinations based on laboratory data sets; (c) Experiment 3:20 three-load combinations based on PLAID data set; (d) Experiment 4:35 three-load combinations based on laboratory data sets.
5.2. Analysis of the Current Separation Effect
- (1)
- Analysis of two-load combination results.
Based on the accurate estimation of the number of loads, a CNN-LSTM-Attention model was constructed for current separation. The model’s performance was quantitatively evaluated using the mean absolute error (MAE) and the coefficient of determination (R2).
The data analysis shows that the R2 values for all loads are greater than 0.92 across the 45 combinations of the PLAID data set. Among them, the separation accuracy of the laptop, fluorescent lamp, and microwave oven is the highest, and R2 is greater than 0.97. Among the 21 combinations of the laboratory data set, the R2 mean across the seven load types exceeds 0.94, and Table 4 lists the specific performance indicators for each load type.
Table 4.
MAE and R2 scores of load current in Experiments 1 and 2.
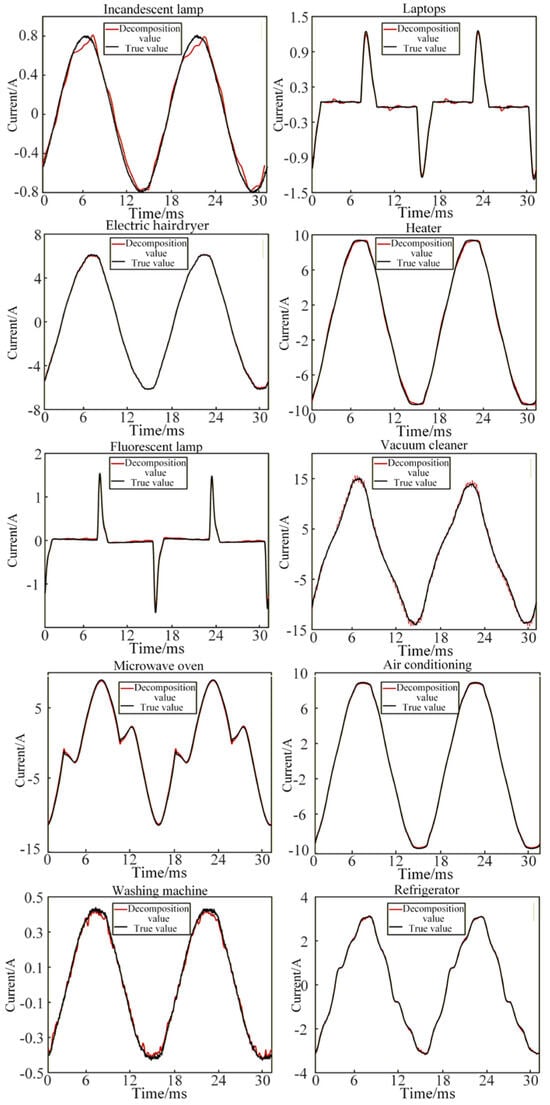
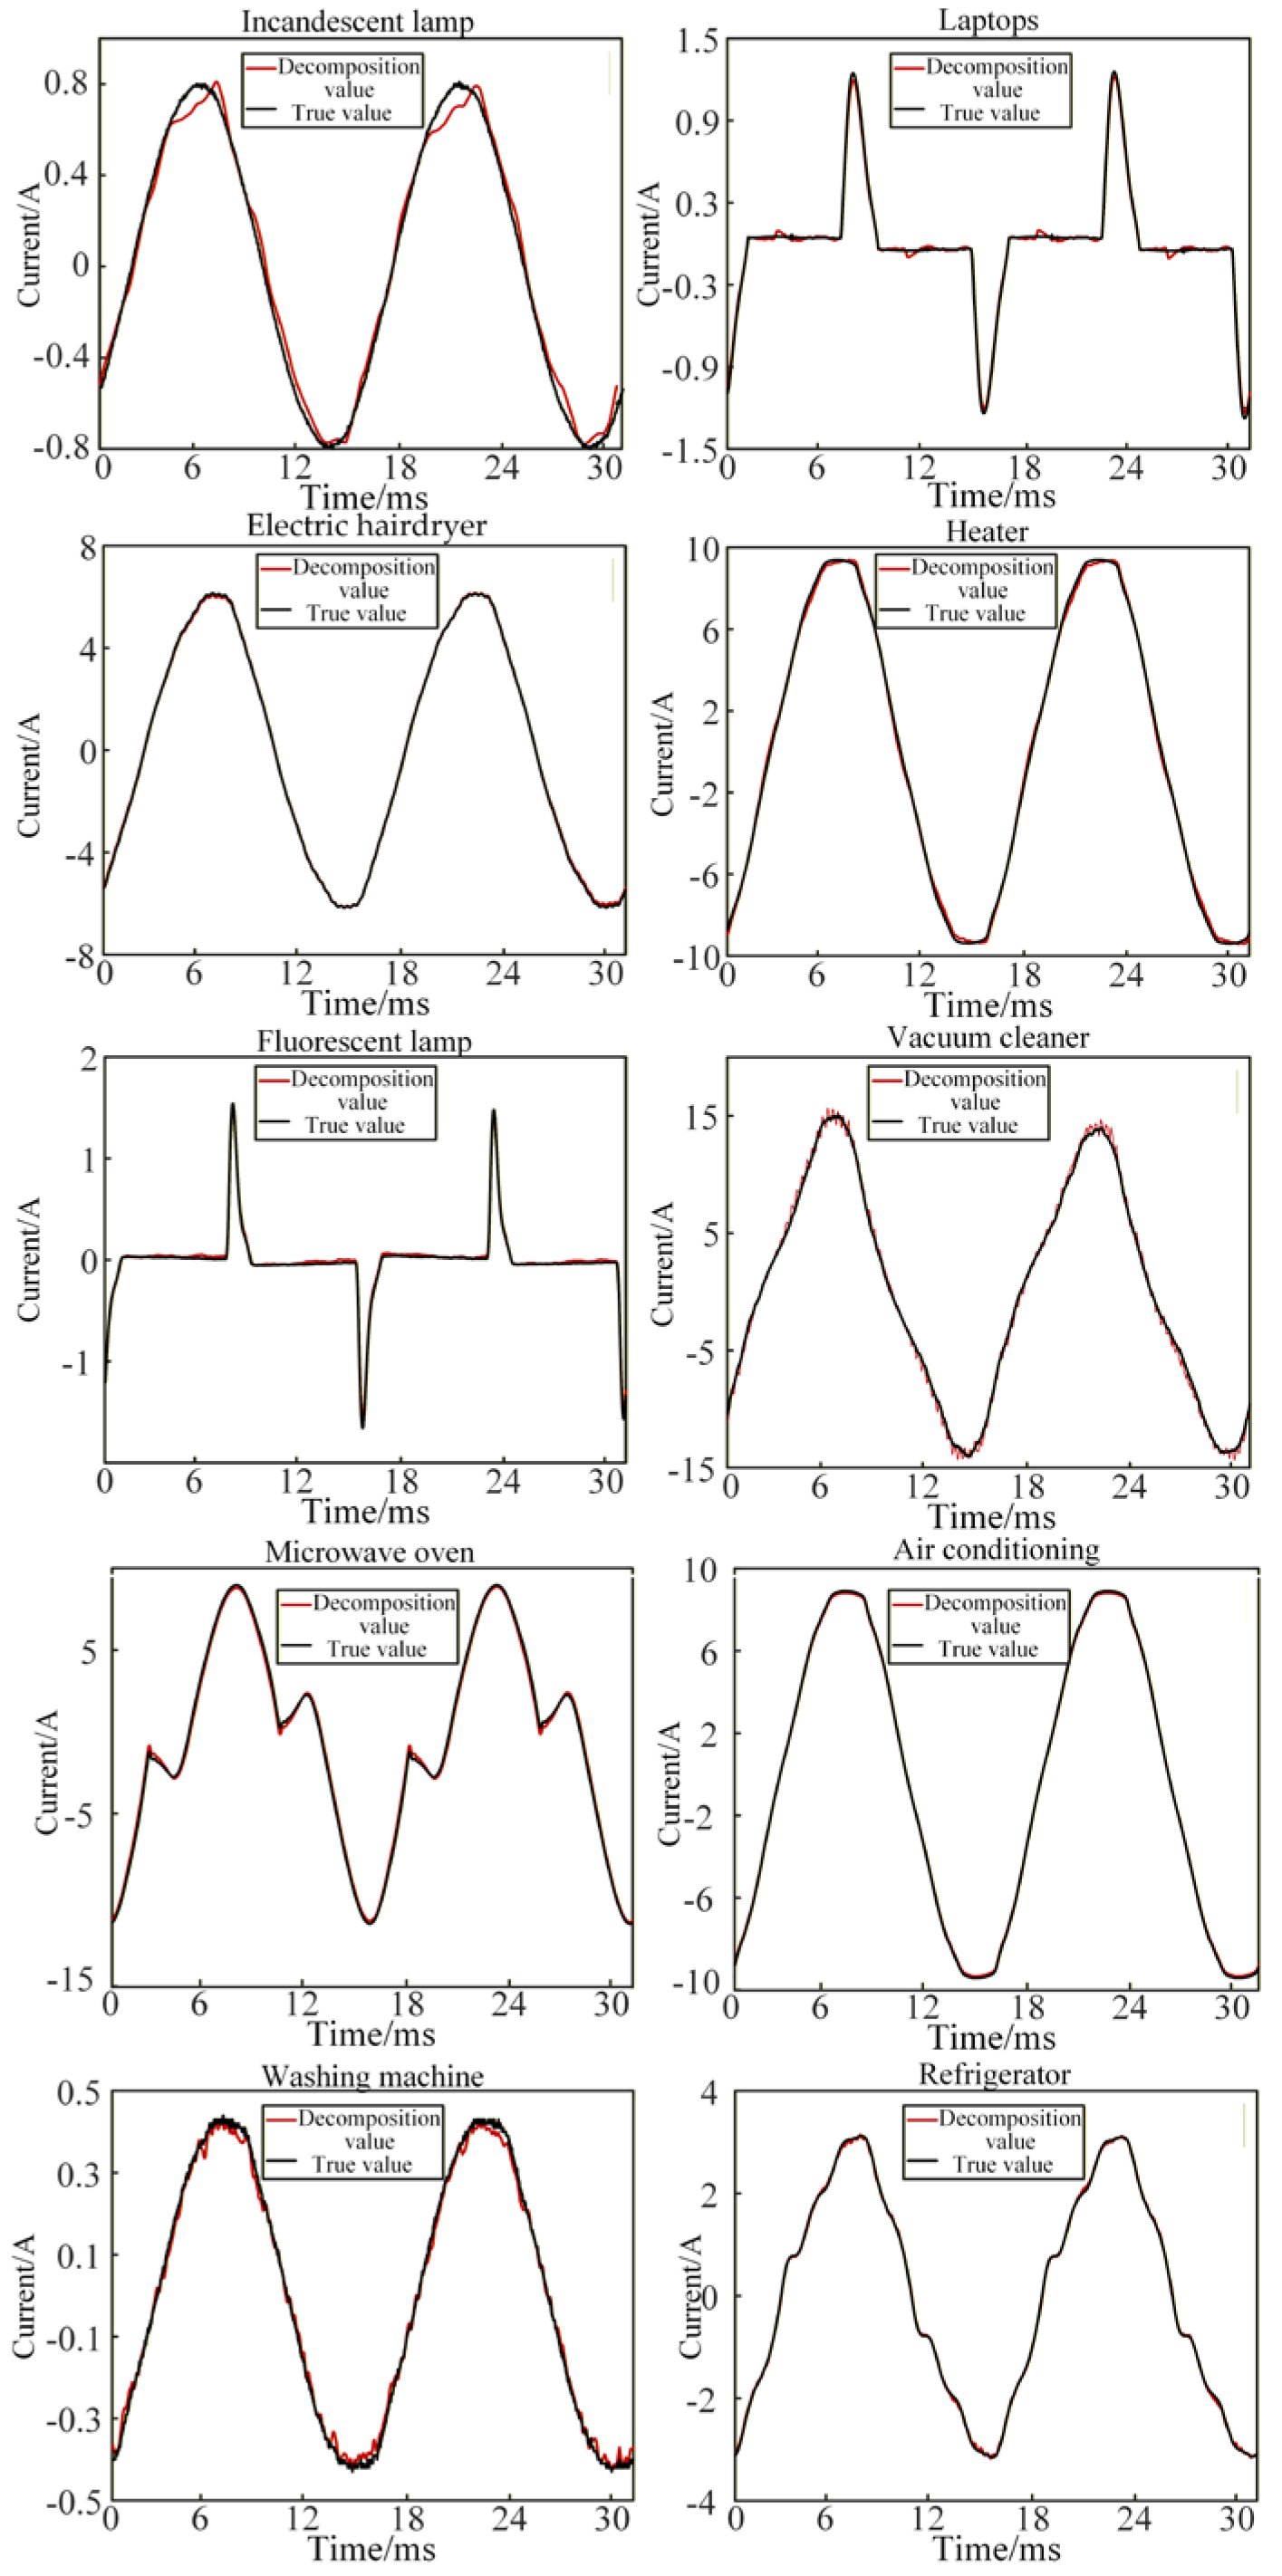
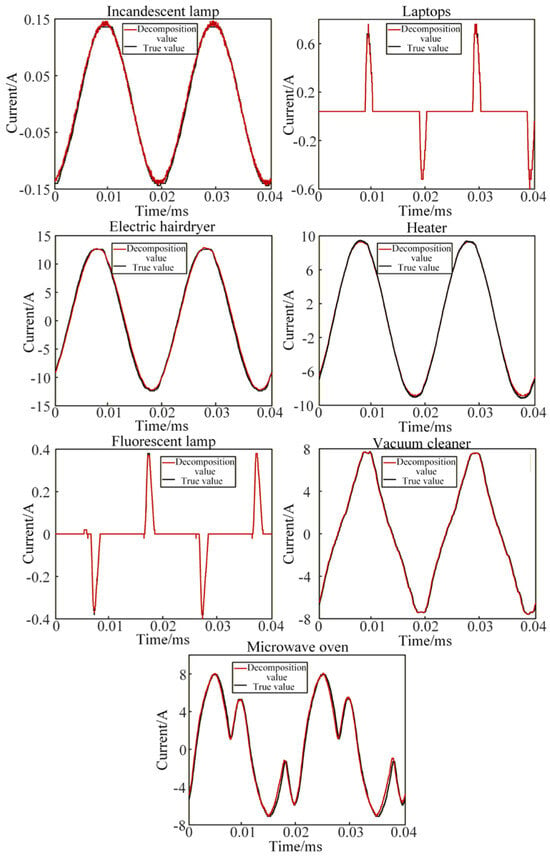
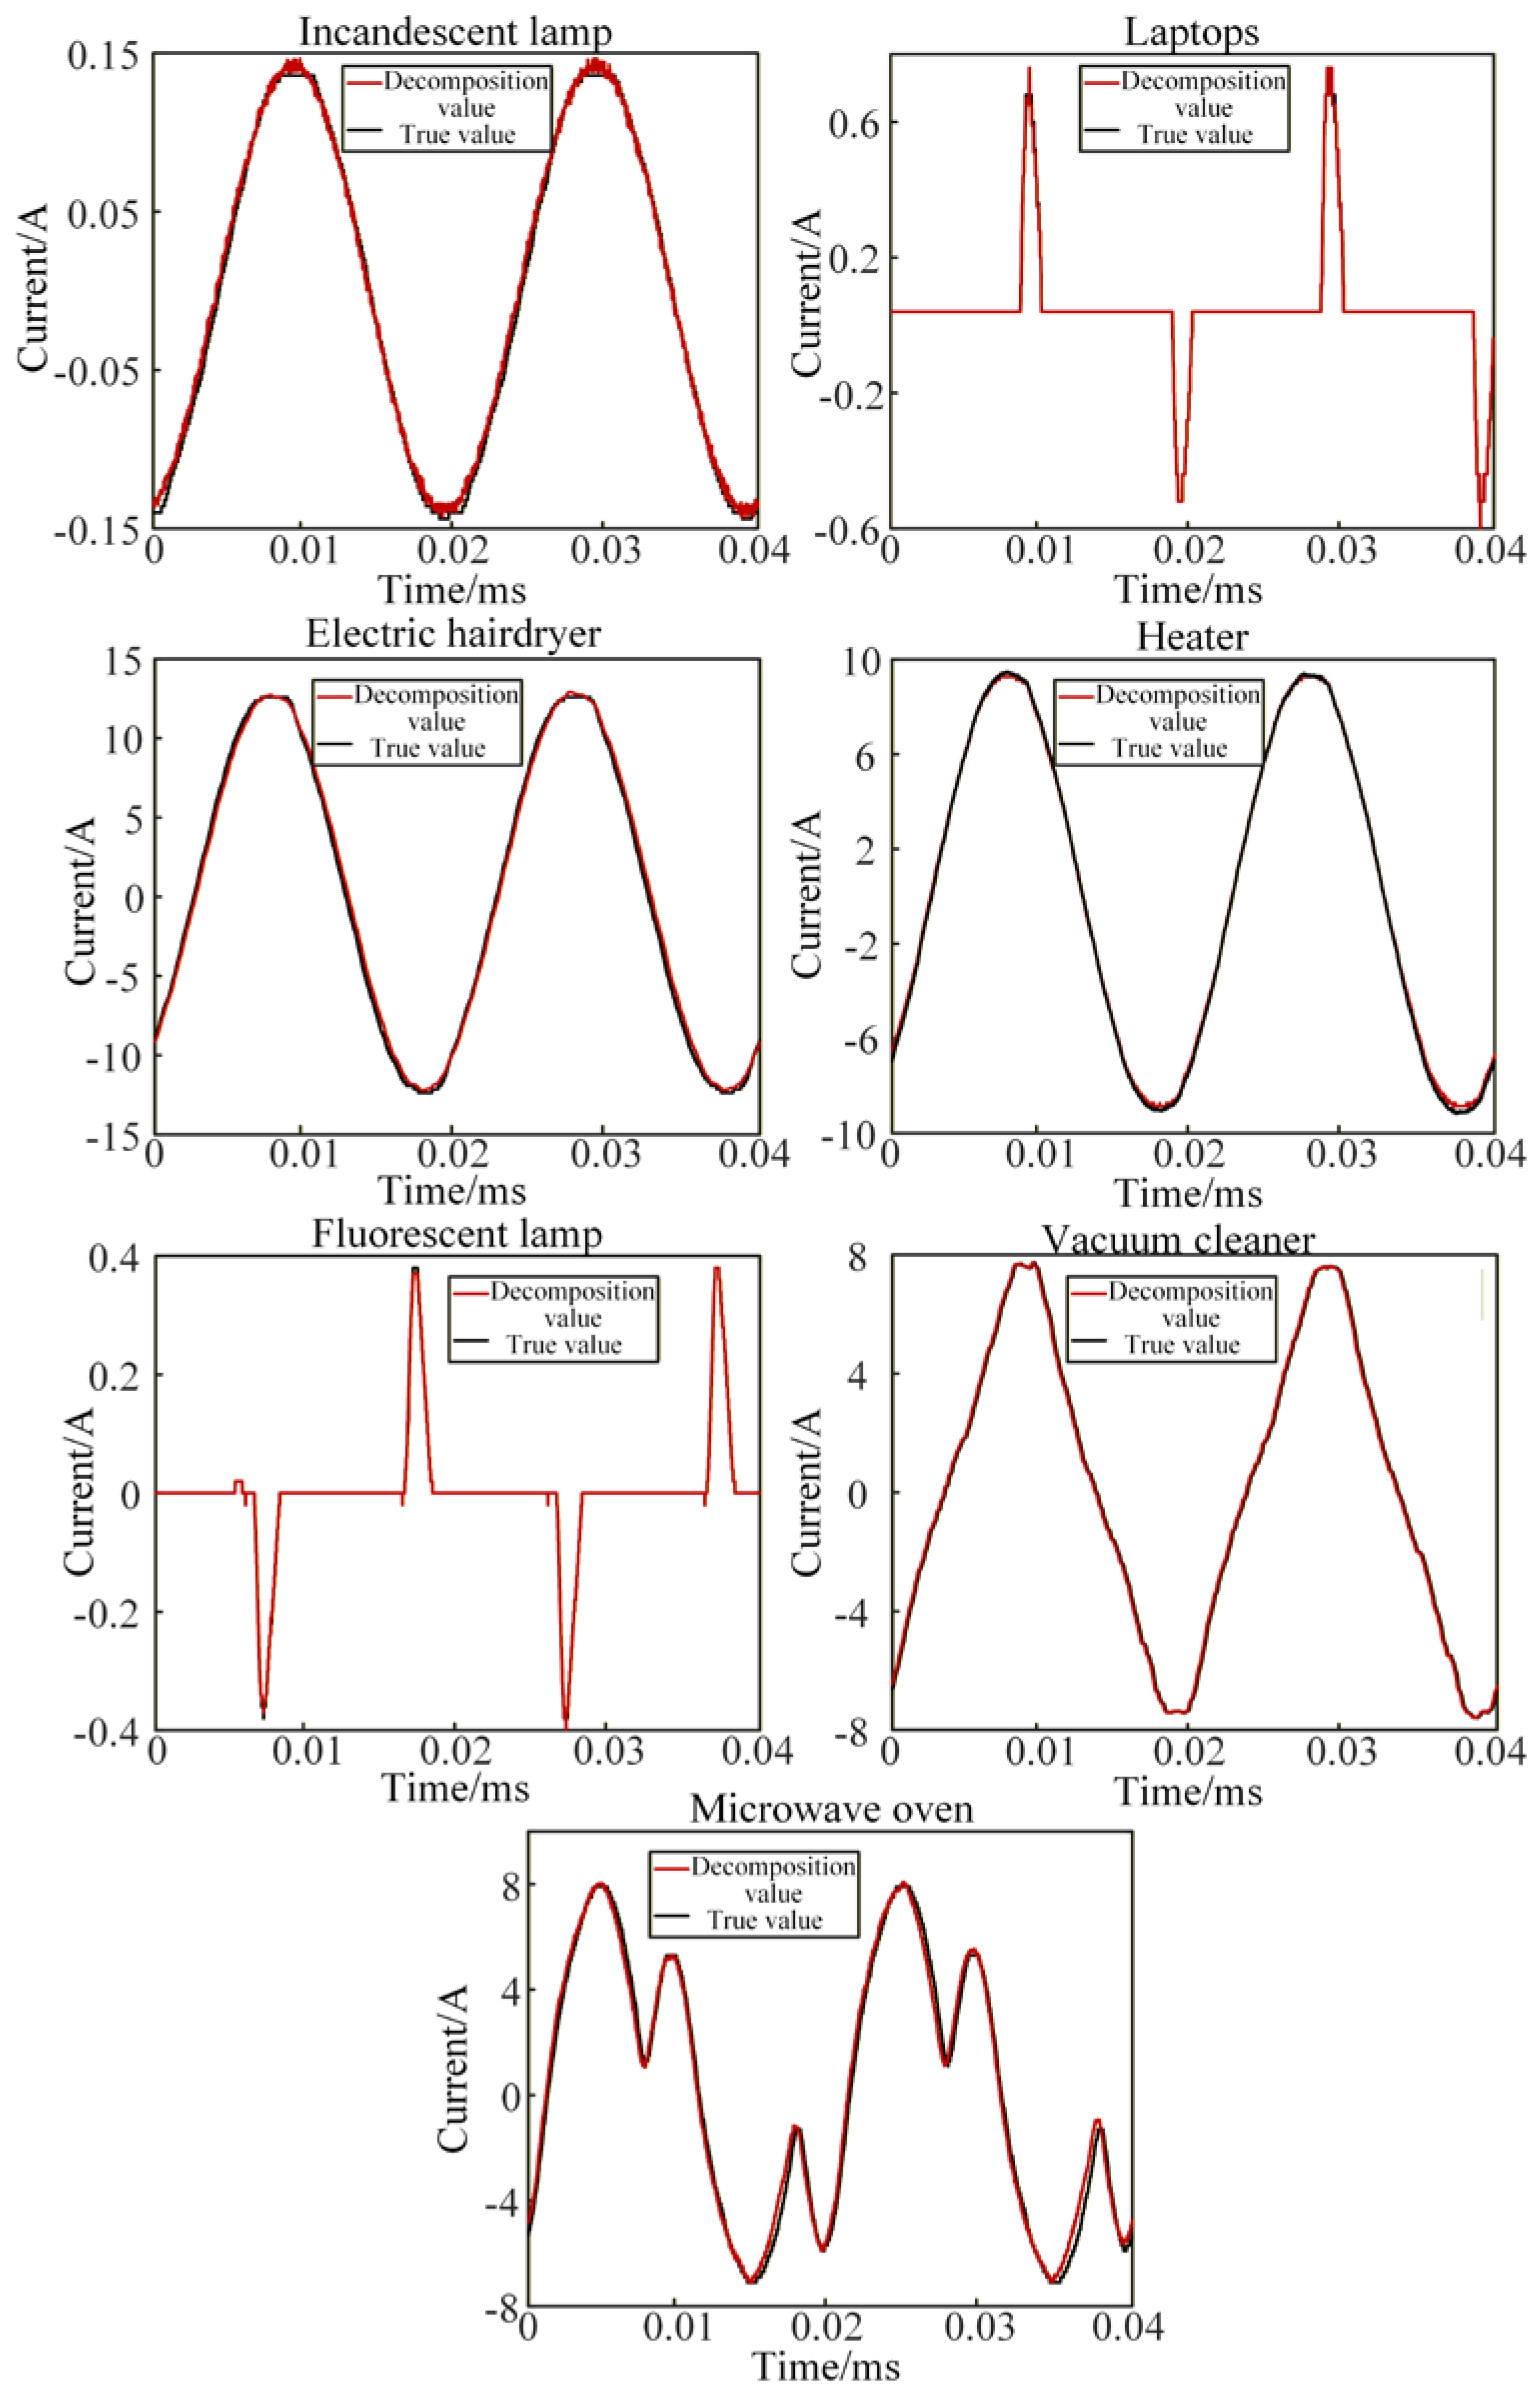
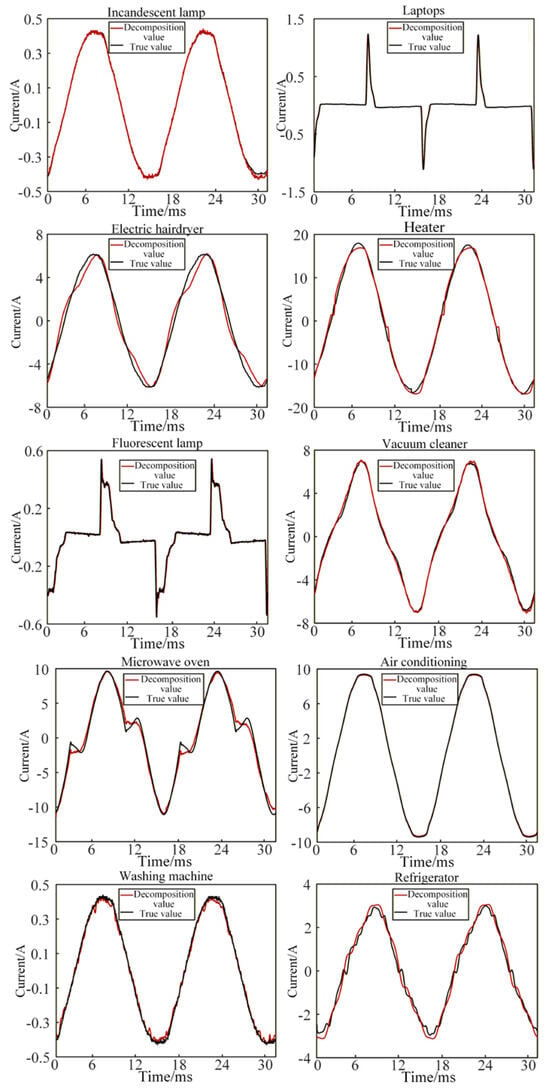
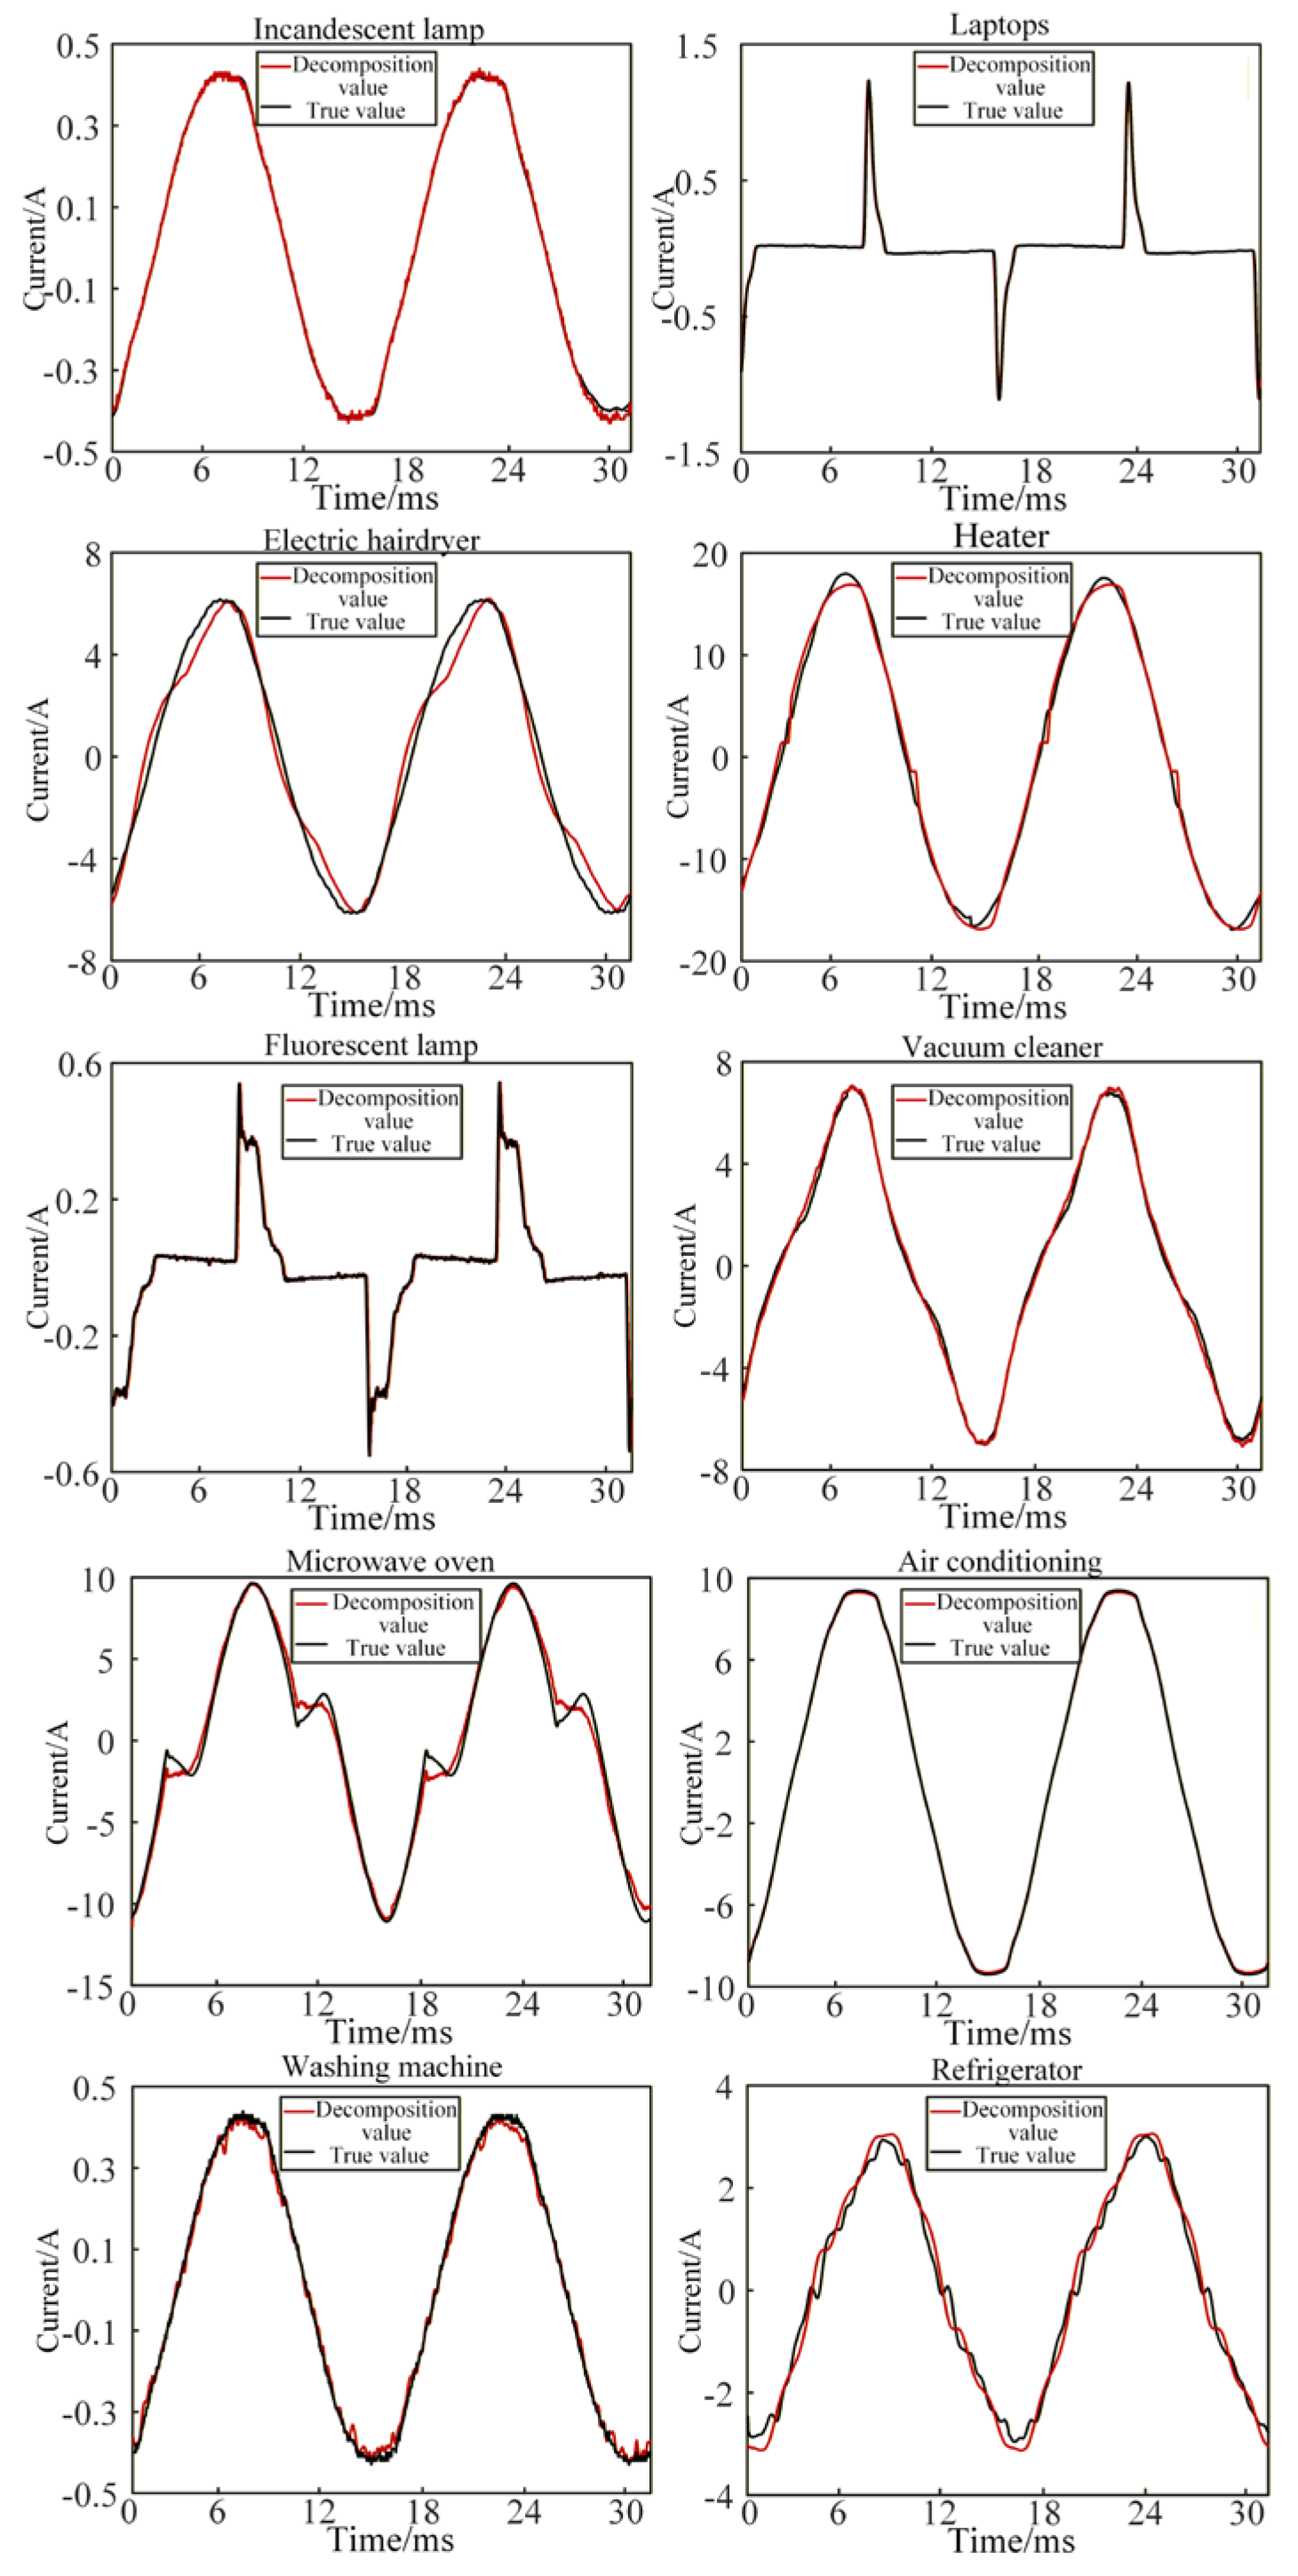
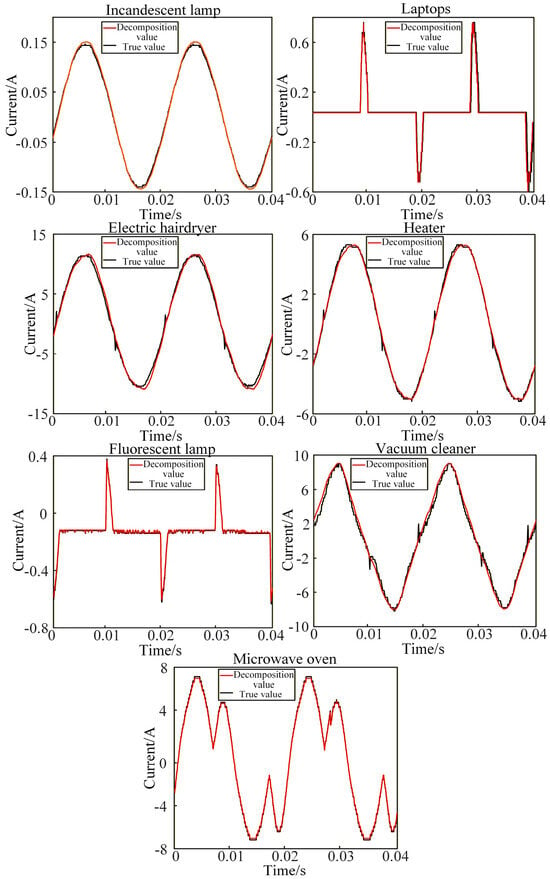
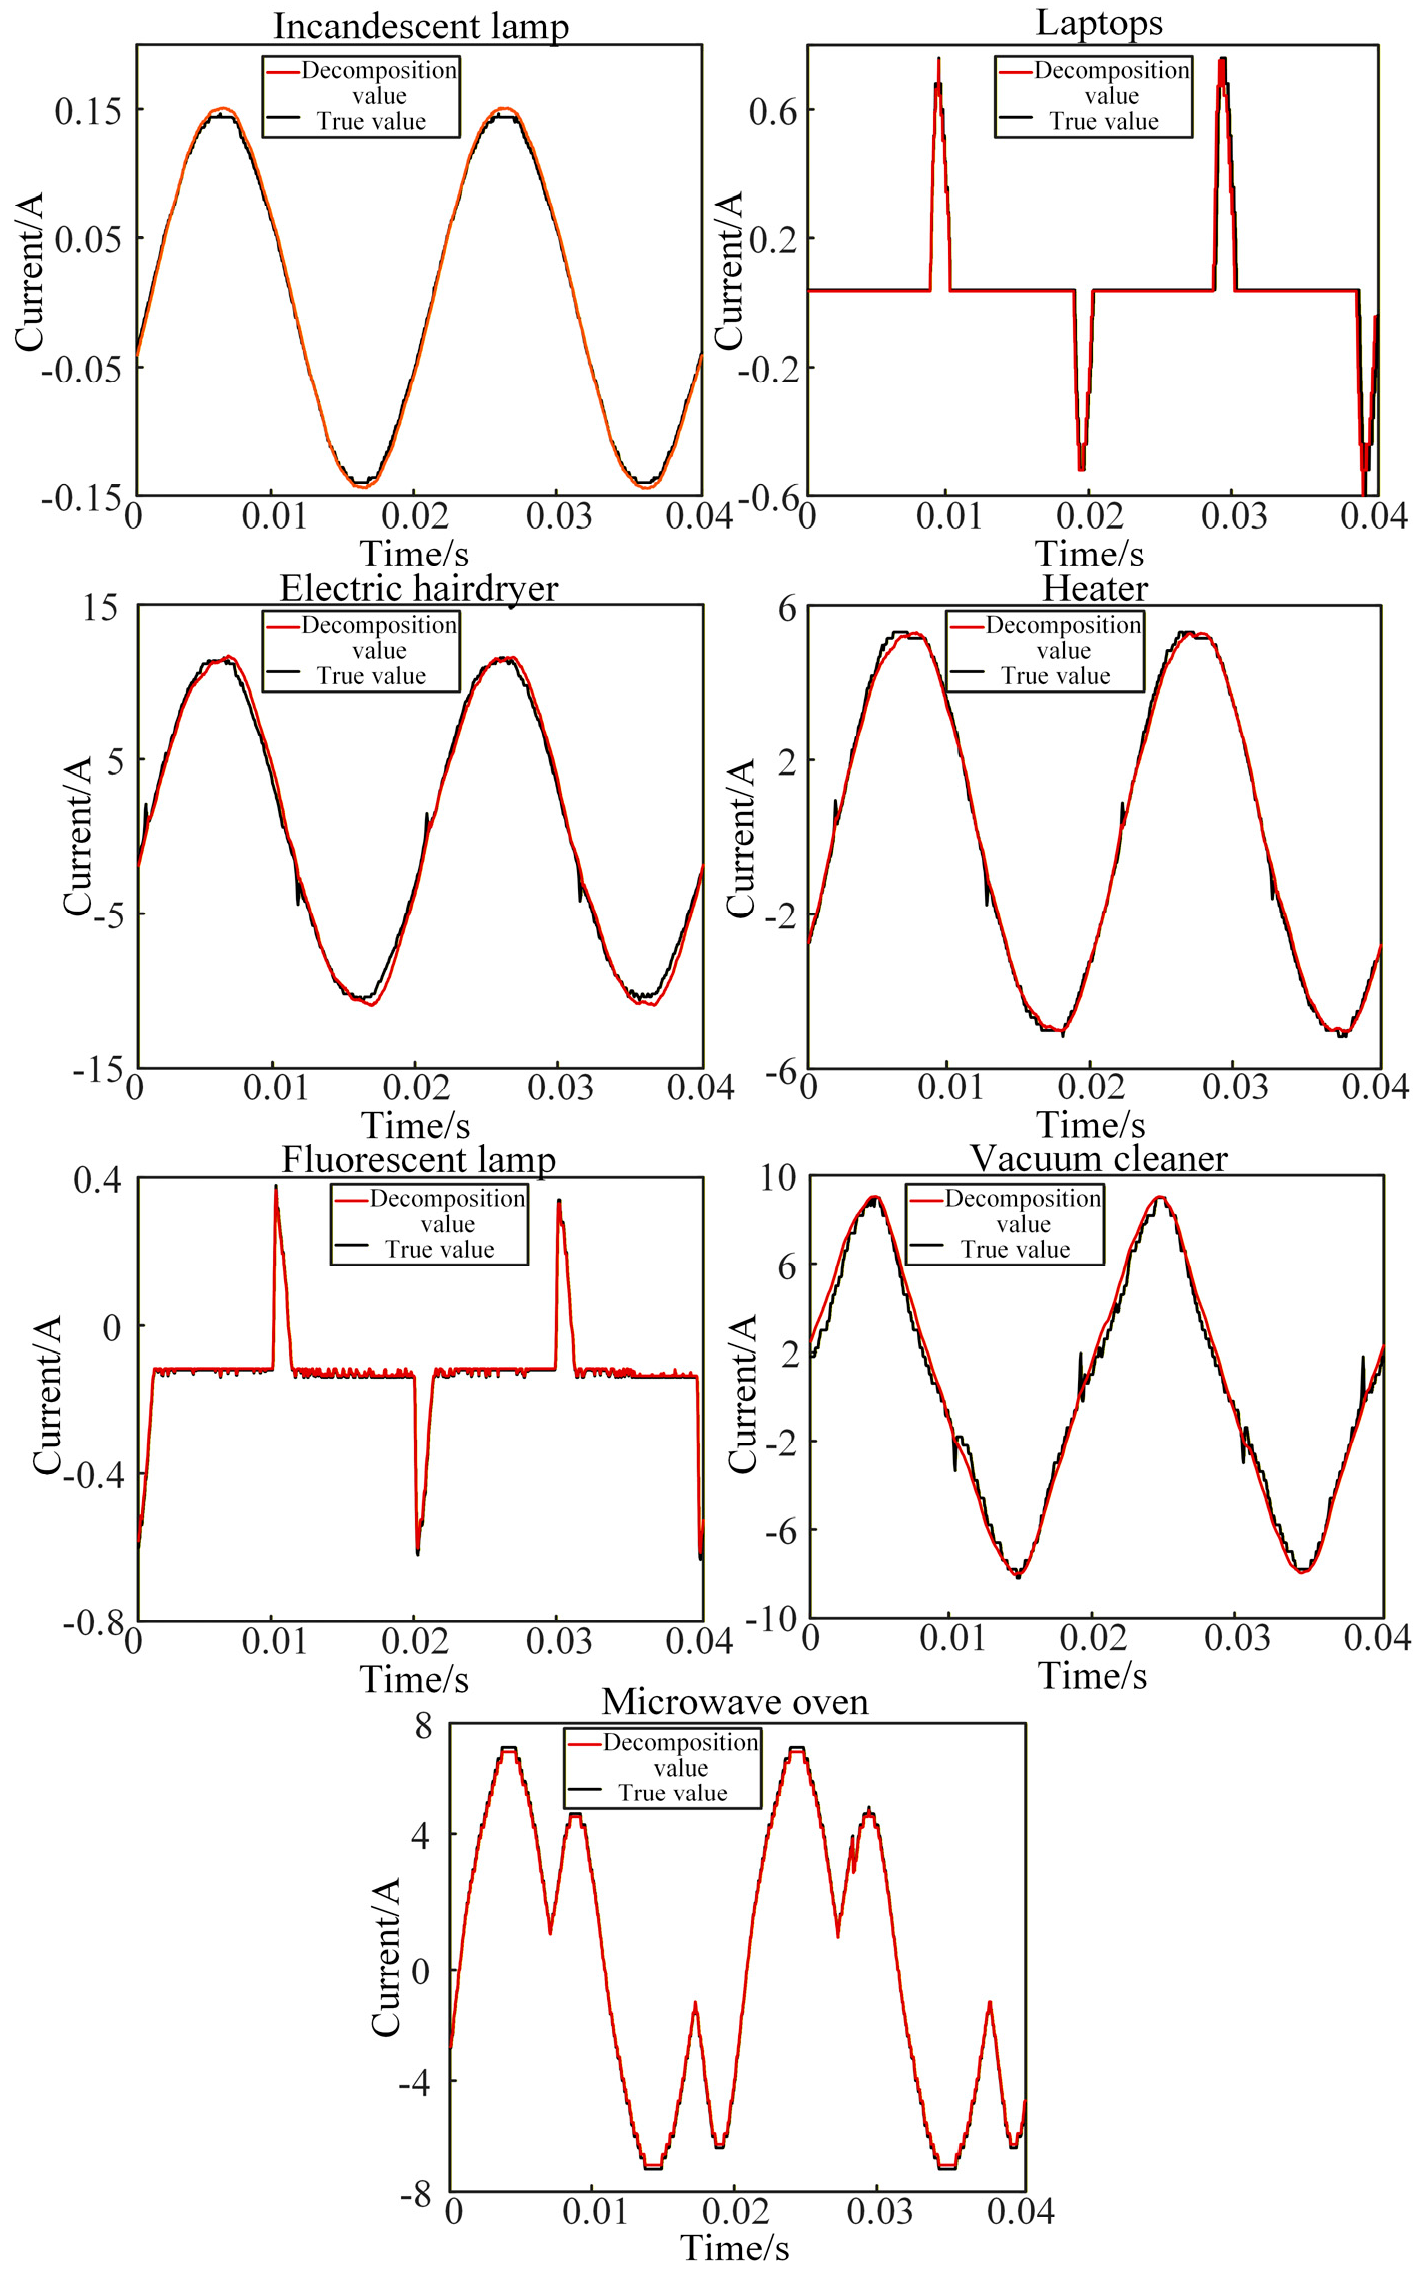
Figure 12 and Figure 13 show the waveform comparisons between the separated current and the real current. The analysis results show that the time-series current obtained by decomposition is highly consistent with the actual value, and only slight fluctuations occur in a few places where the phase changes violently. The error can be further reduced by subsequent filtering.
Figure 12.
The comparison between the real value and decomposition value of load currents in Experiment 1.
Figure 13.
The comparison between the real value and the decomposition value of the load current in Experiment 2.
To evaluate the method’s performance in more complex scenarios, the separation effect of the three-load combination is further analyzed. Compared with the two-load scenario, the signal aliasing in the three-load combination is significantly greater, placing greater demands on the separation model.
- (2)
- Analysis of three-load combination results.
As the number of loads increases, the degree of signal aliasing increases, and the difficulty of separation and identification increases. Table 5 shows the separation performance in the three-load combination scenario.
Table 5.
MAE and R2 scores of load current in Experiments 3 and 4.
For the three-load experiments (Groups 3 and 4), the current separation achieved R2 values above 0.90 and 0.91, respectively, for all constituent loads. While this performance is slightly lower than in the two-load scenario, it still surpasses that of traditional methods, confirming the framework’s promising scalability in handling more complex cases.
Figure 14 and Figure 15 compare the separated and actual current waveforms. These comparisons show that the reconstruction error increases slightly near the zero-crossing points for resistive loads with highly similar waveforms, such as incandescent lamps and hair dryers. Nevertheless, the overall waveform reconstruction remains highly accurate.
Figure 14.
The comparison between the real value and the decomposition value of the load currents in Experiment 3.
Figure 15.
The comparison between the real value and the decomposition value of the load current in Experiment 4.
5.3. Load Identification Performance Evaluation
Following the current separation, the isolated single-load currents require accurate identification. This section validates the end-to-end performance of the complete framework by inputting the separation results into the pre-trained GAF-ResNet18 recognition model. The separated currents from Experiments 1 and 2 were used to construct and label GAF image datasets according to the method in Section 4.3, which the model then classified.
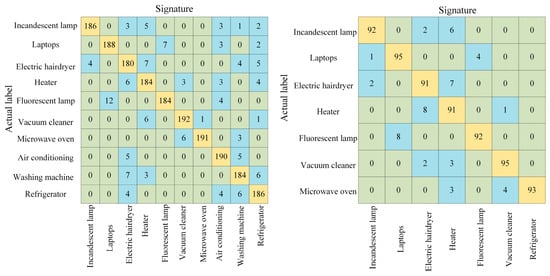
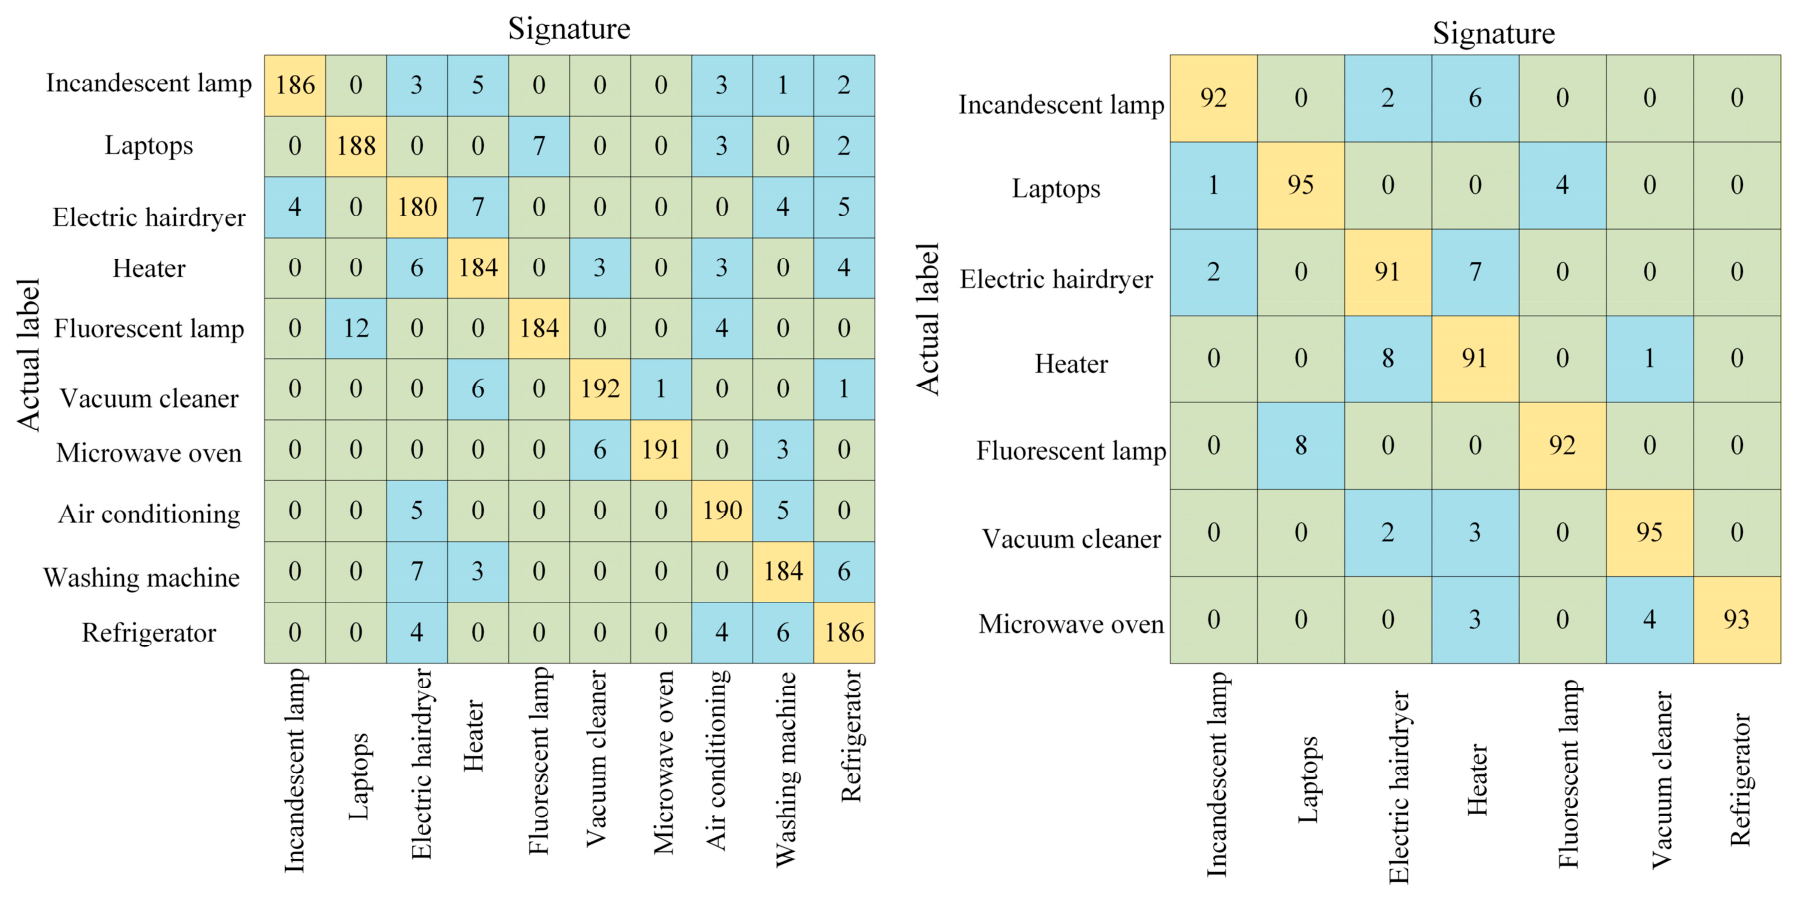
The experimental results confirm the method’s effectiveness for dual-load parallel scenarios: recognition accuracies of 93.25% (Experiment 1) and 92.71% (Experiment 2) were achieved. Figure 16 shows the specific confusion matrix. The primary misclassification occurs between the incandescent lamp and the heater. This is fundamentally because both are purely resistive loads, characterized by nearly sinusoidal current waveforms and exceptionally low harmonic content. In such cases, the original signals are nearly identical in both time and frequency domains. As a two-dimensional re-expression of the original waveform, GAF transformation can extract only very limited discriminative features, resulting in highly similar encoded image textures that the network struggles to distinguish effectively. To overcome this, future work will incorporate additional physical quantities, such as power information and startup inrush current, as supplementary discriminative cues to compensate for the insufficiency of relying solely on steady-state current waveforms. Despite this, the recognition accuracy for every individual load category exceeds 90%, confirming the overall effectiveness of the proposed method.
Figure 16.
Confusion matrix after load decomposition of different data sets.
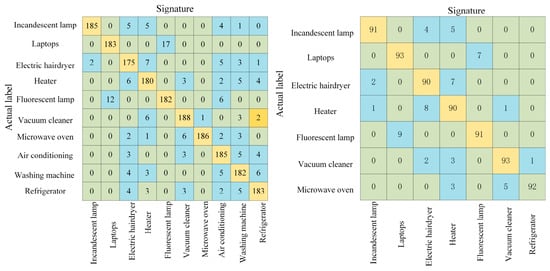
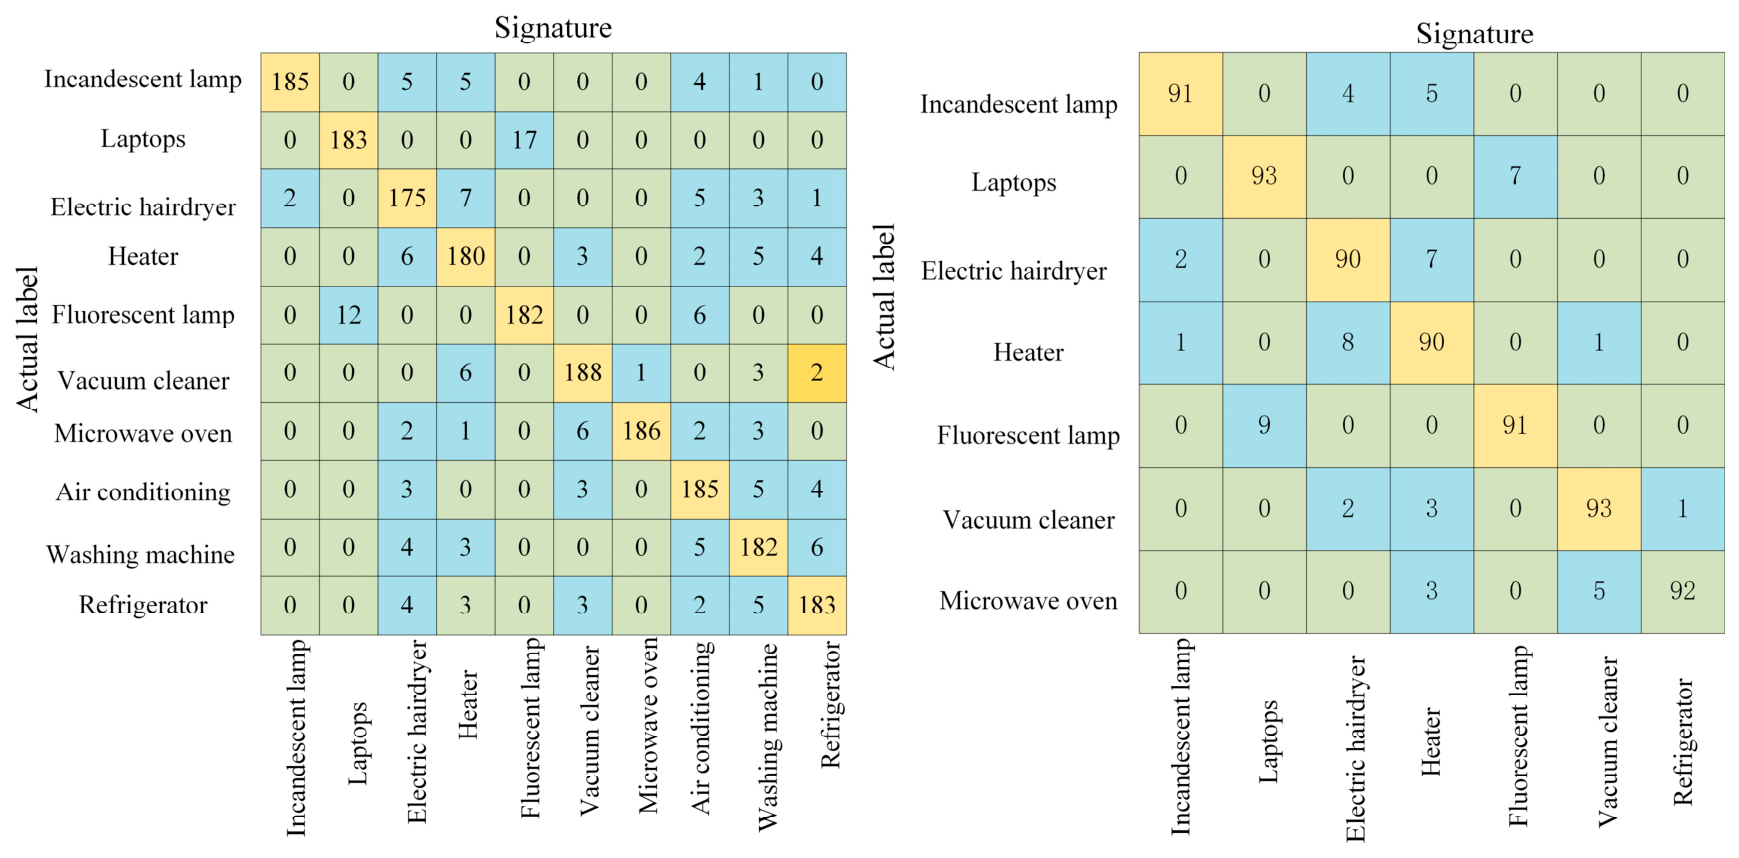
For the three-load scenarios (Experiments 3 and 4), GAF image datasets were constructed from the separated currents and fed into the trained model. The core results show recognition accuracies of 91.45% and 91.43%, respectively. The corresponding confusion matrix is presented in Figure 17.
Figure 17.
Confusion matrix of three combination load decomposition in different datasets.
While the identification accuracy for these three-load combinations is slightly lower than for the two-load case—likely due to minor waveform distortion introduced during the more complex separation process—both results remain well above the 75% threshold typically required for engineering applications.
Analysis of Figure 17 shows that misclassifications are predominantly concentrated in two load pairs: incandescent lamps versus heaters, and laptops versus fluorescent lamps. The former is consistent with earlier observations, as both loads are resistive and exhibit nearly identical current characteristics. The latter stems from the fact that both laptop and fluorescent lamp currents are relatively regular, with low harmonic distortion and comparable frequency-domain profiles, which naturally manifests as similar GAF texture patterns. In such cases, the classifier’s decisions rely on subtle differences in the images, such as variations in overall amplitude and local texture details, rather than salient distinguishing features. Nevertheless, the recognition accuracy for both load types remains above 90%, indicating that the classifier maintains reasonable discriminative capability even when faced with similar textures.
In summary, the experimental results demonstrate the high performance of the proposed framework across all key stages. The method achieved 100% accuracy in load number estimation. For current separation, the R2 coefficients exceeded 0.92 for two-load combinations and remained above 0.90 for three-load combinations. For final load identification, the accuracies reached 93.25% (two-load) and 91.45% (three-load) on the PLAID dataset, and 92.71% (two-load) and 91.43% (three-load) on the laboratory dataset. By contrast, traditional signal processing baselines such as time-domain ICA [32] and frequency-domain harmonic template matching [33] typically achieve an average separation R2 of only 0.70–0.80. Under the same conditions, our method consistently delivers an R2 above 0.90, representing a significant improvement. All results substantially exceed the 75% accuracy threshold generally required for practical applications, confirming the method’s effectiveness and robustness in complex multi-load scenarios. Errors propagate along the chain of “estimation → separation → identification.” The 100% accuracy in load number estimation prevents structural errors from propagating to subsequent stages, and the slight decrease in separation accuracy from two-load to three-load scenarios leads to only about a 2 percentage point loss in identification accuracy, indicating that the cumulative effect of chain-wise error propagation is limited and does not cause a significant degradation of overall performance.
To objectively benchmark this approach, Table 6 compares its performance against traditional methods in multi-load identification. Existing techniques, such as improved KNN [18], voltage-current image reconstruction [19], and Fisher-SVM [20], perform well in specific contexts but exhibit declining accuracy when multiple loads operate in parallel. In contrast, the integrated method proposed in this study consistently achieves identification accuracy above 91% across both PLAID and laboratory datasets. This represents a significant improvement over conventional approaches and demonstrates superior robustness and recognition capability in realistic, parallel-load conditions.
Table 6.
Performance comparison of different non-intrusive load identification methods.
6. Conclusions
To address the challenge of load monitoring in complex power-consumption environments, this study proposes an integrated, non-intrusive load decomposition and identification framework based on steady-state data and deep learning. The principal academic contributions are as follows:
- (1)
- Adaptive Load-Number Estimation: A novel method combining Sparrow Search Algorithm-optimized Variational Mode Decomposition (SSA-VMD) and Principal Component Analysis (PCA) is proposed. By optimizing adaptive parameters and eliminating spurious components, this method achieves accurate load-count estimation without requiring prior knowledge.
- (2)
- Multi-Load Current Separation Model: A current separation model for combined loads is constructed, integrating time-frequency analysis with a CNN-LSTM-Attention network. By jointly capturing spatial-temporal features and employing an attention mechanism, the model effectively mitigates aliasing of multi-load currents in the time-frequency domain, thereby significantly improving waveform reconstruction accuracy.
- (3)
- Load Identification via Time-Series Imaging: A load identification method is proposed, which encodes one-dimensional current sequences into two-dimensional images using a Gramian Angular Field (GAF) and classifies them with a ResNet18 network. This approach enables automatic feature extraction via a deep convolutional network, circumventing the limitations of manual feature engineering. The method achieves over 90% recognition accuracy on both public and proprietary datasets, demonstrating strong robustness and generalization capability.
Author Contributions
Conceptualization, Y.W.; methodology, X.S. and D.S.; validation, Y.W., H.T. and Z.Z.; formal analysis, Y.W.; investigation, Y.W.; resources, Z.B., H.T. and Z.Z.; data curation, X.S.; writing—original draft preparation, Y.W.; writing—review and editing, R.C.; visualization, Y.W.; project administration, Y.W. All authors have read and agreed to the published version of the manuscript.
Funding
This work was supported by the National Natural Science Foundation of China under Grant No. 52477140, the Tianjin Science and Technology Plan Project under Grant No. 24YFXTHZ0036, and the S&T Program of Hebei under Grant No. 25364501D.
Data Availability Statement
The original contributions presented in this study are included in the article. Further inquiries can be directed to the corresponding author.
Acknowledgments
The authors would like to thank all anonymous reviewers for their valuable comments and suggestions. No additional acknowledgments are applicable.
Conflicts of Interest
Hanjia Tang and Zizhe Zhang were employed by the company INODUS Electrical Technology Co., Ltd. Zhizhou Bao was employed by the company People’s Electric Appliance Group Co., Ltd. Ruodan Chen was employed by the company Wuhan China Star Optoelectronics Technology Co., Ltd. The remaining authors declare that the research was conducted in the absence of any commercial or financial relationships that could be construed as a potential conflict of interest. The funders had no role in the design of the study; in the collection, analyses, or interpretation of data; in the writing of the manuscript; or in the decision to publish the results.
References
- Li, X.; Tan, Q.; Zhao, H.; Qiao, N.; Liu, L.; Tan, C.; Tan, Z. Carbon emission factors and decoupling effects of China’s power industry in the context of carbon peak. China Electr. Power 2024, 57, 88–98. [Google Scholar]
- Li, Z.; Wan, J. Collaborative optimization method of multi-microgrid energy considering demand response and carbon trading. Electr. Technol. 2025, 26, 45–51. [Google Scholar]
- Yilmaz, S.; Chambers, J.; Patel, K. Comparison of clustering approaches for domestic electricity load profile characterization implications for demand side management. Energy 2019, 180, 665–667. [Google Scholar] [CrossRef] [Scilit]
- Athanasiadis, C.L.; Papadopoulos, T.A.; Kryonidis, G.C.; Doukas, D.I. A holistic and personalized home energy management system with non-intrusive load monitoring. IEEE Trans. Consum. Electron. 2024, 70, 6725–6737. [Google Scholar] [CrossRef] [Scilit]
- Zhang, T.; Yu, H.; Tian, J.; Fan, H.; Chen, C.; Geng, G. Online evaluation of aggregate load demand response capability based on non-intrusive load identification. Electr. Power Eng. Technol. 2020, 39, 19–25+65. [Google Scholar]
- Wu, X.; Jiao, D.; Gao, Y.-C. Adaptive feature library construction and load identification based on non-invasive power data decomposition. Power Syst. Autom. 2020, 44, 101–109. [Google Scholar]
- Lei, Y.; Sun, Z.; Ye, Z.; Wu, X. Research on non-invasive monitoring methods for power system loads. J. Electr. Technol. 2021, 36, 2288–2297. [Google Scholar]
- Wang, J.; Srikantha, P. Stealthy black-box attacks on deep learning non-intrusive load monitoring models. IEEE Trans. Smart Grid 2021, 12, 3479–3492. [Google Scholar] [CrossRef] [Scilit]
- Tanoni, G.; Principi, E.; Squartini, S. Non-Intrusive Load Monitoring in industrial settings: A systematic review. Renew. Sustain. Energy Rev. 2024, 202, 114703. [Google Scholar] [CrossRef] [Scilit]
- Ridi, A.; Gisler, C.; Hennebert, J. A survey on investigating load monitoring for appliance recognition. In Proceedings of the 2014 22nd International Conference on Pattern Recognition, Stockholm, Sweden, 24–28 August 2014; pp. 3702–3707. [Google Scholar]
- Huang, D.; Guo, N.; Yu, N.; Kong, L. Large-user incentive-based demand response optimization strategy for system flexibility improvement. J. Electr. Technol. 2024, 39, 6778–6792. [Google Scholar]
- Yu, M.; Wang, B.; Lu, L.; Bao, Z.; Qi, D. Non-intrusive adaptive load identification based on Siamese network. IEEE Access 2022, 10, 11564–11573. [Google Scholar] [CrossRef] [Scilit]
- Hart, G.W.; Kern, E.C.; Schweppe, F.C. Non-Intrusive Appliance Monitor Apparatus. U.S. Patent US4858141A, 1989. [Google Scholar]
- Hart, G.W. Non-intrusive appliance load monitoring. Proc. IEEE 1992, 80, 1870–1891. [Google Scholar] [CrossRef] [Scilit]
- Cheng, X.; Li, L.; Wu, H.; Ding, Y.; Song, Y.; Sun, W. Summarization of non-intrusive load monitoring and decomposition research. Grid Technol. 2016, 40, 3108–3117. [Google Scholar]
- Liu, S.; Liu, Y.; Gao, S.; Guo, H.; Song, T.; Jiang, W.; Li, Z.; Wang, J.; Xu, Y. Non-intrusive load decomposition method based on multi-feature objective function PCA-ILP. Power Constr. 2020, 41, 1–8. [Google Scholar]
- Guo, L.; Wang, S.; Chen, H.; Shi, Q. A load identification method based on active deep learning and discrete wavelet transform. IEEE Access 2020, 8, 113932–113942. [Google Scholar] [CrossRef] [Scilit]
- Yan, F.; Zhang, R.; Sun, Y.; Tao, Y.; Huang, G.; Sun, W. Non-intrusive load identification method based on improved kNN algorithm. J. Fudan Univ. 2021, 60, 182–188. [Google Scholar]
- Jia, D.; Li, Y.; Du, Z.; Xu, J.; Yin, B. Non-intrusive load identification using reconstructed voltage–current images. IEEE Access 2021, 9, 77349–77358. [Google Scholar] [CrossRef] [Scilit]
- Luan, K.; Yang, S.; Huang, Y.; Fang, K.; Cheng, H.; Huang, S. Research on load identification based on Fisher-SVM feature selection. J. Electr. Power Sci. Technol. 2023, 38, 230–239+264. [Google Scholar]
- Li, L.; Huang, Y.J.; Xiong, W.; Wang, M.; Yang, D.S. Research on non-intrusive load identification method based on improved convolutional neural network. Electr. Meas. Instrum. 2024, 61, 125–130+156. [Google Scholar]
- Wei, X.Q.; Zhang, C.Y.; Miao, H.Y.; Chen, S. Research on non-intrusive load identification method based on multi-feature fusion. Electr. Appl. Energy Effic. Manag. Technol. 2023, 55–60+76. [Google Scholar]
- Shi, J.; Zhi, D.; Fu, R. Research on a non-intrusive load recognition algorithm based on high-frequency signal decomposition with improved VI trajectory and background color coding. Mathematics 2023, 12, 30. [Google Scholar] [CrossRef] [Scilit]
- Bian, H.; Zhang, Z. A non-intrusive fine-grained load identification method based on three-dimensional voltage-current trajectories. Front. Energy Res. 2024, 12, 1479995. [Google Scholar] [CrossRef] [Scilit]
- Lin, S.; Zhao, B.; Zhan, Y.; Yu, J.; Bian, X.; Li, D. Non-intrusive residential load identification based on load feature matrix and CBAM-BiLSTM algorithm. Front. Energy Res. 2024, 12, 1443700. [Google Scholar] [CrossRef] [Scilit]
- Athanasiadis, C.; Doukas, D.; Papadopoulos, T.; Chrysopoulos, A. A scalable real-time non-intrusive load monitoring system for the estimation of household appliance power consumption. Energies 2021, 14, 767. [Google Scholar] [CrossRef] [Scilit]
- Wang, X.; Geng, Y.; Luo, X.; Guan, X. Detection of dummy data injection attacks by using particle swarm optimization-attention temporal graph convolutional network model in power system. Eng. Appl. Artif. Intell. 2026, 171, 114259. [Google Scholar] [CrossRef] [Scilit]
- Medico, R.; De Baets, L.; Gao, J.; Giri, S.; Kara, E.; Dhaene, T.; Develder, C.; Bergés, M.; Deschrijver, D. A voltage and current measurement dataset for plug load appliance identification in households. Sci. Data 2020, 7, 49. [Google Scholar] [CrossRef] [Scilit]
- DL/T 2365-2021; Technical Specification for Non-Intrusive Load Monitoring Devices. China Electric Power Press: Beijing, China, 2021.
- Jiao, W.; Yang, B. MDAT-Net: A TCN track prediction method combining MSC and spatio-temporal attention. J. Beijing Univ. Aeronaut. Astronaut. 2023, 1, 1001–5965. [Google Scholar]
- Sun, L.; Zhu, G.; Li, P. Joint constraint algorithm based on deep neural network with dual outputs for single-channel speech separation. Signal Image Video Process. 2020, 14, 1387–1395. [Google Scholar] [CrossRef] [Scilit]
- Herath, G.M.; Liyanage, M.H.; Angammana, C.J. Assessment of Non-Intrusive Load Monitoring as a Blind Source Separation Problem. In Proceedings of the 2023 IEEE PES GTD International Conference and Exposition (GTD), Istanbul, Türkiye, 22–25 May 2023; pp. 156–160. [Google Scholar]
- Wu, X.; Han, L.; Wang, Z.; Qi, B. A nonintrusive fast residential load identification algorithm based on frequency-domain template filtering. IEEJ Trans. Electr. Electron. Eng. 2017, 12, S125–S133. [Google Scholar] [CrossRef] [Scilit]
- Yue, Z.; Witzig, C.R.; Jorde, D.; Jacobsen, H.A. BERT4NILM: A Bidirectional Transformer Model for Non-Intrusive Load Monitoring. In NILM 2020—Proceedings of the 5th International Workshop on Non-Intrusive Load Monitoring; Association for Computing Machinery, Inc.: Beijing, China, 2020; pp. 89–93. [Google Scholar]

Disclaimer/Publisher’s Note: The statements, opinions and data contained in all publications are solely those of the individual author(s) and contributor(s) and not of MDPI and/or the editor(s). MDPI and/or the editor(s) disclaim responsibility for any injury to people or property resulting from any ideas, methods, instructions or products referred to in the content. |
© 2026 by the authors. Licensee MDPI, Basel, Switzerland. This article is an open access article distributed under the terms and conditions of the Creative Commons Attribution (CC BY) license.