


Abstract
Currently, the study of individual parameters’ influence on the energy efficiency of hydraulic systems is one of the leading research directions for these types of drives. Determining the influence of individual components and system architectures on the energy efficiency parameter for exemplary objects and systems is a new body of knowledge that allows for the development of a basic and general method for determining the energy efficiency of hydrostatic systems. The method developed and presented in this article extends this knowledge, making it possible to determine the influence of liquid parameters and individual system components on the energy efficiencies achieved by hydrostatic systems. The method used for determining individual factors’ influence on achieved system energy efficiencies is utilitarian and allows for the determination of how changes in specific parameters affect the efficiency of operational systems based on the results of pressure and motion speed measurements. Experimental tests were conducted to determine total power variations and the quantitative relationship between volumetric and flow resistance losses as the oil temperature increased from 25 °C to 75 °C.
1. Introduction
Although hydrostatic systems remain indispensable in modern industrial drives due to their exceptional power-to-weight ratios and modular architecture, reducing their operational energy losses under changing conditions has become a critical vector of current developments and research. Tightening energy regulations and market demands necessitate a shift from highly complicated power analysis models toward universal and precision diagnostics models of energy balances. In this context, thermal variations in the working fluid represent a primary variability vector, as fluctuating temperatures trigger complex changes in volumetric leakage and mechanical–hydraulic losses within the entire hydrostatic system.
Currently, the efficiency of hydrostatic systems is most often determined by using liquid flow models with specific parameters such as viscosity and density. However, the results of tests on actual hydrostatic drive systems suggest that directly correlating energy gain with a change in liquid viscosity is subject to significant error. On the other hand, newly implemented system condition monitoring systems, which include pressure, temperature, and flow sensors, monitor and record changes over time in the system’s key parameters. The data obtained enable the determination of the energy efficiency parameter for individual components or entire hydrostatic systems. It is therefore justified to develop a method that allows for the determination of the actual energy efficiency of hydrostatic systems during operation. The proposed research approach was implemented to determine the actual energy changes in the system, which are a result of the change in liquid temperature.
2. Background
Current research on the energy-related issues of hydrostatic drive systems is being carried out in several parallel directions. The first major direction focuses on achieving a significant increase in the energy efficiency of classical system structures throughout their entire operating range. This is a result of global efforts to reduce CO2 emissions and the desire to decrease energy demand, which directly translates to machine operating costs and mitigates operational problems stemming from excessive thermal energy generated by the systems. This area has also been included in standardization work, which has resulted in the development of a standard that contains a method for determining energy efficiency based on the energy balance of hydrostatic systems as a whole [1].
The development process in this area is divided into two parts: analysis and improvement of the energy parameters of hydrostatic system components, and work aimed at the energy optimization of systems at the level of their architecture and control. In the area of system components, a number of studies focus on increasing the efficiency of hydraulic pumps and motors, where the processes of converting mechanical energy into hydraulic energy and vice versa are associated with a significant magnitude of energy losses. The first interesting example of this development is the work carried out in the field of agricultural machinery [2], in which, due to high sales and usage volume, even a slight improvement in energy efficiency significantly reduces global energy consumption due to the effect of scaling. A wide research analysis has also been conducted on the swash-plate-type axial piston pump regarding the influence of operating parameters on the achieved energy efficiency [3].
The literature also contains research results on the influence of hydraulic fluid quality on external gear pump performance [4], as well as an analysis of the influence of hydraulic oil viscosity on the volumetric losses in a variable piston pump [5]. An extension of this work includes analyses of technical condition identification systems for pumps using self-supervised learning systems, which enable the quick identification of pump damage processes and, consequently, their significant reduction in energy efficiency during operation [6]. Analyses of the energy efficiency and thermal phenomena occurring in hydraulic pumps are related not only to reliability issues but also to operational safety and analyses of the possible effects of irregularities in this area [7]. Work is also being conducted to determine the influence of liquid viscosity on the energy efficiency of centrifugal pumps [8]. Energy analyses of hydraulic cylinders do not appear to be a main direction of research, although individual publications in this area can be found [9,10].
An analysis of the state-of-the-art indicates that a more pronounced direction of research and development for hydraulic systems is the development of architecture and control systems for hydrostatic power transmission to achieve greater efficiency and improved operating parameters. In this area, systems are being developed that are dedicated to specific applications, such as agricultural tractors [11,12], excavators [13], press machines [14], or wave energy converter systems [15]. Among these, several directions of development can be distinguished. The first is based on the energy analysis of exemplary hydrostatic systems, followed by identifying the key components responsible for reducing the system’s efficiency parameter. Such work has been performed for a number of applications, e.g., refuse truck hydraulic systems [16], braking systems for heavy-duty vehicles [17], mining hydraulic excavator systems [18], injection molding machines [19], and hydraulic presses [20].
A second direction of development appears to be the introduction of limited changes in the hydrostatic system’s architecture while introducing significant changes in the control system. As a result of work in this area, electro-hydraulic systems have been developed in which the main control elements are valves, but the control process for the entire system is managed by a central electronic system. A basic, and one could say classic, but still used change in this area, is the application of PID control algorithms [21]. However, more and more advanced control algorithms are being used, which additionally account for the possibility of mechanical energy being returned from the system via a hydraulic motor [22,23], its accumulation hydraulically [24,25,26], or both of these possibilities [27]. The literature also includes a comprehensive study of possible structures for electro-hydraulic systems with energy recovery or storage [28].
Another important development is the use of an electro-hydraulic flow control structure generated by hydraulic pumps, while simultaneously dividing the system architecture into individual units composed of a pump and a directly connected hydraulic actuator. Research on electro-hydraulic systems based on this architecture (Electro-Hydrostatic Actuator—EHA) has been conducted at the level of models [29,30,31,32] and on test benches [33,34,35], including the use of PID control algorithms [36]. Analyses and studies of hydrostatic systems based on determining the thermal energy balance and the possibility of shaping it through changes in the structure of heat dissipation systems are also being conducted [37,38], including in the field of aeronautics [39].
The issue of thermal balance of hydrostatic power transmission systems is analyzed both in terms of the working environment and the influence of changes in liquid temperature on the system itself. The conducted studies directly determine the influence of a change in hydraulic oil temperature on energy losses in the system resulting from flow resistance [40,41,42,43,44,45,46] in a number of applications operating in various working environments. Work is also being conducted on the exchange of thermal energy between the hydraulic system and other systems that generate waste heat [47]. It seems that a promising and still forward-looking direction of research is to determine the influence of liquid temperature on the dynamic response characteristics of the control elements of hydrostatic systems, and work in this area has already begun [48].
From an energy perspective, the fundamental parameter of mineral oils that undergoes significant changes as a function of temperature is viscosity. Studies conducted for the mining industry focus on determining the influence of a decrease in the viscosity of extracted crude oil [49,50,51] on the energy consumption of extraction facilities. The issue of the method for determining the change in viscosity of mineral hydraulic oils used in hydrostatic drive systems as a function of temperature has also been described at the normative level [52,53]. Detailed analyses of the issue of changes in liquid parameters are described in scientific articles that present methods for determining hydraulic oil parameters [54,55,56,57,58], including a method using physics-informed neural networks [59].
Research is also being conducted on methods to increase the energy efficiency of hydrostatic drive systems by using liquids with reduced viscosity [60], including bio-based hydraulic fluids [61], as well as comparative analyses of water and mineral oil as the liquid for transferring energy in a system [62]. The author’s experience indicates that beneficial changes in reducing the systems’ energy consumption, which occur after their temperature is raised, do not directly correspond to the liquid viscosity change curves. This issue has already been directly signaled in work carried out for the space industry [63], but there is a lack of a broader study on this in relation to widely used systems.
The formulation of energy evaluation models for hydrostatic systems frequently requires balancing physical fidelity with mathematical and computational complexity. Advanced thermo-hydraulic modeling paradigms often incorporate simultaneous transient variations in fluid density, bulk modulus, and thermal expansion coefficients to precisely map localized volumetric and mechanical losses [64]. However, explicitly accounting for such multi-variable dependencies can significantly increase the requirements for computing power and software support for complex numerical models. This challenge has driven recent efforts toward establishing simplified macro-level thermal baselines, such as utilizing transient average system temperatures to capture overall useful work without necessitating localized port-by-port discretization [65]. In alignment with this trend toward simplified energy evaluation paradigms, developing a generalized, simplified framework based on temperature as a stabilized parameter is highly recommended.
Consequently, it is essential to develop a universal methodology for quantifying energy consumption shifts in hydrostatic drives. The existing ISO standard method [1] accounts exclusively for energy flows, focusing on the total energy delivered to and discharged from the system, while completely omitting the underlying hydraulic parameters. Therefore, a methodology that directly correlates time-varying hydraulic parameters with the energy flow within a system is highly necessary. In contrast to conventional approaches, the proposed method integrates volumetric losses and their correlation with fluid temperature, marking a next step in this field of research.
3. Scope of Research
The commonly used correlation between changes in the level of pressure losses in a hydrostatic system and the system’s energy difference generally provides a certain degree of consistency. However, for hydraulic systems operated over a wide temperature range, a change in liquid viscosity and density is also associated with a significant change in the magnitude of volumetric losses, described by identifying the stream of liquid lost due to leaks. The author’s own experience, resulting from analyses of hydrostatic systems in mining machinery operated in high ambient temperatures, and partially confirmed in the literature [63], indicates that in many applications, neglecting the analysis of volumetric losses leads to a significant underestimation of the energy consumption of hydrostatic systems operating with an elevated liquid temperature. The energy analysis of systems should therefore take into account the influence of liquid temperature, and thus the change in its viscosity and density parameters, on the level of energy losses resulting from both flow resistance and leaks in the system. It should be emphasized that changes in liquid parameters affect the magnitude of both of these losses in opposite ways, which means that a decrease in liquid viscosity will favorably reduce flow resistance but will lead to an increase in the level of volumetric losses. Therefore, to conduct a full analysis of a system’s energy efficiency, it is necessary to determine the magnitude of all occurring energy losses and include them in the energy balance. It is assumed that these losses can be described using fluid dynamics theory, but in practical applications, determining the actual losses in this way is complicated. On the other hand, directly correlating the magnitude of energy losses in the system with a change in liquid viscosity also does not yield satisfactory results. The research undertaken on this issue has made it possible to develop a method for determining the actual losses occurring within the system, whose description and application for analyzing the change in a hydrostatic system’s energy consumption as a function of liquid temperature are presented in this publication.
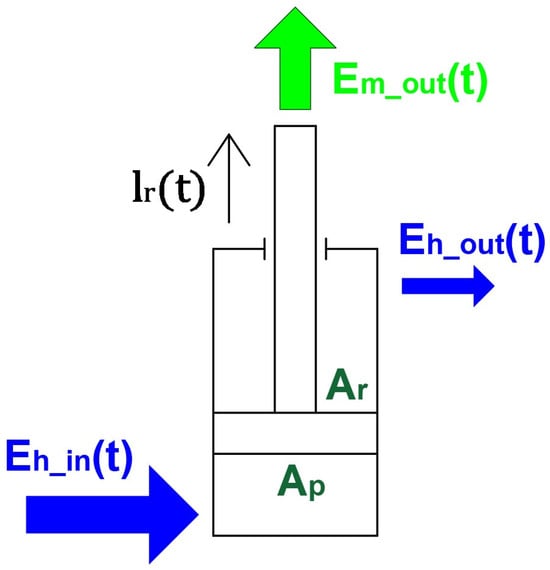
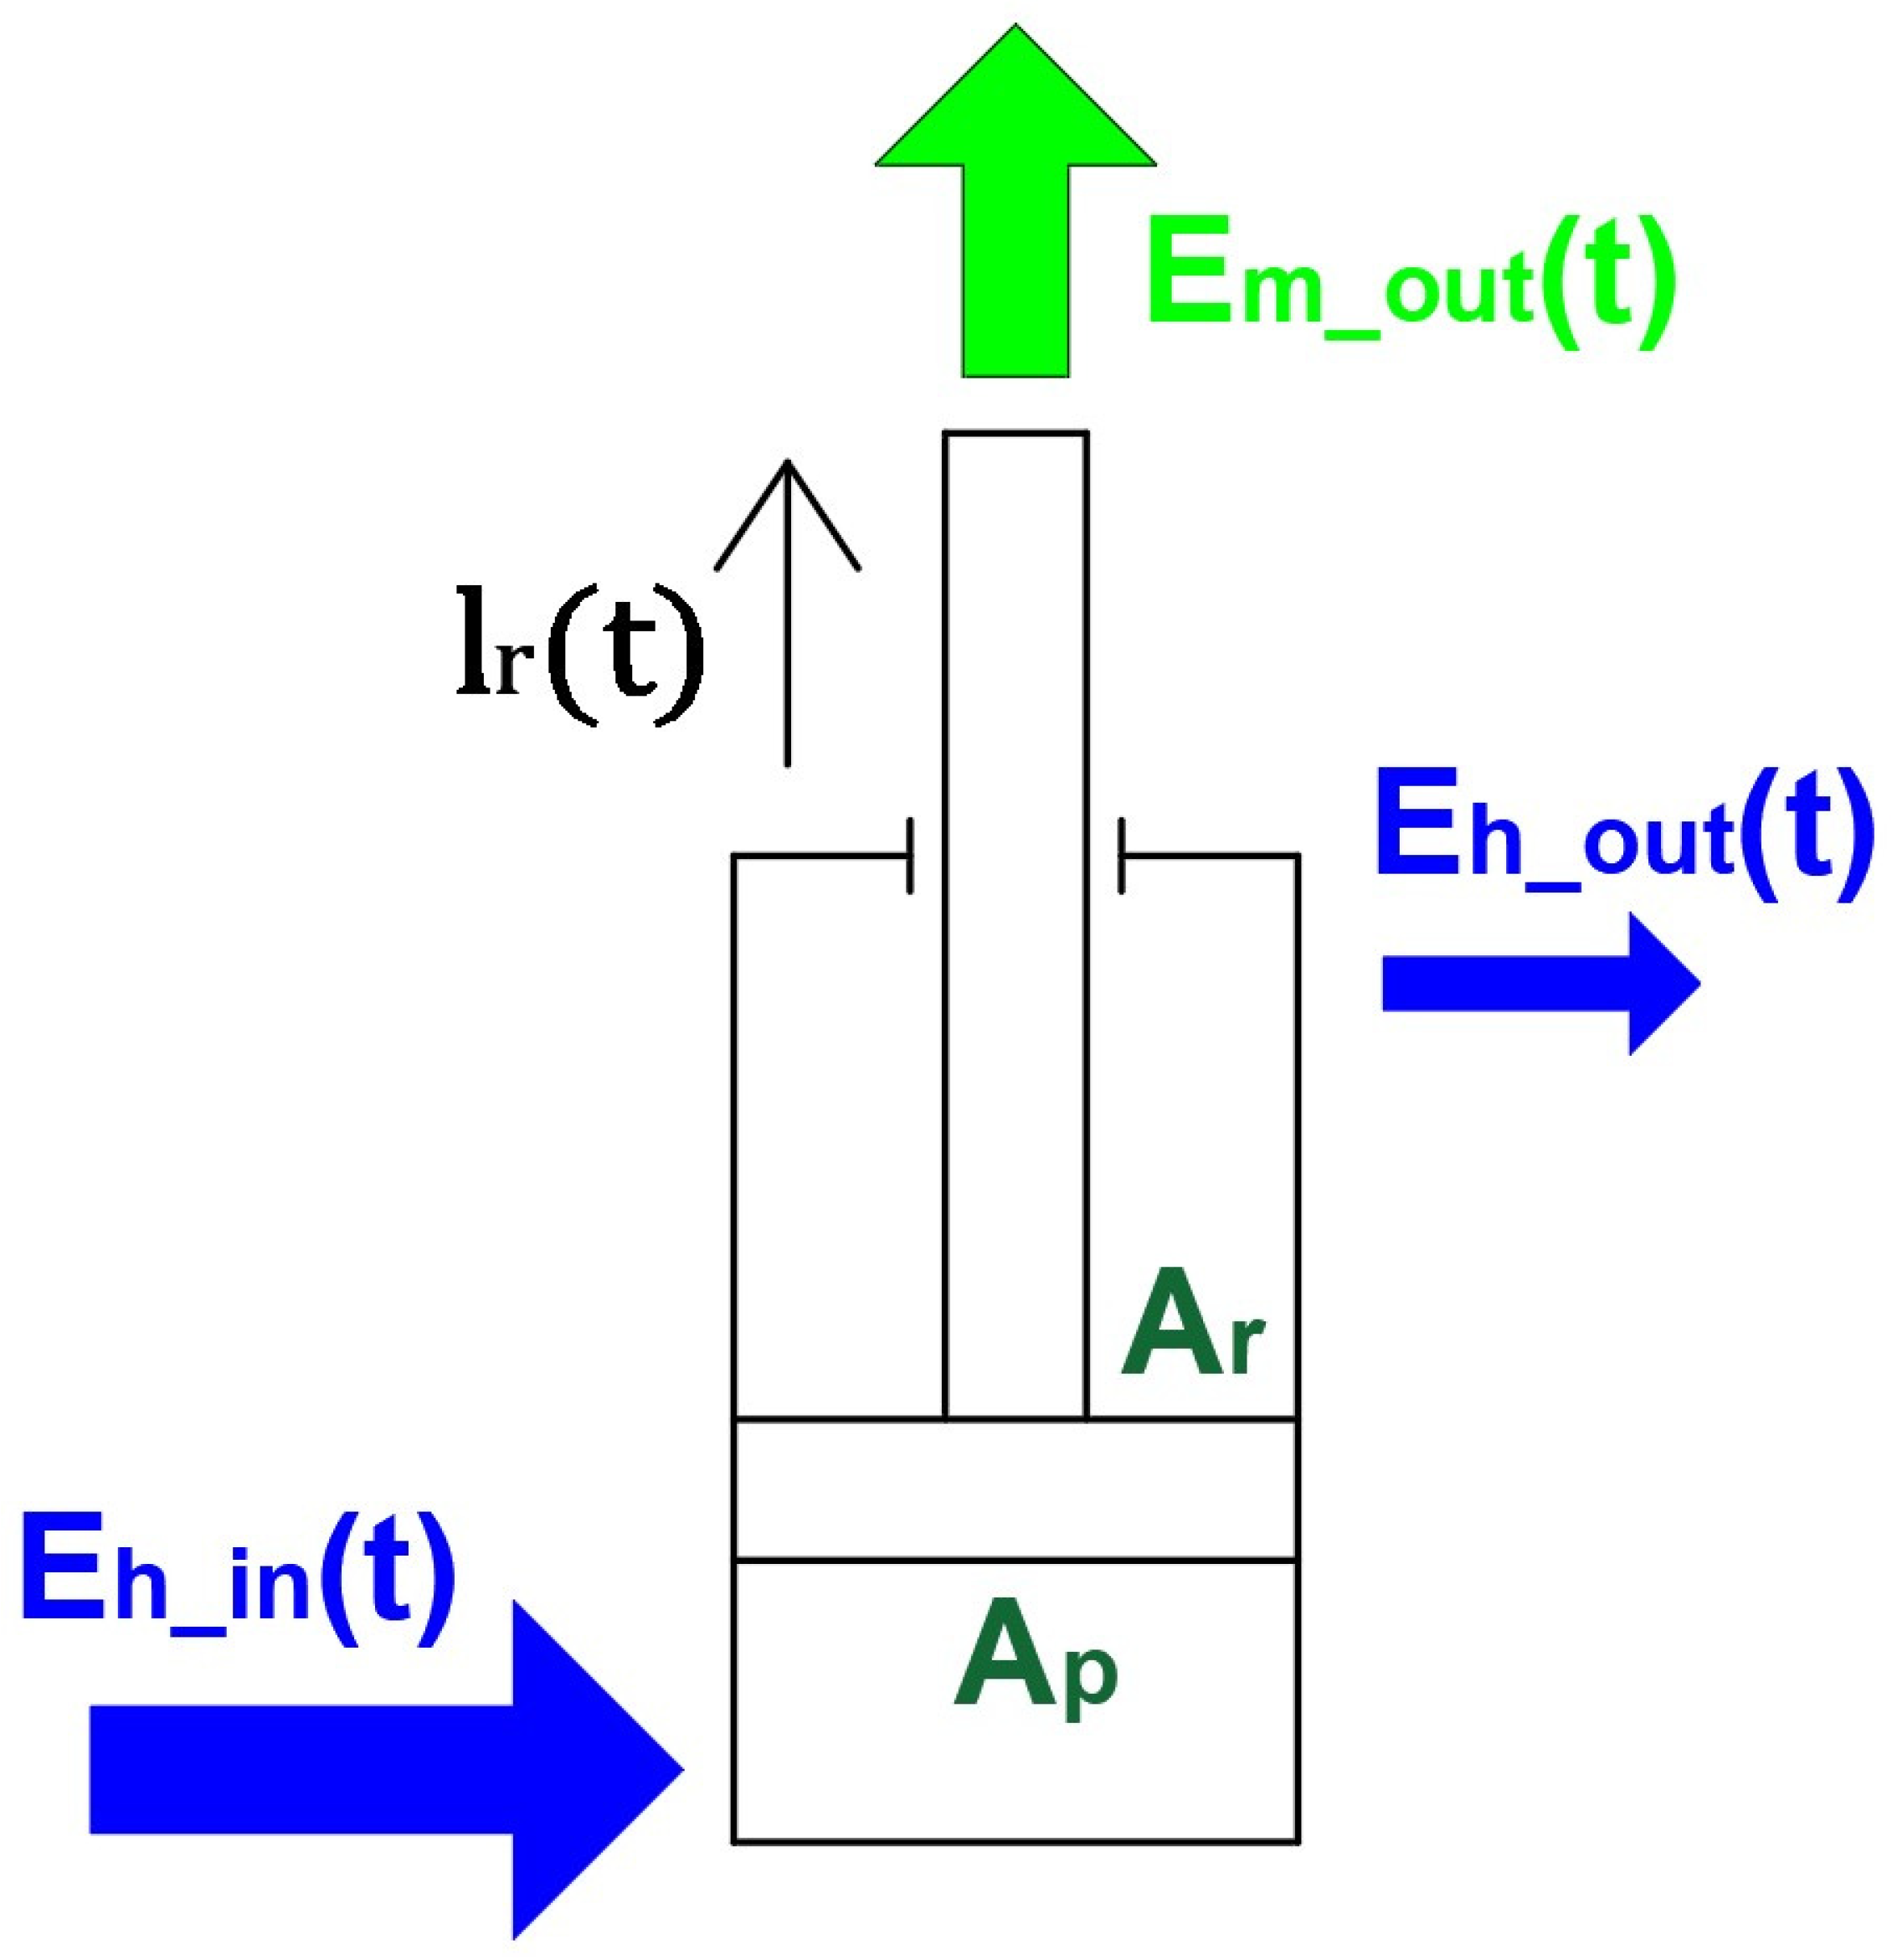
The research approach was based on the assumption that the analysis of energy changes in the system would be conducted based on the hydraulic and mechanical parameters of the actuator. Such an approach allows for the direct determination of the amount of energy used by the system’s executive element and can additionally serve as the basis for a system for monitoring the energy state of systems with a distributed architecture and multiple executive elements. In the case of hydraulic cylinders, the basic measured parameters are operating pressure and cylinder extension. These parameters were adopted as the starting point for conducting the energy analysis. In order to determine the influence of changes in individual parameters (in this case, liquid temperature) on the system’s energy consumption, it was also assumed that the measurement results would be compared during the performance of a work cycle. The work cycle adopted for the analysis should be characterized by a constant amount of energy consumed to perform the work, but variations in individual parameters during operation are permissible. For the boom-type working system used for this research, this was synonymous with performing a lifting motion within a specific displacement range and under a constant load (Figure 1).
Figure 1.
Energy flow model for an extending hydraulic cylinder under load (for a detailed description of the parameters, see Section 4).
The proposed approach will enable a comprehensive energy analysis of the hydrostatic system, taking into account both changes in energy lost to overcome flow resistance and energy losses occurring in the liquid stream associated with leaks. Particularly interesting in this aspect is the analysis of the influence of changes in hydraulic oil temperature in the system, whose increase directly affects the reduction in liquid viscosity and thus the reduction in flow resistance while simultaneously increasing the stream of leaks. The proposed research approach enables an energy analysis of the influence of both these factors and the determination of the actual magnitudes of energy differences in relation to the system’s useful power. The development of an expanded energy model stems directly from the needs of modern industry, as the commonly used analyses are limited to determining pressure changes in the system, which can lead to overly favorable results regarding the energy consumption of systems, which can differ significantly from the real parameters.
It was assumed that the tests would be conducted within the recommended operating temperature range for hydraulic oils, specifically from 25 to 75 °C, using an ISO VG 46 grade oil (FUCHS OIL CORPORATION sp. z o.o., Gliwice, Poland). The viscosity characteristics of this oil ensure the proper functioning of the system across the entire established temperature range.
4. Theoretical Foundations of the Mathematical Model
The development of the mathematical model presented below was based on three fundamental assumptions.
The first assumption was that, to determine the magnitude of energy changes in the system as a function of temperature, the external (mechanical) work performed by the system should be a constant value. To realize this assumption, it was decided that the system’s actuator element, in the form of a hydraulic cylinder, would perform work by lifting a mass within a specified displacement range, which would directly correspond to the constancy of the work performed in a gravitational field.
The second assumption, based on industrial experience, states that the number of measured system parameters should be limited to a minimum, and the measurement system itself should be as simplified as possible. Based on this, the measured values were chosen to be the changes over time of pressure and the displacement of the hydraulic cylinder’s piston rod, as these parameters are monitored in a significant number of currently operated hydrostatic drive systems.
The third assumption was to isolate the area for the analysis of energy phenomena to the system area consisting of the direct supply to the hydraulic cylinder, the hydraulic cylinder itself, and the liquid return line to the tank. This allowed for the determination of the nature of energy phenomena in both the return line and in the actuator system working in conjunction with the return line.
Additionally, the following simplifying assumptions were made:
- Liquid viscosity and density are assumed to be constant throughout the entire system, varying only with temperature;
- Liquid flow between the hydraulic cylinder chambers is negligibly small;
- All flow losses in the actuator’s return line are described as a single, equivalent flow resistance;
- Volumetric losses in the return line are negligible due to the relatively low pressure in it;
- Analyses will be conducted based on a specific and constant parameter of hydraulic cylinder extension.
The energy balance of an extending hydraulic cylinder performing work under an external load directly links hydraulic energy to useful mechanical energy and energy losses that occur during the cylinder’s motion, which are converted into thermal energy. The balance is based on the assumption that the hydraulic energy converted in the cylinder, defined as the difference between the hydraulic energy supplied to the cylinder (Eh_in) and the hydraulic energy discharged from the system (Eh_out) during operation, is equal to the useful mechanical energy (Em_out) and the energy losses (Eloss), as described by the following equation:
Based on the assumptions, the right side of the equation, which defines the useful energy and energy losses in the hydraulic cylinder, can be considered a constant value. Therefore, the left side of the equation, which defines the hydraulic energy of the liquid streams, was subjected to a broader analysis.
It should be noted that the energy balance in Equation (1) is formulated based on the mechanical–hydraulic power states, treating fluid temperature as a stabilized, parametric boundary condition rather than a transient thermodynamic variable. When evaluating such hydrostatic systems under a maintained thermal equilibrium at discrete temperature steps, the internal thermal energy accumulation within the fluid during short operational windows can be considered negligible. Under these conditions, the localized enthalpy flows reduce to the fluid power states, where the impact of temperature is inherently represented by the shift in the fluid’s viscosity and density parameters. This approach justifies evaluating system losses indirectly through the primary variables of input and output pressures and piston velocity, allowing the mathematical model to represent thermodynamic variations without necessitating overly complex enthalpy formulations for this analysis.
The amount of energy supplied to the hydraulic cylinder from the hydraulic supply side during operation can be determined using the following relationships:
where
- pin(t) is the pressure at the hydraulic cylinder’s supply port, varying over time.
- Vin(t) is the volume of liquid supplied to the hydraulic cylinder, varying over time.
The volume of supplied liquid can be determined indirectly by using the measurement of the displacement of the extending piston of the hydraulic cylinder, based on the relationship:
where
- Ap is the piston area.
- lr(t) is the hydraulic cylinder extension varying over time.
- Dp is the piston diameter.
Since it was assumed that for the comparison of energy losses, the analyses are conducted within a defined and constant total displacement of the hydraulic cylinder piston (lr_c), Equation (2) takes the following form:
It should be noted that deriving the volume variations in the supplied liquid from the kinematic parameters of the piston motion serves as a deliberate and basic feature of the proposed framework. The real-time movement of the cylinder’s piston naturally acts as a physical integrator of the system’s energy state. Any internal leakage or volumetric loss occurring within the hydrostatic architecture directly manifests as a corresponding variation in the piston’s displacement output. Consequently, this indirect method provides a useful energy-based framework that directly links energy changes with the total volumetric losses of the system, ensuring a holistic power balance evaluation without the need to isolate individual components.
Therefore, the variables of the equation that remain are the change in supply pressure during the motion and the time of performing this motion, which is directly related to the liquid flow rate at the hydraulic cylinder’s supply port. It can, therefore, be assumed that the determination of the total amount of hydraulic energy supplied to the hydraulic cylinder (Eh_in) describes the area under the pressure curve recorded during the operation time.
where
- Qin is the averaged value of the flow rate at the supply port.
- t0 is the start time for the hydraulic cylinder’s motion analysis.
- ts is the end time for the hydraulic cylinder’s motion analysis.
Therefore, the motion time in the proposed analysis is a measured parameter that, assuming a constant displacement of the hydraulic cylinder under load, allows for the determination of the amount of hydraulic energy supplied to the hydraulic cylinder (Eh_in), and, based on this, the average hydraulic power consumed by the cylinder during motion (Nh_in). Using the assumption of a negligibly small level of leaks in the hydraulic cylinder, the average flow rate of the liquid supplied to the hydraulic cylinder during the analyzed motion was determined first (Equation (6), followed by the relationship describing the consumed hydraulic power (Equation (7).
where
- Vin_s is the volume of liquid in the hydraulic cylinder’s supply chamber at the time the analysis ends (ts).
- Vin_0 is the volume of liquid in the hydraulic cylinder’s supply chamber at the time the analysis begins (t0).
- lr_s is the extension of the hydraulic cylinder’s piston rod at the time the analysis ends (ts).
- lr_0 is the extension of the hydraulic cylinder’s piston rod at the time the analysis begins (t0).
The presented method for determining the energy and hydraulic power of the liquid stream in the hydraulic cylinder during tests was implemented at two locations in the system, as specified in the mathematical model. In the first location, the energy parameters of the liquid stream were identified at the supplied port of the hydraulic cylinder’s piston chamber. The second was located at the port of the piston rod chamber. In this second case of analyzing the energy of the stream discharged from the hydraulic cylinder (Eh_out), the effective area of the hydraulic cylinder on the piston rod side (Ar) was taken into account. The process of extending a loaded hydraulic cylinder was analyzed, where liquid is supplied to the piston chamber and discharged to the tank from the piston rod chamber in a standard control system, in which the stream discharged from the hydraulic cylinder flows through both hydraulic lines and the control valve.
To precisely determine the energy of the stream discharged from the hydraulic cylinder (Eh_out), an analogical approach, as in Equation (5), is used:
where
- Qout is the averaged value of the flow rate at the drain port.
- pout(t) is the pressure at the hydraulic cylinder’s drain port, varying over time.
It should be noted that a temperature increase from 25 °C to 75 °C induces multi-variable coupled effects within the hydrostatic system. These variations simultaneously affect not only the fluid’s dynamic viscosity but also its density, bulk modulus, internal component clearances, and seal friction characteristics. Consequently, the empirical system evaluation represents a multi-criteria thermodynamic process rather than a strictly single-variable analysis. To address this complexity, the proposed analytical approach focuses on determining the explicit power and energy levels directly at the designated measurement points. By capturing these real-time energy profiles, this approach inherently quantifies the cumulative net effect of all thermally induced phenomena. Since the degradation of fluid viscosity is the dominant mechanism driving both flow resistance and volumetric leakage across the investigated thermal spectrum, it serves as the primary interpretative baseline for the established power balance analysis. Consequently, tracking the cylinder chamber pressures and piston velocity provides the essential variables required to capture these cumulative thermodynamic changes without necessitating overly complex or extensive instrumentation.
5. Experiment Methodology and Results
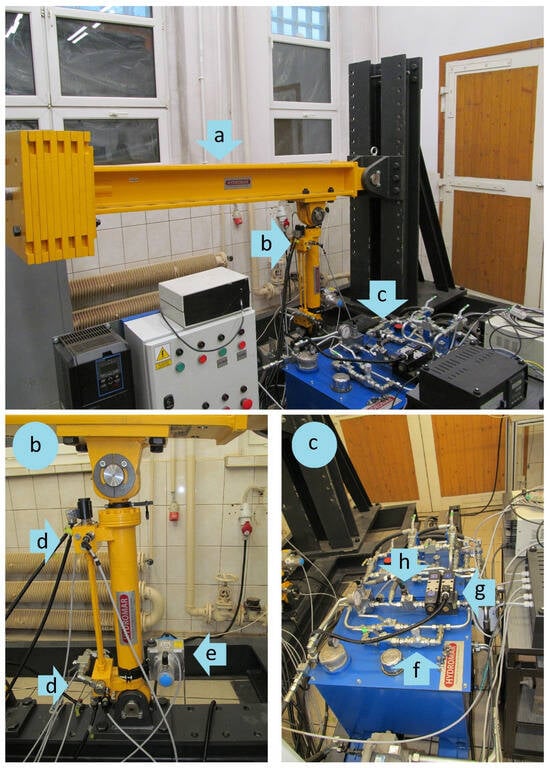
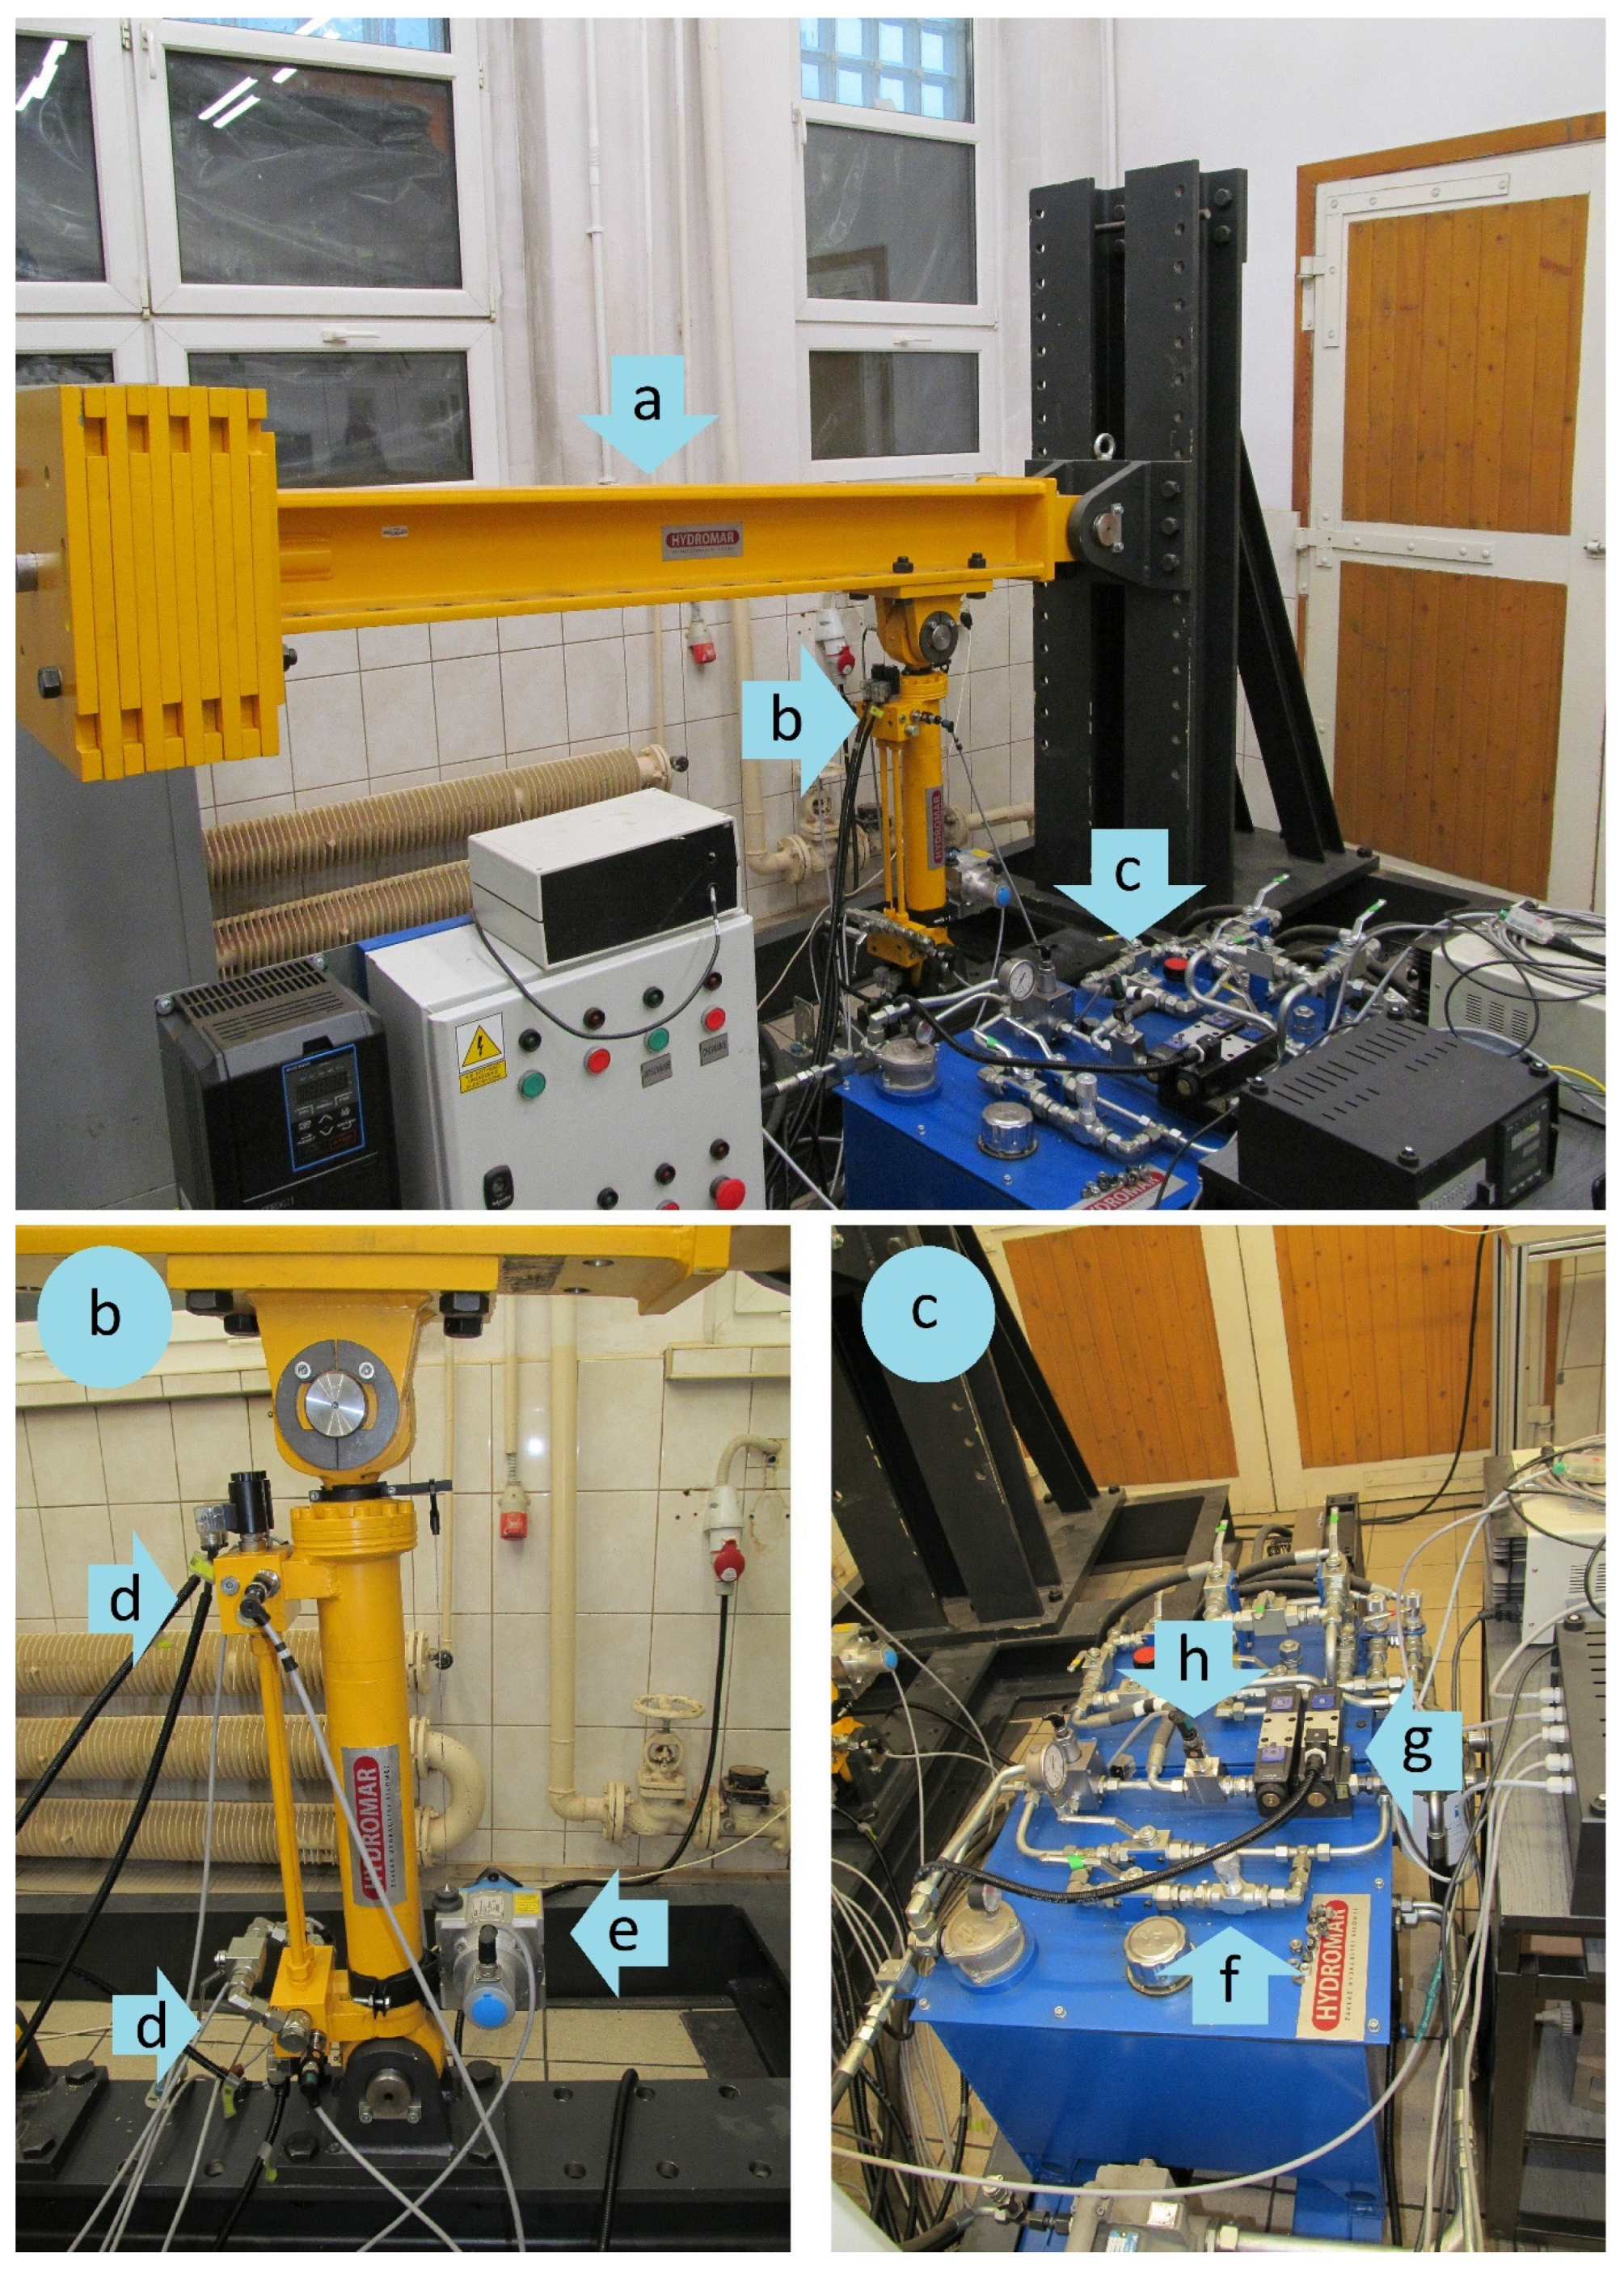
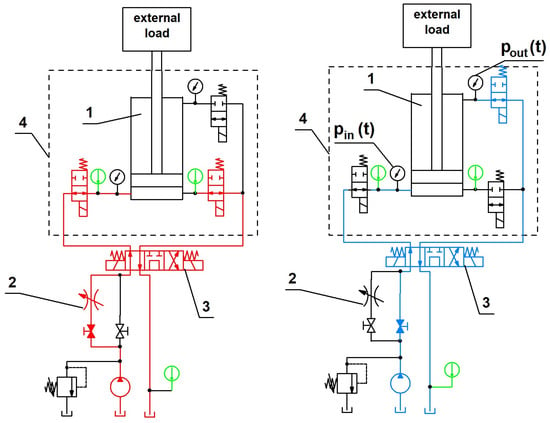
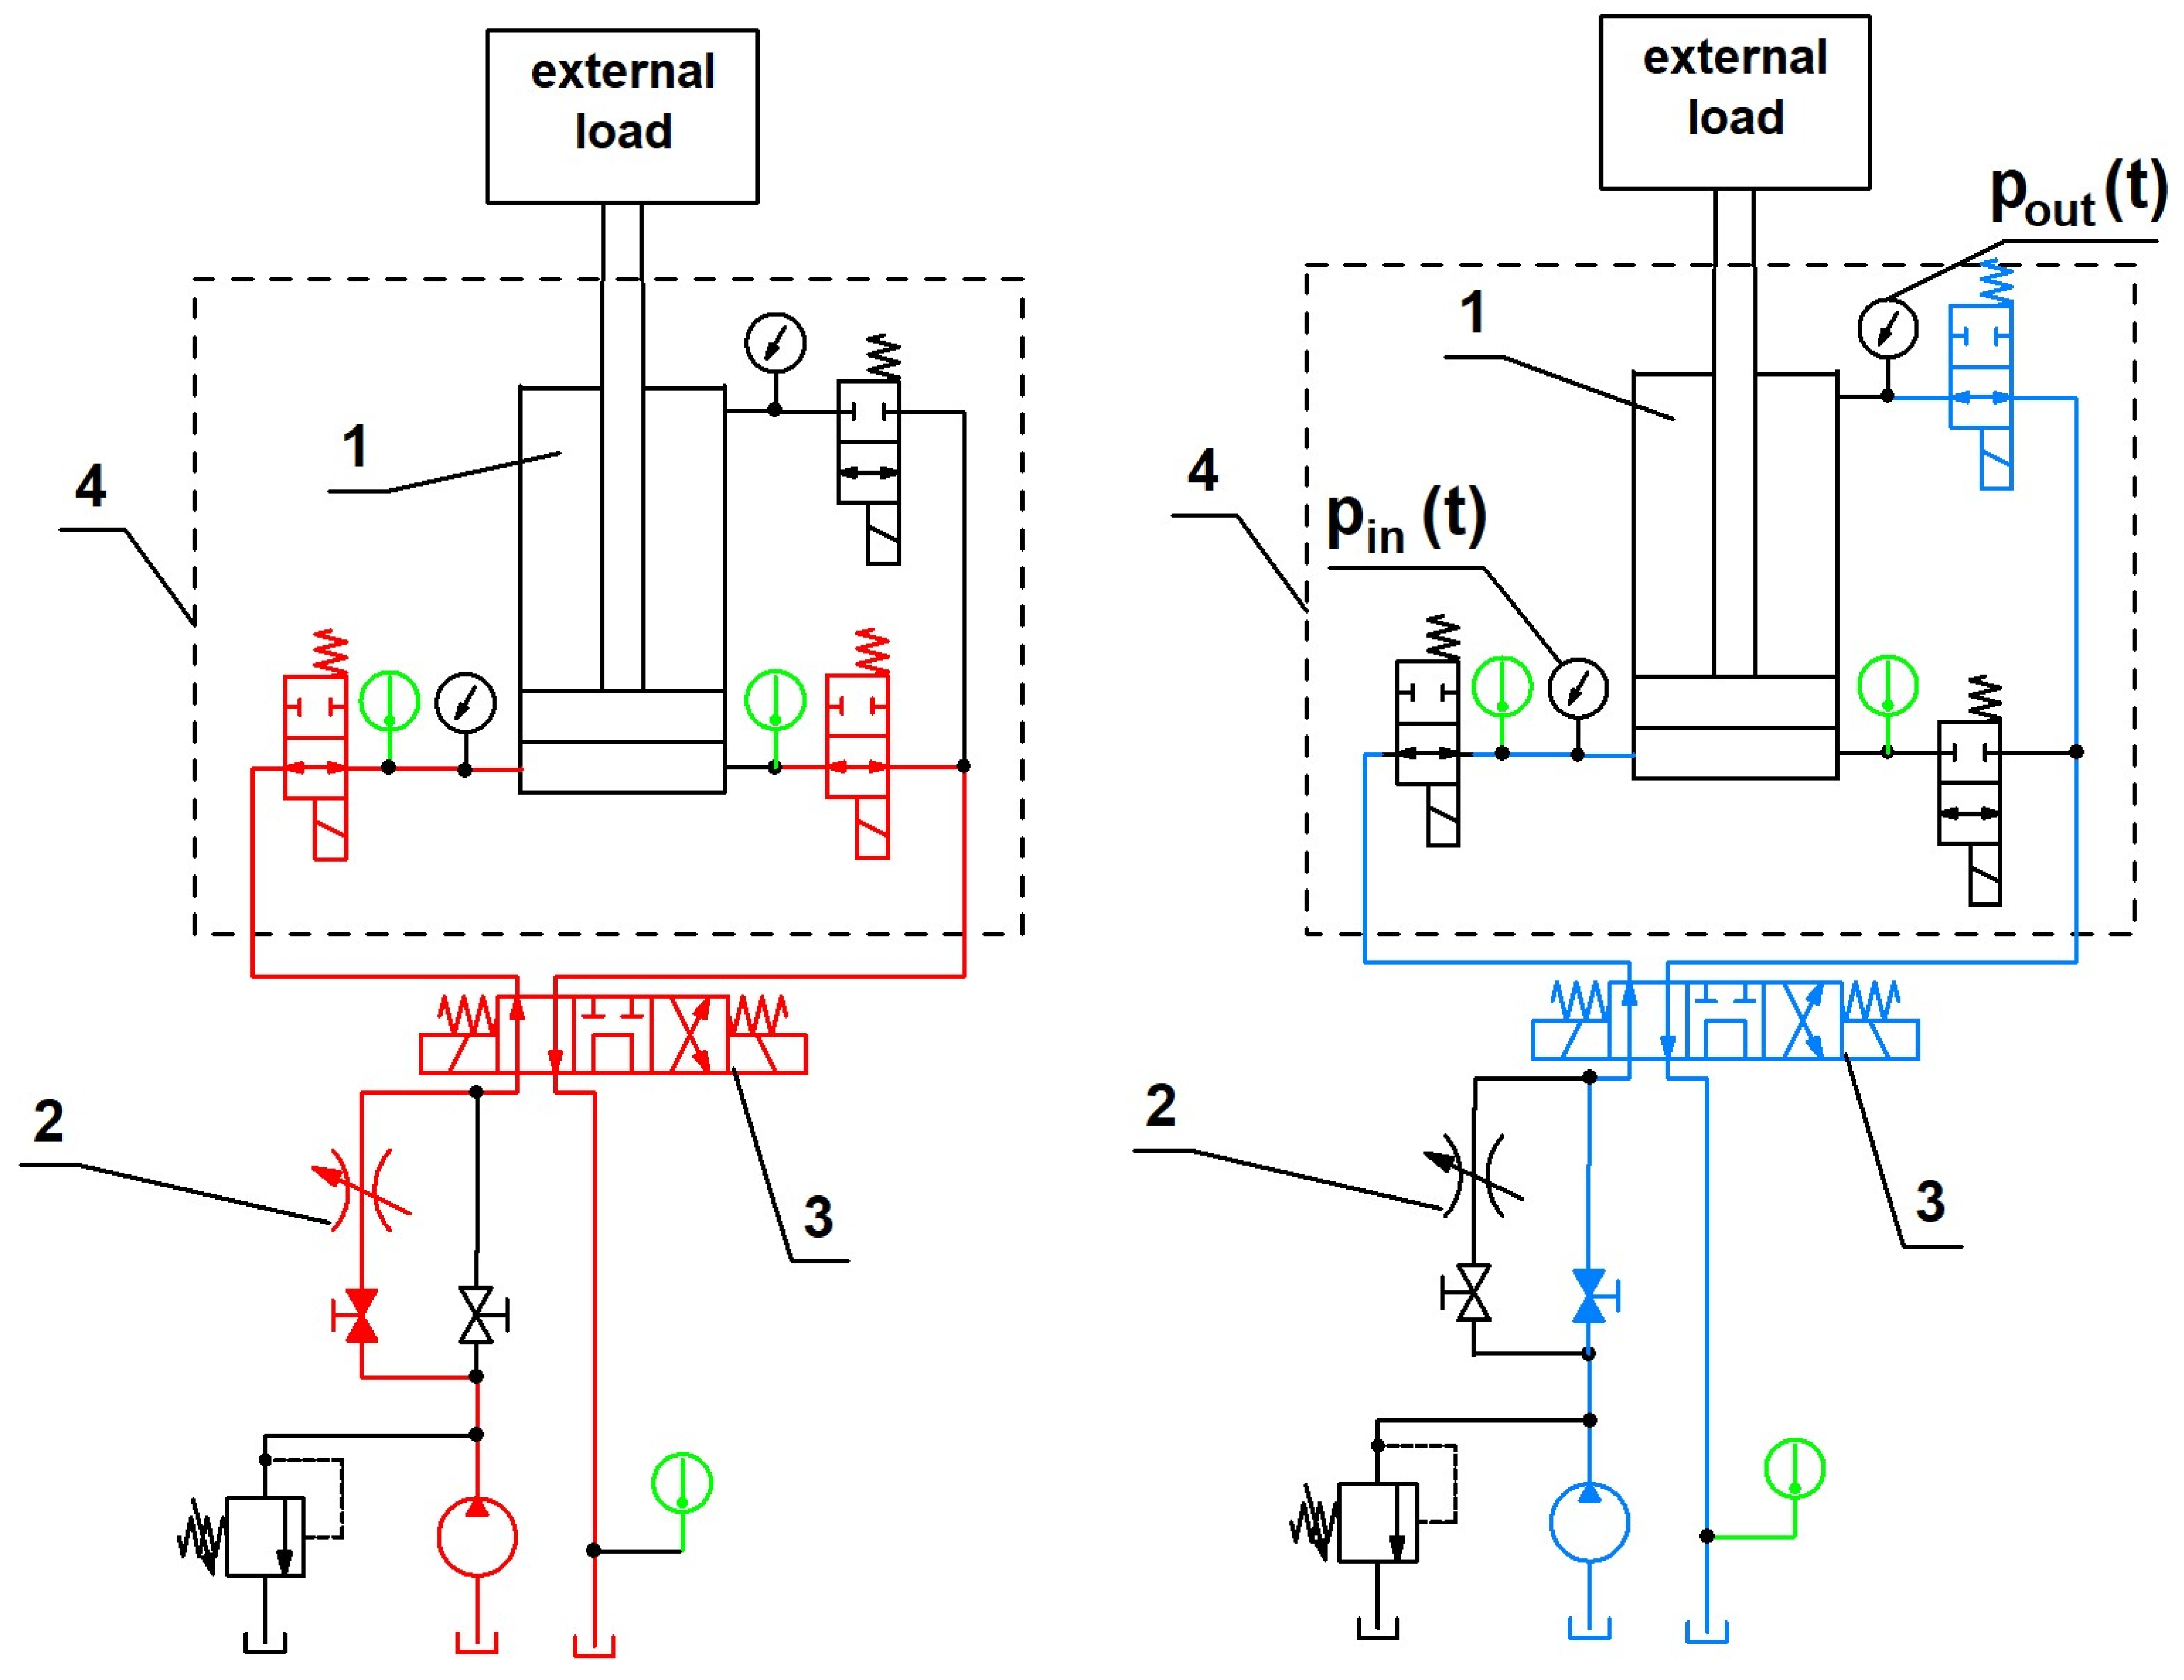
The experimental investigations were conducted on a research rig replicating a boom actuation system (Figure 2). The primary actuator was a double-acting hydraulic cylinder integrated with a valve system that enabled fluid circulation through the cylinder chambers. During the preparation of each test series, the hydraulic oil was preheated to the target temperature using a throttle valve as a resistive element to convert hydraulic energy into thermal energy. Throughout the heating process, a constant flow rate was maintained, and the fluid temperature was monitored at three distinct measurement points to ensure thermal equilibrium across the system. Consequently, the oil circulated through the supply pump, valve blocks, conduits, cylinder chambers, and the reservoir, ensuring a uniform thermal distribution. This procedure justified the assumption that the temperature measured at the reference point was representative of the entire system. Pressure transients were recorded using transducers located on the valve blocks mounted onto the cylinder. During the tests, the pair of two-way valves on the cylinder blocks that enable fluid supply to the chambers remained in the open position to facilitate a classic hydraulic configuration, and the cylinder’s motion was controlled by a standard 4/3 directional control valve (Figure 3, Table 1).
Figure 2.
Experimental setup: (a) boom system with loading masses, (b) hydraulic cylinder, (c) hydraulic power unit with control directional valve, (d) connection blocks for pressure and temperature sensors, and 2/2-way valves, (e) draw-wire displacement sensor, (f) throttle valve in the heating line, (g) 4/3 directional control valve, (h) temperature sensor on the return line to the tank. The lower panels show enlarged views of details (b) and (c).
Figure 3.
Hydraulic system diagrams illustrating fluid flow paths during different operational phases: (left) heating process with flow through the throttle valve marked in red, and (right) experimental testing phase with flow marked in blue. In both cases, the temperature sensors are indicated in green. Key components: (1) hydraulic cylinder, (2) in the heating line, (3) 4/3 directional control valve, (4) connection blocks for pressure and temperature sensors, and 2/2-way valves.
Table 1.
Main parameters of the tested system.
To ensure high measurement reliability, the experimental setup utilizes high-precision instrumentation. The hydraulic pressures were monitored using Keller Series 33X piezoresistive (Keller Group AG, Winterthur, Switzerland) transmitters with an intrinsic accuracy of ±0.05% full scale (FS) and a maximum Total Error Band (TEB) of ±0.1% FS. This TEB is maintained across a range of −10 to 80 °C via integrated mathematical thermal compensation, preventing sensor accuracy degradation due to shifting fluid temperatures. The actuator’s kinematics are captured by a SICK BTF13 (BTF13, SICK AG, Waldkirch, Germany) wire draw encoder with a resolution of 0.04 mm. Given these low instrumentation errors, the baseline uncertainty is statistically negligible. Additionally, the experimental procedure involved repetitions of each test sequence under identical conditions, allowing the data to undergo standard statistical analysis.
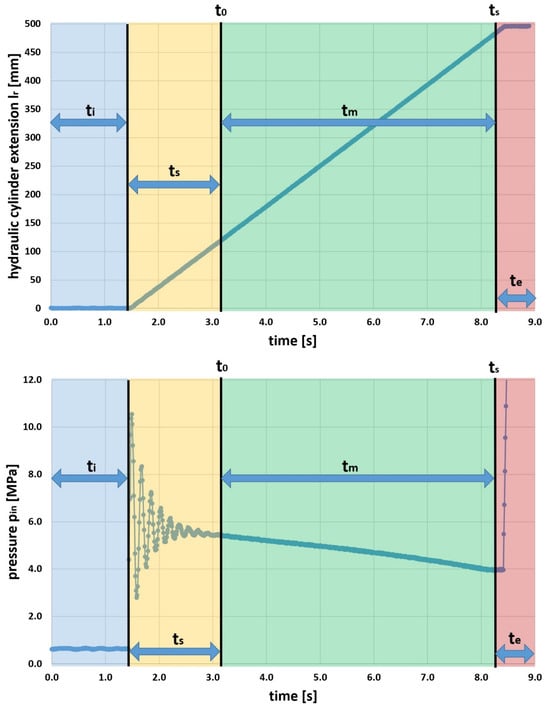
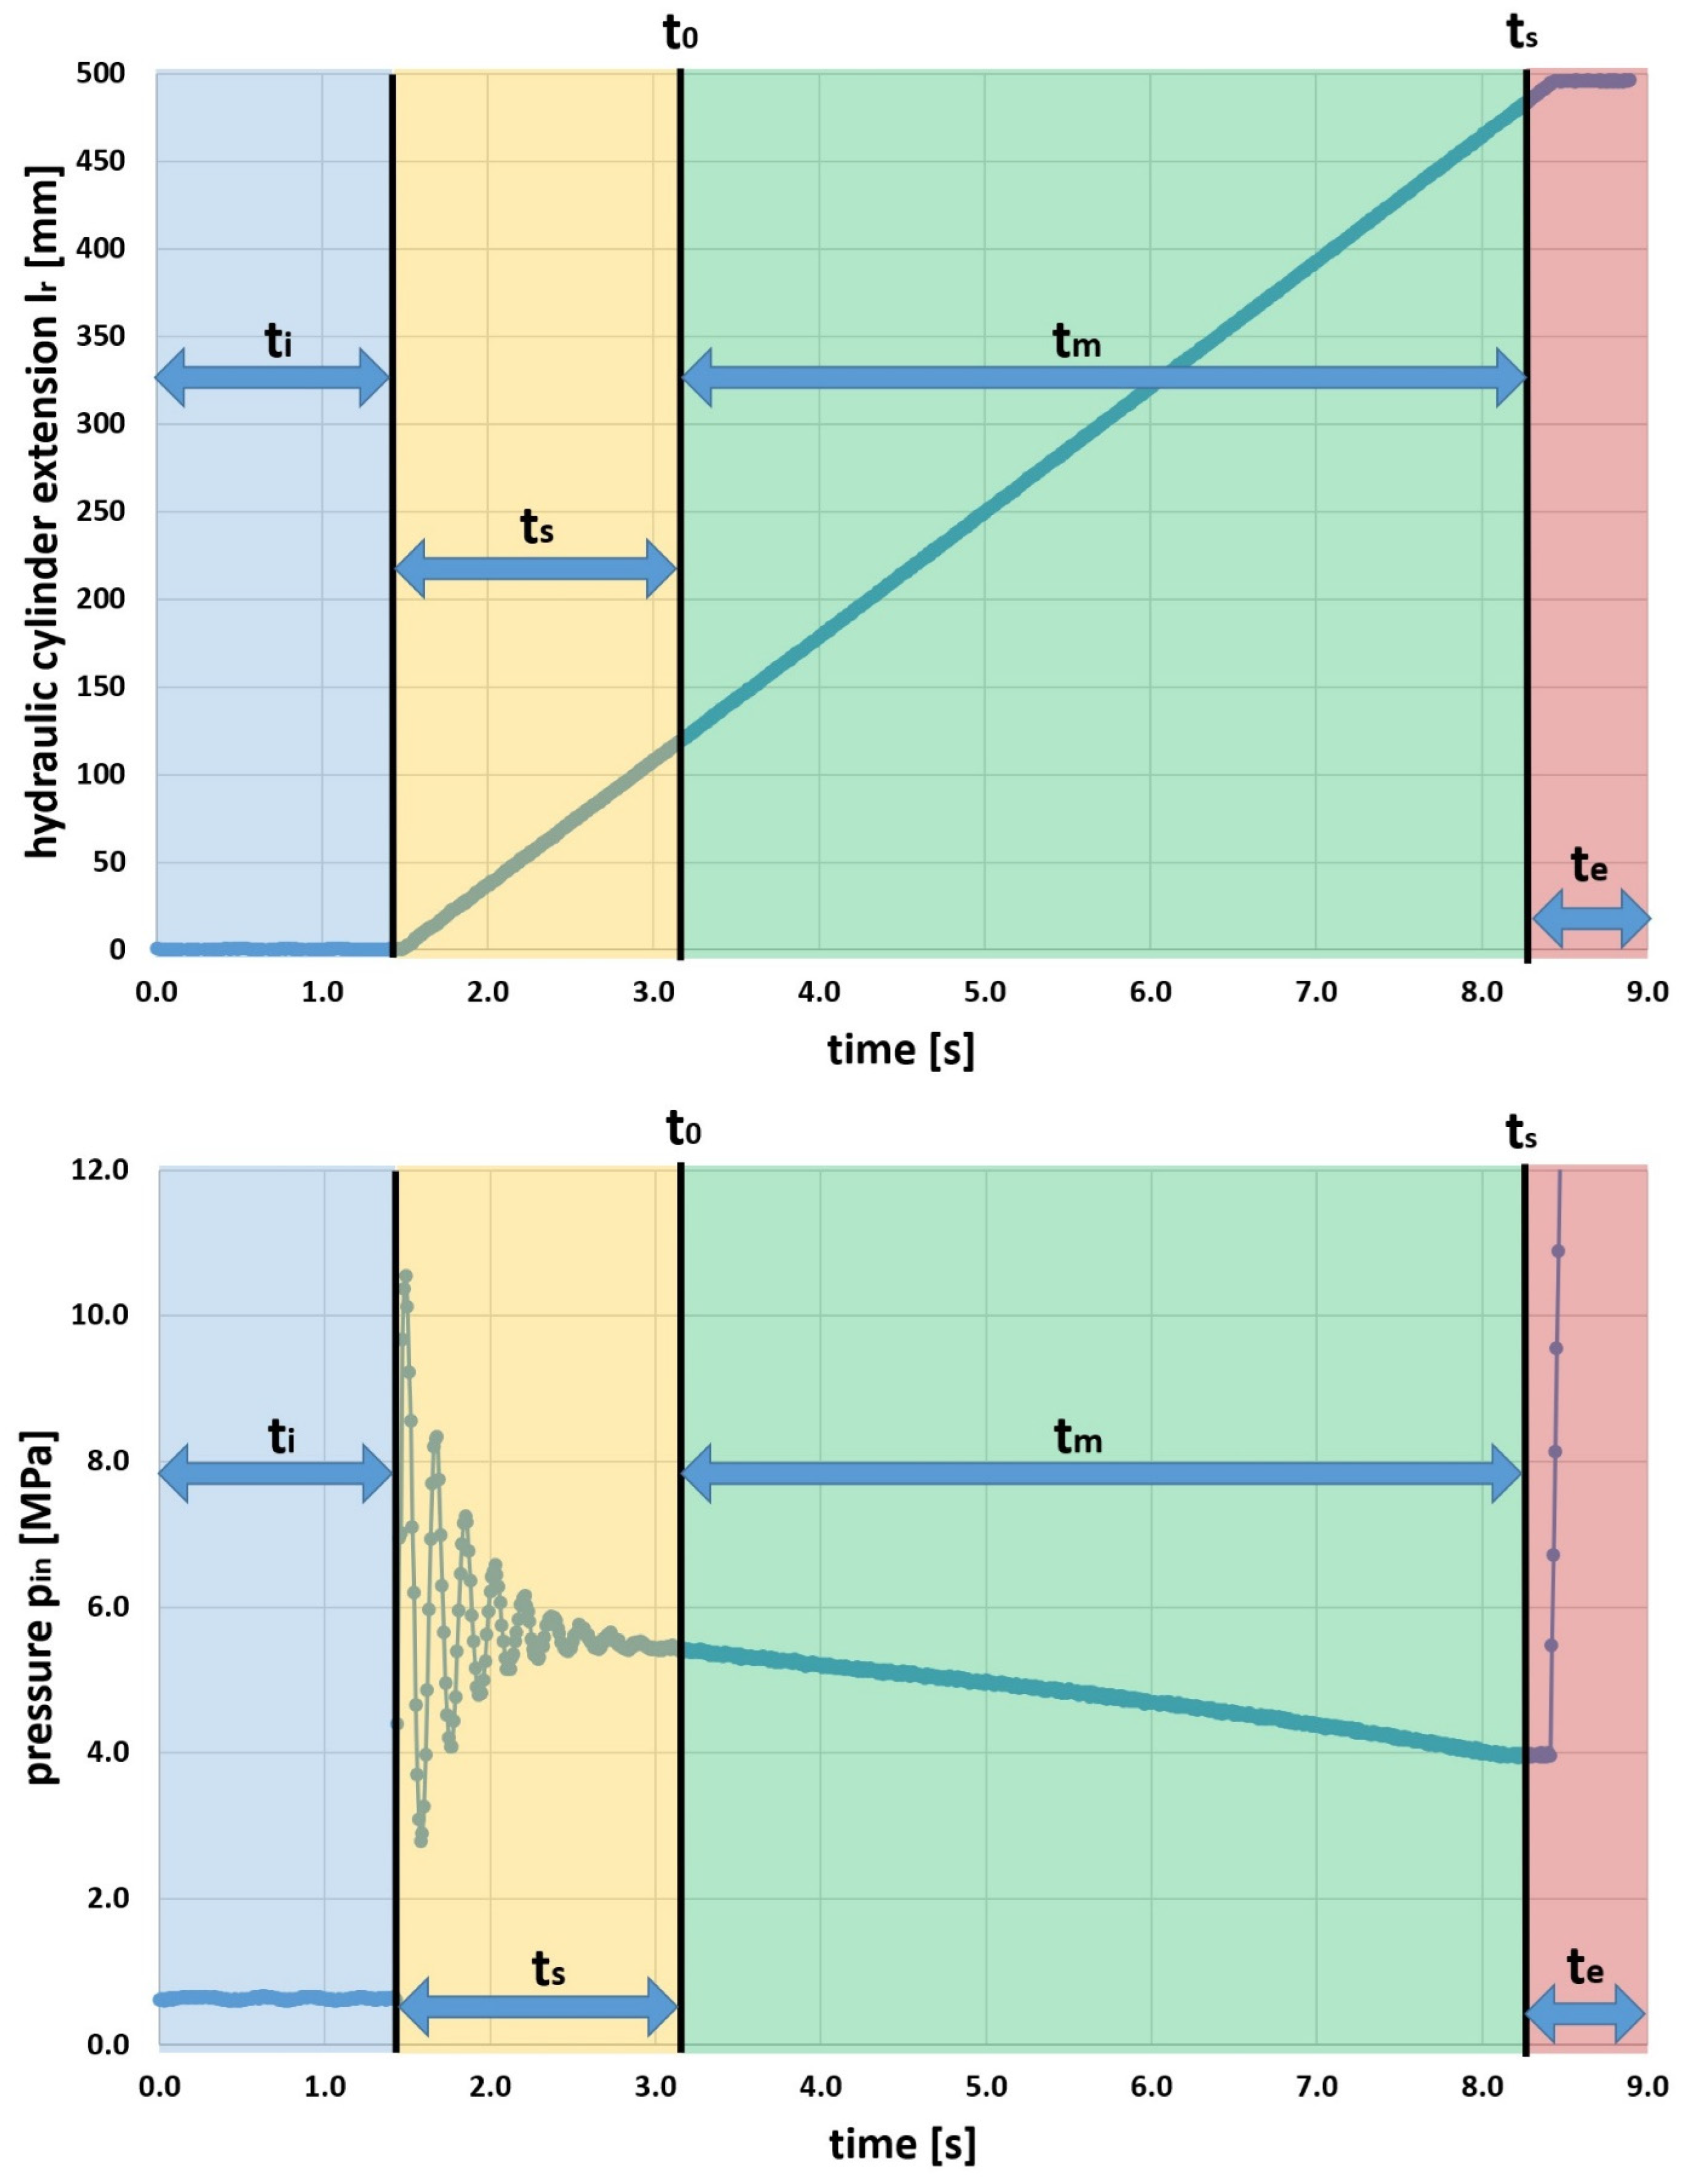
The analyzed boom lifting process can be divided into four stages:
- Before valve engagement and commencement of lifting (ti)—at this stage, the fluid from the pump flows to the reservoir via the relief valve.
- Commencement of cylinder extension movement (ts)—this stage begins at the moment the 4/3 directional control valve is shifted/actuated, directing the fluid to the lower chamber of the cylinder.
- Cylinder movement after cessation of disturbances, resulting from the dynamic interactions occurring during the commencement of motion (tm).
- Cylinder stops at the upper limit position (te).
The lifting process was conducted across the full stroke of the cylinder. A representative course of pressure changes and the corresponding hydraulic cylinder extension during the lifting cycle are shown in Figure 4. The observed time delay between the rise in supply pressure and the onset of movement results from the phenomenon of energy accumulation within the hydraulic system, as characterized in detail in previous studies [66].
Figure 4.
Sample displacement and pressure changes in the hydraulic cylinder’s piston chamber during extension.
To mitigate the influence of pressure variability during the initial phase of motion, associated with the acceleration of the system and dynamic phenomena, the range of cylinder extensions adopted for energetic analysis commenced at 120 mm and ended at an extension equal to 480 mm. These extension ranges corresponded to stable cylinder operation across all measurements performed. Tests were conducted for system temperatures ranging from 25 to 75 °C. After establishing the desired test temperature, the measurement was performed five times. By adopting the above conditions for conducting the research, it was possible to maintain the repeatability of measurements of the test object while ensuring a sufficient number of repetitions to perform basic statistical analysis. The collected results are presented in Table 2.
Table 2.
Statistical analysis of measured parameters (based on five test runs per each temperature measurement, n = 5).
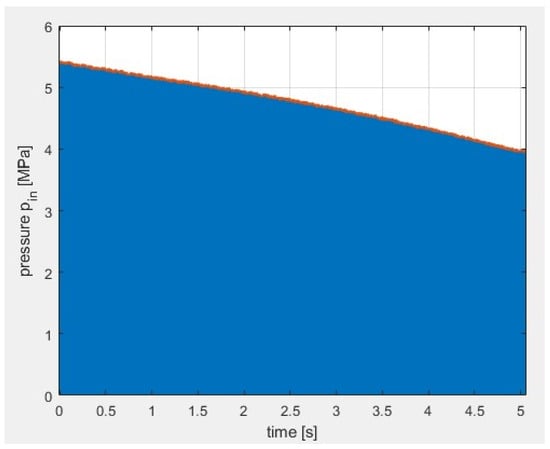
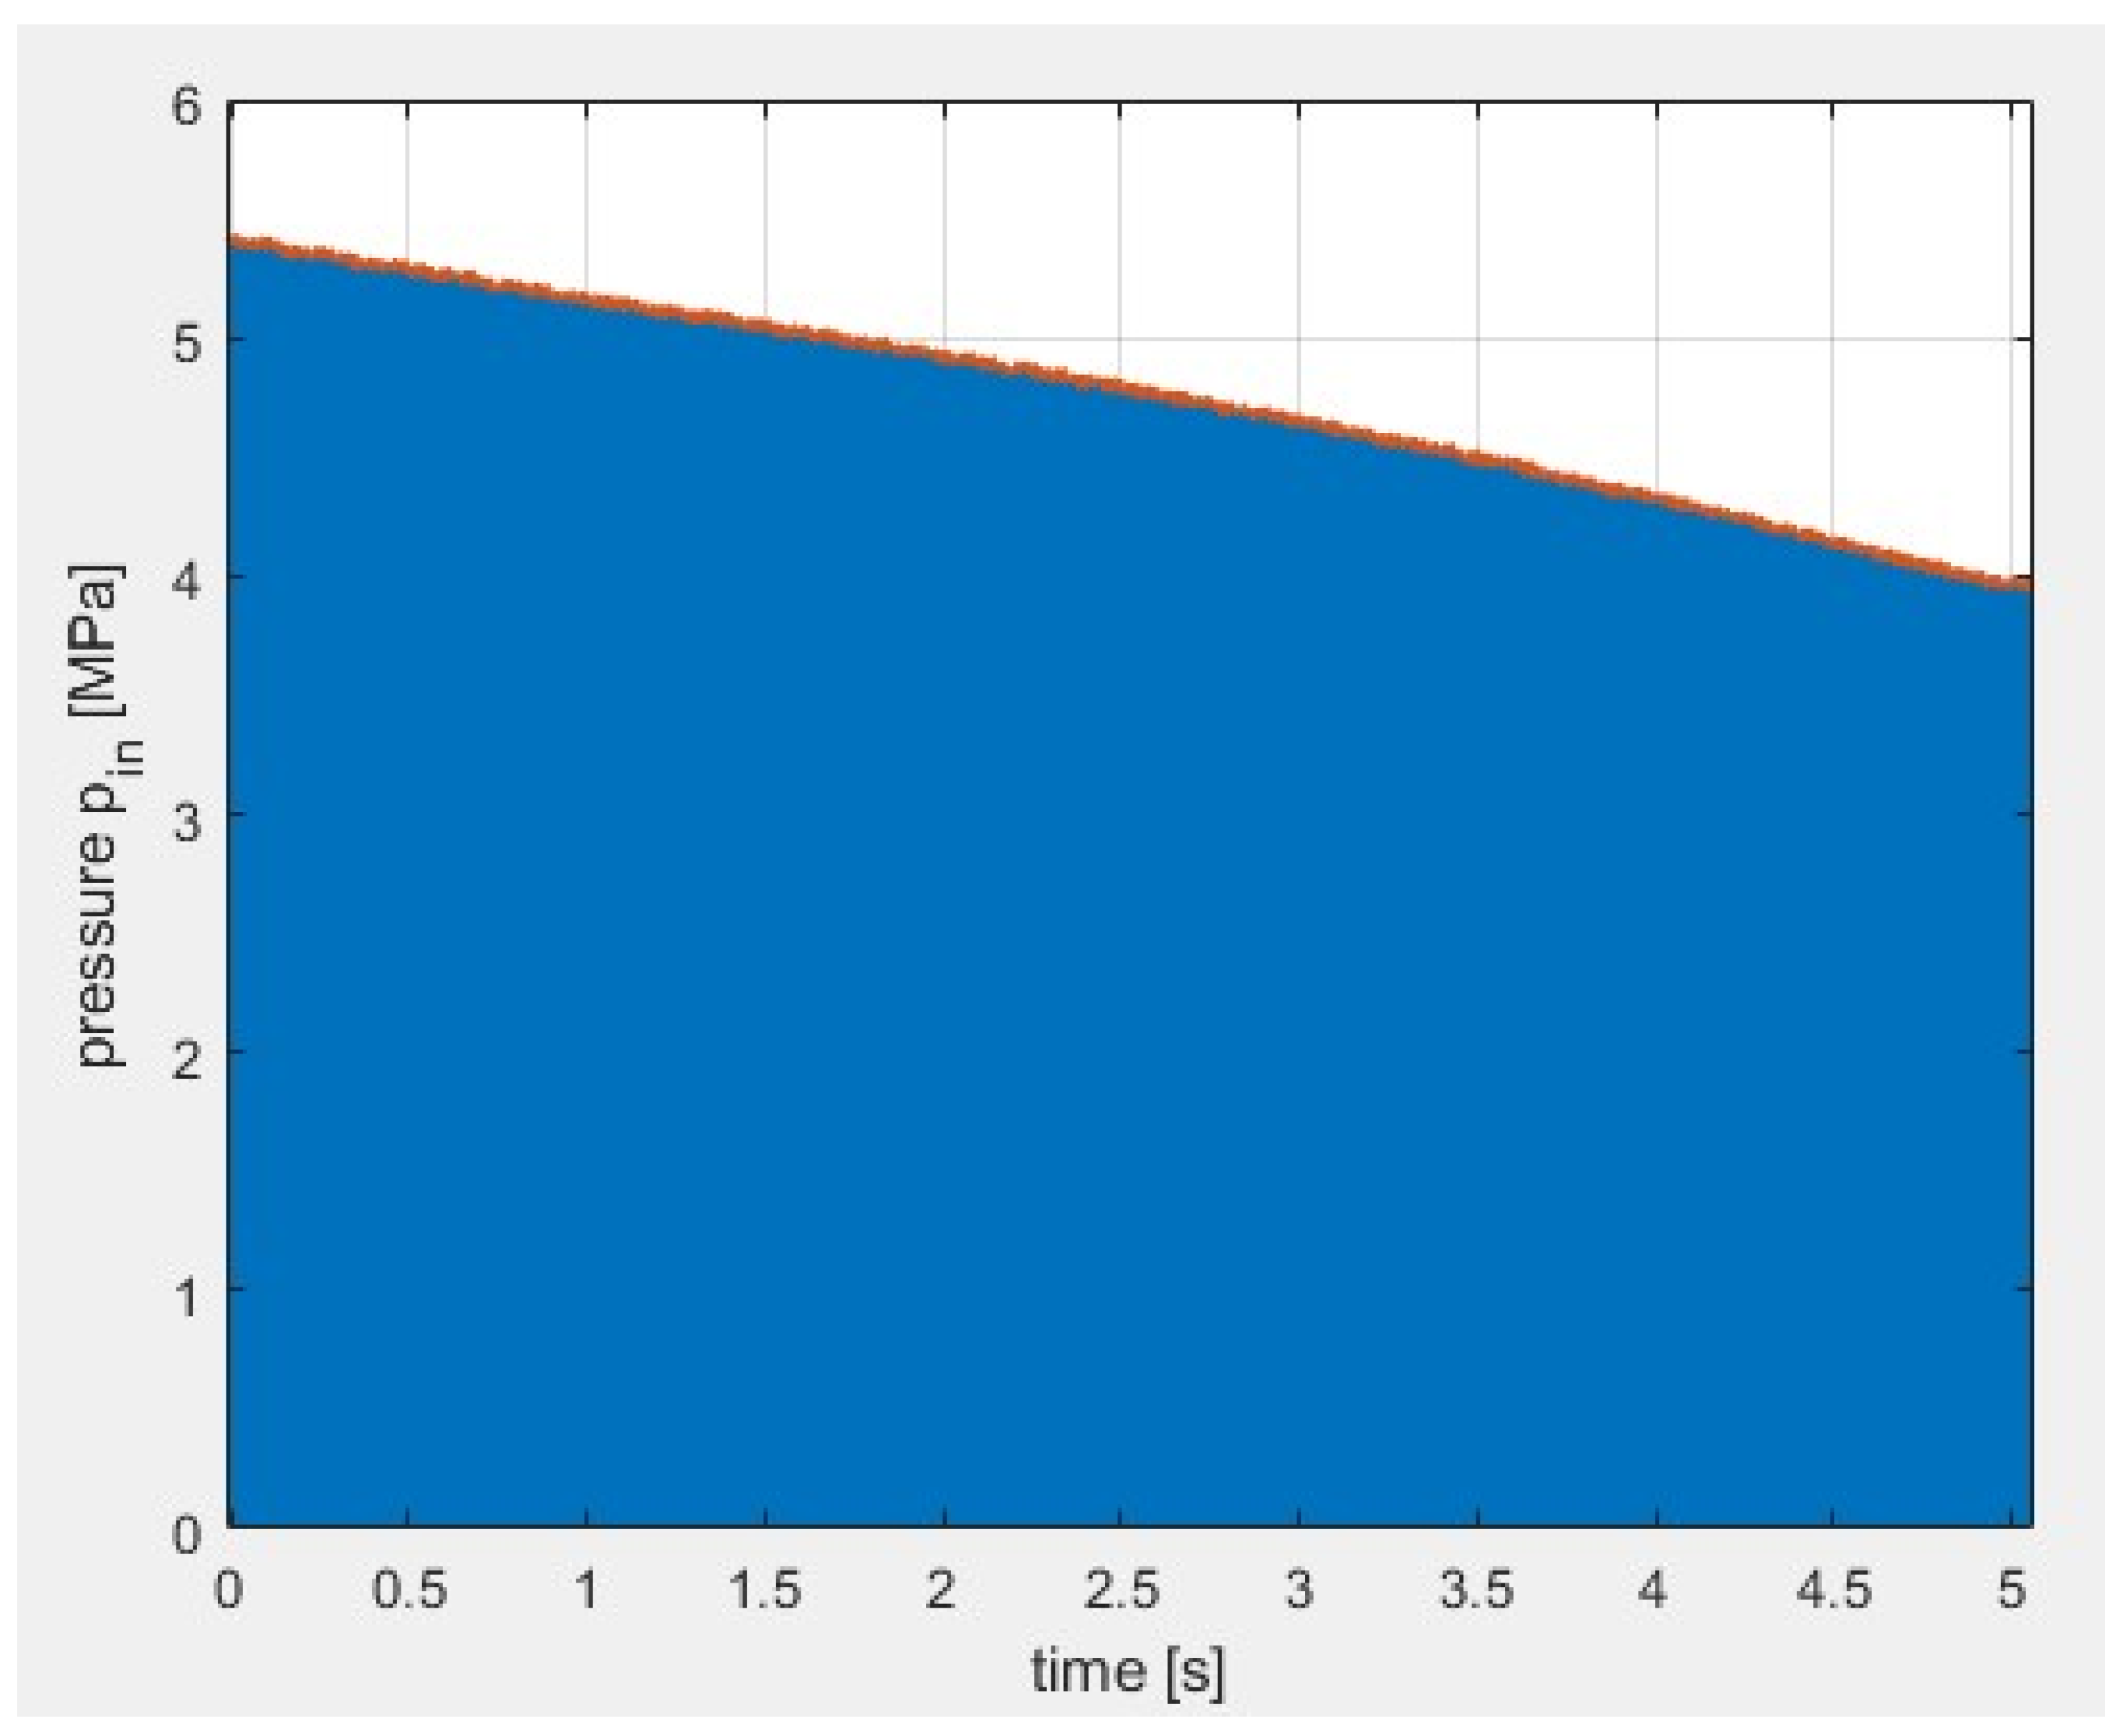
The experimentally determined time values, t0 and ts, combined with the cylinder’s geometric parameters, enabled the calculation of the average inlet (Qin) and outlet (Qout) flow rates. Additionally, the average piston velocity was derived from the recorded travel time. Subsequently, using a numerical integration method implemented in MATLAB—2023b, and specifically, the rectangle rule with a step size of 1 × 10⁻² s, the areas under the pressure curves (Figure 5) were calculated for the previously defined displacement range. The results obtained are summarized in Table 3. The obtained data allow for the determination of parameters at individual measurement points, such as cylinder extension, the area under the pressure curve, and the average flow rate, which are consistent with the previously developed mathematical model.
Figure 5.
Pressure change profile and corresponding area under the curve during cylinder movement.
Table 3.
Statistical analysis of the area under the pressure curve (n = 5).
The conducted statistical analysis indicates that the performed measurements were carried out correctly, resulting in high repeatability of the results and a relatively small confidence interval for the determined magnitudes of the areas under the pressure curves, as well as the time taken to execute the motion in the analyzed displacement range.
6. Results Analysis and Discussion
The test results obtained enable a comparative analysis of three methods, based on three different parameters, for identifying the system’s energy changes as a function of temperature variation. The analyzed parameters will be the average pressure values recorded during the tests, the determined values of hydraulic energy, and the hydraulic power within the system. The obtained values of individual parameters will be correlated with the change in hydraulic oil viscosity, determined according to standard D341—Standard Practice for Viscosity-Temperature Equations and Charts for Liquid Petroleum or Hydrocarbon Products [52]. Furthermore, the analysis of viscosity will take into account the change in oil density with temperature.
In the case of analyzing the pressure changes recorded at the supply and drain ports of the cylinder during its operation, it was assumed that the average magnitude of the pressure (pav) recorded during cylinder work would be the indicator. Simultaneously, in order to account for varying operating times, the analysis relied on the parameter of the area under the pressure curve:
In the hydraulic system, HLP class oil with the trade name RENOLIN VG 46 was used. The average pressure values for different oil temperatures, determined based on the test results, are presented in Table 4.
Table 4.
Average pressures, liquid kinematic viscosity, and their percentage changes (n = 5).
In the above analysis, percentage pressure changes at the cylinder’s supply port do not explicitly manifest the influence of fluid viscosity on flow losses, as the pressure characteristic is dominated by the external load. Nevertheless, this parameter remains essential for the final energy balance. In contrast, a pronounced dependence of the pressure drop on hydraulic oil viscosity is observed on the drain side, suggesting that this correlation is pivotal to the analysis.
To expand the scope of this study, an alternative approach based on hydraulic energy levels at both measurement points was implemented. Since the energy change is directly proportional to the area under the pressure curves, the percentage fluctuations align with the magnitudes observed in the average pressure analysis. However, an energy-based approach uniquely enables the quantification of both the effective work performed and the energy dissipated due to internal flow resistance. By applying the previously introduced mathematical model, the energy values were determined and are summarized in Table 5.
Table 5.
Average energies and their percentage changes (n = 5).
Analyzing the obtained results, it can be indicated that the energy balance confirms that the performed tests were characterized by a practically constant amount of energy utilized for work performed by the system. If the energy amount for the system’s work registered at a fluid temperature of 25 °C is taken as the baseline, the changes do not exceed 0.5%. However, a slight tendency for the work energy to decrease at temperatures up to 50 °C can be observed, and after this threshold, a slight increase occurs. This phenomenon, likely related to the operating conditions of the piston-cylinder pair and the sealing characteristics, seems to be an issue that could be further investigated in future research.
The third analytical approach investigated for determining the influence of temperature, and consequently oil viscosity, on the energy consumption of the system’s operation is the analysis at the level of the achieved power. This analysis has an advantage over the others because it enables the determination of the influence of flow rate decrease in the system, which is a result of reduced fluid viscosity and, consequently, increased volumetric losses. Furthermore, it will enable the correlation of the working motion execution time with the system’s power changes. The obtained analysis results are presented in Table 6.
Table 6.
Average powers and their percentage changes (n = 5).
The presented results indicate that, along with the increase in fluid temperature, the percentage decrease in power at the cylinder’s supply port is significantly greater than the decrease in average pressure. It can, therefore, be stated that the change in the average pressure value is an indicator of the change in flow resistance, whereas the recorded power decrease also includes the change in fluid flow rate, which results from changes in volumetric efficiency in the supply line. By identifying the total change in hydraulic power at the measurement points and, based on the changes in average pressure, the change in the level of energy losses due to flow resistance, the magnitude of the power change resulting from volumetric losses can be directly determined. In the analyzed case, the increase in fluid temperature influences an energetically favorable change in flow resistance, but also a detrimental increase in energetic volumetric losses in the supply system.
The total decrease in hydraulic power (ΔNh) can, therefore, be divided into two components:
One component of this sum describes the decrease in energy consumption resulting from the change in flow resistance (ΔNhloss), while the second component describes the power decrease due to volumetric losses (ΔNhvol) and the resulting changes in flow rate. To determine the ratio of these power components, we will rely on the results of earlier analyses of the percentage decrease in power and energy at individual measurement points (Table 7), treating the percentage indicators as parameters that define the mutual ratio of the changes in the indicated types of power relative to the values determined for a fluid temperature of 25 °C.
Table 7.
Power balance.
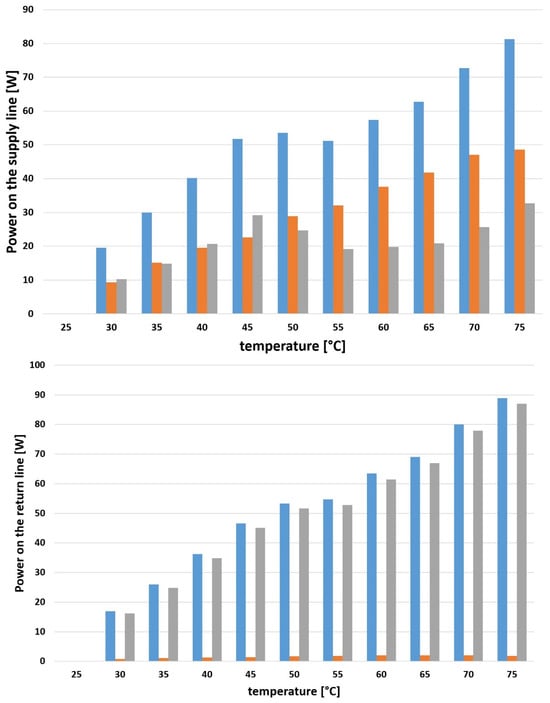
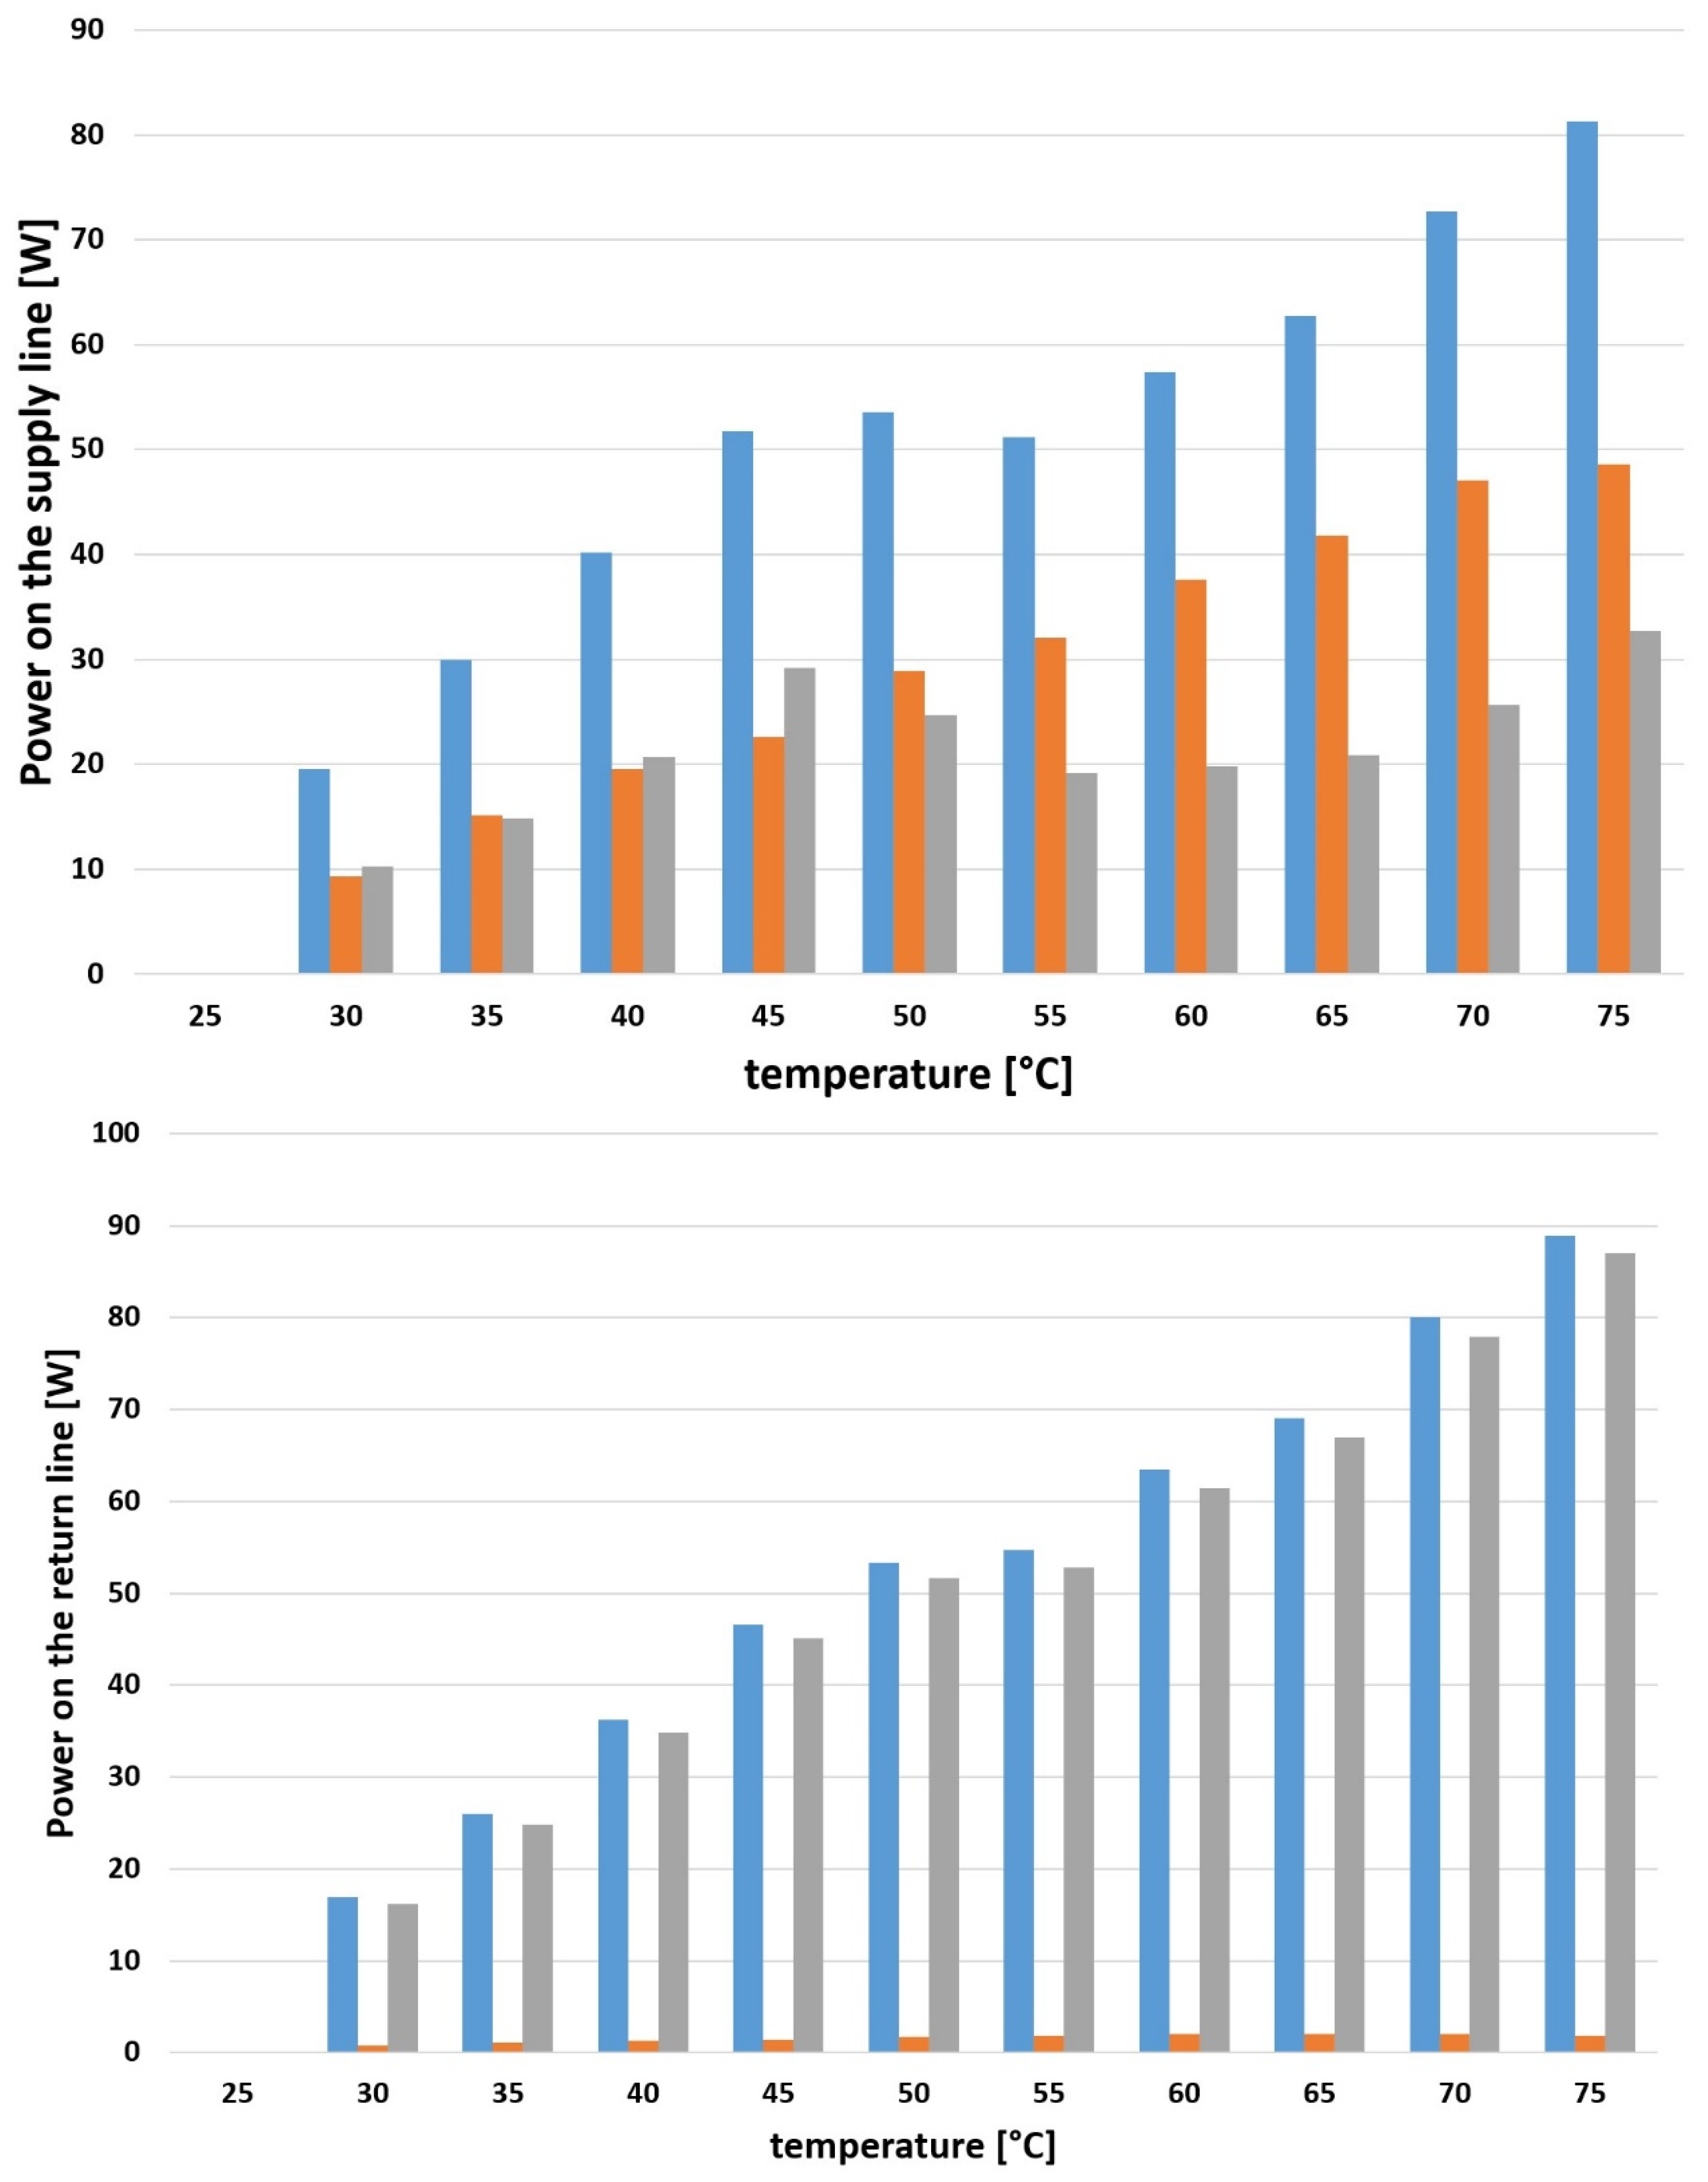
In the case of measuring energy flow through the cylinder’s drain port, the percentage changes in the average power and average pressure parameters are very close to one another. This results from the fact that virtually no volumetric losses occur in this line, and the difference in the percentage decrease is due to the change in flow rate in this line, which results from a slight change in piston speed. Thus, the power balance for the drain line directly indicates that the dominant energetic change is the reduction in flow resistance in the line. In the case of the supply port, where the power flow significantly depends on the magnitude of volumetric losses in the supply line, this ratio is more balanced (Figure 6).
Figure 6.
Power balance components: power variation from flow resistance (blue), power variation from leakage (orange), and net power balance (gray).
Analyzing the results obtained, it can be concluded that volumetric power losses on the cylinder’s supply side have a significant impact on energy balance. In the analyzed example, the increase in hydraulic oil temperature and the resulting decrease in viscosity are energetically favorable, but on the supply side, at a temperature of 75 °C, the total power decrease in the system was less than 33 W, which translates to less than 2% of the hydraulic power recorded at the supply port. The reduction in fluid viscosity is directly energetically favorable only in the system’s drain line.
In industrial practice, it seems possible for a phenomenon to occur where an increase in volumetric loss power is greater than a change in flow resistance due to a temperature rise in the hydraulic system. Furthermore, as shown by the research, directly linking the change in the fluid viscosity parameter with expected energetic benefits can lead to erroneous results. The structure of the hydraulic system, the parameters of the supply and drain lines, and the volumetric efficiencies of pumps and valves are the key aspects. Consequently, by using the presented energetic analysis method, parameters critical to any hydrostatic system can be identified.
7. Conclusions
This article presents an extended energetic analysis method for hydrostatic power transmission systems, enabling a determination of actual energy fluctuations as a function of hydraulic oil temperature. The research conducted and the resulting analyses led to the following key conclusions:
- The method effectively integrates flow resistance variations and volumetric losses, providing a comprehensive view of energy transitions. By measuring fundamental parameters such as pressure and cycle duration, the approach allows for a precise identification of the energy balance without the need for overly complex instrumentation.
- This study demonstrates that the correlation between energetic changes and fluid viscosity is not uniform across the system. While a direct correlation is valid for the drain line, it is insufficient for the supply side. Specifically, for a 50 °C temperature increase, the actual hydraulic power on the supply side changed by only 2%, whereas the useful mechanical power simultaneously decreased by 2.53%, highlighting the critical role of volumetric losses.
- The proposed method serves as a robust tool for identifying power balances at both the design and operational stages, offering a foundation for more accurate efficiency predictions and real-time energetic state monitoring.
Despite the insights gained, this study is subject to certain limitations. The experimental verification was conducted using a specific type of hydraulic oil (RENOLIN VG 46) under a single load condition; therefore, the generalizability of the findings to other fluid types or varying load profiles requires further verification. Additionally, this study focuses on energetic fluctuations and does not account for the long-term impact of oil temperature variations on component wear, particularly regarding seal durability.
It should be emphasized that while the empirical validation of the developed mathematical and physical models was conducted using a specific test rig configuration with a single circuit, a fixed load, and one hydraulic oil grade, the power balance approach itself is inherently universal. The fundamental value of this methodology lies in its shifting of focus away from the identification of changes in individual components toward a broader, systemic perspective. As demonstrated, this energy-based framework enables the comprehensive evaluation of even complex hydrostatic architectures while operating with a significantly limited number of measurement parameters. In this research, the specific experimental setup served as a successful benchmark to map the structural distribution of energy losses between the supply and drain lines. The scalable nature of the proposed approach makes it a highly useful diagnostic tool for the energetic optimization of diverse industrial fluid power systems under varying operating conditions.
Future research can be extended to investigate the performance of bio-based hydraulic oils and operations under extreme, wide-temperature-range conditions. Furthermore, there is significant potential to combine the proposed method with Artificial Intelligence (AI) technology. This would enable the development of advanced control systems for real-time energy efficiency optimization, dynamically adjusting system parameters based on instantaneous oil temperature and fluid state.
Funding
This research received no external funding.
Data Availability Statement
The original contributions presented in this study are included in the article. Further inquiries can be directed to the corresponding author.
Acknowledgments
The author would like to thank ZHS HYDROMAR Sp. z o.o. in Szamotuły, Poland, for their cooperation on research and development projects performed in the Laboratory of Working Machines and Fluid Systems Diagnostics at Wrocław University of Science and Technology.
Conflicts of Interest
The author declares no conflicts of interest.
References
- Standard ISO 18464:2025; Hydraulic Fluid Power—Design Methodology for Energy Efficient Systems. ISO: Geneva, Switzerland, 2025. Available online: https://www.iso.org/standard/85295.html (accessed on 12 September 2025).
- Breidi, F.; Garrity, J.; Lumkes, J. Design and Testing of Novel Hydraulic Pump/Motors to Improve the Efficiency of Agricultural Equipment. Trans. ASABE 2017, 60, 1809–1817. [Google Scholar] [CrossRef] [Scilit]
- Kauranne, H. Effect of Operating Parameters on Efficiency of Swash-Plate Type Axial Piston Pump. Energies 2022, 15, 4030. [Google Scholar] [CrossRef] [Scilit]
- Novaković, B.; Radovanović, L.; Zuber, N.; Radosav, D.; Đorđević, L.; Kavalić, M. Analysis of the Influence of Hydraulic Fluid Quality on External Gear Pump Performance. Eksploat. I Niezawodn. 2022, 24, 260–268. [Google Scholar] [CrossRef] [Scilit]
- Koralewski, J. Influence of Hydraulic Oil Viscosity on the Volumetric Losses in a Variable Capacity Piston Pump. Pol. Marit. Res. 2011, 3, 55–65. [Google Scholar] [CrossRef] [Scilit]
- Choi, M.; Lee, C.; Park, S.; Hwang, M.; Oh, H. Frequency-Enhanced Network with Self-Supervised Learning for Anomaly Detection of Hydraulic Piston Pumps. Expert Syst. Appl. 2025, 282, 127662. [Google Scholar] [CrossRef] [Scilit]
- Tab Vestal, P.E.; Steffan, A. Pump BLEVE Protection Initiator Determination. In Proceedings of the 14th Global Congress on Process Safety, Orlando, FL, USA, 22–25 April 2018; pp. 1596–1617. [Google Scholar]
- Li, W.; Zhang, Y. The Vortex Pump Under Highly Viscous Liquid Flow Conditions. Arab. J. Sci. Eng. 2018, 43, 4739–4761. [Google Scholar] [CrossRef] [Scilit]
- Skorek, G. Friction Losses in a Linear Hydraulic Motor as a Result of the Influence of the Control Structure and Oil Viscosity. J. KONES Powertrain Transp. 2018, 25, 377–384. [Google Scholar] [CrossRef] [Scilit]
- Hashim, W.M.; Al-Salihi, H.A.; Al Zubaidi, F.N. Effects of Temperature on the Properties of HL32 Oil in the Conventional Hydraulic Actuators. Heliyon 2022, 8, 11831. [Google Scholar] [CrossRef] [Scilit] [PubMed]
- Gaiola, A.; Zardin, B.; Casoli, P.; Borghi, M.; Mazzali, F.; Pintore, F.; Fiorati, S. The Hydraulic Power Generation and Transmission on Agricultural Tractors: Feasible Architectures to Reduce Dissipation and Fuel Consumption—Part I. E3S Web Conf. 2020, 197, 7009. [Google Scholar] [CrossRef] [Scilit]
- Casoli, P.; Zardin, B.; Ardizio, S.; Borghi, M.; Pintore, F.; Mesturini, D. The Hydraulic Power Generation and Transmission on Agricultural Tractors: Feasible Architectures to Reduce Dissipation and Fuel Consumption—Part 2. E3S Web Conf. 2020, 197, 7010. [Google Scholar] [CrossRef] [Scilit]
- Casoli, P.; Scolari, F.; Vescovini, C.M.; Mesturini, D.; Zannoni, F. Excavator Hydraulic Circuit Solution to Reduce Dissipations and Fuel Consumption. E3S Web Conf. 2021, 312, 5004. [Google Scholar] [CrossRef] [Scilit]
- Gao, J.; Yan, G.; Peng, G.; Xi, G. Experiment Study on Performances of Servo Pump Used in Hydraulic Press Machine. Adv. Mater. Res. 2012, 516–517, 892–895. [Google Scholar] [CrossRef] [Scilit]
- Do, T.C.; Dang, T.D.; Ahn, K.K. Efficiency Improvement of a Hydraulic Power Take-off of Wave Energy Converter Using Variable Displacement Motor. Int. J. Precis. Eng. Manuf.-Green Technol. 2022, 9, 1087–1099. [Google Scholar] [CrossRef] [Scilit]
- Berne, L.J.; Raush, G.; Gamez-Montero, P.J.; Roquet, P.; Codina, E. Multi-Point-of-View Energy Loss Analysis in a Refuse Truck Hydraulic System. Energies 2021, 14, 2702. [Google Scholar] [CrossRef] [Scilit]
- Da Silva Bravo, R.R.; De Cantuaria Gama, A.T.; Oliveira, A.A.M.; De Negri, V.J. Component Sizing and Sensitivity Analysis of Design Parameters of a Hydraulic-Pneumatic Regenerative Braking System for Heavy Duty Vehicles. Energy 2023, 264, 126021. [Google Scholar] [CrossRef] [Scilit]
- Rakhutin, M.G.; Khanh, G.Q.; Krivenko, A.E.; Van Hiep, T. Evaluation of the Influence of the Hydraulic Fluid Temperature on Power Loss of the Mining Hydraulic Excavator. J. Min. Inst. 2023, 261, 374–383. [Google Scholar]
- Gupta, N.; Kini, P.; Gupta, S.; Darbari, H.; Joshi, N.; Khosravy, M. Six Sigma Based Modeling of the Hydraulic Oil Heating Under Low Load Operation. Eng. Sci. Technol. Int. J. 2021, 24, 11–21. [Google Scholar] [CrossRef] [Scilit]
- Novaković, B.Z.; Djordjević, L.; Đurđev, M.; Radovanović, L.; Zuber, N.; Desnica, E.; Bakator, M. Effect of Changes in Hydraulic Parameters and Tank Capacity of the Hydraulic Press System on the Heating of the Hydraulic Oil. Eksploat. I Niezawodn. 2024, 26, 190826. [Google Scholar] [CrossRef] [Scilit]
- Siddique, M.A.A.; Kim, W.-S.; Kim, Y.-S.; Kim, T.-J.; Choi, C.-H.; Lee, H.-J.; Chung, S.-O.; Kim, Y.-J. Effects of Temperatures and Viscosity of the Hydraulic Oils on the Proportional Valve for a Rice Transplanter Based on PID Control Algorithm. Agriculture 2020, 10, 73. [Google Scholar] [CrossRef] [Scilit]
- Ganassi, G.; Mesturini, D.; Dolcin, C.; Bonavolontà, A.; Frosina, E.; Marani, P. Viable Energy Recovery Strategies Through Advanced Directional Control Valve. Int. J. Fluid Power 2023, 24, 361–392. [Google Scholar] [CrossRef] [Scilit]
- Tyni, T.; Vepsäläinen, J. Hydraulic Hybrid System Coupling Traction Motor and Working Hydraulics of Electric Wheel Loader. Energy 2025, 332, 137217. [Google Scholar] [CrossRef] [Scilit]
- Bonavolontà, A.; Mesturini, D.; Dolcin, C.; Marani, P.; Frosina, E.; Senatore, A. Downstream Compensator: Innovative Systems, Modeling Analysis and Energy Optimization. E3S Web Conf. 2020, 197, 7003. [Google Scholar] [CrossRef] [Scilit]
- Bonavolontà, A.; Frosina, E.; Marani, P.; Mesturini, D.; Dolcin, C.; Busani, U. Experimental and Modelling Analysis of a Downstream Compensation System: Energy Optimization of the Directional Control Valves. Int. J. Fluid Power 2023, 24, 99–124. [Google Scholar] [CrossRef] [Scilit]
- Tan, L.; He, X.; Xiao, G.; Jiang, M.; Yuan, Y. Design and Energy Analysis of Novel Hydraulic Regenerative Potential Energy Systems. Energy 2022, 249, 123780. [Google Scholar] [CrossRef] [Scilit]
- Zhang, L.; Zhang, H.; Zhang, Z.; Zhou, J.; Yang, J. Research on the RBF Control Strategy Based on Dual-Layer Particle Swarm Optimization in a Novel Electro-Mechanical-Hydraulic Power Coupling Vehicle. Energy 2025, 326, 136247. [Google Scholar] [CrossRef] [Scilit]
- Mahato, A.C.; Ghoshal, S.K. An Overview of Energy Savings Approaches on Hydraulic Drive Systems. Int. J. Fluid Power 2020, 21, 81–118. [Google Scholar] [CrossRef] [Scilit]
- Oh, J.-Y.; Jung, G.-H.; Lee, G.-H.; Park, Y.-J.; Song, S.C. Modeling and Characteristics Analysis of Single-Rod Hydraulic System Using Electro-Hydrostatic Actuator. Int. J. Precis. Eng. Manuf. 2012, 13, 1445–1451. [Google Scholar] [CrossRef] [Scilit]
- Siefert, J.; Li, P.Y. Optimal Control of the Energy-Saving Hybrid Hydraulic-Electric Architecture (HHEA) for Off-Highway Mobile Machines. IEEE Trans. Control. Syst. Technol. 2022, 30, 2018–2029. [Google Scholar] [CrossRef] [Scilit]
- Fassbender, D.; Brach, C.; Minav, T. Energy-Efficiency Comparison of Different Implement Powertrain Concepts to Each Other and Between Different Heavy-Duty Mobile Machines. Int. J. Fluid Power 2024, 25, 127–144. [Google Scholar] [CrossRef] [Scilit]
- Padovani, D.; Rundo, M.; Fresia, P.; Altare, G. Energy Analysis of a Hybrid Electro-Hydraulic System for Efficient Mobile Hydraulics. J. Phys. Conf. Ser. 2023, 2648, 012051. [Google Scholar] [CrossRef] [Scilit]
- Benić, J.; Brezak, D.; Šitum, Ž.; Kolar, D.; Lisjak, D. Detailed Experimental Comparison of Energy Efficiency Between Proportional and Direct Driven Hydraulic System. Results Eng. 2023, 18, 101178. [Google Scholar] [CrossRef] [Scilit]
- Tiboni, M. Power Drive Architectures for Industrial Hydraulic Axes: Energy-Efficiency-Based Comparative Analysis. Appl. Sci. 2023, 13, 10066. [Google Scholar] [CrossRef] [Scilit]
- Singh, V.P.; Olesen, E.N.; Pedersen, H.; Minav, T. Experimental Evaluation of a Novel Electro-Hydrostatic Steering Solution for Off-Road Mobile Machinery. Energy Convers. Manag. 2025, 332, 119710. [Google Scholar] [CrossRef] [Scilit]
- Lovrec, D.; Tic, V.; Tasner, T. Dynamic Behaviour of Different Hydraulic Drive Concepts—Comparison And Limits. Int. J. Simul. Model. 2017, 16, 448–457. [Google Scholar] [CrossRef] [Scilit]
- Merkelbach, S.; Otto, N.; Schmitz, K. The Heat Balance of a Hydraulic System. O+P Fluidtechnik 2020, 64, 48–57. [Google Scholar]
- Zhang, Q.; Liu, X.; Tong, Z.; Cheng, Z. Research on Heat Generation Law and Cooling System Performance of Hydraulic System of Combined Machine Tool. Energies 2023, 16, 7322. [Google Scholar] [CrossRef] [Scilit]
- Tong, X.; Fu, Y.; Li, Z.; Xu, Y.; Cao, A. Calculation of Temperature Control and Heat Dissipation in Hydraulic System. In Lecture Notes in Mechanical Engineering; Springer: Singapore, 2024; pp. 496–504. [Google Scholar] [CrossRef] [Scilit]
- Niu, Y.; Gu, X.; Yue, X.; Zheng, Y.; He, P.; Chen, Q. Research on Thermodynamic Characteristics of Hydraulic Power Take-Off System in Wave Energy Converter. Energies 2022, 15, 1373. [Google Scholar] [CrossRef] [Scilit]
- Karlén, N.; Minav, T.; Pietola, M. Investigation of Thermal Effects in Direct Driven Hydraulic System for Off-Road Machinery. In Proceedings of the 9th FPNI Ph.D. Symposium on Fluid Power, Florianópolis, Brazil, 26–28 October 2016. [Google Scholar] [CrossRef] [Scilit]
- Minav, T.; Heikkinen, J.; Schimmel, T.; Pietola, M. Direct Driven Hydraulic Drive: Effect of Oil on Efficiency in Sub-Zero Conditions. Energies 2019, 12, 219. [Google Scholar] [CrossRef] [Scilit]
- Michael, P.; Dai, C.; Rodriguez, K. Fluid Property Effects on Power Consumption in a Hydraulic System at Low Temperatures. In Proceedings of the BATH/ASME 2020 Symposium on Fluid Power and Motion Control, Online, 9–11 September 2020. [Google Scholar] [CrossRef] [Scilit]
- Skorek, G. Influence of Hydraulic Oil Viscosity on the Energy Efficiency of Hydrostatic Drive. J. KONBiN 2022, 52, 11–30. [Google Scholar] [CrossRef] [Scilit]
- Wang, W.; Chen, J.; Lin, P.; Guo, J.; Wang, Y.; Zhou, P.; Zhou, J.; Chen, D.; Deng, Y.; Chen, C. Experimental Investigation into the Effects of Deep-Sea Environment on Thermophysical Properties of Hydraulic System Working Fluids. J. Mar. Sci. Eng. 2025, 13, 630. [Google Scholar] [CrossRef] [Scilit]
- Wu, J.-B.; Li, L. Pipeline Pressure Loss in Deep-Sea Hydraulic Systems Considering Pressure-Dependent Viscosity Change of Hydraulic Oil. J. Mar. Sci. Eng. 2021, 9, 1142. [Google Scholar] [CrossRef] [Scilit]
- Chen, S. Waste Heat Recovery and Reuse for Ship Hydraulic Oil Temperature Control System. Therm. Sci. 2023, 27, 1257–1263. [Google Scholar] [CrossRef] [Scilit]
- Burecek, A.; Hruzík, L.; Vasina, M. Evaluation of Oil Viscosity Influence on Hydraulic Shock in Long Pipe. Appl. Mech. Mater. 2014, 630, 85–90. [Google Scholar] [CrossRef] [Scilit]
- Xie, W.; Chen, L.; Xia, Z.; Wang, F.; Ou, J.; Liu, W.; Liang, X.; Liu, J.; Liu, Z. Method for Exploiting High-viscosity and High-pour-point Crude Oil. J. Phys. Conf. Ser. 2021, 1838, 12040. [Google Scholar] [CrossRef] [Scilit]
- Soto-Castruita, E.; Ramírez-González, P.V.; Martínez-Cortés, U.; Quiñones-Cisneros, S.E. Effect of the Temperature on the Non-Newtonian Behavior of Heavy Oils. Energy Fuels 2015, 29, 2883–2889. [Google Scholar] [CrossRef] [Scilit]
- Nadia, M.; Hadjadj, A.; Ferroudji, H. Numerical Study of Temperature and Pressure Effects of a Yield-Power Law Fluid Flow on Frictional Pressure Losses for Laminar and Turbulent Regimes. Pet. Sci. Technol. 2024, 42, 1451–1467. [Google Scholar] [CrossRef] [Scilit]
- Standard D341; Standard Practice for Viscosity-Temperature Equations and Charts for Liquid Petroleum or Hydrocarbon Products. 2020. Available online: https://store.astm.org/d0341-20e01.html (accessed on 11 September 2025).
- Standards E ISO 2909:2002; Petroleum Products—Calculation of Viscosity Index from Kinematic Viscosity. ISO: Geneva, Switzerland, 2022. Available online: https://www.en-standard.eu/iso-2909-2002-petroleum-products-calculation-of-viscosity-index-from-kinematic-viscosity/ (accessed on 12 September 2025).
- Stanciu, I. Some Methods for Determining the Viscosity Index of Hydraulic Oil. Indian J. Sci. Technol. 2023, 16, 254–258. [Google Scholar] [CrossRef] [Scilit]
- Vozárová, V.; Petrović, A.; Csillag, J.; Božiková, M.; Híreš, Ľ.; Valach, M. Dynamic Viscosity and Pour Point of Hydraulic Oils. In Proceedings of the 6th International Conference on Trends in Agricultural Engineering, Prague, Czech Republic, 7–9 September 2016; pp. 703–707. [Google Scholar]
- Bair, S.; Michael, P. Modeling the Pressure and Temperature Dependence of Viscosity and Volume for Hydraulic Fluids. Int. J. Fluid Power 2010, 11, 37–42. [Google Scholar] [CrossRef] [Scilit]
- Gierz, Ł.; Perz, K.; Wieczorek, B.; Peixoto, M.C.; Warguła, Ł. Kinematic Viscosity of Engine, Gear, Hydraulic and Special Purpose Oils at Temperatures of 25 °C and 50 °C. Mater. Mech. Eng. Technol. 2024, 3, 11–16. [Google Scholar] [CrossRef] [Scilit]
- Shen, W.; Zhang, J.; Sun, Y.; Zhang, D.; Jiang, J. Effect of Cavitation Bubble Collapse on Hydraulic Oil Temperature. J. Cent. South Univ. 2016, 23, 1657–1668. [Google Scholar] [CrossRef] [Scilit]
- Al-Issa, A.; Weber, J. Predicting Hydraulic Oil Thermophysical Properties Using Physics-Informed Neural Networks. Int. J. Fluid Power 2024, 25, 59–88. [Google Scholar] [CrossRef] [Scilit]
- Quilumba, F.L.; Lee, L.K.; Lee, W.-J.; Harding, A. Improving Hydraulic System Energy Efficiency with High-Performance Hydraulic Fluids. IEEE Trans. Ind. Appl. 2014, 50, 1313–1321. [Google Scholar] [CrossRef]
- Deuster, S.; Schmitz, K. Bio-Based Hydraulic Fluids and the Influence of Hydraulic Oil Viscosity on the Efficiency of Mobile Machinery. Sustainability 2021, 13, 7570. [Google Scholar] [CrossRef] [Scilit]
- Śliwiński, P. The Influence of Water and Mineral Oil on Volumetric Losses in the Displacement Pump for Offshore and Marine Applications. Pol. Marit. Res. 2019, 26, 173–182. [Google Scholar] [CrossRef] [Scilit]
- Fan, Y.; Huang, J. Performance Influence of Fluid Viscosity on the Single-Phase Fluid Loop. In Proceedings of the International Astronautical Federation—58th International Astronautical Congress, Hyderabad, India, 24–28 September 2007; pp. 5604–5608. [Google Scholar]
- Ketelsen, S.; Michel, M.; Andersen, T.O.; Ebbesen, M.K.; Weber, J.; Schmidt, L. Thermo-Hydraulic Modelling and Experimental Validation of an Electro-Hydraulic Compact Drive. Energies 2021, 14, 2375. [Google Scholar] [CrossRef] [Scilit]
- Al-Issa, A.; Schulze, T.; Weber, J. Rapid Thermal Energy Modeling and Analysis of Complex Industrial Hydraulic Systems. Int. J. Fluid Power 2025, 26, 65–98. [Google Scholar] [CrossRef] [Scilit]
- Siwulski, T. Experimental Tests on the Influence of Accumulated Pressure Energy on the Response Time of a Hydraulic Cylinder under External Load Actuated in a Classic and Distributed System Structure. Energies 2023, 16, 7696. [Google Scholar] [CrossRef] [Scilit]

Disclaimer/Publisher’s Note: The statements, opinions and data contained in all publications are solely those of the individual author(s) and contributor(s) and not of MDPI and/or the editor(s). MDPI and/or the editor(s) disclaim responsibility for any injury to people or property resulting from any ideas, methods, instructions or products referred to in the content. |
© 2026 by the author. Licensee MDPI, Basel, Switzerland. This article is an open access article distributed under the terms and conditions of the Creative Commons Attribution (CC BY) license.