


Abstract
The integration of wind energy into urban environments is constrained by low wind speeds, high turbulence, and the recurrent negative torque experienced by lift-driven vertical-axis wind turbines (VAWTs). This study specifically evaluates a straight-bladed H-Darrieus rotor equipped with a single upstream passive flat-plate deflector for the wind regime measured on the campus of the Universidad Nacional Mayor de San Marcos (Lima, Peru). A three-dimensional transient CFD model using the SST k–ω turbulence model was applied to compare the baseline rotor and the deflector-assisted configuration under identical operating conditions; DMST calculations were used only as a low-order cross-check for the bare rotor performance trend, not as a substitute for experimental validation. The deflector was selected after a geometric sensitivity assessment and positioned at 30° relative to the incoming flow, with a span equal to the rotor height and a length comparable to the rotor diameter. At TSR = 2.5, the maximum power coefficient increased from 0.4459 for the bare rotor to 0.6153 with the deflector, equivalent to an improvement of approximately 38%. Velocity and pressure fields show that the deflector accelerates the flow toward the advancing blade while shielding the returning blade, thereby reducing adverse torque and smoothing cyclic torque fluctuations. The results define the applicability of the proposed passive device for low-to-moderate urban wind environments with a dominant wind sector and provide a reproducible numerical basis for subsequent wind-tunnel and field validation.
1. Introduction
The rapid growth in global demand for clean energy has accelerated the expansion of renewable energy systems worldwide, positioning wind energy as a cornerstone of the ongoing energy transition [1]. Multiple large-scale assessments indicate that wind technologies will account for the majority of new electricity capacity additions in the coming decades, reflecting their technological maturity and declining costs [2]. Recent studies show that global wind power capacity has expanded at sustained double-digit annual growth rates [3] and is projected to increase substantially under net-zero emissions pathways [4]. Wind power is now widely recognized as one of the most cost-competitive sources of low-carbon electricity and a key contributor to greenhouse gas mitigation strategies [5]. It is important to note that global wind resource assessments show that the technically exploitable potential of wind energy far exceeds projected electricity demand [6], even under ambitious climate stabilization scenarios, demonstrating its ability to support pathways compatible with limiting global warming to well below 2 °C [7].
However, harnessing wind energy in urban environments presents unique challenges and opportunities. Cities experience highly complex wind patterns, as buildings and other structures create lower wind speeds and intense turbulence that can significantly reduce turbine performance [8]. Small turbines in the built environment are subject to erratic gusts and dynamic loads, which not only hinder their energy production but also accelerate fatigue damage [9]. In fact, the “complex aerodynamics” of urban wind energy are often cited as a major obstacle to urban wind energy systems [10]. On the other hand, even modest wind resources in cities represent an untapped opportunity for on-site generation [11]. The strategic placement of turbines on rooftops or along building edges can harness localized flow acceleration, helping to meet local energy demand and improve building sustainability [12]. This potential has driven a growing body of research on the assessment of urban wind resources and turbine siting, including advanced computational models to predict wind patterns in urban landscapes [13]. Researchers are also exploring innovative solutions such as machine learning to better map and forecast urban wind energy, with the aim of overcoming the uncertainties that have hindered the development of urban wind farms [14].
Conventional horizontal-axis wind turbines (HAWTs), which dominate utility-scale wind farms, are widely recognized as suboptimal for deployment in urban environments characterized by highly turbulent, multidirectional, and intermittent wind flows [15]. In these environments, HAWTs suffer from frequent yaw misalignment, increased mechanical fatigue, high noise emissions, and heightened safety and aesthetic concerns when scaled down to operate near buildings [16]. In contrast, vertical-axis wind turbines (VAWTs) have emerged as a promising alternative for urban and built-environment applications [17] due to their inherent ability to capture wind from any direction without active yaw mechanisms and their typically lower tip speed ratios, resulting in quieter operation and reduced risk to pedestrians and wildlife [18]. Numerous experimental and numerical studies have demonstrated that VAWTs are more resilient under the weak, unstable, and highly turbulent wind conditions typical of urban areas [19] and that they are better suited for integration into building rooftops and facades. Among VAWT configurations, the lift-driven Darrieus-type turbine has sparked renewed interest in research due to advances in blade aerodynamics, materials, and control strategies [20]. Since its conception in the early 20th century, the Darrieus rotor has evolved into multiple configurations such as the H-type [21], Darrieus–Savonius hybrids [22], curved-section [23], and slotted-blade [24], among others. These Darrieus turbines face distinctive aerodynamic challenges, as each blade experiences large cyclic variations in angle of attack and repeated interaction with its own wake, leading to complex and unstable phenomena such as dynamic stall, vortex shedding, and pronounced torque ripple [25].
Additional operational advantages justify the selection of VAWTs for this urban application. Compared with small HAWTs, VAWTs may operate at lower cut-in velocities, are less dependent on yaw alignment, can place the generator and drivetrain closer to the support structure, and generally involve lower mechanical complexity and maintenance cost. These features are particularly relevant for rooftop and campus-scale systems, where wind direction changes rapidly and access for maintenance is limited.
Comparative evaluations between horizontal-axis wind turbines (HAWTs) and vertical-axis wind turbines (VAWTs) consistently show that, while HAWTs maintain superior performance in high-altitude, low-turbulence wind conditions, Darrieus-type VAWTs can match or exceed them in turbulent, low-altitude environments [26]. In urban areas and built environments, wind fields exhibit complex aerodynamics characterized by high instability, multidirectional, and intermittent flows [27]. In these scenarios, the main vulnerability of HAWTs lies in their strict dependence on active yaw control mechanisms to maintain alignment with the flow; this causes continuous misalignment, severe structural fatigue due to asymmetric loads, and increased noise emissions, which hinders their architectural integration [28]. In contrast, the intrinsic omnidirectionality of VAWTs allows them to capture wind energy without the need for mechanical realignment, drastically reducing system complexity and the risk of operational failures [29]. Recent research supports the finding that modern Darrieus VAWTs (lift-driven), when subjected to aerodynamic optimizations such as the use of advanced airfoils or flow deflectors, are able to significantly narrow the efficiency gap. Under these optimized conditions, Darrieus VAWTs can achieve power coefficients (Cp) close to those of conventional three-bladed HAWTs [30]. Furthermore, given that their drive train is typically located at ground level, VAWTs substantially reduce installation and maintenance costs, offering a highly competitive levelized cost of energy (LCOE) or even lower costs at small and medium scales under moderate wind conditions [31].
The comparison between HAWTs and optimized Darrieus VAWTs is therefore not interpreted as an equivalence at all operating points. Conventional three-bladed HAWTs typically reach their peak Cp at higher TSR values, often around λ ≈ 6–8, whereas small Darrieus rotors reach their optimum at lower TSR values, commonly near λ ≈ 2–4 depending on solidity, airfoil and Reynolds number. The present rotor reached its optimum at λ = 2.5, which is advantageous for urban operation because lower blade-tip speeds reduce acoustic emissions and mechanical loads.
The application of this type of turbine in densely populated cities such as Lima is of particular interest and relevance. Lima has an urban environment with high surface roughness due to its complex architectural topography and buildings of varying heights, which generates highly turbulent and unpredictable wind conditions [32]. Although average wind speeds in these urban areas are typically low to moderate, VAWTs have proven to be commercially and technically viable, as they operate efficiently at wind speeds ranging from 0.5 to 6 m/s, mitigating the performance loss that conventional systems would suffer [33]. Likewise, the integration of vertical-axis wind turbines into Lima’s infrastructure—such as on the roofs of residential buildings or university campuses—represents a decentralized solution with low logistical impact that supports the transition toward energy-positive and sustainable urban districts.
Despite the evident potential of VAWTs in urban areas, the literature highlights a pressing need to address their inherent aerodynamic challenges, such as low efficiency during autonomous startup and the negative torque generated on the trailing blade under turbulent flow conditions [34]. In this context, this research is justified by the imperative need to maximize the energy performance of these turbines using passive technologies that are low-cost to implement. Therefore, the main objective of this study is to computationally evaluate, using Computational Fluid Dynamics (CFD), the aerodynamic and performance improvements of a vertical-axis Darrieus wind turbine with straight blades, to which a flat-plate flow deflector is incorporated, designed and implemented under the specific conditions of the urban wind resource at the campus of the Universidad Nacional Mayor de San Marcos in Lima, Peru.
The remainder of this paper is organized as follows. Section 2 describes the urban wind-resource assessment, deflector geometry, numerical model, mesh strategy, performance metrics and validation approach. Section 3 presents the aerodynamic and performance results for the baseline and deflector-assisted configurations. Section 4 discusses the mechanisms, limitations and comparison with previous enhancement strategies. Section 5 summarizes the main conclusions and the applicability range of the proposed design.
Relative to previous VAWT studies using passive deflectors, the novelty of this work lies in the combined assessment of a single flat-plate deflector under a measured urban wind regime; the explicit comparison between baseline and deflector-assisted Cp–TSR curves; and the physical interpretation of performance gains through velocity, pressure and torque-field post-processing. The design is intentionally simple, passive and low-cost, targeting urban microgeneration rather than maximum efficiency under ideal wind-tunnel inflow.
The methodological hierarchy used in this work is multi-source and multi-fidelity rather than a fully coupled micro-to-macro multiscale solver. At the urban-resource scale, CTCLIMA and NASA POWER wind data were used to characterize the site and define representative operating conditions. At the rotor scale, transient CFD resolved the interaction between the H-Darrieus rotor and the passive deflector. At the reduced-order scale, DMST was used only for the bare rotor to verify the expected Cp–TSR trend before evaluating the deflector configuration with CFD.
2. Materials and Methods
2.1. Assessment of Urban Wind Resources
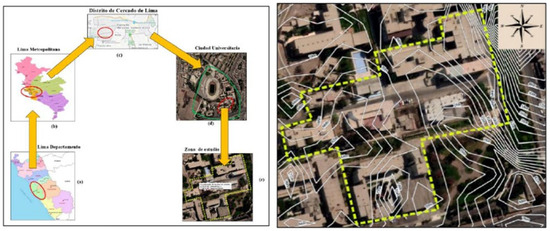
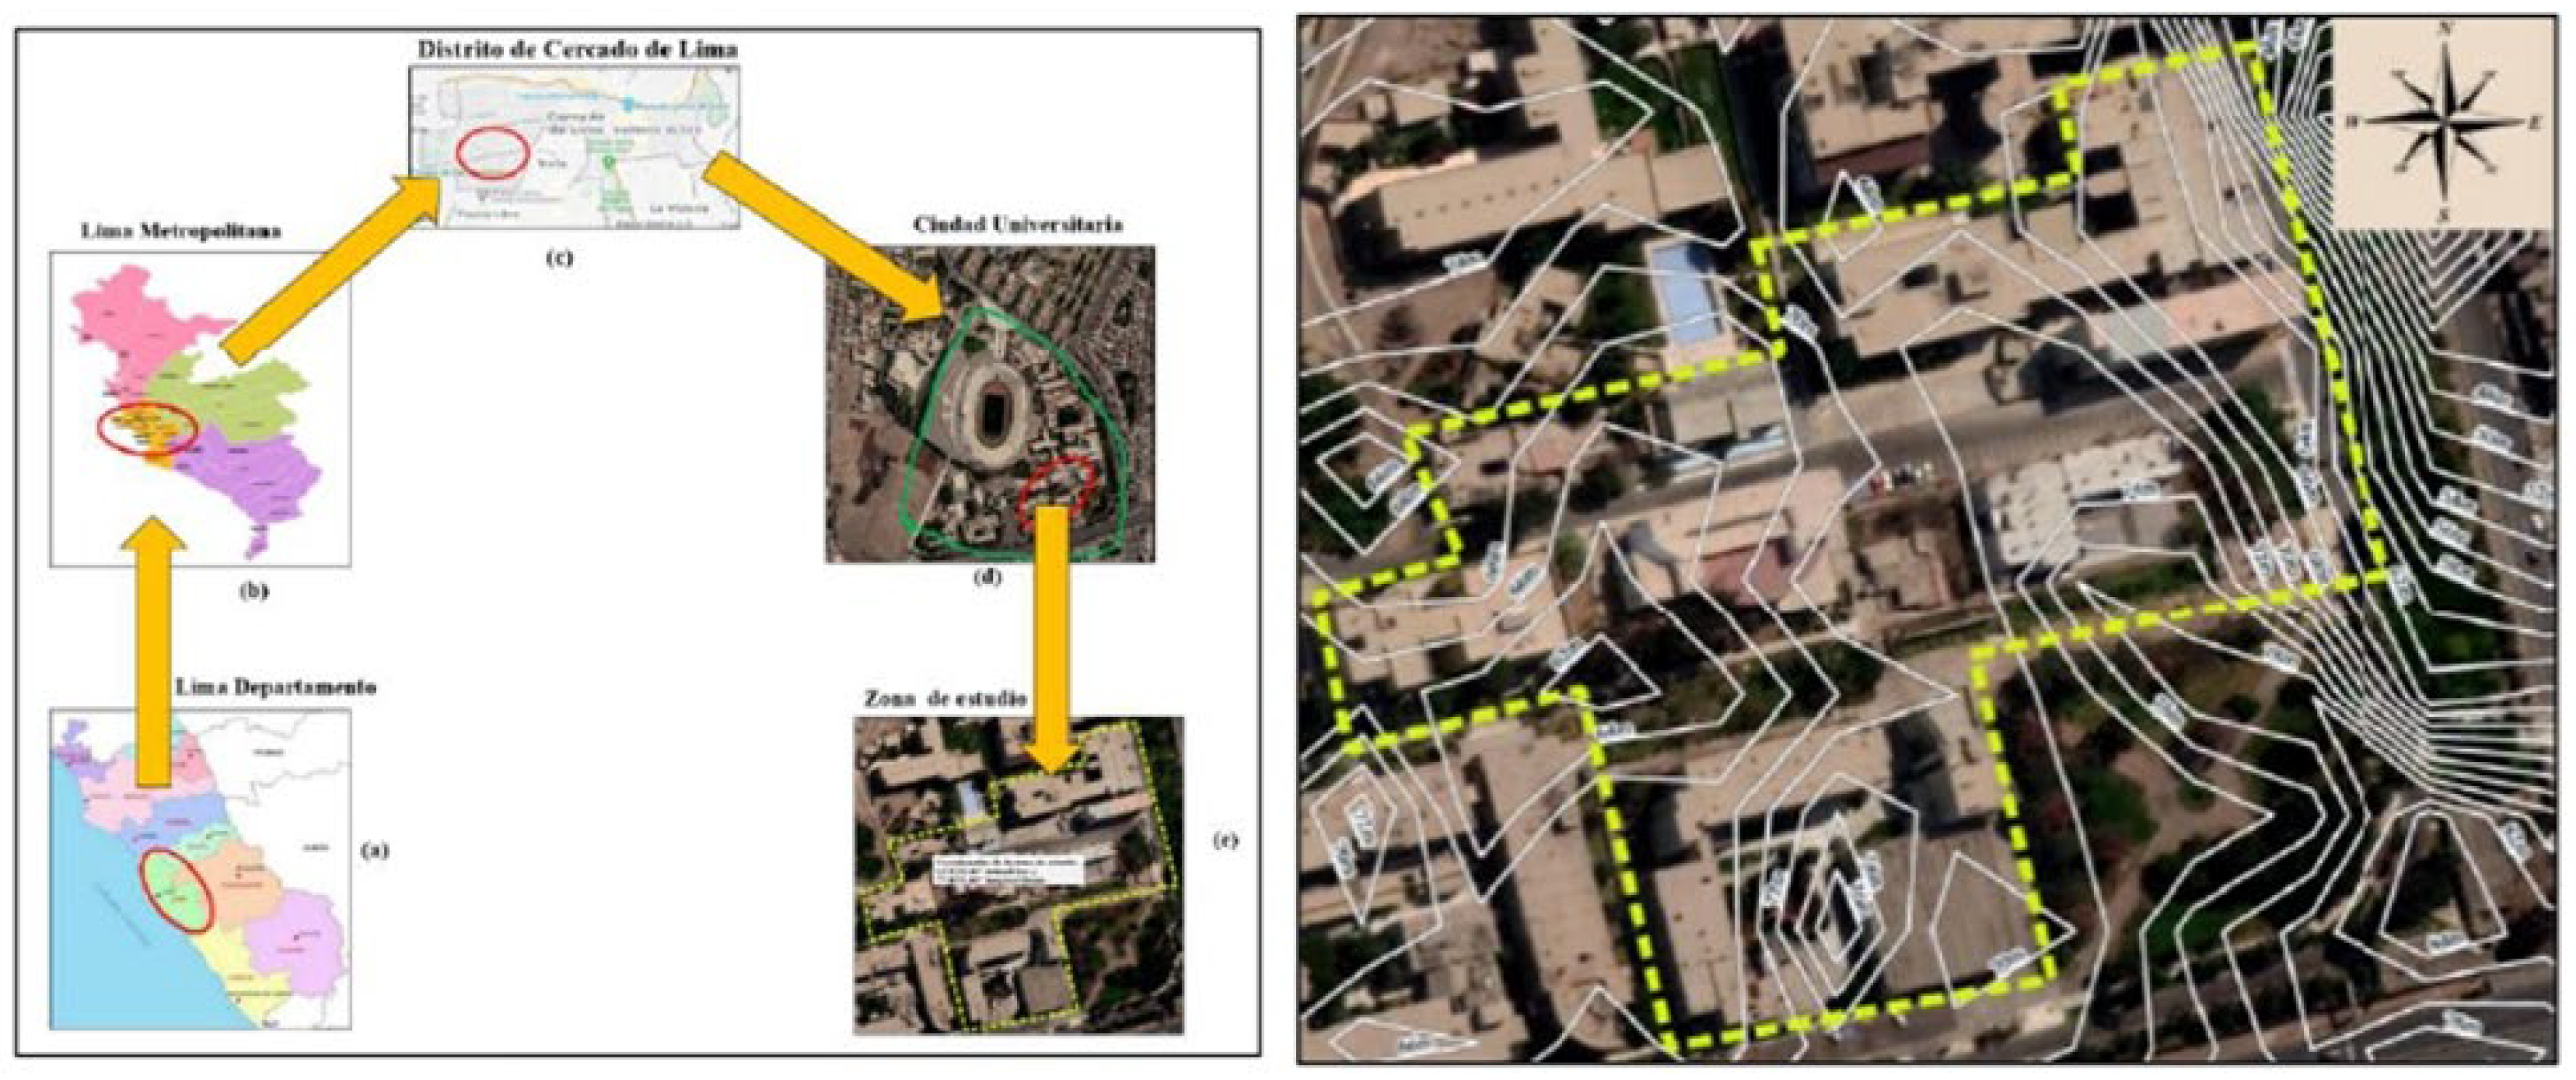
To assess local wind resources, two data sources were used: (1) in situ measurements from the campus weather station (CTCLIMA) and (2) long-term climate data from the NASA POWER database, which provides satellite-derived wind information for the site coordinates and was cited following NASA POWER referencing guidance [35]. The in situ station data capture microscale wind behavior on campus, while NASA POWER data provide a broader climatological context. Using both datasets, the statistical distribution of wind speeds and directions at the site was derived. The site location map was prepared from Google Earth Pro (version 7.0 beta) imagery and is cited in the caption of Figure 1 [36].
Figure 1.
Geographic location of the study area prepared from Google Earth imagery: (a) Department of Lima, (b) Metropolitan Lima, (c) Cercado de Lima District, (d) university campus, and (e) selected study area. Source: adapted from Google Earth imagery.
Wind speed variability was characterized by fitting a two-parameter Weibull probability distribution to the measured data. The probability density function was expressed as:
where is wind speed, k is the dimensionless shape parameter and c is the scale parameter in m/s. The Weibull model was chosen because it is widely used for characterizing wind resources due to its flexibility and accuracy in representing observed wind speed distributions. The shape parameter k describes the consistency of the wind regime, whereas c represents the characteristic wind-speed magnitude. Additionally, a wind rose was constructed by grouping the data into 16 compass sectors and calculating the percentage of time that the wind blows within each speed interval for each sector.
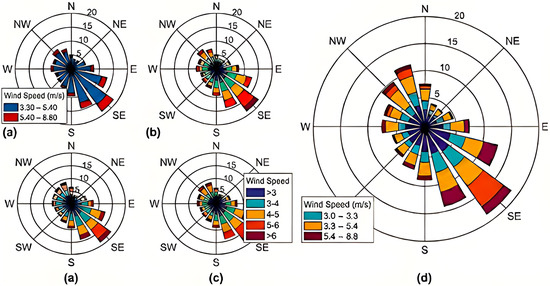
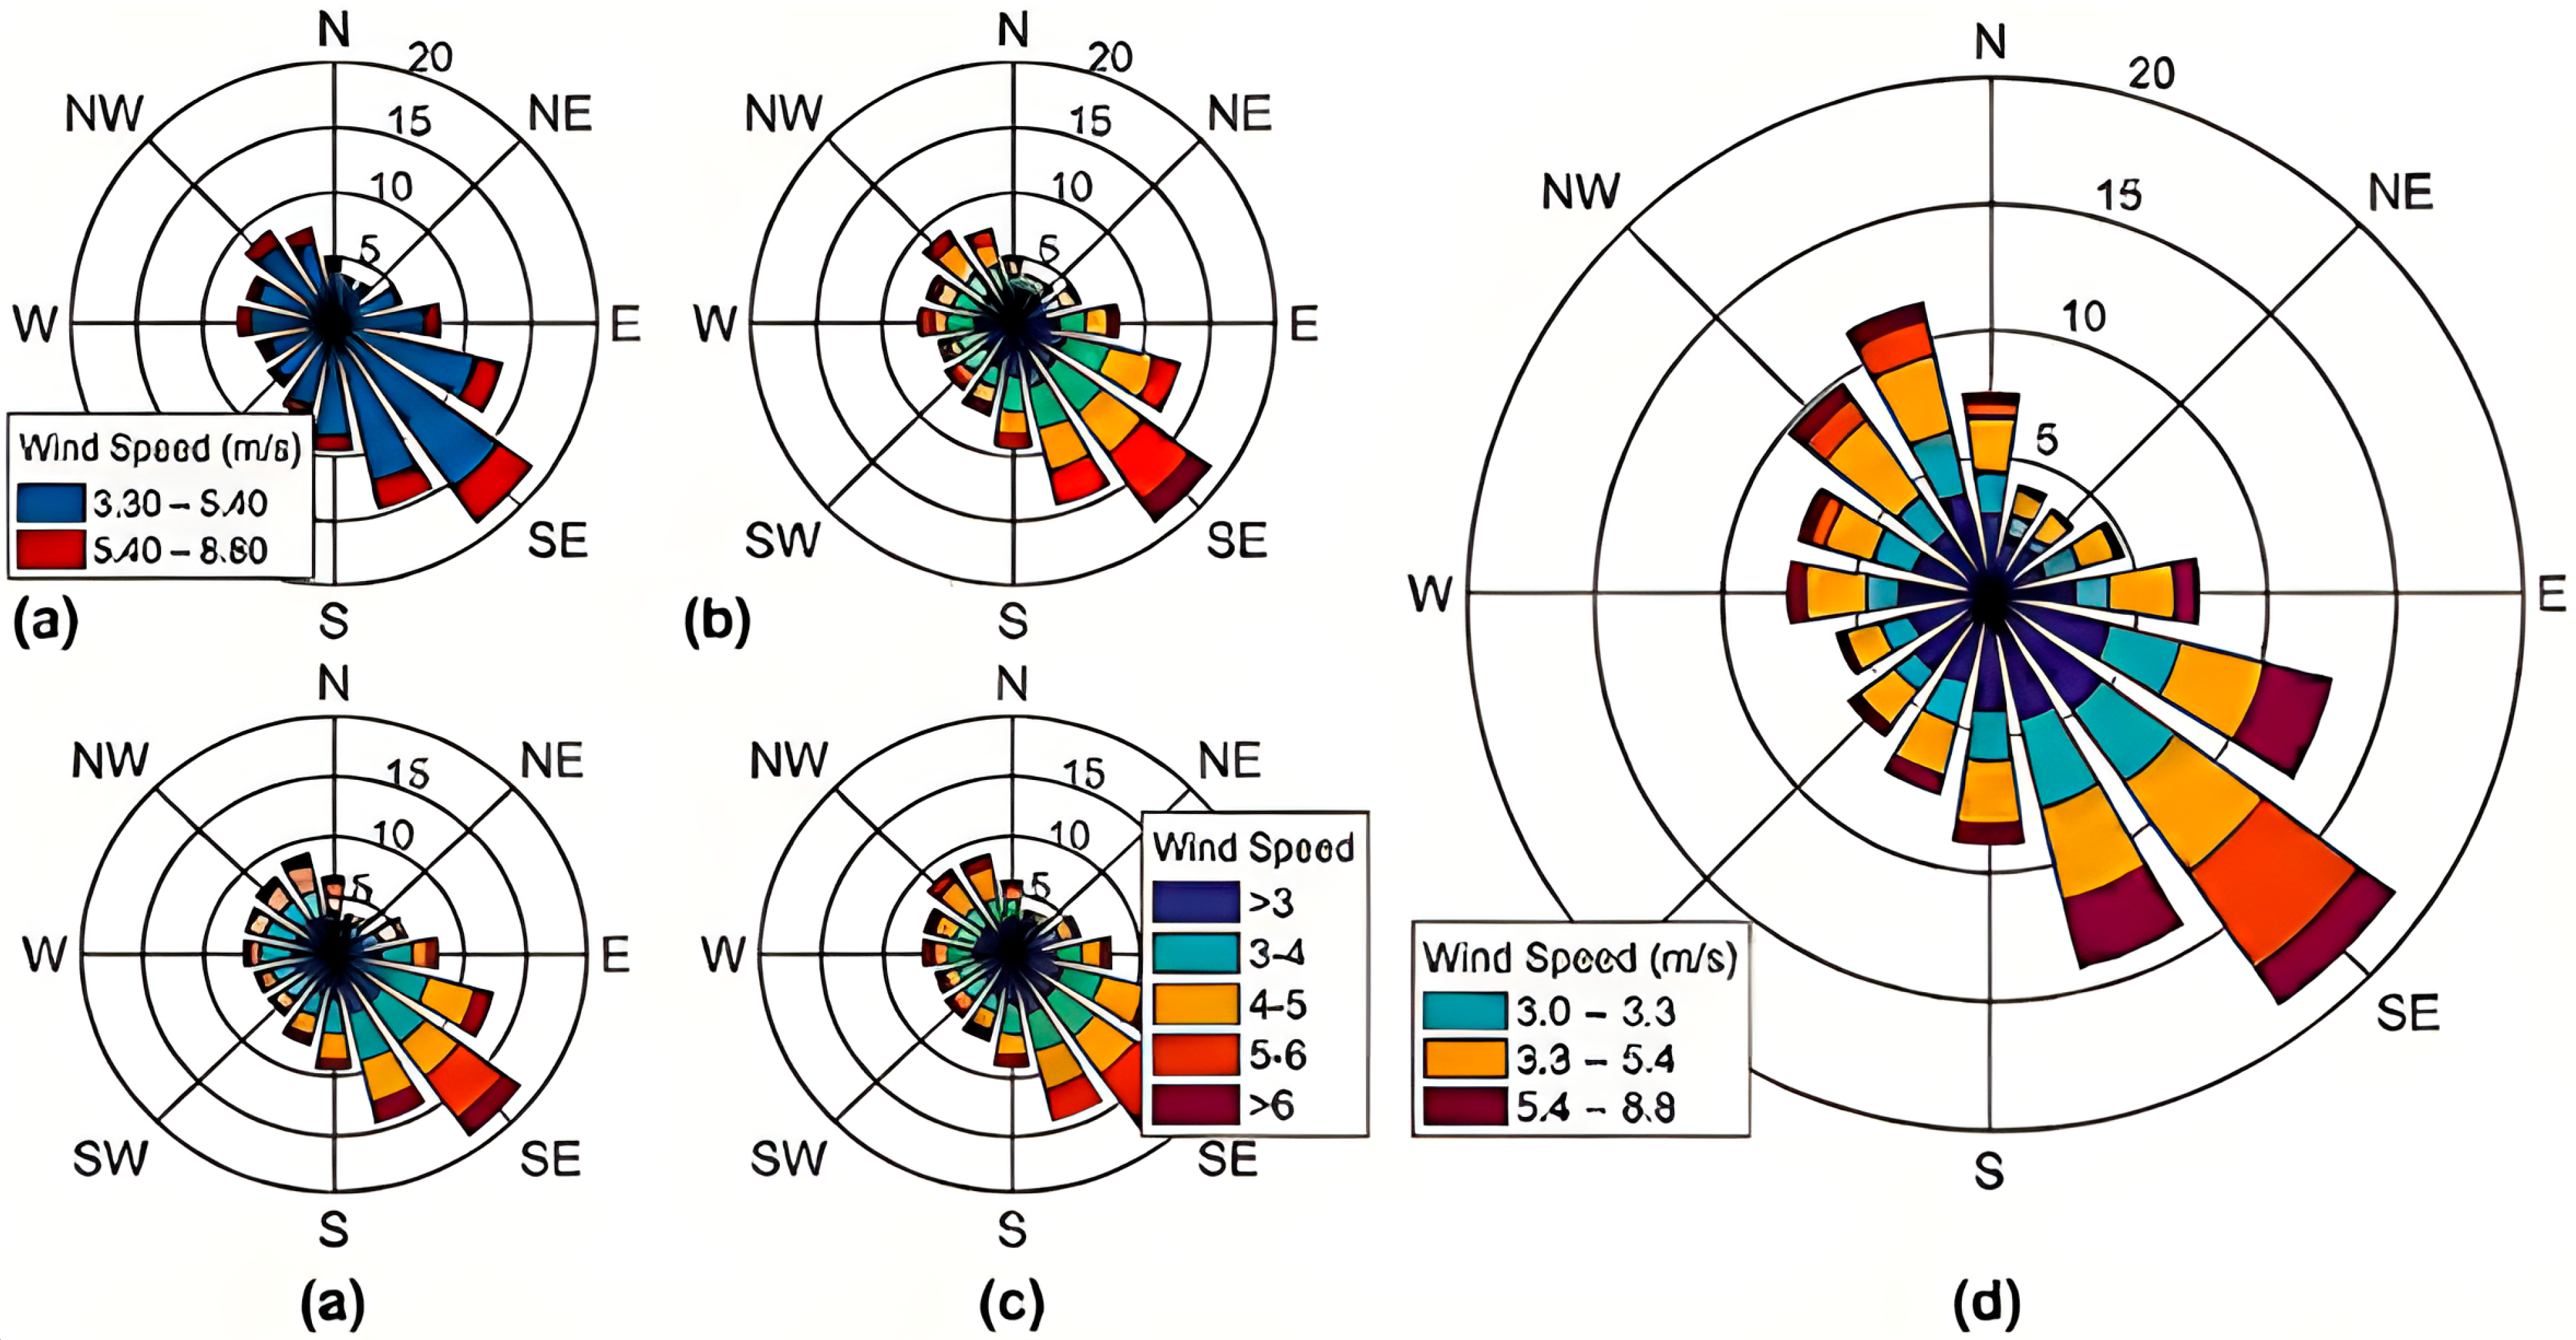
The wind-rose panels indicate that the site is dominated by southeasterly winds, which supports the selected orientation of the passive deflector and justifies using the prevailing inflow direction as the representative CFD condition (Figure 2).
Figure 2.
Wind-direction frequency and wind-speed classes at the study site: (a) simplified wind rose grouped into two velocity ranges, (b) detailed wind rose with multiple speed intervals, (c) complementary sectoral representation used to verify the dominant direction, and (d) enlarged detailed plot showing the prevailing southeasterly winds.
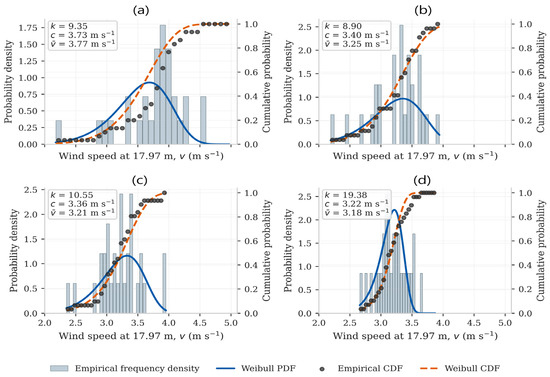
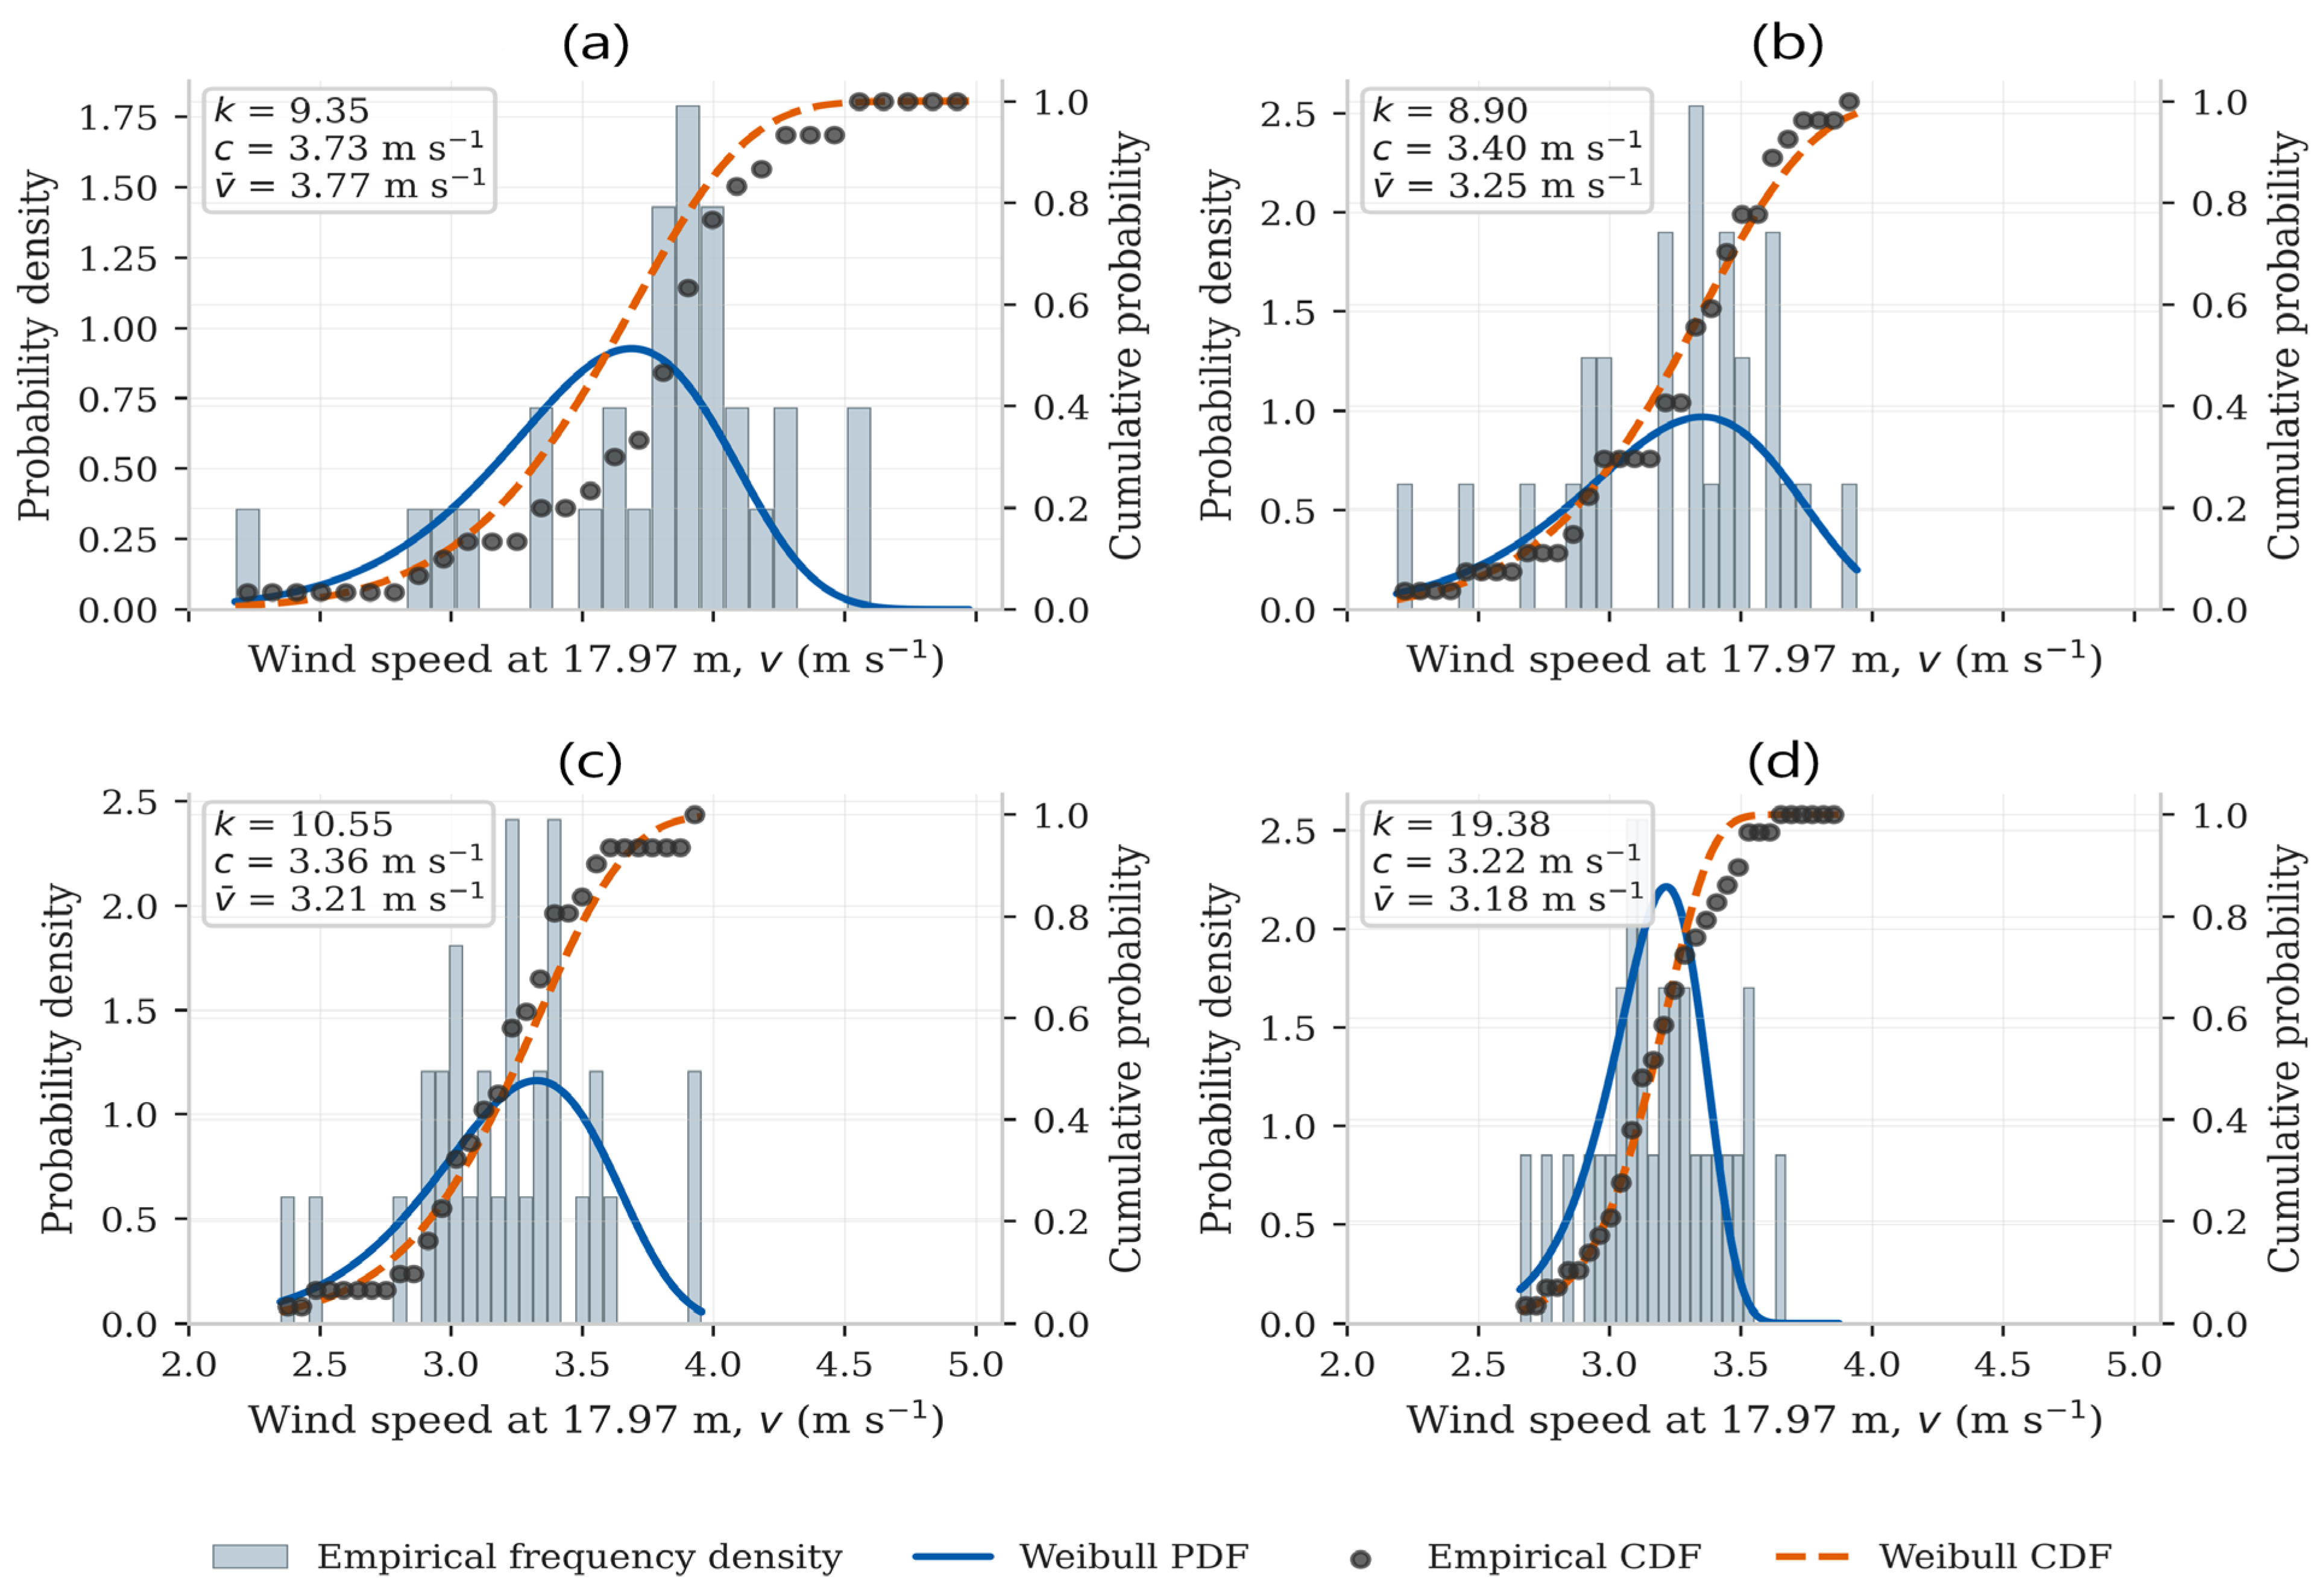
The monthly Weibull fits show that the urban wind regime is concentrated in the low-to-moderate speed range (Figure 3). These parameters were used to define representative inlet conditions for the CFD simulations (Table 1), while the complete CTCLIMA monthly values are provided in the Supplementary Materials.
Figure 3.
Monthly Weibull probability-density and cumulative-probability fits for NASA POWER wind-speed data during the first four months of 2022: (a) January, (b) February, (c) March, and (d) April. Histograms represent observed wind-speed frequency, solid curves represent fitted Weibull probability density, and dashed curves represent cumulative probability.
Table 1.
Consolidates the annual mean wind speeds and Weibull parameters from independent data sources.
To support subsequent simulations, the site surface roughness was estimated from the surrounding urban terrain, which includes buildings, trees and campus obstacles. The area was classified as high-roughness terrain, approximately Davenport Class 3–4, corresponding to an aerodynamic roughness length of approximately z0 = 0.1–1.0 m; the value z0 = 0.5 m was therefore adopted for the logarithmic inlet profile. This estimate was used to represent the vertical wind-speed gradient in the computational model and to maintain consistency between the wind-resource assessment and the CFD boundary conditions.
2.2. Thematic Selection Criteria
The passive deflector was defined as a flat stationary plate with a span equal to the rotor height and a length comparable to the rotor diameter. Its role is to redirect the incident wind toward the advancing blade and to create a protected low-velocity region around the returning blade. The final configuration was selected from a sensitivity assessment of plate angle, distance and length, considering the ability to increase Cp while avoiding placement of the rotor inside the separated wake immediately behind the plate.
The sensitivity assessment in Table 2 was used as a screening stage rather than as a full optimization routine. The retained configuration prioritizes improved Cp, reduced negative torque and feasible implementation on rooftops or campus-scale installations.
Table 2.
Summary of the deflector-parameter sensitivity assessment used to select the passive flat-plate configuration.
The geometric values in Table 3 define the final passive device modeled in CFD. Keeping the deflector span equal to the rotor height ensures that the redirected flow covers the full blade span, while the selected upstream offset prevents the rotor from being placed inside the separated wake behind the plate.
Table 3.
Geometry and positioning parameters of the selected flat-plate deflector.
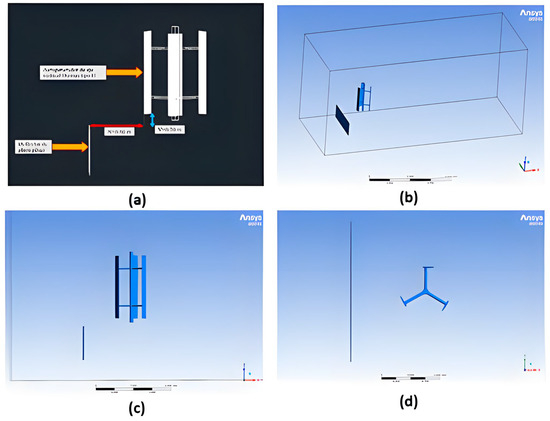
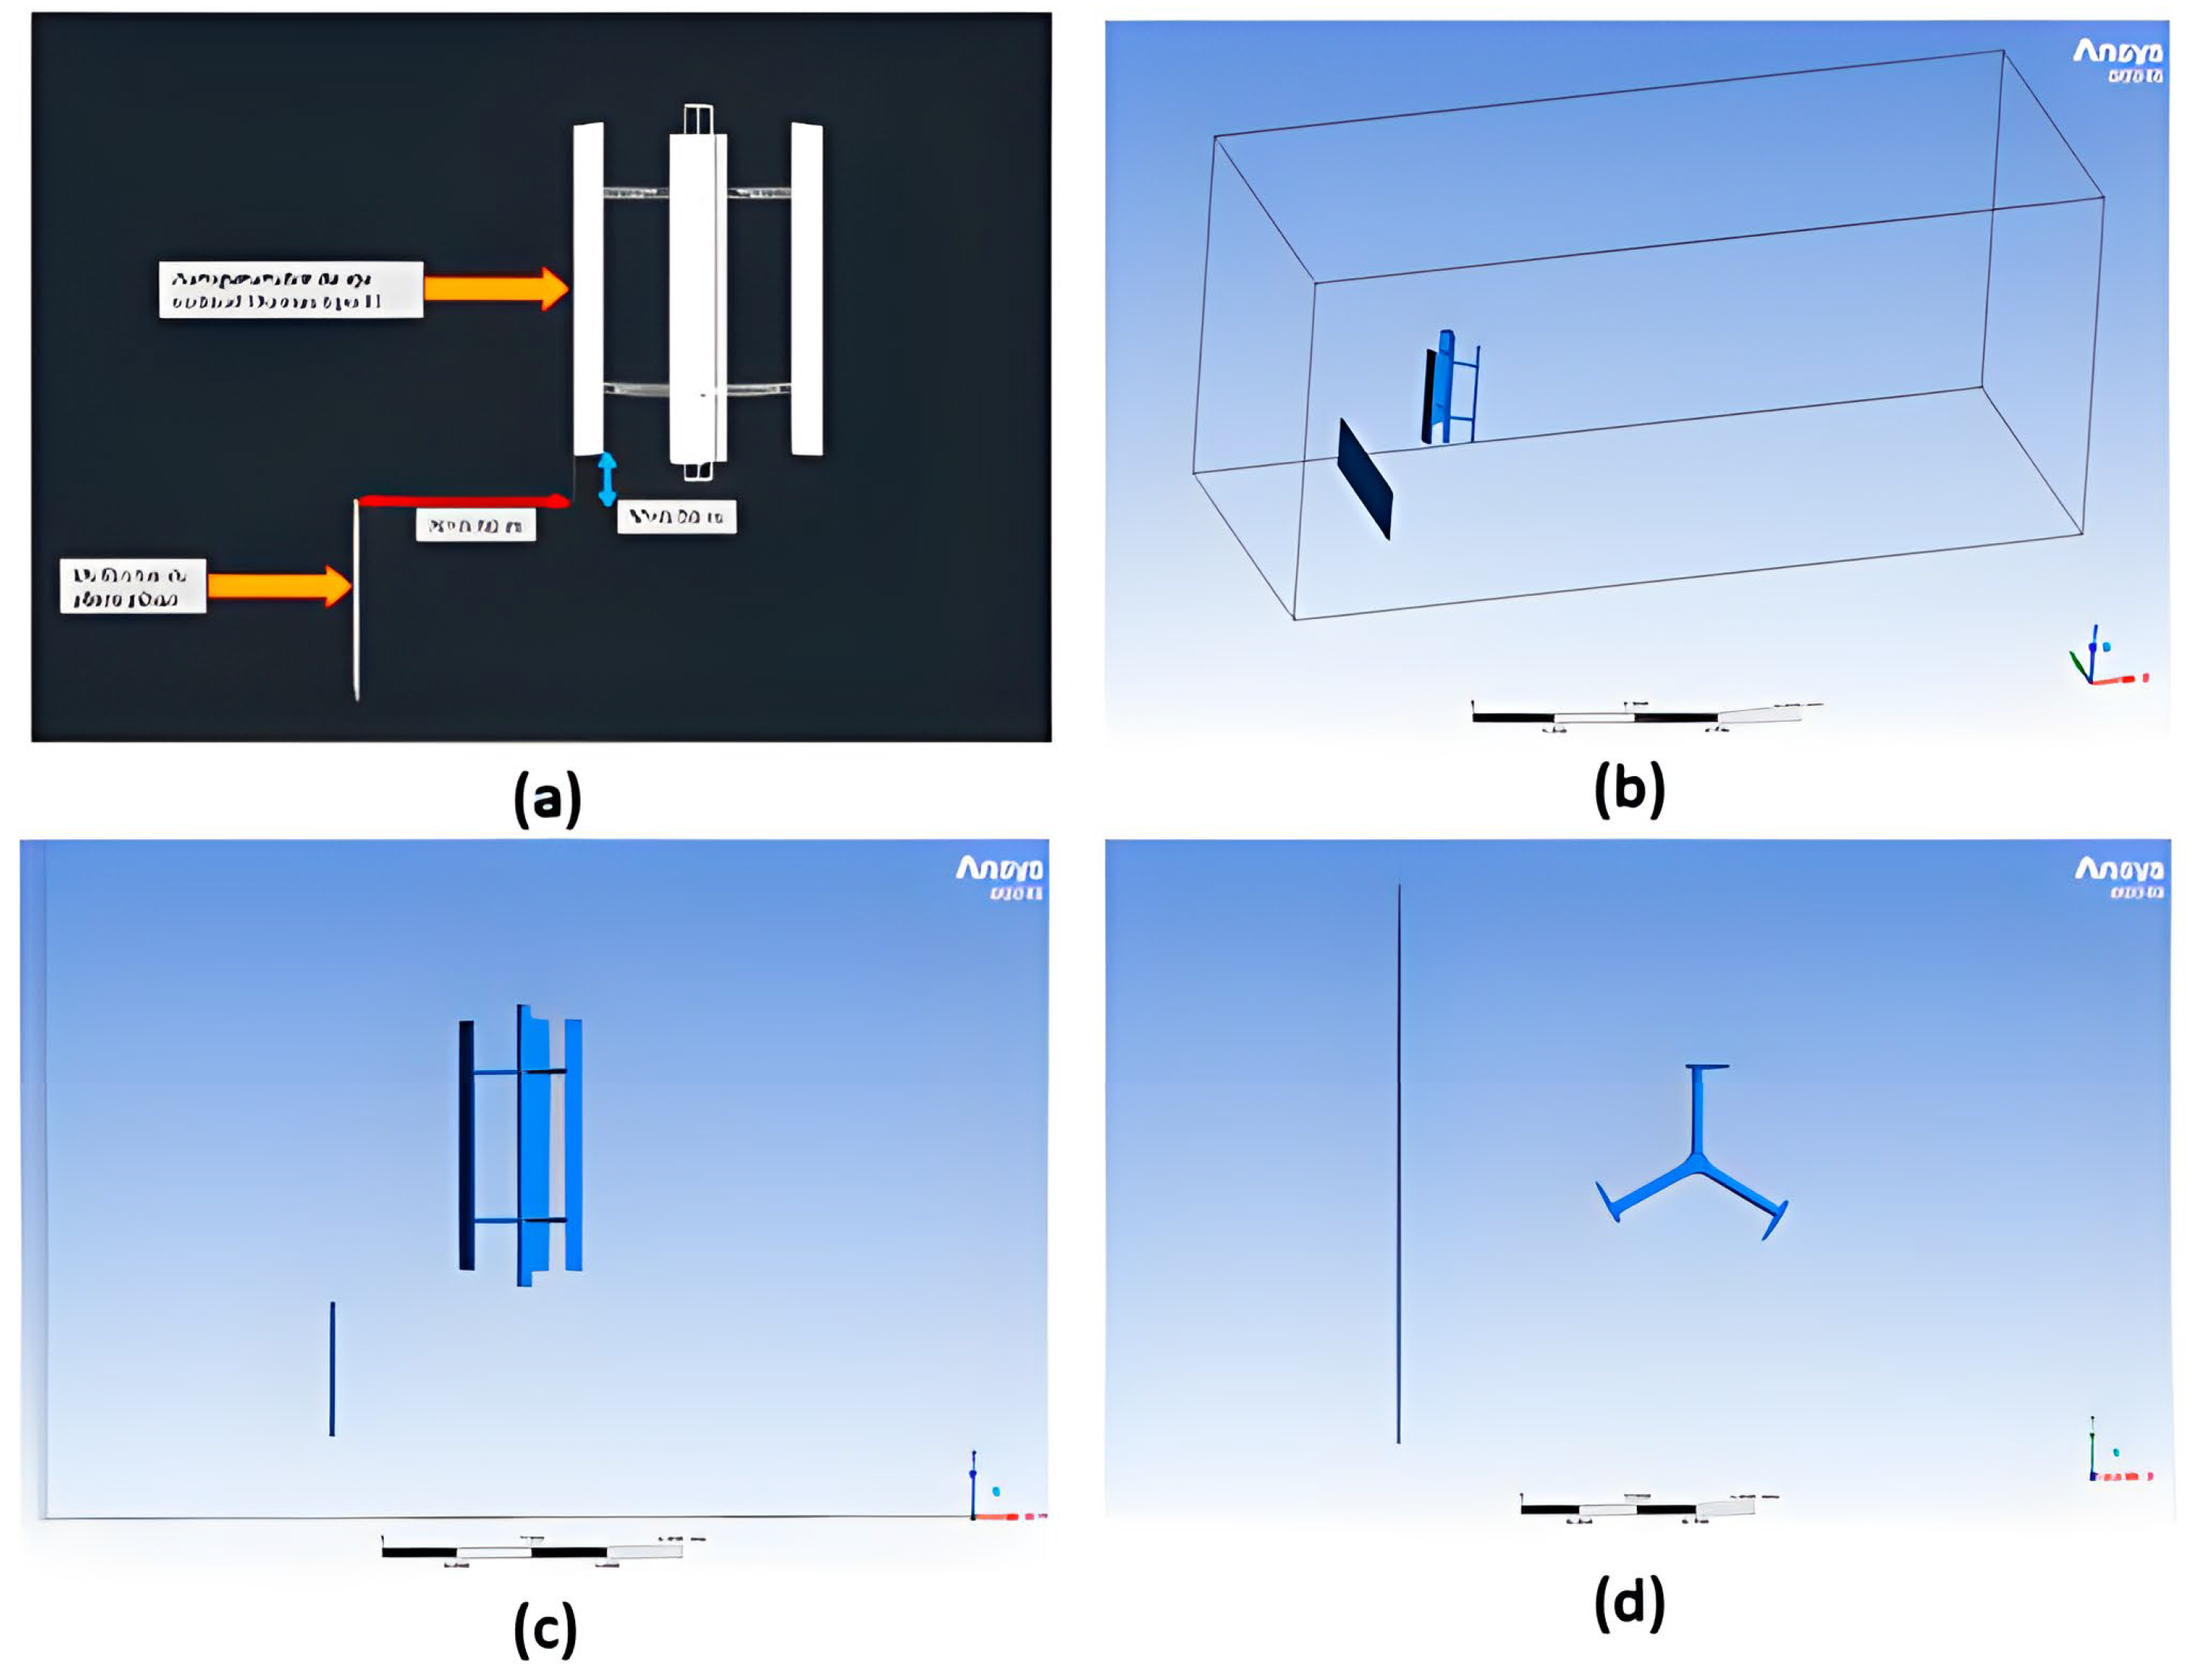
The deflector dimensions were assessed by considering aerodynamic benefit and practical feasibility (Figure 4). A larger plate can intercept and redirect more wind toward the advancing blade, but excessive length increases blockage, structural load and installation complexity. The selected length, approximately 1.5 times the rotor radius, therefore represents a compromise between flow acceleration and urban-scale constructability. The rotor was positioned outside the immediate separated wake behind the plate so that the accelerated deflected stream, rather than the low-speed wake bubble, interacts with the advancing blades. This placement reduces adverse pressure on the returning blades and increases the net driving torque, consistent with previous reports of 20–50% VAWT power improvements using properly configured deflectors [37].
Figure 4.
Passive flat-plate deflector configuration with 30° orientation relative to the incoming flow, span equal to the rotor height and upstream offset of approximately one rotor radius: (a) geometric design of the deflector relative to the H-Darrieus rotor. (b) upstream distance used to position the rotor outside the immediate separated wake. (c) side view of the deflector and rotor assembly in the computational domain, and (d) top view showing the three-bladed rotor geometry and the relative positioning of the upstream deflector plate.
2.3. CFD Simulation Setup
Computational Fluid Dynamics (CFD) simulations were performed using ANSYS CFX (version 2023a Ansys, Inc., Canonsburg, PA, USA) to investigate the aerodynamic behavior of the vertical-axis wind turbine (VAWT) both with and without a deflector. A fully three-dimensional, transient simulation framework was adopted to capture the unsteady aerodynamic phenomena associated with blade rotation, wake interaction, and flow redirection induced by the deflector. This approach is particularly necessary for Darrieus-type turbines, whose blades experience continuously varying angles of attack and dynamic-stall effects under variable wind conditions.
The computational domain was defined as a cylindrical control volume representing a virtual wind tunnel around the turbine. The radial extent of the domain was set to approximately 10–12 rotor diameters from the turbine axis to minimize blocking and boundary interference effects, while the upper and lower boundaries were placed at various heights relative to the turbine rotor to allow for the full development of the wake. The ground surface was explicitly modeled as a horizontal plane to represent near-surface operation and was treated as a non-slip wall with aerodynamic roughness consistent with the estimated urban terrain of the study site. The inlet boundary was located approximately five rotor diameters upstream of the turbine, and the outlet boundary was located more than 15 rotor diameters downstream, ensuring stable exhaust outlet conditions.
At the inlet, an urban atmospheric boundary layer was imposed using a logarithmic wind speed profile. The vertical distribution of wind speed was defined as:
where U(z) is the wind speed at height z, Uref is the reference wind speed measured at the reference height zref, z0 is the aerodynamic roughness length, and z is the vertical coordinate above ground level. In this study, zref = 10 m, Uref = 3.5 m/s and z0 = 0.5 m were adopted to represent dense urban terrain. This logarithmic atmospheric-boundary-layer profile is a standard representation for near-surface wind over rough terrain and provides a realistic vertical wind gradient for the urban site. A turbulence intensity of 10% was specified at the inlet as a conservative representative value for the main CFD cases, while the implications of higher urban turbulence levels are discussed in Section 4.
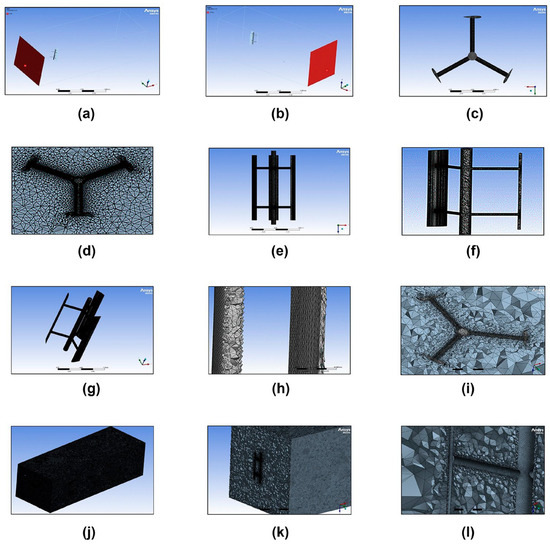
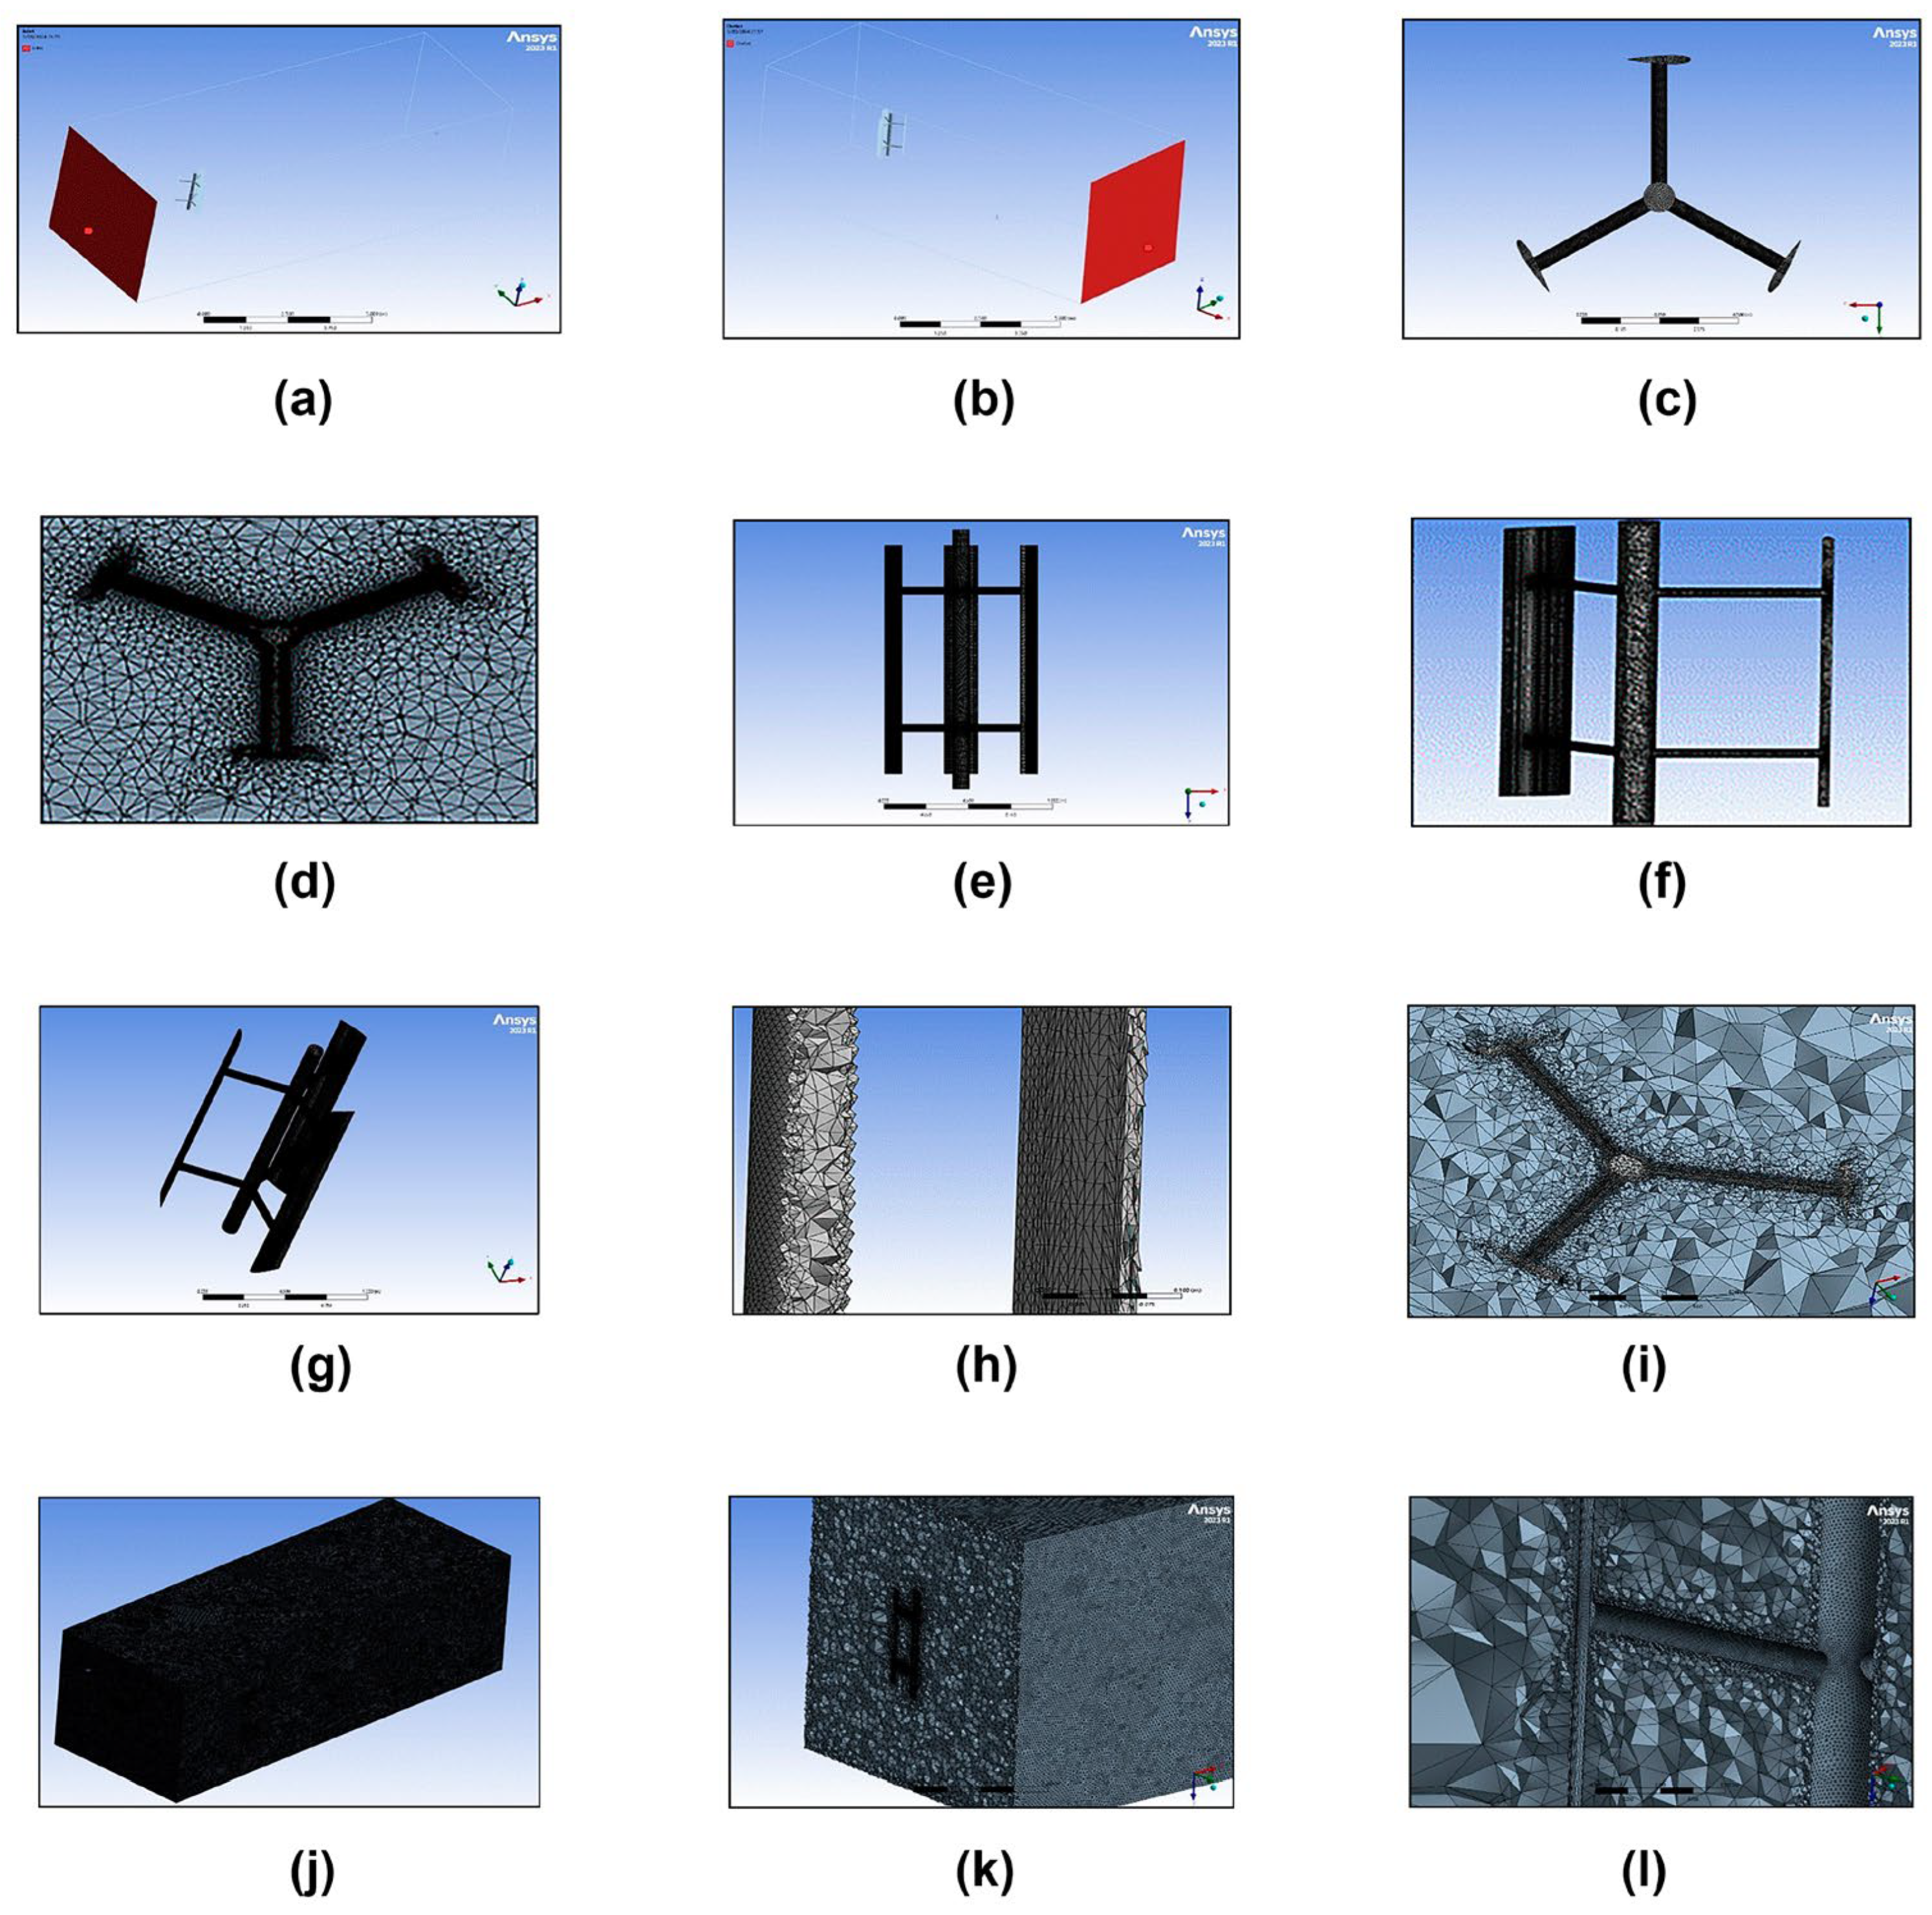
The blade rotation was modeled using a sliding mesh technique. The computational domain was divided into two regions: an inner cylindrical region enclosing the rotor, which was allowed to rotate, and an outer stationary region containing the shroud and the surrounding flow field. The rotating domain was assigned a prescribed angular velocity corresponding to the selected tip-speed ratio, and a general grid interface was defined between the rotating and stationary regions to allow for a conservative transfer of flow variables. This sliding-mesh approach explicitly solves for blade motion and the unstable interactions between blades, wakes, and deflectors, making it particularly well-suited for capturing dynamic stall phenomena and cyclic torque variations. Rotor rotation was discretized using time steps corresponding to approximately one degree of azimuthal rotation per step. Each time step was solved using an implicit transient scheme, and convergence was achieved when the residuals of the continuity and momentum equations fell below 1 × 10⁻⁴. The geometric details of the computational domain and the mesh strategy adopted are illustrated in Figure 5.
Figure 5.
Mesh and computational-domain details for the baseline H-Darrieus rotor: (a) inlet, (b) outlet, (c) top view, (d) bottom view, (e) front view, (f) front-section view, (g) isometric view, (h) isometric-section view, (i) detailed boundary-layer/inflation region, (j) control-volume mesh, (k) control-volume Section 1, and (l) control-volume Section 2.
To ensure adequate resolution of velocity gradients and flow separation phenomena in the vicinity of solid surfaces, a hybrid meshing strategy was implemented. As shown in Figure 5d,i, critical refinement was applied to the boundary layer around the NACA 0015 profiles and the deflector plate. An O-grid was generated consisting of 25 layers of prismatic elements with a growth rate of 1.15, ensuring that the first element adjacent to the wall maintained a value of y+ < 1. This smooth transition from the highly structured prisms in the viscous sublayer to the tetrahedral elements in the free-flow domain is essential for maximizing the predictive performance of the SST k–ω turbulence model, allowing for the accurate capture of dynamic stall effects and wake interaction.
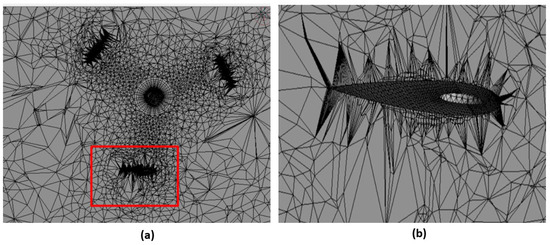
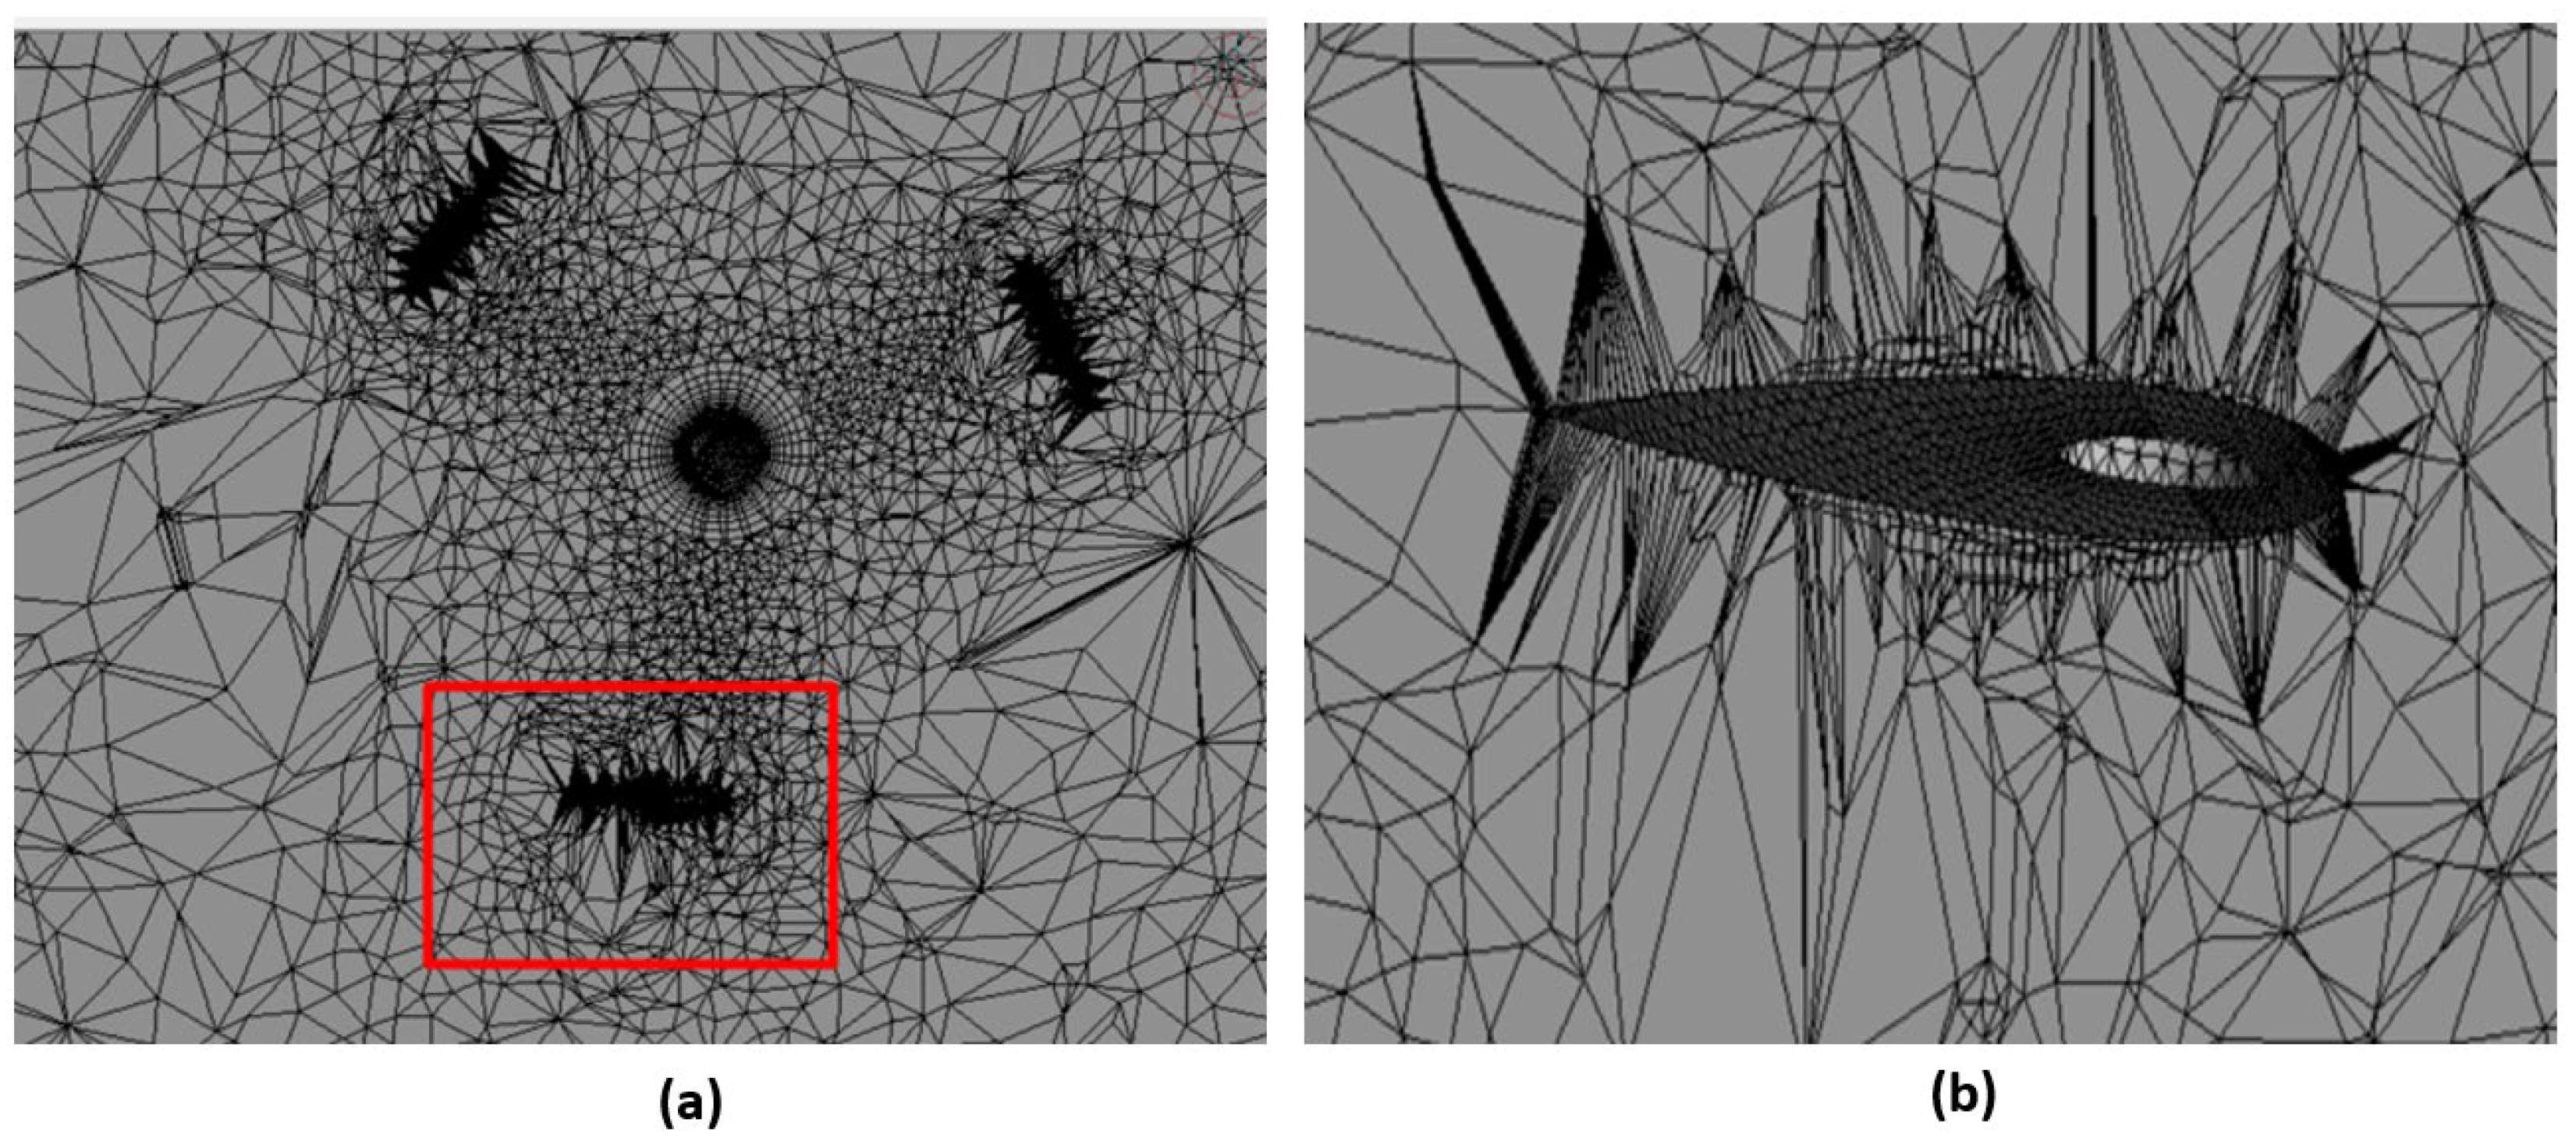
Figure 6 complements Figure 5 by documenting the local mesh treatment in the rotor–deflector interaction region, where gradients are largest and where the SST k–ω model requires adequate near-wall resolution.
Figure 6.
Local mesh-refinement details around the rotor and passive deflector: (a) unstructured refinement in the rotating/stationary interface region and (b) enlarged boundary-layer and wake-refinement zone used to resolve shear layers and near-wall gradients.
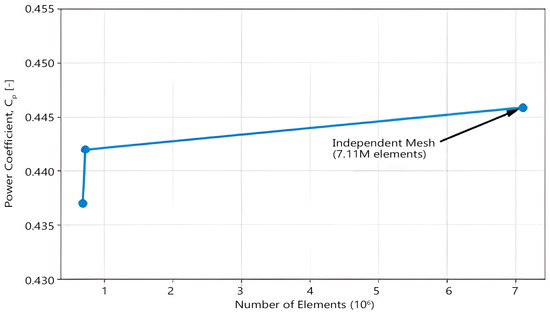
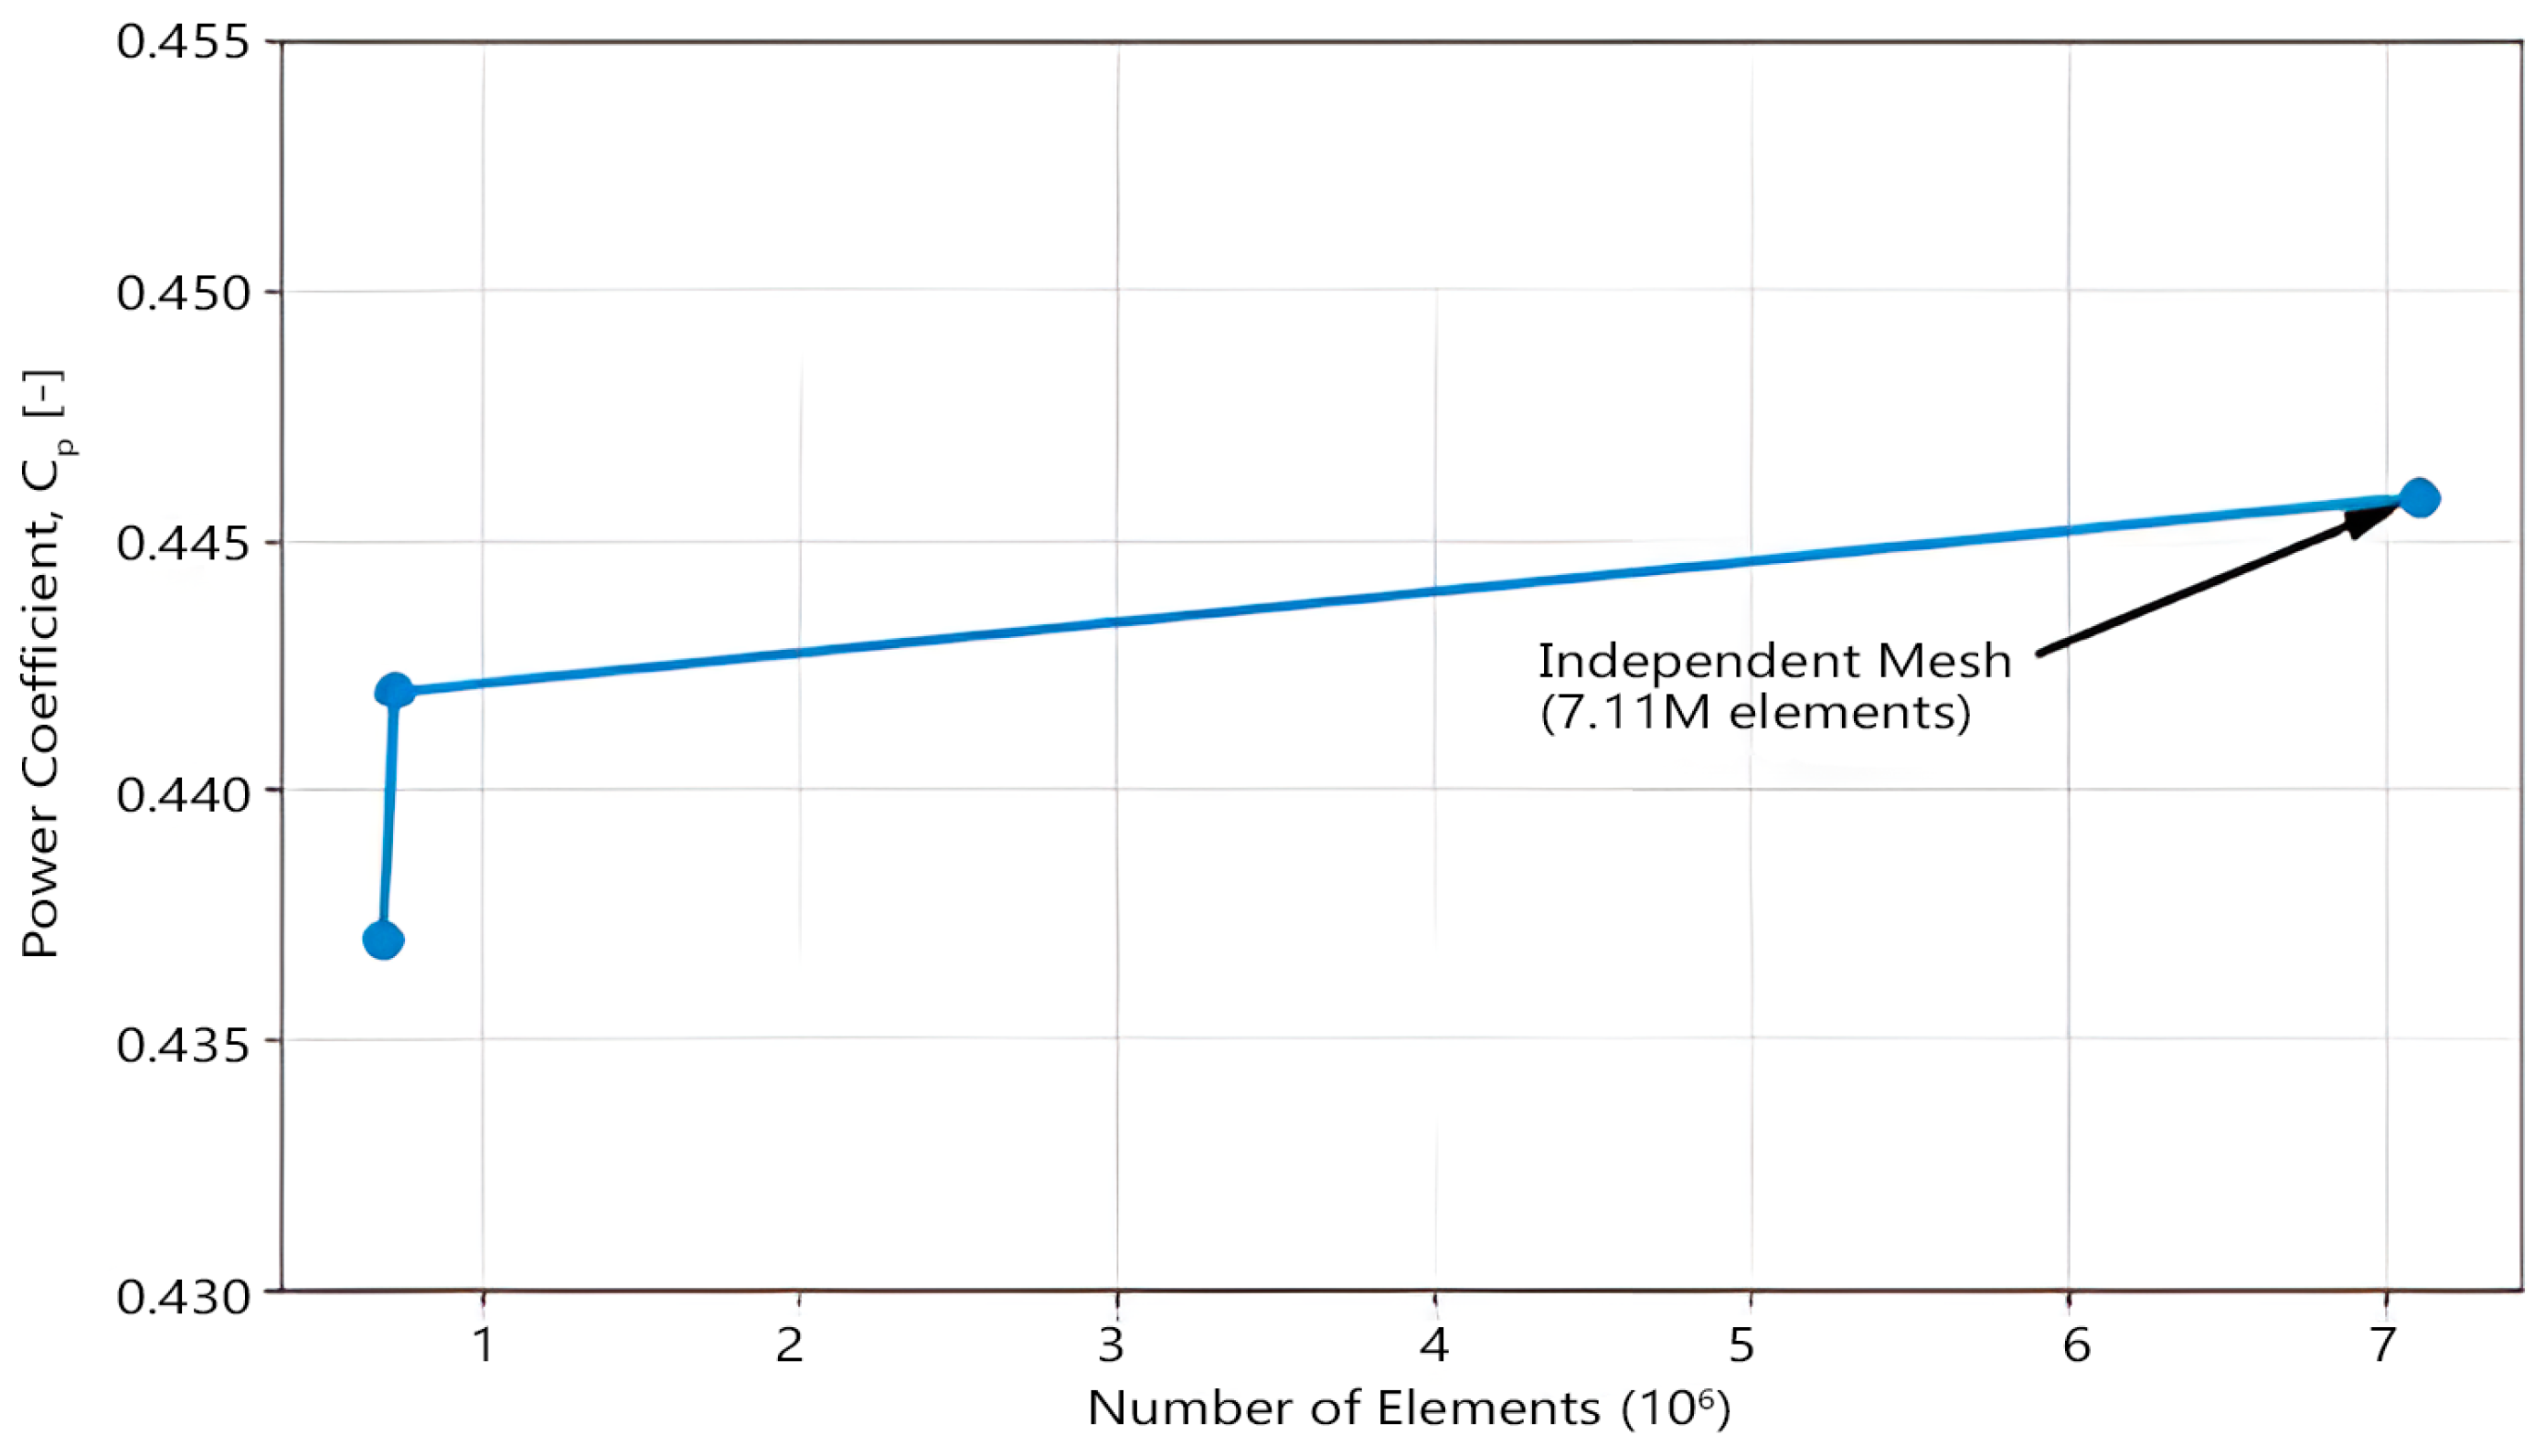
A high-quality mesh was generated to accurately resolve the aerodynamics of the blades and the flow modifications induced by the deflector. The mesh was predominantly unstructured, with localized refinements in critical regions. In the rotor region, each blade was surrounded by an O-grid of inflated layers to accurately capture the boundary layer. The first cell height was selected to achieve y+ values close to unity, ensuring compatibility with the turbulence model. Approximately 20–30 prismatic layers with a growth ratio less than 1.2 were applied to resolve the viscous sublayer and the damping region along the surfaces of the blades and deflectors. Additional mesh refinement was introduced around the deflector to resolve shear layers and accelerated flow zones generated near its edges. Outside these regions, the mesh was gradually coarsened to reduce computational cost. A mesh independence study was performed using a three-iteration refinement, resulting in an independent unstructured three-dimensional mesh consisting of 1,253,311 nodes and 7,105,411 tetrahedral elements, as shown in Figure 7.
Figure 7.
Mesh independence study showing the evolution of the power coefficient (Cp) at TSR = 2.5 as a function of the number of elements. The final mesh of 7.11 million elements was selected because it provided stable results with less than 1% variation.
The mesh settings reported in Table 4 demonstrate that near-wall and wake regions were refined consistently for the baseline and deflector-assisted configurations, thereby reducing numerical bias in the comparison of Cp and torque.
Table 4.
Mesh-resolution and boundary-layer settings used in the final transient CFD model.
Turbulence effects were modeled using the k–ω Shear Stress Transport (SST) model, which combines the near-wall accuracy of the k–ω formulation with the robustness of the k–ε model in free flow. The SST model has been extensively validated for VAWT applications and is capable of capturing flow separation, unstable aerodynamic loads, and dynamic stall phenomena with reasonable accuracy. Standard model constants were used, and no transition model was activated, as the operating Reynolds number range (approximately 105–106) and the surface characteristics of the blades indicate predominantly turbulent flow over the airfoils.
Each simulation continued until periodic steady-state conditions were reached, typically after 8–10 complete rotor revolutions, when torque and force histories became cyclic and repeatable. To minimize residual transient effects, the reported mean torque and Cp values were obtained by averaging the last ten statistically periodic revolutions rather than a single revolution. Sensitivity analyses for time step and mesh independence confirmed numerical stability, with variations in the predicted power coefficient remaining within 2%, indicating that the CFD configuration was sufficiently robust to evaluate the aerodynamic performance of both configurations.
2.4. Evaluation of Power and Torque Coefficients
The average mechanical torque was then calculated by averaging over the final ten statistically periodic complete rotations after initial transients had decayed. The imposed angular velocity was constant for each prescribed TSR case; therefore, its cycle-averaged value is equal to the imposed value, although the instantaneous aerodynamic torque varies strongly with azimuthal angle.
The mechanical power extracted by the rotor was calculated as:
where ω is the angular velocity of the rotor (rad·s−1). To evaluate the aerodynamic performance of the turbine in a dimensionless form, the power coefficient Cp was calculated as:
where ρ is the air density (kg·m−3), A is the rotor swept area, and U is the free-stream wind speed (m·s−1). For the H-type Darrieus turbine with straight blades considered in this study, the swept area was defined as:
where H is the rotor height and D is the rotor diameter. The power coefficient Cp represents the fraction of the kinetic energy available in the wind that the turbine converts into useful mechanical power. In all simulations, the air density was assumed to be constant at ρ = 1.225 kg/m3, and the reference wind speed U corresponded to the inlet velocity specified in the CFD model (3.5 m/s) for the representative urban condition.
Keeping this reference area unchanged allows the increase in extracted energy caused by the passive device to be quantified consistently. Therefore, the Cp value reported for the deflector-assisted rotor is an apparent rotor-normalized coefficient: it is normalized by the bare rotor swept area, whereas the deflector modifies the effective upstream streamtube and the local kinetic-energy flux. For this reason, values slightly above the classical Betz limit should not be interpreted as a violation of the actuator-disk limit for an unbounded, bare rotor; instead, they reflect the different control volume created by a concentrator/deflector system.
By repeating this procedure for each simulated operating point, a complete set of Cp values was obtained across different rotational speeds. In addition to the average power coefficient, the instantaneous torque profiles were examined in detail to evaluate the influence of the deflector on the azimuthal torque distribution, particularly the reduction in negative torque during the half-cycle of blade rotation as it returns (downwind).
A key dimensionless performance parameter analyzed in this study was the tip-speed ratio (TSR), defined as:
where R = D/2 is the rotor radius. The simulations covered a wide range of tip-speed ratios, from approximately λ = 1.0 to λ = 5.0. This range spans the low-λ regime, where the turbine operates under deep-stall conditions with low efficiency, through the optimal operating region, and up to the high-λ regime, where blade drag and wake interactions progressively reduce the torque. Based on established performance characteristics of small three-bladed Darrieus VAWTs, the maximum power coefficient was expected within the range λ = 2–4. Preliminary results of the DMST analysis (Section 2.5) further indicated an optimal operating point near λ = 3. Consequently, the CFD simulations focused on this region, using finer increments of Δλ = 0.5 to accurately capture the peak of the Cp(λ) curve.
For each selected tip-speed ratio, the rotor angular velocity was specified, and the simulation was run until convergence and periodicity were achieved. Next, a single data point was extracted from the Cp(λ) curve. This procedure was consistently applied to both configurations: the base turbine without a deflector and the enhanced turbine with a deflector. Following the simulations, a comparative analysis was performed by plotting and tabulating the power coefficient as a function of the tip-speed ratio for both configurations. The inclusion of the deflector resulted in a systematic upward shift of the Cp curve over most of the operating range. The performance improvement was quantified by evaluating the percentage increase in Cp at the optimal tip-speed ratio, as well as under off-design conditions. The corresponding torque improvement was also analyzed. In particular, at λ = 2, where the influence of the deflector was most pronounced, the average cycle torque of the turbine equipped with a deflector was substantially higher than that of the base configuration.
These improvements can be directly attributed to the aerodynamic effect of the deflector, which redirects the incoming flow toward the leading blades, increases effective lift during the upwind half-cycle, and reduces the opposing aerodynamic forces on the trailing blades. Under representative operating conditions, the average torque coefficient was approximately 47% higher for the turbine equipped with a deflector compared to the baseline case. This magnitude of improvement is consistent with previously reported performance improvements for flat-plate flow-enhancement devices, which typically range from 20% to 50%.
To ensure a fair comparison, all other parameters—including wind speed, turbulence intensity, mesh resolution, and numerical settings—were kept identical between the base case and the deflector case. The numerical uncertainty associated with the CFD simulations, derived from residual convergence and time averaging, was small relative to the observed performance differences. Consequently, the results demonstrate that the inclusion of the deflector leads to physically significant and robust improvements in both torque output and power coefficient.
2.5. Validation of Analytical Models (DMST)
To provide a low-order consistency check for the baseline rotor, an analytical model based on the Double-Tube Multiple-Stream (DMST) theory was employed. The DMST model is a simplified aerodynamic formulation for Darrieus-type vertical-axis wind turbines (VAWTs) and was applied only to the base configuration without a deflector. In the present study, DMST was not treated as experimental validation or as a higher-accuracy benchmark than CFD; instead, it was used to verify that the bare-rotor Cp–TSR trend and optimum operating range were physically plausible before evaluating the deflector-assisted case with transient CFD. Within the DMST framework, the rotor swept area is conceptually divided into a series of independent flow tubes traversing the rotor, effectively decomposing the rotor disk into multiple parallel flow channels covering both the leading and trailing halves of the rotation. Within each flow tube, the flow is assumed to be one-dimensional, and two momentum balance equations are applied: one for the upwind interaction between the incoming flow and the blades and another for the downwind interaction following partial energy extraction. As a result of this extraction, the wind speed is reduced by an induction factor; consequently, when the flow reaches the downstream half of the rotor, it exhibits a lower effective wake velocity. By solving the force balance within each flow tube, the thrust and torque contributions generated by the blades are calculated, and the overall turbine performance is obtained by summing the contributions of all flow tubes over a complete revolution.
Several input parameters were required for the DMST calculations. First, the rotor’s geometric characteristics were specified, including the number of blades (three), the rotor radius, the rotor height, and the blade chord length, all of which were consistent with the CFD model and the actual turbine design. Second, the aerodynamic characteristics of the blade airfoil were provided in the form of tabulated lift and drag coefficients. Specifically, the lift coefficient CL(α) and the drag coefficient CD(α) were defined as functions of the angle of attack α for the NACA 0015 airfoil. These aerodynamic polars were obtained from published wind tunnel experiments and validated computational studies reported in the literature, particularly from Sandia National Laboratories’ databases on the symmetric performance of the airfoil. The dataset covered a full angular range from 0° to 180°, including post-stall behavior, which is essential because VAWT blades experience wide and rapidly varying angles of attack, especially at low tip speeds. The use of complete polar data avoids extrapolation beyond the measured values and improves the predictive accuracy of the DMST model. Additional model inputs included free-stream wind speed, set at U = 3.5 m/s to match the CFD simulations, and air density, assumed to be ρ = 1.225 kg/m3. The DMST algorithm was run by sweeping a range of tip-speed ratios λ, calculating the instantaneous aerodynamic forces on the blades as a function of the azimuthal angle, and integrating these forces over a full rotation to obtain the average torque and mechanical power at each λ. Although dynamic stall effects were not explicitly modeled in the basic DMST formulation, the use of experimentally derived CL and CD curves—which inherently include stall behavior—partially accounts for these effects. In addition, standard finite aspect ratio corrections were applied to account for the three-dimensional effects of the blades, adjusting the two-dimensional lift and drag coefficients to reflect the finite length of the blades (see the detailed coefficients in Table S1 of the Supplementary Materials).
The DMST analysis provided a trend-level reference for the turbine power-coefficient curve Cp(λ) of the base rotor configuration. This analytical curve was compared with the CFD-derived Cp(λ) results as a numerical consistency check, not as proof of physical accuracy. The DMST model predicted a maximum power coefficient of Cp = 0.45 at a tip-speed ratio of λ = 2.5, while the CFD simulations yielded Cp = 0.4459 at the same λ. This agreement indicates that the CFD setup reproduces the expected bare-rotor operating range and the correct Cp–TSR trend. Nevertheless, because DMST remains a simplified streamtube model, final physical validation requires wind-tunnel or field experiments. The comparison therefore supports the plausibility of the baseline CFD results without replacing experimental validation.
The performance curves in Figure 8 are the basis for quantifying the aerodynamic gain of the deflector. The maximum Cp increases from 0.4459 in the baseline CFD case to 0.6153 in the deflector-assisted case at the optimum operating region, corresponding to a relative improvement of approximately 38.0%.
Figure 8.
Aerodynamic performance curves of the H-Darrieus rotor: (a) power coefficient (Cp) as a function of tip-speed ratio (TSR) for the DMST, baseline CFD and deflector-assisted CFD cases; (b) mean torque response as a function of TSR for the evaluated rotational states.
It is important to note that the DMST model does not directly account for the presence of a deflector or other external flow-modifying devices, as it assumes an undisturbed free flow approaching the rotor. For this reason, the DMST approach was not applied to the deflector-enhanced configuration. Its role was limited to a low-order consistency check for the bare-rotor Cp–TSR trend. The deflector-assisted configuration was assessed directly through transient CFD flow fields, pressure contours and torque histories, and the need for future experimental validation is explicitly recognized.
2.6. Verification and Analysis of Numerical Uncertainty
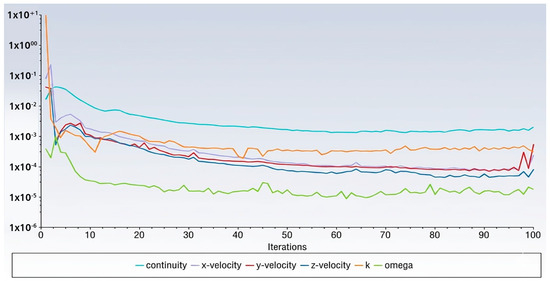
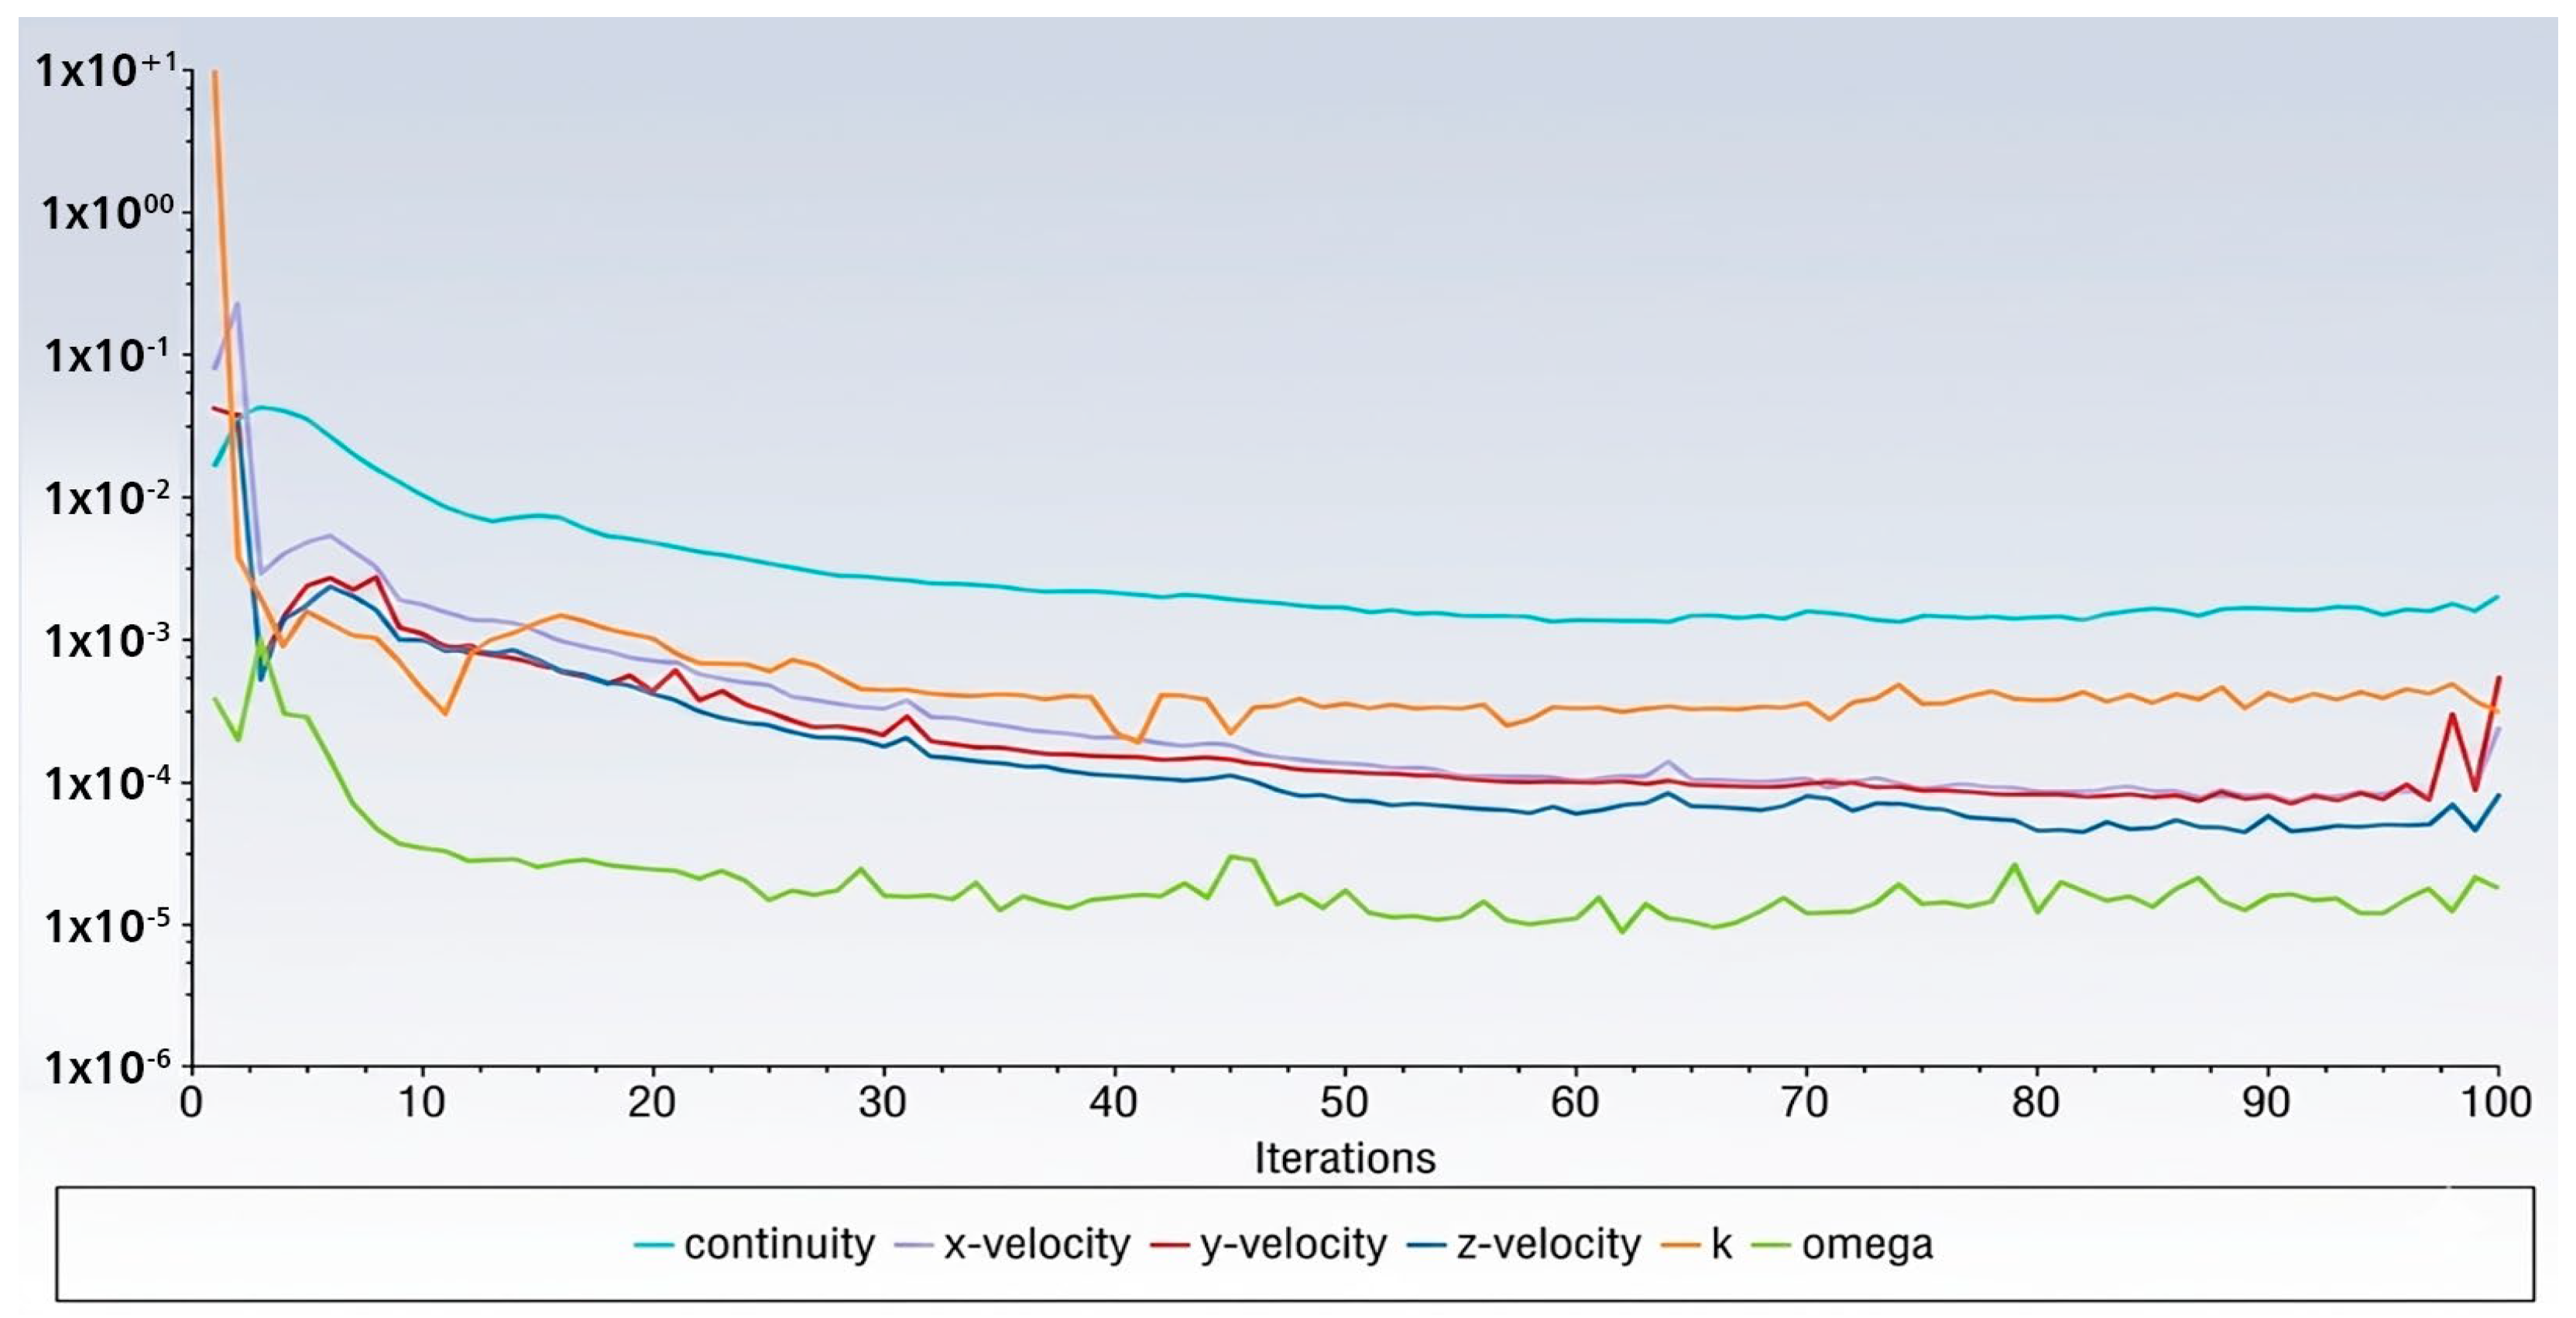
The numerical stability and iterative convergence of the transient simulations were checked by monitoring the residuals of the continuity and momentum equations. As illustrated in Figure 9, the residuals exhibited damped oscillatory behavior characteristic of periodic unsteady flows and remained below the 10−4 criterion at each time step. This residual behavior is interpreted only as evidence of numerical convergence; it does not by itself validate the physical accuracy of the CFD model. Therefore, reliability was evaluated together with mesh and time-step sensitivity, periodic torque convergence, consistency of Cp–TSR trends, and the physical plausibility of the velocity and pressure fields. Experimental wind-tunnel or field validation remains necessary for confirming the absolute accuracy of the model.
Figure 9.
Convergence history of the residuals for the deflector-augmented VAWT simulation, demonstrating numerical stability below the 10−4 criterion.
3. Results
The variables in Table 5 define the controlled comparison between the baseline rotor and the deflector-assisted rotor. Because all numerical settings were kept constant, the observed differences in Cp, torque, velocity and pressure fields can be attributed to the passive deflector.
Table 5.
Variables and operating states investigated in the baseline and deflector-assisted CFD simulations.
3.1. Characterization of Wind Resources
The analysis of local wind conditions revealed a Weibull distribution with a shape parameter k = 2.2–2.5 and a scale parameter c = 3.2–4.4 m/s (depending on the month). This indicates a moderately narrow distribution of wind speeds centered around a low mean (3 m/s). The most probable wind speeds were in the range of 2.6–3.6 m/s during the first four months of 2022, with an annual average speed of 3.4 m/s. The wind rose revealed a predominant wind direction blowing from the southeast toward the northwest, aligned with the campus orientation. This prevailing direction guided the placement of the deflector in the simulations. Turbulence intensity at the site was moderate (expected to be in the range of 15–20%), characteristic of urban environments with obstacles. Such turbulence and multidirectional flows underscore the importance of evaluating the performance of the vertical-axis wind turbine (VAWT) under variable wind conditions, as addressed in this study.
3.2. Base Rotor Performance (Without Deflector)
The modified double-multiple-streamtube (DMST) model produced a very similar trend-level peak (Cp = 0.45 at TSR = 2.5), which was consistent with the CFD result (Cp = 0.4459) and supported the plausibility of the baseline numerical setup without replacing experimental validation. Beyond the optimum, Cp dropped at higher TSRs as expected due to increased drag and a decrease in the relative angle of attack. It is worth noting that, at low TSR (<1), the turbine’s Cp was close to zero or negative, indicating the difficulty of starting up on its own without additional mechanisms. These baseline performance metrics serve as a reference for evaluating the impact of the deflector.
The torque characteristics of the base rotor were also examined. The instantaneous torque versus azimuth angle profiles show that, in the absence of a deflector, the torque of each blade fluctuates significantly over the course of one revolution. A pronounced region of negative torque is observed when a blade moves upstream (for example, around 90–180° azimuth, when the blade is on the trailing half of the rotor facing the wind). This negative torque is caused by the blade’s movement against the incoming flow, which reduces net output and causes the torque ripple. Maximum positive torque occurs when a blade moves downwind (around 0°/360° azimuth), generating lift that drives rotation. For the 3-blade base rotor, the net output torque is the sum of these three phase-shifted blade torques. The average torque was positive at the optimal TSR, but fluctuations were significant, indicating potential vibrational loads and non-uniform power delivery to the shaft during each cycle.
3.3. Rotor Performance with an Increased Deflector
The Cp reached 0.62 at TSR = 2.5, a substantial improvement of approximately 38% in peak efficiency compared to the baseline. In other words, the deflector-enabled configuration captured approximately 62% of the wind power at the optimum, exceeding the typical Betz limit-free coefficient for a bare VAWT. Across the entire TSR range, the deflector case shows higher Cp values than the baseline, especially in the mid-TSR region (2–3). The optimal TSR remained around 2.5, indicating that the deflector primarily increases the magnitude of the aerodynamic torque without requiring a significantly different tip speed ratio. It is worth noting that the CFD simulations with the deflector indicate a positive Cp even at lower TSRs (1–1.5), whereas the baseline had power close to zero or negative in that range. This suggests that the deflector could aid in automatic startup by providing extra torque at low rotor speeds. At very high TSR (>4), the Cp of the deflector housing eventually decreases and becomes negative, as the rotor overspeeds relative to the wind; however, in practice, an operational TSR of around 2–3 would be maintained for maximum power extraction.
The instantaneous torque profiles changed dramatically with the deflector. When comparing torque to azimuth angle, the deflector significantly mitigated torque fluctuations at low rotational speeds; however, at high RPM ranges such as 300–360 RPM, regions of negative torque persist due to aerodynamic drag induced by high relative velocity. With the deflector shielding the trailing blade, torque remains positive (or nearly zero in the worst-case scenario) throughout the entire 360° rotation. The blades no longer experience a strong adverse force when traveling against the wind through the deflector’s wake shadow. Furthermore, the maximum positive torque generated when the blades face the oncoming flow (around 0°/360°) increased in magnitude with the deflector. The overall effect is much smoother and higher net torque throughout the cycle for the deflector-equipped rotor. The ripple (variation) in torque is reduced, which implies less mechanical stress and more stable rotation. The model also highlights that, in the case of the deflector, the torque curve shifts upward: the minimum torque remains above zero, and the maximum torque is greater than in the baseline. This torque behavior directly explains the higher time-averaged power coefficient observed: the deflector causes each blade to perform more positive work and virtually no negative work during one revolution.
The torque behavior is documented in the Supplementary Materials through Table S6 and the newly added Figure S2, which plot torque as a function of wind speed and rotational speed. These Supplementary Data support the interpretation that the deflector improves the useful torque range under the evaluated operating states and helps explain the higher Cp reported in Figure 8.
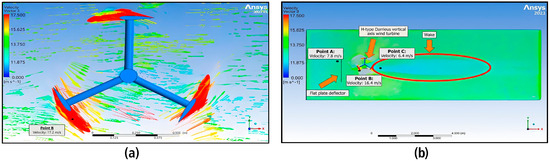
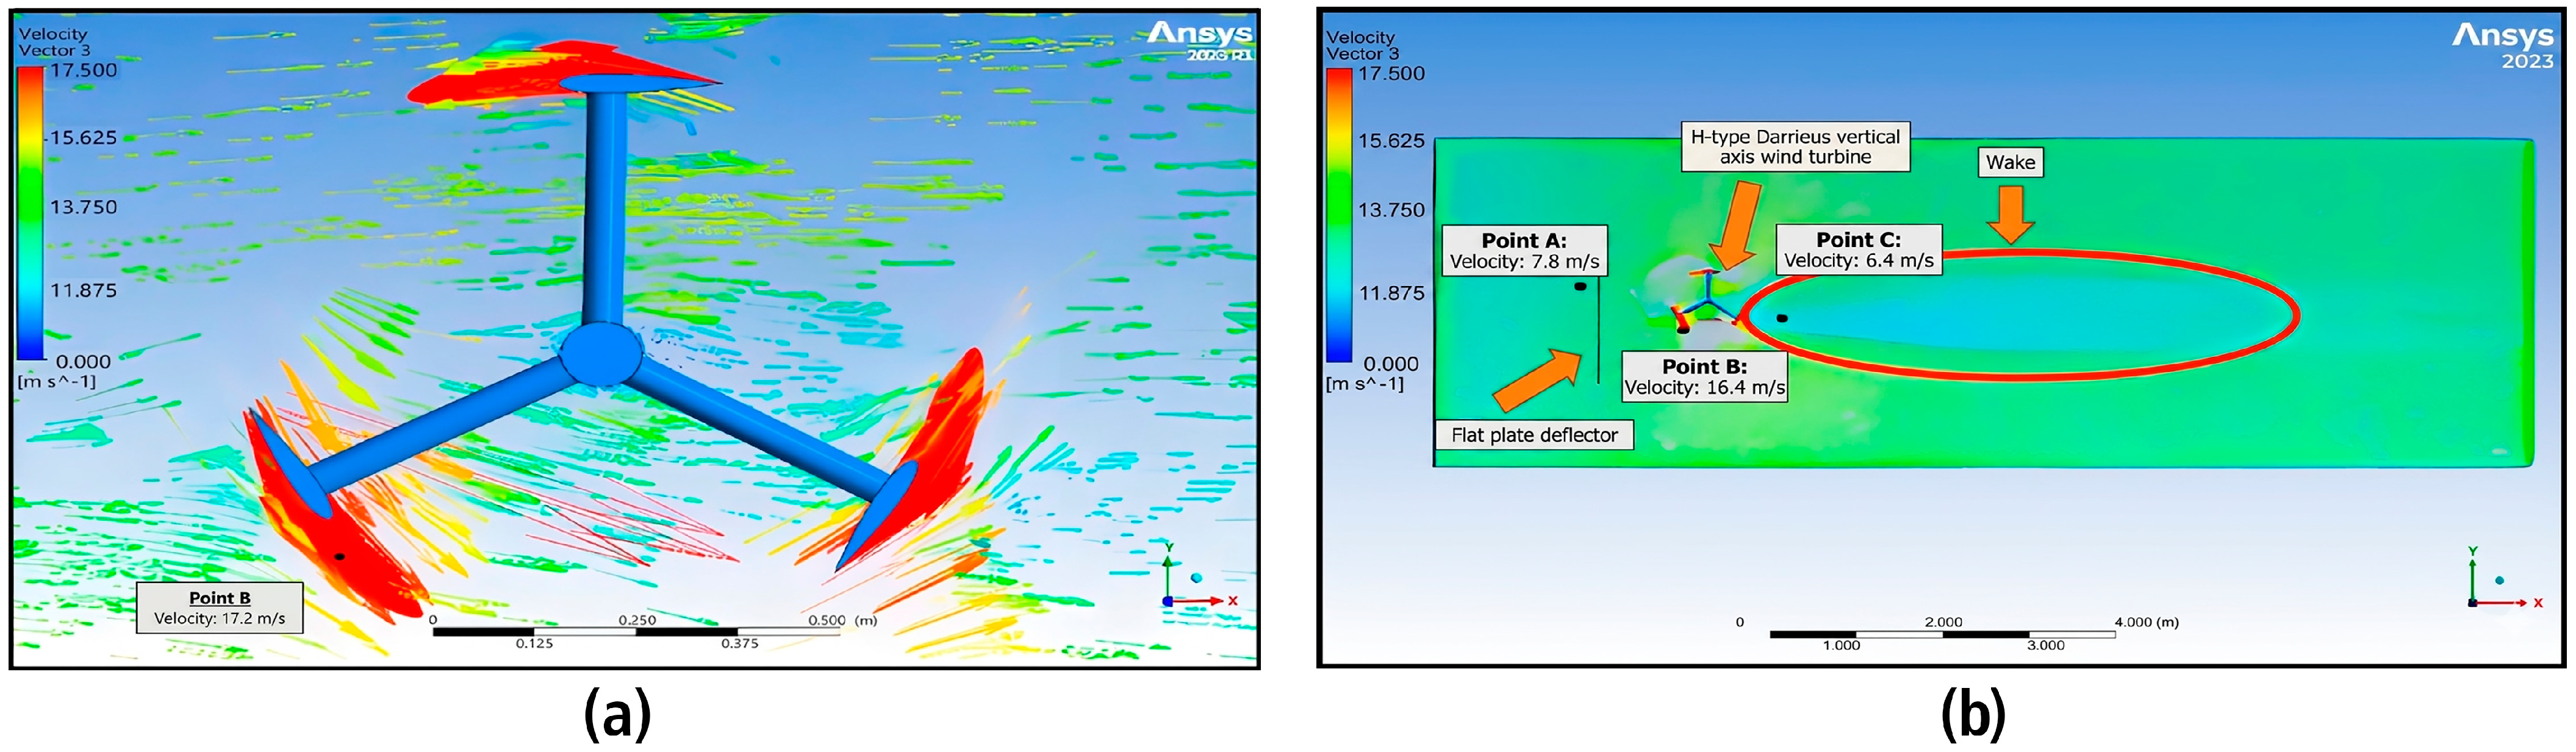
The results of the CFD flow field provide insight into how the deflector achieves these performance improvements. Quantitative analysis of the velocity fields using control points allows for validation of the channeling effect induced by the deflector. As illustrated in Figure 10, the incident flow approaching the system has a local velocity of 7.8 m/s (Point A). Upon interacting with the 30° deflector plate, the air experiences a contraction effect that accelerates the flow until it reaches a maximum velocity of 17.2 m/s (Point B) as it enters the area swept by the advancing blades. This local acceleration of the flow not only increases effective lift but also represents a superior utilization of the available kinetic energy compared to the base rotor. Finally, the flow profile at the outlet shows a reduction in velocity to 6.4 m/s (Point C), demonstrating efficient energy extraction and a low-energy wake that protects the rotor’s return phase.
Figure 10.
Quantitative analysis of the velocity field: (a) plan view of the wind-channeling and local-acceleration effect induced by the deflector; (b) transient flow profile at the outlet section. Control points A (incident flow, 7.8 m/s), B (accelerated flow, 17.2 m/s), and C (wake flow, 6.4 m/s) are identified.
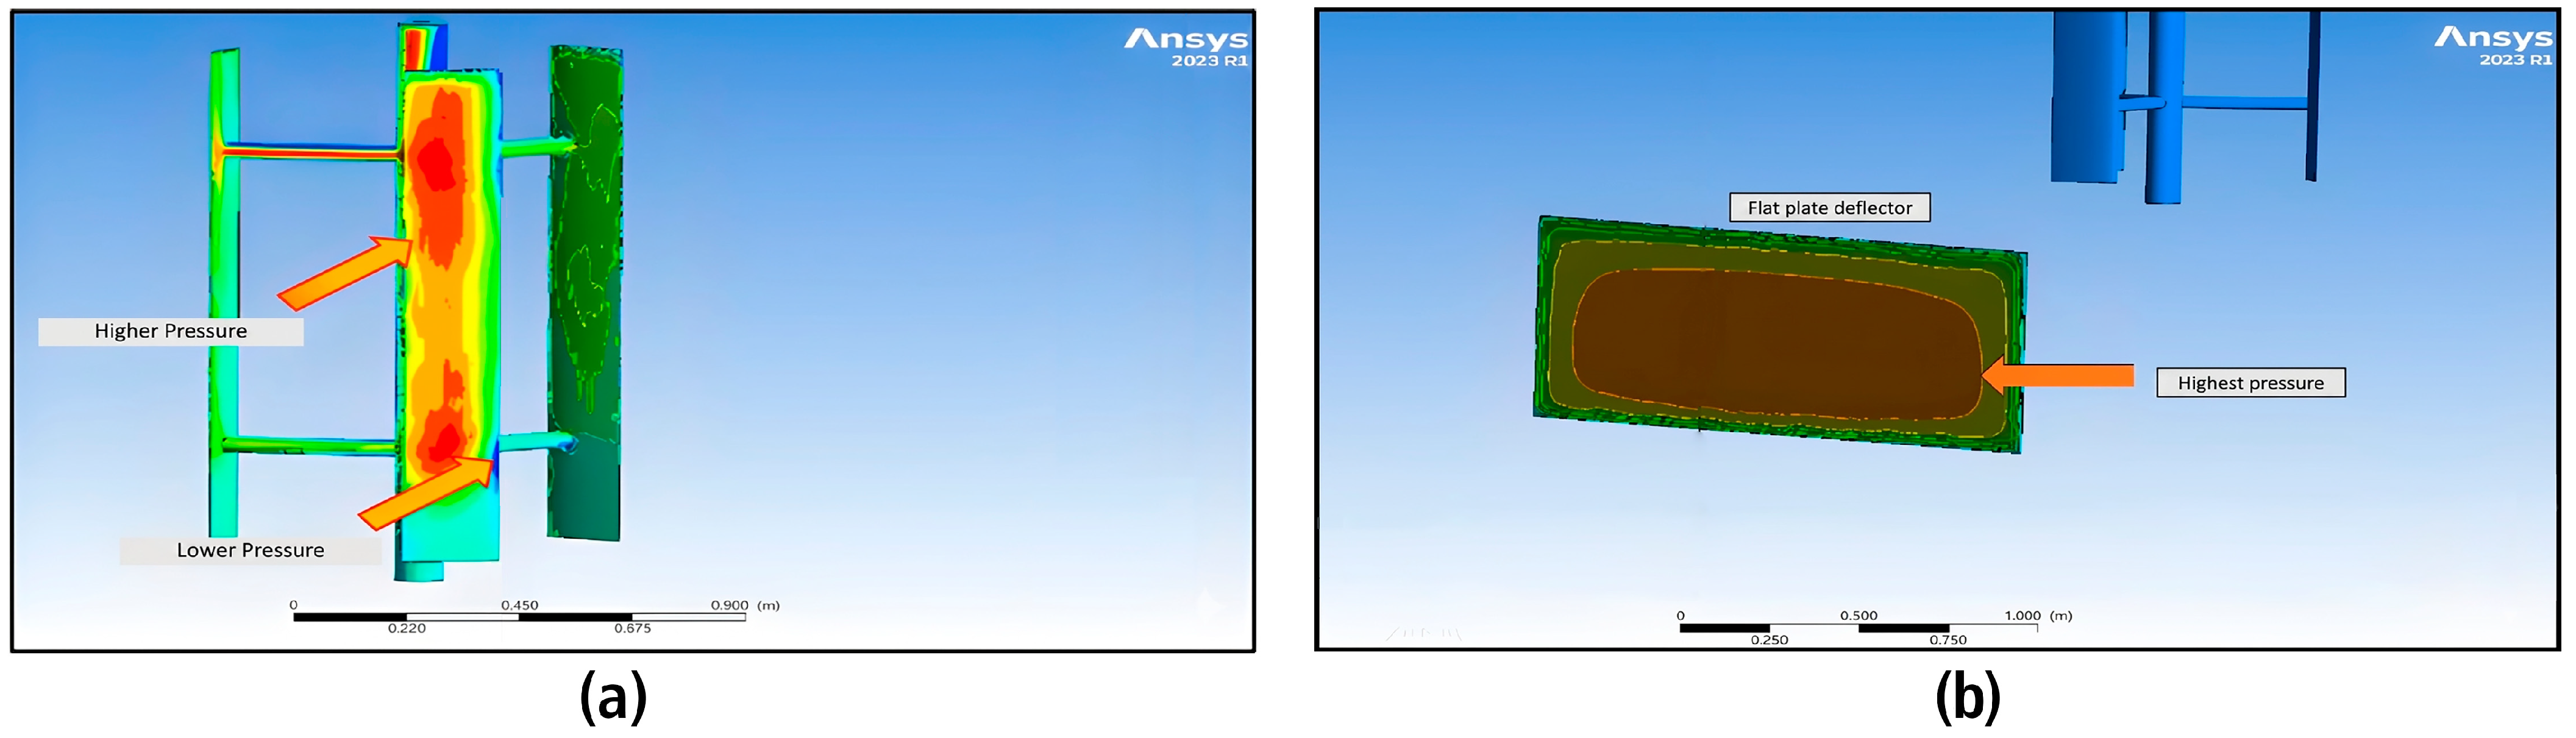
The wake behind the rotor with the deflector is narrower and shifts upward, indicating greater extraction of kinetic energy and faster flow recovery. The physical mechanism underlying the increase in performance is evident when comparing the static pressure fields of the base rotor and the enhanced configuration. As illustrated in Figure 11 (comparison of pressure distributions), the presence of the deflector fundamentally alters the system’s aerodynamics. In the optimized configuration, a zone of high static pressure is generated on the windward face of the plate, inducing a favorable pressure gradient that accelerates the flow toward the leading edge of the rotor. Simultaneously, a marked suction effect is observed on the leeward side of the deflector, which protects the blades during their return phase (180° to 360°). This redistribution of the pressure field drastically reduces the drag force opposing rotation, physically validating the mitigation of negative torque and the consequent increase in the net torque extracted by the cycle.
Figure 11.
Comparison of static-pressure contours: (a) baseline H-Darrieus rotor without a deflector and (b) rotor configured with a 30° flat-plate deflector. The deflector creates a windward high-pressure zone and a protected leeward region that reduces adverse loading on the returning blades.
A quantitative comparison was performed between the CFD and DMST results as a low-order consistency check for the bare rotor. Because DMST is an analytical streamtube model with simplifying assumptions, it was not used as an independent validation of physical accuracy. Instead, agreement between the Cp–TSR trends was used to verify that the CFD model predicted a plausible operating range for the baseline H-Darrieus rotor, while the deflector-assisted configuration was assessed directly through CFD flow fields, pressure contours and torque histories.
4. Discussion
The approximately 38.0% improvement in the power coefficient (Cp) achieved by integrating a 30° flat-plate deflector exceeds the performance reported by several contemporary flow-control technologies that operate exclusively on the blade. Al-Khawlani et al. [38] documented increases of 8–12% with an experimentally validated trailing-edge wedge flap, while Maher et al. [39] achieved a 45% improvement using a passive circular flow separator adjacent to the leading edge; both devices act locally on the boundary layer without altering the incident flow field. The present design, however, operates on the scale of the entire rotor: the 30° angle simultaneously generates a low-velocity wake region that reduces drag on the trailing blade, significantly mitigating the negative torque recorded between θ = 180° and θ = 360°, and a Venturi-type contraction effect that accelerates the flow toward the leading sector, increasing effective lift. This dual mechanism explains why Cp reaches 0.6153 at TSR = 2.5, a value that approaches double-deflector configurations such as those of Chen et al. [40] (Cp = 0.63, 70.27% improvement) and Ghafoorian et al. [41] (Cp = 0.69, 47% improvement), while requiring only one passive deflector surface. The hybrid configuration by Abbasi and Daraee [42], which combines a 45° deflector with a plasma actuator activated between 55° and 145° azimuth, reported a Cp of 0.554 (45.68% gross improvement); however, after accounting for the plasma’s energy consumption, the net improvement drops to 26.72%, a figure lower than that obtained with the passive deflector proposed here.
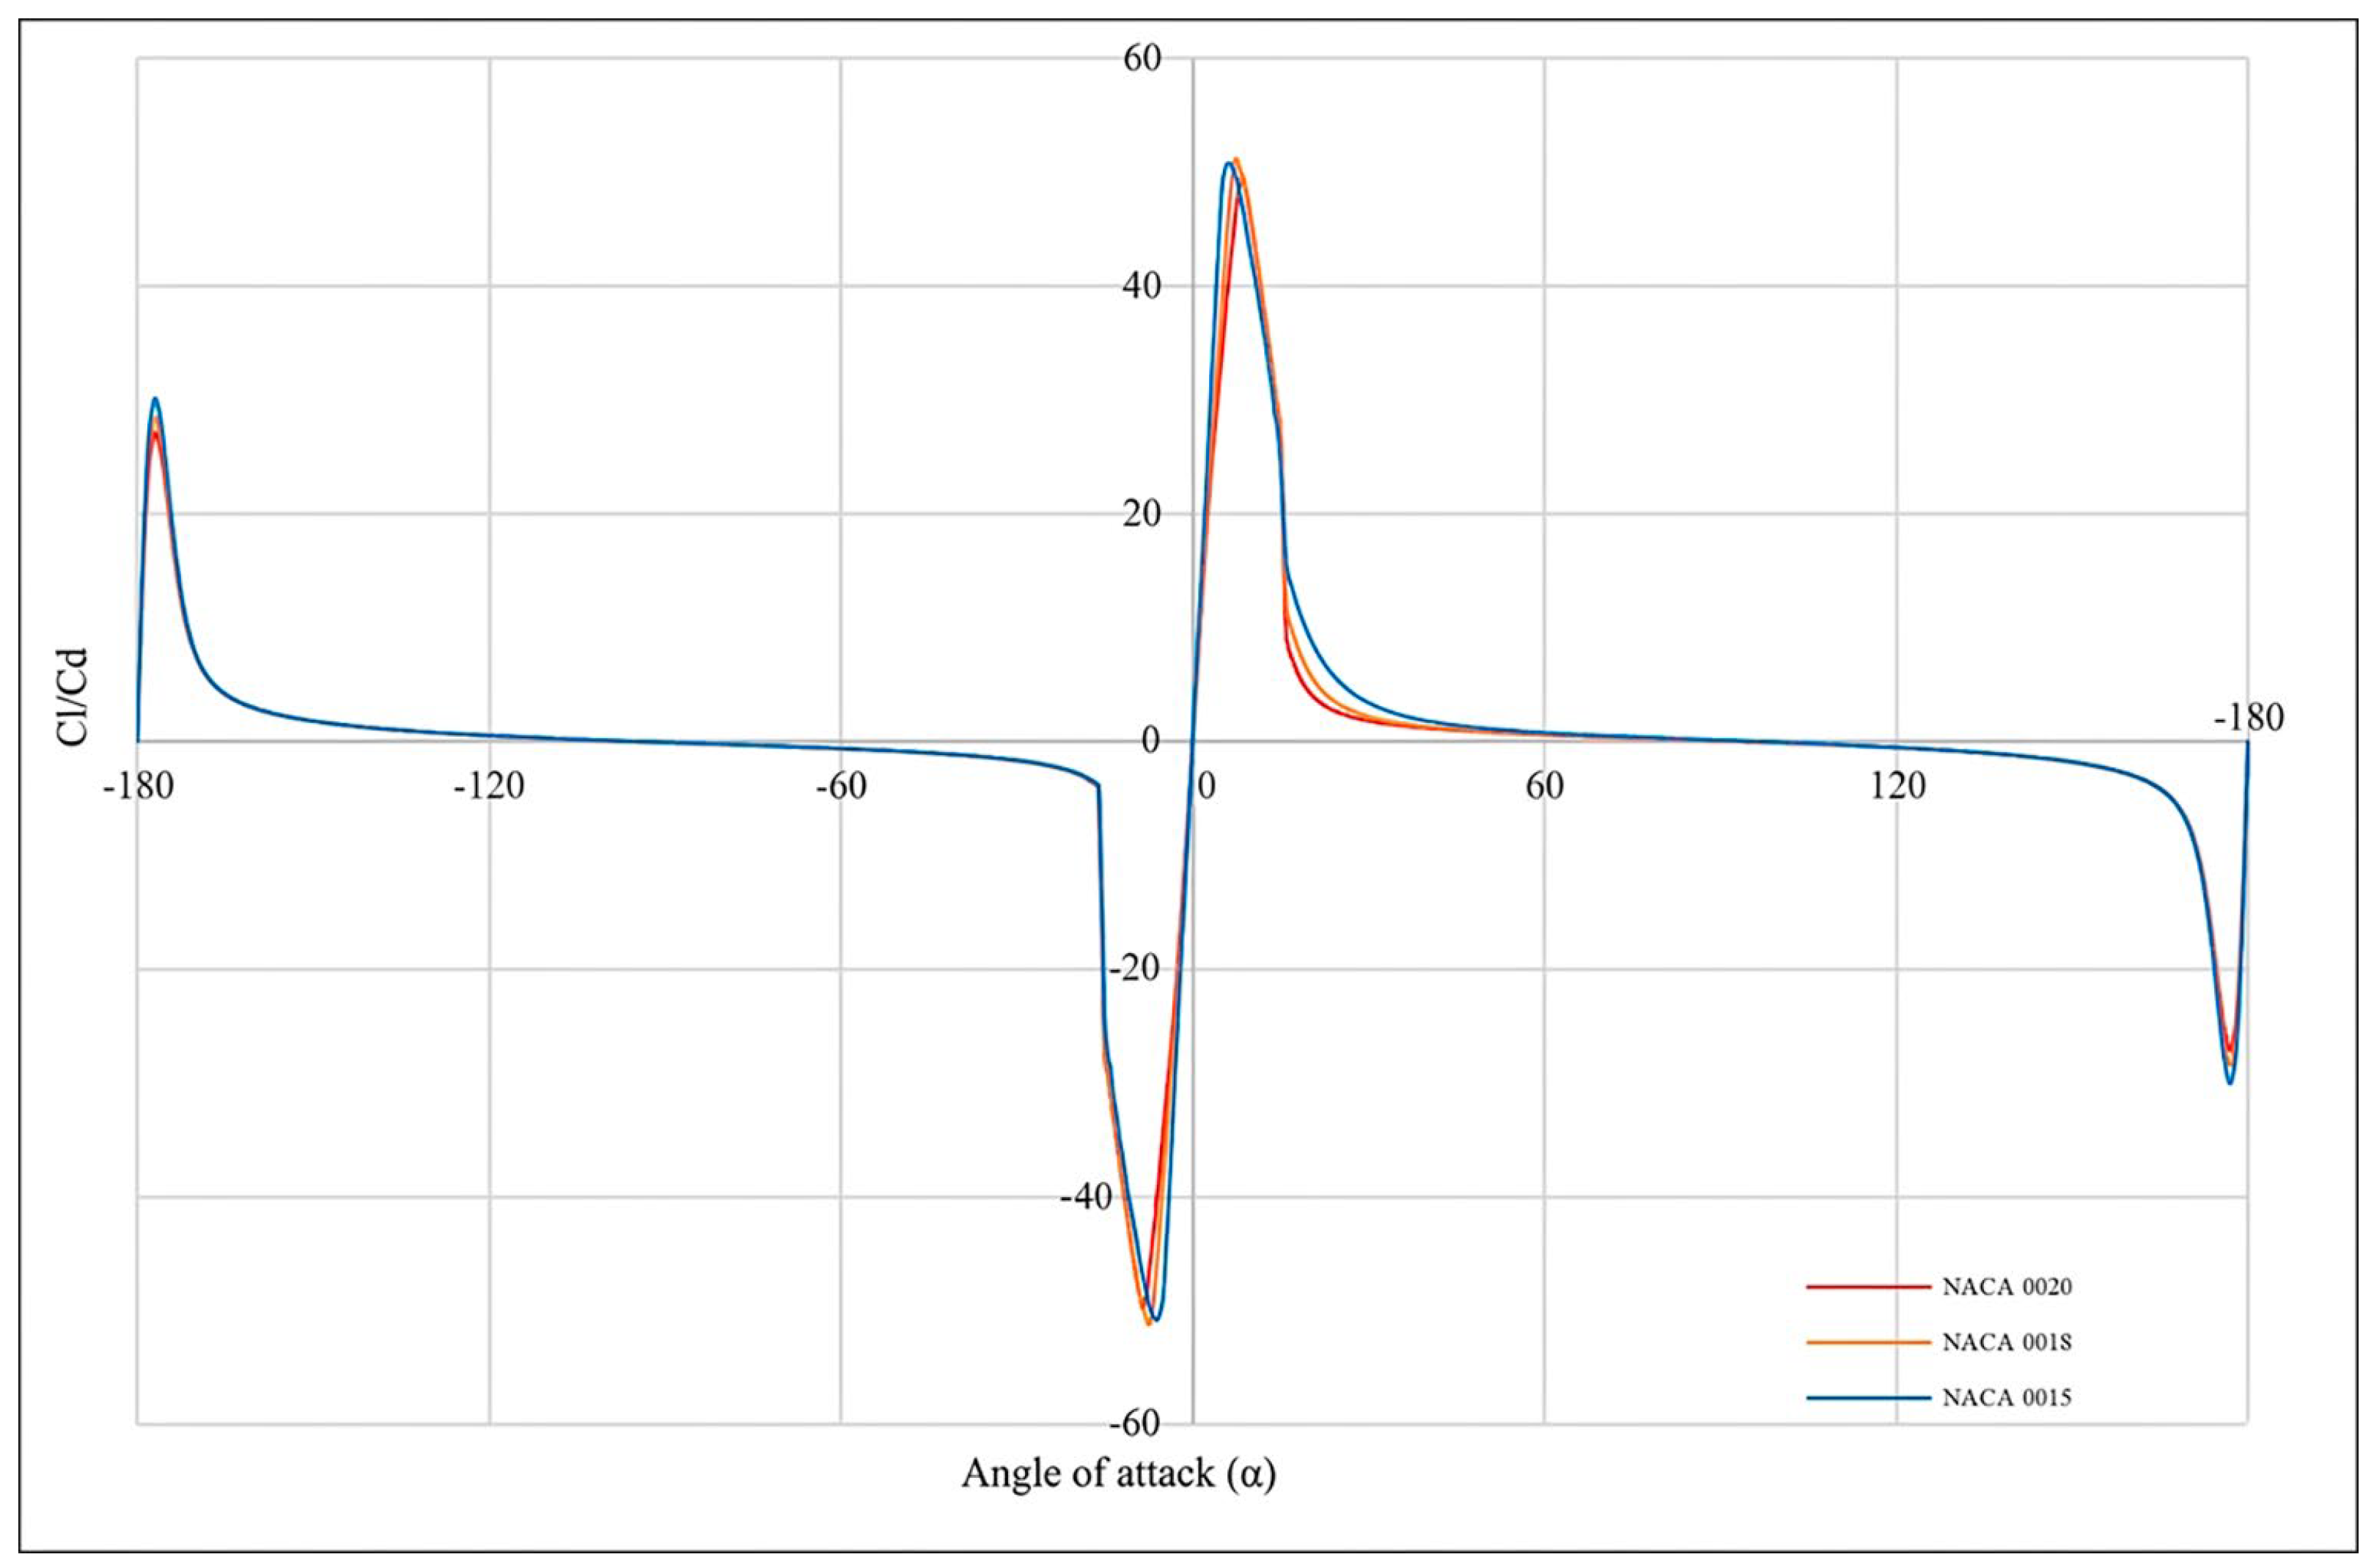
This behavior can be explained analytically by examining the evolution of the aerodynamic coefficients over a complete 360° cycle. As shown in Figure 12, the NACA 0015 airfoil experiences extreme cyclic variations in angle of attack, which induces dynamic stall phenomena characterized by a sudden increase in the drag coefficient (CD) and severe fluctuations in the lift coefficient (CL). During the return phase (180–360°), the blade inherently moves in the opposite direction to the incident flow, generating a negative torque that reduces the rotor’s net efficiency. The integration of the 30° deflector fundamentally alters this cycle by reducing the effective relative velocity over the blade during this critical interval, shifting the operating points away from the zones of highest aerodynamic drag. This protection not only stabilizes the instantaneous torque but also optimizes the lift hysteresis cycle, allowing the rotor to maintain superior rotational inertia even under the marginal wind conditions detected on the UNMSM campus.
Figure 12.
Cyclic variation in the lift (CL) and drag (CD) coefficients for the NACA 0015 airfoil over a full revolution (0–360°). The drag peaks observed in the return region (180–360°) justify the use of the deflector to mitigate negative torque and improve the overall efficiency of the cycle.
The operational feasibility of this fixed deflector is particularly advantageous for urban sites characterized by high turbulence and low average wind speeds, such as the UNMSM campus in Lima (3.4 m/s). As shown in Table 6, active control technologies—such as plasma actuators [42], oscillating flaps, or vortex cavities with optimized geometry [3]—require a continuous power supply, control electronics, and specialized maintenance, requirements that increase the levelized cost of energy and reduce reliability in distributed rooftop installations. The passive flat plate has no moving parts and no parasitic energy consumption, ensuring greater resilience against the turbulent and multidirectional flows characteristic of urban areas. While advanced configurations such as the double deflector by Chen et al. [40] achieve improvements exceeding 70%, their implementation on urban rooftops increases the aerodynamic load on the support structure and raises installation and anchoring costs. Similarly, the auxiliary blade and double deflector system by Ghafoorian et al. [41] extends the self-starting range up to TSR = 0.7, but at the cost of increased rotor stiffness and construction complexity. The single-deflector design proposed here balances the maximization of kinetic energy extraction with technical simplicity, ensuring a competitive capacity factor under marginal wind conditions where the cost–benefit ratio of the enhancement device is decisive. Although the three-dimensional URANS simulations performed capture the main flow structures with high fidelity, they have inherent limitations, such as the potential underestimation of small-scale vortex structures compared to LES (Large Eddy Simulation) models. Therefore, future research will require experimental validation in a wind tunnel to confirm long-term operational behavior.
Table 6.
Comparison of VAWT performance improvements reported for passive and active flow-control devices.
Future wind-tunnel and field validation will quantify: (i) instantaneous and cycle-averaged torque, (ii) rotational speed and TSR, (iii) electrical power and generator efficiency, (iv) pressure distribution or pressure taps on the deflector and selected blades, (v) inlet and wake velocity fields measured with hot-wire/PIV or multi-point anemometry, and (vi) turbulence intensity upstream and downstream of the rotor. These measurements will be compared with CFD using normalized errors in Cp, torque coefficient and velocity ratios at the same TSR and inlet conditions.
The influence of turbulence intensity should be interpreted carefully. The inlet TI = 10% case was selected as a conservative and numerically stable representative condition for the main comparison, whereas measured urban flows may locally reach 15–20% or higher near buildings and trees. Increasing turbulence intensity is expected to accelerate transition, thicken the wake, and modify dynamic-stall timing; consequently, it may either slightly improve low-TSR starting behavior through enhanced mixing or reduce peak Cp by increasing dissipative losses. For this reason, the revised analysis treats the 10% case as a baseline numerical condition and identifies turbulence-intensity sensitivity as a priority for experimental and future CFD work.
Table 6 places the present 3D CFD result within the range of improvements reported for recent passive and active augmentation strategies. The proposed single flat-plate deflector offers a lower-complexity alternative, although experimental validation is still required before full-scale deployment.
5. Conclusions
This study demonstrated that a vertical-axis Darrieus wind turbine (VAWT) with straight blades can substantially improve its performance for urban microgeneration by incorporating an upstream passive deflector optimized for the site’s representative wind conditions. The characterization of wind resources for the UNMSM campus in Lima revealed a low to moderate wind regime (annual average wind speed of 3.4 m/s) with a clear prevailing wind direction, justifying the adoption of a fixed deflector strategy oriented toward the dominant wind sector.
The scope of applicability of the proposed design is therefore limited to low-to-moderate wind-speed urban environments with a clearly identifiable dominant wind direction, similar to the UNMSM campus conditions analyzed here. The fixed deflector is not intended for sites with highly variable dominant directions unless the installation incorporates directional adjustment or multiple deflector orientations.
From an aerodynamic perspective, the three-dimensional evaluation based on CFD rigorously quantified the performance gain achieved. The base turbine achieved a maximum power coefficient of Cp = 0.4459 at an optimal tip speed ratio of λ = 2.5. Upon introducing the deflector into the optimized configuration, the maximum performance increased to Cp = 0.6153 at the same λ, representing an approximately 38.0% improvement in maximum efficiency. This increase is consistent with the change in the aerodynamic torque signature: the deflector mitigated torque fluctuations, reduced regions of negative torque during the return half of the rotation under nominal operating conditions, and increased positive torque on the leading sector, resulting in higher average power per cycle.
The baseline CFD performance curve showed excellent agreement (discrepancy < 1%) with the DMST-based analytical trend, supporting the numerical setup as a low-order consistency check while not replacing experimental validation.
Despite the substantial improvements demonstrated, the results must be interpreted with consideration of the limitations inherent in URANS simulations, which represent an idealized numerical environment as opposed to the highly transient gust structures of the urban reality. Consequently, long-term operational behavior will require experimental validation under real atmospheric boundary layer conditions. Future work will focus on prototype fabrication, in situ field testing, and the structural evaluation of aerodynamic loads induced by the deflector surface.
Supplementary Materials
The following supporting information can be downloaded at: https://www.mdpi.com/article/10.3390/en19122875/s1, Table S1. Minimum and maximum lift (CL) and drag (CD) coefficients for the NACA 0015 airfoil used in the analytical support calculations; Table S2. Analytical power coefficient (Cp) as a function of tip-speed ratio (λ), calculated with the DMST model for the baseline H-Darrieus rotor; Table S3. Mesh configuration and boundary-condition setup used in ANSYS for the CFD simulations; Table S4. CFD power coefficient (Cp) of the bare H-Darrieus rotor as a function of tip-speed ratio; Table S5. CFD power coefficient (Cp) of the deflector-assisted H-Darrieus rotor as a function of tip-speed ratio; Table S6. reports the torque response over the evaluated wind-speed and rotational-speed combinations, supporting the discussion of negative-torque mitigation; Table S7. Monthly CTCLIMA wind-speed and Weibull parameters for the first four months of 2022; Figure S1. Rotor behavior of the deflector-assisted VAWT as a function of rotational speed (rpm), showing the evolution of torque and power-related response under the evaluated operating states; Figure S2. Torque response map as a function of wind speed and rotational speed for the evaluated rotor operating states. The zero-torque line is included to identify operating regions with positive and negative aerodynamic torque.
Author Contributions
Conceptualization, B.S.-G., L.S.-C. and L.D.-S.; methodology, B.S.-G., L.D.-S., J.M.-P. and R.S.-F.; software, L.D.-S., G.C.-G., O.C.-C. and G.T.-M.; validation, J.M.-P., A.V.-Z. and C.S.-M.; formal analysis, B.S.-G., L.S.-C., J.P.-G. and O.O.-A.; investigation, B.S.-G., L.D.-S. and G.C.-G.; resources, L.S.-C., J.M.-P. and R.S.-F.; data curation, G.C.-G., O.C.-C., G.T.-M. and C.S.-M.; writing—original draft preparation, B.S.-G. and L.D.-S.; writing—review and editing, L.S.-C., J.M.-P. and R.S.-F.; visualization, G.C.-G. and O.O.-A.; supervision, L.S.-C. and R.S.-F.; project administration, L.S.-C. All authors have read and agreed to the published version of the manuscript.
Funding
This research did not receive external funding.
Data Availability Statement
The original contributions presented in the study are included in the article/Supplementary Material, further inquiries can be directed to the corresponding author.
Conflicts of Interest
The authors declare that there are no conflicts of interest.
Abbreviations
The following abbreviations are used in this manuscript:
| CFD | Computational Fluid Dynamics |
| Cp | Power coefficient |
| CTCLIMA | Campus Weather Station (UNMSM) |
| DMST | Double-Multiple Streamtube |
| HAWT | Horizontal Axis Wind Turbine |
| LCOE | Levelized Cost of Energy |
| NACA | National Advisory Committee for Aeronautics |
| SST | Shear Stress Transport |
| TEWF | Trailing-Edge Wedge Flap |
| UNMSM | Universidad Nacional Mayor de San Marcos |
| Urans | Unsteady Reynolds-Averaged Navier–Stokes equations |
| VAWT | Vertical Axis Wind Turbine |
References
- Icaza-Alvarez, D.; Jurado, F.; Tostado-Véliz, M. Smart energy transition with the inclusion of floating wind energy in existing hydroelectric reservoirs with a view to 2050. Ecuadorian case study. Energy Rep. 2023, 10, 2804–2816. [Google Scholar] [CrossRef] [Scilit]
- Rehman, S.; Alhems, L.M.; Alam, M.M.; Wang, L.; Toor, Z. A review of energy extraction from wind and ocean: Technologies, merits, efficiencies, and cost. Ocean Eng. 2023, 267, 113192. [Google Scholar] [CrossRef] [Scilit]
- Emdadi, B.; Moradi, R. Wind Climates and Annual Energy Production. In Rahimpour Sustainability and the Environment, 1st ed.; MRBT-E of RE, Ed.; Elsevier: Oxford, UK, 2024; pp. 227–242. [Google Scholar]
- Barthelmie, R.J.; Pryor, S.C. Climate change mitigation potential of wind energy. Climate 2021, 9, 136. [Google Scholar] [CrossRef] [Scilit]
- Larsén, X.; Zhu, R.; McKenna, R. Mapping wind resources and extreme wind: Technical and social aspects. In The SDC International Report 2020: Cooperating for Energy Transition; Aarhus University Library: Aarhus, Denmark, 2020. [Google Scholar]
- Chen, W.; Li, J.; Wu, J.; Wang, Z.; Liu, J.; Song, J.; Hu, G. Wind energy potential of a novel green building design: Three connected high-rise buildings with Y-plan layout. Energy 2026, 344, 140124. [Google Scholar] [CrossRef] [Scilit]
- Clarkero, L.; Wei, Y.-M.; De La Vega Navarro, A.; Garg, A.; Hahmann, A.N.; Khennas, S.; Azevedo, I.M.L.; Löschel, A.; Singh, A.K.; Steg, L. Energy Systems (Chapter 6). In IPCC 2022 Climate Change 2022: Mitigation of Climate Change. Contribution of Working Group III to the Sixth Assessment Report of the Intergovernmental Panel on Climate Change; IPCC: Cambridge, UK, 2023; pp. 613–746. [Google Scholar]
- Vallejo Díaz, A.; Herrera Moya, I. Urban wind energy with resilience approach for sustainable cities in tropical regions: A review. Renew. Sustain. Energy Rev. 2024, 199, 114525. [Google Scholar] [CrossRef] [Scilit]
- Anup, K.C.; Whale, J.; Urmee, T. Urban wind conditions and small wind turbines in the built environment: A review. Renew. Energy 2019, 131, 268–283. [Google Scholar] [CrossRef] [Scilit]
- Micallef, D.; Van Bussel, G. A review of urban wind energy research: Aerodynamics and other challenges. Energies 2018, 11, 2204. [Google Scholar] [CrossRef] [Scilit]
- Lunevich, I.; Kloppenburg, S.; Smits, M.; Bush, S.R. Urban wind energy futures in the making: Energy plazas, hotspots, and enclaves. Futures 2026, 176, 103763. [Google Scholar] [CrossRef] [Scilit]
- Kumar, R.; Raahemifar, K.; Fung, A.S. A critical review of vertical axis wind turbines for urban applications. Renew. Sustain. Energy Rev. 2018, 89, 281–291. [Google Scholar] [CrossRef] [Scilit]
- Liu, S.; Zhang, L.; Lu, J.; Zhang, X.; Wang, K.; Gan, Z.; Liu, X.; Jing, Z.; Cui, X.; Wang, H. Advances in urban wind resource development and wind energy harvesters. Renew. Sustain. Energy Rev. 2025, 207, 114943. [Google Scholar] [CrossRef] [Scilit]
- Reja, R.K.; Amin, R.; Tasneem, Z.; Ali, M.F.; Islam, M.R.; Saha, D.K.; Badal, F.R.; Ahamed, M.H.; Moyeen, S.I.; Das, S.K. A review of the evaluation of urban wind resources: Challenges and perspectives. Energy Build. 2022, 257, 111781. [Google Scholar] [CrossRef] [Scilit]
- Dilimulati, A.; Stathopoulos, T.; Paraschivoiu, M. Wind turbine designs for urban applications: A case study of shrouded diffuser casing for turbines. J. Wind Eng. Ind. Aerodyn. 2018, 175, 179–192. [Google Scholar] [CrossRef] [Scilit]
- Jerez, S.; Barriopedro, D.; García-López, A.; Lorente-Plazas, R.; Somoza, A.; Turco, M.; Carrillo, J.; Trigo, R. An Action-Oriented Approach to Make the Most of the Wind and Solar Power Complementarity. Earth’s Futur. 2023, 11, e2022EF003332. [Google Scholar] [CrossRef] [Scilit]
- Shen, Z.; Gong, S.; Zuo, Z.; Chen, Y.; Guo, W. Darrieus vertical-axis wind turbine performance enhancement approach and optimized design: A review. Ocean Eng. 2024, 311, 118965. [Google Scholar] [CrossRef] [Scilit]
- Costoya, X.; Decastro, M.; Carvalho, D.; Gómez-Gesteira, M. Assessing the complementarity of future hybrid wind and solar photovoltaic energy resources for North America. Renew. Sustain. Energy Rev. 2023, 173, 113101. [Google Scholar] [CrossRef] [Scilit]
- Naik, K.; Sahoo, N. Effect of J-shaped blade number on small-scale Darrieus-type straight bladed vertical axis wind turbine for low wind regime. Ocean Eng. 2026, 343, 123500. [Google Scholar] [CrossRef] [Scilit]
- Tjiu, W.; Marnoto, T.; Mat, S.; Ruslan, M.H.; Sopian, K. Darrieus vertical axis wind turbine for power generation I: Assessment of Darrieus VAWT configurations. Renew. Energy 2015, 75, 50–67. [Google Scholar] [CrossRef] [Scilit]
- Verkinderen, E.; Imam, B. A simplified dynamic model for mast design of H-Darrieus vertical axis wind turbines (VAWTs). Eng. Struct. 2015, 100, 564–576. [Google Scholar] [CrossRef] [Scilit]
- Abdel-razak, M.H.; Emam, M.; Ookawara, S.; Hassan, H. Study the performance of a novel design of twin hybrid Darrieus-Savonius vertical-axis wind turbines integrated with building water storage tanks: 3D optimization study. Renew. Energy 2026, 256, 124024. [Google Scholar] [CrossRef] [Scilit]
- Qamar, S.B.; Janajreh, I. A comprehensive analysis of solidity for cambered darrieus VAWTs. Int. J. Hydrogen Energy 2017, 42, 19420–19431. [Google Scholar] [CrossRef] [Scilit]
- Abdolahifar, A.; Karimian, S.M.H. A comprehensive three-dimensional study on Darrieus vertical axis wind turbine with slotted blade to reduce flow separation. Energy 2022, 248, 123632. [Google Scholar] [CrossRef] [Scilit]
- Shen, Z.; Gong, S.; Lu, H.; Guo, W.; Chen, W. Investigation of the effect of pitch angle of double darrieus vertical axis wind turbine based on aerodynamic performance and entropy production theory. Ocean Eng. 2024, 311, 118930. [Google Scholar] [CrossRef] [Scilit]
- Ruiz-Leo, M.L.; Gil-García, I.C.; Fernández-Guillamón, A. From Resource Assessment to AEP Correction: Methodological Framework for Comparing HAWT and VAWT Offshore Systems. J. Mar. Sci. Eng. 2025, 13, 2183. [Google Scholar] [CrossRef] [Scilit]
- Trauernicht, N.; Miguda, H.; Martinetti, A. Design guidelines for HAWT/VAWT decision-making in the context of underserved communities. Procedia CIRP 2024, 128, 448–453. [Google Scholar] [CrossRef] [Scilit]
- Dar, A.S.; Waridel, F.; Porté-Agel, F. Effect of roof fence shape on flow over a building and its impact on wind turbine performance. Renew. Energy 2025, 238, 121859. [Google Scholar] [CrossRef] [Scilit]
- Mladen, B.; Santa, R.; Jelena, T.B.; Simon, M. The Future of Vertical-Axis Wind Turbines: Opportunities, Challenges, and Sustainability Perspectives. Energies 2025, 18, 6369. [Google Scholar] [CrossRef] [Scilit]
- Alina, F.; Kuanysh, A.; Alisher, A.; Fariza, O.; Teodor, I.; Ivaylo, S. A Comparative Review of Vertical Axis Wind Turbine Designs: Savonius Rotor vs. Darrieus Rotor. Inventions 2025, 10, 95. [Google Scholar] [CrossRef] [Scilit]
- Sarmeje, C.P.; Waida, M.D.; Danladi, A. Optimization and integration of vertical axis wind turbines in hybrid renewable energy systems: A systematic review. FUDMA J. Sci. 2025, 9, 171–177. [Google Scholar]
- Cacciuttolo, C.; Cano, D.; Guardia, X.; Villicaña, E. Renewable Energy from Wind Farm Power Plants in Peru: Recent Advances, Challenges, and Future Perspectives. Sustainability 2024, 16, 1589. [Google Scholar] [CrossRef] [Scilit]
- Basack, S.; Podder, S.; Dutta, S.; Lucchi, E. Performance analysis and numerical modeling of mechanical and electrical components in a rooftop vertical-axis wind turbine. Energies 2025, 18, 1623. [Google Scholar] [CrossRef] [Scilit]
- Rascón, J.; Gosgot Angeles, W.; Oliva-Cruz, M.; Barrena Gurbillón, M.Á. Wind Characteristics and Wind Energy Potential in Andean Towns in Northern Peru between 2016 and 2020: A Case Study of the City of Chachapoyas. Sustainability 2022, 14, 5918. [Google Scholar] [CrossRef] [Scilit]
- NASA Langley Research Center (LaRC). POWER Project Data Access Viewer: Prediction of Worldwide Energy Resources. Available online: https://power.larc.nasa.gov/ (accessed on 1 February 2026).
- Google. Google Earth Web. Available online: https://earth.google.com/web (accessed on 1 February 2026).
- Rajpar, A.H.; Ali, I.; Eladwi, A.E.; Bashir, M.B.A. Recent development in the design of wind deflectors for vertical axis wind turbine: A review. Energies 2021, 14, 5140. [Google Scholar] [CrossRef] [Scilit]
- Al-Khawlani, N.A.; Fazlizan, A.; Abdalkarem, A.A.M.; Muzammil, W.K.; Harun, Z.; Ibrahim, A. Performance enhancement of a vertical-axis wind turbine using an optimised trailing-edge wedge flap: CFD and experimental investigation. Ocean Eng. 2026, 356, 125270. [Google Scholar] [CrossRef] [Scilit]
- Maher, N.S.; Ghazalla, R.A.; Mohamed, M.H.; Nawar, M.A.A.; Attai, Y.A. An innovative approach for harnessing wind power by Darrieus turbines using a passive flow controller. J. Eng. Appl. Sci. 2025, 72, 210. [Google Scholar] [CrossRef] [Scilit]
- Chen, W.-H.; Lam, T.T.; Chang, M.-H.; Jin, L.; Chueh, C.-C.; Augusto, G.L. Optimizing H-Darrieus wind turbine performance with double-deflector design. Energies 2024, 17, 503. [Google Scholar] [CrossRef] [Scilit]
- Ghafoorian, F.; Enayati, E.; Mirmotahari, S.R.; Wan, H. Self-starting improvement and performance enhancement in Darrieus VAWTs using auxiliary blades and deflectors. Machines 2024, 12, 806. [Google Scholar] [CrossRef] [Scilit]
- Daraee, M.A.; Abbasi, S. A novel approach to performance improvement of a VAWT using plasma actuators. J. Clean. Prod. 2023, 424, 138876. [Google Scholar] [CrossRef] [Scilit]

Disclaimer/Publisher’s Note: The statements, opinions and data contained in all publications are solely those of the individual author(s) and contributor(s) and not of MDPI and/or the editor(s). MDPI and/or the editor(s) disclaim responsibility for any injury to people or property resulting from any ideas, methods, instructions or products referred to in the content. |
© 2026 by the authors. Licensee MDPI, Basel, Switzerland. This article is an open access article distributed under the terms and conditions of the Creative Commons Attribution (CC BY) license.