


Abstract
Wake interactions between wind turbines have a significant impact on the performance of downstream turbines and the overall efficiency of wind farms. In this study, wind tunnel experiments were carried out to investigate the wake characteristics of multiple wind turbines under different inflow conditions, upstream yaw angles, and turbine arrangements. The applicability of a previously proposed blade optimization method for reduced-scale wind turbine wake experiments was further assessed, and several wake velocity superposition models were evaluated. The results indicate that inflow turbulence intensity has a greater influence on wake recovery than inflow velocity and that increased turbulence intensity accelerates wake mixing and velocity recovery. Moreover, an appropriate upstream yaw angle and a staggered turbine arrangement can alleviate the wake deficit experienced by the downstream turbine. Additionally, the experimental data confirm that the optimized blade design method is effective for multi-turbine wake experiments. Among the models considered, the geometric sum model shows the best agreement with the experimental data under non-yaw conditions with small turbine spacing. The present study provides useful reference data for wind farm layout optimization and wake model development.
1. Introduction
Wind energy has emerged as a crucial renewable energy source due to its abundant reserves, environmental friendliness, and high commercial viability [1,2]. However, as the space for wind farm development became increasingly constrained, the spacing between wind turbines decreased, leading to a more pronounced wake effect. With the dwindling availability of suitable development sites, wind turbines often needed to be installed in close proximity. When multiple turbines operated close to each other, the wake effect caused the wind speed of the downstream turbines to decrease, resulting in a power generation loss of up to 30% for the entire wind farm [3]. Additionally, the increased turbulence intensity from the wake raised the fatigue load on downstream turbines by about 5% to 15% compared to upstream turbines [4]. Therefore, a better understanding of wake characteristics is vital for evaluating the impact of wake interference between multiple turbines, improving wind farm power generation, and extending operational life.
Research has indicated that wake characteristics are highly susceptible to inflow conditions, yaw angle, turbine arrangement, and other parameters. Chamorro and Porte-Agel [5] found through wind tunnel experiments that wind speed recovery in the far wake region is closely related to atmospheric turbulence and that higher inflow turbulence intensity enhances wake mixing and accelerates wake recovery. Zhang et al. [6] found that higher incoming turbulence intensity increased the similarity of the wake after each downstream wind turbine. Regarding the influence of yaw angle on wake characteristics, Dou et al. [7] found through experiments that under optimal tip-speed ratio conditions, the presence of a yaw angle caused wake offset and asymmetry. Many researchers using wind tunnel tests found that setting a certain yaw angle for the upstream wind turbine could improve the output power of the downstream turbine. Kragh and Hansen [8] demonstrated that setting a yaw angle of about 30° could reduce the steady-state load on the blade by 70%, thus prolonging the service life of the wind turbine. Turbine spacing also significantly impacts the wake characteristics of multiple wind turbines. In wind farms, due to limited land space, the distance between turbines cannot be set far enough to avoid mutual influence, often resulting in a series arrangement where downstream turbines are almost entirely located in the wake area of upstream turbines. It is common to distribute turbines with a spacing of 6 to 10 turbine diameters [9]. However, considering the power generation efficiency of the entire farm and investment costs, the spacing between turbines can be appropriately adjusted. Tian et al. [10] found that reducing turbine spacing along the wind and adopting a staggered arrangement could effectively increase the total power of the wind farm. Markfort et al. [11] found that a staggered arrangement absorbed more kinetic energy than an aligned arrangement, thus improving the power generation efficiency of the entire field. This conclusion was also confirmed by Tian et al. [10].
The main methods used for studying wake characteristics include field measurement, numerical simulation, wind tunnel testing, and analytic models. While field measurement reflects real data of the wake, its accuracy can be affected by environmental instability [6]. Numerical simulation is convenient for obtaining wake characteristics at any position in the wind field but relies heavily on empirical models due to the unsteady and turbulent flow nature and requires substantial computational resources [9]. Wake models are often based on physical laws, and semi-empirical models are obtained from numerical simulation or wind tunnel test data. However, in cases of staggered arrangement and wake superimposition, where no clear physical theory exists, these models primarily rely on data and experience. Comparatively, wind tunnel testing, which relies on physical principles to accurately replicate real-world wind turbine wake, offers good controllability and is cost-effective compared to field measurement. As mentioned earlier, this method is widely used. In conclusion, wind tunnel testing is proposed as the method of choice for studying wakes in this paper. Although wind tunnel experiments provide an effective and reliable way to predict wind turbine wake, miniature turbine models must be used due to the limited size of the wind tunnel, leading to significant differences in Reynolds numbers between the prototype turbine and the turbine model, resulting in thrust coefficients that are only 30–40% of those of full-size wind turbines. Thus, faithful scaled experiments should be conducted either by modifying the rotor and airfoil geometry to match the wake and performance of full-scale turbines [12] or by designing and testing scaled wind turbine models in a way that better preserves aerodynamic similarity and performance characteristics [13]. To address the issue of the lower Reynolds number in wind tunnel testing compared to real wind fields, Huang et al. [14] developed a blade optimization design method. The objective was to create blades for a scaled wind turbine model that would achieve the desired thrust coefficient (CT) at the design blade tip-speed ratio (TSR). The wind tunnel test conducted on a single wind turbine wake demonstrated that the wake characteristics of the scaled wind turbine model closely matched those of full-scale turbines, confirming the feasibility of the method. Therefore, in this study, the blade design method proposed by Huang et al. [14] is adopted to design the scaled wind turbine model.
While basic wake behaviors under varied inflow and layout conditions are generally well documented [15], the scientific novelty of this work lies in the rigorous experimental validation of the thrust-matched blade optimization method within complex multi-turbine environments. This study effectively bridges the gap between idealized single-turbine performance and the intricate aerodynamic interactions characteristic of operational wind farms, especially under the coupled effects of inflow turbulence, yaw misalignment, and staggered configurations. By explicitly testing the scalability of this optimization methodology, the research provides a high-fidelity experimental foundation that has been previously missing for multi-turbine arrays in reduced-scale wind tunnel testing. While previous studies have validated thrust-matched scaled blades for single turbines, their aerodynamic fidelity in complex multi-turbine environments remains an open question. Therefore, the primary novelty of this study lies in providing a high-fidelity experimental validation of the thrust-matched blade optimization method within multi-turbine arrays, particularly under the coupled effects of inflow turbulence, yaw misalignment, and staggered configurations. Additionally, this study utilizes this experimental dataset to evaluate the accuracy of existing wake velocity superposition models under controlled, multi-parameter wind tunnel conditions. To sum up, the paper’s content is organized as follows: the second section introduces the wind tunnel test settings, the third section presents the findings of this experiment and the characteristics of multi-turbine wake, the fourth section discusses the comparative analysis of the wake superposition model and the wind tunnel test results, and finally, conclusions are provided.
2. Experimental Setup and Procedure
This section details the experimental setup, encompassing the design of the wind turbine model, the test scheme, the arrangement of test conditions, and the verification of the inflow wind field.
2.1. Settings of Wind Turbine Models and Wind Farm Layouts
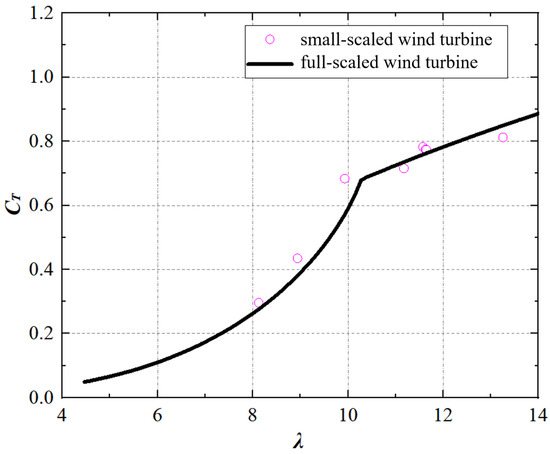
The experimental setup utilizes 1:400 scale models of 2 MW three-blade wind turbines. The driving system includes a turbine rotor, DC motor, and a tower. The diameter of the turbine rotors is 380 mm (D), the hub height of the wind turbines is 235 mm (H), and the tower diameter is 12 mm. The scaled blade optimization method proposed by Huang et al. [14] aims to develop a blade optimization methodology suitable for small-scale wind tunnel tests of turbine wakes. Based on this research, it can be concluded that the wind turbine model with the blades redesigned using the proposed optimization methodology achieves a thrust coefficient consistent with that of the prototype, which facilitates the reproduction of wake characteristics in reduced-scale experiments. To provide a direct aerodynamic validation of the reduced-scale turbine model, the measured thrust coefficient as a function of the tip-speed ratio is presented in Figure 1. As illustrated, the optimized scaled blades successfully reproduce the target full-scale aerodynamic behavior within the design operational range. Specifically, under the tested inflow conditions, the model maintains a stable thrust coefficient of approximately 0.8 at the design TSR of 8.5. During the experimental campaign, the rotor speeds were precisely regulated via external DC motors to lock this optimal operating point. Given the 1:400 geometric scale and the tested inflow velocities, the turbine model inevitably operates at a reduced-Reynolds-number regime compared to the full-scale prototype. Although the reduced-scale model inevitably operates at a lower Reynolds number compared to the full-scale prototype due to geometric scaling, this mismatch primarily influences the blade boundary layer behavior and fine-scale turbulence structures in the immediate near-wake region. The present study focuses primarily on the macroscopic statistical characteristics of the wake—specifically, the mean velocity deficit and added turbulence intensity in the transition and far-wake regions (4D to 6D downstream). The previous literature has established that these macroscopic statistical wake properties are predominantly governed by the overall momentum extraction (characterized by matching the thrust coefficient, CT) and ambient inflow conditions, rather than blade-scale viscous effects. Therefore, by ensuring macro-scale aerodynamic similarity through the thrust-matched blade optimization, the Reynolds number effects on the targeted wake statistical characteristics in this experimental campaign can be considered negligible.
Figure 1.
curve of small-scale and full-scale wind turbines.
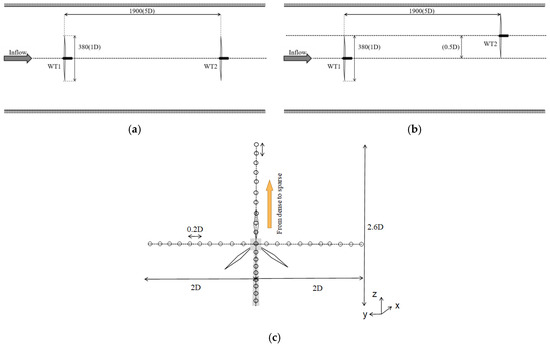
Table 1 provides detailed information on the test cases. In the naming convention of these cases, U represents the incoming wind speed (m/s) at the hub height, Iu represents the incoming turbulence intensity at the hub height, and γ represents the yaw angle (°) of the upstream turbine. The test layouts are depicted in Figure 2: WT1 denotes the upstream wind turbine, WT2 is the downstream wind turbine in aligned arrangement, and WT2’ is the downstream wind turbine in staggered arrangement. The measurement locations of the wake area are 4D, 5D and 6D behind the downstream wind turbine.
Table 1.
Wind tunnel test conditions.
Figure 2.
Schematic diagrams of (a,b) wind farm layouts and (c) measurement point layout.
The test investigates both single wind turbine (SWT) and multiple wind turbine (MWT) configurations, including non-yaw and yaw conditions. The yaw conditions pertain solely to the upstream wind turbine, with the yaw direction being counterclockwise. The MWT test conditions are further divided into aligned and staggered arrangements. Figure 2a,b schematically illustrate the two wind farm layouts compared in this study, while the measurement locations at 4D, 5D, and 6D behind the downstream turbine are illustrated in the measurement point layout in Figure 2c. As revealed in Figure 2a, two wind turbine models were arranged as an aligned layout with a 5D spacing in the streamwise direction, referred to as the MWT aligned layout. In Figure 2b, the two wind turbines are staggered with a spanwise distance of 0.5D, referred to as the MWT staggered layout. It should be noted that both the MWT staggered and MWT aligned layouts maintain the same streamwise spacing of 5D. In the wake tests of the SWT, the effects of different inflow wind speeds and inflow turbulence under non-yaw conditions are considered. For the MWT tests, the effects of varying inflow wind speeds, different inflow turbulence, differing yaw angles of upstream wind turbines, and different turbine arrangements are examined.
A Cobra Probe anemometry system (Turbulent Flow Instrumentation Pty Ltd., Tallangatta, Australia) was utilized to measure the turbulent flow characteristics over the wind farms under different test cases. The measurement range of the anemometry system is 2 to 100 m/s, with an accuracy level of 0.50%. Furthermore, since the wake field is reconstructed from sequential single-point measurements, the current approach does not directly characterize instantaneous phenomena such as wake meandering or the evolution of coherent turbulent structures. Using the Cobra Probe, all three components of the velocity vector can be measured instantaneously. The time-averaged velocity and turbulent kinetic energy can also be calculated from the instantaneous measurement data. For the measurement results presented in this study, the sampling rate of the instantaneous velocity vector was set at 1000 Hz, with a measurement period of 60 s at each point of interest. This large sample size (60,000 samples per point) ensures highly converged time-averaged statistics, rendering the standard error of the mean negligible and ensuring high confidence in the measured wake profiles. McTavish et al. [16] asserted that when the blockage ratio of the model is less than 10%, the wake expansion in the experiment is similar to that of free flow. In this wind tunnel experiment, the blockage ratios for the aligned and staggered arrangements were 2.63% and 4.22%, respectively. Therefore, the blockage effect induced by the interference between the flow and the tunnel wall is negligible, ensuring the full development of the wake in the test section.
2.2. Verification of Atmospheric Boundary Layer Inflow
The experimental study was conducted in the open-type wind tunnel laboratory of Chongqing University (CQU-WT01). The test section is 15.12 m (length) × 2.4 m (width) × 1.8 m (height). The maximum wind speed of the wind tunnel is 35 m/s.
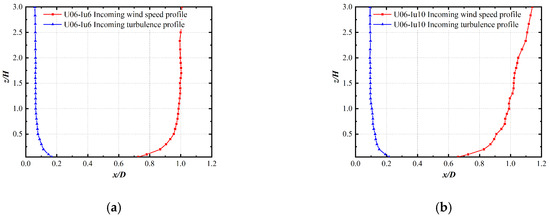
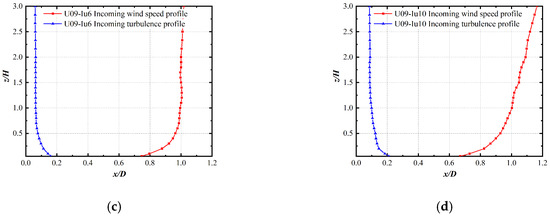
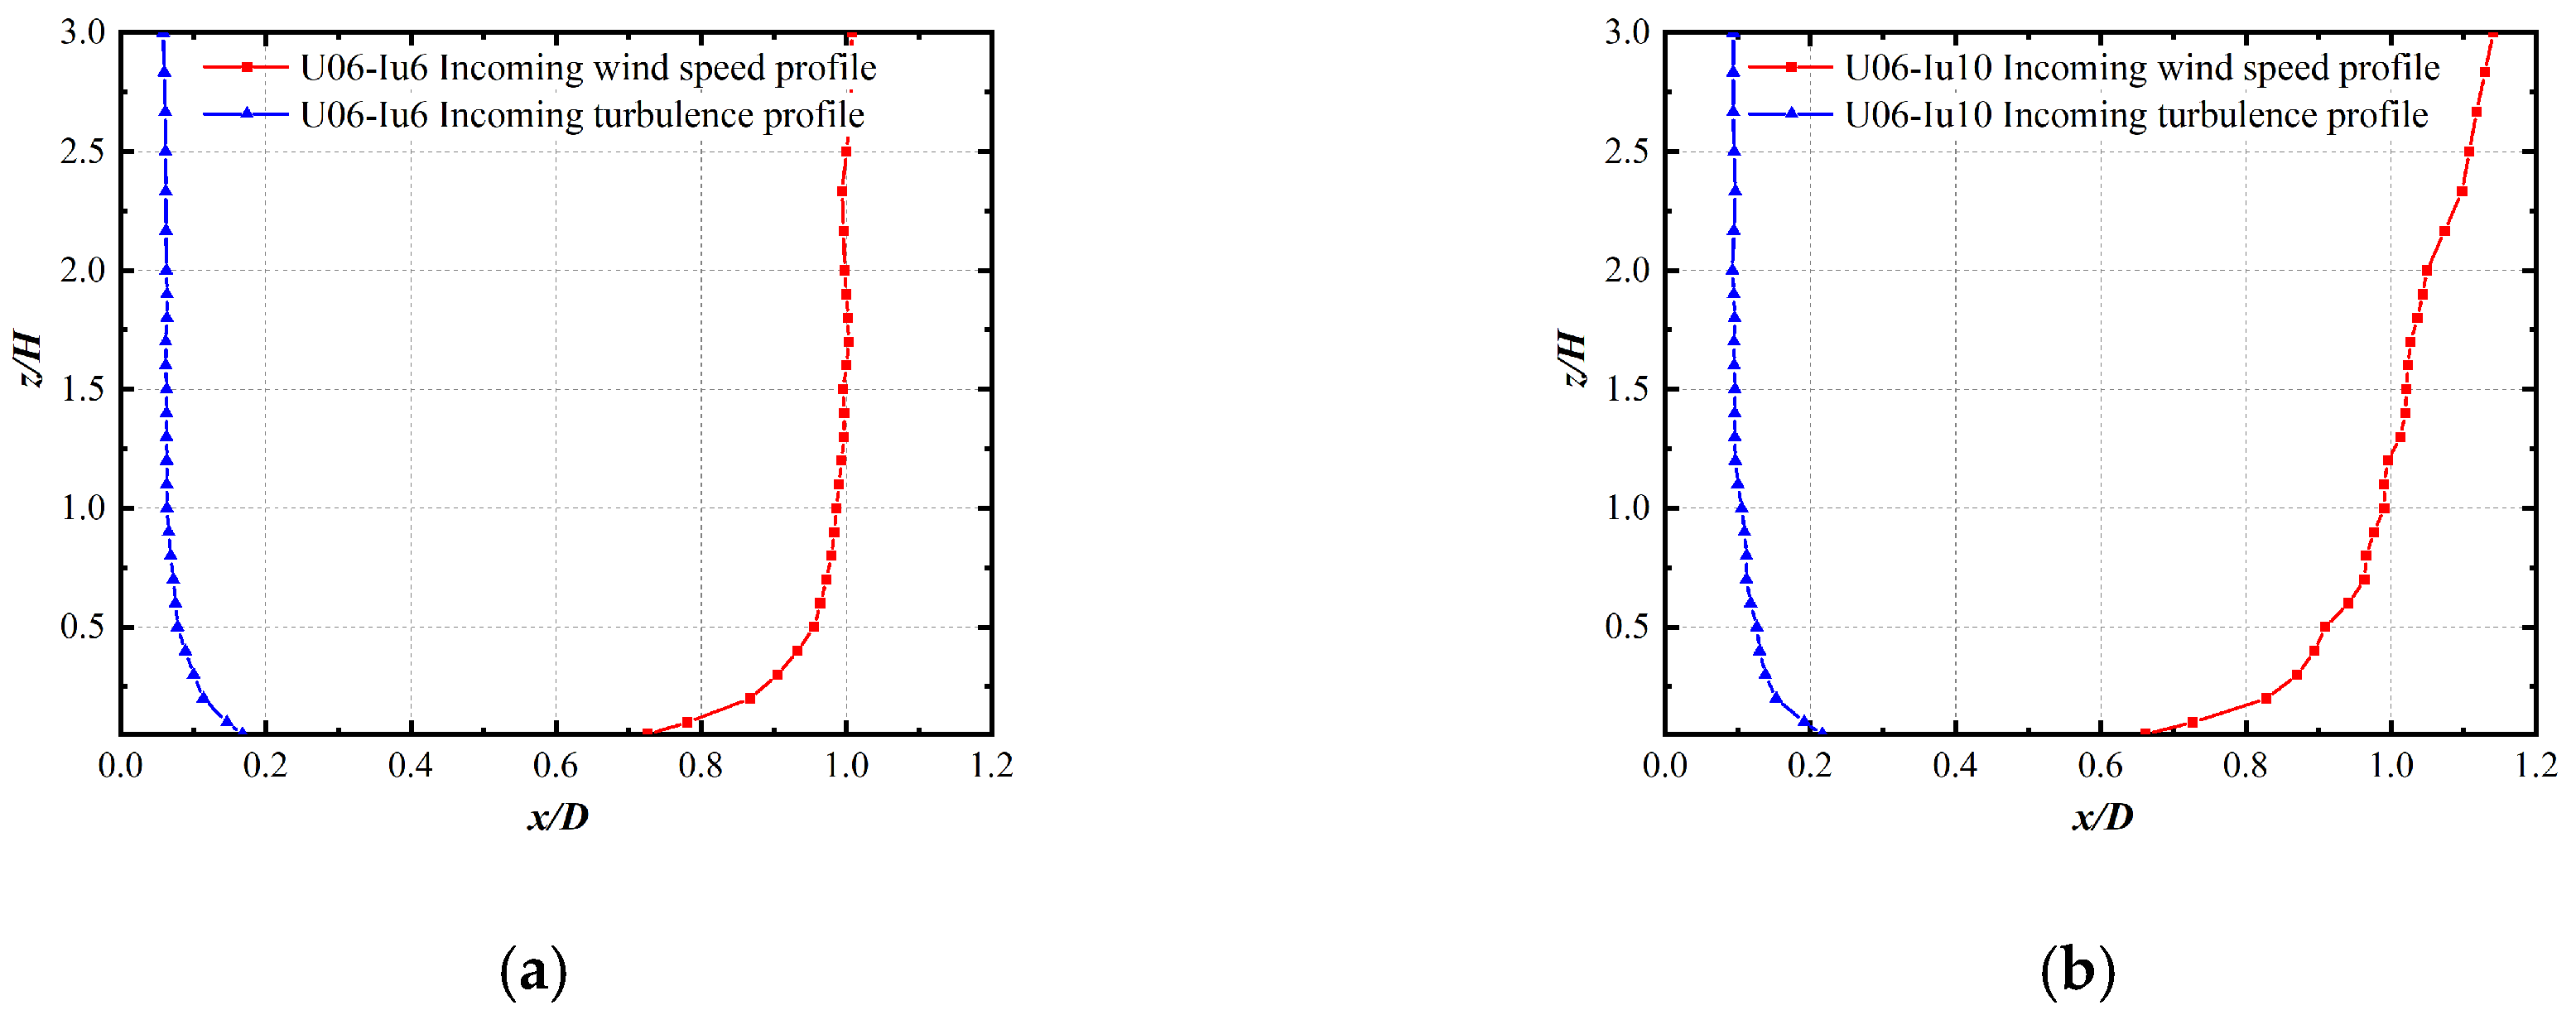
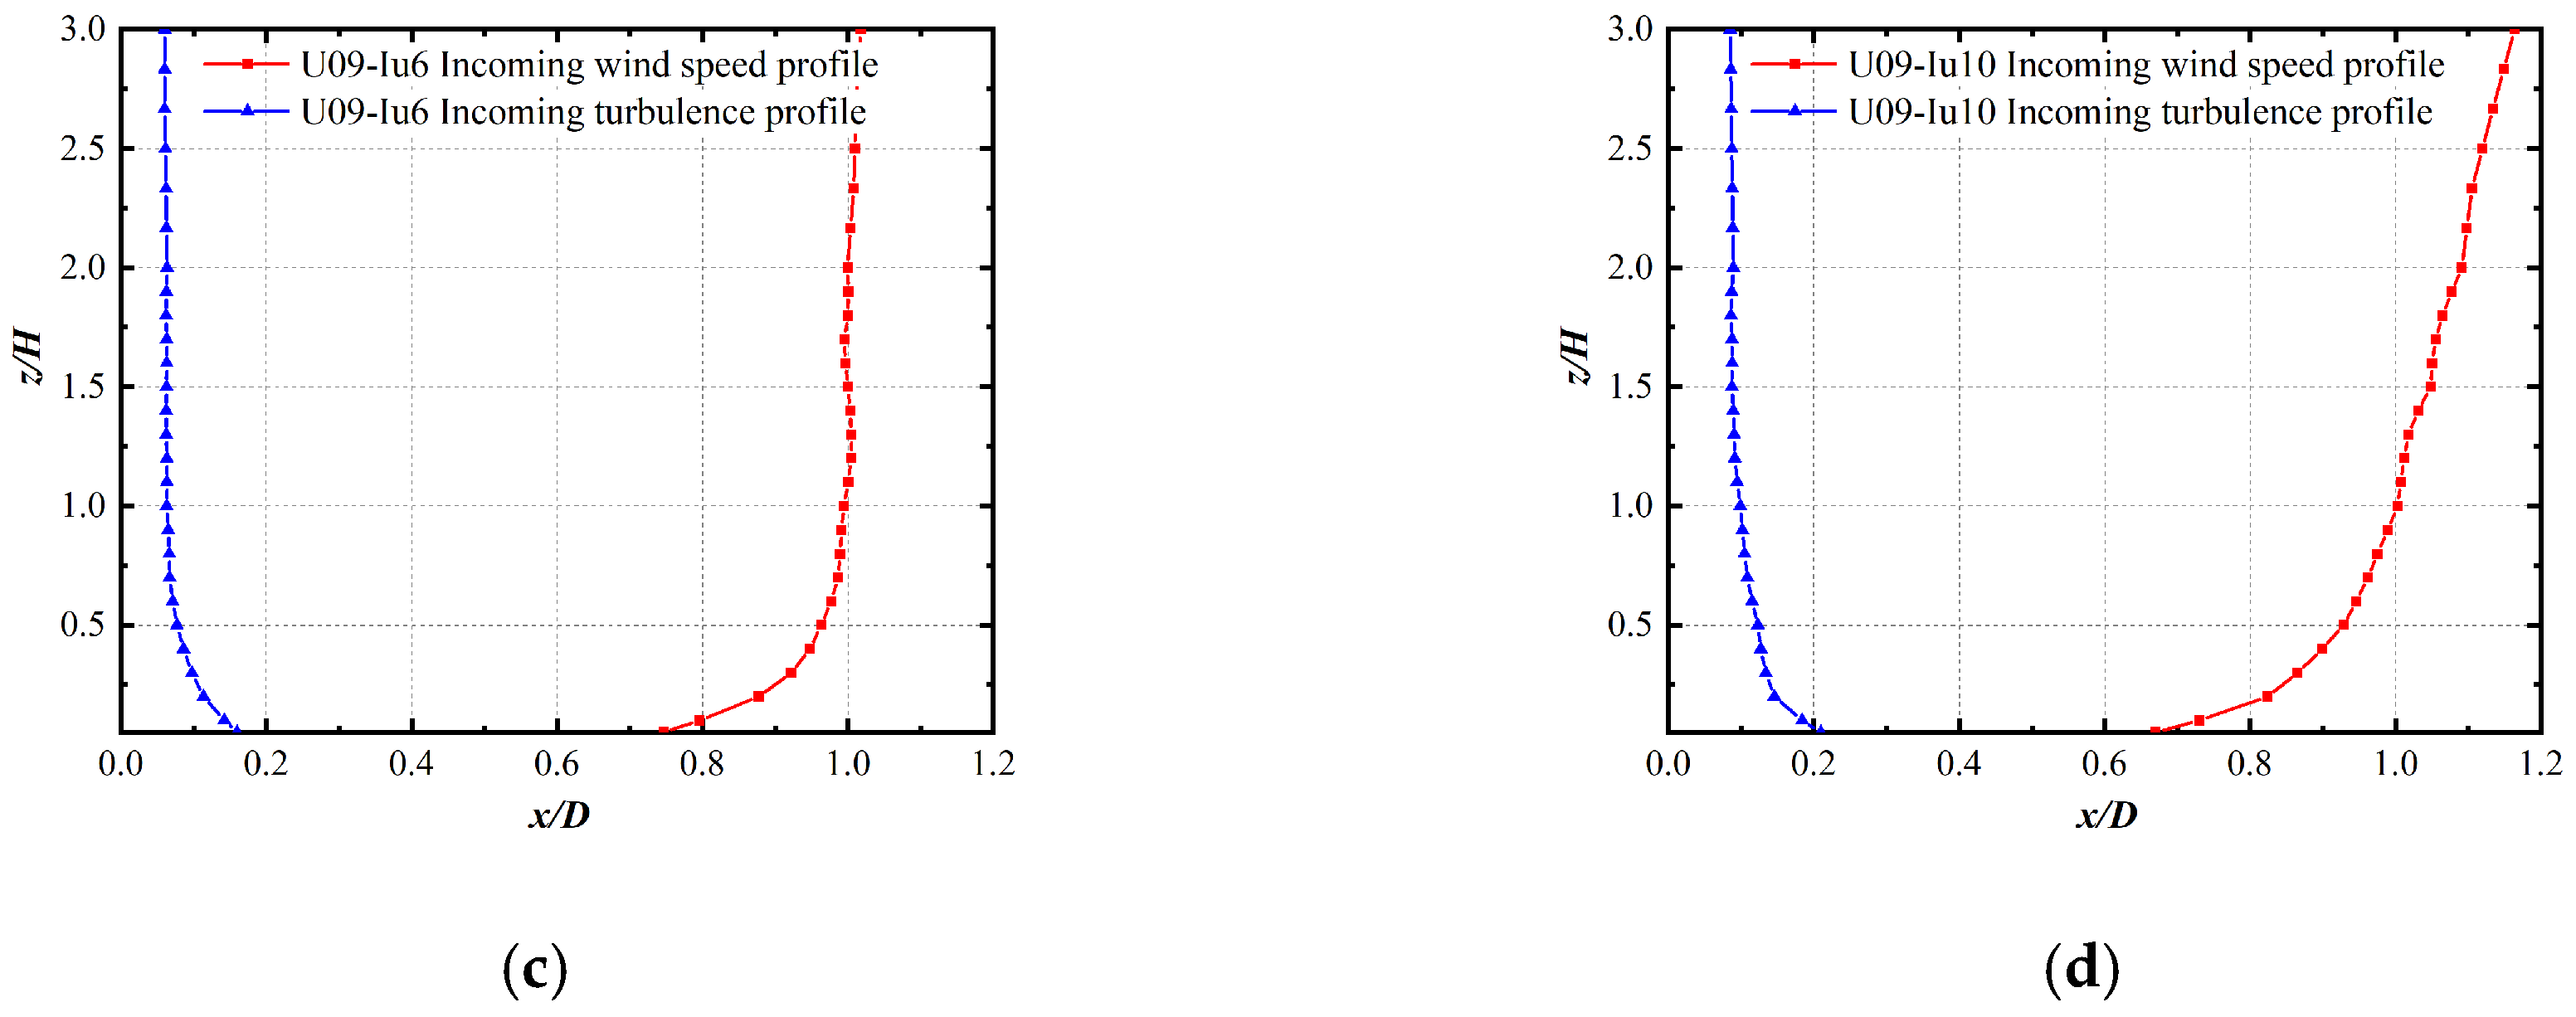
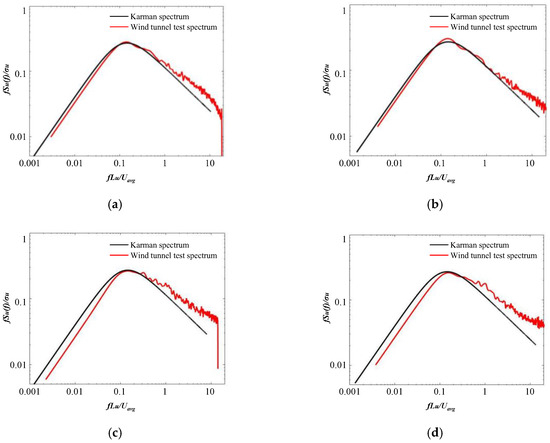
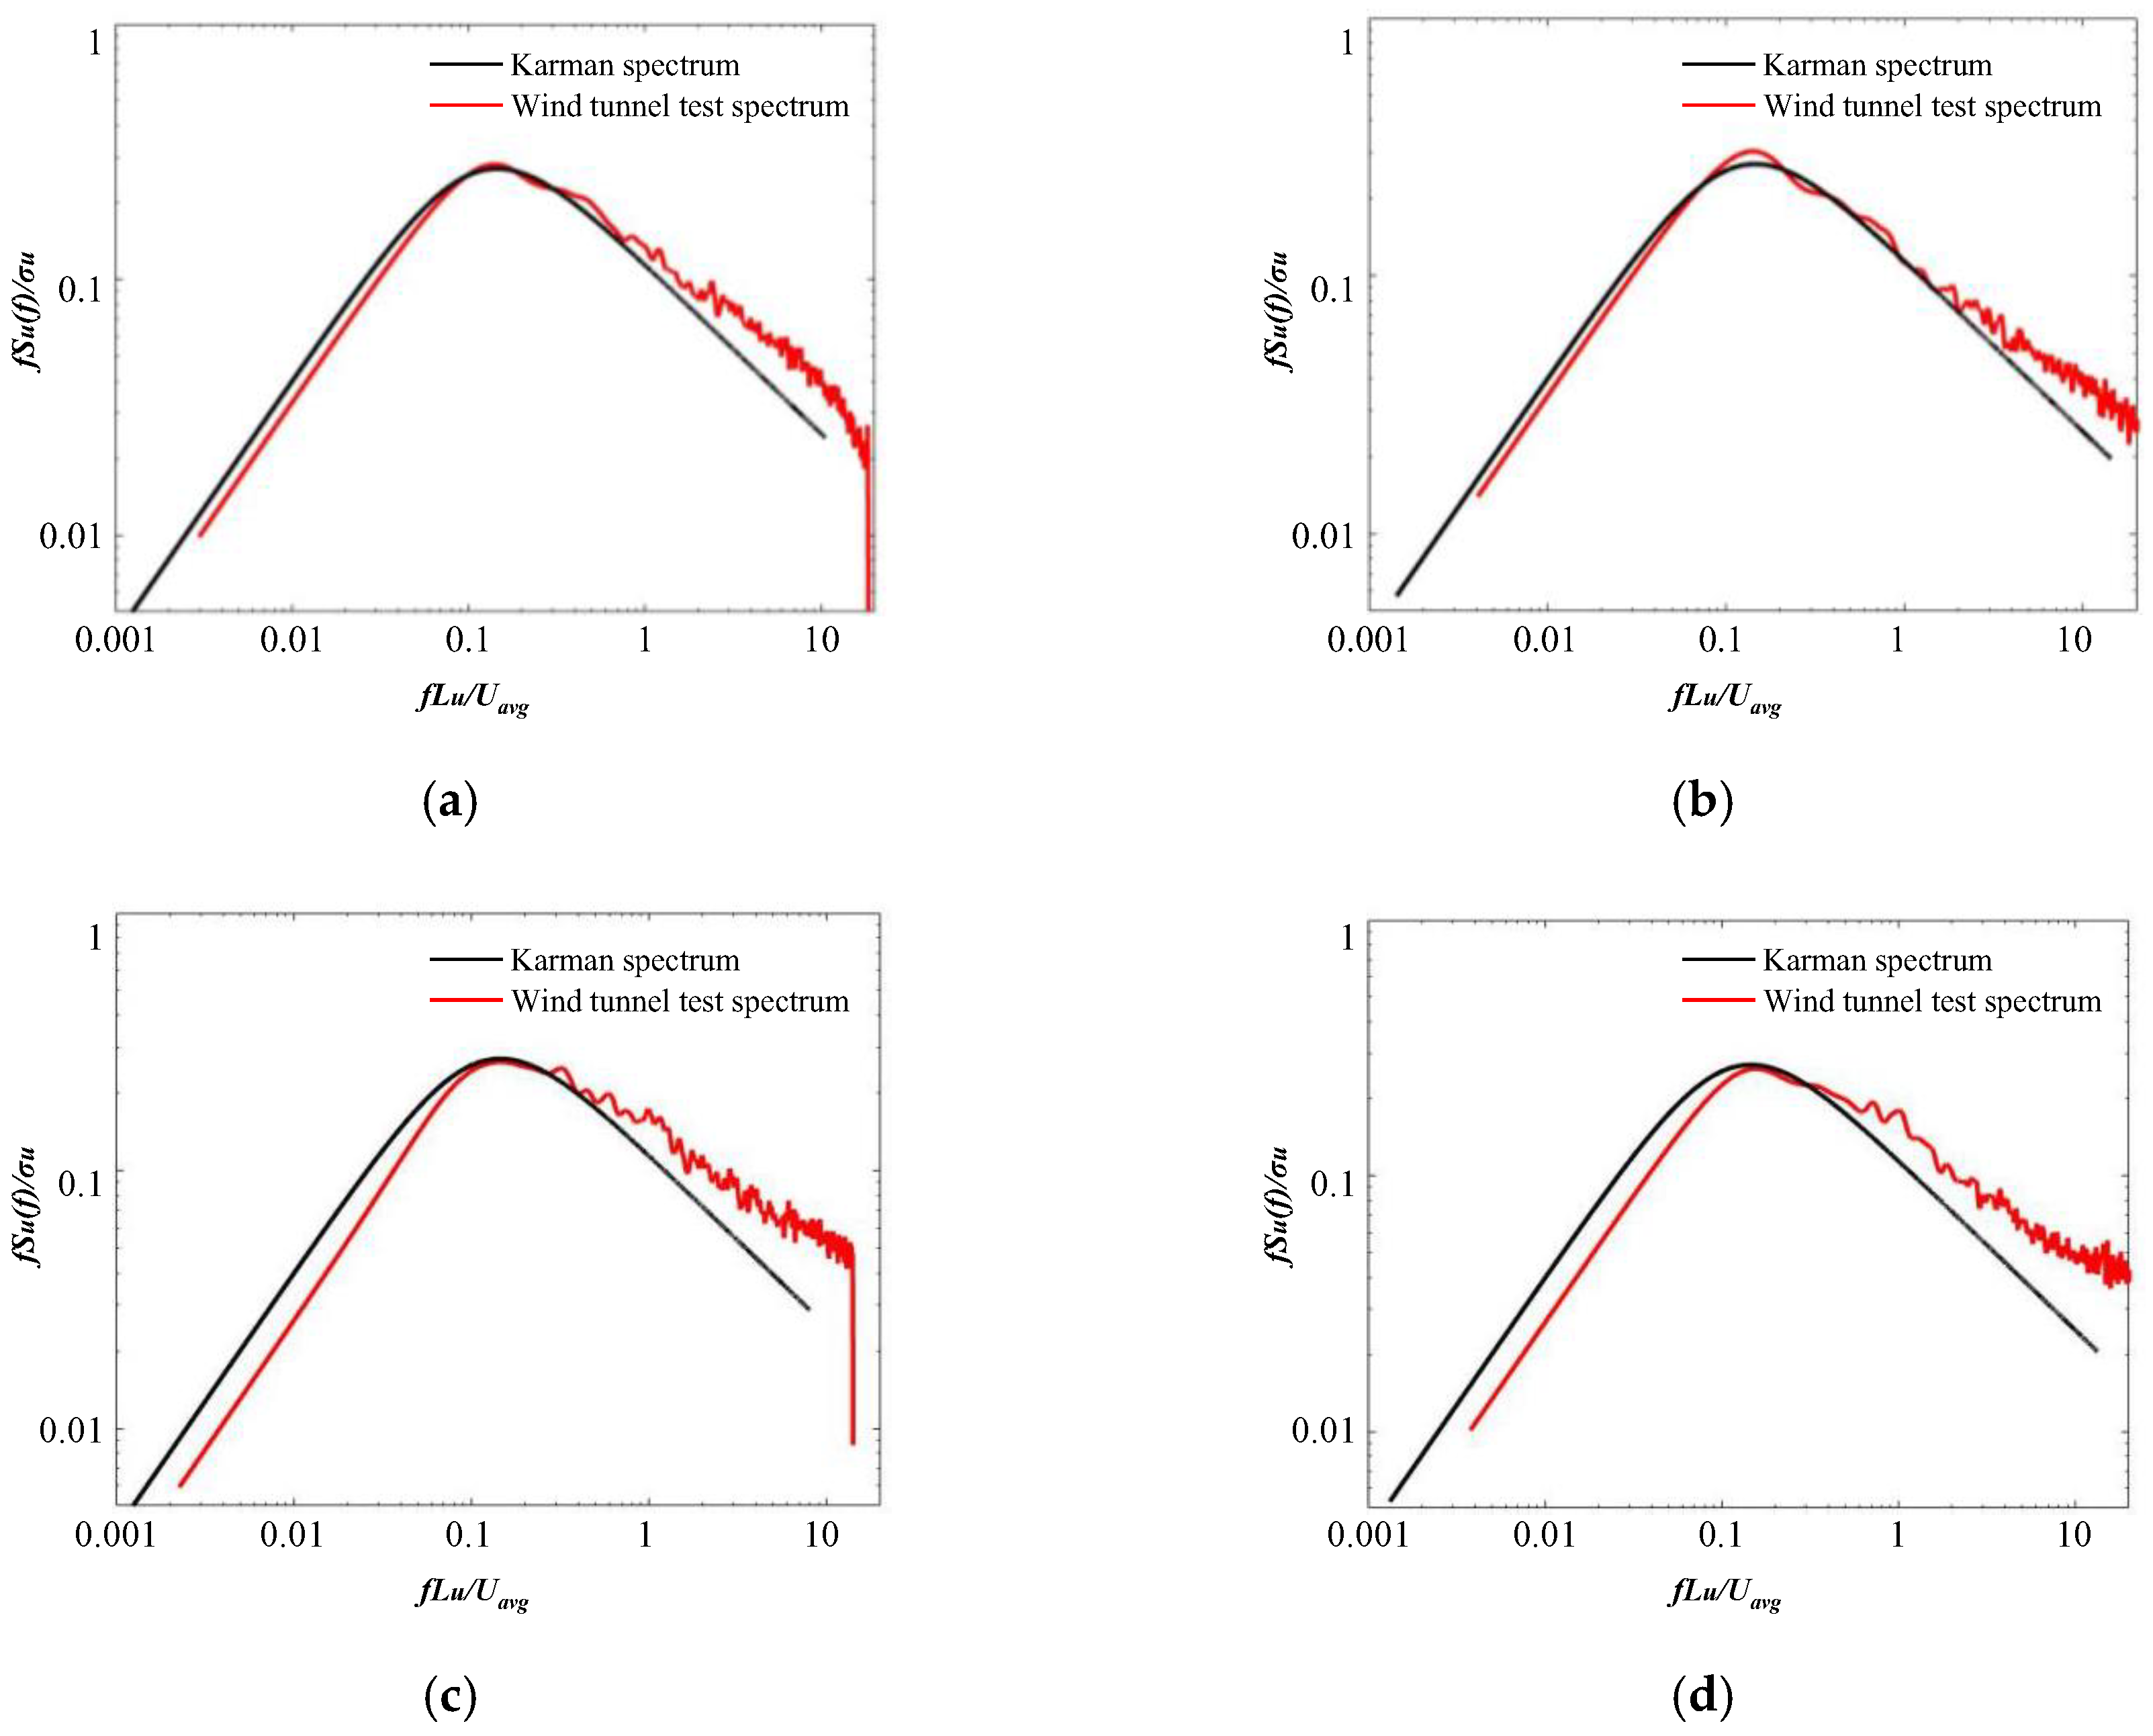
Target boundary layer conditions were generated using spires, and wooden block arrays with different sizes and array spacings were mounted on the wind tunnel floor upstream of the tested wind turbine models to generate the boundary layer incoming flow required in the target wind field. The target freestream wind velocities are 6 m/s and 9 m/s, with 6% and 10% turbulence intensity, respectively. The power law adopted for the upstream inflow conditions is , where and refer to the wind speed at any height z and the wind speed at the hub height in the flow direction, respectively. In addition, α is the wind shear index, which is determined by the local atmospheric environment and surface roughness. The vertical profiles of the incoming wind speed and turbulence intensity for the four target inflow conditions are displayed in Figure 3, while the corresponding power spectra are presented in Figure 3. These measurements verify the effective retention of the design wind speed and turbulence levels throughout the test section, which ensures the reliability of the experimental conditions. As illustrated in Figure 4, the observed power spectra align closely with the Karman spectrum. Throughout this experimental campaign, the rotor speeds of both wind turbines were precisely regulated using external motors. Under all four inflow conditions, the downstream wind turbine was operated at the optimal aerodynamic design point verified in Figure 1, maintaining a tip-speed ratio of approximately 8.5 and a thrust coefficient of around 0.8.
Figure 3.
Vertical profiles of incoming wind speed and turbulence under inflow. (a) U06-Iu06; (b) U06-Iu10; (c) U09-Iu06; (d) U09-Iu10.
Figure 4.
Wind speed power spectrum under inflow. The black line represents the theoretical Kármán spectrum, and the red line represents the spectrum of measured wind speed in wind tunnel test: (a) U06-Iu06; (b) U06-Iu10; (c) U09-Iu06; (d) U09-Iu10.
It should be acknowledged that the sequential single-point measurement approach utilizing the Cobra Probe provides time-averaged statistics rather than instantaneous wake structures. Consequently, dynamic phenomena such as wake meandering and the evolution of coherent turbulent structures are not directly characterized in this study. Furthermore, while the blade optimization method successfully matches the CT, potential Reynolds number effects on the fine-scale turbulence structure warrant careful consideration in high-fidelity wake modeling.
3. Results and Discussion
Experimental data were collected under a range of operating conditions, including various inflows, upstream yaw angles, and wind farm layouts, to analyze the specific influences of these parameters on the downstream wind turbine wake.
3.1. Effect of Different Inflows on Wake Characteristics
The investigations within the neutral atmospheric boundary layer focused on variations in incoming wind speed and turbulence intensity to identify the primary factors influencing the wake. Both single wind turbine (SWT) and multiple wind turbine (MWT) configurations were evaluated in this parametric study. At hub height, wake characteristics were measured at downstream locations of 4, 5, and 6 for both configurations, with spanwise data collected from −2.0 to 2.0, as shown in Figure 5. The mean velocity is presented as a dimensionless normalized value (), while the added turbulence intensity is expressed as a percentage (%). To improve clarity, the vertical axis for the added turbulence intensity is scaled such that each grid division represents an increment of 30%. Specifically, subplots (a) and (b) present the wake profiles under different inflow wind speeds (6 m/s and 9 m/s) for both the single wind turbine (SWT) and the aligned multiple wind turbines (MWTs aligned) under a constant incoming turbulence intensity of 6%. The four curves within each of these two subplots explicitly represent: (1) SWT under 6 m/s, (2) SWT under 9 m/s, (3) MWT aligned under 6 m/s, and (4) MWT aligned under 9 m/s.
Figure 5.
Wake characteristics of SWT and MWT at hub height under different inflows: (a) normalized mean velocity profiles under 6% incoming turbulence; (b) added turbulence intensity profiles under 6% incoming turbulence; (c) normalized mean velocity profiles under 6 m/s incoming velocity; (d) added turbulence intensity profiles under 6 m/s incoming velocity.
Conversely, subplots (c) and (d) display the wake characteristics under different inflow turbulence intensities (6% and 10%) at a constant incoming velocity of 6 m/s. The four curves within each of these subplots correspond to: (1) SWT under 6% turbulence, (2) SWT under 10% turbulence, (3) MWT aligned under 6% turbulence, and (4) MWT aligned under 10% turbulence. This detailed differentiation enables a direct and rigorous quantitative comparison of the coupled effects of inflow conditions and layout configurations on wake evolution.
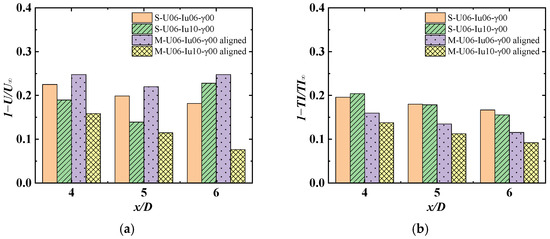
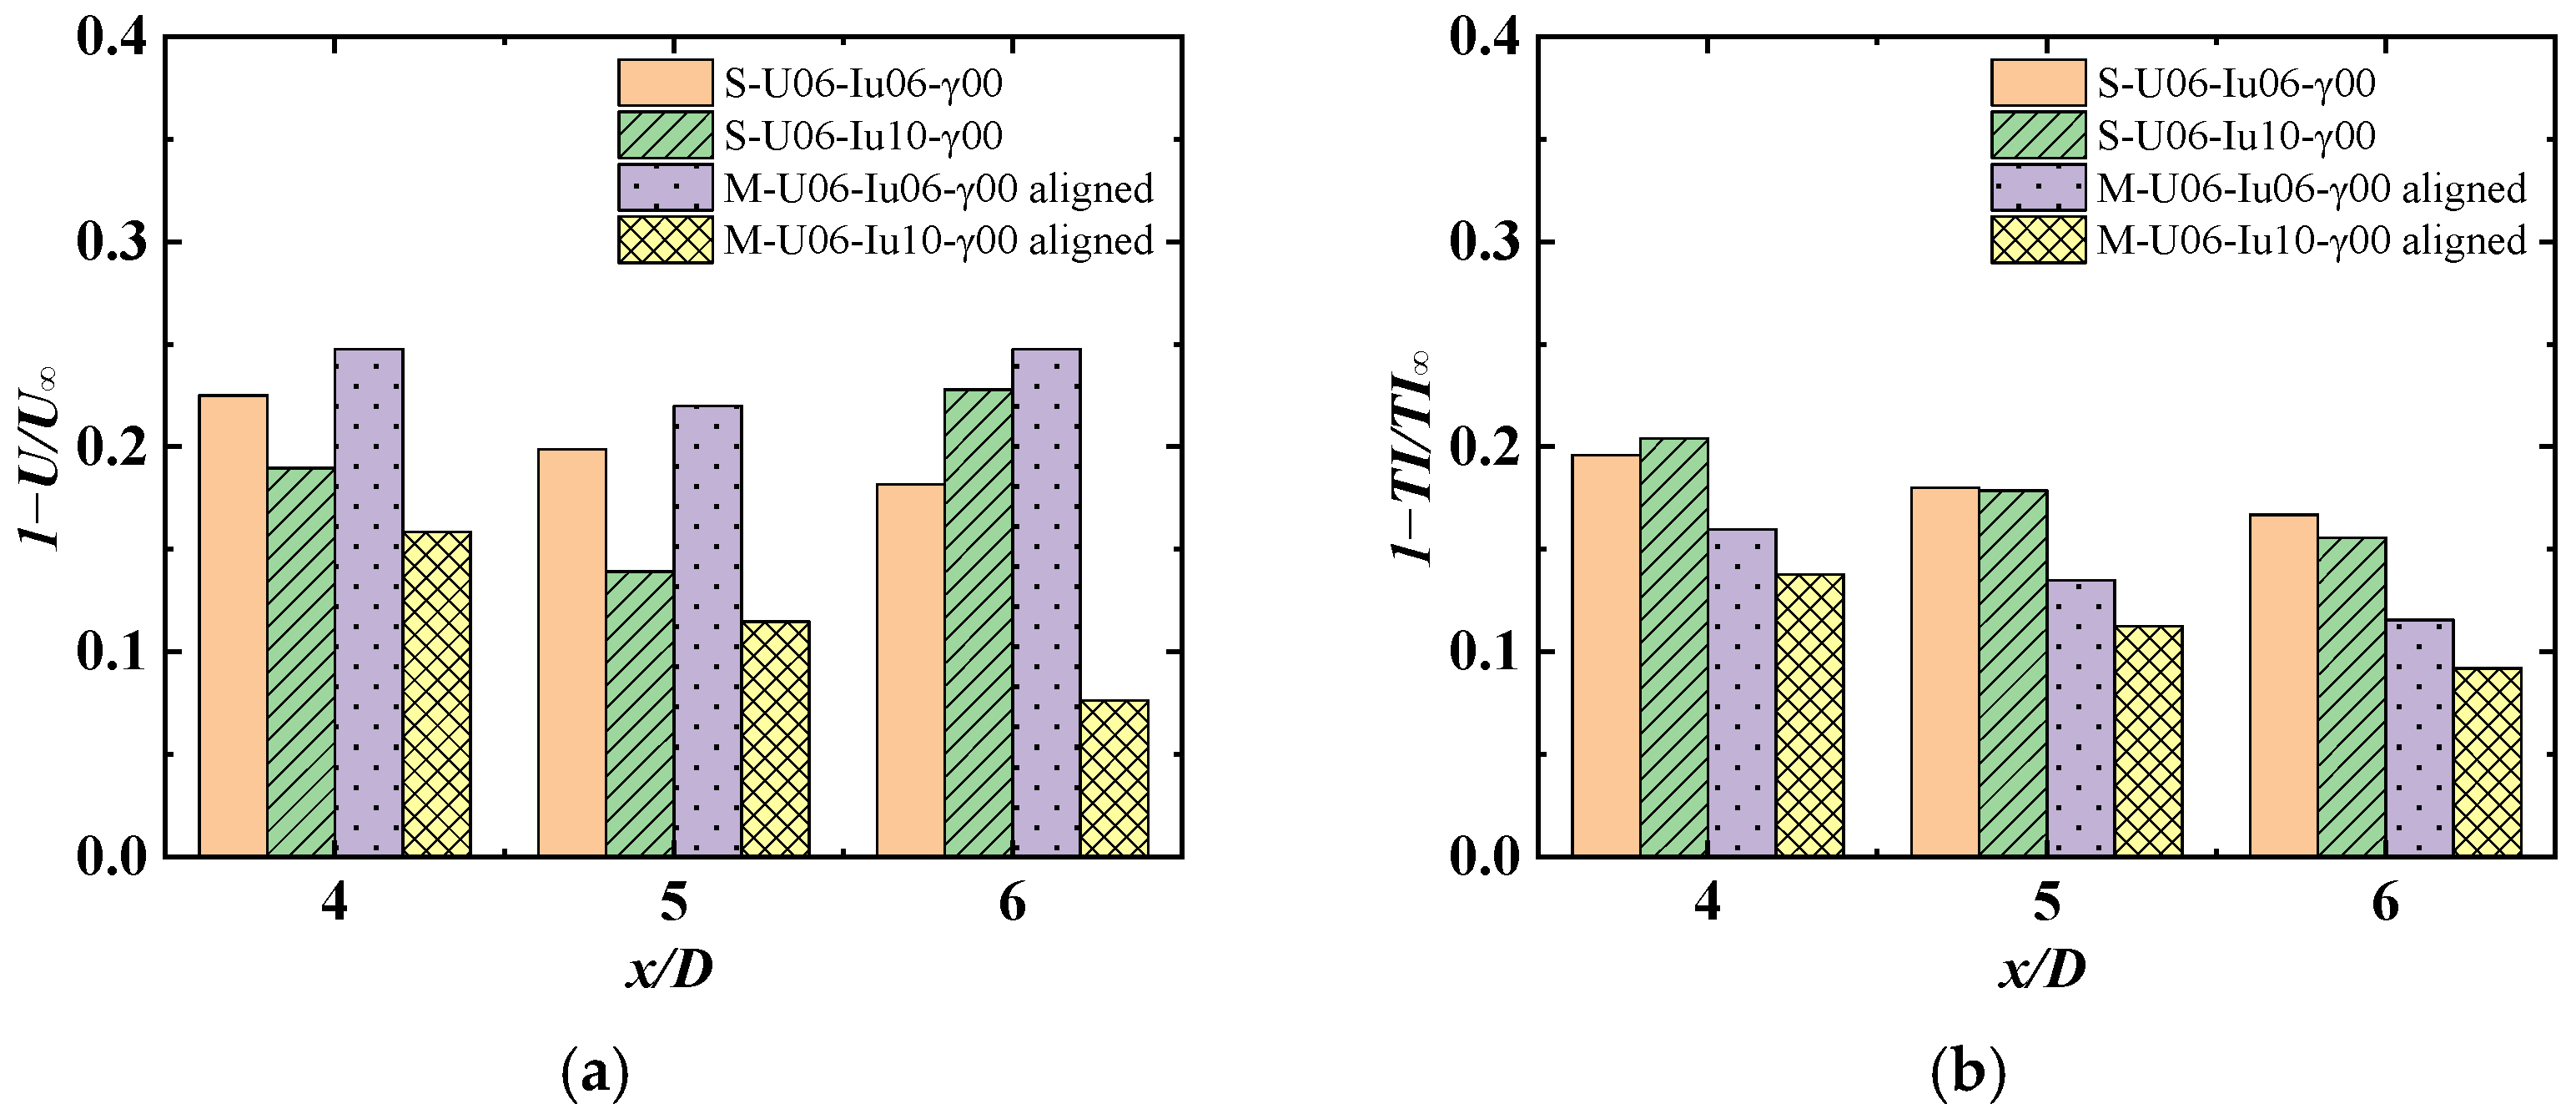
A comparison between Figure 5 and Figure 6 reveals that the normalized velocity and added turbulence intensity profiles remain remarkably consistent when the incoming velocity is the only variable. These observations suggest that incoming velocity is not the dominant factor governing wake velocity variations. In contrast, keeping the incoming velocity constant while increasing the turbulence intensity leads to accelerated wake recovery. The accelerated wake recovery observed under higher turbulence intensities is fundamentally driven by intensified turbulent entrainment. This process facilitates a more vigorous momentum flux from the high-velocity ambient flow into the wake region, which effectively replenishes the velocity deficit through enhanced kinetic energy exchange across the wake shear layer. This mechanism becomes increasingly evident in the far-wake regions, further establishing turbulence intensity as a critical parameter in wake behavior.
Figure 6.
The wake characteristics of SWT and MWT aligned under different incoming flows: (a) relative velocity deficits; (b) relative added turbulence intensity.
Observations from Figure 5 indicate a wake width of approximately for the SWT cases, which is influenced by the physical dimensions of the motor model. Figure 6 demonstrates that velocity deficits in the MWT layouts do not result from a simple linear superposition. The MWT wake width expands to nearly , which is slightly larger than the SWT cases. This expansion aligns with previous research by Schumann, Pierella, and Saetran [17], who attributed such characteristics to the superposition of two distinct rotor wakes, resulting in a broader speed loss area and a more gradual transition zone.
3.2. Effect of Yaw Angle on Wake Characteristics
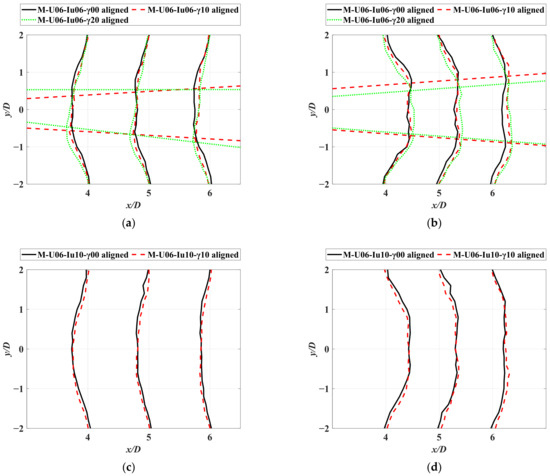
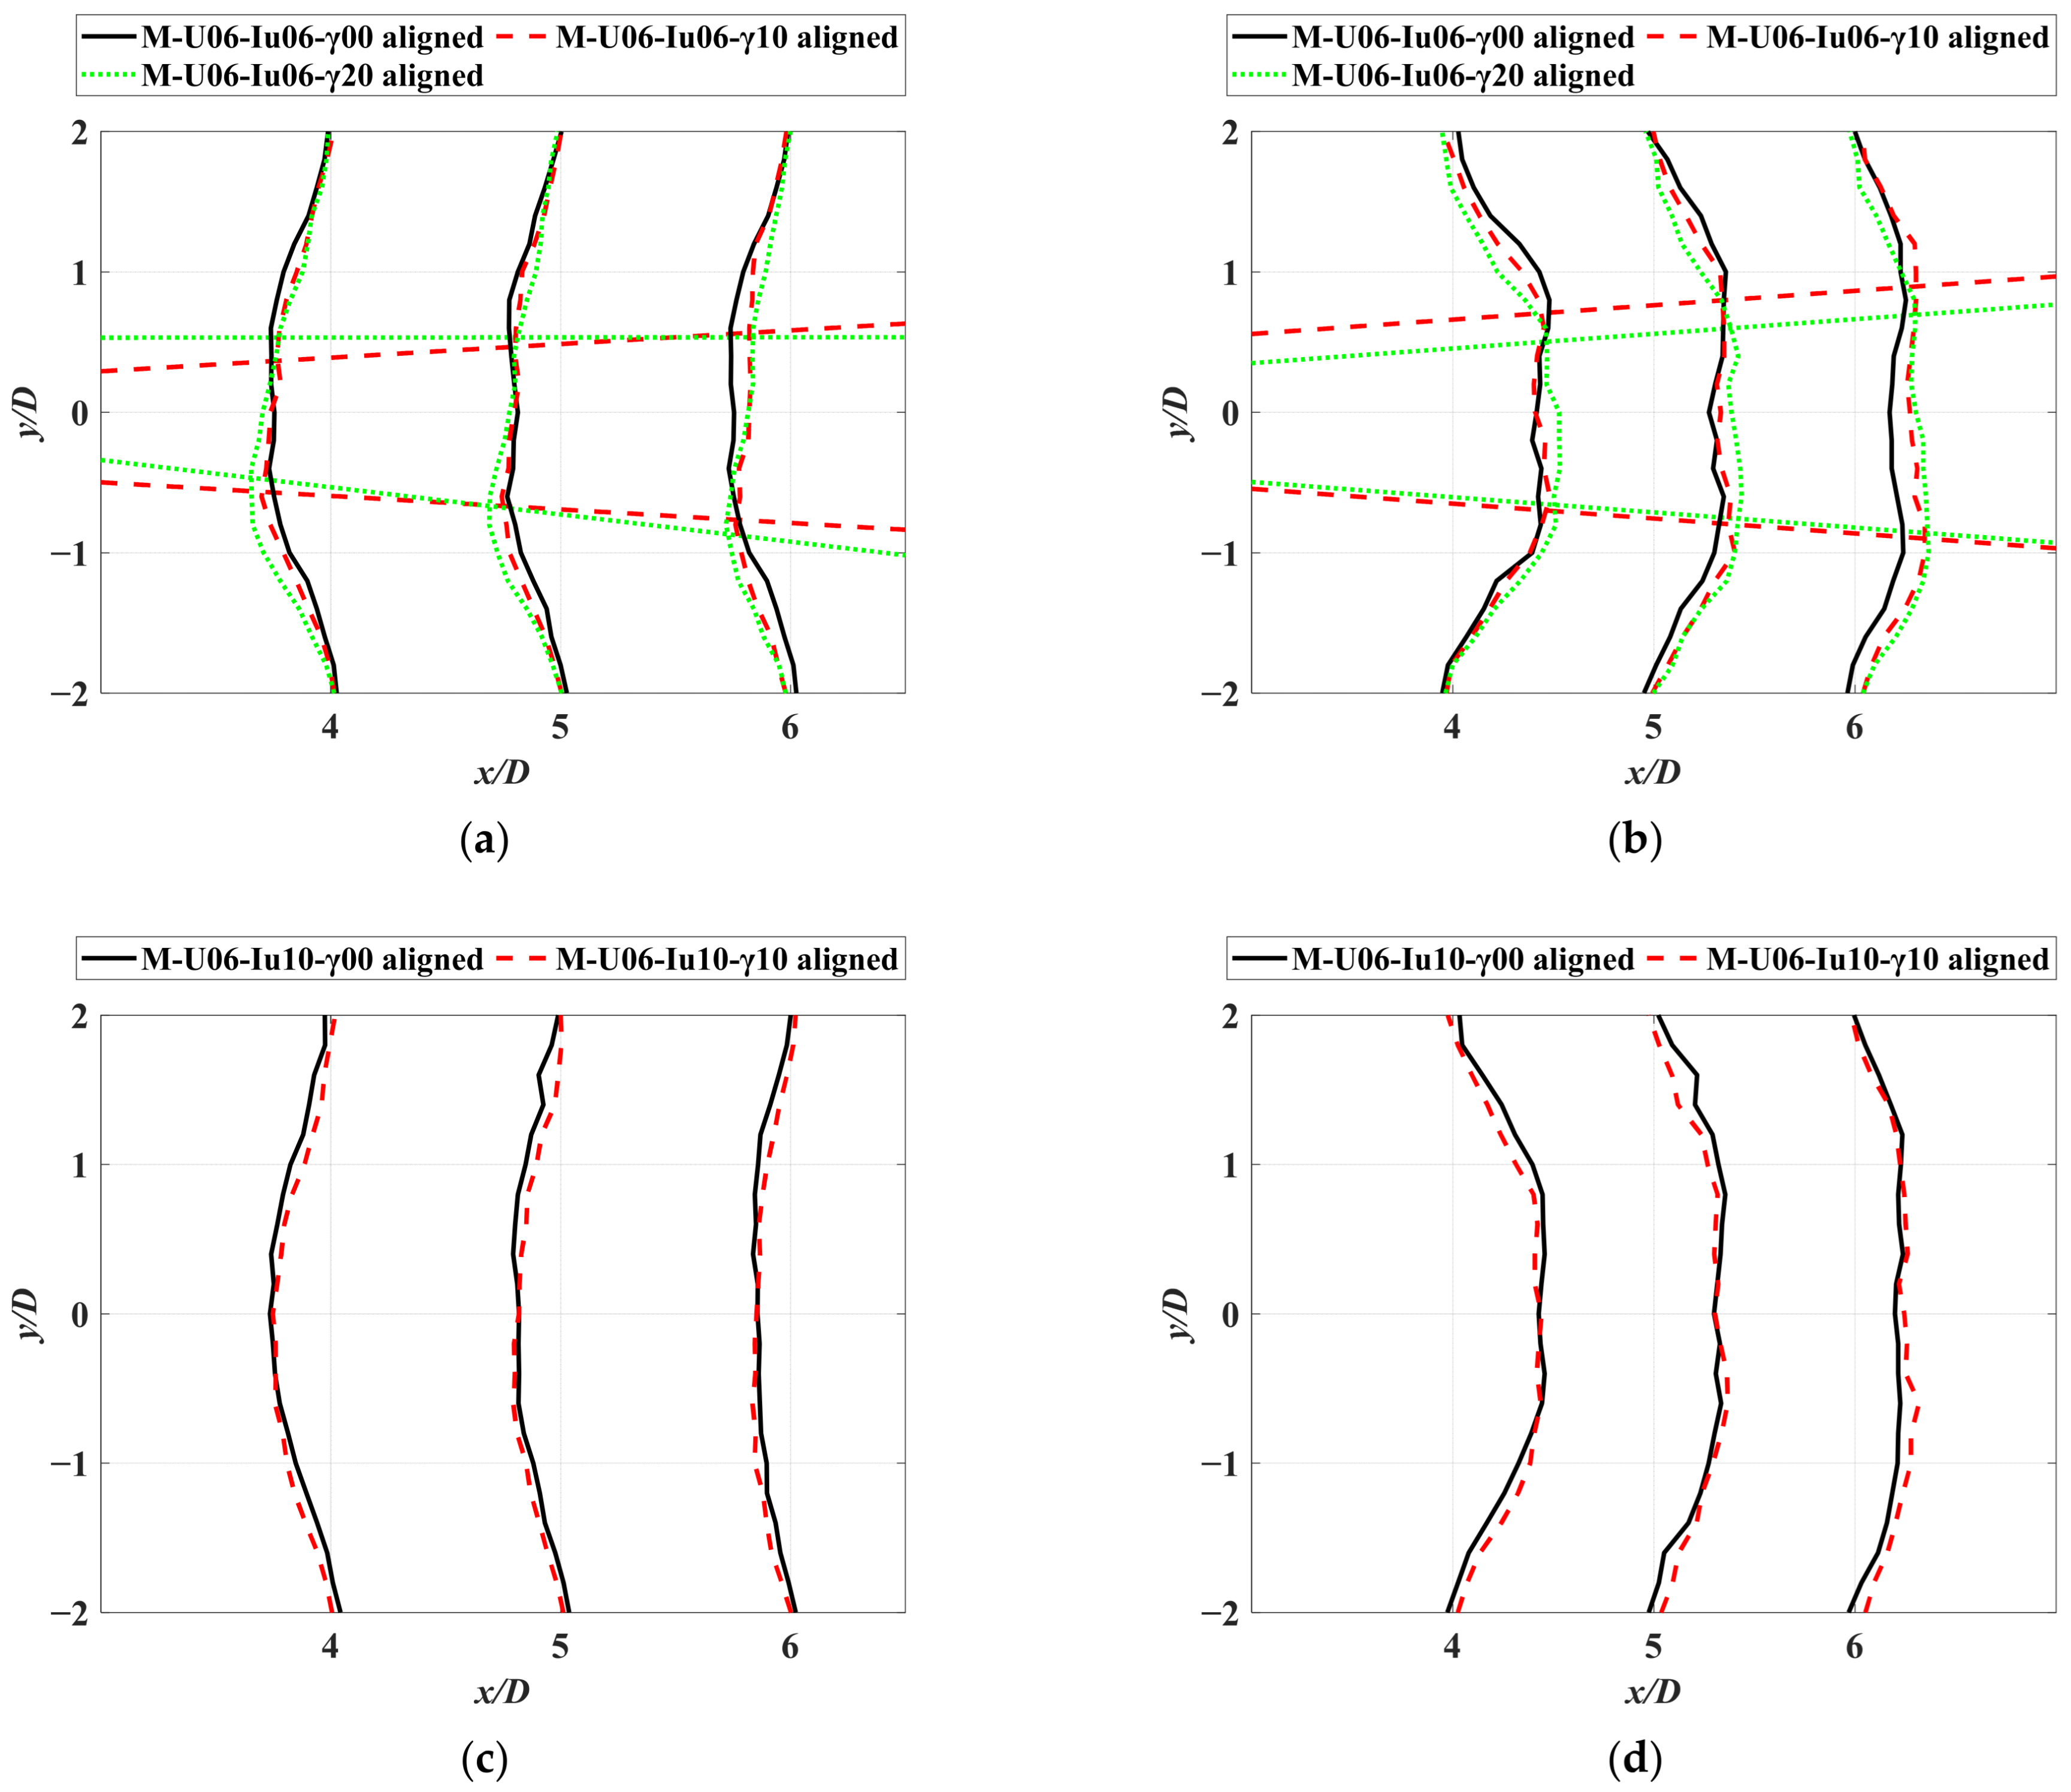
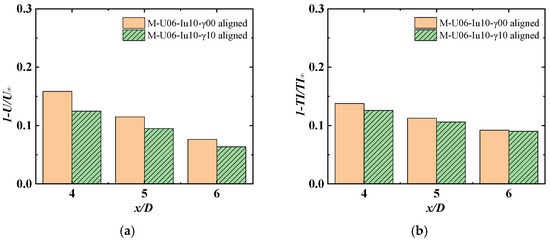
Under the same inflow condition, the yaw angle of the upstream turbine was changed, and the influence of yaw angle on the wake characteristics of the turbine is discussed. Figure 7 shows the wake profiles of the downstream turbine at hub height under the same inflow and different yaw angles of the upstream wind turbine. In Figure 7a,b, the red dashed line represents the peak position with a 10° yaw angle, and the green dashed line represents the peak position with a 20° yaw angle. It is evident that the maximum velocity deficits and additional turbulence occurred asymmetrically in the radial direction at hub height, consistent with observations by Dou et al. [7] through wind tunnel tests. This asymmetry arose because the upstream yaw angle shifted the wake center of the upstream turbine, causing asymmetric inflow to the downstream turbine. Table 2 lists the absolute values of added turbulence intensity in the downstream wake area at hub height under different SWT and MWT conditions. Figure 8 compares wake profiles at hub height in the downstream wake at 0° and 10° yaw angles of the upstream wind turbine under the same inflow conditions (U06-Iu10). It was observed that with an increase in yaw angle, the wake structure exhibited significant asymmetry. In the near-wake regions (4D and 5D), both the downstream wake velocity deficits and added turbulence intensity significantly decreased. However, as shown in Table 2, this attenuation effect became less pronounced in the far-wake region (6D), where added turbulence intensity levels fluctuated or slightly increased. These modifications in the wake structure suggest a potential for mitigating downstream power losses and reducing fatigue loads, though direct power and structural measurements are required to confirm these operational benefits.
Figure 7.
Wake characteristics of MWT aligned at hub height under different yaw angles: (a) normalized mean velocity profiles under 6% incoming turbulence; (b) added turbulence intensity profiles under 6% incoming turbulence; (c) normalized mean velocity profiles under U06-Iu10 incoming flow; (d) added turbulence intensity profiles under U06-Iu10 incoming flow.
Table 2.
The absolute added turbulence intensity at different positions in the wake of SWT cases and MWT cases.
Figure 8.
Comparison of wake profiles on hub height in downstream wake at 0° and 10° yaw angles of upstream wind turbine under the same inflow U06-Iu10: (a) relative velocity deficits; (b) added turbulence intensity.
3.3. Effect of Wind Turbine Arrangement on Wake Characteristics
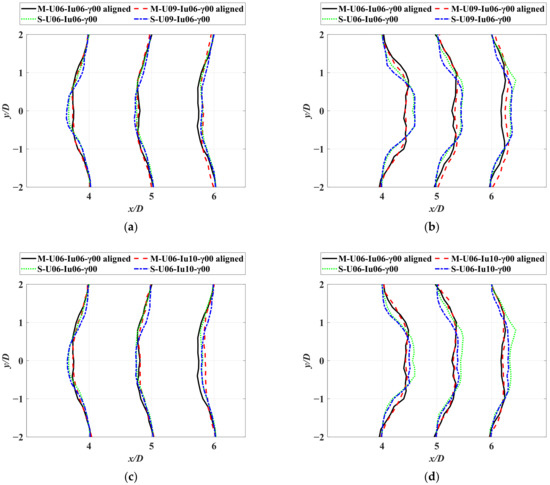
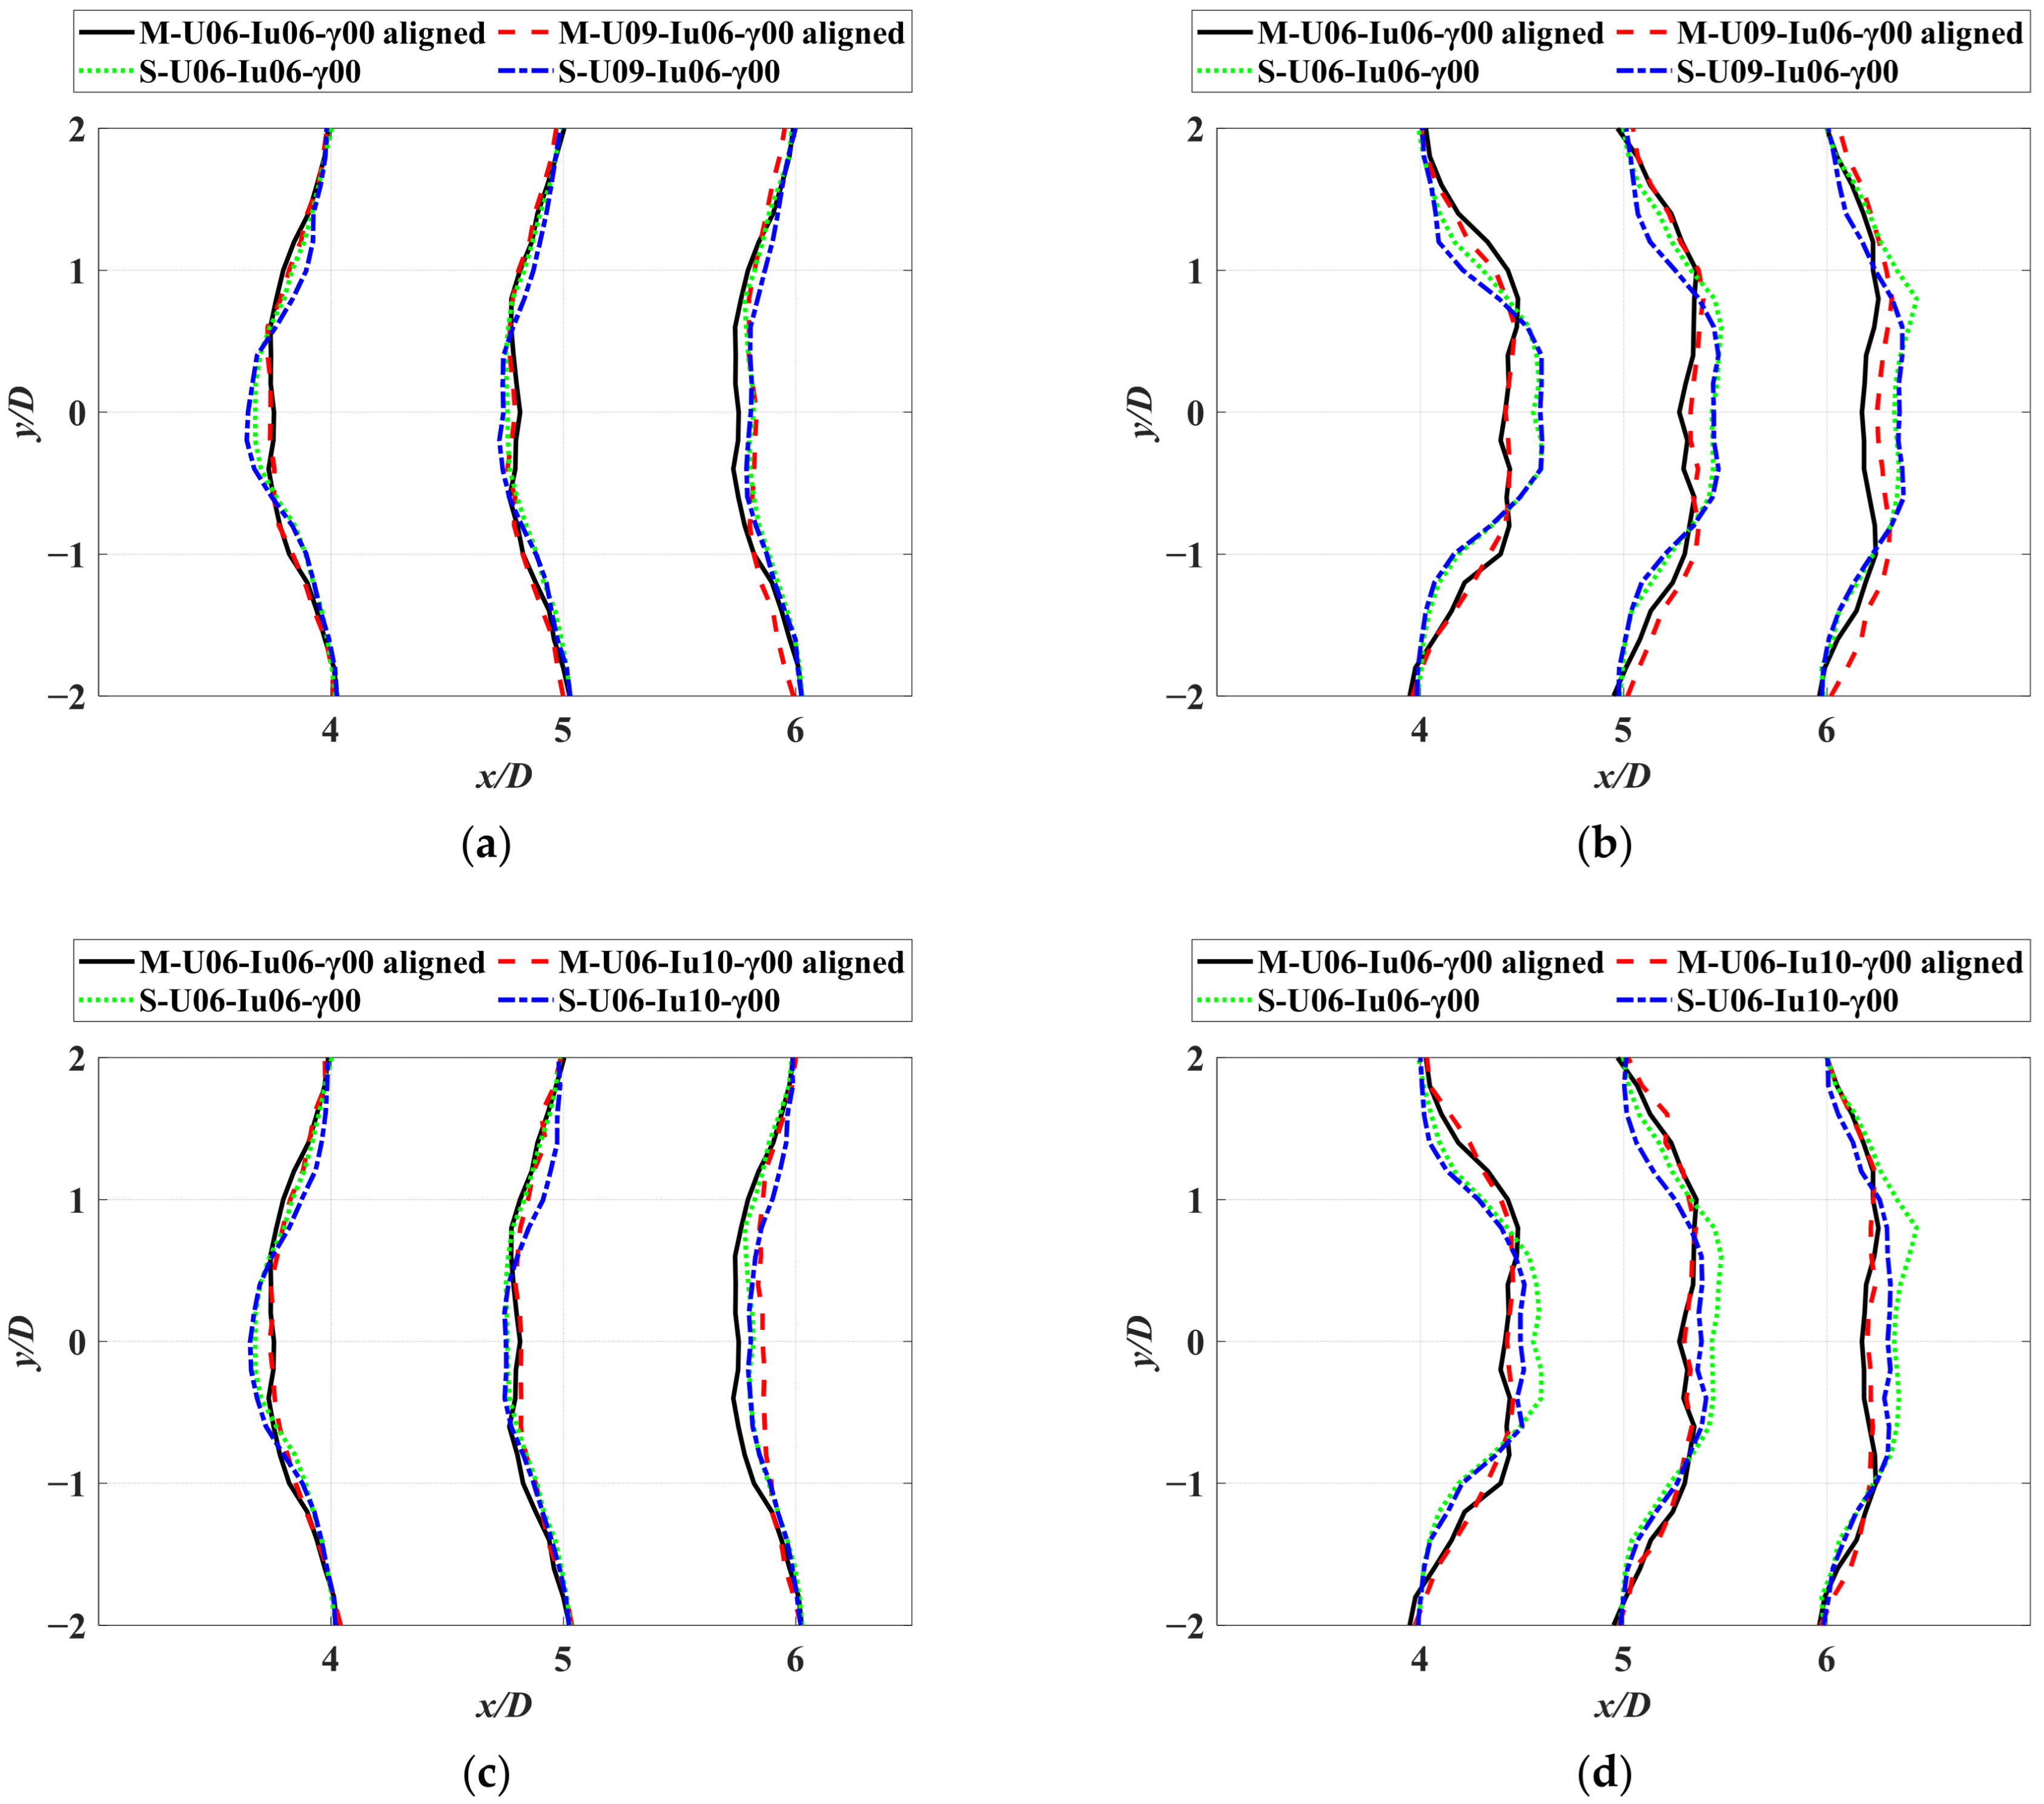
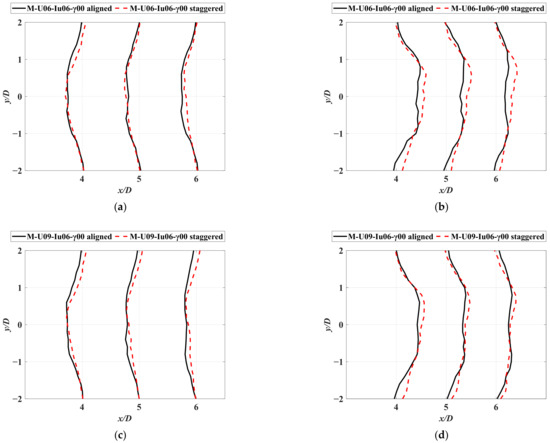
To investigate the influence of layout configuration on wake development, comparative tests were conducted for both aligned and staggered turbine arrangements. Figure 9 presents the transverse wake profiles at hub height for the two configurations.
Figure 9.
Wake profiles at hub height for aligned and staggered wind turbine arrangements under identical inflow conditions: (a) normalized mean velocity profiles under inflow condition U06-Iu06; (b) added turbulence intensity profiles under inflow condition U06-Iu06; (c) normalized mean velocity profiles under inflow condition U09-Iu06; (d) added turbulence intensity profiles under inflow condition U09-Iu06.
Under identical inflow conditions, the peak velocity deficits at hub height exhibited remarkable consistency across the cases in the near-wake region, as the downstream turbine initially remains highly influenced by the primary core of the upstream wake. This similarity occurs because the downstream wind turbine remains within the primary wake region affected by the upstream turbine, even with the lateral offset introduced in the staggered arrangement.
A more detailed analysis, however, revealed critical differences between the layouts. In the staggered arrangement (Figure 9a,c), the velocity deficit profile displays a flatter and broader distribution, contrasting with the sharper, more concentrated deficit peak observed in the aligned case. This indicates that the staggered configuration promotes more rapid lateral dispersion and enhanced wake mixing. The lateral offset prevents the downstream turbine from being fully immersed in the momentum-deficient core of the upstream wake. Instead, it intercepts a portion of the wake that has already undergone mixing with the higher-velocity free stream. Consequently, rather than significantly reducing the absolute peak velocity deficit, the staggered layout fundamentally alters the profile’s morphology, creating a flatter, more uniform velocity distribution across a broader affected area. This finding aligns with the observations of Markfort et al. [11], who reported that staggered arrangements enhance turbulent transport and increase kinetic energy absorption from the flow above the wind farm, ultimately improving overall power efficiency.
This enhanced mixing accelerates the wake recovery process, as the intensified turbulent diffusion more efficiently transports momentum from the outer flow into the wake core, which is a phenomenon also observed by Tian et al. [10] in similar layout comparisons.
In summary, although the magnitude of the maximum velocity deficit in the near wake is comparable between configurations, the staggered arrangement fundamentally alters the wake structure by promoting lateral mixing and turbulent dispersion. These mechanisms facilitate faster recovery and reduce adverse effects on any potential third turbine located farther downstream. The results underscore the significant potential of optimizing wind farm layouts to mitigate collective wake losses.
4. Comparison and Analysis of Wake Superposition Models
To simplify the analysis and discussion of multi-turbine wake interactions in wind farms, several researchers have proposed superposition models based on single-turbine wake models. Currently, four main multi-turbine wake superposition models are commonly used: the linear superposition model (LS) proposed by Lissaman [18], the sum of squares model (SS) by Katic et al. [19], the sum of kinetic energy deficits model (SKED) by Voutsinas et al. [20], and the geometric superposition model (GS) by Niayifar and Porté-Agel [21]. These models are largely empirical and have limited physical foundation.
Zong and Porté-Agel [15] compared these four wake models with wind tunnel data and found that the GS model provided the best agreement with measured velocity deficits, while the others tended to overestimate or underestimate downstream wake losses. The current assessment evaluates the applicability of these superposition models by utilizing data from the MWT tests under non-yaw and aligned conditions. Their mathematical expressions are presented below:
LS model:
SS model:
SKED model:
GS model:
where u0 is the inflow velocity, ui is the inflow velocity of turbine ; uj is the inflow velocity of turbine ; and uij is the wake velocity exerted by turbine at the location of turbine ; u0 represents the freestream incoming velocity; ui and uj represent the local inflow velocities directly approaching turbine and turbine , respectively; and uij denotes the wind velocity at the location of turbine under the singular wake effect of upstream turbine .
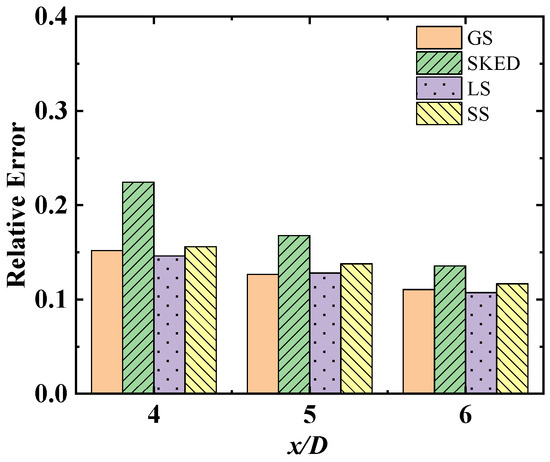
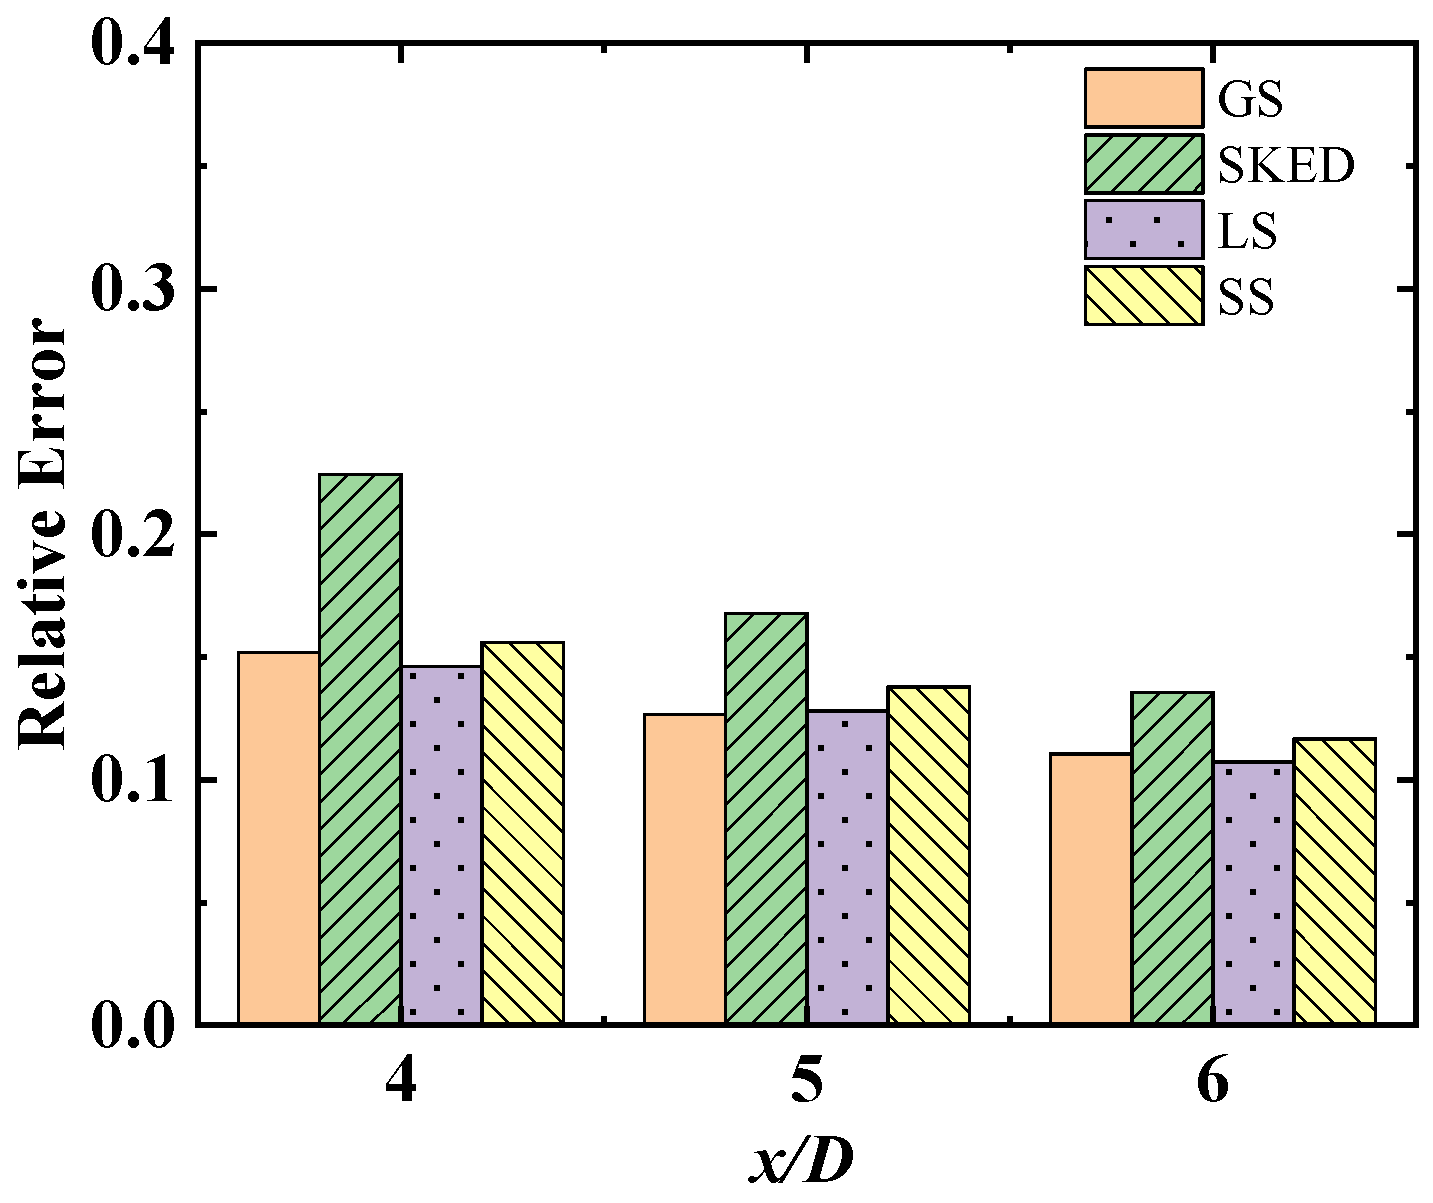
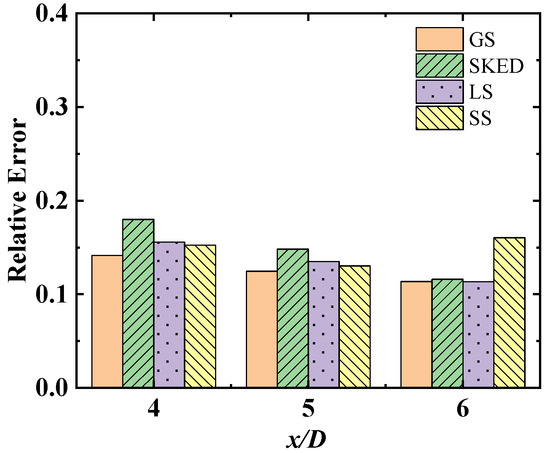
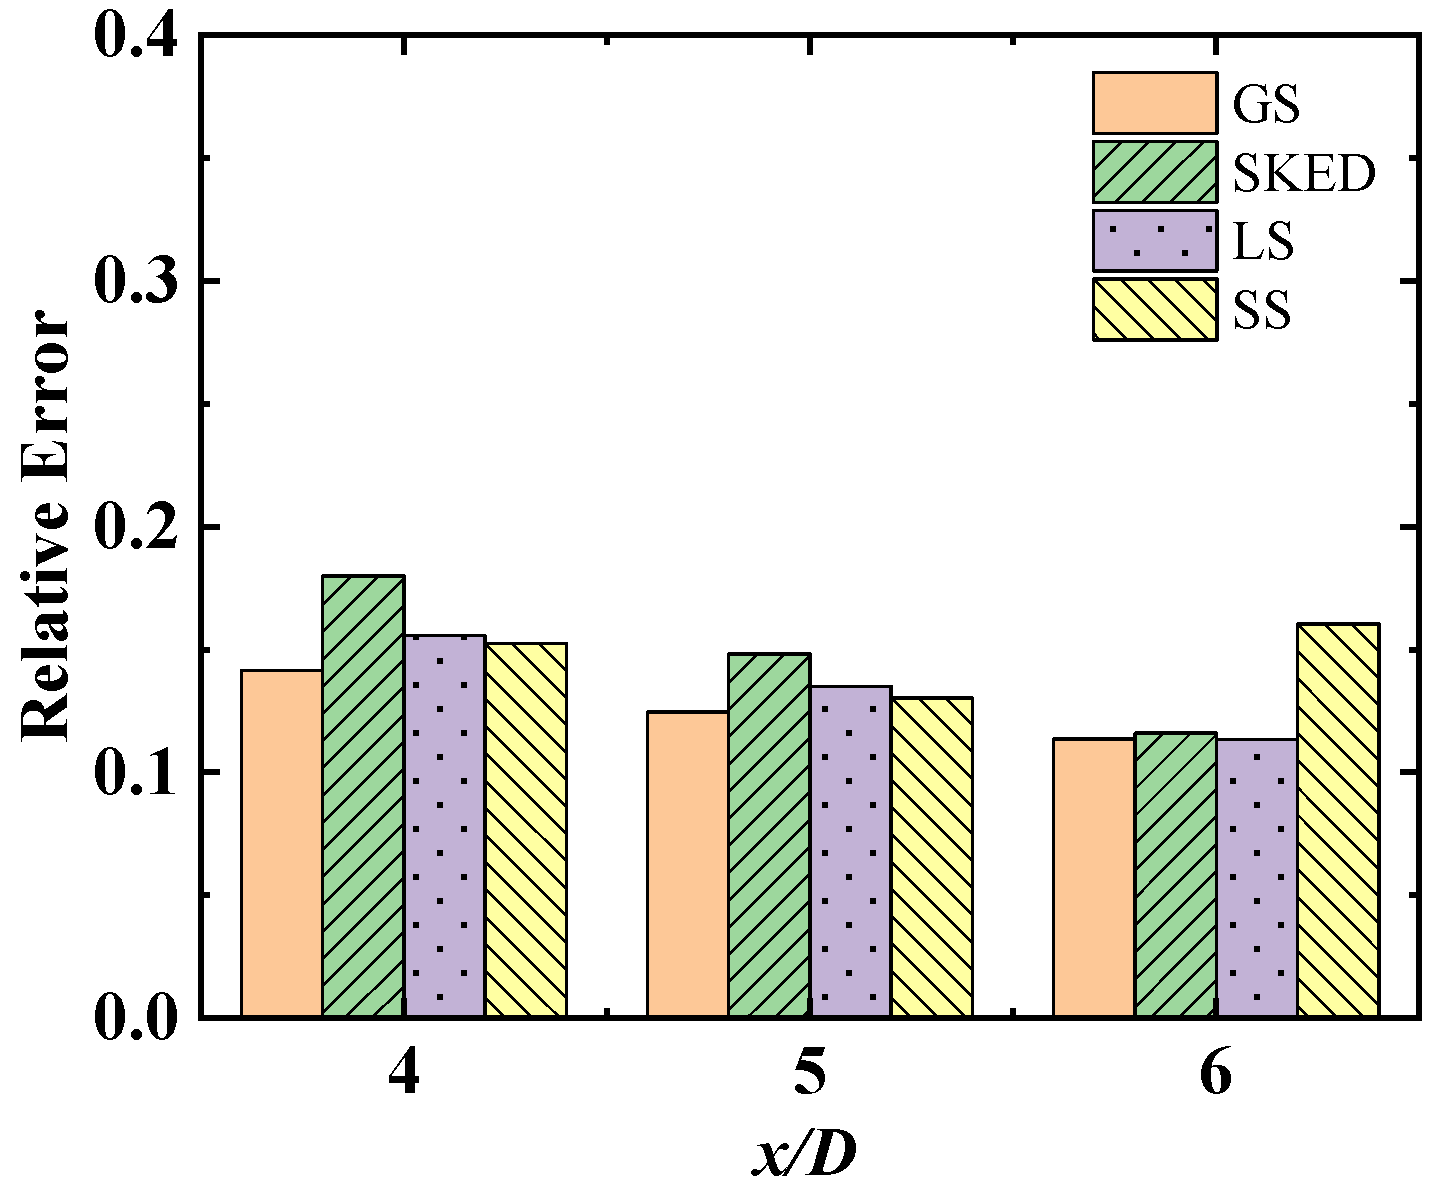
In this study, the streamwise spacing between the upstream and downstream turbines was set to 5D. Based on the single-wake model proposed by Ishihara and Qian [22], the four superposition models were compared against the wind tunnel experimental data. To quantitatively evaluate their accuracy, the relative error metric was defined based on the hub-height transverse profile data, as and represent the predicted and experimentally measured normalized velocities, respectively. The spatial distributions of these relative errors for each model are presented in Figure 10 and Figure 11.
Figure 10.
Relative error of velocity in different wake superposition models under U06-Iu06-γ00.
Figure 11.
Relative error of velocity in different wake superposition models under U09-Iu06-γ00.
Within the specific range of aligned non-yaw conditions and small turbine spacing investigated here, the GS model exhibits the highest accuracy in capturing wake velocity deficits, aligning with the findings of Zong and Porté-Agel [15]. However, its generalized superiority across more complex staggered or yawed configurations should be considered within the limitations of the current operating parameters. Zhang et al. [4] also reached similar conclusions in numerical simulations of two-turbine wakes. However, their study further suggested that for three or more turbines, the SS model performs better at smaller spacings, while the LS model becomes more accurate as spacing increases. Therefore, the applicability of these models to layouts with three or more turbines, as well as to yaw and staggered arrangements, requires further investigation.
5. Conclusions
Wind tunnel experiments were conducted to investigate the wake characteristics of multiple wind turbines under different inflow conditions, upstream yaw angles, and turbine arrangements. Based on the present results, the following conclusions can be drawn.
First, inflow turbulence intensity has a greater influence on wake recovery than inflow velocity. An increase in turbulence intensity enhances momentum exchange between the wake region and the surrounding flow, thereby accelerating wake mixing and velocity recovery. This effect is observed in both the transverse profiles at hub height and the vertical profiles behind the hub center.
Second, the wake velocity deficit of the downstream wind turbine decreases with increasing yaw angle of the upstream turbine. At the same time, the wake center and the peak-added turbulence intensity shift laterally, leading to a more asymmetric wake structure. A staggered turbine arrangement produces a similar effect by modifying the inflow condition of the downstream turbine and reducing its direct exposure to the momentum-deficient wake core. Therefore, an appropriate upstream yaw angle and a staggered layout can help mitigate wake losses and improve the overall performance of wind farms.
Third, among the wake superposition models examined in this study, the geometric sum model provides the best agreement with the experimental results under non-yaw conditions with small turbine spacing. The present experiments also confirm the applicability of the previously proposed airfoil optimization method in reduced-scale multi-turbine wake tests.
Overall, this study provides useful experimental evidence for understanding the wake behavior of multiple wind turbines and offers reference data for wind farm layout optimization and wake model validation. It is important to acknowledge the limitations of the current study. The experimental findings and the optimal performance of the geometric sum model are strictly validated for a two-turbine configuration, and a fixed streamwise spacing of 5D, a single lateral staggered offset and are based solely on hub-height aerodynamic measurements. Furthermore, claims regarding power and load optimization are inferred from wake field data rather than direct mechanical measurements. Future work should investigate the wake characteristics of downstream wind turbines under a broader range of streamwise spacings, staggered offsets, and inflow conditions to generalize these observations across diverse wind farm layouts. Additional studies could also explore the impact of different pitch angles and tip-speed ratios on the performance of multiple wind turbines.
Author Contributions
Conceptualization, B.Y.; methodology, H.L.; formal analysis, H.L.; investigation, G.Q. and T.H.; resources, B.Y.; data curation, T.H.; writing—original draft preparation, T.H.; writing—review and editing, B.Y., H.L. and G.H.; supervision, B.Y., G.Q. and G.H. All authors have read and agreed to the published version of the manuscript.
Funding
This research was funded by the Natural Science Foundation of Chongqing (Nos. U24A20174 and 52278483), 111 Project of China (No. B18062), the Innovation Group Project of Southern Marine Science and Engineering Guangdong Laboratory (Zhuhai) (No. 311023014), Fundamental Research Funds for the Central Universities 2022CDJQY-009.
Data Availability Statement
The original contributions presented in this study are included in the article. Further inquiries can be directed to the corresponding author.
Acknowledgments
The authors would like to acknowledge the financial support from the Natural Science Foundation of Chongqing, the 111 Project of China, the Innovation Group Project of Southern Marine Science and Engineering Guangdong Laboratory (Zhuhai), Fundamental Research Funds for the Central Universities.
Conflicts of Interest
The authors declare no conflicts of interest.
References
- Mehta, D.; van Zuijlen, A.H.; Koren, B.; Holierhoek, J.G.; Bijl, H. Large Eddy Simulation of wind farm aerodynamics: A review. J. Wind Eng. Ind. Aerodyn. 2014, 133, 1–17. [Google Scholar] [CrossRef]
- Porte-Agel, F.; Bastankhah, M.; Shamsoddin, S. Wind-Turbine and Wind-Farm Flows: A Review. Bound.-Layer Meteorol. 2020, 174, 1–59. [Google Scholar] [CrossRef] [PubMed]
- Barthelmie, R.J.; Folkerts, L.; Ormel, F.T.; Sanderhoff, P.; Eecen, P.J.; Stobbe, O.; Nielsen, N.M. Offshore wind turbine wakes measured by sodar. J. Atmos. Ocean. Technol. 2003, 20, 466–477. [Google Scholar] [CrossRef]
- Thomsen, K.; Sorensen, P. Fatigue loads for wind turbines operating in wakes. J. Wind Eng. Ind. Aerodyn. 1999, 80, 121–136. [Google Scholar] [CrossRef]
- Chamorro, L.P.; Porte-Agel, F. A Wind-Tunnel Investigation of Wind-Turbine Wakes: Boundary-Layer Turbulence Effects. Bound.-Layer Meteorol. 2009, 132, 129–149. [Google Scholar] [CrossRef]
- Zhang, R.Z.; Xin, Z.Q.; Huang, G.Q.; Yan, B.W.; Zhou, X.H.; Deng, X.W. Characteristics and modelling of wake for aligned multiple turbines based on numerical simulation. J. Wind Eng. Ind. Aerodyn. 2022, 228, 105097. [Google Scholar] [CrossRef]
- Dou, B.Z.; Guala, M.; Lei, L.; Zeng, P. Experimental investigation of the performance and wake effect of a small-scale wind turbine in a wind tunnel. Energy 2019, 166, 819–833. [Google Scholar] [CrossRef]
- Kragh, K.A.; Hansen, M.H. Load alleviation of wind turbines by yaw misalignment. Wind Energy 2014, 17, 971–982. [Google Scholar] [CrossRef]
- Sanderse, B.; van der Pijl, S.P.; Koren, B. Review of computational fluid dynamics for wind turbine wake aerodynamics. Wind Energy 2011, 14, 799–819. [Google Scholar] [CrossRef]
- Tian, W.; Ozbay, A.; Hu, H. An experimental investigation on the wake interferences among wind turbines sited in aligned and staggered wind farms. Wind Energy 2018, 21, 100–114. [Google Scholar] [CrossRef]
- Markfort, C.D.; Zhang, W.; Porte-Agel, F. Turbulent flow and scalar transport through and over aligned and staggered wind farms. J. Turbul. 2012, 13, N33. [Google Scholar] [CrossRef]
- McTavish, S.; Feszty, D.; Nitzsche, F. Evaluating Reynolds number effects in small-scale wind turbine experiments. J. Wind Eng. Ind. Aerodyn. 2013, 120, 81–90. [Google Scholar] [CrossRef]
- Bottasso, C.L.; Campagnolo, F.; Petrovic, V. Wind tunnel testing of scaled wind turbine models: Beyond aerodynamics. J. Wind Eng. Ind. Aerodyn. 2014, 127, 11–28. [Google Scholar] [CrossRef]
- Huang, G.; Zhang, S.; Yan, B.; Yang, Q.; Zhou, X.; Ishihara, T. Thrust-matched optimization of blades for the reduced-scale wind tunnel tests of wind turbine wakes. J. Wind Eng. Ind. Aerodyn. 2022, 228, 105113. [Google Scholar] [CrossRef]
- Zong, H.; Porte-Agel, F. A momentum-conserving wake superposition method for wind farm power prediction. J. Fluid Mech. 2020, 889, A8. [Google Scholar] [CrossRef]
- McTavish, S.; Feszty, D.; Nitzsche, F. An experimental and computational assessment of blockage effects on wind turbine wake development. Wind Energy 2014, 17, 1515–1529. [Google Scholar] [CrossRef]
- Schumann, H.; Pierella, F.; Saetran, L. Experimental investigation of wind turbine wakes in the wind tunnel. Energy Procedia 2013, 35, 285–296. [Google Scholar] [CrossRef]
- Lissaman, P.B.S. Energy Effectiveness of Arbitrary Arrays of Wind Turbines. J. Energy 1979, 3, 323–328. [Google Scholar] [CrossRef]
- Katic, I.; Hojstrup, J.; Jensen, N.O. A Simple Model for Cluster Efficiency. In Proceedings of the European Wind Energy Association Conference and Exhibition, Rome, Italy, 7–9 October 1986; pp. 407–410. [Google Scholar]
- Voutsinas, S. On the analysis of wake effects in wind parks. Wind Eng. 1990, 14, 204–219. [Google Scholar]
- Niayifar, A.; Porte-Agel, F. Analytical Modeling of Wind Farms: A New Approach for Power Prediction. Energies 2016, 9, 741. [Google Scholar] [CrossRef]
- Ishihara, T.; Qian, G.W. A new Gaussian-based analytical wake model for wind turbines considering ambient turbulence intensities and thrust coefficient effects. J. Wind Eng. Ind. Aerodyn. 2018, 177, 275–292. [Google Scholar] [CrossRef]

Disclaimer/Publisher’s Note: The statements, opinions and data contained in all publications are solely those of the individual author(s) and contributor(s) and not of MDPI and/or the editor(s). MDPI and/or the editor(s) disclaim responsibility for any injury to people or property resulting from any ideas, methods, instructions or products referred to in the content. |
© 2026 by the authors. Licensee MDPI, Basel, Switzerland. This article is an open access article distributed under the terms and conditions of the Creative Commons Attribution (CC BY) license.