Article

Response Surface Analysis of the Energy Performance and Emissions of a Dual-Fuel Engine Generator Using Biodiesel and Hydrogen-Enriched Biogas


by
Danilo Simon
1,*,
Samuel N. M. de Souza
1,
Doglas Bassegio
1,
Willian C. Nadaleti
2,
Juliano de Souza
1,
Reinaldo A. Bariccatti
1,
Reginaldo F. Santos
1,
Carlos E. C. Nogueira
1,
Waldir M. Machado Junior
1 and
Jair A. C. Siqueira
1
1
State University of Western Paraná, Unioeste, Cascavel 85819-110, PR, Brazil
2
Federal University of Pelotas, Ufpel, Pelotas 96010-610, RS, Brazil
*
Author to whom correspondence should be addressed.
Energies 2025, 18(20), 5502; https://doi.org/10.3390/en18205502
Submission received: 8 August 2025 / Revised: 22 September 2025 / Accepted: 28 September 2025 / Published: 18 October 2025
(This article belongs to the Section I2: Energy and Combustion Science)

Abstract

In this study, we investigate the dual-fuel operation of compression ignition engines using biodiesel at varying concentrations in combination with biogas, with and without hydrogen enrichment. A response surface methodology, based on a central composite experimental design was employed to optimize energy efficiency and minimize pollutant emissions. The partial substitution of diesel with gaseous fuel substantially reduces the specific fuel consumption, achieving a maximum decrease of 21% compared with conventional diesel operation. Enriching biogas with hydrogen, accounting for 13.3% of the total flow rate, increases the thermal efficiency by 0.8%, compensating for the low calorific value and reduced volumetric efficiency of biogas. Variations in biodiesel concentration exhibits a nonlinear effect, yielding an additional average efficiency gain of 0.4%. Regarding emissions, the addition of hydrogen to biogas contributes to an average reduction of 5% in carbon monoxide emissions compared to the standard dual-fuel operation. However, dual-fuel operation leads to higher unburned hydrocarbon emissions relative to neat diesel; hydrogen enrichment mitigates this drawback by reducing hydrocarbon emissions by 4.1%. Although NOx emissions increase by an average of 26.6% with hydrogen addition, dual-fuel strategies achieve NOx reductions of 11.5% (hydrogen-enriched mode) and 33.3% (pure biogas mode) relative to diesel-only operation. Furthermore, the application of response surface methodology is robust and reliable, with experimental validation showing errors of 0.55–8.66% and an overall uncertainty of 4.84%.

1. Introduction

The global energy matrix is largely characterized by the use of fossil and nonrenewable fuels, which places significant pressure on the environment, a situation exacerbated by increasing waste generation [1]. In this context, the production of renewable fuels has emerged as an alternative to reduce emissions and promote sustainable waste management, aiming to minimize environmental impacts and enhance energy diversification and security [2,3].
The global production of biodiesel has expanded and diversified, contributing significantly to the reduction in emissions associated with fossil fuels and representing a substantial renewable fraction of the current fuel mix [4].
When comparing biodiesel and diesel, considering emissions, energy content, and combustion characteristics, biodiesel blends typically lead to significant reductions in hydrocarbon (HC) and carbon monoxide (CO) emissions, albeit with slight increases in fuel consumption and nitrogen oxide (NOx) emissions [5].
The combined use of biodiesel with other fuels or the addition of combustion-enhancing compounds reduces fuel consumption, improves oxidation stability, and lowers NOx emissions, highlighting a promising area for research aimed at optimizing biodiesel utilization [6].
Biogas has gained traction as a reliable energy alternative primarily because of its widespread availability [7]. Biogas is a combustible gas produced through the anaerobic decomposition of organic waste, with a composition that, although variable under different physical and chemical conditions, is primarily based on methane (CH4) and carbon dioxide (CO2) [8].
Initially, biogas utilization was limited to small-scale applications such as lighting and cooking. However, its use in internal combustion engines, particularly for stationary energy generation, has increased considerably. Biogas has increasingly contributed to energy security owing to its environmental benefits and production potential [7].
Nonetheless, the application of biogas in internal combustion engines faces challenges due to its composition—particularly the high CO2 content—which results in a lower calorific value, combustion instability, and higher emissions of CO and unburned HCs [9].
Therefore, in addition to dual-fuel operation (biodiesel/biogas), the enrichment of biogas with hydrogen is a promising strategy for improving combustion performance and emissions. This is mainly due to the favorable combustion properties of hydrogen and its low technological impact on existing systems [10], offering a high calorific value and considerable potential for emission reduction [11].
The compatibility of hydrogen as a gaseous fuel additive is a key advantage because it can be integrated without major technological changes. Moreover, it offers flexibility by allowing gradual adjustments to its concentration to optimize the injection processes, thereby supporting decarbonization efforts while increasing the calorific value of biogas, improving thermal efficiency, and reducing HC and CO emissions [12].
However, due to its high calorific value, hydrogen enrichment tends to elevate combustion chamber temperatures, which can lead to increased NOx emissions. Therefore, its use must be carefully optimized by considering the characteristics of the other fuels involved [13].
Dual-fuel combinations in compression ignition engines—using biodiesel as the liquid fuel and biogas enriched with hydrogen as the gaseous fuel—have shown significant potential for system optimization, offering complementary characteristics that can enhance emission profiles and overall engine performance [13].
Among the evaluated strategies, the combination of biogas and hydrogen proved particularly effective. Hydrogen enrichment offsets the low reactivity of biogas by leveraging its high flame speed and energy content [12]. This interaction improves combustion characteristics by increasing heat release and [13,14,15] in-cylinder pressure, leading to higher thermal efficiency and lower emissions [13]. These results underscore the role of hydrogen as a key enabler in optimizing dual-fuel operation with biodiesel and biogas.
Table 1 highlights that current literature primarily focuses on assessing the individual trends of biodiesel, biogas, and hydrogen when applied to dual-fuel engines, typically analyzing their isolated effects on emissions and performance parameters. Several studies explore the combination of biogas with hydrogen [16,17,18,19,20,21,22,23,24] or biogas with biodiesel [14,15,20,21,25], reporting specific outcomes such as increased NOx emissions with hydrogen enrichment or CO reduction with biodiesel blends. However, few investigations address the simultaneous interaction of these three fuels within a single dual-fuel system, particularly scenarios where hydrogen-enriched biogas is combined with varying biodiesel concentrations.
Moreover, a significant gap in the literature is the lack of parametric optimization studies, such as those employing response surface methodology (RSM), which could identify optimal fuel ratios and operating conditions to maximize energy efficiency while minimizing emissions.
Most available studies remain descriptive, providing trend analyses without proposing quantitative optimization models or experimental approaches that consider the combined effects of multiple fuels on combustion dynamics.
In this context, the present study adopts a distinct approach by experimentally investigating the interaction between biodiesel, biogas, and hydrogen in dual-fuel engines, emphasizing the comparative assessment of conditions with and without hydrogen addition.
A series of experiments were conducted wherein hydrogen presence was deliberately varied, enabling not only the evaluation of its impact on emissions and performance but also the development of response surface models for both scenarios—biogas with and without hydrogen enrichment.
A comparative approach within a unified experimental design remains underexplored in the existing literature, which predominantly emphasizes isolated analyses of hydrogen addition or basic biogas and biodiesel blends, seldom addressing the more complex interactions among the three fuels.
By incorporating these combined effects and modeling system responses, this study provides evidence to support the optimization of dual-fuel engine operation, offering data that can inform control strategies and emission mitigation in renewable fuel applications. A distinctive contribution of this work is the evaluation of whether low-level hydrogen enrichment of biogas supplied to a dual-fuel engine yields substantial and measurable improvements in performance and emissions, with particular relevance to small generator sets employed in agricultural applications in remote regions of Brazil.
Response surface models delineate trade-offs among liquid-fuel specific consumption, thermal efficiency, and NOx, CO, and HC emissions, identifying operating points as functions of load and biodiesel fraction. These findings support operational strategies and emission-mitigation measures for small generator sets powered by renewable gaseous fuels, particularly in rural settings.

2. Materials and Methods

2.1. Liquid-Fuel Mineral Diesel Oil/Biodiesel

The liquid fuel utilizing biodiesel, designated as B100, was produced via the transesterification of soybean oil at the Multiuser Laboratory of Sustainable Technologies (LABTES) of UNIOESTE Cascavel, Paraná, Brasil, chosen to ensure representativeness of Brazilian market conditions, where soybean oil is the predominant biodiesel feedstock.
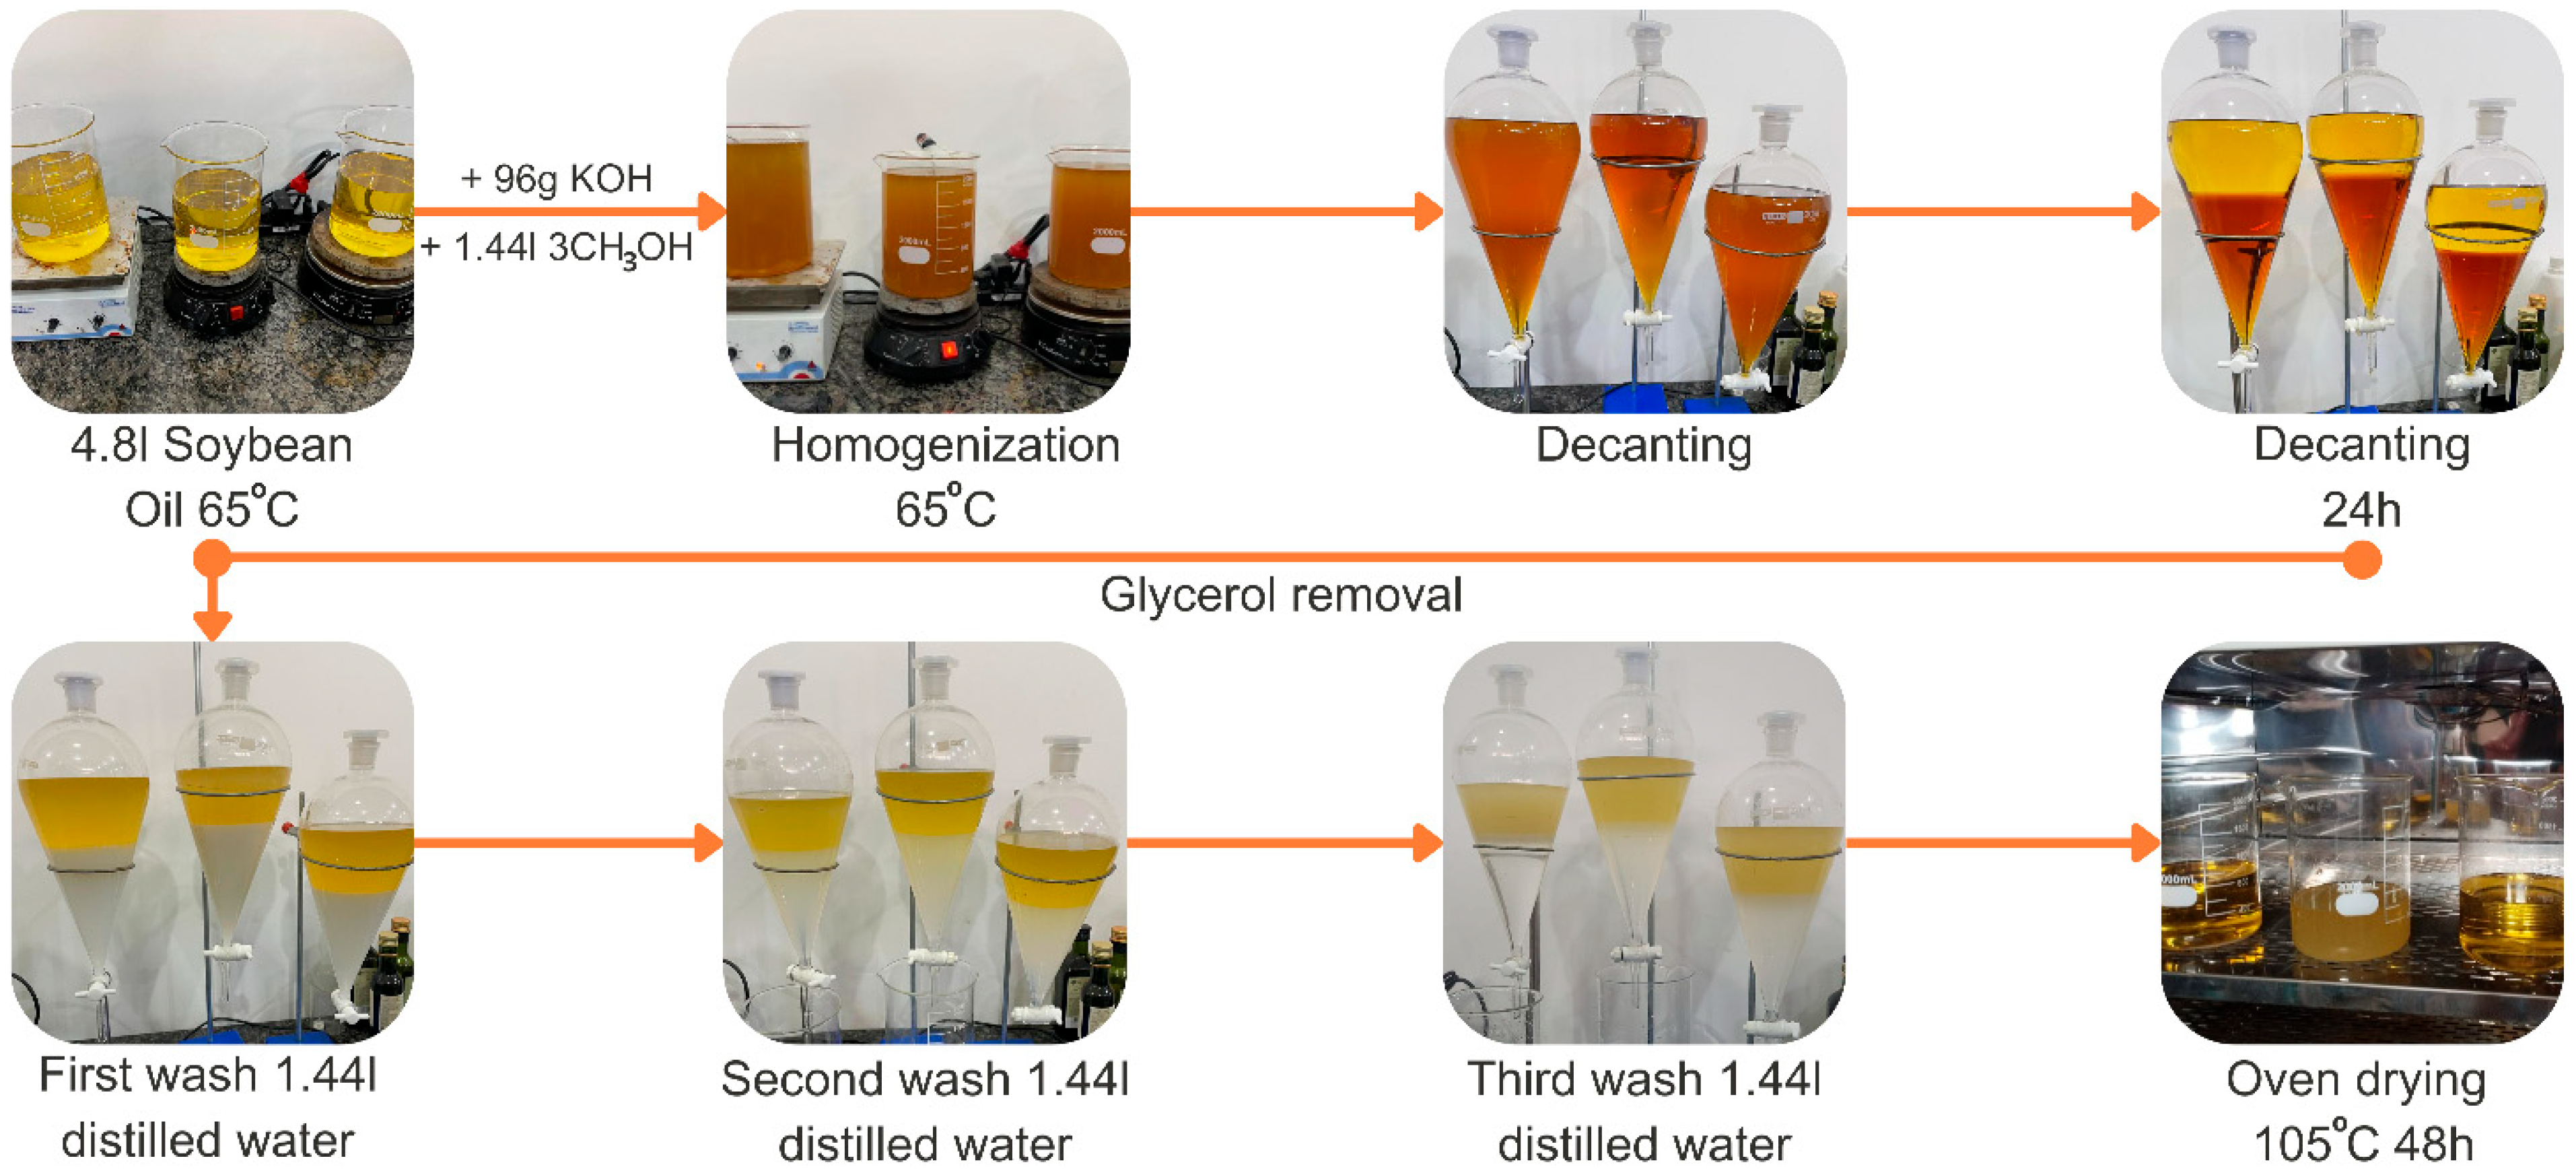
Biodiesel was produced using a ratio of 4.8 L of commercial soybean oil, 1.44 L of methanol, and 96 g of potassium hydroxide. The soybean oil was divided into three portions of 1.6 L each, heated to 65 °C under mechanical stirring until translucent, and subsequently decanted to separate the glycerol.
The biodiesel washing process was conducted in three cycles involving the addition and mixing of distilled water, followed by 24 h decantation periods. Final drying was performed in an oven at 105 °C for 48 h (Figure 1), yielding approximately 2.3 L of B100 biodiesel, whose physicochemical properties are presented in Table 2 and Table 3.
The biodiesel used in this study had a water content of 770 mg/kg, exceeding the ASTM D6304 specification limit of 500 mg/kg (Table 2). However, this deviation did not affect combustion behavior or engine performance under the tested conditions.
Since the fuel was utilized immediately after production, storage-related issues such as oxidation and microbial growth were avoided. Furthermore, the same biodiesel batch was employed across all experiments, ensuring sample consistency and enhancing the reliability of comparative analyses.
The liquid fuel also included pure A-S10 mineral diesel oil, called B0, obtained commercially by Estrada Distribuidora de Derivados de Petróleo LTDA Cascavel, Paraná Brasil, which was then fractionated and mixed with B100 biodiesel in the concentrations shown in Table 3.

2.2. Gaseous Biogas/Hydrogen Fuel

The biogas used in this research comes from pig farm waste provided by 1650 pigs in the finishing phase, generating approximately 8000 kg/day of waste, which is destined for a covered lagoon-type biodigester.
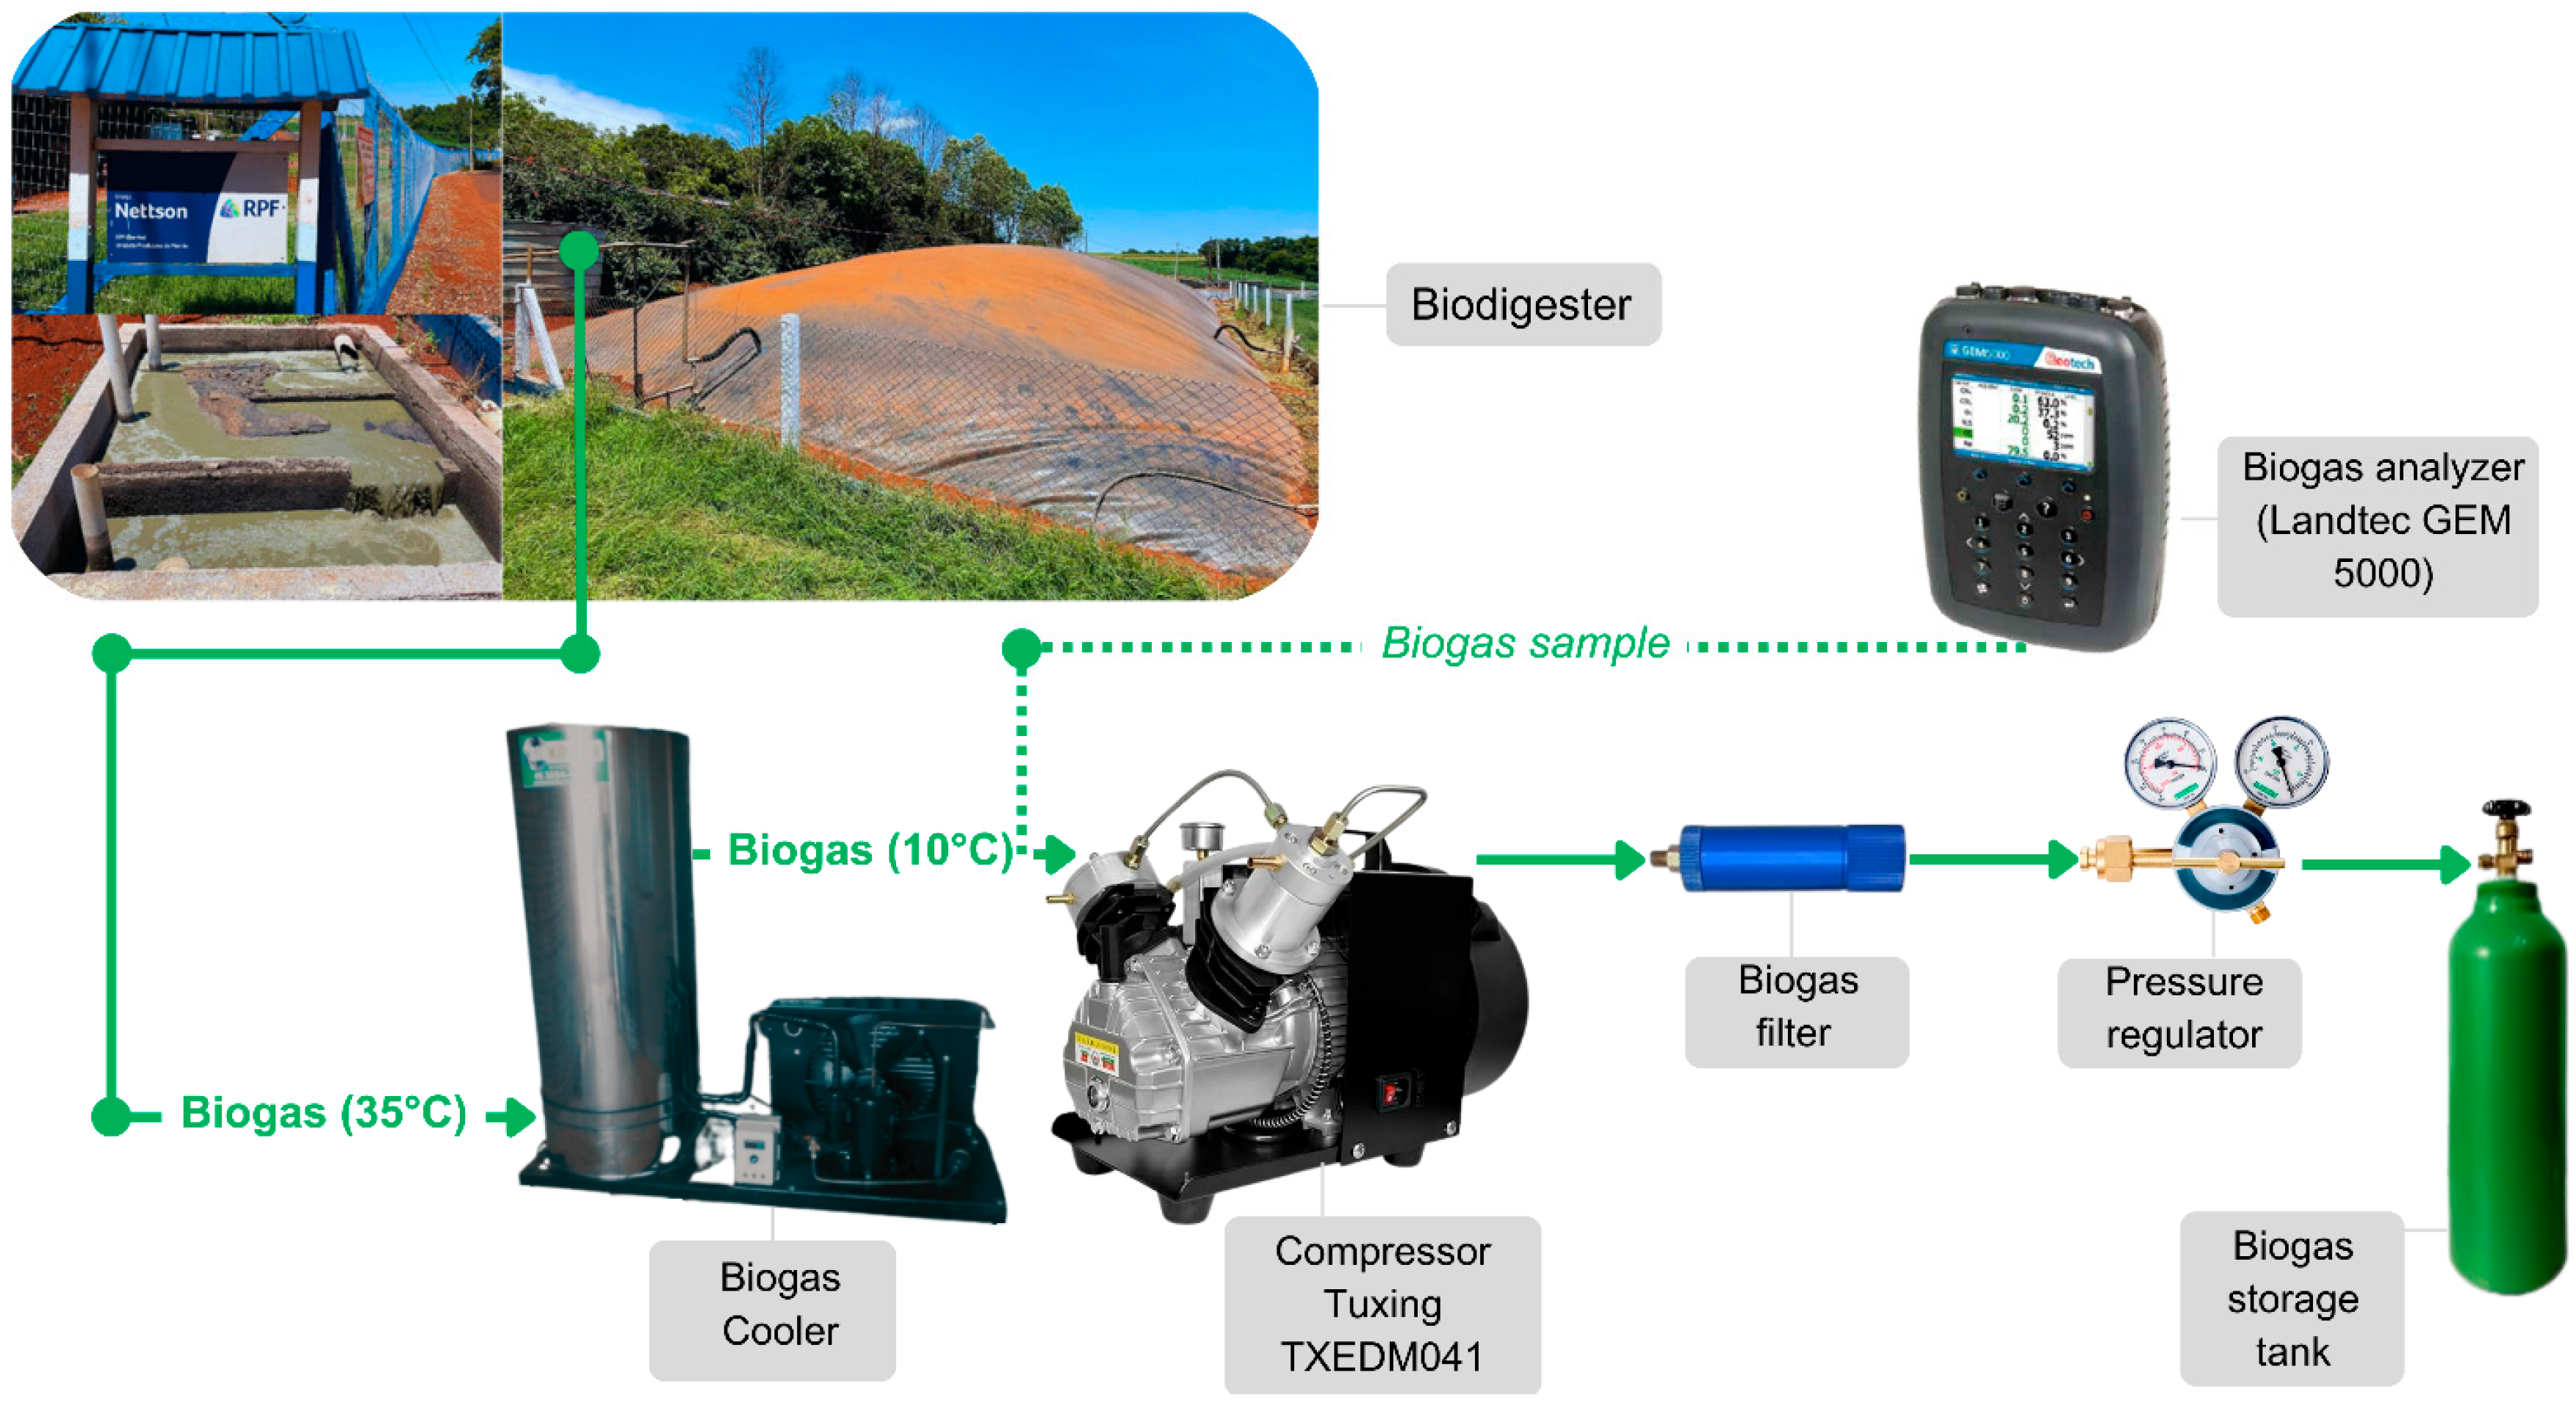
The biogas collection system is shown in Figure 2. It captures biogas after it has been cooled and dried by the Bioköller cooler, Toledo, Paraná Brasil, is compressed and stored at 10 Mpa (100 Bar) by the Tuxing compressor model TXEDM041 in five type 1 CNG cylinders, and then analyzed using the LANDTEC® Gas Extraction Monitor (model GEM5000; Table 4).
Hydrogen was purchased from Oxiguaçu indústria e Comércio de Gases LTDA Cascavel, Paraná Brasil. Commercial hydrogen (99% H2) with a low calorific value (LCV hydrogen) of 116.49 kJ/g was compressed to 20 Mpa and stored in a metal cylinder.
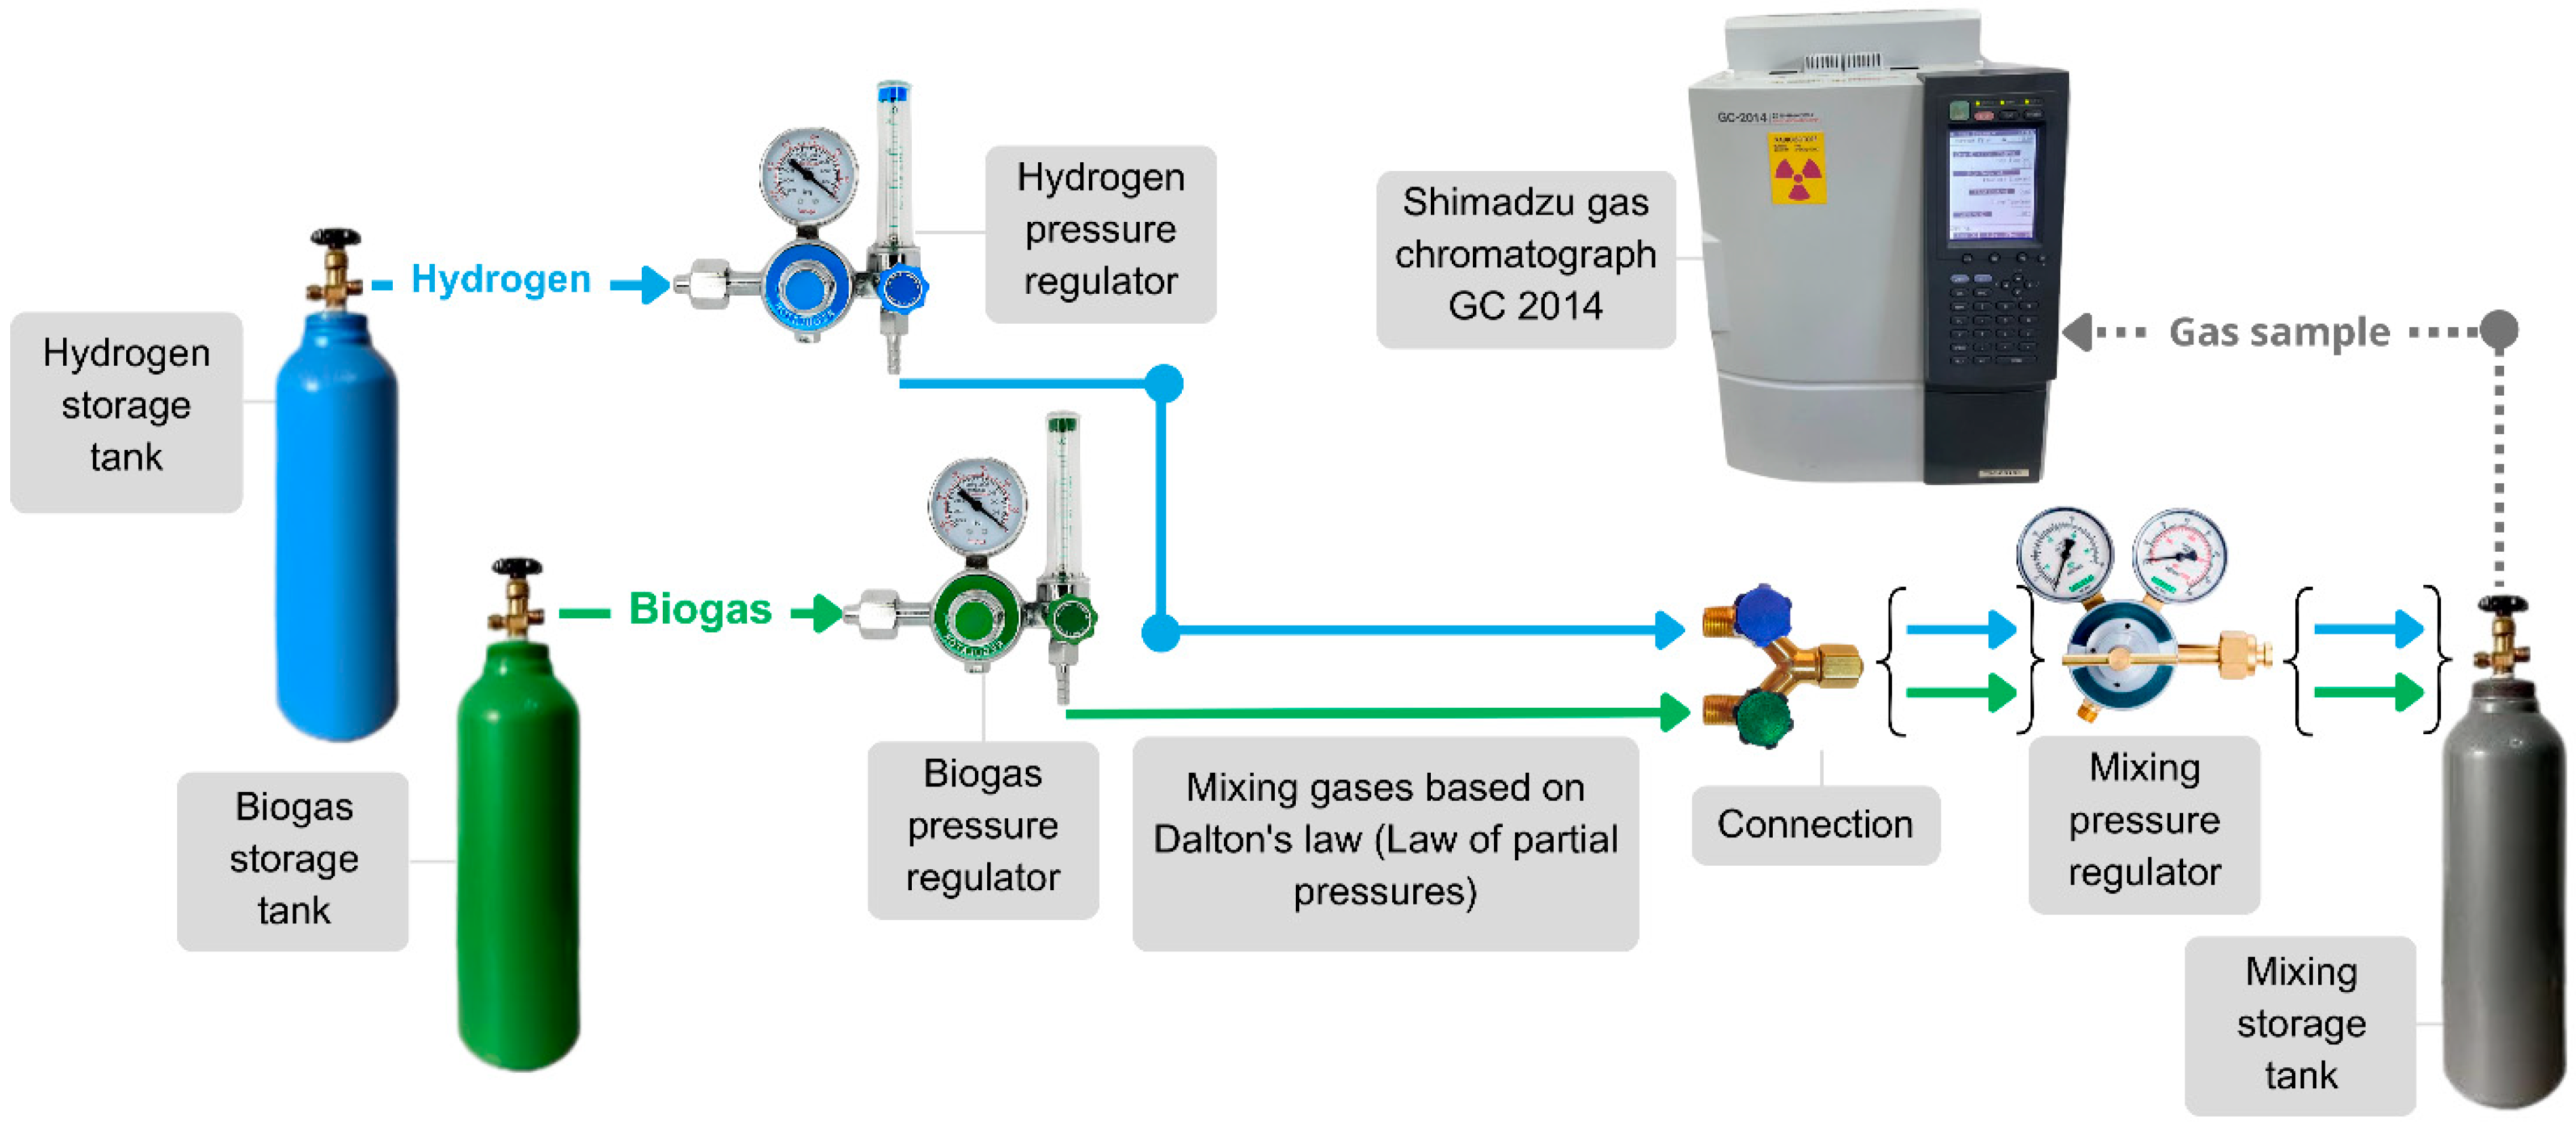
To determine the hydrogen concentration in the mixture, Dalton’s law for additive pressures was used to determine the total pressure of the gas mixture by the sum of the pressures of each of the constituent gases, as well as Amagat’s law of additive volumes, where the total volume of the mixture is equal to the sum of the volumes of the constituent gases, which Sagar and Agarwal [45] considered a good approximation when preparing mixtures between hydrogen and natural gas.
The pressures of biogas and hydrogen in the mixing cylinder were monitored using pressure regulators equipped with manometers and flowmeters to define an approximation of the amount of each gas inserted into the mixing cylinder, which was subsequently tested using a Shimadzu model GC-2014 gas chromatograph (Figure 3) to determine the hydrogen concentration in the mixture.
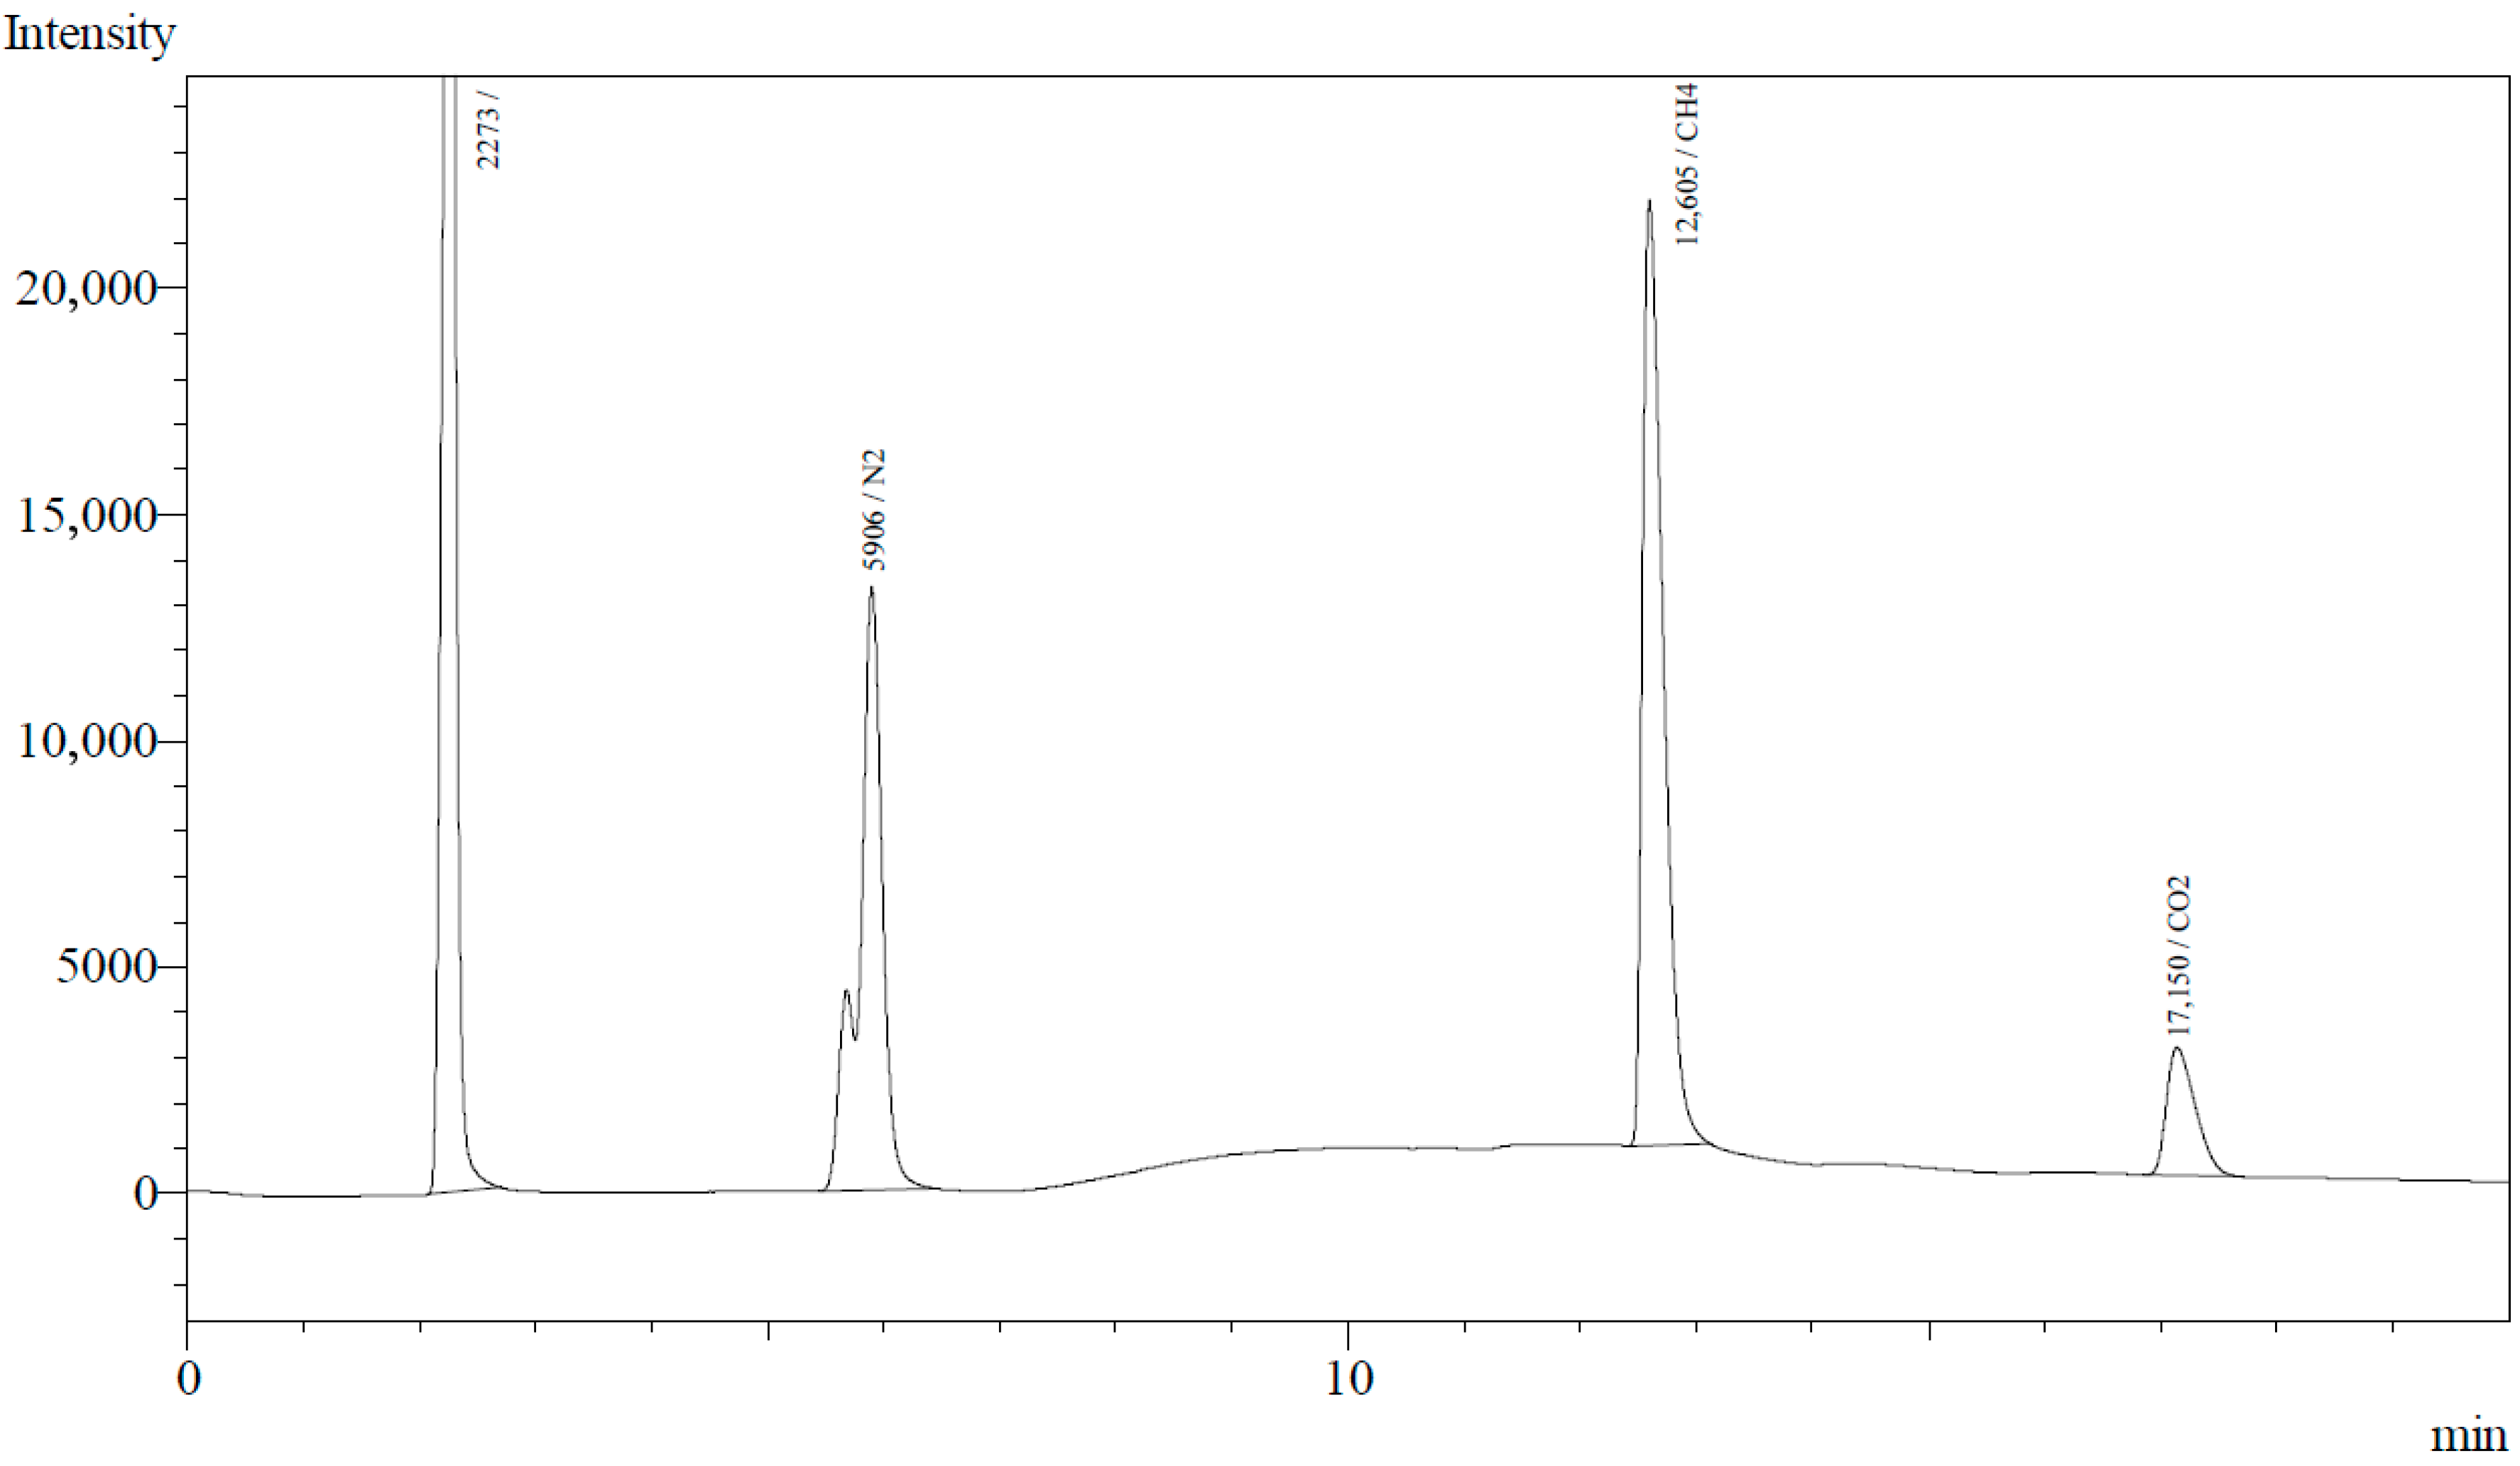
The gaseous fuel sample was collected directly from the storage cylinder using an Instrutherm gas sampling bag with a capacity of 1 L, and then injected into the chromatograph using a syringe. The chromatographic analysis (Figure 4) revealed a composition of 13.3% hydrogen, 55.6% CH4, and 31.1% CO2 (Table 5). The presence of nitrogen in the samples is attributed to contamination during sampling.
The selected hydrogen enrichment level of 13.3% was determined by experimental and resource constraints, which limited the preparation of multiple blending ratios. The target range was 10–15% H2, and the final value reflected mixture precision limitations.
A lower concentration was deliberately chosen to evaluate whether modest hydrogen additions could yield measurable improvements in performance and emissions while maintaining operational safety. Broader optimization through additional concentration levels is planned for future investigations.

2.3. Experimental System

The experimental system comprised a single-cylinder compression-ignition generator engine (nominal power of 10 HP at 3600 rpm), which was originally designed to run on diesel. It was later modified to operate in dual-fuel mode, using biodiesel and hydrogen-enriched biogas as the pilot and main fuels, respectively. The adaptations only focused on an air intake system with an installed Huayi GX390/188F carburetor.
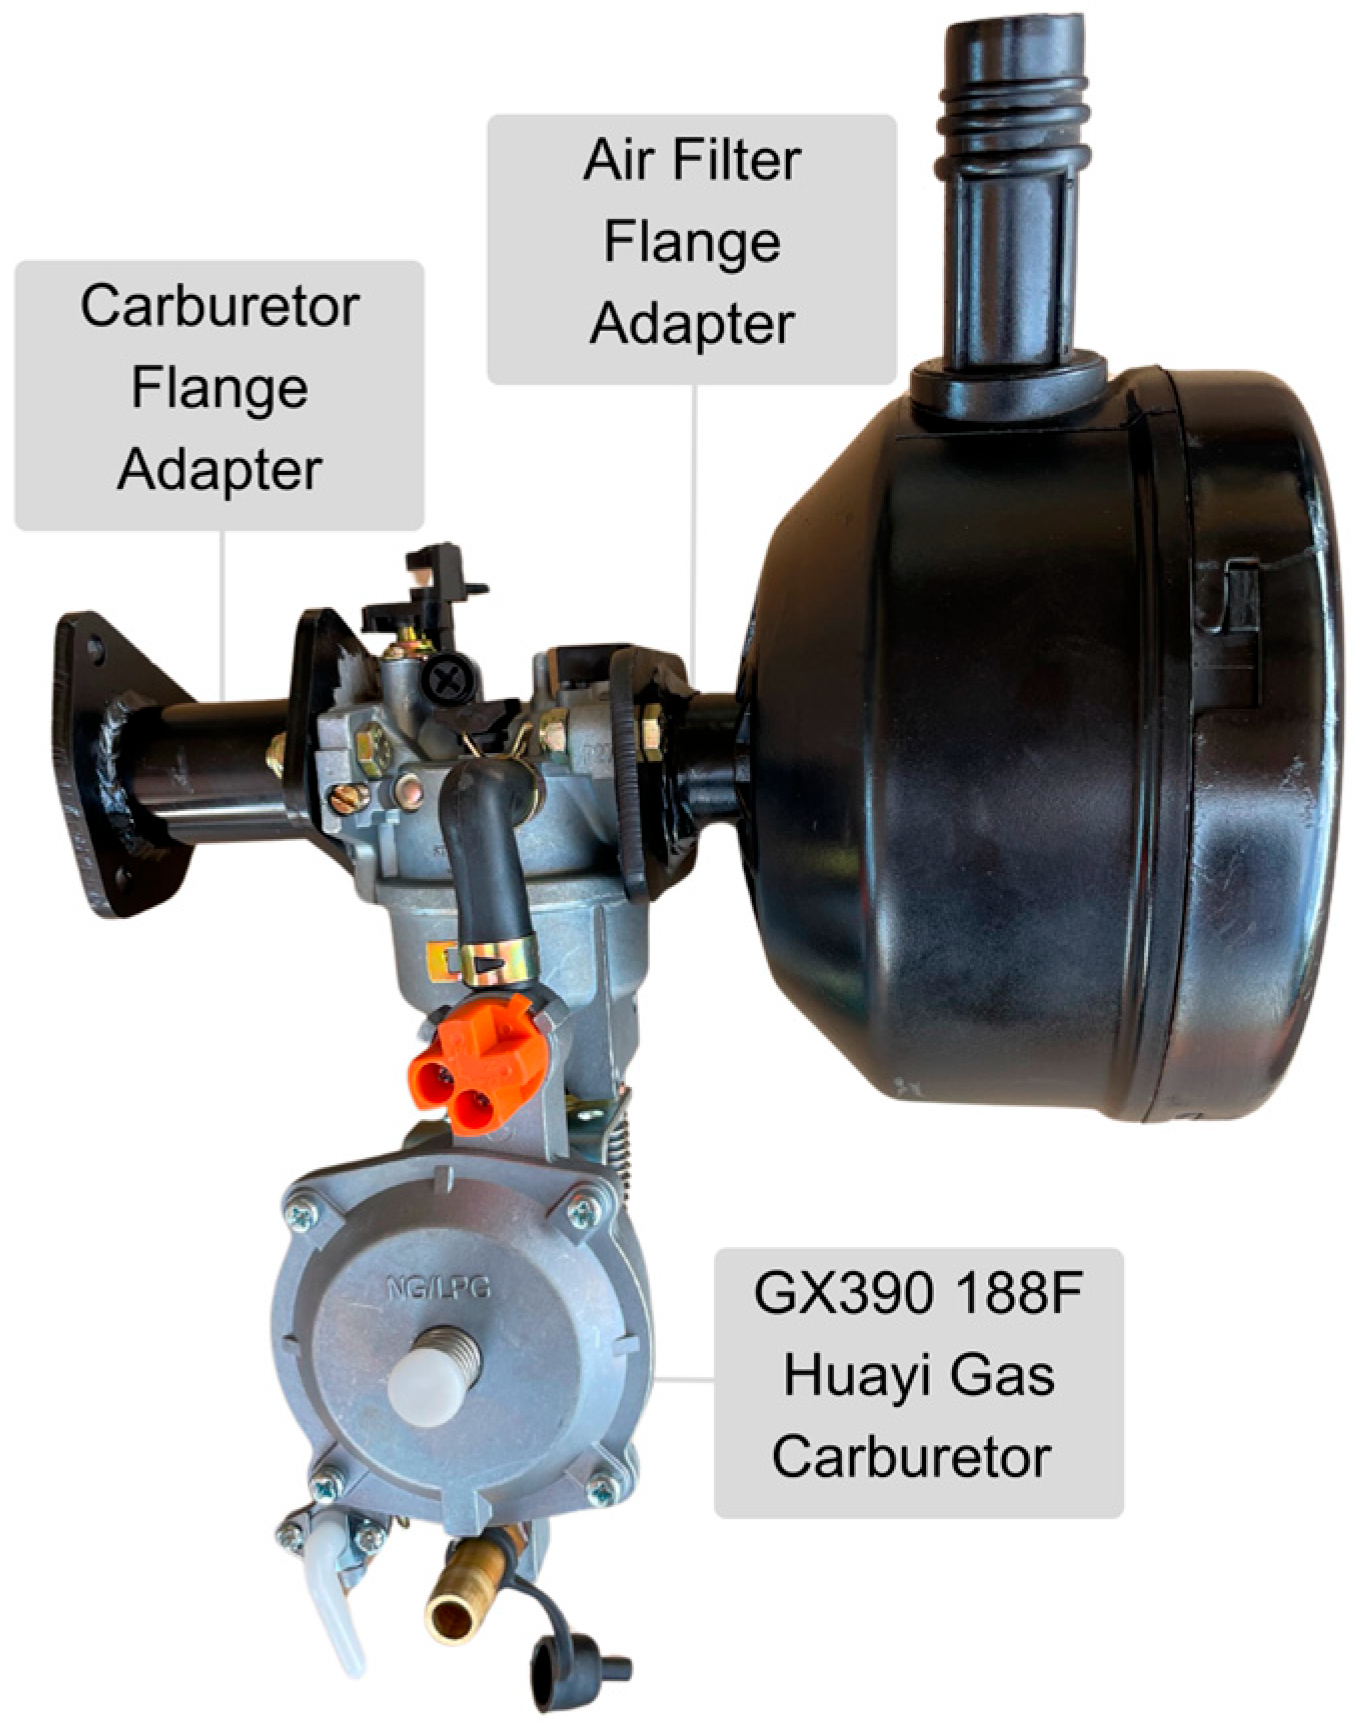
The carburetor adaptation was developed starting from the engine air filter flange. A second flange was designed and attached to enable carburetor mounting with the two flanges spaced 50 mm apart to prevent physical interference between components. The connection was established using a tube with an internal diameter of 27.8 mm, matching the carburetor outlet (Figure 5). Finally, the air filter was coupled to the carburetor. This configuration ensures effective mixing of the gaseous fuel with the intake air before entering the combustion chamber.
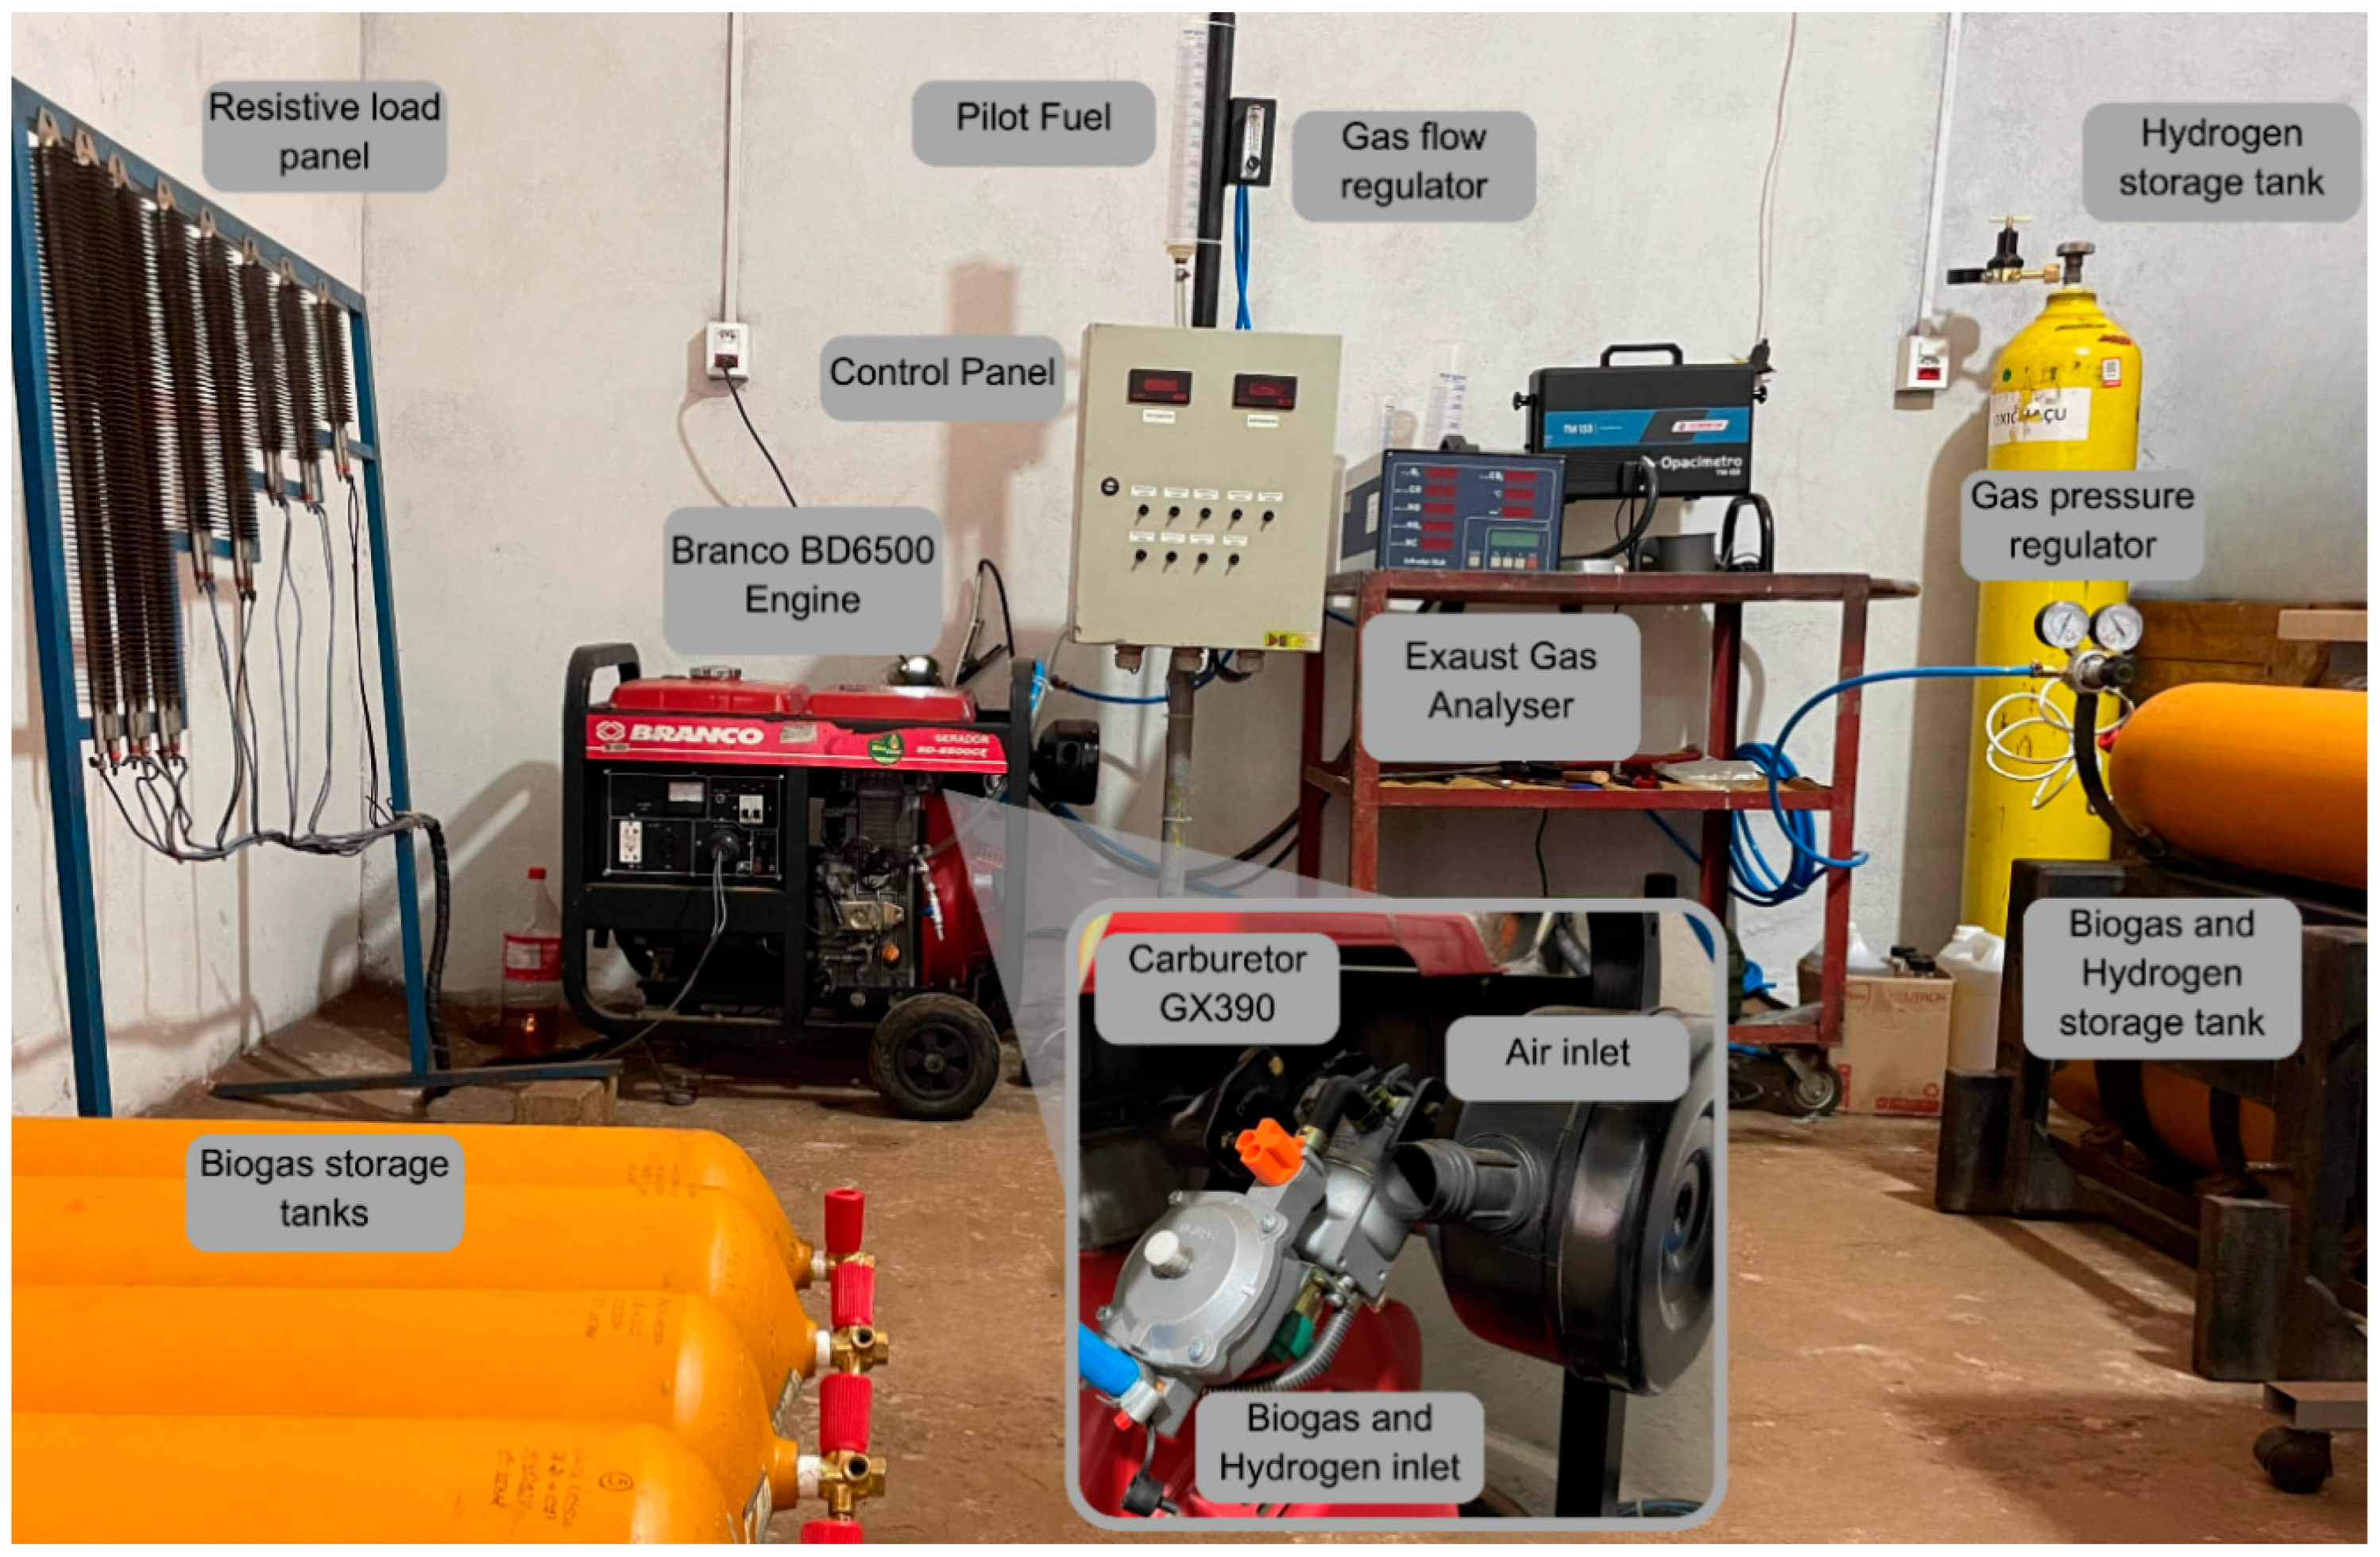
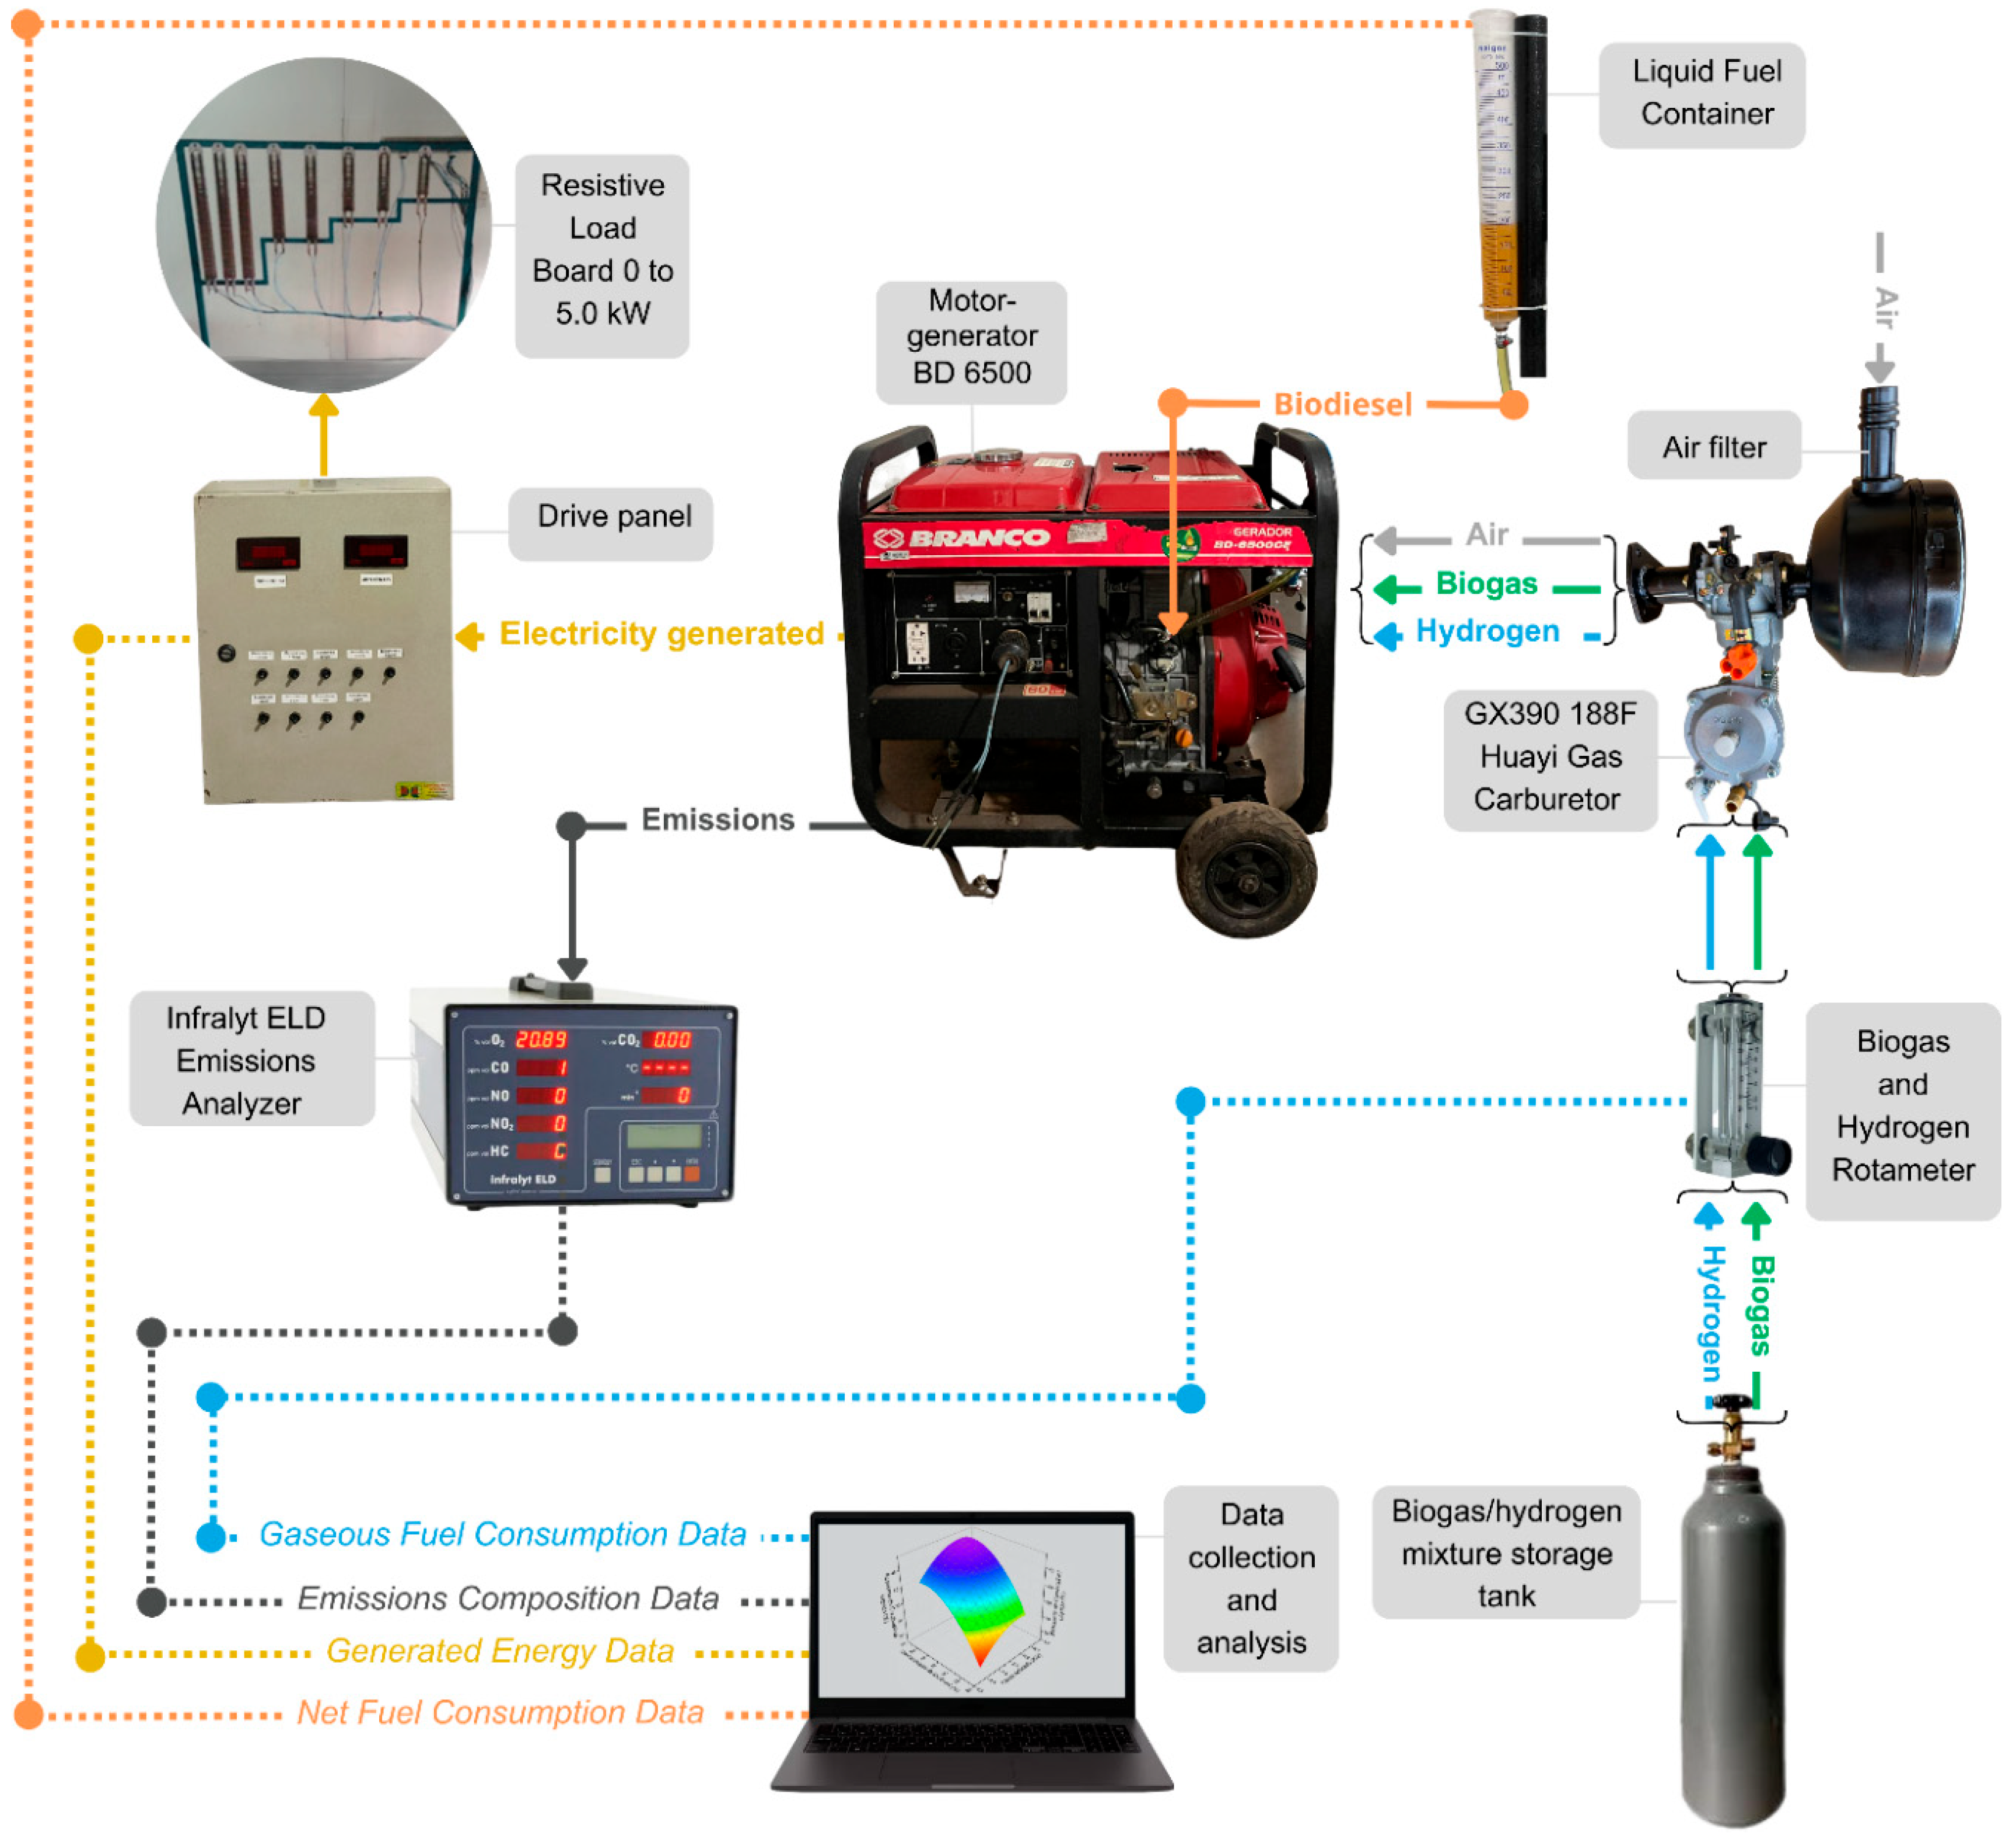
Different load regimes were simulated using a modular resistive bank operating at an alternating current of 240 V. Gaseous fuel consumption was monitored using an LZT M6 rotameter, whereas biodiesel consumption was measured using a 500 mL polypropylene measuring cylinder. The electrical performance parameters were obtained using a Fluke F302+ digital multimeter with noninvasive current sensors. Exhaust emissions (CO, NO, NO2, and HC) were continuously analyzed using the Infralyt ELD infrared gas analyzer, allowing integrated evaluation of the engine’s behavior under different load and fuel supply conditions. The experimental setup and the system’s functional schematic are shown in Figure 6 and Figure 7, respectively.

2.4. Methodology for Uncertainty Analysis

To evaluate the measuring instruments and values obtained from the tests and ensure a systematic evaluation of the experimental data, an uncertainty analysis was conducted based on the measurements obtained (Table 6). Based on the average and variance of the values obtained, the standard deviation was calculated for each of the measurements taken to determine the measurement uncertainty, which was then grouped together, culminating in the uncertainty obtained by the experimental procedure according to Equation (1) [46,47].
u e x p e r i m e n t o ( % ) = u n e t   f u e l   c o n s u m p t i o n   2   +   u v o l t a g e   2 + u c u r r e n t   2 + u n o x   2 + u c o   2 + u h c   2   = 0.17 2   + 0.35 2 + 0.04 2 + 3.37 2 + 3.37 2 + 0.31 2   = ±   4.84 %
The total uncertainty of the experiment, determined according to Equation (1), was 4.84%, slightly higher than the values reported by Murugesan [46] (2.36%); Ahmad, Yadav and Hasan [47] (3.24%); Oni [48] (0.64%); Mohite [19] (4.47%); and Saridemir, Polat, and Ağbulut [32] (2.3%); however, remaining below the 5% limit, this level of uncertainty is considered acceptable, guaranteeing a 95% degree of reliability.

2.5. Experimental Design

Response surface methodology was used in this study. It is a multivariate statistical method used to fit data to a three-dimensional curve, determined using a low-degree polynomial equation [49,50].
The methodological process involves the development of an experimental design that defines the tests to be performed. The inputs and results of these tests are then simulated to identify the best equation and, consequently, the surface that describes them. This allows the identification of optimized points and regions of the mechanism or phenomenon under study [51].
The experimental design can be characterized by the distribution of its points using the Central Composite Design (CCD) model, which, according to Veza [50], is highly effective in fitting first- and second-order surfaces and is therefore suitable for the experiments presented in this work.
Further corroborating the effectiveness of the response surface method, Sharma [52] highlighted it as one of the most relevant methods for describing and optimizing internal combustion engines because it highlights the most important points provided by the engine’s input conditions as well as their optimization in the number of tests given by the experimental design.
In this research, the input variables were the concentration of biodiesel in the liquid fuel (%) and the load applied (kW) in the generator with a respective input range of 15% to 30%, 2.00 kW to 4.00 kW, with central points established at 22.5% biodiesel and 3.00 kW load (Table 7), as well as the presence of hydrogen enriching the biogas at a concentration of 13.3% as a mixture.
The responses analyzed were based on the objective of comparing the specific liquid fuel consumption (g/kWh) and efficiency of the generator engine provided by variations in the biodiesel concentrations in the liquid fuel and hydrogen enrichment in the gaseous fuel in the dual-operating mode. The emission responses of the engine generator for CO, NOx, and HCs were analyzed.
The experimental models were developed using OriginPro 2024b (Learning Edition) software with serial number GL3S4-6089-7609064 using its Design of Experiments v1.39 application, which uses response surface methodology based on a CCD with two replicates and six central points, totaling 40 tests, culminating in five experimental matrices with equal input data and different responses for each of the factors analyzed, as shown in Table 8.

Methodology for Performance Analysis and Data Collection

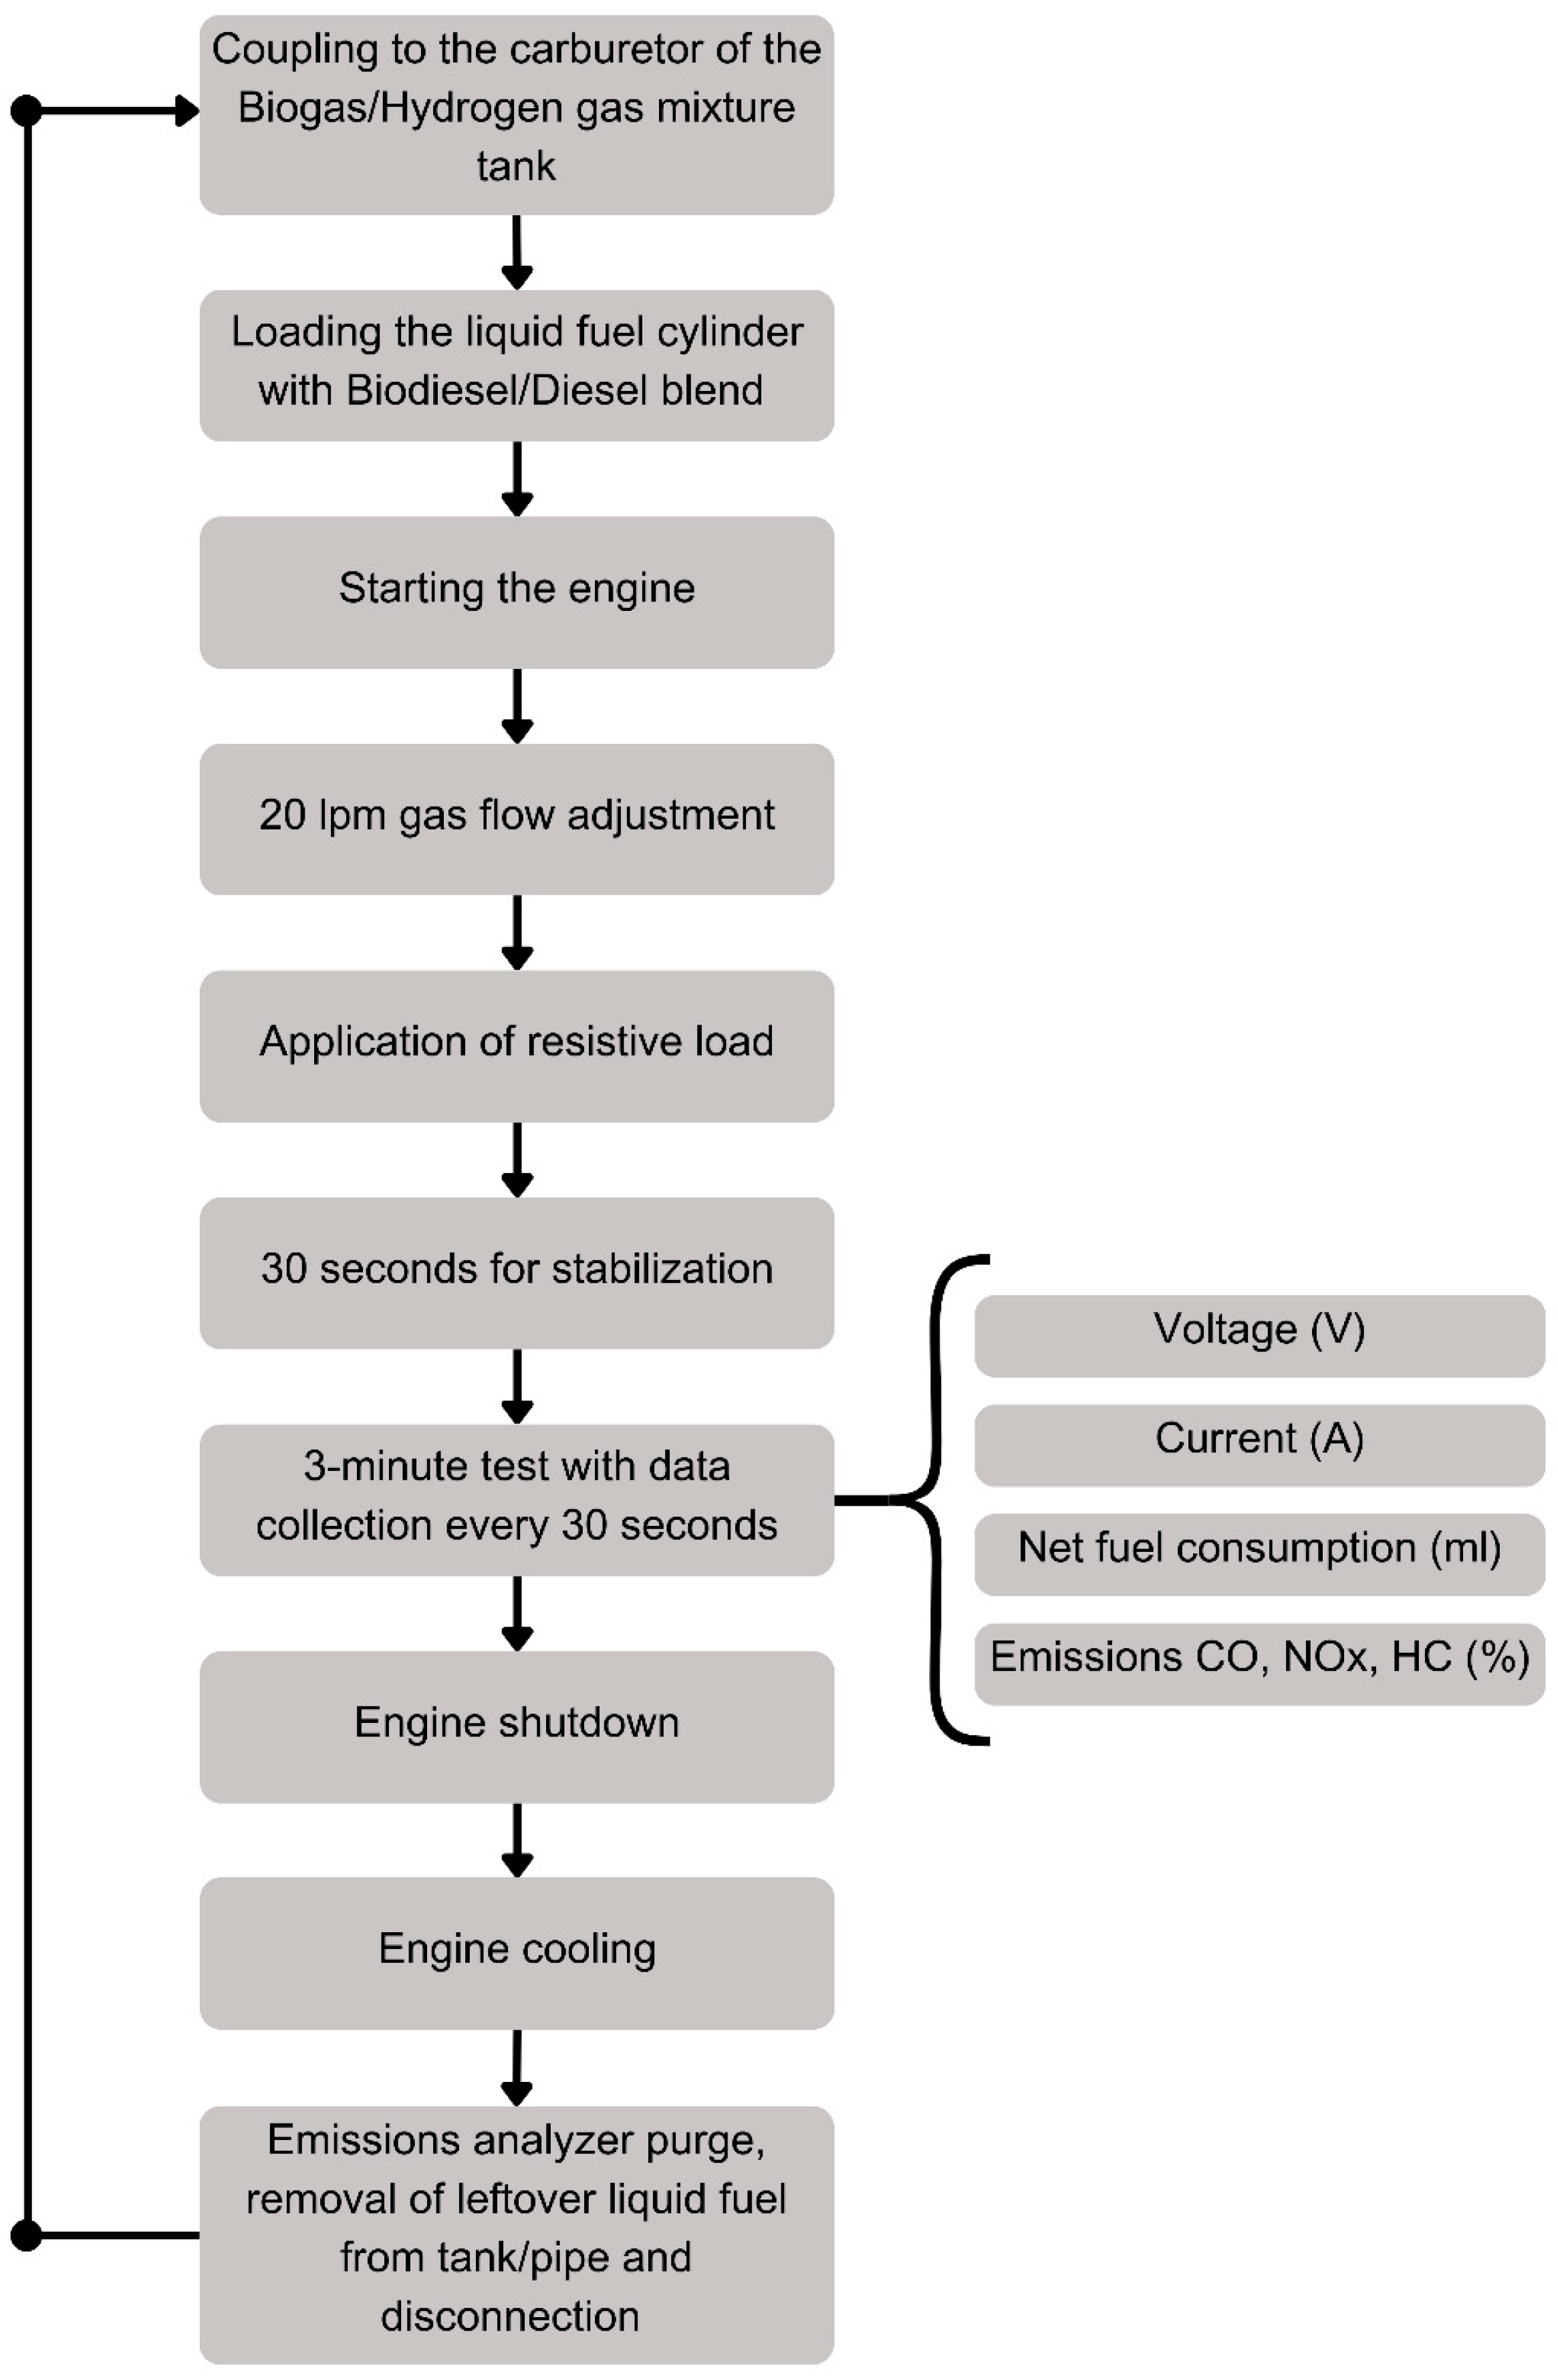
The experimental procedure shown in Figure 8 began by attaching a cylinder containing the biogas and hydrogen mixture to the carburetor and loading the cylinder with the biodiesel and diesel mixture, with concentrations according to the experimental matrix shown in Table 7.
The engine was started, the gas flow rate was adjusted to 10 LPM, and a load set based on the experimental matrix was applied. After 30 s to stabilize the system, the test was conducted for 3 min, collecting data on voltage (V), current (A), CO, NOx, and HC emissions (%) every 30 s, as well as the total net fuel consumption (mL).
Once the measurements were completed, the engine was turned off and cooled. Finally, the emissions analyzer was purged so that there was no interference between the tests, and any leftover liquid fuel was removed from the tank and pipes so that a new test could begin.

3. Discussion

3.1. Analysis of Variance of Performance Parameters and Emissions

Table 9 shows the results of the analysis of variance (ANOVA) for specific liquid fuel consumption, thermal efficiency, and CO, NOx, and HC concentrations.
The load applied to the engine (Load) was the dominant factor, with highly significant effects (p < 0.001) [47] on all parameters evaluated, indicating its strong influence on the performance and emissions, as demonstrated by the high F values and statistical significance of the linear and quadratic terms of the load.
The addition of hydrogen (Hyd.) had a statistically significant impact, reducing specific fuel consumption (F = 14.13; p < 0.0001) and increasing thermal efficiency (F = 41.74; p < 0.0001). In addition, the presence of hydrogen significantly affected the CO (F = 11.58; p = 0.0019) and NOx (F = 183.47, p < 0.0001) concentrations.
Biodiesel (Biod.) only influenced efficiency (F = 6.65; p = 0.0144), with no significant effect on the CO, NOx, or HC concentrations. Quadratic effect analyses revealed that biodiesel (Biod. × Biod.) and load (Load × Load) had relevant influences on various responses, suggesting a nonlinear behavior that deserves attention when adjusting the regression models.
Interactions between the biodiesel and load (Biod. × Load) and between biodiesel and hydrogen (Biod. × Hyd.) used only in the CO and NOx models showed a significant effect on CO emissions, whereas the load–hydrogen interaction (Load × Hyd.) significantly affected the NOx emissions.
The lack-of-fit tests indicated that the models fitted for specific consumption, efficiency, and CO and NOx emissions were of good quality (p > 0.05). However, the model for HC emissions showed a marginal fit (p = 0.0057), indicating the possibility of variation not being fully captured by the evaluated factors.
The coefficients of determination (Table 10) reinforce the quality of the obtained model. R2 values > 0.97 were observed for specific fuel consumption, thermal efficiency, and CO and NOx concentrations, indicating that >97% of the variability in the data was explained by the adjusted models.
For HC emissions, the model yielded an R2 of 0.81 and an adjusted R2 of 0.78, indicating good explanatory capacity, albeit lower than that obtained for the other parameters. This reduced accuracy may be attributed to the inherently erratic behavior of HC emissions, which are strongly influenced by factors such as combustion temperature and equivalence ratio. Nonetheless, the model provides a reasonable approximation for predicting HC emissions.
Based on the data from the ANOVA and the experimental matrix, response surface models were developed for each variable evaluated, considering the presence (h1) and absence (h0) of hydrogen in the gaseous fuel. The corresponding mathematical expressions are given in Equations (2)–(13), where x denotes the biodiesel concentration (%) and y the applied load (kW).
S N F C   h 0   ( g k W h 1 ) = 27.632 x 2 + 0.153 y 2 224.425 x 0.3428 y + 793.387
S N F C   h 1 ( g k W h 1 ) = 27.632 x 2 + 0.153 y 2 224.425 x 0.3428 y + 779.390
η   h 0   % = 0.0026 x 2 0.7868 y 2 + 0.1389 x + 7.1846 y + 2.2426
η   h 1   % = 0.0026 x 2 0.7868 y 2 + 0.1389 x + 7.1846 y + 1.4440
C O 2   h 0   ( % ) = 0.0037 x 2 1.065   10 5 y 2 + 0.1743 x + 0.4358 y + 3.9459
C O 2   h 1 ( % ) = 0.0037 x 2 1.065   10 5 y 2 + 0.1743 x + 0.4358 y + 4.0160
H C   h 0 ( p p m ) = 4.0775 x 2 0.0111 y 2 46.0140 x + 0.5601 y + 261.4691
H C   h 1 ( p p m ) = 4.0775 x 2 0.0111 y 2 46.0140 x + 0.5601 y + 254.5608
C O   h 0 ( p p m ) = 97.0578 x 2 0.2257 y 2 969.1527 x 9.3791 y + 5.6458 x y + 2916.2598
C O   h 1 ( p p m ) = 97.0578 x 2 0.2257 y 2 955.3488 x 5.5547 y + 5.6458 x y + 2746.8737
N O x   h 0 ( p p m ) = 0.0397 x 2 2.4373 y 2 + 1.8394 x + 31.3931 y 0.0042 x y 46.5061
N O x   h 1 ( p p m ) = 0.0397 x 2 2.4373 y 2 + 1.7801 x + 36.2608 y 0.0042 x y 47.3414

3.2. Analysis of Performance and Emissions Statistical Residuals

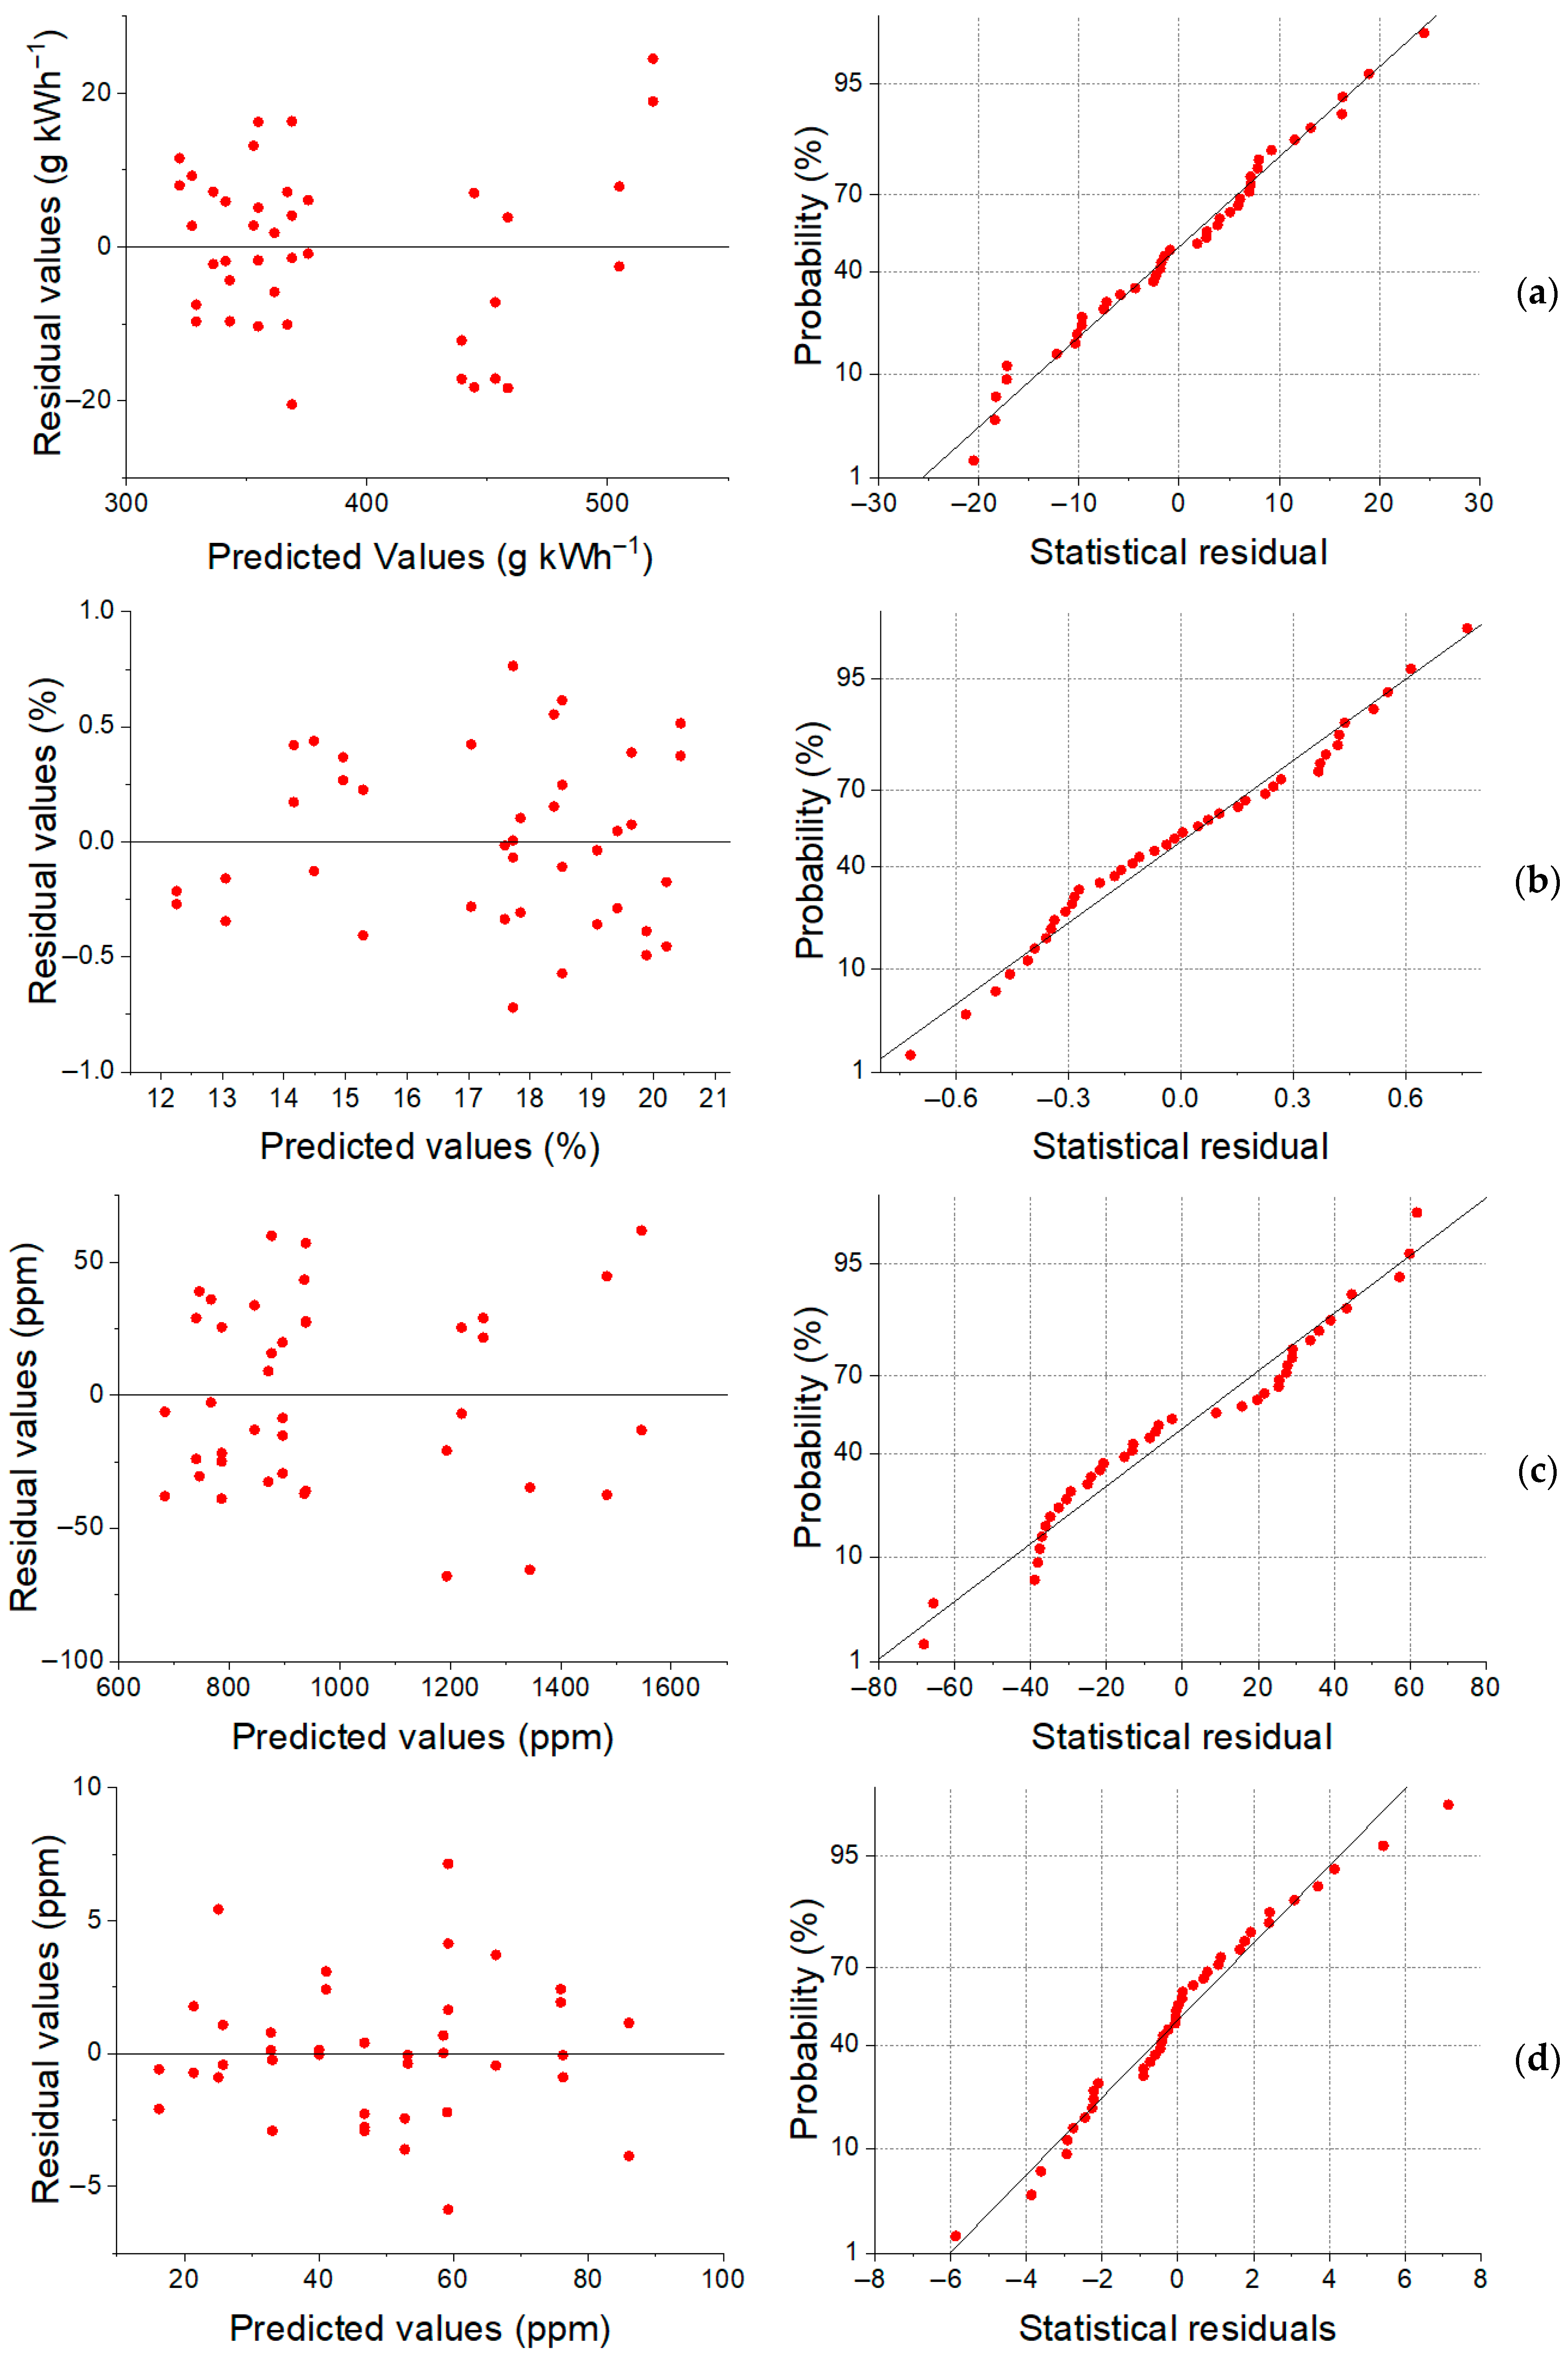
A residual analysis was conducted to validate the suitability of the response surface models developed for engine performance and emission parameters. The residual plots corresponding to the specific liquid fuel consumption; thermal efficiency; and CO, NOx, and HC concentrations are shown in Figure 9.
For the specific net fuel consumption (Figure 9a), thermal efficiency (Figure 9b), and CO concentration (Figure 9c), the residuals exhibited random behavior around the zero line and good adherence to the normality line. In addition to the normality of the errors, these results indicated the absence of systematic trends, confirming the robustness and statistical suitability of the models fitted for these parameters.
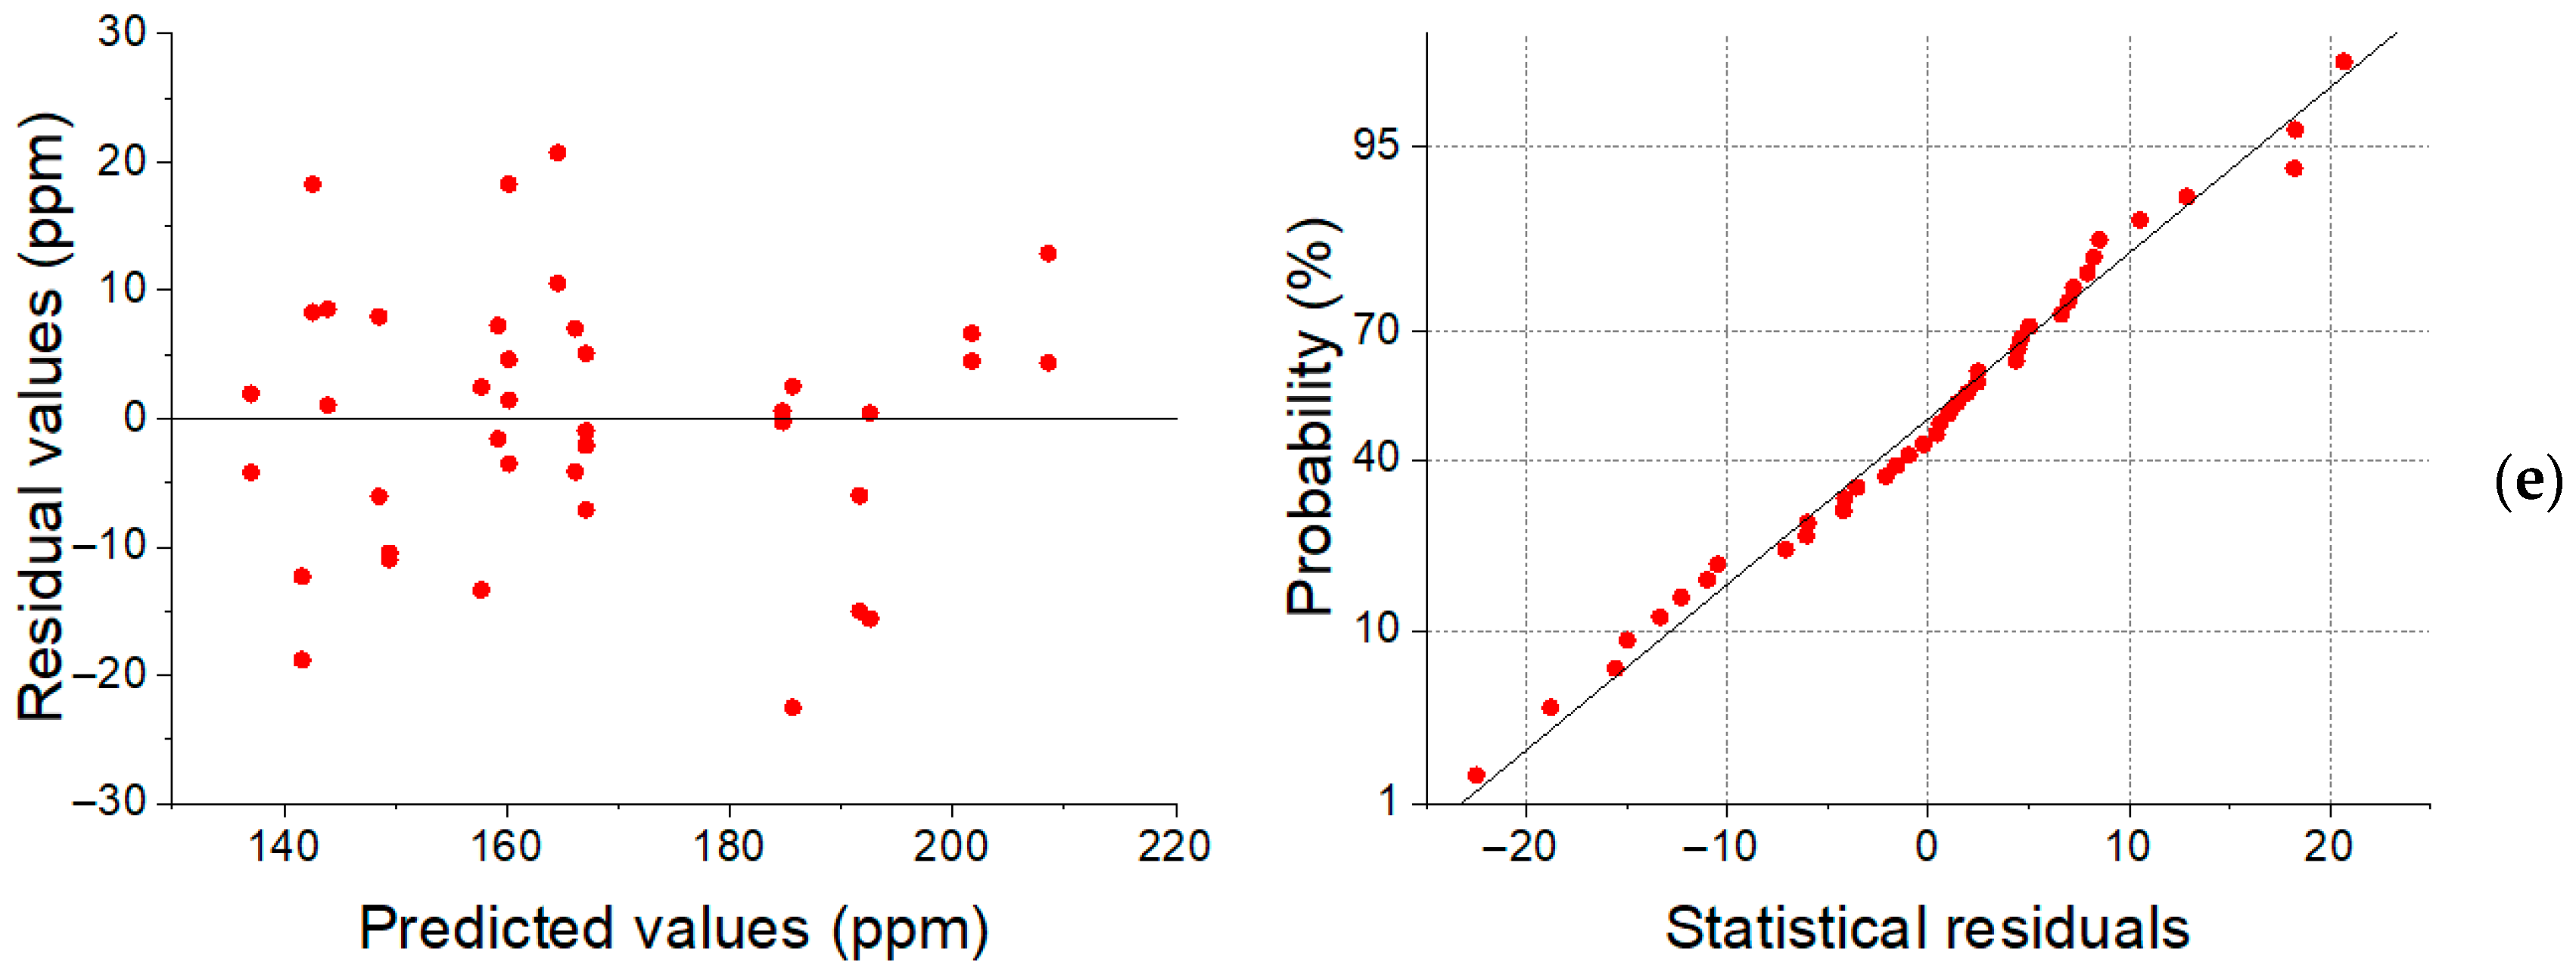
Regarding the NOx (Figure 9d) and HC (Figure 9e) concentrations, the residuals also exhibited a random distribution and approximately normal behavior. However, for HC, the dispersion of the residuals was slightly greater, which is compatible with the lower coefficient of determination.

3.3. Analysis of Performance Response Surfaces

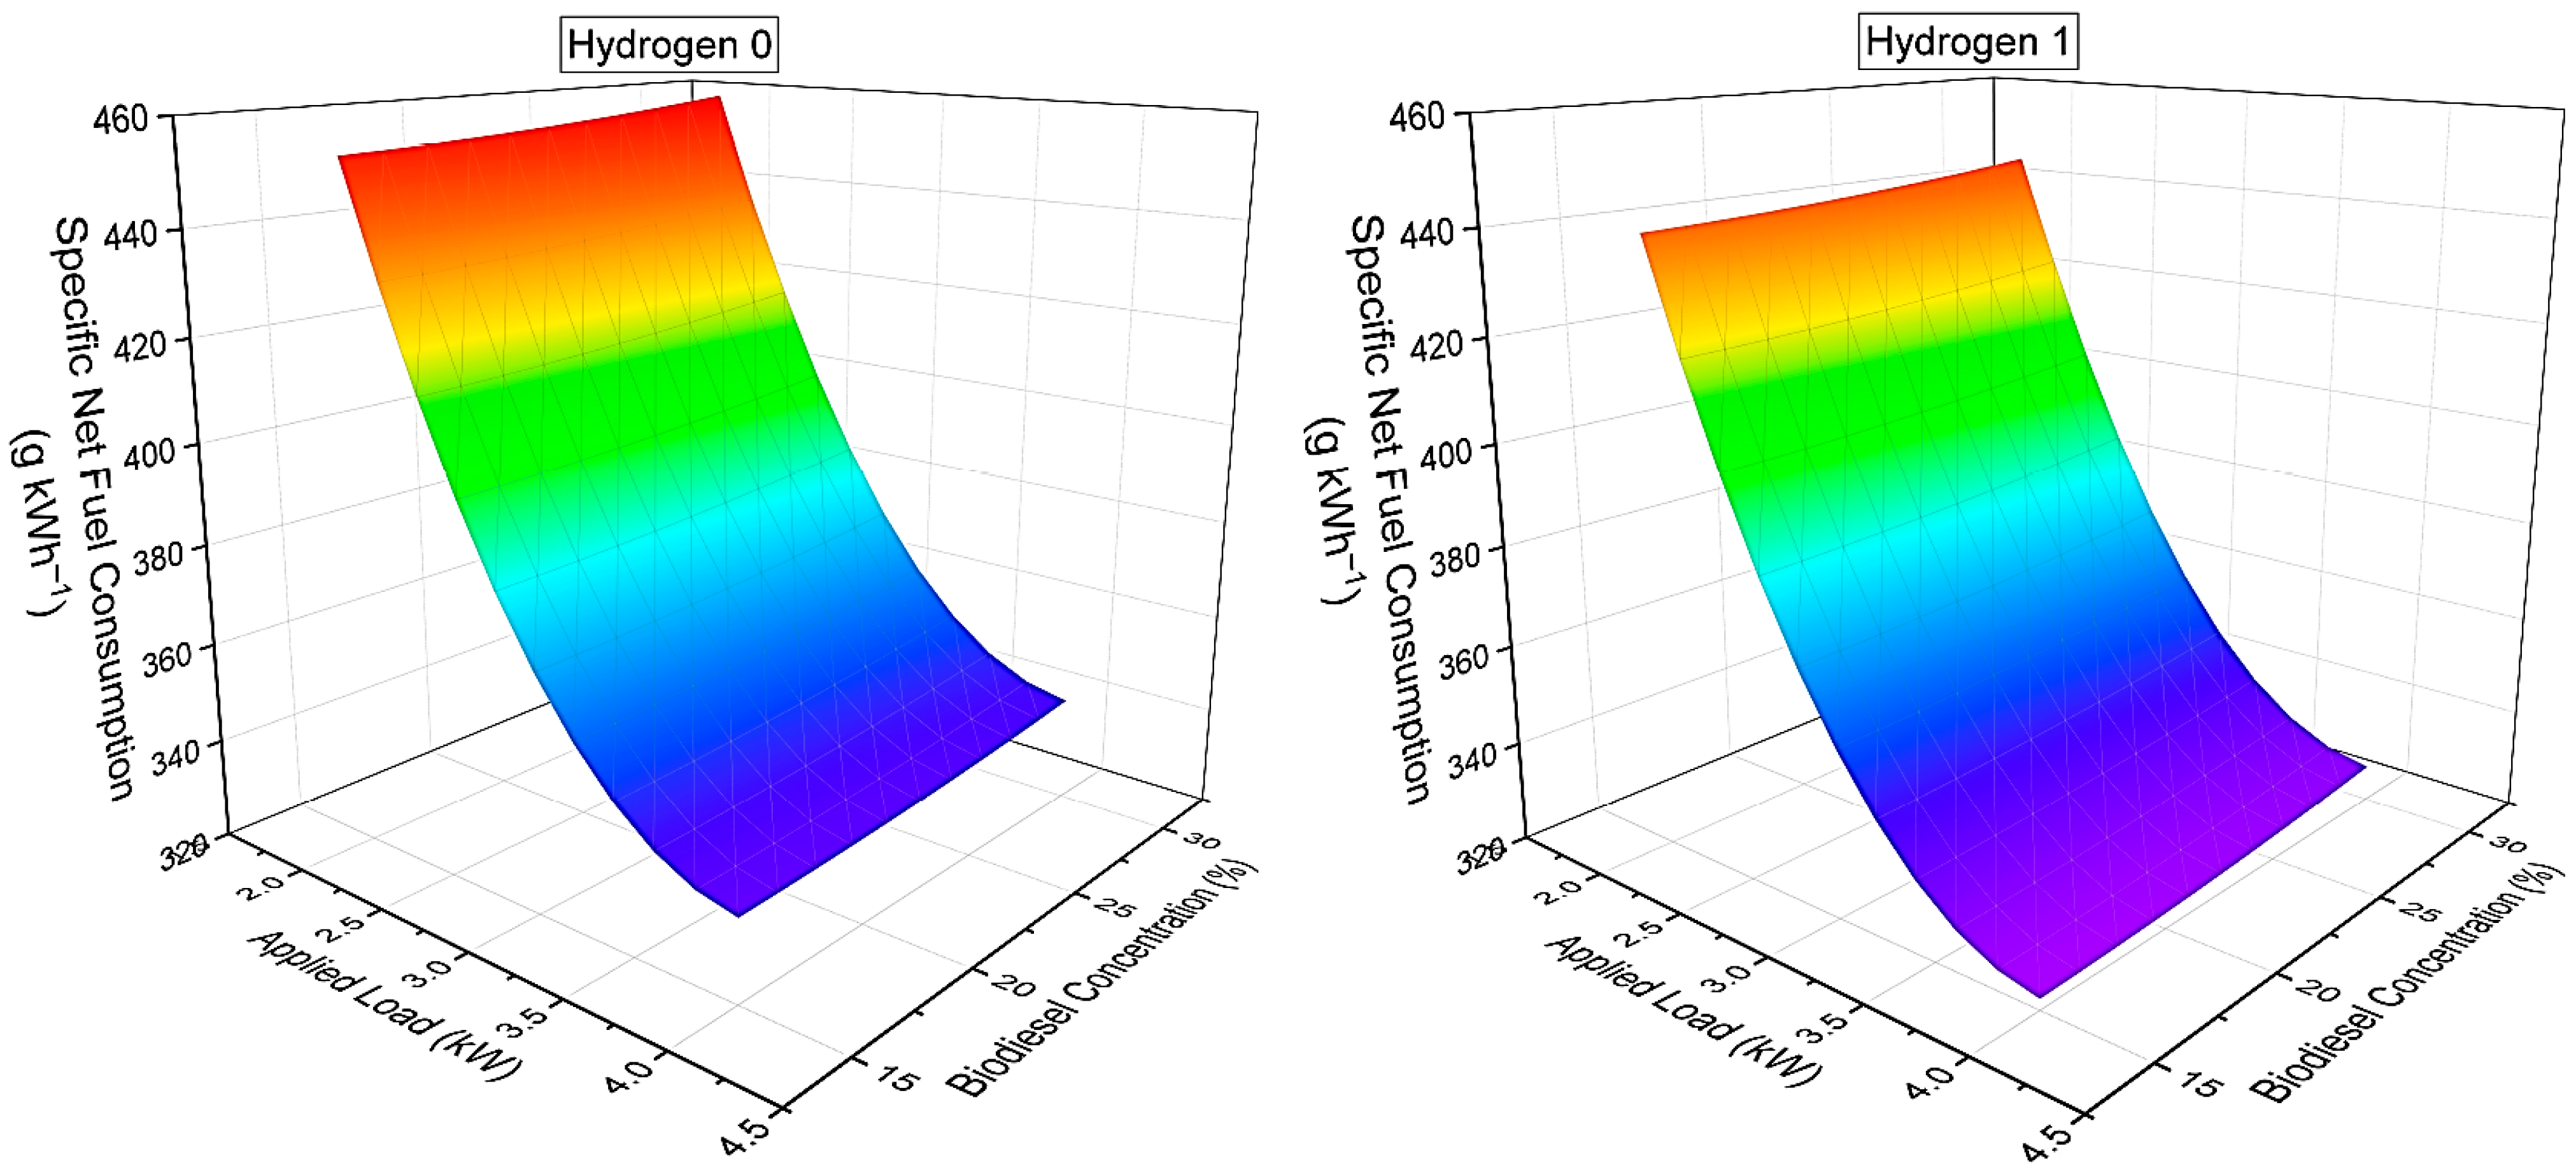
The response surfaces for the specific consumption of liquid fuel (Figure 10) indicate significant variations as a function of load, which is in agreement with the analysis of the effects. Under low-load conditions, high specific consumption values were observed, with progressive reductions as the load increased, which was attributed to the better energy use of the fuel at higher load regimes, consistent with Ahmad, Yadav, and Singh [29].
A comparison between the surfaces with and without hydrogen enrichment (Figure 10) shows the influence of hydrogen on reducing the specific consumption, with an average decrease of 4.2%, in line with the results of Bouguessa [18]. This reduction is attributed to the improved combustion promoted by hydrogen, which increases the rate of energy release, favors thermal efficiency, and reduces losses associated with incomplete combustion, as reported by Ahmad, Yadav, and Singh [29].
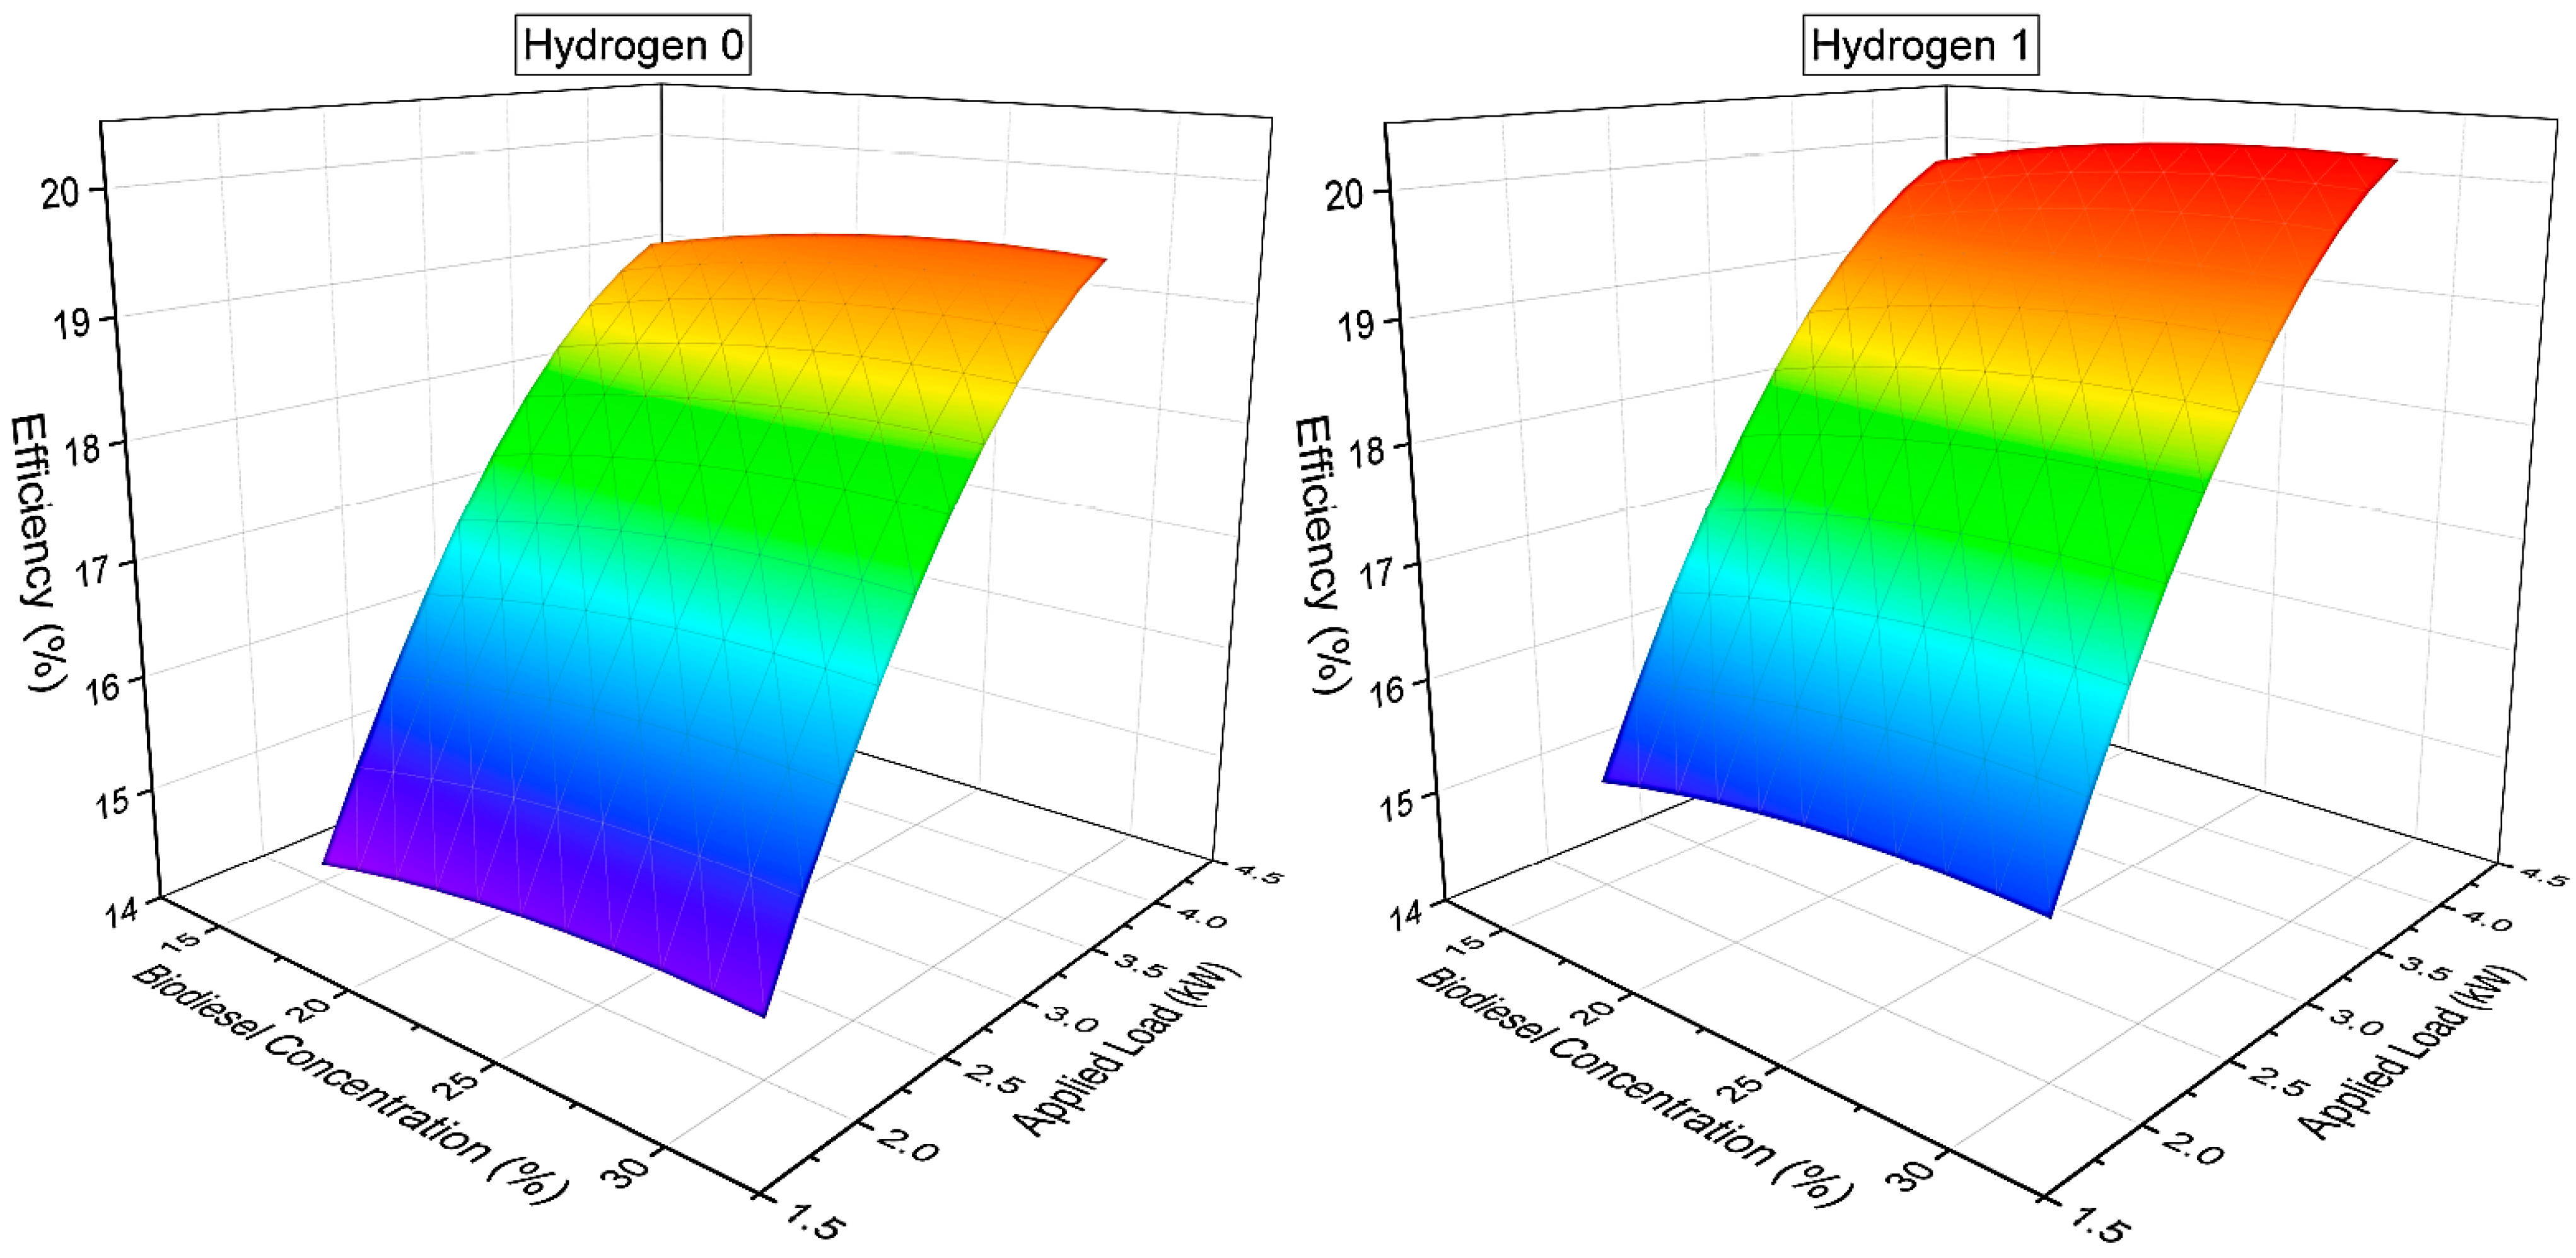
The response surface for the thermal efficiency (Figure 11) confirms the strong influence of the load, with a significant increase in efficiency under higher load conditions. This behavior is in line with the trend observed in the consumption and power models, attributed to the higher operating temperature which promotes more complete combustion [29].
Regarding the biodiesel concentration in the liquid fuel, a slight increase in efficiency was observed as the proportion of biodiesel increased. This nonlinear behavior was evidenced by the significance of the quadratic term of the biodiesel concentration in the ANOVA test. The average increase of 0.4% in efficiency is in line with the findings of Oni [48], who attributed the effect to the higher cetane index and the presence of oxygen in the molecular structure of biodiesel, favoring more efficient ignition and complete combustion.
Enriching biogas with hydrogen also resulted in improved efficiency, although to a lesser extent, because of the reduced concentrations used in this study (13.3% hydrogen and 10 LPM flow). The average variation observed was 0.76%, which was consistent with, although lower than, the increase reported by Oni [48], with a 7.5% increase in efficiency and 60% hydrogen enrichment at a flow rate of 23.4 LPM.
The improvement in efficiency promoted by hydrogen is attributed to the better quality of the air–fuel mixture and improved ignition, favoring more homogeneous and stable combustion. This trend is consistent with the observations of Bouguessa [18], who highlighted the high reactivity and high flame propagation speed provided by hydrogen as the determining factors for efficiency gains.

3.4. Analysis of Emissions Response Surfaces

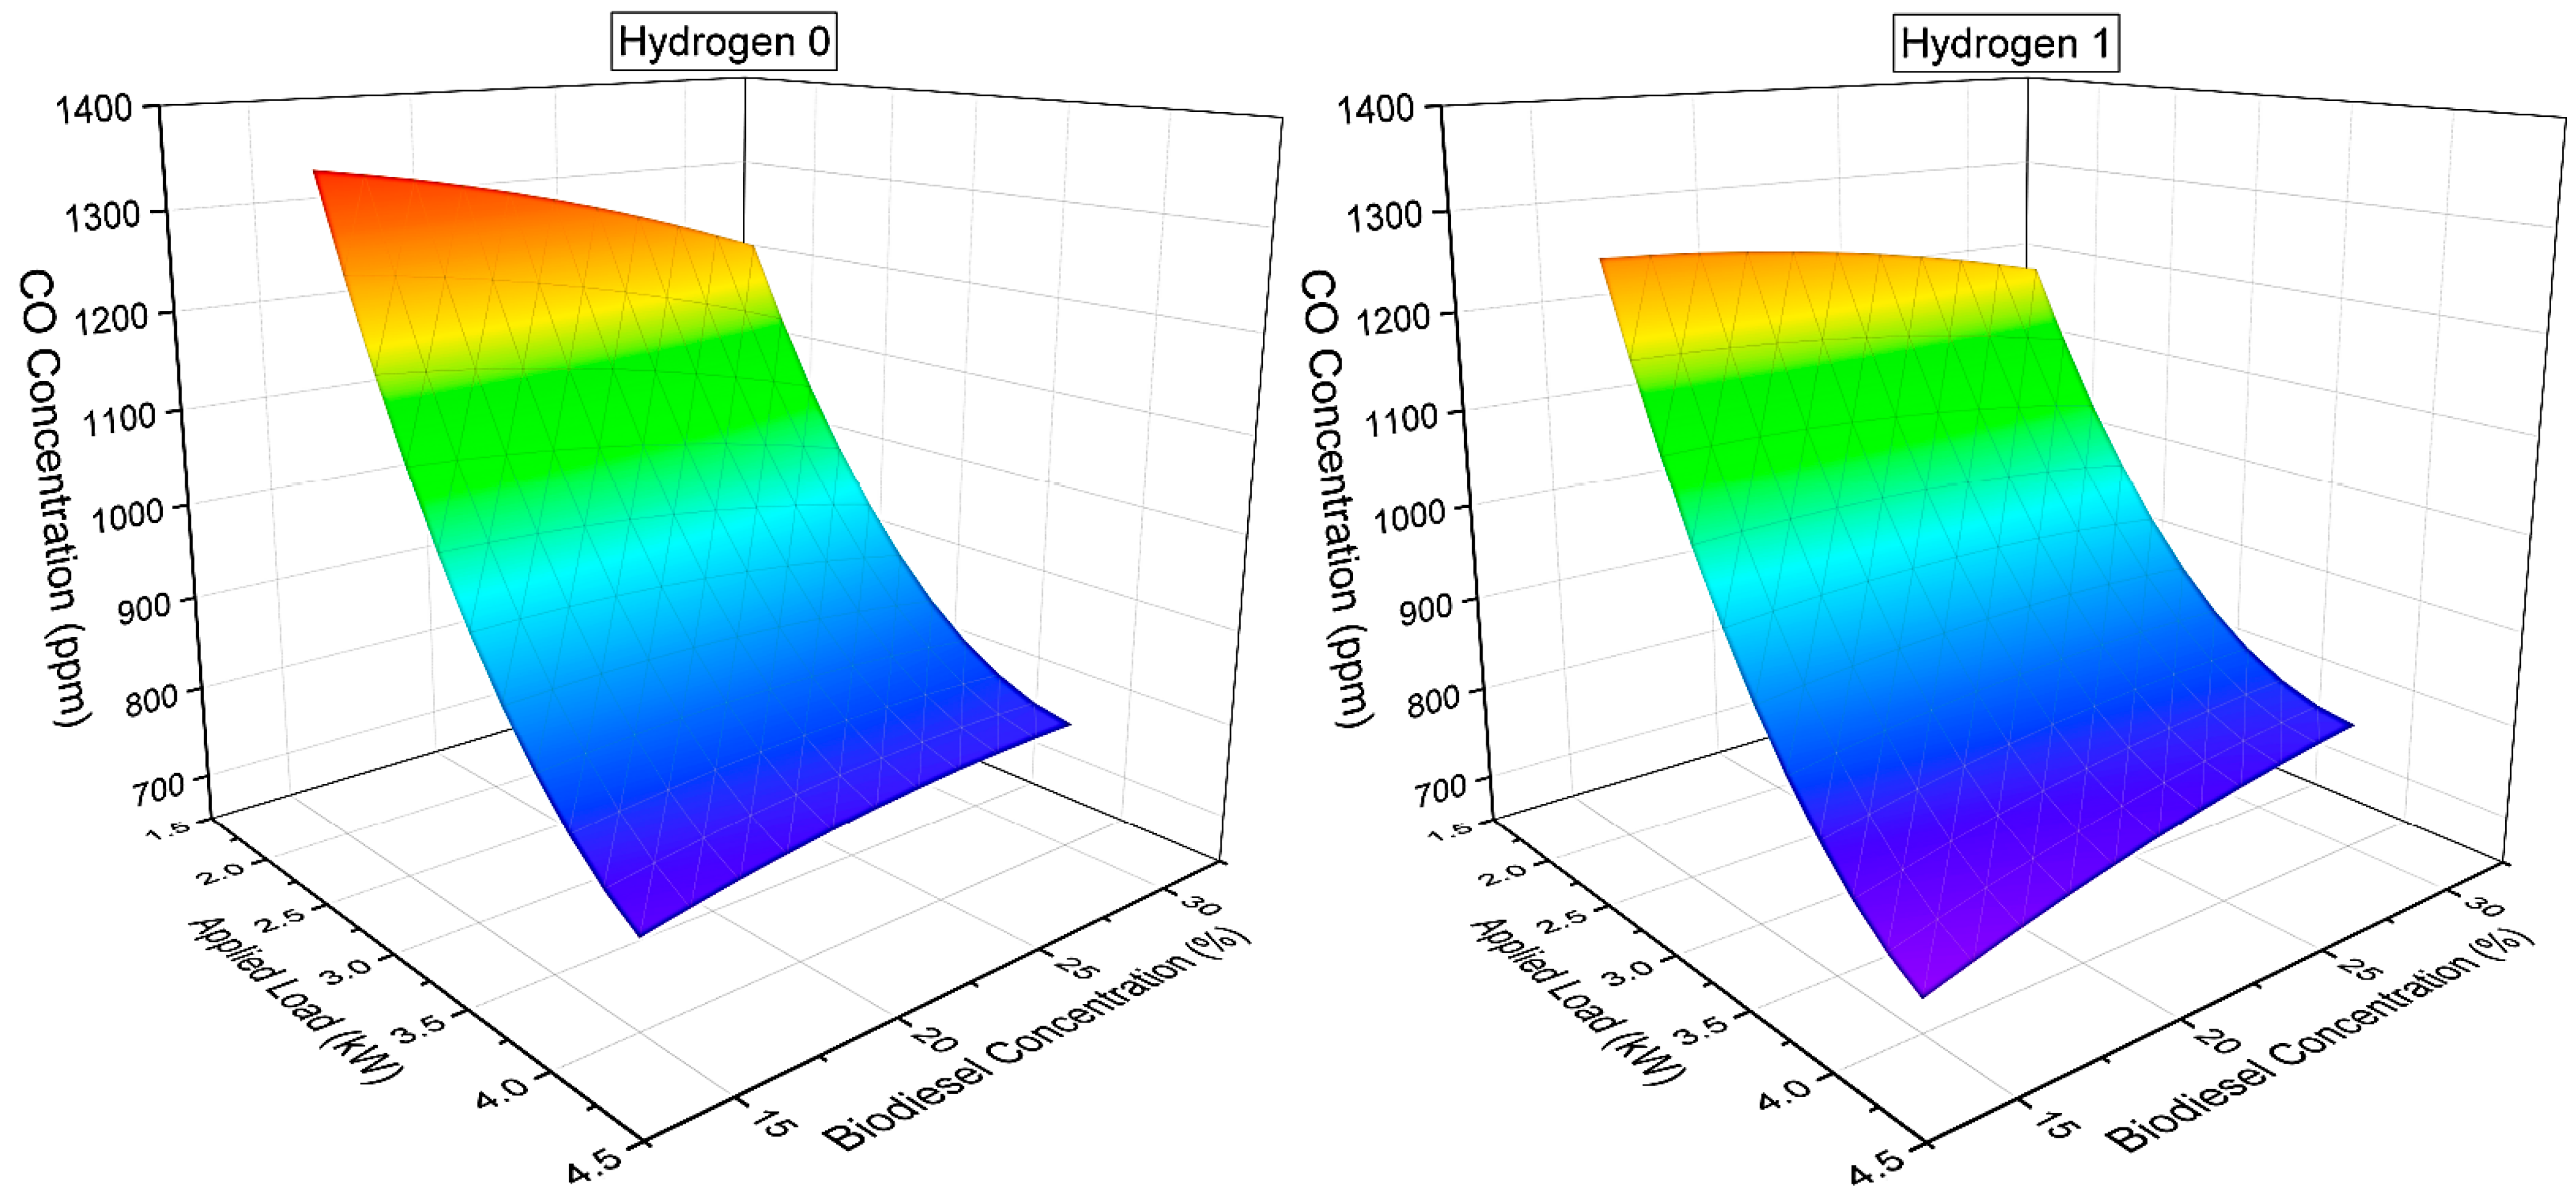
The response surfaces for the CO concentration (Figure 12) show a significant reduction as the applied load increases, with an average variation of 66.4% between 2 and 4 kW. This behavior reflects a greater combustion efficiency at high loads, particularly under poor mixture conditions, in agreement with the results of Bouguessa [18] and Muhssen, Zöldy and Bereczky [35], who attributed this tendency to incomplete burning and low combustion temperatures at low loads.
Increasing the biodiesel concentration in the liquid fuel resulted in an additional average reduction of 1.1% in the CO levels, an effect associated with the higher oxygen content of biodiesel that favors combustion, as observed by Goga [14].
In addition, the model showed an interaction effect between the load and biodiesel concentration, indicating that the impact of biodiesel is more relevant at low loads, whereas at high loads, the difference becomes statistically irrelevant.
The addition of hydrogen to the gaseous fuel (13.3% H2) produced an average additional 5% reduction in CO concentrations, particularly at low loads (Figure 12). This effect is consistent with the conclusions of Muhssen, Zöldy, and Bereczky [52], who attributed the improvement in combustion to the increase in the temperature and flame speed provided by hydrogen.
More significant reductions (25–30%) were reported by Oni [48], Oni [16], and Bouguessa [18], although under higher hydrogen concentrations and flow rates than those used in this study.
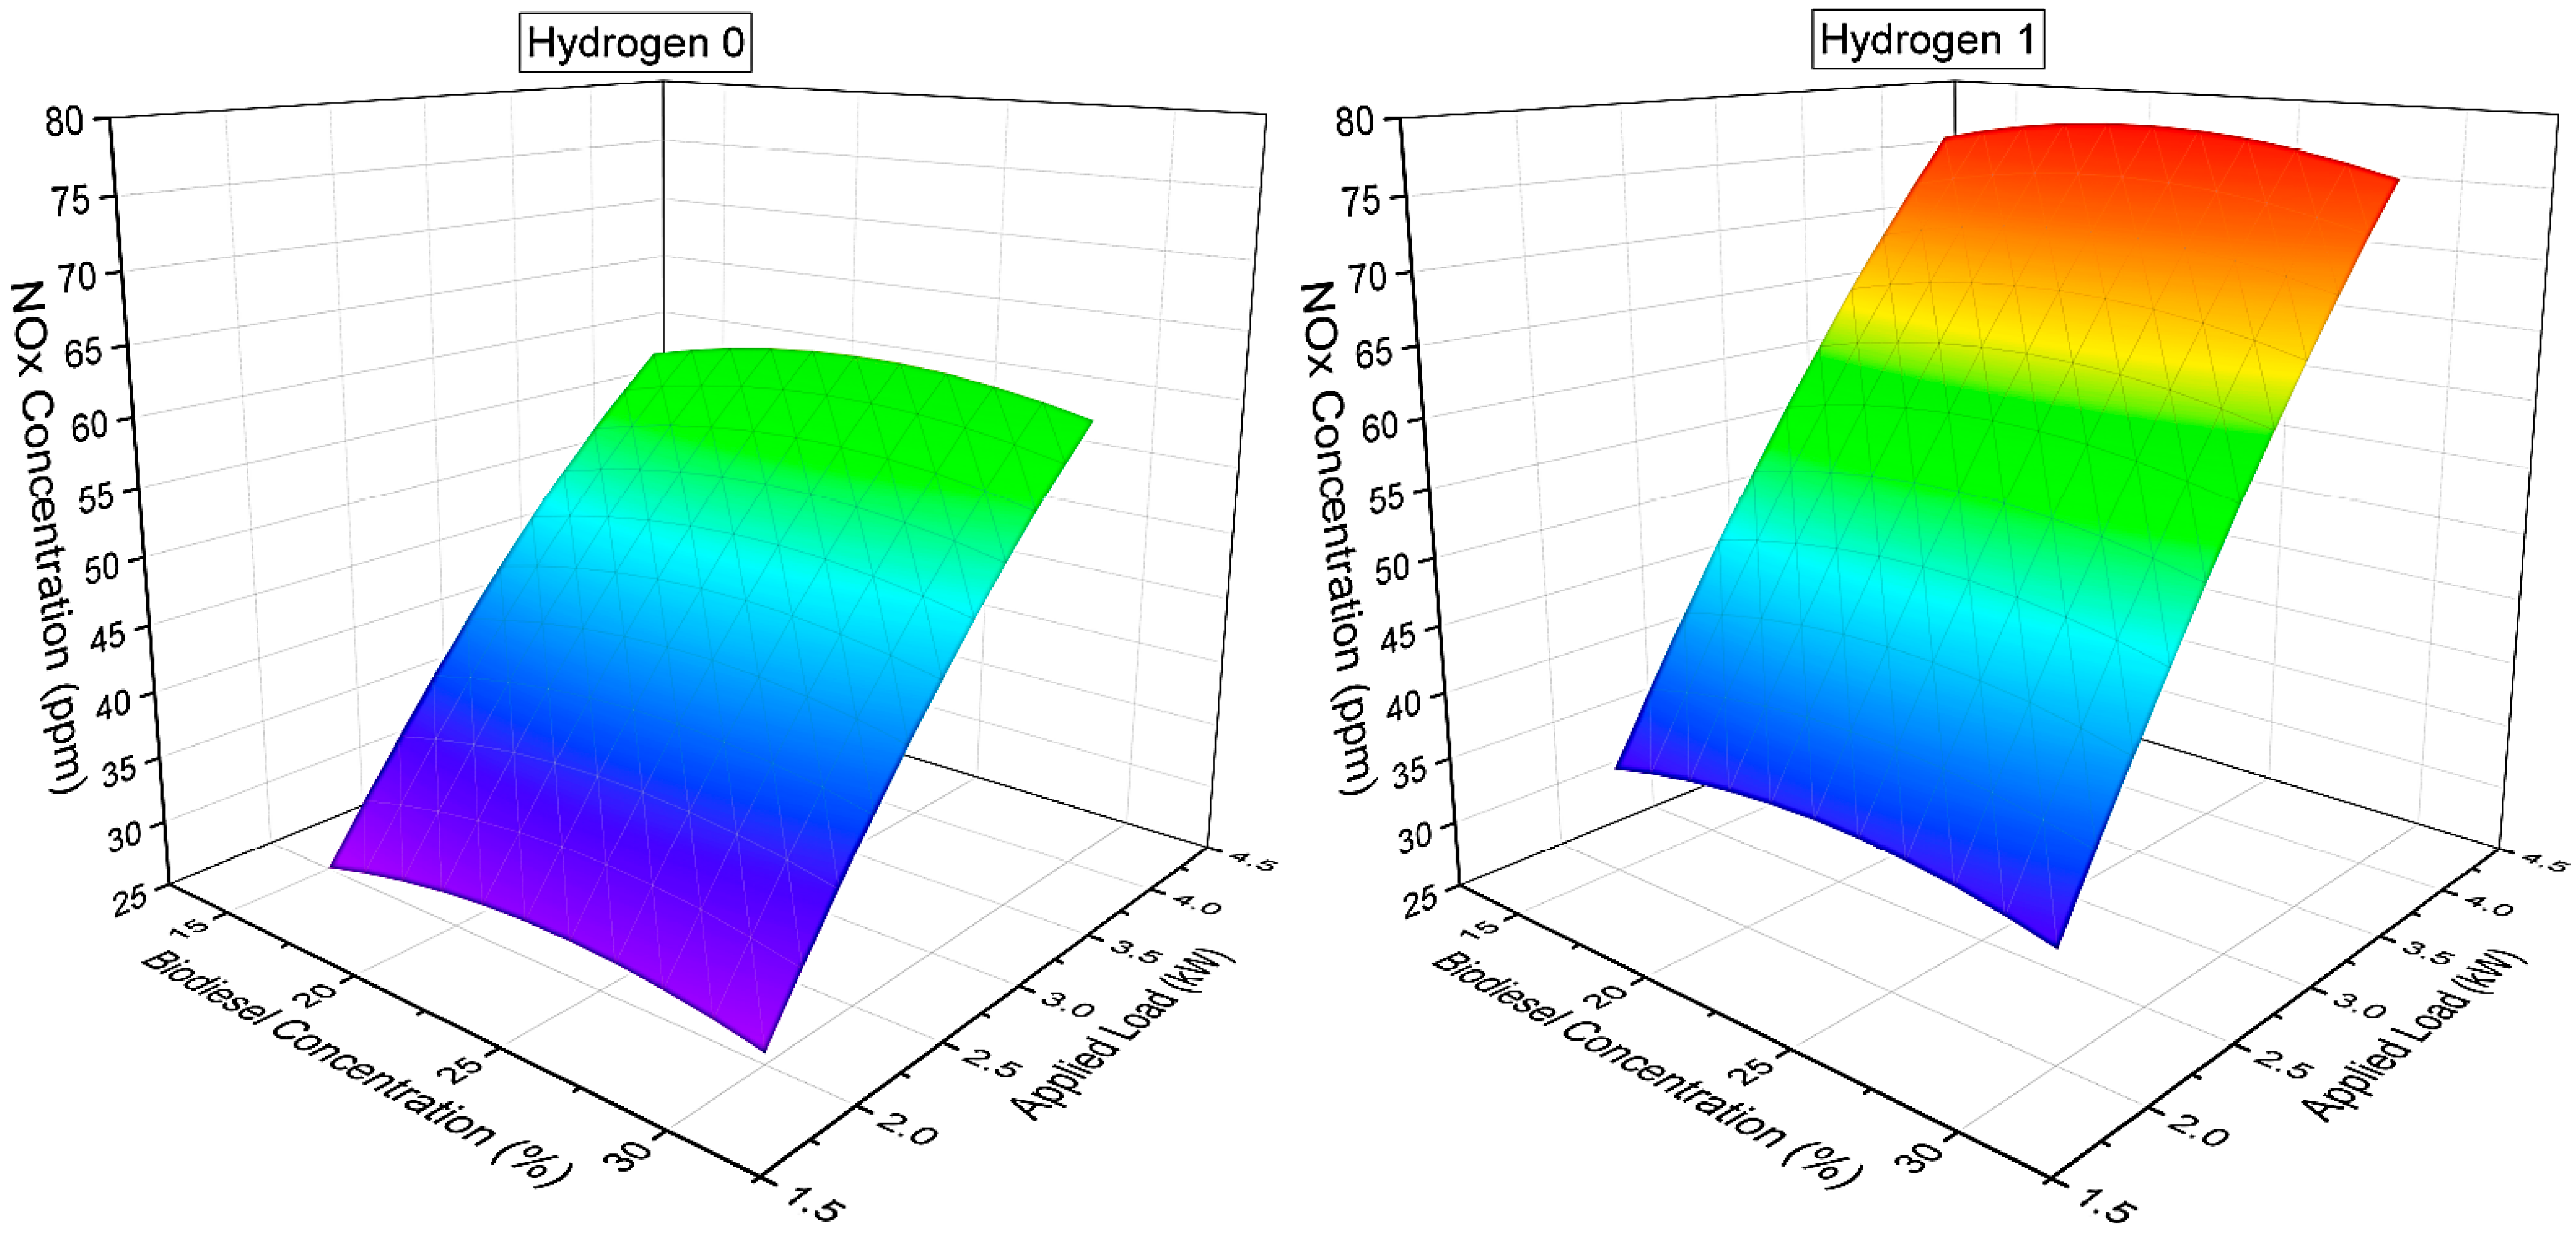
For NOx emissions (Figure 13), a consistent increase was observed with increasing load in operations with pure biogas and hydrogen-enriched biogas. This increase is characteristic of internal combustion engines and is directly related to the peak temperature rise in the combustion chamber, which favors the thermal NOx formation mechanisms of Muhssen, Zöldy, and Bereczky [52].
The presence of hydrogen increased the NOx levels at all loads analyzed, with an average increase in NOx levels of 26.6% (Figure 13). This result is consistent with the literature [16,48], which shows that although hydrogen improves efficiency and reduces CO and HC emissions, it also increases the maximum combustion temperature, promoting the formation of NOx. The higher flame speed and faster ignition associated with hydrogen contributed to the pressure and temperature peaks, which intensified the oxidation of the molecular nitrogen present in the intake air.
However, the magnitude of the NOx increase observed in this study was moderate compared to that in other studies that used higher hydrogen concentrations (>20%), which suggests that the strategy of limiting the hydrogen content (here, to 13.3%) can balance efficiency gains and CO and HC reductions without excessively penalizing NOx emissions.
This behavior highlights the need for a careful balance between the beneficial and adverse effects of hydrogen enrichment in dual-fuel engines, particularly in applications seeking efficiency gains and emission control.
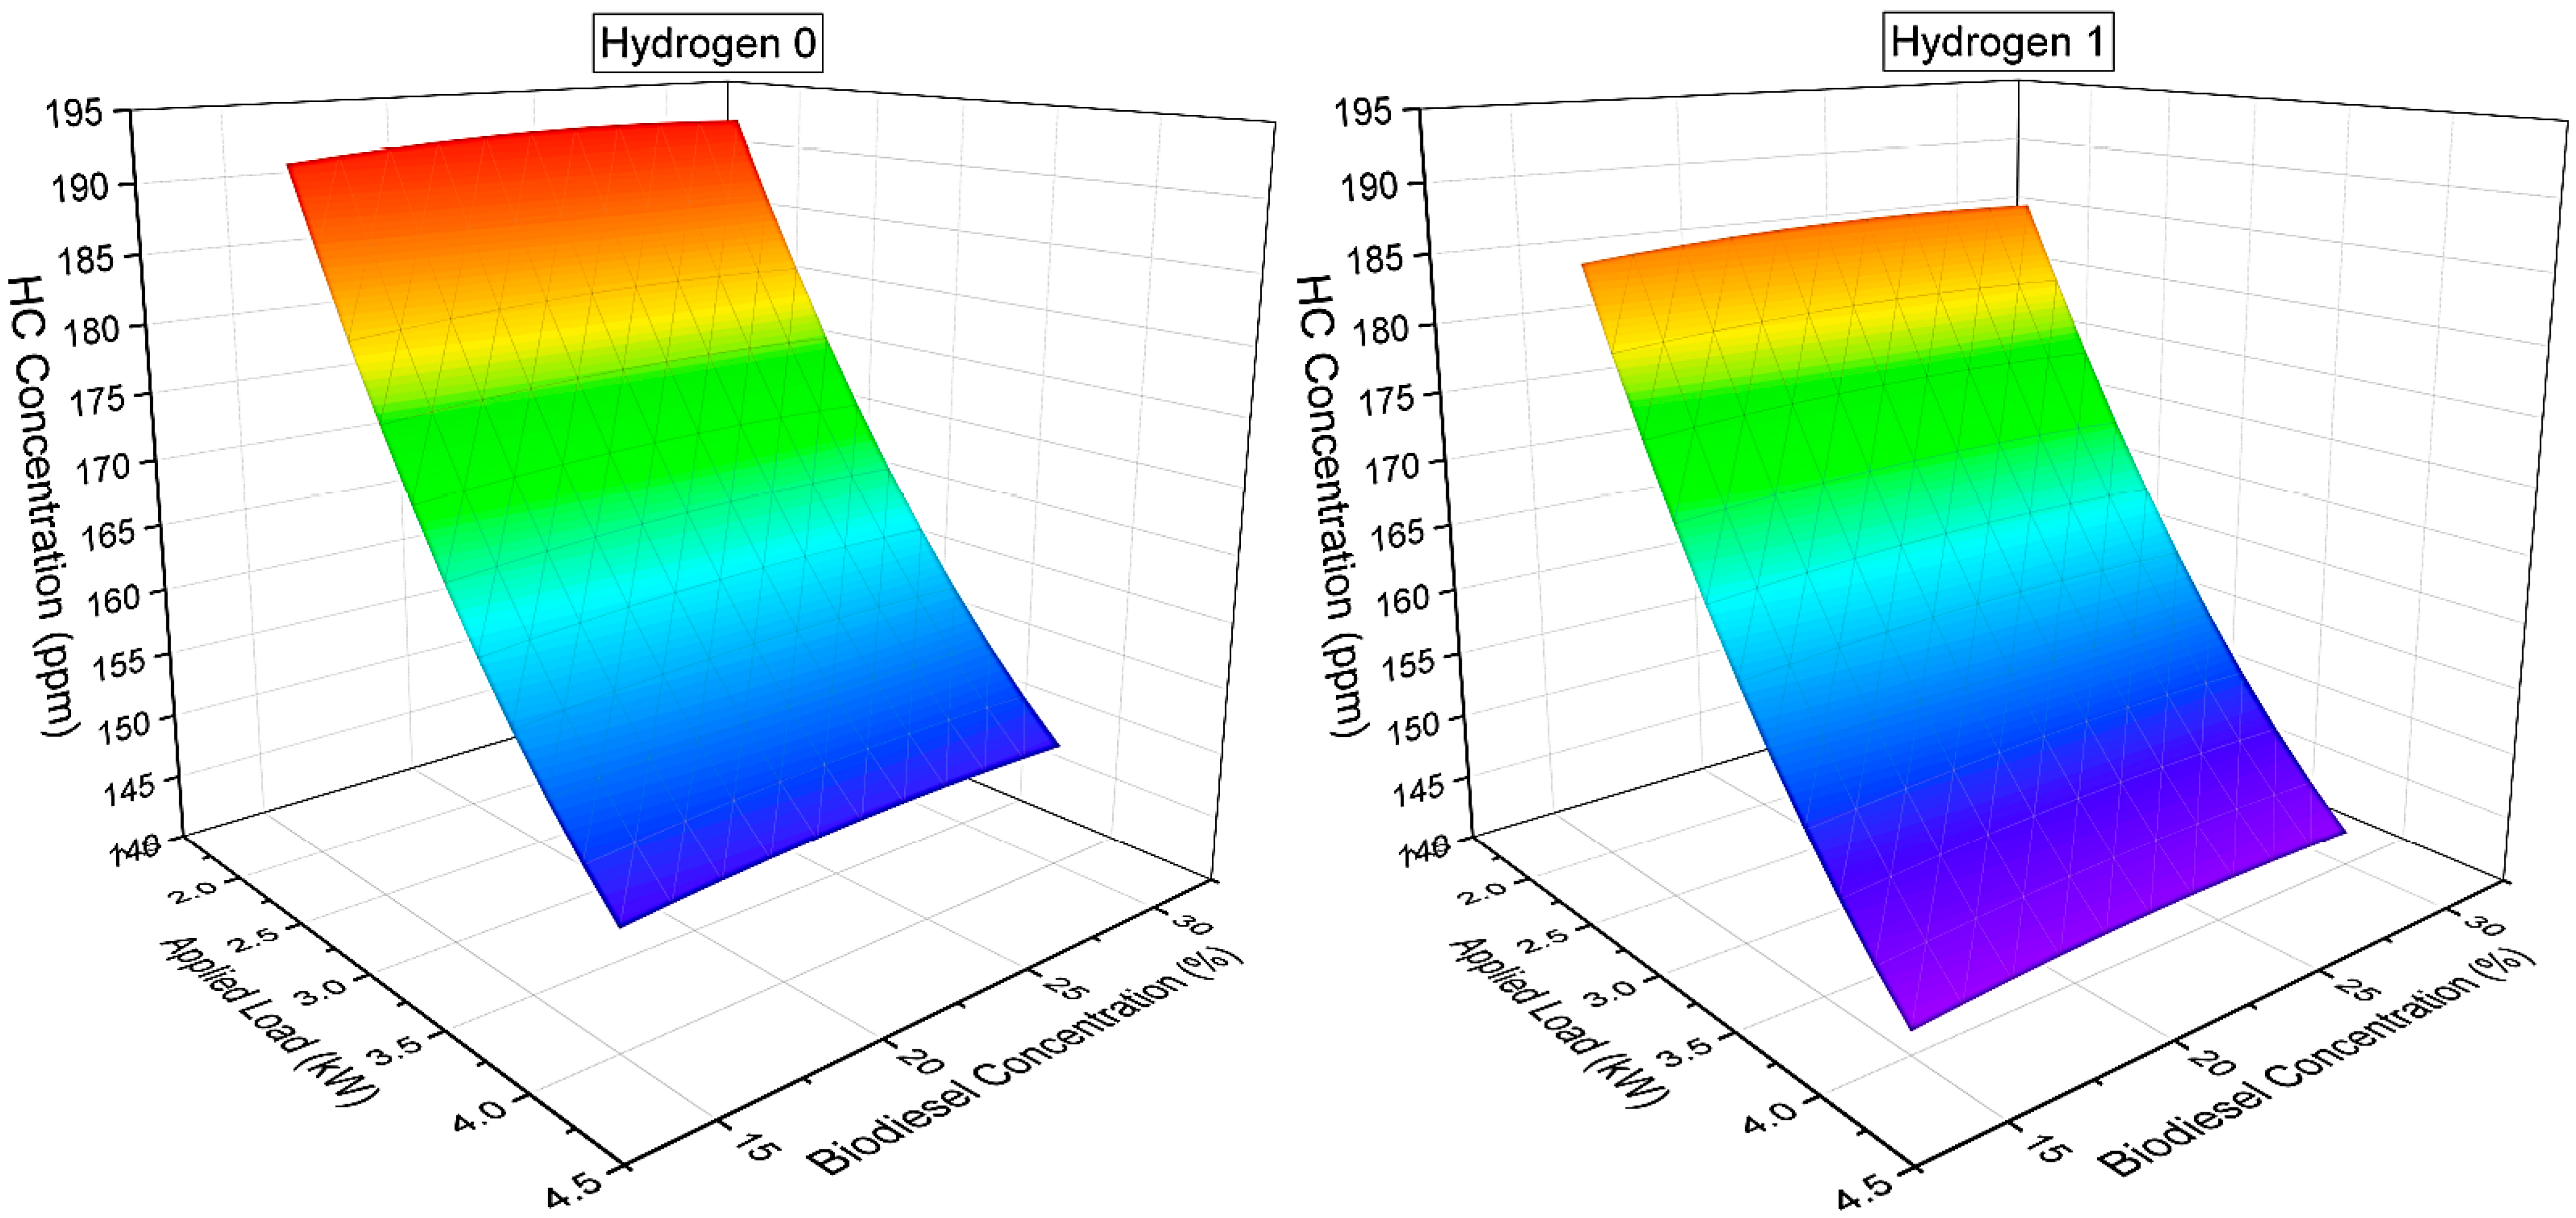
The response surfaces for HCs (Figure 14) revealed a consistent downward trend with increasing load, which was attributed to the higher combustion efficiency and combustion chamber temperature, as described by Muhssen, Zöldy and Bereczky [52]. The biodiesel concentration had no significant effect on the HC levels.
Enriching biogas with hydrogen led to an average reduction of 4.1% in the HC levels across the entire operating range, which was consistent with the effects described by Bouguessa [18] and Oni [48]. This decrease is attributed to the improvement in ignition and flame propagation associated with the high reactivity of hydrogen, optimization of burning, and reduction in the formation of unburned HCs.

3.5. Validation and Optimization

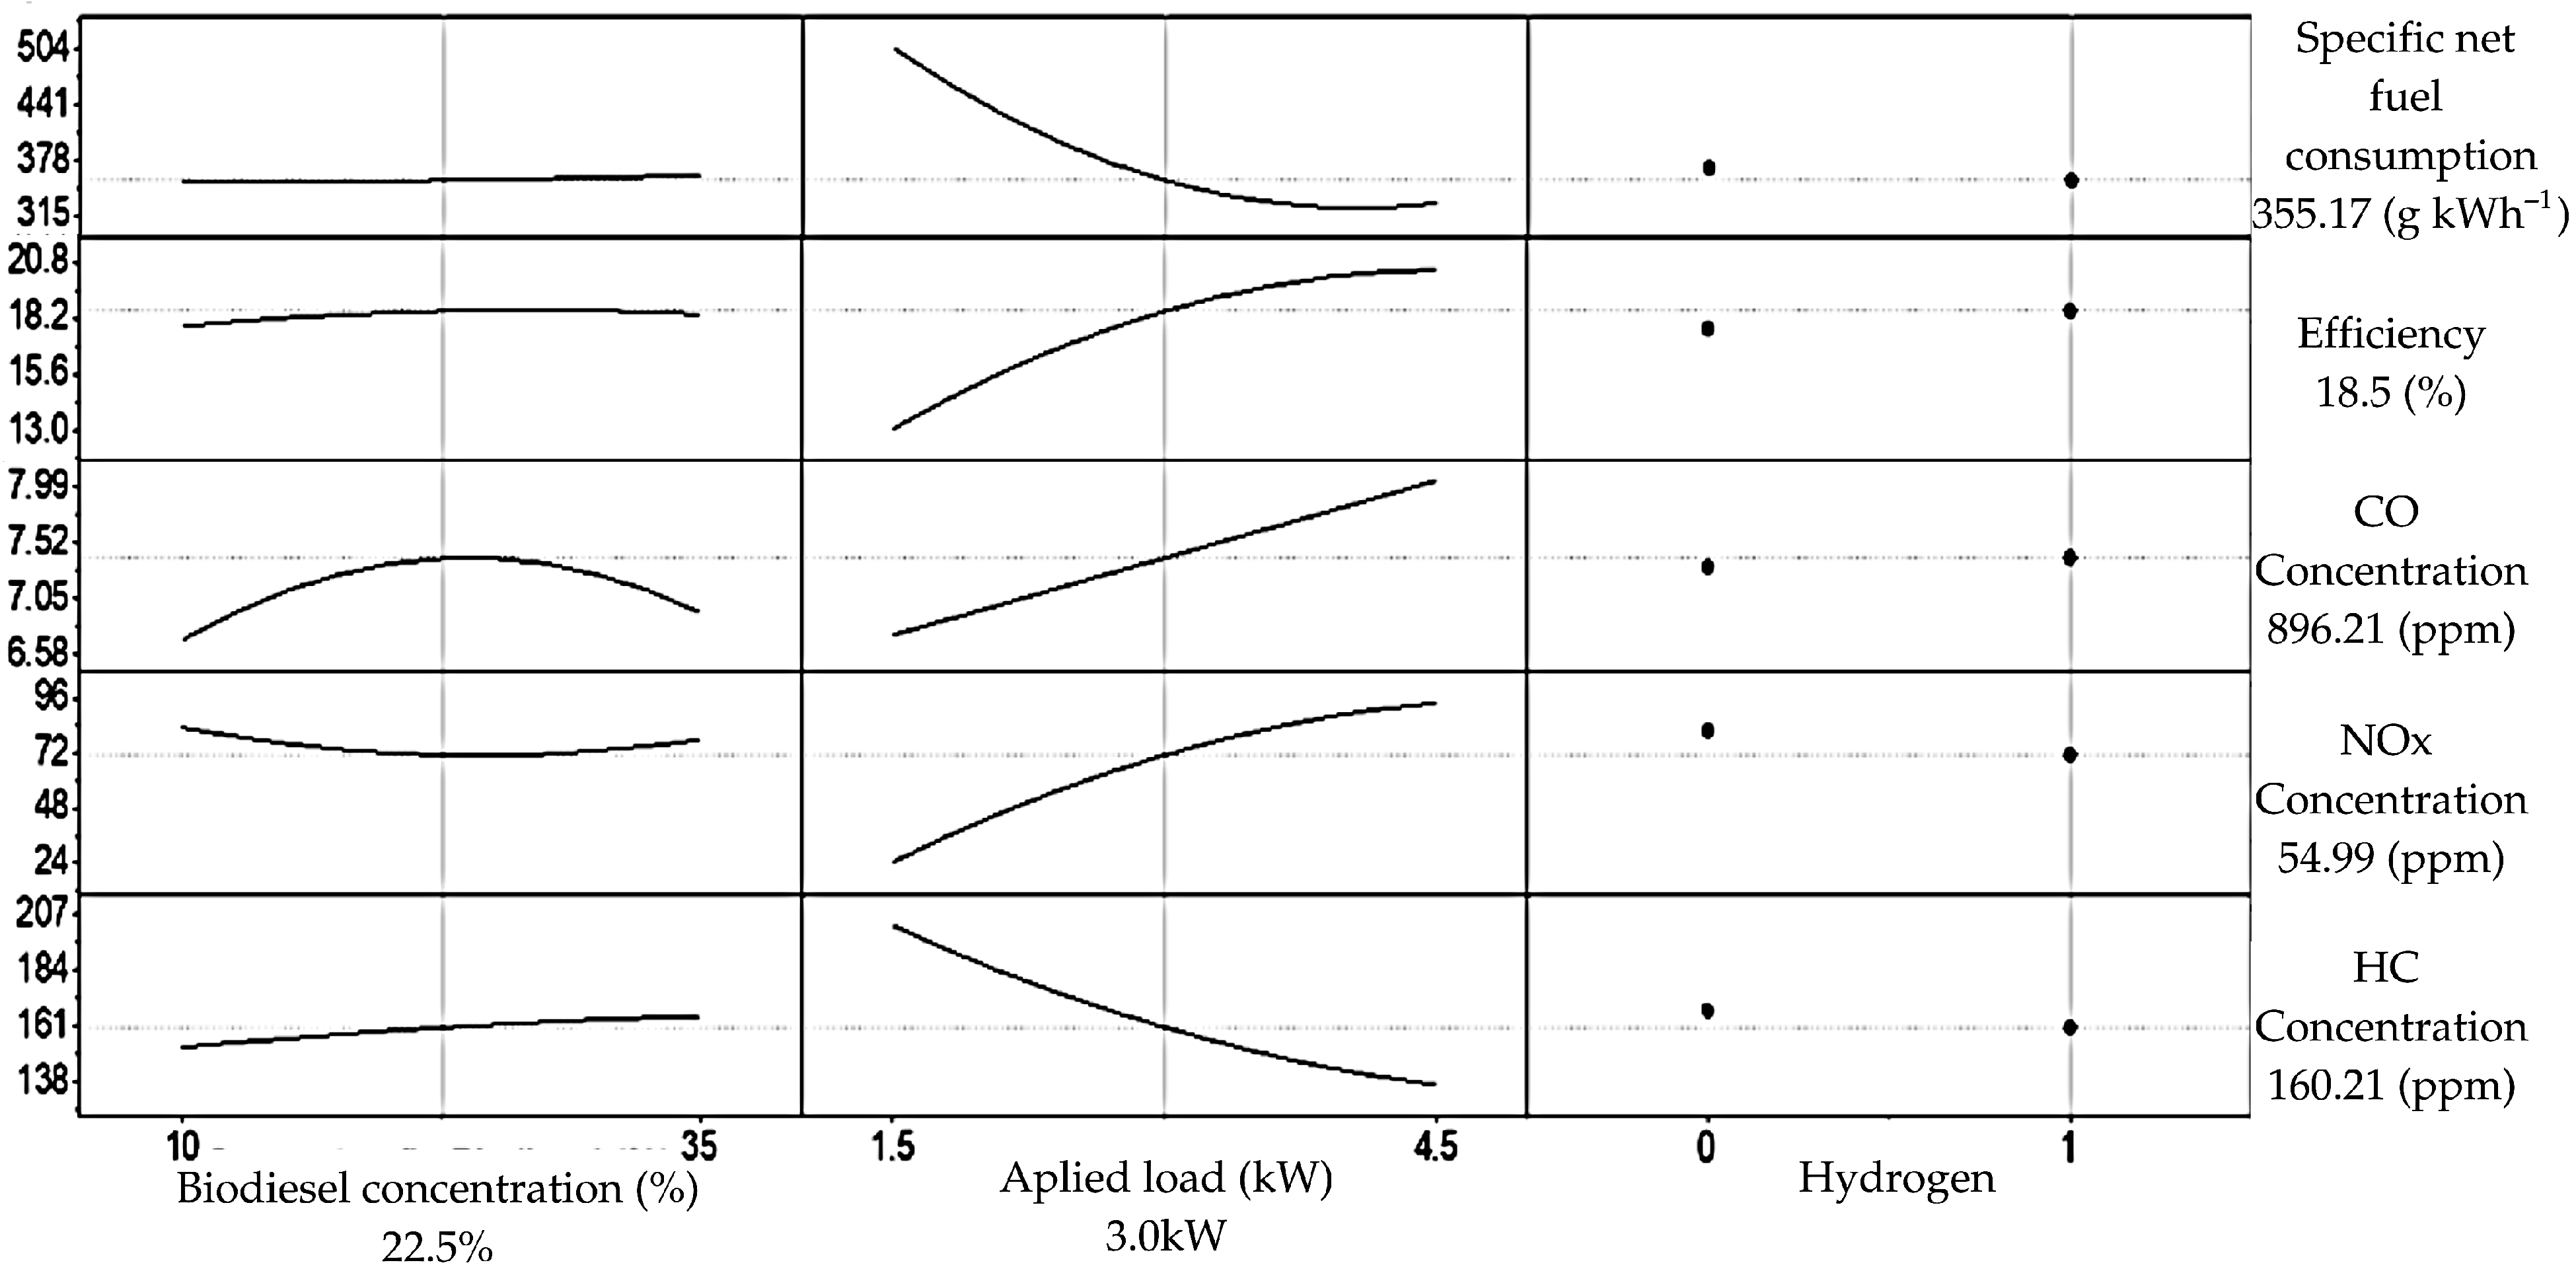
The motor-generator parameters were optimized to maximize the efficiency while minimizing the specific liquid fuel consumption and CO, HC, and NOx emissions. Figure 15 shows the optimized configuration, corresponding to a blend with 22.5% biodiesel, an applied load of 3.0 kW, and the enrichment of gaseous fuel with 13.3% hydrogen.
The optimized parameters obtained were consistent with the trends reported by Ahmad, Yadav, and Singh [29], who observed an optimized performance for blends containing 20% biodiesel and biogas enriched with 20% hydrogen, although operating under different load and gas flow conditions.
In this study, the optimized configuration resulted in an efficiency of 18.5%, specific consumption of 355.17 g kWh−1, and a significant reduction in CO and HC emissions. However, there was an increase in the NOx levels associated with the addition of hydrogen because of the increase in the peak combustion temperature and flame propagation speed, as described by Nguyen [16] and Oni [48]. This behavior underscores the need for further research on NOx mitigation strategies for hydrogen-enriched engines.
The models were validated by comparing the predicted and experimental values at the optimized points (Table 11). The relative errors ranged from 0.55% to 8.66%. For the specific consumption, power, efficiency, CO2, CO, and HC variables, the errors remained below 3.15%, indicating the high accuracy of the models. This is in line with the values presented by Sharma [51] and Singh [28], which ranged from 2.4% to 6.7% and 2.67% to 4.65%, respectively.
Although the error associated with the NOx concentration (8.66%) was higher than that of the others, it remained within the acceptable limits reported in the literature for experimental validations of internal combustion engines, as indicated by Veza [50], Sharma [51], and Singh [28], whose values vary between 1.58% and 16.24%. These results reinforce the robustness of the developed response surface models and the reliability of the obtained experimental data.

3.6. Comparison of Operating Modes

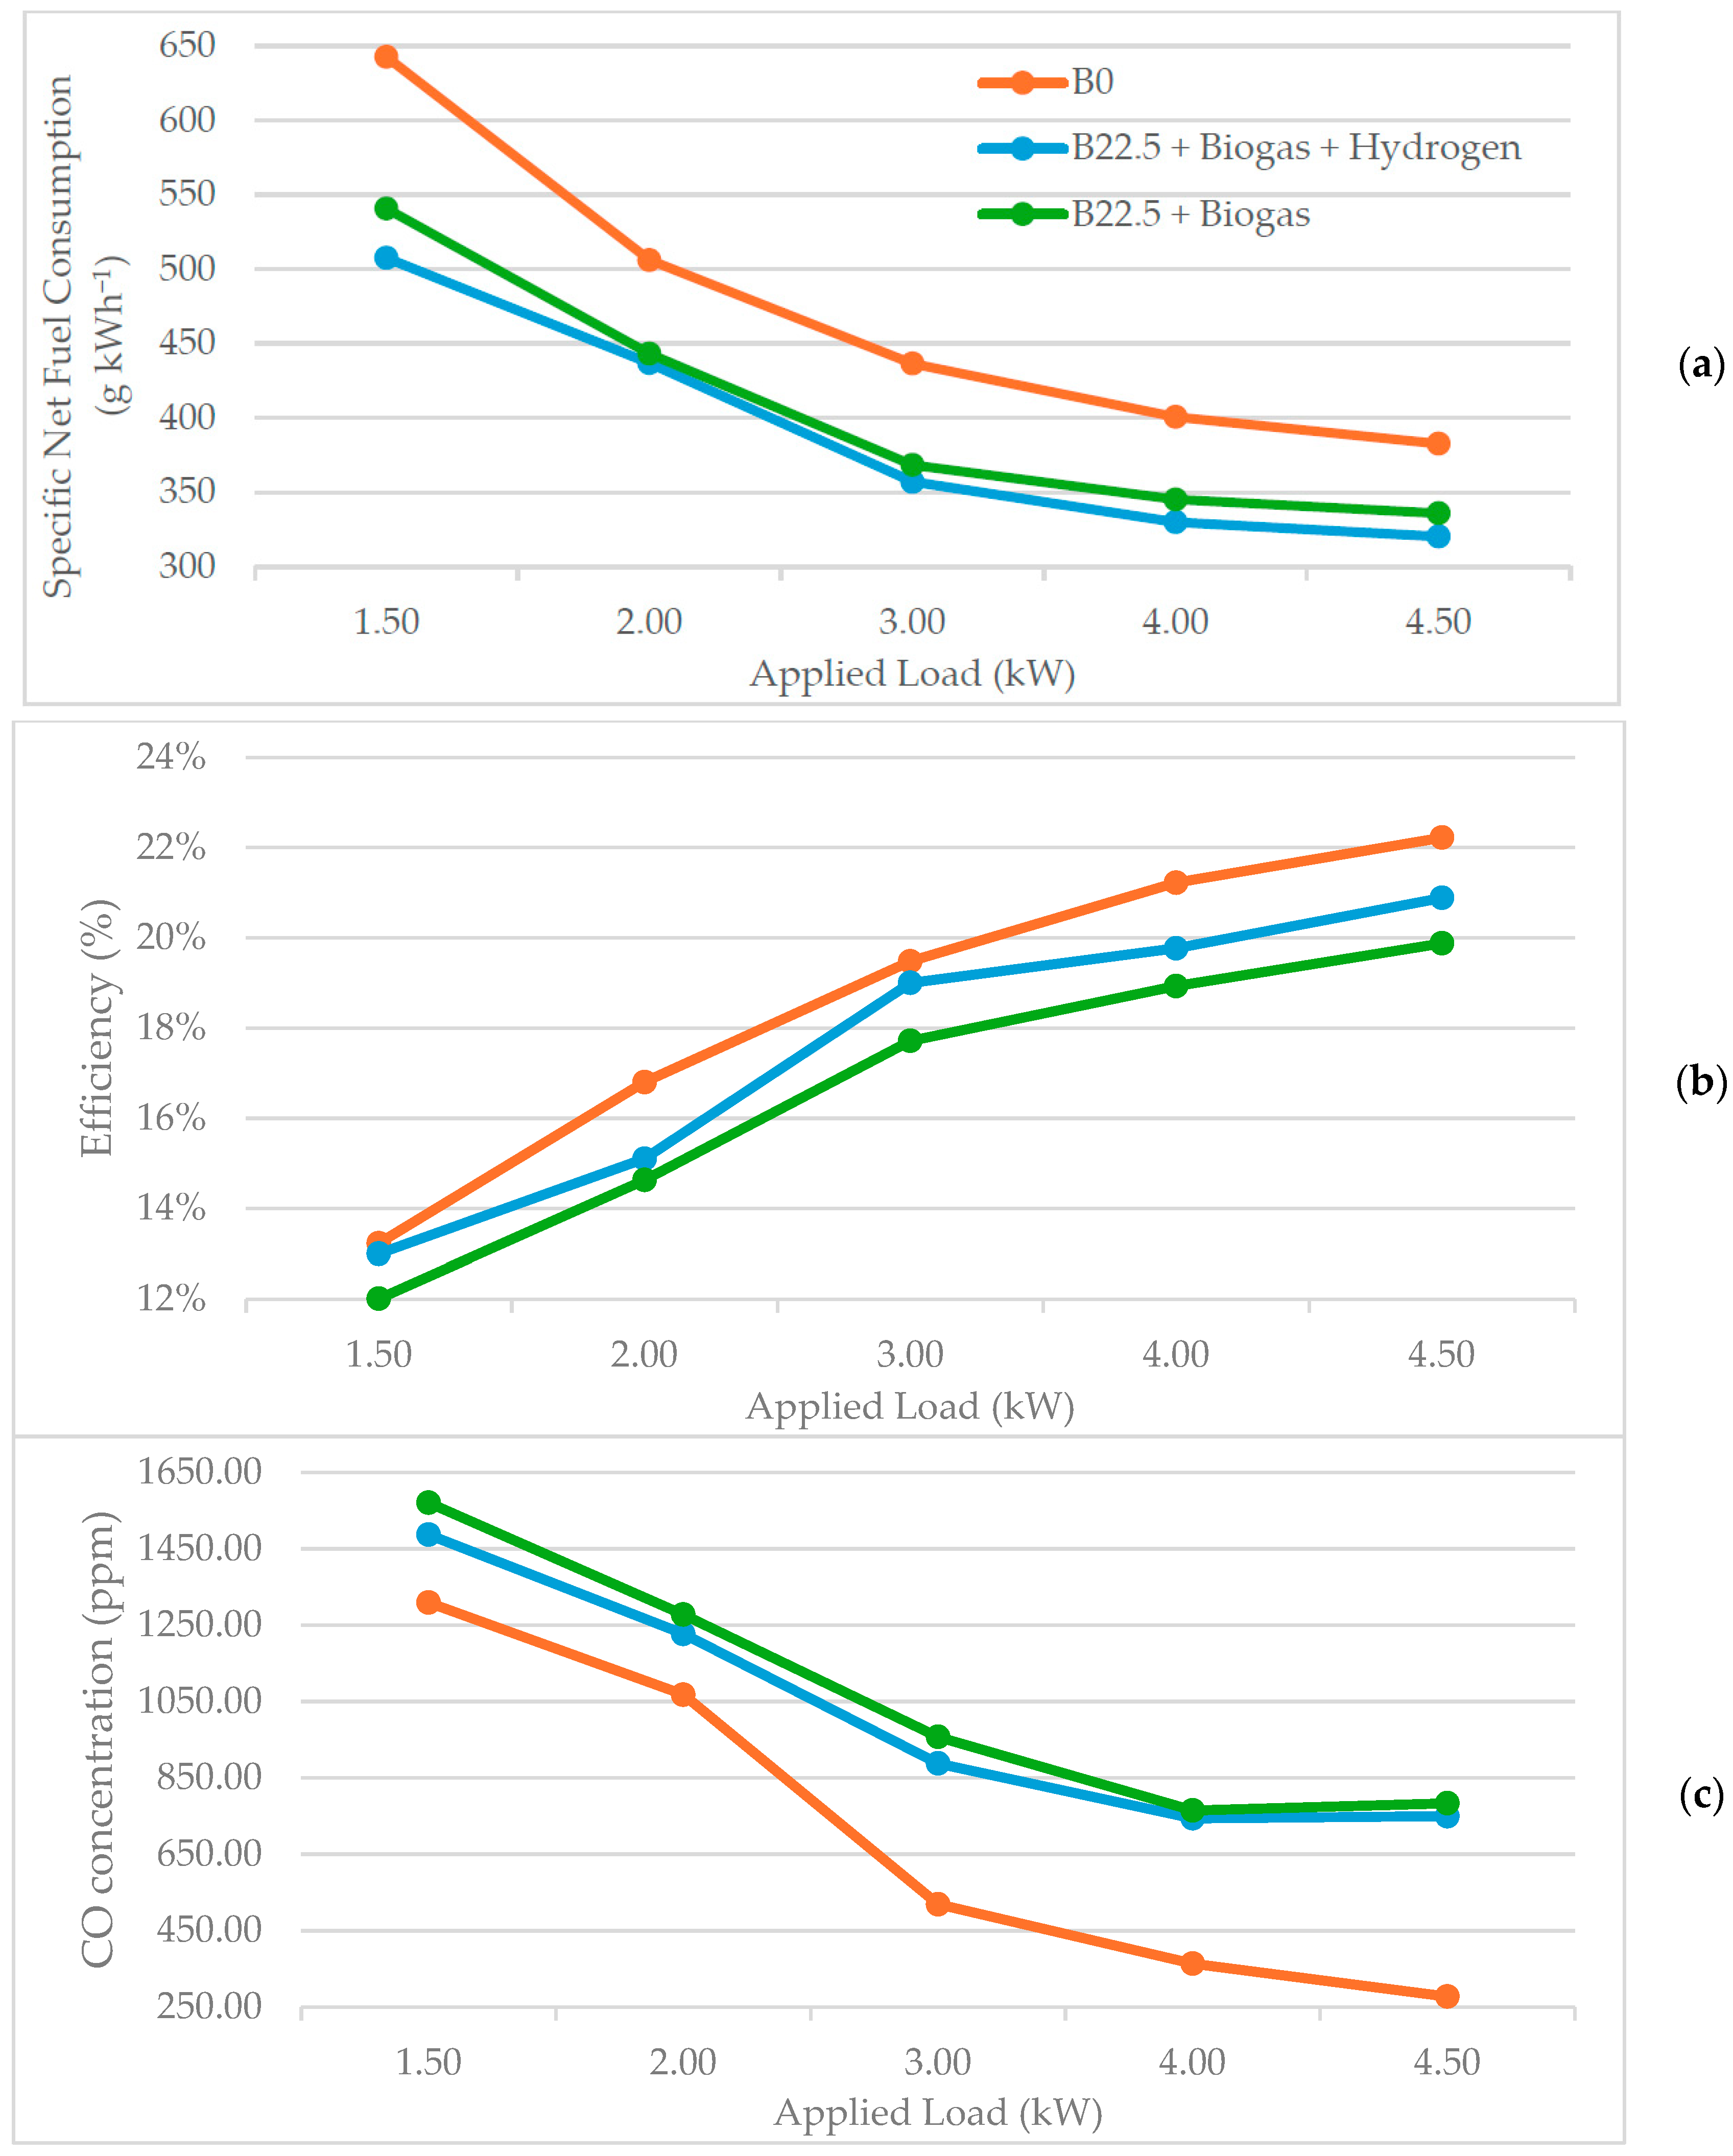
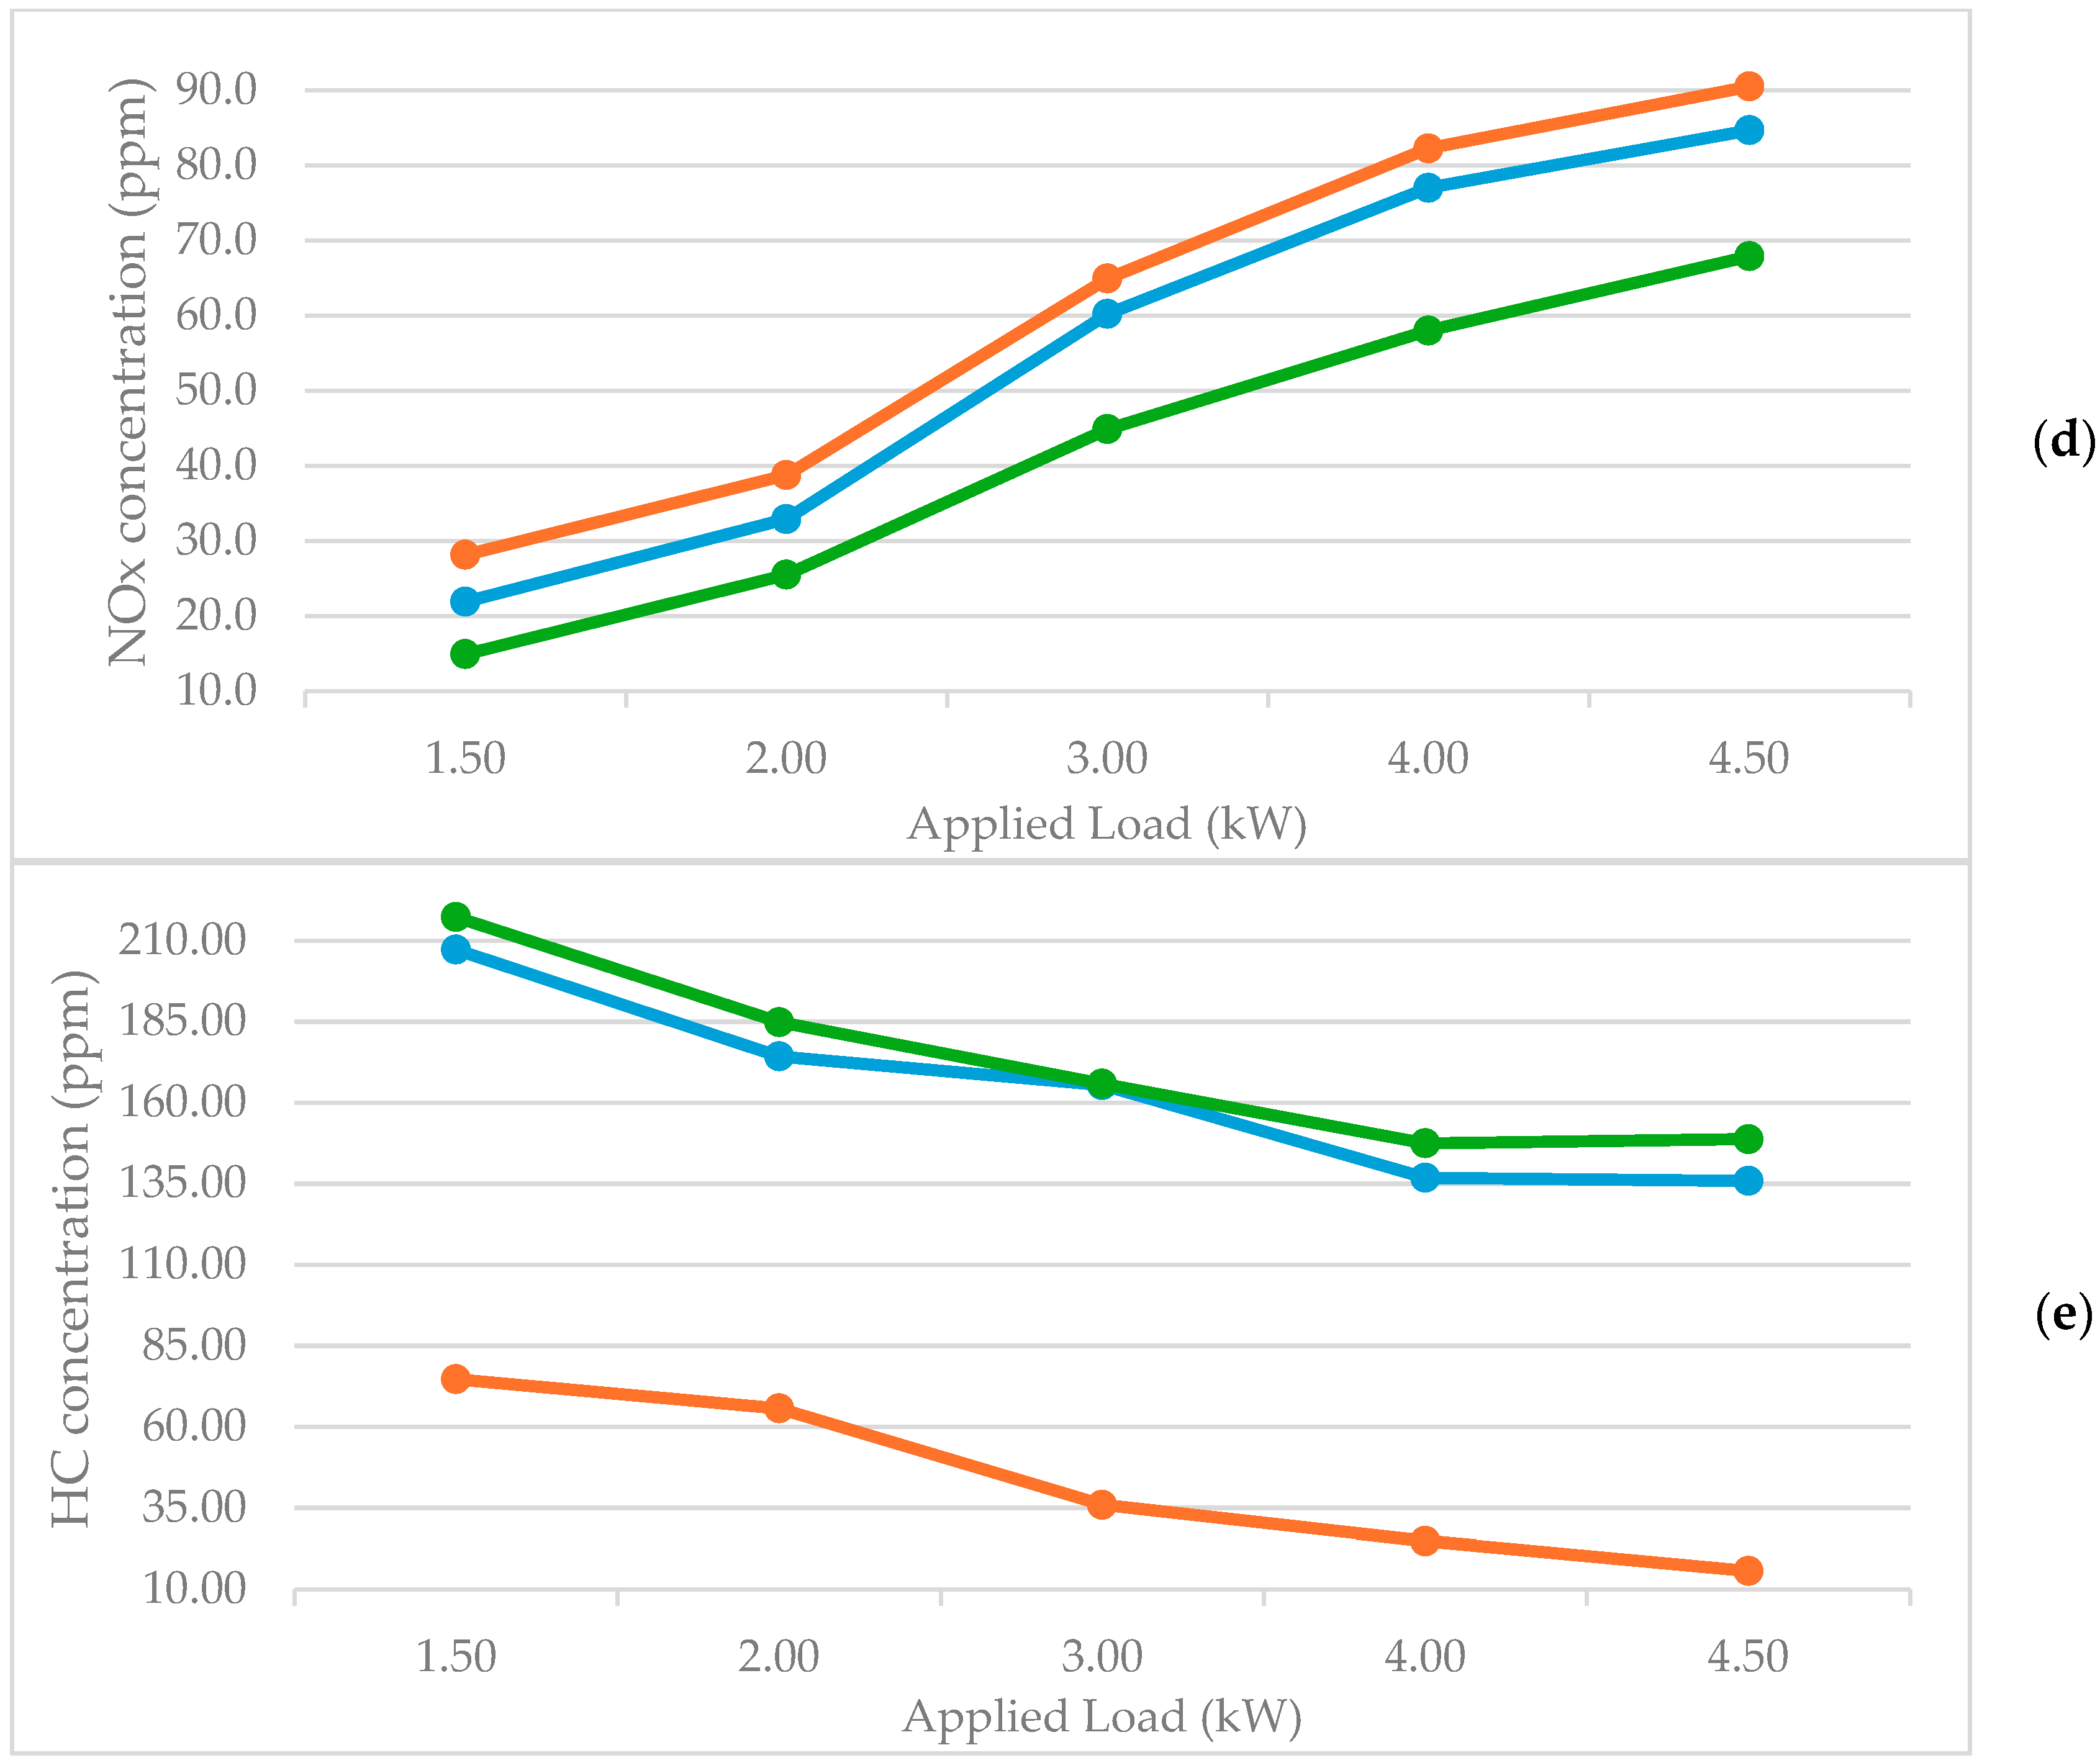
To provide a comprehensive overview, Figure 16 compares the experimental results for the specific liquid fuel consumption, thermal efficiency, and CO, NOx, and HC emissions for operation with 22.5% biodiesel, considering the normal mode (B0) and dual-fuel modes (B22.5 + pure biogas and B22.5 + hydrogen-enriched biogas).
In terms of specific liquid fuel consumption (Figure 16a), enriching the biogas with 13.3% hydrogen resulted in a constant reduction of approximately 5% over the entire range of loads tested.
Compared to that with pure diesel, dual-fuel operation showed more significant reductions, reaching 21% at low load (1.5 kW) and 16.3% at high load (4.5 kW). These results are compatible with the reductions of up to 52% reported by Nguyen [16], which are attributed to the replacement of liquid fuel with gaseous fuel, made possible mainly by biogas.
Analysis of thermal efficiency (Figure 16b) revealed an average reduction of 2% in operation with pure biogas compared to the normal mode with diesel, which was attributed to slow flame propagation and the lower volumetric efficiency typical of low-calorific-value gaseous fuels [18].
The addition of hydrogen partially mitigates these limitations, resulting in an absolute increase in efficiency of approximately 1%. However, the efficiency levels in the dual-fuel mode remained lower than those achieved with pure diesel, suggesting that strategies such as upgrading biogas to biomethane may be necessary for more significant gains [16].
CO emissions (Figure 16c) were significantly higher in dual-fuel mode than in normal mode. Despite the reduction provided by hydrogen compared to pure biogas, there was an increase in CO emissions that intensified with increasing load, reaching variations of 182.5% and 170.4% for the modes with and without hydrogen, respectively.
This increase was attributed to incomplete combustion resulting from the lower temperature and flame speed associated with biogas [29], which cooled the combustion chamber and reduced the peak temperature, thereby limiting the complete oxidation of CO.
The NOx concentrations (Figure 16d) indicated that dual-fuel operation resulted in substantially lower emissions than those observed in normal mode. The use of hydrogen-enriched biogas reduced NOx emissions by approximately 11.5% on average, whereas the use of biogas alone led to a reduction of approximately 33.3%, in line with the 25–64% reduction range reported by Oni [48].
These results show that although hydrogen alone tends to increase NOx, its combination with biogas mitigates this effect because of the high CO2 content and lower combustion temperature of the mixture.
For HC emissions (Figure 16e), there was an increase in the dual-fuel mode compared with pure diesel. However, the presence of hydrogen led to reductions in the HC levels, particularly at high loads, corroborating the observations of Bouguessa [18], which related hydrogen enrichment to more efficient and homogeneous burning of the mixture.
Comparisons with prior studies were normalized by load point and expressed as variations relative to neat diesel and to the biogas-only baseline.
The modest efficiency gains and tempered NOx response reflect the low hydrogen fraction, CO2 dilution in the biogas that lowers adiabatic flame temperature, and open-loop carburetion, which induces λ heterogeneity with elevated HC and CO at low load and possible NOx intensification at high load.
Architecture and protocol differences (a single-cylinder engine at 3600 rpm under steady resistive loading) also limit direct comparability with multi-cylinder, electronically injected, or dynamometric/transient setups.
Within this framework, the models quantify the trade-offs and delineate load–biodiesel operating regions for the low-H2 case, helping to rationalize deviations from Nguyen [16], Oni [48], and Bouguessa [18].

4. Conclusions

The results of this study show that operating in the dual-fuel mode, partially replacing diesel with a mixture of biogas and hydrogen, is a promising strategy for improving energy efficiency and reducing liquid fuel consumption. The addition of hydrogen to biogas promotes efficiency gains at high loads and significant reductions in specific consumption, although this results in an increase in NOx emissions.
The response surface models for specific consumption were robust, with an average reduction of 4.2% in the liquid fuel consumption with biogas enrichment. Compared with pure diesel, dual operation resulted in maximum reductions reaching 21% at low loads and 16.3% at high loads.
Thermal efficiency was affected by the addition of hydrogen and the biodiesel concentration. Increasing the proportion of biodiesel promoted an average increase of 0.4% in the efficiency, whereas the addition of hydrogen resulted in an average improvement of 0.76%. However, the efficiency in the dual-fuel mode remained lower than that observed with pure diesel, suggesting that greater concentrations of hydrogen may be necessary to optimize the performance.
With regard to emissions, dual-fuel operation favored CO reduction with increasing load and with the addition of hydrogen, although CO concentrations remained higher than those with pure diesel owing to the higher biogas content in the gaseous fuel.
The addition of hydrogen to biogas reduces HC emissions by an average of 4.1%, particularly in high-load operations. However, dual operation with biogas resulted in higher HC emissions than pure diesel.
NOx emissions were influenced by the load and combustion temperature, with hydrogen promoting an average increase of 26.6% compared with the dual-fuel mode without enrichment. Nevertheless, compared with pure diesel, the dual operation resulted in reductions of 11.5% (with hydrogen) and 33.3% (with pure biogas), demonstrating the mitigating effect of biogas on NOx formation.
Hydrogen, even at modest fractions and low flow rates, demonstrates a clear positive effect on engine performance and emissions. In this study, an enrichment level of approximately 13.3% H2 at 20 L·min−1 yielded measurable gains without compromising operational safety, underscoring its practical relevance for small generator sets in agricultural applications. The unified experimental design and strict control of boundary conditions provided a consistent comparative dataset, highlighting the benefits of hydrogen enrichment over biogas-only operation and supporting the refinement of control-strategies for emission mitigation.
This study, however, is subject to several limitations. These include open-loop carburetion in place of calibrated electronic gas injection, resistive load-bank operation instead of dynamometric testing, the absence of exhaust-gas-temperature monitoring, use of a small single-cylinder CI engine, evaluation at only one hydrogen enrichment level, and reliance on short, stabilized runs.
Open-loop carburetion introduces λ variability and mixture heterogeneity. This tends to elevate HC and CO at low load and may intensify NOx at high load.
The absence of exhaust-gas temperature (EGT) monitoring prevents direct correlation of NOx with thermal peaks and hampers the identification of heteroscedasticity and residual thermal effects.
Use of a single-cylinder engine at 3600 rpm with a resistive load provides steady-state evidence. These results are not directly generalizable to multi-cylinder architectures, transient regimes, or advanced control strategies.
Optimization via RSM is valid only within the tested envelope (load levels, biodiesel fraction, and presence/absence of H2). Any extrapolation requires additional validation.
The dataset should be used as a controlled comparative reference and a basis for preliminary tuning. Future work should consider closed-loop gas injection, dynamometric testing, EGT instrumentation, and sweeps of H2 fraction/flow and equivalence ratio.
These constraints limit the extrapolation of findings to multicylinder engines and advanced control strategies. Nonetheless, the results offer a controlled reference for system design and calibration. Future work should expand the range of hydrogen fractions and flow rates, implement closed-loop gas injection, incorporate dynamometric and thermal instrumentation, and investigate integration with biomethane and other alternative fuels.

Author Contributions

Conceptualization, S.N.M.d.S., D.S. and D.B.; methodology, D.S., S.N.M.d.S., W.C.N. and R.A.B.; software, D.S.; validation, D.B., D.S., J.d.S., R.F.S., W.C.N., J.A.C.S. and C.E.C.N.; formal analysis, D.S., D.B., S.N.M.d.S. and W.C.N.; investigation, D.S., S.N.M.d.S.; resources, S.N.M.d.S., D.B., R.F.S., J.d.S. and R.A.B.; data curation, D.S.; writing—original draft preparation, D.S.; writing—review and editing, D.S., D.B., S.N.M.d.S., C.E.C.N. and W.M.M.J.; visualization, W.M.M.J., J.A.C.S. and R.A.B.; supervision, S.N.M.d.S.; project administration, S.N.M.d.S.; funding acquisition, S.N.M.d.S. and D.B. All authors have read and agreed to the published version of the manuscript.

Funding

This research was funded by Coordenaçao de Aperfeiçoamento de Pessoal de Nível Superior—Brasil (CAPES)—Finance Code 001, which supported the research and scholarships to Danilo Simon, and Doglas Bassegio (grant number PDPG 88887.924187/2023-00). Samuel N. M. de Souza, Willian C. Nadaleti, Reinaldo A. Bariccatti, Reginaldo F. Santos, and Carlos E. C. Nogueira also appreciate the scholarship support given by National Council of Scientific and Technological Development (CNPq).

Data Availability Statement

Available upon reasonable request from the corresponding author.

Conflicts of Interest

The authors declare no conflicts of interest.

References

  1. Hasan, M.R.; Anzar, N.; Sharma, P.; Malode, S.J.; Shetti, N.P.; Narang, J.; Kakarla, R.R. Converting biowaste into sustainable bioenergy through various processes. Bioresour. Technol. Rep. 2023, 23, 101542. [Google Scholar] [CrossRef] [Scilit]
  2. Dhanya, B.; Mishra, A.; Chandel, A.K.; Verma, M.L. Development of sustainable approaches for converting the organic waste to bioenergy. Sci. Total Environ. 2020, 723, 138109. [Google Scholar] [CrossRef] [Scilit]
  3. Callegari, A.; Bolognesi, S.; Cecconet, D.; Capodaglio, A.G. Production technologies, current role, and future prospects of biofuels feedstocks: A state-of-the-art review. Crit. Rev. Environ. Sci. Technol. 2020, 50, 384–436. [Google Scholar] [CrossRef] [Scilit]
  4. Osman, W.N.A.W.; Rosli, M.H.; Mazli, W.N.A.; Samsuri, S. Comparative review of biodiesel production and purification. Carbon Capture Sci. Technol. 2024, 13, 100264. [Google Scholar] [CrossRef] [Scilit]
  5. Arya, M.; Rout, A.K.; Samanta, S. A review on the effect of engine performance and emission characteristics of C.I. Engine using Diesel-Biodiesel-Additives fuel blend. Mater. Today Proc. 2022, 51, 2224–2232. [Google Scholar] [CrossRef] [Scilit]
  6. Palani, Y.; Devarajan, C.; Manickam, D.; Thanikodi, S. Performance and emission characteristics of biodiesel-blend in diesel engine: A review. Environ. Eng. Res. 2022, 27, 200338. [Google Scholar] [CrossRef] [Scilit]
  7. Gupta, P.; Kurien, C.; Mittal, M. Biogas (a promising bioenergy source): A critical review on the potential of biogas as a sustainable energy source for gaseous fuelled spark ignition engines. Int. J. Hydrogen Energy 2022, 48, 7747–7769. [Google Scholar] [CrossRef] [Scilit]
  8. Garcilasso, V.P.; Ferraz Junior, A.D.N. Biogás. In Tecnologias de Produção e Uso de Biogás e Biometano, 1st ed.; Coelho, S.T., Ed.; IEE Instituto de Energia e Meio Ambiente da Universidade de São Paulo, Assumpção I, organizadores: São Paulo, Brazil, 2018; pp. 1–79. [Google Scholar]
  9. Qian, Y.; Sun, S.; Ju, D.; Shan, X.; Lu, X. Review of the state-of-the-art of biogas combustion mechanisms and applications in internal combustion engines. Renew. Sustain. Energy Rev. 2017, 69, 50–58. [Google Scholar] [CrossRef] [Scilit]
  10. Sinigaglia, T.; Lewiski, F.; Martins, M.E.S.; Siluk, J.C.M. Production, storage, fuel stations of hydrogen and its utilization in automotive applications-a review. Int. J. Hydrogen Energy 2017, 42, 24597–24611. [Google Scholar] [CrossRef] [Scilit]
  11. Ishaq, H.; Dincer, I.; Crawford, C. A review on hydrogen production and utilization: Challenges and opportunities. Int. J. Hydrogen Energy 2022, 47, 26238–26264. [Google Scholar] [CrossRef] [Scilit]
  12. Muhammed, N.S.; Gbadamosi, A.O.; Epelle, E.I.; Abdulrasheed, A.A.; Haq, B.; Patil, S.; Al-Shehri, D.; Kamal, M.S. Hydrogen production, transportation, utilization, and storage: Recent advances towards sustainable energy. J. Energy Storage 2023, 73, 109207. [Google Scholar] [CrossRef] [Scilit]
  13. Hosseini, S.H.; Tsolakis, A.; Alagumalai, A.; Mahian, O.; Lam, S.S.; Pan, J.; Peng, W.; Tabatabaei, M.; Aghbashlo, M. Use of hydrogen in dual-fuel diesel engines. Prog. Energy Combust. Sci. 2023, 98, 101100. [Google Scholar] [CrossRef] [Scilit]
  14. Goga, G.; Chauhan, B.S.; Mahla, S.K.; Dhir, A.; Cho, H.M. Combined impact of varying biogas mass flow rate and rice bran methyl esters blended with diesel on a dual-fuel engine. Energy Sources Part A Recover. Util. Environ. Eff. 2021, 43, 120–132. [Google Scholar] [CrossRef] [Scilit]
  15. Deheri, C.; Acharya, S.K.; Thatoi, D.N.; Mohanty, A.P. A review on performance of biogas and hydrogen on diesel engine in dual fuel mode. Fuel 2020, 260, 116337. [Google Scholar] [CrossRef] [Scilit]
  16. Nguyen, V.N.; Nayak, S.K.; Le, H.S.; Kowalski, J.; Deepanraj, B.; Duong, X.Q.; Truong, T.H.; Tran, V.D.; Cao, D.N.; Nguyen, P.Q.P. Performance and emission characteristics of diesel engines running on gaseous fuels in dual-fuel mode. Int. J. Hydrogen Energy 2024, 49, 868–909. [Google Scholar] [CrossRef] [Scilit]
  17. Atelge, M.R.; Senol, H.; Djaafri, M.; Hansu, T.A.; Krisa, D.; Atabani, A.; Eskicioglu, C.; Muratçobanoğlu, H.; Unalan, S.; Kalloum, S.; et al. a critical overview of the state-of-the-art methods for biogas purification and utilization processes. Sustainability 2021, 13, 11515. [Google Scholar] [CrossRef] [Scilit]
  18. Bouguessa, R.; Tarabet, L.; Loubar, K.; Belmrabet, T.; Tazerout, M. Experimental investigation on biogas enrichment with hydrogen for improving the combustion in diesel engine operating under dual fuel mode. Int. J. Hydrogen Energy 2020, 45, 9052–9063. [Google Scholar] [CrossRef] [Scilit]
  19. Mohite, A.; Bora, B.J.; Sharma, P.; Sarıdemir, S.; Mallick, D.; Ağbulut, Ü. Performance enhancement and emission control through adjustment of operating parameters of a biogas-biodiesel dual fuel diesel engine: An experimental and statistical study with biogas as a hydrogen carrier. Int. J. Hydrogen Energy 2024, 52, 752–764. [Google Scholar] [CrossRef] [Scilit]
  20. Nayak, C.; Sahoo, B.B. Comparative assessment of biogas and producer gas with diesel in a twin cylinder dual-fuel diesel engine. J. Braz. Soc. Mech. Sci. Eng. 2020, 42, 531. [Google Scholar] [CrossRef] [Scilit]
  21. Telaumbanua, I.K.; Oishi, Y.; Ogawa, D.; Kawai, H.; Ambarita, H. Determination of the optimum biogas energy ratio in dual-fuel biodiesel used in cooking oil-biogas operation. Energy Sources Part A Recover. Util. Environ. Eff. 2023, 45, 13001–13020. [Google Scholar] [CrossRef] [Scilit]
  22. Atelge, M.; Arslan, E.; Krisa, D.; Al-Samaraae, R.; Abut, S.; Ünalan, S.; Atabani, A.; Kahraman, N.; Akansu, S.O.; Kaya, M.; et al. Comparative investigation of multi-walled carbon nanotube modified diesel fuel and biogas in dual fuel mode on combustion, performance, and emission characteristics. Fuel 2022, 313, 123008. [Google Scholar] [CrossRef] [Scilit]
  23. Dimitriou, P.; Tsujimura, T. A review of hydrogen as a compression ignition engine fuel. Int. J. Hydrogen Energy 2017, 42, 24470–24486. [Google Scholar] [CrossRef] [Scilit]
  24. Zhang, X.; Gao, J.; Fan, D.; Yang, Q.; Han, F.; Yu, H. Impact of pilot diesel injection timing on performance and emission characteristics of marine natural gas/diesel dual-fuel engine. Sci. Rep. 2024, 14, 10713. [Google Scholar] [CrossRef] [Scilit]
  25. Kshatriya, A.S.; Tiwari, P.; M, S.; Yunus Khan, T.M.; Abdul Khadar, S.D.; Mansour, M.; M, F. Investigations into the Combined Effect of Mahua Biodiesel Blends and Biogas in a Dual Fuel Engine. Energies 2022, 15, 2057. [Google Scholar] [CrossRef] [Scilit]
  26. Mirhashemi, F.S.; Sadrnia, H. NOX emissions of compression ignition engines fueled with various biodiesel blends: A review. J. Energy Inst. 2020, 93, 129–151. [Google Scholar] [CrossRef] [Scilit]
  27. Dhas, A.A.G.; Almoallim, H.S.; Ganeshan, S.; Anbarasu, A.; Beata, G. In-depth study of waste cooking oil blends with hydrogen and ammonia in internal combustion engine: Performance and emission study. Fuel 2024, 369, 131663. [Google Scholar] [CrossRef] [Scilit]
  28. Singh, D.; Sharma, D.; Soni, S.L.; Inda, C.S.; Sharma, S.; Sharma, P.K.; Jhalani, A. A Comprehensive Review on 1st-Generation Biodiesel Feedstock Palm Oil: Production, Engine Performance, and Exhaust Emissions. BioEnergy Res. 2021, 14, 1–22. [Google Scholar] [CrossRef] [Scilit]
  29. Ahmad, A.; Yadav, A.K.; Singh, A. Process optimization of spirulina microalgae biodiesel synthesis using RSM coupled GA technique: A performance study of a biogas-powered dual-fuel engine. Int. J. Environ. Sci. Technol. 2024, 21, 169–188. [Google Scholar] [CrossRef] [Scilit]
  30. Fareed, A.F.; El-Shafay, A.; Mujtaba, M.; Riaz, F.; Gad, M. Investigation of waste cooking and castor biodiesel blends effects on diesel engine performance, emissions, and combustion characteristics. Case Stud. Therm. Eng. 2024, 60, 104721. [Google Scholar] [CrossRef] [Scilit]
  31. Yoon, S.H.; Lee, C.S. Experimental investigation on the combustion and exhaust emission characteristics of biogas–biodiesel dual-fuel combustion in a CI engine. Fuel Process. Technol. 2011, 92, 992–1000. [Google Scholar] [CrossRef] [Scilit]
  32. Sarıdemir, S.; Polat, F.; Ağbulut, Ü. Improvement of worsened diesel and waste biodiesel fuelled-engine characteristics with hydrogen enrichment: A deep discussion on combustion, performance, and emission analyses. Process. Saf. Environ. Prot. 2024, 184, 637–649. [Google Scholar] [CrossRef] [Scilit]
  33. Ruatpuia, J.V.; Halder, G.; Vanlalchhandama, M.; Lalsangpuii, F.; Boddula, R.; Al-Qahtani, N.; Niju, S.; Mathimani, T.; Rokhum, S.L. Jatropha curcas oil a potential feedstock for biodiesel production: A critical review. Fuel 2024, 370, 131829. [Google Scholar] [CrossRef] [Scilit]
  34. Leykun, M.G.; Mekonen, M.W. Investigation of the Performance and Emission Characteristics of Diesel Engine Fueled with Biogas-Diesel Dual Fuel. Fuels 2022, 3, 15–30. [Google Scholar] [CrossRef] [Scilit]
  35. ASTM D5986; Standard Test Method for Determination of Oxygenates, Benzene, Toluene, C8–C12 Aromatics and Total Aromatics in Finished Gasoline by Gas Chromatography/Fourier Transform Infrared Spectroscopy. ASTM International: West Conshohocken, PA, USA, 2023.
  36. EN 14105; Fat and Oil Derivatives—Fatty Acid Methyl Esters (FAME)—Determination of Free and Total Glycerol and Mono-, Di-, and Triglyceride Contents. European Committee for Standardization (CEN): Brussels, Belgium, 2020.
  37. ASTM D4052; Standard Test Method for Density, Relative Density, and API Gravity of Liquids by Digital Density Meter. ASTM International: West Conshohocken, PA, USA, 2023.
  38. ASTM D445; Standard Test Method for Kinematic Viscosity of Transparent and Opaque Liquids and Calculation of Dynamic Viscosity. ASTM International: West Conshohocken, PA, USA, 2024.
  39. ASTM D6304; Standard Test Method for Determination of Water in Petroleum Products, Lubricating Oils, and Additives by Coulometric Karl Fischer Titration. ASTM International: West Conshohocken, PA, USA, 2021.
  40. ASTM D2709; Standard Test Method for Water and Sediment in Middle Distillate Fuels by Centrifuge. ASTM International: West Conshohocken, PA, USA, 2022.
  41. ASTM D2386; Standard Test Method for Freezing Point of Aviation Fuels. ASTM International: West Conshohocken, PA, USA, 2023.
  42. ASTM D93; Standard Test Methods for Flash Point by Pensky–Martens Closed Cup Tester. ASTM International: West Conshohocken, PA, USA, 2020.
  43. ASTM D130; Standard Test Method for Corrosiveness to Copper from Petroleum Products by Copper Strip Test. ASTM International: West Conshohocken, PA, USA, 2019.
  44. ASTM D240; Standard Test Method for Heat of Combustion of Liquid Hydrocarbon Fuels by Bomb Calorimeter. ASTM International: West Conshohocken, PA, USA, 2019.
  45. Sagar, S.; Agarwal, A.K. Experimental validation of accuracy of dynamic hydrogen-compressed natural gas mixing system using a single cylinder spark ignition engine. Int. J. Hydrogen Energy 2016, 41, 14272–14282. [Google Scholar] [CrossRef] [Scilit]
  46. Murugesan, P.; Hoang, A.T.; Venkatesan, E.P.; Kumar, D.S.; Balasubramanian, D.; Le, A.T.; Pham, V.V. Role of hydrogen in improving performance and emission characteristics of homogeneous charge compression ignition engine fueled with graphite oxide nanoparticle-added microalgae biodiesel/diesel blends. Int. J. Hydrogen Energy 2022, 47, 37617–37634. [Google Scholar] [CrossRef] [Scilit]
  47. Ahmad, A.; Yadav, A.K.; Hasan, S. Enhanced production of methane enriched biogas through intensified co-digestion process and its effective utilization in a biodiesel/biohydrogen fueled engine with duel injection strategies: ML-RSM based an efficient optimization approach. Int. J. Hydrogen Energy 2024, 65, 671–686. [Google Scholar] [CrossRef] [Scilit]
  48. Oni, B.A.; Sanni, S.E.; Ibegbu, A.J.; Amoo, T.E. Investigating the emissions and performance of hydrogen enriched-biogas-Parinari polyandra biodiesel in a direct injection (DI) engine. Int. J. Hydrogen Energy 2022, 47, 29945–29955. [Google Scholar] [CrossRef] [Scilit]
  49. Simsek, S.; Uslu, S. Investigation of the effects of biodiesel/2-ethylhexyl nitrate (EHN) fuel blends on diesel engine performance and emissions by response surface methodology (RSM). Fuel 2020, 275, 118005. [Google Scholar] [CrossRef] [Scilit]
  50. Veza, I.; Spraggon, M.; Fattah, I.R.; Idris, M. Response surface methodology (RSM) for optimizing engine performance and emissions fueled with biofuel: Review of RSM for sustainability energy transition. Results Eng. 2023, 18, 101213. [Google Scholar] [CrossRef] [Scilit]
  51. Sharma, A.; Ansari, N.A.; Pal, A.; Singh, Y.; Lalhriatpuia, S. Effect of biogas on the performance and emissions of diesel engine fuelled with biodiesel-ethanol blends through response surface methodology approach. Renew. Energy 2019, 141, 657–668. [Google Scholar] [CrossRef] [Scilit]
  52. Muhssen, H.S.; Zöldy, M.; Bereczky, Á. A Comprehensive Review on the Hydrogen–Natural Gas–Diesel Tri-Fuel Engine Exhaust Emissions. Energies 2024, 17, 3862. [Google Scholar] [CrossRef] [Scilit]
Figure 1. Process for producing soy biodiesel by transesterification.
Energies 18 05502 g001
Figure 2. Biogas composition collection and analysis system.
Energies 18 05502 g002
Figure 3. Biogas enrichment system with hydrogen.
Energies 18 05502 g003
Figure 4. Chromatographic analysis of the biogas and hydrogen mixture.
Energies 18 05502 g004
Figure 5. Experimental Intake Setup: Carburetor Mounting and Air Filter Flange Adapters.
Energies 18 05502 g005
Figure 6. Laboratory setup for biodiesel pilot and hydrogen–biogas fueling.
Energies 18 05502 g006
Figure 7. Schematic of the experimental setup for dual-fuel engine operation with biogas and hydrogen enrichment.
Energies 18 05502 g007
Figure 8. Experimental procedure for performance and emission evaluation of a dual-fuel engine using biogas, hydrogen, and biodiesel/diesel blends.
Energies 18 05502 g008
Figure 9. Residual plots for (a) specific net fuel consumption, (b) efficiency, (c) CO concentration, (d) NOx concentration, and (e) HC concentration.
Energies 18 05502 g009aEnergies 18 05502 g009b
Figure 10. Surface response plots for specific net fuel consumption (g kWh−1) under conditions without hydrogen (H0) and with hydrogen enrichment (H1).
Energies 18 05502 g010
Figure 11. Surface response plots for efficiency (%) under conditions without hydrogen (H0) and with hydrogen enrichment (H1).
Energies 18 05502 g011
Figure 12. Surface response plots for CO concentrations under conditions without hydrogen (H0) and with hydrogen enrichment (H1).
Energies 18 05502 g012
Figure 13. Surface response plots for NOx concentrations under conditions without hydrogen (H0) and with hydrogen enrichment (H1).
Energies 18 05502 g013
Figure 14. Surface response plots for HC concentrations under conditions without hydrogen (H0) and with hydrogen enrichment (H1).
Energies 18 05502 g014
Figure 15. Response surface optimization of biodiesel concentration, engine load, and hydrogen enrichment for performance and emission parameters in dual-fuel.
Energies 18 05502 g015
Figure 16. Comparison of engine performance and emissions under different fuel modes: B0, B22.5 with biogas, and B22.5 with biogas and hydrogen enrichment. (a) Specific net fuel consumption; (b) Thermal efficiency; (c) CO concentration; (d) NOₓ concentration; (e) HC concentration.
Energies 18 05502 g016aEnergies 18 05502 g016b
Table 1. Trends in calorific value and emissions of biodiesel, biogas, and hydrogen when used in combination.
FuelCalorific ValueHydrocarbons (HC)Carbon Monoxide (CO)Nitrogen Oxides (NOx)
BiodieselDownward trend
[14,26,27]
Downward trend
[14,25,28,29,30,31]
Downward trend
[14,25,28,30,31,32]
Upward trend
[5,6,14,25,28,29,30,31,32,33]
BiogasDownward trend
[13,14,15]
Upward trend
[14,15,16,17,18,19,20,21,25,29,34]
Upward trend
[14,15,16,17,18,19,20,21,22,25,29,31,34]
Downward trend
[14,16,17,18,19,20,21,25,29,31,34]
HydrogenUpward trend
[13,15,18,23,27]
Downward trend
[15,16,18,19,23,24,27,32]
Downward trend
[15,16,19,23,27,32]
Upward trend
[13,15,16,18,19,23,24,27]
Table 2. Physical and chemical properties of the biodiesel produced.
ParametersUnitTest MethodResults 100% BiodieselASTM LimitsStatus
Total aromatics-ASTM D5986 [35]1.15--
Benzene-ASTM D59860.03--
Toluene-ASTM D598613.54--
Total olefins-ASTM D598629.28--
Esters-EN 14105 [36]98.90--
Specific mass 20 °Ckg/m3ASTM D4052 [37]882.70850–890Approved
Kinematic viscosity at 40 °Cmm2/sASTM D445 [38]4.221.96–6.0Approved
Water content by Karl Fischermg/kgASTM D6304 [39]770.10Max. 500Deviation accepted
Water and sediment% VolASTM D2709 [40]0.00Max. 0.05Approved
Freezing point°CASTM D2386 [41]<−1.00--
Flash point°CASTM D93 [42]169.00Min. 130Approved
Corrosivity to copper-ASTM D130 [43]1A3Approved
Lower calorific valueMJ/kgASTM D240 [44]35.81Min. 35Approved
Table 3. Diesel and biodiesel concentrations in the blends prepared.
BlendBiodiesel Conc. (%)Density (kg/m3)Lower Calorific Value (MJ/kg)
B00.0%828.242.4
B1010.0%831.541.5
B1515.0%836.241.4
B2222.5%839.040.4
B3030.0%844.040.0
B3535.0%848.539.7
B100100.0%882.735.8
Table 4. Composition and concentration of collected biogas.
GasConcentration
CH462.0% ± 0.5%
CO237.9% ± 0.5%
O20.1% ± 1.0%
CO29 ppm ± 10 ppm
H2S1 ppm ± 1 ppm
Table 5. Composition of the biogas/hydrogen gas mixture.
GasConcentration
Hydrogen (H2)13.3%
Methane (CH4)55.6%
Carbon dioxide (CO2)31.1%
Table 6. Uncertainty and precision values of measured input parameters.
PropertiesPrecision (±)Uncertainty (%)
Net Fuel Vol. (mL)±2.5 mL0.17
Voltage (V)±1.8%0.35
Current (A)±1.0%0.04
CO (ppm)±10 ppm3.37
NOx (ppm)±5 ppm3.44
HC (ppm)±10 ppm0.31
Table 7. RSM Factor-Level Mapping: Biodiesel Concentration and Applied Load.
LevelsConcentration of Biodiesel
in the Liquid Fuel (%)
Applied Load (kW)
−210.001.50
−115.002.00
022.503.00
130.004.00
235.004.50
Table 8. CCD experimental matrix.
Ens.Biodiesel Conc. (%)Load (kW)H2 Conc. (13.3%)Specific Net Fuel Consumption
(g kWh−1)
Efic. (%)CO Conc. (ppm)NOx Conc. (ppm)HC Conc. (ppm)
130.02.00440.1513.151245.8326.83193.00
222.53.00385.1314.90995.3344.50166.17
330.02.01451.5413.071172.6733.00163.17
430.04.00347.1516.83760.6756.83138.50
515.02.00446.1412.531309.3324.17176.67
615.04.00343.2416.36768.8359.17156.50
715.04.01333.6416.93676.8375.33129.33
830.04.01336.5017.38811.6778.33160.83
915.02.01422.1713.381281.3332.83185.33
1015.02.00436.1912.751278.5030.50185.67
1122.53.01344.4616.75887.6750.33156.67
1230.02.00462.3712.641213.5025.33177.00
1315.02.01427.1713.281288.6730.17184.50
1415.04.00333.8316.66715.8358.50142.50
1522.53.00372.8615.46965.8347.17165.00
1622.53.01353.0716.42866.8360.83161.67
1730.04.00339.4017.13746.6756.83139.00
1822.53.00348.3316.23965.5043.83172.17
1922.53.01371.0715.70916.0066.33178.50
2030.04.01329.9817.64764.5077.83150.83
2115.04.01330.0717.03645.0076.17122.83
2222.53.00367.3915.55902.1744.00160.00
2330.02.01426.2513.661125.3333.67188.17
2422.53.01359.9016.11881.0063.33164.83
2510.03.00356.7515.25978.6740.00185.33
2622.51.50543.3910.511533.0015.67213.00
2735.03.00374.6315.55879.3343.50173.17
2810.03.01355.6715.62832.6753.17144.33
2935.03.01355.6616.72936.1749.17166.50
3035.03.00381.5815.27837.8344.17162.00
3135.03.01363.3316.37892.0050.33157.67
3222.51.51502.3811.321446.0023.17206.17
3322.54.50333.3717.51764.1765.83145.00
3422.54.51319.3418.32715.1782.17132.83
3522.51.50537.8710.571608.0014.17221.50
3622.54.50338.6717.24802.8370.00152.50
3722.54.51321.5118.19784.6787.17139.00
3822.51.51512.7911.141528.1720.67208.33
3910.03.00374.0614.62898.3340.17175.17
4010.03.01366.0515.25879.3352.83160.17
Table 9. ANOVA of performance parameters and emissions.
Source of
Variation
Specific Net Fuel
Consumption
(g kWh−1)
Efficiency
(%)
CO Concentration (ppm)NOx Concentration (ppm)HC Concentration (ppm)
Fp-ValueFp-ValueFp-ValueFp-ValueFp-Value
Biod.1.840.18426.650.01440.660.42130.040.84660.070.7905
Load843.12<0.00011350.62<0.00011432.44<0.00011473.65<0.0001137.70<0.0001
Hyd.14.13<0.000141.74<0.000111.580.0019183.47<0.00014.160.0492
Biod. × Biod30.92<0.00017.660.009172.1<0.00017.710.00921.830.1855
Load. × Load115.67<0.000185.10<0.0001130.35<0.000114.8<0.00013.050.0900
Biod. × Load----18.9<0.00010.000.9659--
Biod. × Hyd.----5.180.02990.220.6391--
Load × Hyd.----1.070.309623.9<0.0001--
Lack of fit2.17420.05511.37850.24771.86690.11191.75660.13513.45400.0057
Table 10. Determination coefficients for performance parameters and emissions.
Determination CoefficientSpecific Net Fuel Consumption (g kWh−1)Efficiency (%)CO Conc. (ppm)NOx Conc. (ppm)HC Conc. (ppm)
R20.970.970.980.980.81
R2aj.0.960.970.980.980.78
Table 11. Validation of results and determination of errors for biodiesel concentration of 22.5%, applied load of 3.0 kW, and hydrogen concentration of 13.3%.
AnswersPredicted
Value
Experimental
Value
Error
Esp. net fuel consumption (g kWh−1)355.17357.20.55%
Efficiency (%)18.518.61.10%
CO Concentration (ppm)896.21887.880.94%
NOx Concentration (ppm)54.9960.218.66%
HC Concentration (ppm)160.21165.423.15%
Disclaimer/Publisher’s Note: The statements, opinions and data contained in all publications are solely those of the individual author(s) and contributor(s) and not of MDPI and/or the editor(s). MDPI and/or the editor(s) disclaim responsibility for any injury to people or property resulting from any ideas, methods, instructions or products referred to in the content.