


Abstract
Anaerobic digestion is considered unsuitable for the bioremediation of tannery effluent due to process inhibition, mainly due to high concentrations of sulfur species, and the accumulation of and/or . This study using the standardized biochemical methane potential protocol showed that efficient processing is possible with slaughterhouse wastewater, provided sufficient functional biomass is present at the start of the process and the concentration is below inhibition threshold. Methanogenic activity (K = 13.4–17.5 and µm = 0.15–0.27) and yields were high when reactors were operated ISR ≥ 3 and/or lower ≤ 710 mg/L while high ≥ 1960 mg/L and ISR < 3.0 caused almost complete inhibition regardless of corresponding ISR and . The theoretical optimum operating conditions (922 mg/L , ISR = 3.72) are expected to generate 361 mL biogas/gVS, 235 mL /gVS with reduction efficiencies of 27.5% VS, 27.4% TS, 75.1% TOC, 75.6% , and 41.1% COD. This implies that tannery sludge will be reduced by about 27% (dry mass) and by 76%, with a fraction of it recovered as . The models displayed a perfect fit to the cumulative yields with high precision in the order Logistic > Cone > modified Gompertz > first order.
Highlights
- Tannery effluent characteristics exhibited significant batch to batch variability
- Inhibition was seemingly caused by , and S, respectively
- The inhibitory effect of led to a significant decrease in A, µm, and K
- Process recovered , , and reusable water e.g for irrigation and construction
- Models perfectly fitted in the order Logistic > Cone > modified Gompertz > first order
1. Introduction
The leather tanning and products industries play prominent roles in the world’s economy, particularly for developing countries. South Africa is a net exporter of hides/skins, and is a renowned producer of exotic ostrich leather. The industry sustainably recycles skins which are by-products of the meat industry and prevents their disposal on to the environment. However, tanneries solve one problem and create another as they produce large amounts of tannery wastewater (TWW) loaded with toxic metal salts, and in/organic substances. Conventionally, a tonne of raw hide/skin yields approximately 200 kg of leather, 500 kg wet sludge, and 50–15,000 m3 of liquid effluent containing residual processing chemicals [1]. Typically, TWW contains high loads of chromium (Cr), sodium (Na), chlorides (Cl), nitrogen (TN), sulfate (), sulfide (), and suspended solids (SS) [2]. In addition, the process generates in-plant solid wastes such as untanned raw trimmings, fleshings, tanned waste blue splits, trimmings, and shavings. Most of the solids emanate from wet-blue processing and 80% is generated by the beamhouse processes [3]. Tanneries are therefore regarded as one of the most polluting industries particularly in developing countries that dominate the industry and supply >60% of the world’s skins/hides [1].
The adequate management of TWW and tannery solid waste, particularly sludge is onerous and expensive and impacts on the profitability of the tanneries. Sludge management costs account for nearly 40% of the overall budget and 55% of the process and maintenance costs of tannery wastewater treatment plants (TWWTPs) [4], while the costs of energy may be up to 60% of the total costs incurred in TWWTPs [5]. The amalgamation of slaughterhouses and tanneries presents an opportunity to integrate the value chain, promote the processing of fresh skins and co-treatment of TWW with slaughterhouse wastewater (SWW) [6]. The authors demonstrated the synergistic effect of co-digesting (AcoD) tannery waste activated sludge (TWAS) with slaughterhouse sludge (SHS). There is a lack of studies focusing on the AcoD of TWW with slaughterhouse wastewater (SWW) while evaluating process kinetics and recovering valuable resources. This is innovative approach will integrate the value chain and promote cleaner production through the processing of fresh or chilled skin/hides. This will eliminate sodium chloride (NaCl) preservation, the soaking stage, and NaCl availability in TWW.
However, the successful application of anaerobic digestion (AD) in treating TWW and SWW is hindered by microbial inhibitors, notably inorganic sulfur (S) species, ammonia (), volatile organic acids (VOA), and heavy metals. The presence of favours the growth of sulfate-reducing bacteria (SRB) which compete with methanogens for available carbon sources (acetate (, and carbon dioxide/hydrogen (). The availability of microbial inhibitors in TWW had prompted investigations on AcoD and pre-treatment, particularly coagulation in order to improve process efficiency. Successes in pretreatment studies have led to the realization that these ‘toxicants’ can potentially be recovered as value-added products. In light of the global adoption of circular bioeconomy principles, TWWTPs are increasingly being regarded as potential biorefineries. A review by Mpofu et al. [7] reported on the feasibility of using AD to recover sulfur species ( and ), and VOA rich biogas, biofertilizer/compost, metals, activated carbon, and/or reusable water. Therefore, the aim of this study was to determine the AD process efficiency and kinetics during the AcoD of TWW and SWW at different concentrations using an acclimated inoculum. The study also seeks to ascertain whether the adoption of AD can: (i) improve the quality of treated TWW to a standard that promotes reuse (ii) and/or recover elemental sulfur (), (iii) and/or recover renewable energy as biogas, and/or (iv) reduce the volume of sludge from TWWTPs, thereby improving the overall environmental and economic performance of tanneries.
2. Materials and Methods
2.1. Sampling
Samples used in this study were collected from an ostrich tannery that is integrated with a slaughterhouse (IOT). The tannery processes mainly fresh ostrich skins via wet-blue tanning. The tannery blends TWW and SWW and treats the blended effluents (ostrich tannery effluent (OTE)) using the activated sludge process (ASP). Six 50 L composite ostrich tannery effluent (OTE) samples were obtained from the balancing tank every 2 weeks over the course of 5 months (March to September 2018), to allow for fluctuations in effluent quality.
2.2. Analytical Methods
The loss on ignition standard methods were used to determine the concentration of total solids (TS) at 105 °C in an oven and total volatile solids (VS) in furnace at 550 °C, respectively [8]. Soluble fractions of the reactors were sampled before mixing and were analyzed to determine process efficiency. A Merck Spectroquant Pharo® Spectrophotometer (Darmstadt, Germany) together with Merck cell tests or kits were used to determine the concentration of substances (Table 1): chemical oxygen demand (COD) (cat no: 14555), 5-day biological oxygen demand (BOD5) (cat no: 00687), total organic carbon (TOC) (cat no: 14879), total volatile organic acids (VOAt) as acetic acid equivalents (AAE) (cat no: 01763), total sulfate () (cat no: 118389), total ( (cat no: 14779), total nitrogen (TN) (cat no: 14537), nitrate ) (cat no: 114776), nitrite () (cat no: 114776), total phosphate (TP) as phosphorous () (cat no: 14729), total ammonia nitrogen (TAN) () (cat no: 00683), and total alkalinity (Alk) as calcium carbonate ( (cat no: 101758), following the prescribed procedures.
Table 1.
Characteristics of different batches of ostrich tannery effluent.
The concentrations of metals (Al, Cd, Cr, Co, Cu, Fe, Ni, Pb, and Zn) and other cations (Ca, Cl, K, Mg, and Na) were acidified with nitric acid (HNO3) and were quantified by inductively coupled plasma (ICP) atomic emission spectroscopy (AES) using a Thermo ICap 6200 ICP-AES instrument, while ultra-trace analyses were performed by ICP-mass spectrometry (MS) using an Agilent (Santa Clara, USA) 7900 ICP-MS instrument.
2.3. Biomethane Potential Experiments
The biomethane potential (BMP) experimental protocol described by Holliger et al. [9] was followed in this study. The constant inoculum amount added in all the reactors was 176 mL while the blended OTE varied from 850 mL to 2120 mL. The reactors were 2.5 L (total volume) screw-capped borosilicate bottles with modified lids fitted with o-rings containing stainless steel inserts with gas-tight ports and tubing to allow sampling and biogas collection. All reactors were topped up to 2.3 L using deionized water. There was a high TVS ratio between inoculum and OTE (~25:1), and the volume occupied by the inoculum was relatively low, even at high inoculum to substrate ratios (ISRs). An acclimated inoculum was prepared by feeding OTE to digestate obtained from mesophilic batch reactors treating TWAS. The inoculum was kept at 37 °C and was fed with OTE until biogas production and quality stabilized [10].
The effect of 2 numeric factors were investigated: (665–2000 mg/L) and ISR (2–5), which were assessed using 2 responses: anaerobic biodegradability (%COD, %TS, %TVS, and %TOC reduction)], and maximum yield (ML /gVS), using response surface methodology (RSM). The RSM was based on a full factorial central composite experimental design (CCD) with 13 runs, 5 replicates (R4, R8–R11) and 5 levels for each factor. The experimental design matrix (Table 2) was generated using Design-Expert® Software Version 11 (Stat-Ease, Inc., Minneapolis, MN, USA). Two sets of each reactor and negative controls (inoculum and substrates only) reactors were set up. However, no positive controls were setup. Magnesium sulfate () and potassium sulfate () were added to the OTE of selected reactors to mimic the upper range of expected in the effluent stream. Reactors were manually mixed once a day for two minutes.
Table 2.
Experimental design matrix showing the methane yield and biodegradability results.
Biogas Sampling and Analysis
The gas ports from the 2 L BMP bioreactors were connected to individual gas sampling bags. When sufficient biogas was produced (>200 mL), samples were analyzed qualitatively and quantitatively. The , , and oxygen () content (%vol), as well as the content (parts per million (ppm) of the gas were determined using a Geotech biogas 5000 analyzer (Warwickshire, UK) according to the manufacturers’ instructions. Biogas volume was determined using a gas syringe.
3. Results and Discussion
3.1. Characteristics of Ostrich Tannery Effluent
It has been shown that there are significant differences in the TWW generated from the processing of either ostrich skins or bovine hides [7]. One contributing factor is the differences in the tanning and TWW treatment processes. In this study, the variations in the slaughterhouse and tannery operations was the main contributing factor.
3.1.1. Chemical and Biological Oxygen Demand and Solids Concentrations in the Ostrich Tannery Effluent
As expected, there was a batch-to-batch variation in the parameters that were measured in the OTE (Table 1). The TS, TVS, and COD significantly varied (ANOVA, p < 0.05) and batch 4 (June-winter) was higher. Apart from routine differences in the daily industrial processes, it was hypothesized that (i) samples containing different proportions of SWW and/or (ii) ostrich skins containing a higher amount of fat during colder months may have played contributory roles [10]. Indeed, the TS, TVS, and COD concentrations exhibited an inverse relationship with the monthly average temperature profile of the area. The BOD:COD ratio (=0.10) in batch 4 was the lowest of all the batches, but the BOD itself was within the range of the other batches. These results suggest that, if organic solids, notably fats, were responsible for the high TS, TVS, and COD concentrations in batch 4, then these were mainly recalcitrant in nature.
The gCOD:gTVS ratios of batches 1–6 were 2.20, 2.00, 1.59, 1.07, 1.56, and 3.12, respectively. These results suggested that batches 1, 2, and 6 were more lipid-like in character (gCOD:gTVS = 2.9) due to the low TVS content, whilst the other batches were more protein-like (gCOD:gTVS = 1.42) [11]. It was postulated that the insignificant differences (ANOVA, p > 0.05) in TVS:TS ratios and gCOD:gTVS were mainly due to the elucidated factors that caused differences in the TVS content of the OTE. Assuming no inhibition, yields of approximately 1000 mL/gTVS for lipid-like batches and 415–496 mL/gTVS for protein-like batches with 50–71% are expected [11]. Despite the lack of TVS:TS ratios being reported in literature, it was envisaged that batch 4 samples would be the most suitable for AD as TVS:TS ratios >0.8 are required for efficient reactor performance [12].
3.1.2. Concentration of Nitrogen, Carbon and Volatile Organic Acids in the Ostrich Tannery Effluent
Total nitrogen concentrations (TN) in TWW are widely reported in literature, and are typically high [7]. The TN determined in this study for OTE (Table 1) were in keeping with literature values. In contrast to TN, there is a lack of studies that report TOC and C:N ratios of TWW. Except for batch 5 (485 mg/L, end July 2018), the TOC (820–9080 mg/L, Table 1) in this study were higher than 510 mg/L reported by Bhattacharya et al. [13]. Although, the optimal C:N range for AD is 20–30 [14], the optimal range for TWW has been reported as 6–9 [15]. Anaerobic reactors operating at lower than optimal C:N ratios are likely to suffer and VOA inhibition during AD. In this study, although the TN of batch 3 and 4 (May–June) was low, the TOC concentrations were high compared to other batches. Batch 3 exhibited an optimal C:N ratio (25.2 ± 0.9) for AD whilst batch 4 was above optimal (34.9 ± 1.6) and the rest were below optimal (1.55–14.4).
Animal skins have a layer of fat that can increase in colder months and result in increased lipid concentrations in TWW. Fat floats were observed in the OTE, particularly in batch 4. Generally, lipids have high yields and Bo, and require long retention times due to low degradation rates [16]. High lipid concentrations (long chain fatty acids) in OTE may theoretically inhibit AD [16]. In this study, the measured VOAt concentrations (1.80–3.07 g/L) were mostly below the inhibitory thresholds (VOAt = 5.80–6.90 g/L) [17]. The VOA:ALK ratios of OTE (0.53–0.62) were >0.4, indicated the possibility of AD process instability and failure [18]. However, the speciation of during the AD of nitrogenous wastes serves as a buffer and plays a vital role in maintaining a relatively constant pH [15,19].
3.1.3. Inorganic Characteristics of Ostrich Tannery Effluents
The TN and were not significantly different (p > 0.05) in batches 2–5, and highest in batches 1 and 6. The concentration in batch 4 was notably higher than in the other batches. The batch-to-batch variation in N species was assumed to be due to process variations, environmental factors, effluent constituents and microbial activity (hydrolysis). The concentrations were all below the inhibiting range of 53–1450 mg/L for AD [20]. As expected in OTE, high , Na, Cl, Cr, Fe, and Ca concentrations were found. The concentration trends of Na, Cl, Fe, Cr, TS, and COD were similar (r = 0.64–0.86) from batch to batch.
Significant differences (ANOVA, p < 0.05) in and were assumed to emanate mainly from the differences in tanning operations rather than differences in the TWWTP performance and environmental factors. The high COD: ratios (13–37) of batch 2–5 were above the reported ranges for favoring methanogenesis over sulphidogenesis [21]. However, batch 1 and 6 were within the 1–7 range and capable of supporting either methanogenesis or sulphidogenesis. The macronutrient (C:N:P:S) ratios were in the range 2.1–64:1.1–3.8:0.01–0.3:1 (Table 1) and were not equivalent to the optimal ratio of 500–600:15:5:1 for AD [22]. Therefore, acclimatization of the inoculum was most vital in ensuring effective AD.
3.1.4. Metal Characteristics of Ostrich Tannery Wastewater
The concentration of most metals (Na-Mg; Zn-Cu-Ni-Cd-Fe-Al; Ni-Pb; and Cr-Al) in the OTE samples displayed a similar trend (r = 0.73–0.99), with the first 2 batches having the highest concentrations. The IC50 values for methanogens and acetogens have been reported as 11 g/L Na, 28 g/L K, 4.8 g/L Ca, 4–8 mg/L Cd, 100–400 mg/L Ni, 17–58 mg/L Zn, 67 mg/L Pb, 8.3–3000 mg/L Cr, and 0.7–5.65 g/L Fe [23,24]. The metal concentrations in the OTE were below the reported IC50. Some metals, such as Ni, Zn, Co, Cu, and Ca are also necessary as metabolic co-factors, and in this study, they were either within or below the optimal range for AD. However, inhibiting and optimal metal concentrations strongly depend on their availability as free ions, their physico-chemical properties, operating conditions, microbial species and their adaptation [25]. The presence of metal mixtures in TWW may exhibit antagonistic and synergistic effects to inhibition [26].
3.2. Biochemical Methane Potential Experiments
Methanogenesis is generally considered to be the slowest, most sensitive, and often rate-limiting reaction when processing tannery effluents as they are laden with soluble and/or unionised toxicants such as /, , /, VOA, and metals [7].
3.2.1. Cumulative Methane Generation
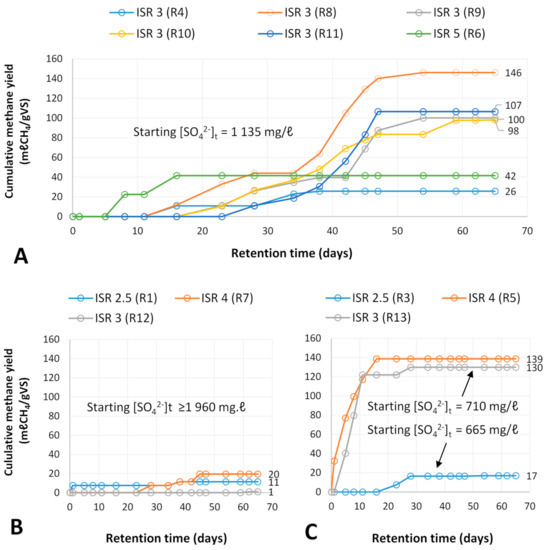
In this study, negligible biogas that could not be quantified was generated in the inoculum and substrate controls. In reactors with ISR ≥ 3, and ≤ 710 mg/L lag phases between 5 and 23 days were experienced before generation commenced (Figure 1), reflecting complete, but transient inhibition. In addition, in four of five replicates with ISR = 3, close to 50 days were required for generation to reach completion. The concentrations in these reactors was in the upper range expected in the OTE from the tannery concerned ( = 352–1186 mg/L, n = 6, Table 1). The average cumulative yield in these reactors ranged from 98 to 146 mL/gVS, higher than the yield reported by Saxena et al. [27], but lower than that reported by Achouri et al. [28] for AD of TWW without pre-treatment (7.6 mL/gVS and 753 mL/gVS, respectively, after 35 and 37 days, respectively). Studies by Mpofu et al. [6,19] also reported long lag phases of >60 days during mono-digestion of ostrich TWAS, and 20 days during co-digestion (AcoD) (50%/50% v/v) with ostrich SHS that led to retention times of 108 and 50 days, respectively.
Figure 1.
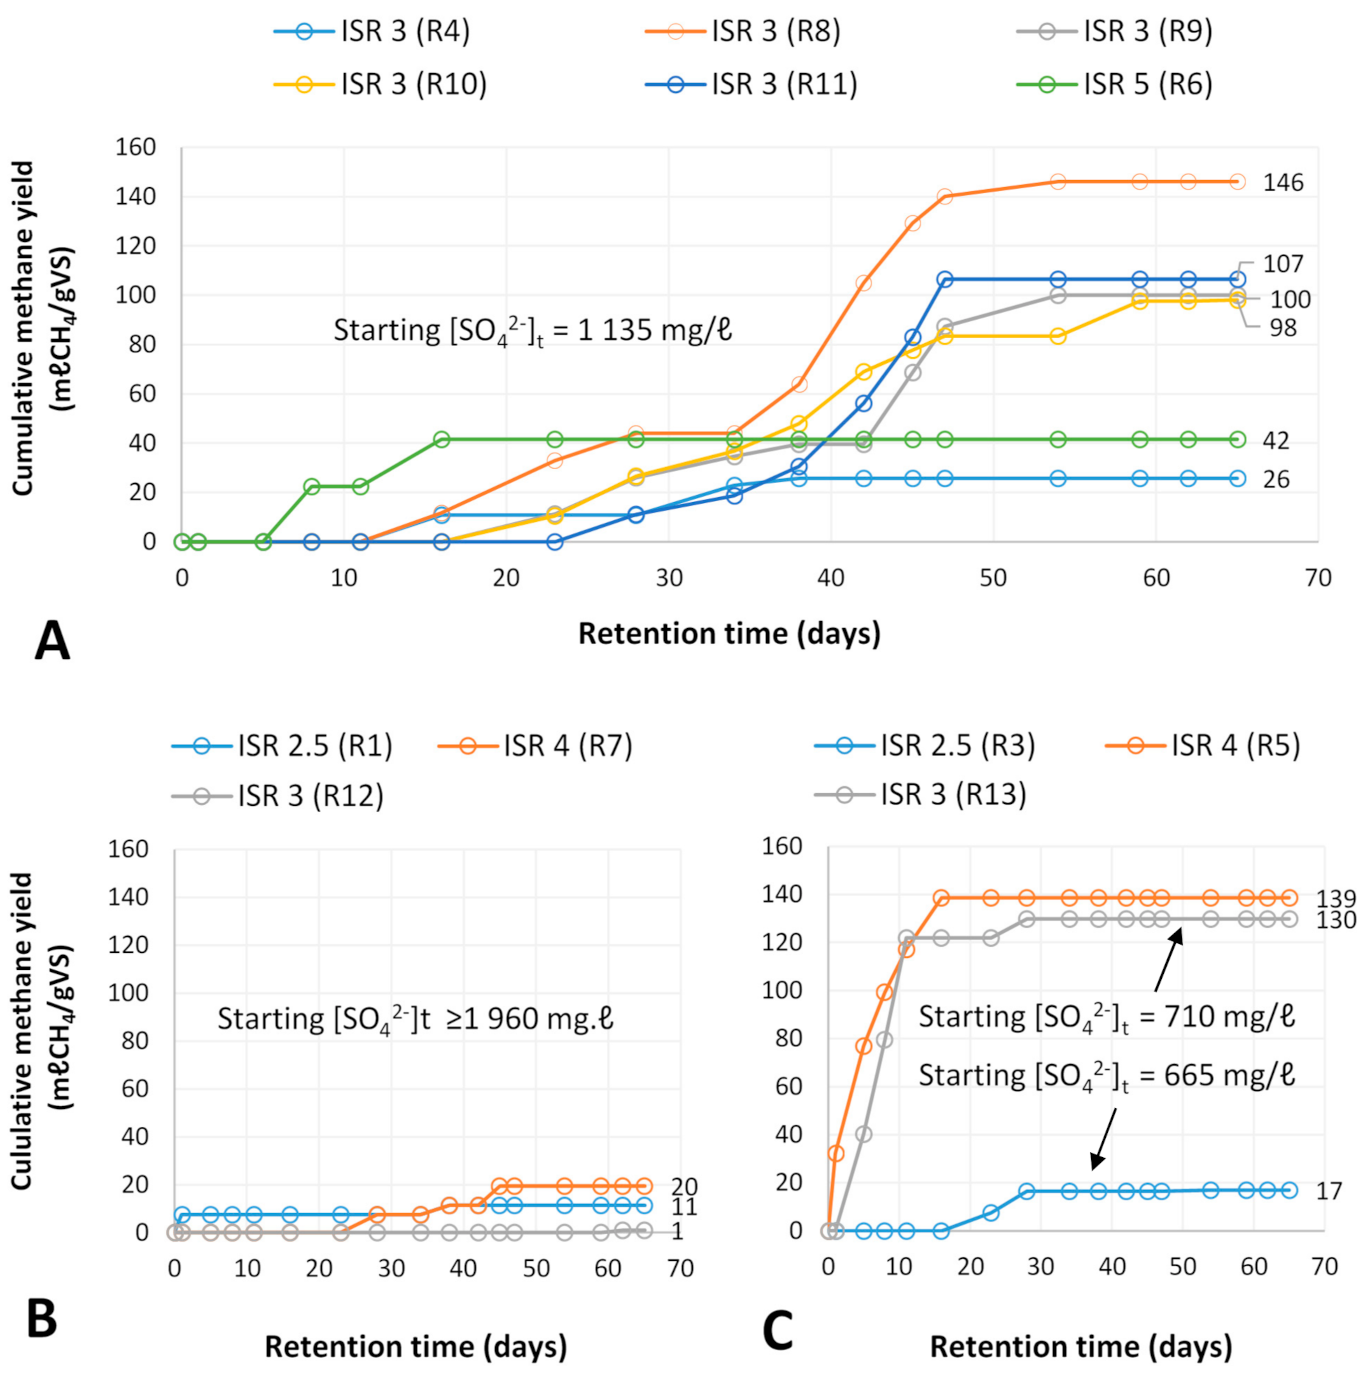
Cumulative methane yields of reactors operating at different sulfate concentrations and inoculum to substrate ratios, (A): sulfate concentrations = 1135 mg/L, (B): sulfate concentration ≥ 1960 mg/L, (C): sulfate concentrations = 665 and 710 mg/L.
In the reactors with ≥ 1960 mg/L (i.e., above the range expected in the OTE from the study site), methanogenesis was severely inhibited at all ISRs (Figure 1B). However, at ISR ≥ 3 and ≤ 710 mg/L (mid concentration range from study site), no lag phase was experienced, and more than 92% of the cumulative generation of 130–139 mL was obtained within 10 days of operation (Figure 1C). These results are very promising and strongly suggest that by optimizing the sludge recycle ratio and/or SRT, efficient AD can be achieved, provided the concentration is kept below a particular (high) threshold. Further experiments need to be conducted to optimize these, and other factors (such as mixing), in continuous or semi-continuous systems.
3.2.2. Hydrolysis and pH Changes
The lack of generation in some of the reactors in the first 15 days reflected poor or absent methanogenic activity, but not necessarily a lack of other metabolic processes. Analysis of selected physicochemical parameters of the reactor contents established that hydrolysis, acidogenesis and acetogenesis took place.
It was assumed that the primary mechanism for release (76–89% increase after 20 days), was protein hydrolysis. The overall increase in VOA in some reactors, and 38–80% reduction in FOG clearly indicated that hydrolysis of lipids also occurred. The concentration in samples taken at day 0 and at day 20 in all reactors fell above the minimum inhibitory concentration (MIC) reported in literature for AD (53 mg/L; [29]), but fell well below this MIC at the end of the study (day 62). Temporal increases (25–147%) between day 0 and day 20 were observed in reactors operating at higher ISRs (>2.5) and/or lower ≤ 1335 mg/L, while decreases (5–51%) were observed for reactors operating at lower ISRs ≤ 2.5 and/or higher ≥ 1335 mg/L. The pH in the reactors remained largely within the optimal range for methanogens over the first 20 days. However, values measured in all reactors at the end of the study were slightly higher than the optimal range (6.5–8.0) [30]. Buffering capacity provided by high / concentration probably compensated to some extent for the initial high VFA:ALK of the reactor contents.
In terms of VFA:ALK, initial ratios (>0.4) suggested that potentially unstable operational conditions for methanogenesis existed during start-up, which stabilized after 20 days (<0.3–0.4) in all reactors with the exception of R3 and R12 which generated minimal . There was a notable increase in alkalinity, suggesting microbial utilisation of in the reactors, for example by oxidising homoacetogens, chemolithotrophic sulfur oxidising bacteria (SOB), and/or hydrogenotrophic methanogens (HMs).
3.2.3. Acidogenesis, Acetogenesis and Changes in Volatile Organic Acid Concentration
The initial and final VOA concentrations in R1 and R12 increased by 16% and 17%, respectively. In contrast, decreases ranging from 7% to 60% were noted in other reactors. Together with changes in the VOA, was reduced to , suggesting that both acidogenesis and acetogenesis occurred during the lag phase. The accumulation of VOA in the two reactors (R1 and R12) operating at high ≥ 1960 mg/L and ISR ≤ 3 suggested the involvement of SRB in the breakdown of complex substrates.
The VOA concentration at any point in time depends on the balance between the breakdown of the products of hydrolysis into VOA by acidogens, and utilization of the VOA by acetogens and/or aceticlastic methanogens. Increased VOA concentrations could therefore be attributed to inhibition of the latter two metabolic groups. In contrast, decreased VOA concentrations could be attributed to either inhibition of acidogens (decreased formation) and/or efficient acetogenic/methanogenic activity (utilization). High partial pressures greater than 10−4 atmospheres are also known to inhibit propionate (HPr), butyrate (HBu), and ethanol degrading acetogens [31].
Lipid inhibition may have occurred in R1, R2 and R12, which may have led to decreased acidogenesis and/or acetogenesis and subsequent accumulation of VOA.
3.2.4. Sulfidogenesis, Sulfite Oxidation and Methanogenesis
Notable reductions in occurred in all the reactors over the study period, with concomitant increases in over the first 20 days of operation. It was assumed that sulfidogenesis was largely responsible for the simultaneous increase in and reduction in , and that SRB dominated not only generation, but also contributed to organic substrate utilization. Furthermore, at pH > 8, is solubilized to , such that as the pH increased in the reactors, some of the may have precipitated with metals. This can reduce direct toxicity on functional microbial species, but it can also reduce the bioavailability of essential methanogenic micronutrients. The concentrations measured at day 20 fell within the inhibitory range (IC50 43–125 mg/L at pH 7–8) for methanogenesis [32].
Nonetheless, it was apparent that about 43–96% of the formed from sulfidogenesis was oxidized into elemental sulfur () as a white layer was formed at the interface of the bulk liquid and head space in the reactors. This phenomenon has been described by Sabumon [33,34], whom observed the formation of as the main intermediary product of and oxidation during treatment of TWW. Moraes [35] reported that may be re-formed by oxidation of thiosulfate () and elemental . This may have been the case with R1 and R2 where a 91% reduction in by day 20 was followed by 99% increase by day 62. Chemolithotrophic SOB can simultaneously reduce oxidized N compounds ( and ) and oxidize under anoxic conditions (Equation (1) to Equation (4)). Other inorganic reduced S compounds such as and can also be used as electron donors by SOB. In this study, the notable decrease in the between day 20 and day 62 in the reactors supports denitrification having occurred, which would have made and available as electron donors for SOB. Furthermore, consumption of by SOB could explain the anomalous increase in alkalinity in all reactors, except R5 and R8. However, due to the complexity of the physicochemical and biological processes, detailed mass balances for S were not determined.
The COD: ratios were consistently <10, suggesting that sulfidogenesis would be favored over methanogenesis. It was therefore hypothesized that (i) methanogenesis was favored in reactors R5 and R13 where no lag phase for generation was experienced (ISR ≥ 3 and ≤ 710 mg/L), (ii) sulfidogenesis initially dominated, followed by methanogenesis in the reactors that generated after lag phases, and (iii) sulfidogenesis was favored, and methanogenesis was severely and continually inhibited in reactors with high of ≥ 1960 mg/L (R1, R7, R12). This was supported by qualitative analysis of the biogas from R1 (230 mL biogas: 78 ppm , 0.1% , 0% ). It was hypothesised that the physicochemical and biological milieu in R1 and R12 inhibited aceticlastic methanogens (AMs) and/or acetogens, leading to an accumulation of VOA between day 20 and day 62, which exacerbated methanogenic inhibition.
The results strongly suggested that SRB played a key role in the syntrophic degradation of hydrolysis metabolites and VOAs in most of the reactors. This could in turn have led to the dominance of HMs after the lag phase, which was suggested by the (>1) for the reversible inhibited reactors [36]. It was conclusively established that ≥ 1960 mg/L caused almost complete methanogenic inhibition, while no inhibition occurred when reactors were operated at ≤ 710 mg/L and ISR ≥ 3. Furthermore, both reactors that were operated at the lowest ISR (=2.5) were almost completely inhibited, suggesting that the initial methanogenic population density was too low to become established in that particular environment.
3.2.5. Metal Inhibition or Stimulation and Macronutrient Limitation
Depending on the speciation and concentration, bioavailable metals and other ions may either promote or inhibit methanogenesis. In this study, the concentrations of all the essential metals decreased, except for Ni in R1, R5, R7, R11, R12, and R13. More holistically, the concentrations of most soluble metals decreased in the reactors, except for R7 and/or R12. In contrast Ca increased concurrently with a decrease in VOA, , and except in R2, R7, and R12 that operated at high concentrations and/or lower ISR. Interestingly, the same reactors exhibited a low yield and experienced longer lag phases. This supports the observed flocs in the different reactors which may have formed in an effort to adapt and prevent metal toxicity or deficiency through excretion of extracellular polymeric substances and soluble microbial products [25].
It is plausible that inhibition was initially caused by , followed by , , and/or nutrient limitation. The C:N range was below optimal in all reactors at the beginning and end of the study. The initial C:N:P ratios ranged from 280:37:1 to 111:26:1, indicating both N and P were limiting macronutrients. However, although there was a notable reduction in concentration, bioavailable (soluble) P was still present at day 62. Furthermore, the that was generated may have reduced the bioavailability of inhibitory and/or stimulatory micronutrients via precipitation [16]. The precipitates may have further reversibly inhibited functional microorganisms by blocking their access to substrates [37].
3.3. Optimisation of Cumulative Methane Yield and Anaerobic Biodegradability
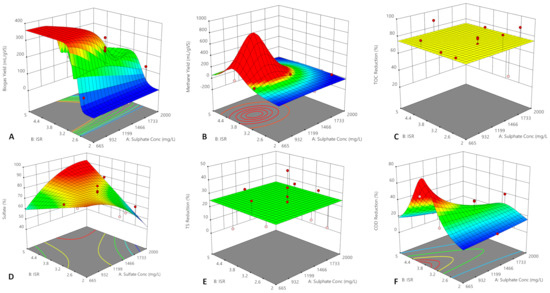
The experimental gas yields ( and biogas) and (% reduction of TOC, TS, VS, COD) (Table 2) were modelled using linear equations and quadratic polynomials with up to second degree interaction terms (Figure 2).
Figure 2.
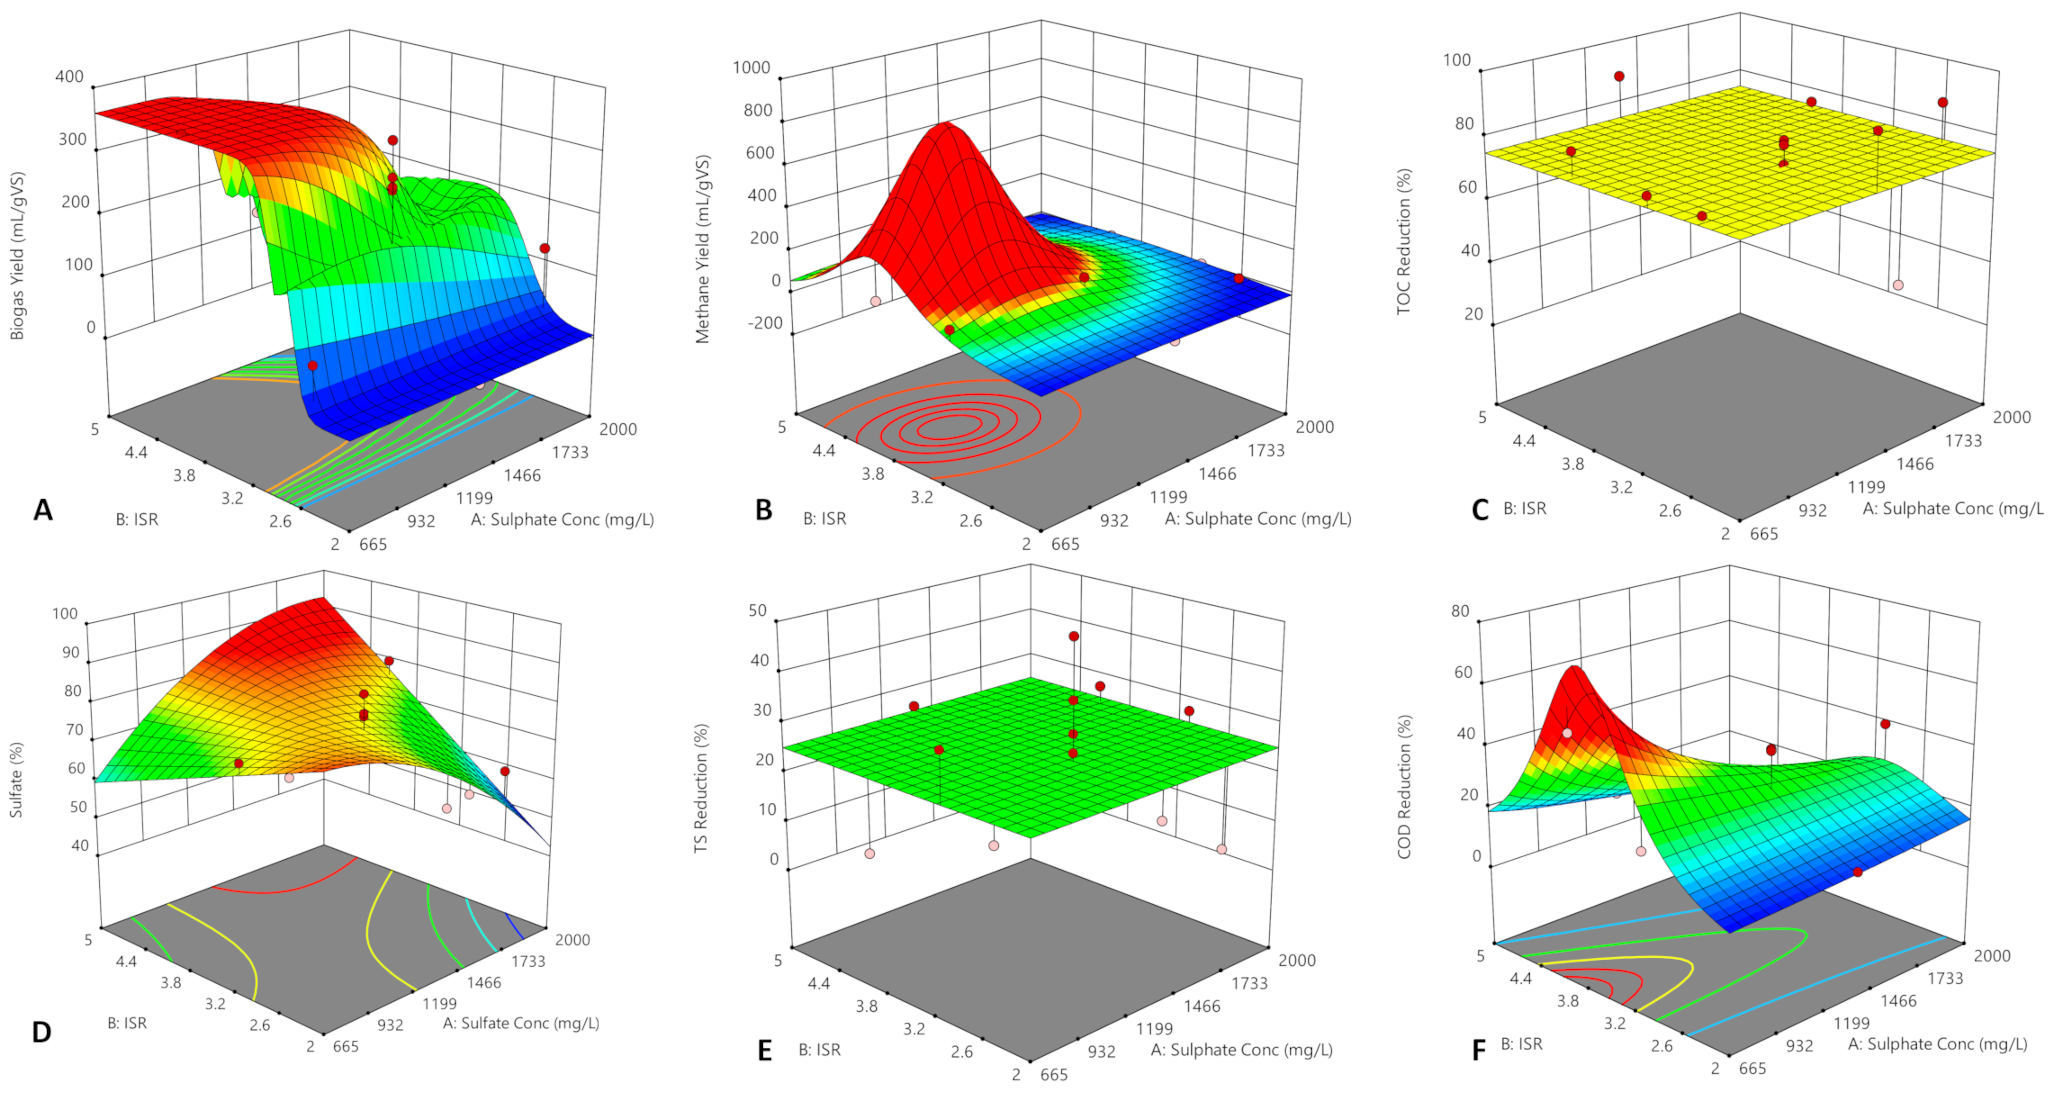
Effect of sulfate concentration and inoculum to substrate ration on: (A)—biogas yield; (B)—cumulative methane yield; (C)—total organic carbon reduction; (D)—total solids reduction; (E)—volatile solids reduction; and (F)—COD reduction during anaerobic digestion of ostrich slaughterhouse-tannery effluent.
The models (Equations (5)–(11)) were significant (F test, p < 0.05) and there was only 0.12–3.20% probability that this may have been caused by natural system variation (Table 3). The F test showed that ISR and and their interaction ISR2, ()2 and ISR() were all significant (p < 0.05) model terms for biogas yield, while ISR and its interaction with (ISR()) were the only non-significant terms (F test, p > 0.05) on yield. The interaction of both factors ISR () was the only significant factor (F test, p < 0.05) on sulfate reduction whilst () and its interaction ()2 were the only significant factors (F test, p < 0.05) affecting COD reduction (Table 3). Nonetheless, both factors were significant in achieving the maximization of gas yields and Bo. The correlation coefficients (R2) of the models (Table 3) indicated that only 13.3%, 23.2%, 29.1%, and 16.1% of the variability in biogas yield, yield, % and %COD reduction was not explained by the models, respectively. The models’ adj. R2 values were 0.81, 0.61, 0.55, and 0.76, respectively, suggesting moderate to good predictability of the gas yields and Bo.
Table 3.
Summary of the statistical results of the fitted models.
In contrast, the general quadratic polynomial and linear equations did not fit the %TOC, %VS, and %TS reduction data very well (adj R2 ≤ 0.28) and returned negative predicted R2. This indicated that the overall mean better predicted Bo (Stat-Ease, Inc., Minneapolis, MN, USA). This is in agreement with the observation that regardless of inhibition of generation, other processes occurred. Therefore, Equations (5)–(11) were used to simulate and optimize the Bo and cumulative gas yields as plotted in Figure 2.
The cumulative yields and the average % varied from 0 to 146 mL/gVS and 9.3% to 44.8%, respectively. The corresponding reduction efficiencies were (49.3–85.3%), TOC (23.2–93.1%), VS (15.2–55.0%), TS (11.5–49.2%), and COD (10.8–52.0%) (Table 2). The yields were compared to the controls (inoculum only) and corrected yield reported. Based on the interest to maximize yield and Bo, the theoretical optimum operating conditions were found to be at = 922 mg/L and ISR = 3.72 with a desirability of 0.65. These optimum conditions are expected to generate 361 mL biogas/gVS, 235 ML /gVS and reduction efficiencies of 27.5% VS, 27.4% TS, 75.1% TOC, 75.6% , and 41.1% COD. This implies that the mass of sludge will be reduced by about 27% (dry mass) and by 76%, with a fraction of it recovered as .
The yields obtained in this study (Table 2) were comparable to those obtained by Vazifehkhoran et al. [38] and higher than those reported by Agustini et al. [39] and Saxena et al. [27]. However, Achouri et al. [28] reported higher gas yields and no lag phase, presumably due to the higher dilutions (34% and 53%) using tap water, uncorrected gas yields, addition of micronutrients and use of a blend of tanyard and beamhouse effluent. Interestingly, Mpofu et al. [6] operated 0.5 L batch reactors at = 494–562 mg/L, 37 ± 2 °C, pH = 7.0 ± 0.5 and ISR (=4) while codigesting TWAS and SHS (50% v/v). The authors reported biogas yields of 333–431 mL/gVS, yield of 170–215 mL /gVS, 50–53% (average), and Bo of 54.4–68.5% VS, 45.5–50.7% TS and 43.2–48.2% COD. The %COD reduction achieved in this study were lower compared to other studies using ASBR and other continuous reactors (UASB, UAFFB, UAFBR, SAnMBR, and UACF) [7]. They were however in the same range with 45%, 56%, 45%, and 43%, accomplished by Achour et al. [28], Berhe et al. [15], Daryapurkar et al. [40], and Saxena et al. [27] respectively, using batch reactors.
3.3.1. Water Reuse
The resulting treated OTE met the stipulated wastewater limit values applicable for the irrigation of land with up to 50 and 500 m3/day. However, treated OTE did not meet the limit values for irrigating with 2000 m3/day in terms of SS, COD, , and Cl [41]. This can be mitigated by mixing treated OTE and tap water at an optimised volumetric ratio that meets the irrigation standard. Maqboo et al. [42] concluded that irrigating with 50:50 (v/v) tap water and TWW might be a sustainable alternative for increasing vegetable growth.
3.3.2. Correlative Analysis of Variables on Methane Yield and Anaerobic Biodegradability
There was a weak linear insignificant relationship (r ≤ −0.29, (F test, p > 0.05)) between and %solids reduction. Similarly, ISR did not linearly correlate with Bo (TS, COD, and TOC), average % and yield (−0.16 ≤ r ≤ 0.12, (F test, p > 0.05)). There was a strong significant positive linear correlation (r = 0.71, (F test, p < 0.05)) between ISR and %VS reduction, while weak insignificant negative linear relationships (−0.29 < r ≤ −0.21, (F test, p > 0.05)) existed between with %COD and %TOC reduction and ISR with biogas yield and % reduction (0.31 ≤ r ≤ 0.34, (F test, p > 0.05)). Mpofu et al. [10] also reported a lack of correlation (r < 0.19, (F test, p > 0.05)) between ISR and %solids reduction, strong positive correlation (r = 0.84, (F test, p < 0.05)) with gas yields and a moderate positive correlation (r = 0.46, (F test, p > 0.05)) with %COD reduction. A moderate negative linear relationship (−0.39 < r ≤ −0.53, (F test, p > 0.05)) existed between with % reduction, average %, biogas and yield. These results confirm that (i) high promoted sulfidogenesis over methanogenesis, which negatively affected gas yields, (ii) gas yields and removal could be improved by decreasing the influent to around 922 mg/L and increasing the ISR to 3.7, and (iii) the strong significant linear relationship between % reduction with %TS (r = 066, (F test, p < 0.05)) and %VS (r = 0.64, (F test, p < 0.05)) reduction indicated the importance of SRB in degrading hydrolysis products. This may have created a better environment for the hydrolytic bacteria.
3.4. Kinetic Study of Cumulative Methane Production
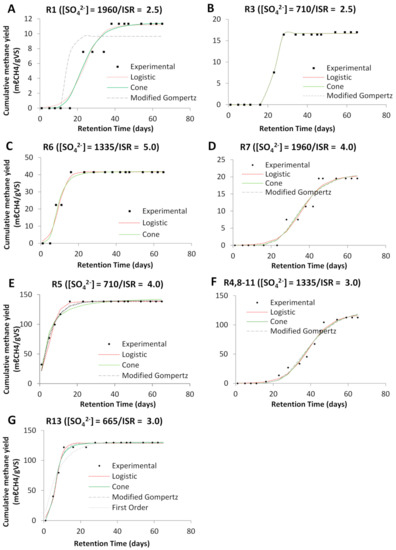
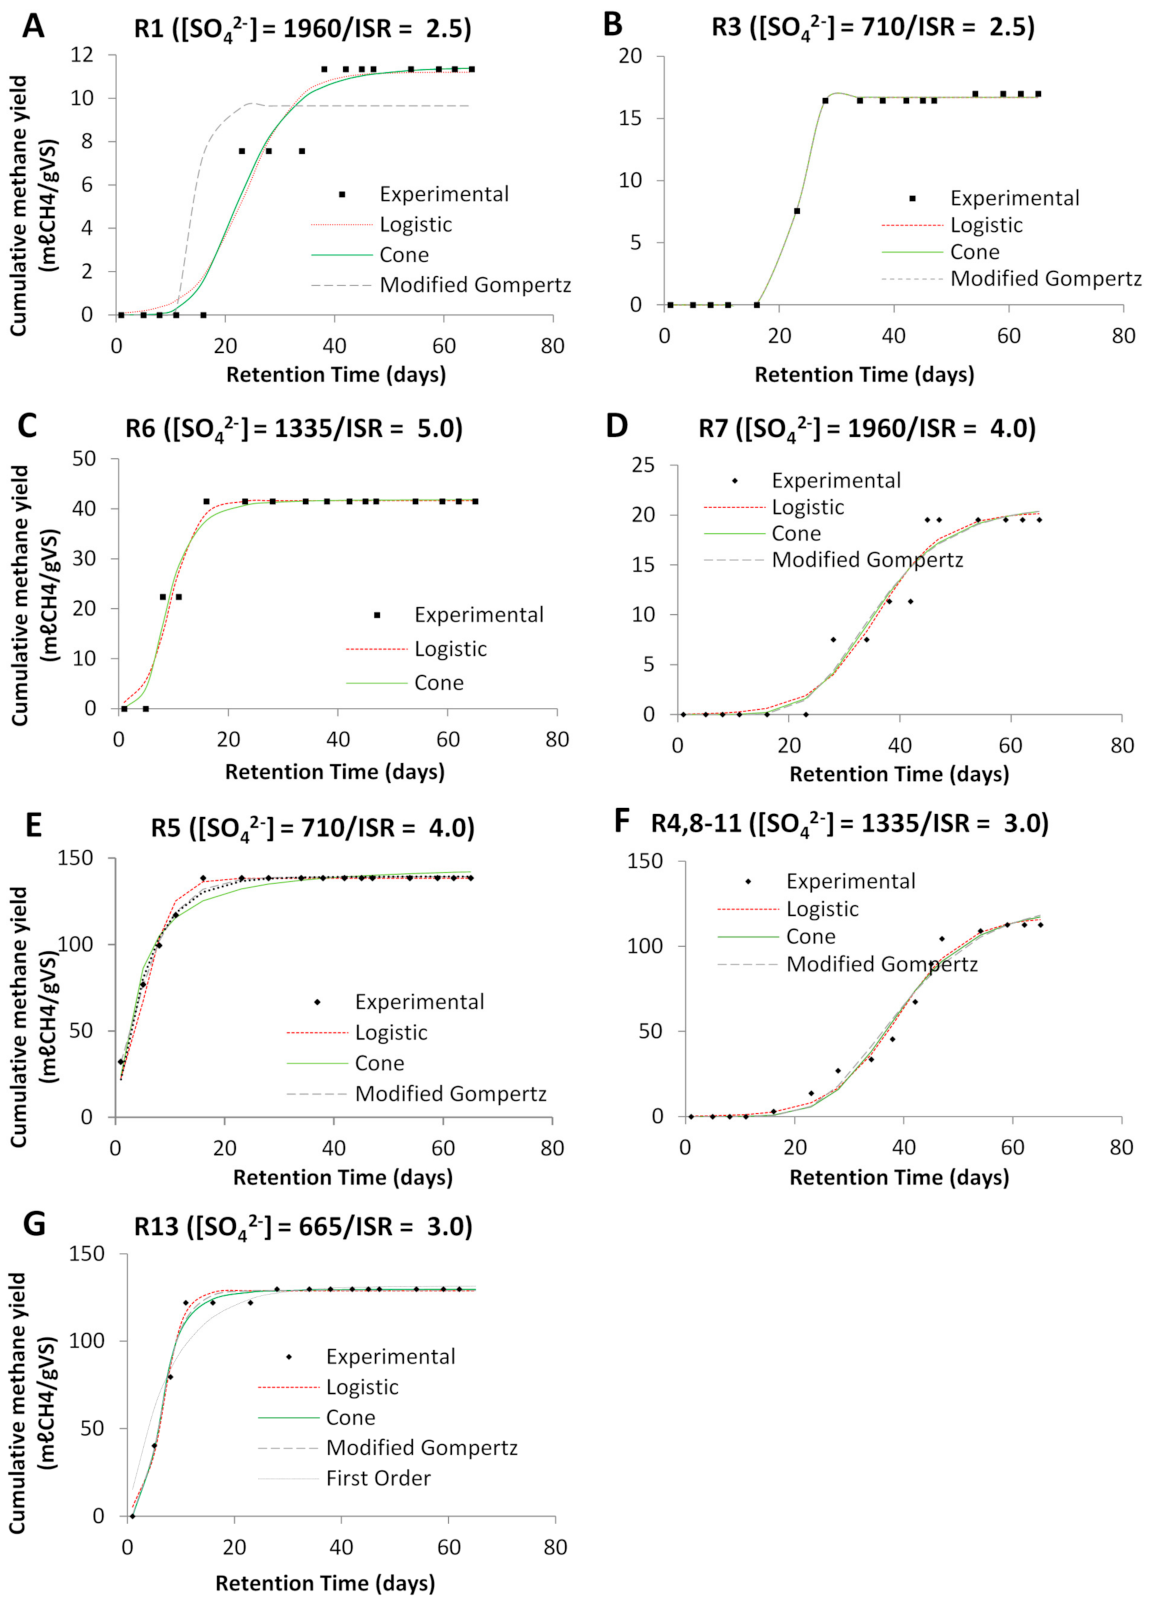
There is a lack of studies that report on the AD kinetics while treating TWW and worse for OTE. In order to evaluate the performance and the kinetics of the BMP experiment, the modified Gompertz, logistic, first order, and cone models were fitted onto the cumulative yield data (Table 3) using non-linear regression. The models displayed a perfect fit to the cumulative yields with high precision in the order Logistic > Cone > modified Gompertz > first order (Figure 3, Table 4).
Figure 3.
Graphs depicting the experimental and model curves for cumulative methane yields for reactors operating at different sulfate concentrations and ISR, respectively. (A): 1960 mg/L and 2.5, (B): 710 mg/L and 2.5, (C): 1335 mg/L and 5, (D): 1960 mg/L and 4, (E): 710 mg/L and 4, (F): 1335 mg/L and 3, (G): 665 mg/L and 3 (note the different scales on the y axes).
Table 4.
Kinetic parameters and goodness of fit obtained from evaluated models.
According to the statistical parameters (Table 4), the first order model was the worst predictor (Adj R2 = 0.437–0.763) for most reactors that experienced a lag phase except for R5 (Adj R2 = 0.984), R6 (Adj R2 = 0.883) and R13 (Adj R2 = 0.939) that experienced shorter lag phases of 3 to 6 days. The exponential–plateau curve displayed by the first order model accurately fits data without or with short lag phases. The first order model predicted the lowest kinetic values for maximum microbial specific growth rate (µm). In contrast, the rest of the models best fitted (0.827 ≤ Adj R2 ≤ 0.999) reactors with long lag phases of 14 to 35 days as they display a sigmoidal shape with lag, exponential and stationary phases. However, the modified Gompertz model yielded the highest lag phases (λ) and significantly under predicted the ultimate yields (A) by >63%. The cone (Adj R2 = 0.960–0.999) and logistic (Adj R2 = 0.956–0.985) models gave better approximations of the kinetic constants.
The range of the kinetic constants: A, µm, K and λ obtained in this study were 11.2–139 mL/gVS, 0.171–17.5 mL /gVSd, 0.025–0.27 day−1 and 0–35 days, respectively. The highest K and µm were found in reactors R5 and R13 operating at lower of 710 and 665 mg/L and ISR of 4 and 3, respectively. This confirms that from the range of parameters tested, higher ISR and low provided the most ideal environment for proliferation of methanogens. The production μm = 0.015–17.5 mL /gVSd obtained in this study were comparable to μm = 2.04–5.48 mL /gVSd reported by Sri Bala Kameswari et al. [14], and μm = 0.08–5.49 reported by Mpofu et al. [19] for AD of tannery sludge. Furthermore, they were similar to μm = 6.0–18.1 mL /gVSd reported by Mpofu et al. [6] while co-digesting TWAS and SHS. The K values in this study were higher than K = 0.0185–0.0239 d−1 reported by Thangamani [43,44] during the AcoD of tannery sludge and solid wastes and K = 0.008–0.14 day−1 reported by Mpofu et al. [6,19] during the mono and AcoD of TWAS and SHS, respectively. Generally, low K values indicate efficient AD similar to natural systems that operate under slow but steady reaction rates [45]. This study proved the advantage of liquid (wet/low solids) over solid (dry/high solids) AD and the synergistic effect of AcoD of OTE with SWW. Nonetheless, there is a need for more studies on the kinetics of AD of TWW.
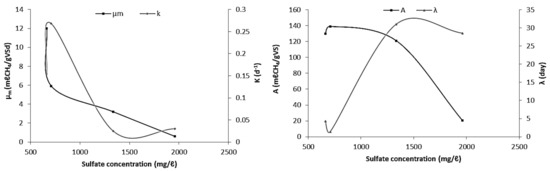
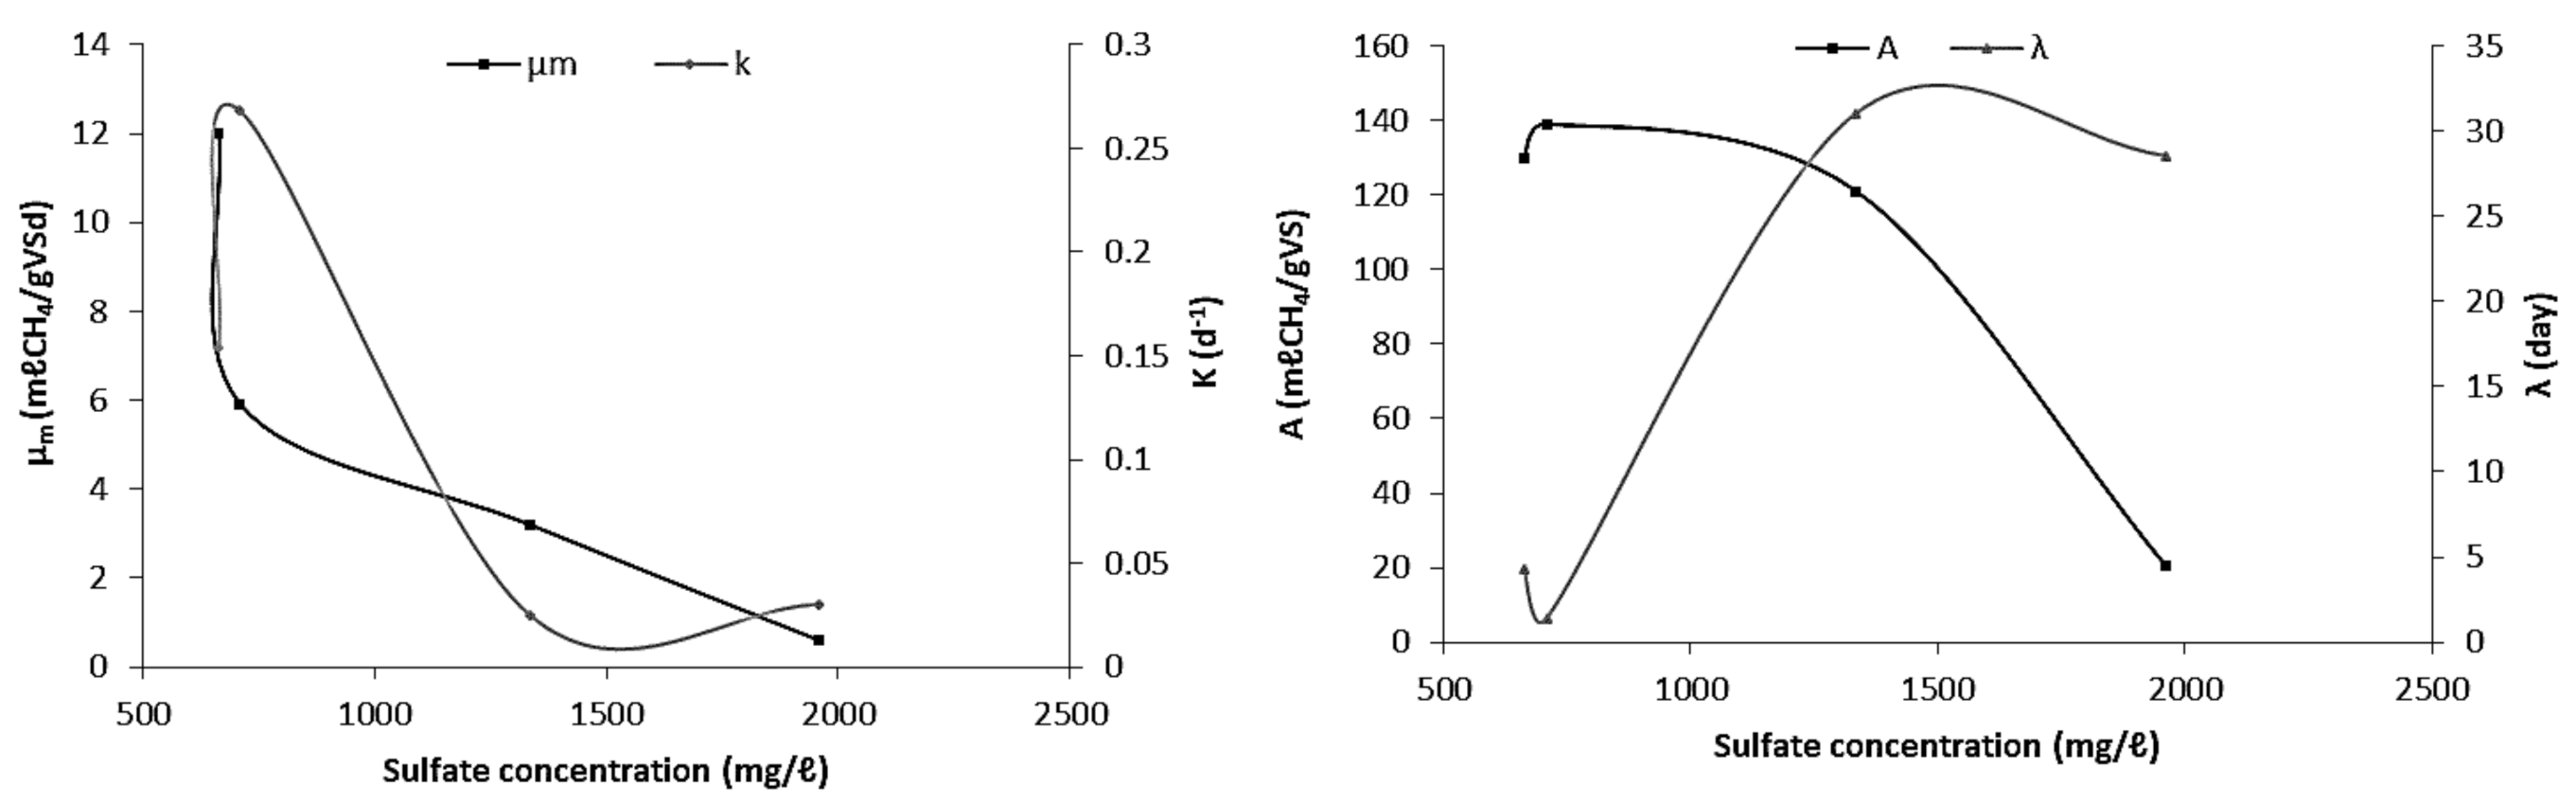
In order to understand the influence of ISR and on the process kinetics, reactors operating at the same ISR and same were analyzed. For reactors operating at constant ISR, an increase in led to a significant (ANOVA, p < 0.05) decrease in A, µm and K, and a significant (ANOVA, p < 0.05) increase λ due to the inhibitory effect of S species on methanogenesis. In contrast, an increase in led to a 34% decrease in λ and a constant K while operating at lower ISR (=2.5). Moderate to strong negative linear correlation existed between with µm (r = −0.74), K (r = −0.61) and A (r = −0.60). In reactors operating at near optimal ISR (=3–4), increases in from 665 to 710, 710 to 1335 and 1335 to 1960 mg/L led to an increase in A and K with a decrease in µm and λ; decrease in A, K and µm with an increase in λ; and an increase in K with a decrease in A, µm, and λ respectively (Figure 4). The results demonstrated a non-monotonic relationship between process parameters and kinetics. Therefore, the optimal that promoted a higher A, K, and µm and lower λ was determined to be 922 mg/L at ISR = 3.7 (Section 3.3).
Figure 4.
Correlation between kinetic parameters with influent sulfate concentrations for reactors operating at near optimum inoculum to substrate ratio (3.0–4.0).
Generally, AD process instability is caused by a metabolic imbalance between acidogenesis and methanogenesis and/or sulfidogenesis. In order to understand the hydrolytic-methanogenic balance, it was important to study the relationship between K and μm by converting the units of μm to d−1. The K/μm ratio was >1.0 in all reactors, showing that the rate of hydrolysis rate was faster than methanogenesis rate, and the imbalance increased (r = 0.65, (F test, p < 0.05)) with . This consolidates the hypothesis that hydrolysis and acidogenesis proceeded faster than methanogenesis (Section 3.2.4). Thus, methanogenesis was the rate limiting step in this study.
3.5. Conclusions
Efficient AD of OTE is capable of reducing solids by up to 49% (dry mass) while recovering irrigation water, elementary sulfur, and up to 146 mL /gVS. Methanogenic activity was highest (K = 13.4–17.5 and µm = 0.15–0.27) when reactors were operated at ISR ≥ 3 and/or lower ≤ 710 mg/L while high ≥ 1960 mg/L and ISR < 3.0 caused almost complete inhibition regardless of corresponding ISR and . It is acknowledged that while will vary by tannery, and on a temporal basis at each tannery, concentrations measured in this study were ideal for AD and resource recovery. This presents integrated tanneries and slaughterhouses as potential biorefineries that can promote the sustainable economic development of developing countries.
Author Contributions
Conceptualization, project administration, A.B.M., O.O.O., and P.J.W.; data curation, methodology, validation, visualization, all authors; formal analysis, writing—original draft, A.B.M.; investigation, A.B.M., V.A.K., and W.M.K.; funding acquisition, supervision, O.O.O. and P.J.W.; writing—review and editing, A.B.M. and P.J.W.; resources, P.J.W. All authors have read and agreed to the published version of the manuscript.
Funding
This research was funded by the Water Research Commission of South Africa (Project K5/2471/3) and the Cape Peninsula University Technology Research Fund (URF R103). The APC was funded by the Faculty of Engineering at Cape Peninsula University Technology.
Institutional Review Board Statement
Not Applicable.
Informed Consent Statement
Not Applicable.
Data Availability Statement
The data presented in this study is available upon request from the corresponding author. It is not currently available publicly.
Acknowledgments
The authors would like to thank the funders of this project. The contents of the manuscript do not necessarily reflect the views and policies of the funding organizations. The authors would also like to thank Gareth Holtman for assistance in setting up the gas sampling apparatus of the reactors.
Conflicts of Interest
The authors declare no conflict of interest.
Abbreviations
| A | ultimate methane yield |
| Alk | total alkalinity |
| ANOVA | Analysis of variance |
| BOD | biological oxygen demand |
| CH4 | methane |
| C/N | carbon to nitrogen ratio |
| H2 | hydrogen |
| H/SRT | hydraulic/solid retention time |
| K | rate constant |
| NH3/NH4 | ammonia/um |
| Pb | lead |
| sulfate | |
| TKN | total Kjeldahl Nitrogen |
| TOC | total organic carbon |
| TWAS | tannery waste activated sludge |
| T/VS | total/volatile solids |
| AAE | acetic acid equivalents |
| AMs | aceticlastic methanogens |
| Bo | biodegradability |
| CCD | central composite design |
| Cl | chloride |
| Cu | copper |
| HMs | hydrogenotrophic methanogens |
| ISR | inoculum to substrate ratio |
| Mg | magnesium |
| Ni | nickel |
| r | Pearson’s correlation |
| SRB | sulfate reducing bacteria |
| TL | tanning liquor |
| TP | total phosphate |
| TWW | tannery wastewater |
| UACF | upflow anaerobic contact filter |
| AD/AcoD | anaerobic digestion/codigestion |
| ASBR | anaerobic sequencing batch reactor |
| BMP | biochemical methane potential |
| Ca | calcium |
| COD | chemical oxygen demand |
| Fe | iron |
| sulfide species | |
| IOT | integrated ostrich tannery |
| Na | sodium |
| OLR | organic loading rate |
| S0 | elementary sulfur |
| SWW | slaughterhouse wastewater |
| TN | total nitrogen |
| TS | total solids |
| TWWTP | TWW treatment plant |
| UASB | upflow anaerobic sludge blanket |
References
- Buljan, J.; Král, I. The Framework for Sustainable Leather Manufacture; UNIDO: Vienna, Austria, 2015; pp. 1–203. [Google Scholar]
- Buljan, J.; Král, I. Introduction to Treatment of Tannery Effluents; UNIDO: Vienna, Austria, 2011; pp. 1–69.
- Kanagaraj, J.; Velappan, K.C.; Babu, N.K.C.; Sadulla, S. Solid Wastes Generation in the Leather Industry and Its Utilization for Cleaner Environment: A Review. J. Sci. Ind. Res. 2006, 65, 541–548. [Google Scholar] [CrossRef] [Scilit]
- Akyol, Ç.; Demirel, B.; Onay, T.T. Recovery of Methane from Tannery Sludge: The Effect of Inoculum to Substrate Ratio and Solids Content. J. Mater. Cycles Waste Manag. 2014, 17, 1–8. [Google Scholar] [CrossRef] [Scilit]
- Buljan, J. Costs of Tannery Waste Treatment. In Leather and Leather Products Industry Panel; UNIDO: Leon, France, 2005; pp. 1–25. [Google Scholar]
- Mpofu, A.B.; Oyekola, O.O.; Welz, P.J. Co-Digestion of Tannery Waste Activated Sludge with Slaughterhouse Sludge to Improve Organic Biodegradability and Biomethane Generation. Process Saf. Environ. Prot. 2020, 131, 235–245. [Google Scholar] [CrossRef] [Scilit]
- Mpofu, A.B.; Oyekola, O.O.; Welz, P.J. Anaerobic Treatment of Tannery Wastewater in the Context of a Circular Bioeconomy for Developing Countries. J. Clean. Prod. 2021, 296, 126490. [Google Scholar] [CrossRef] [Scilit]
- American Public Health Association; American Water Works Association; Water Environment Federation. Standard Methods for the Examination of Water and Wastewater, 23rd ed.; Baird, R., Bridgewater, L., Rice, E., Eds.; American Public Health Association; American Water Works Association; Water Environment Federation: Washington, DC, USA, 2017.
- Holliger, C.; Alves, M.; Andrade, D.; Angelidaki, I.; Astals, S.; Baier, U.; Bougrier, C.; Buffière, P.; Carballa, M.; De Wilde, V.; et al. Towards a Standardization of Biomethane Potential Tests. Water Sci. Technol. 2016, 74, 2515–2522. [Google Scholar] [CrossRef] [Scilit]
- Mpofu, A.B. Optimisation of the Anaerobic Treatment of Secondary Tannery Sludge for Biogas Production and Solids Reduction; Cape Peninsula University of Technology: Cape Town, South Africa, 2018. [Google Scholar]
- Angelidaki, I.; Sanders, W. Assessment of the Anaerobic Biodegradability of Macropollutants. Rev. Environ. Sci. Biotechnol. 2004, 3, 117–129. [Google Scholar] [CrossRef] [Scilit]
- Zhang, R.; El-Mashad, H.M.; Hartman, K.; Wang, F.; Liu, G.; Choate, C.; Gamble, P. Characterization of Food Waste as Feedstock for Anaerobic Digestion. Bioresour. Technol. 2007, 98, 929–935. [Google Scholar] [CrossRef] [Scilit]
- Bhattacharya, P.; Roy, A.; Sarkar, S.; Ghosh, S.; Majumdar, S.; Chakraborty, S.; Mandal, S.; Mukhopadhyay, A.; Bandyopadhyay, S. Combination Technology of Ceramic Microfiltration and Reverse Osmosis for Tannery Wastewater Recovery. Water Resour. Ind. 2013, 3, 48–62. [Google Scholar] [CrossRef] [Scilit]
- Sri Bala Kameswari, K.; Kalyanaraman, C.; Umamaheswari, B.; Thanasekaran, K. Enhancement of Biogas Generation during Co-Digestion of Tannery Solid Wastes through Optimization of Mix Proportions of Substrates. Clean Technol. Environ. Policy 2014, 16, 1067–1080. [Google Scholar] [CrossRef] [Scilit]
- Berhe, S.; Leta, S. Anaerobic Co-Digestion of Tannery Waste Water and Tannery Solid Waste Using Two-Stage Anaerobic Sequencing Batch Reactor: Focus on Performances of Methanogenic Step. J. Mater. Cycles Waste Manag. 2018, 20, 1468–1482. [Google Scholar] [CrossRef] [Scilit]
- Appels, L.; Lauwers, J.; Degrve, J.; Helsen, L.; Lievens, B.; Willems, K.; Van Impe, J.; Dewil, R. Anaerobic Digestion in Global Bio-Energy Production: Potential and Research Challenges. Renew. Sustain. Energy Rev. 2011, 15, 4295–4301. [Google Scholar] [CrossRef] [Scilit]
- Buyukkamaci, N.; Filibeli, A. Volatile Fatty Acid Formation in an Anaerobic Hybrid Reactor. Process Biochem. 2004, 39, 1491–1494. [Google Scholar] [CrossRef] [Scilit]
- Gao, S.; Zhao, M.; Chen, Y.; Yu, M.; Ruan, W. Tolerance Response to in Situ Ammonia Stress in a Pilot-Scale Anaerobic Digestion Reactor for Alleviating Ammonia Inhibition. Bioresour. Technol. 2015, 198, 372–379. [Google Scholar] [CrossRef] [Scilit] [PubMed]
- Mpofu, A.B.; Welz, P.J.; Oyekola, O.O. Anaerobic Digestion of Secondary Tannery Sludge: Optimisation of Initial PH and Temperature and Evaluation of Kinetics. Waste Biomass Valorization 2020, 11, 873–885. [Google Scholar] [CrossRef] [Scilit]
- Chen, Y.; Cheng, J.J.; Creamer, K.S. Inhibition of Anaerobic Digestion Process: A Review. Bioresour. Technol. 2008, 99, 4044–4064. [Google Scholar] [CrossRef] [Scilit] [PubMed]
- Guerrero, L.; Chamy, R.; Jeison, D.; Montalvo, S.; Huiliñir, C.; Guerrero, L.; Chamy, R.; Jeison, D.; Montalvo, S. Behavior of the Anaerobic Treatment of Tannery Wastewater at Different Initial PH Values and Sulfate Concentrations. Environ. Sci. Heal. 2013, 48, 1073–1078. [Google Scholar] [CrossRef] [Scilit]
- Deublein, D.; Steinhauser, A. Biogas from Waste and Renewable Resources, 1st ed.; John Wiley & Sons: Weinhem, Germany, 2008. [Google Scholar] [CrossRef] [Scilit]
- Lin, C.-Y. Effect of Heavy Metals on Volatile Fatty Acid Degradation in Anaerobic Digestion. Water Res. 1992, 26, 177–183. [Google Scholar] [CrossRef] [Scilit]
- Zayed, G.; Winter, J. Inhibition of Methane Production from Whey by Heavy Metals—Protective Effect of Sulfide. Appl. Microbiol. Biotechnol. 2000, 53, 726–731. [Google Scholar] [CrossRef] [Scilit]
- Thanh, P.M.; Ketheesan, B.; Yan, Z.; Stuckey, D. Trace Metal Speciation and Bioavailability in Anaerobic Digestion: A Review. Biotechnol. Adv. 2016, 34, 122–136. [Google Scholar] [CrossRef] [Scilit] [PubMed]
- Feijoo, G.; Soto, M.; Méndez, R.; Lema, J.M. Sodium Inhibition in the Anaerobic Digestion Process: Antagonism and Adaptation Phenomena. Enzyme Microb. Technol. 1995, 17, 180–188. [Google Scholar] [CrossRef] [Scilit]
- Saxena, S.; Saharan, V.K.; George, S. Modeling & Simulation Studies on Batch Anaerobic Digestion of Hydrodynamically Cavitated Tannery Waste Effluent for Higher Biogas Yield COD TS. Ultrason. Sonochem. 2019, 58, 104692. [Google Scholar] [CrossRef] [Scilit]
- Achouri, O.; Panico, A.; Ph, D.; Derbal, K.; Ph, D.; Pirozzi, F. Effect of Chemical Coagulation Pretreatment on Anaerobic Digestion of Tannery Wastewater. J. Environ. Eng. 2017, 1–5. [Google Scholar] [CrossRef] [Scilit]
- Rajagopal, R.; Massé, D.I.; Singh, G. A Critical Review on Inhibition of Anaerobic Digestion Process by Excess Ammonia. Bioresour. Technol. 2013, 143, 632–641. [Google Scholar] [CrossRef] [Scilit] [PubMed]
- Amani, T.; Nosrati, M.; Sreekrishnan, T.R. Anaerobic Digestion from the Viewpoint of Microbiological, Chemical, and Operational Aspects—A Review. Environ. Rev. 2010, 278, 255–278. [Google Scholar] [CrossRef] [Scilit]
- Gerardi, M.H. The Microbiology of Anaerobic Digesters; John Wiley & Sons: Hoboken, NJ, USA, 2003. [Google Scholar]
- O’Flaherty, V.; Lens, P.; Leahy, B.; Colleran, E. Long-Term Competition between Sulphate-Reducing and Methane-Producing Bacteria during Full-Scale Anaerobic Treatment of Citric Acid Production Wastewater. Water Res. 1998, 32, 815–825. [Google Scholar] [CrossRef] [Scilit]
- Sabumon, P.C. Development of a Novel Process for Anoxic Ammonia Removal with Sulphidogenesis. Process Biochem. 2008, 43, 984–991. [Google Scholar] [CrossRef] [Scilit]
- Sabumon, P.C. Development of the Sulphidogenesis Cum Ammonia Removal Process for Treatment of Tannery Effluent. Water Sci. Technol. 2008, 58, 391–397. [Google Scholar] [CrossRef] [Scilit] [PubMed]
- Moraes, B.S.; Souza, T.S.O.; Foresti, E. Effect of Sulfide Concentration on Autotrophic Denitrification from Nitrate and Nitrite in Vertical Fixed-Bed Reactors. Process Biochem. 2012, 47, 1395–1401. [Google Scholar] [CrossRef] [Scilit]
- Ariunbaatar, J.; Scotto Di Perta, E.; Panico, A.; Frunzo, L.; Esposito, G.; Lens, P.N.L.; Pirozzi, F. Effect of Ammoniacal Nitrogen on One-Stage and Two-Stage Anaerobic Digestion of Food Waste. Waste Manag. 2015, 38, 388–398. [Google Scholar] [CrossRef] [Scilit]
- Utgikar, V.P.; Harmon, S.M.; Chaudhary, N.; Tabak, H.H.; Govind, R.; Haines, J.R. Inhibition of Sulfate-Reducing Bacteria by Metal Sulfide Formation in Bioremediation of Acid Mine Drainage. Environ. Toxicol. 2002, 17, 40–48. [Google Scholar] [CrossRef] [Scilit]
- Vazifehkhoran, A.H.; Shin, S.G.; Triolo, J.M. Use of Tannery Wastewater as an Alternative Substrate and a Pre-Treatment Medium for Biogas Production. Bioresour. Technol. 2018, 258, 64–69. [Google Scholar] [CrossRef] [Scilit] [PubMed]
- Agustini, C.B.; da Costa, M.; Gutterres, M. Tannery Wastewater as Nutrient Supply in Production of Biogas from Solid Tannery Wastes Mixed through Anaerobic Co-Digestion. Process Saf. Environ. Prot. 2019, 135, 38–45. [Google Scholar] [CrossRef] [Scilit]
- Daryapurkar, R.A.; Nandy, T.; Kaul, S.N.; Deshpande, C.V.; Szpyrkowicz, L. Evaluation of Kinetic Constants for Anaerobic Fixed Film Fixed Bed Reactors Treating Tannery Wastewater. Int. J. Environ. Stud. 2001, 58, 835–860. [Google Scholar] [CrossRef] [Scilit]
- Department of Water Affairs. Revision of General Authorisations in Terms Section 39 of the National Water Act, 1998 (Act Number 36 of 1998); Gorvenment Printing Works: Pretoria, South Africa, 2013; pp. 1–32.
- Maqbool, A.; Ali, S.; Rizwan, M.; Ishaque, W.; Rasool, N.; ur Rehman, M.Z.; Bashir, A.; Abid, M.; Wu, L. Management of Tannery Wastewater for Improving Growth Attributes and Reducing Chromium Uptake in Spinach through Citric Acid Application. Environ. Sci. Pollut. Res. 2018, 25, 10848–10856. [Google Scholar] [CrossRef] [Scilit]
- Thangamani, A.; Rajakumar, S.; Ramanujam, R.A. Anaerobic Co-Digestion of Hazardous Tannery Solid Waste and Primary Sludge: Biodegradation Kinetics and Metabolite Analysis. Clean Technol. Environ. Policy 2010, 12, 517–524. [Google Scholar] [CrossRef] [Scilit]
- Thangamani, A.; Suseela, R.; Ramanujam, R.A. Biomethanation Potential of Animal Fleshing and Primary Sludge and Effect of Refractory Fraction of Volatile Solids. J. Environ. Sci. Sustain. Soc. 2009, 3, 29–34. [Google Scholar] [CrossRef] [Scilit]
- Li, L.; He, Q.; Zhao, X.; Wu, D.; Wang, X.; Peng, X. Anaerobic Digestion of Food Waste: Correlation of Kinetic Parameters with Operational Conditions and Process Performance. Biochem. Eng. J. 2018, 130, 1–9. [Google Scholar] [CrossRef] [Scilit]

Publisher’s Note: MDPI stays neutral with regard to jurisdictional claims in published maps and institutional affiliations. |
© 2021 by the authors. Licensee MDPI, Basel, Switzerland. This article is an open access article distributed under the terms and conditions of the Creative Commons Attribution (CC BY) license (http://creativecommons.org/licenses/by/4.0/).