


Abstract
The restructuring of power systems and the ever-increasing demand for electricity have given rise to congestion in power networks. The use of distributed generators (DGs) may play a significant role in tackling such issues. DGs may be integrated with electrical power networks to regulate the drift of power in the transmission lines, thereby increasing the power transfer capabilities of lines and improving the overall performance of electrical networks. In this article, an effective method based on the Harris hawks optimization (HHO) algorithm is used to select the optimum capacity, number, and site of solar-based DGs to reduce real power losses and voltage deviation. The proposed HHO has been tested with a complex benchmark function then applied to the IEEE 33 and IEEE 69 bus radial distribution systems. The single and multiple solar-based DGs are optimized for the optimum size and site with a unity power factor. It is observed that the overall performance of the systems is enhanced when additional DGs are installed. Moreover, considering the stochastic and sporadic nature of solar irradiance, the practical size of DG has been suggested based on analysis that may be adopted while designing the actual photovoltaic (PV) plant for usage. The obtained simulation outcomes are compared with the latest state-of-the-art literature and suggest that the proposed HHO is capable of processing complex high dimensional benchmark functions and has capability to handle problems pertaining to electrical distribution in an effective manner.
1. Introduction
Installing distributed generation (DG) sources in the distribution network system has been standard practice in recent years to minimize overall power losses and enhance the power quality [1,2]. The optimum sizing and positioning of DGs in power system networks are essential to maximize the benefits from those installations. The incorrect allocation and unreasonable sizing of DG units in the power system networks may increase voltage sags, voltage flickering, harmonic distortion, fault current, and power losses. With the application of DG units, the power system losses may be reduced by 13% [3,4]. In the functioning of power systems, economic damage and voltage collapse may be avoided through the reduction in power loss and voltage stability enhancement, respectively [5]. Thus, the investigation in optimal location selection and sizing of DG units in the distribution network is a step towards a profitable electricity supply [6,7]. Among all DG systems, solar photovoltaic DG systems seek attention worldwide for their abundant availability, easy installation, maintenance, and environment-friendly features.
The major goals of most techniques to determine the best location and size of DG units are to reduce power loss and improve voltage profile. The various techniques such as analytical methods, ant bee colony (ABC), genetic algorithm (GA), tabu search (TS), particle swarm optimization (PSO), fuzzy system, evolutionary programming, dynamic programming, etc., have been utilized to achieve the aforesaid objectives in a distribution network through the proper allocation and sizing of DG units. In the literature, GA is used to estimate the placement and size of DG units to improve the voltage profile and reduce power loss. Once DG units are appropriately placed in the distribution system network, voltage stability and loss reduction are improved significantly. The GA is utilized as the most applied optimization technique in resolving the problem of DGs allocation and sizing [8,9]. The multiobjective genetic optimization method is used in radial distribution systems to determine the best position and size for renewable-based DG units [10]. For site determination of DGs planning and performance index-based size, a GA-based multiobjective optimization is utilized to minimize the actual power loss in distribution systems with constant power, current, and impedance models [11]. Almabsout et al. [12] suggest an improved GA to determine the best placement and capacity of the simultaneous allocation of DGs/SCs in radial systems by combining the benefits of genetic algorithms and local search [12]. To minimize system losses, a mix of analytical and genetic algorithm approaches is utilized to optimize the allocation of numerous DGs in a distribution network [13].
To reduce real power losses and improve the voltage profile, Madhusudhan et al. [14] proposed the GA to identify the optimum location, as well as the size of the distribution network’s DG units. Ayodele et al. [15] used GA to find the best DG technology for optimal power system functioning, as well as the best position and size of the DG to reduce network power loss. GA is applied to reduce the cost of system expansion and improves system stability [16,17]. However, GA convergence time is high, especially, when applied in the solution of complex problems, and may suggest inaccurate solutions. When compared to GA and TS techniques, Hassan et al. and Fan et al. [18,19] employed simulated annealing (SA) to find and specify the capacity of DGs while lowering computation time. However, the SA method has disadvantages such as termination at a local minimum, significant computational time, no information regarding the divergence of the local minimum from the global minimum, and no upper constraint for the calculation time. Using the TS approach, Liu et al. and Azam et al. [20,21] concentrated on DG optimum planning with the goal of minimizing both losses and line loadings. The TS technique, on the other hand, has the drawback of requiring a large number of iterations and parameter calculations. PSO was used to determine the best scale and distribution of DG units in the power system, together with its benefits [22].
One of the most effective and widely used optimization strategies is the PSO [23,24,25]. Barik et al. [26] presented a multiobjective PSO method for determining the best location and size of DG units while taking economic and technical factors into account. The advanced versions of PSO methods, such as improved PSO [27], binary PSO [28], social learning PSO [29], PSO with inertia weight, and PSO with constriction factor [30], are also applied in the DG allocation and sizing problems. However, the PSO technique has some disadvantages, such as difficulty in initializing the design parameters and inapplicability to scattering problems. Tolabi et al. and Oloulade et al. [31,32] introduced the ant colony optimization (ACO) technique to tackle the allocation and size problem of renewable energy source-based DGs in radial distribution networks with the goal of minimizing overall system losses. Their analysis showed that ACO gives a better solution, and computational time is less than GA. However, ACO takes more time to converge due to the complex nature of the problem but is still shorter than analytical methods. The major disadvantage of the ACO technique lies with its uncertainty in time to convergence. Das et al. [33] and Seker and Hocaoglu [34] used the artificial bee colony (ABC) method to compare results to the PSO technique and discovered that ABC provides a higher-quality solution with a faster convergence rate. The cuckoo search algorithm was used by Yuvaraj and Ravi [35] to improve the voltage profile and reduce power losses in biomass and solar–thermal DG units. To optimize the system voltage profile and decrease line losses, Arya and Koshti [36] used a shuffled frog leaping algorithm.
Rajaram et al. [37] used a plant growth simulation algorithm with objectives such as decreasing the losses and improving the voltage profile. To reduce energy losses in a distribution network system, Othman et al. [38] used the big bang–big crunch approach to find appropriate DG units. The bat algorithm was suggested by Sudabattula and Kowsalya [39] for the efficient allocation of solar-based DGs in the distribution network. To decrease power losses while preserving voltage profile, Duong et al. [40] developed an efficient biogeography-based optimization for optimal location and size of solar photovoltaic distributed generating units.
Harris hawks optimization (HHO) is a new metaheuristic optimization algorithm used in various applications, as tabulated in Table 1.
Table 1.
Application of HHO in different literatures.
After a thorough search in credible academic publications, as shown in Table 1, to-date, the efficient newly invented HHO method has not been utilized to optimal solar-based DG allocation in a radial distribution system. As a result, this study compares and contrasts the suggested work with well-known optimization techniques. Suitable DG unit placement may bring significant benefits, including cost saving through a reduction in power loss and increasing the purchasing power capacity.
Motivation and Contributions
The primary motivation behind this work is to design a novel technique for appropriate allocation and sizing of solar photovoltaic DGs to reduce power losses and enhance the voltage profile. Worldwide sustainable development is possible through the generation of electricity from renewable energy resources. The Indian government has taken a number of steps to stimulate the use of renewable energy (RE) resources, including setting state-specific RE objectives in the form of solar purchase obligations (SPO) and renewable purchase obligations (RPO). Every state has set a goal to fulfill a significant part of its overall energy demand from renewable resources under the provisions of RPO and SPO. The solar photovoltaic DGs (PV DG) considered in this paper are among all the renewable energy resources; solar energy has received major importance due to its abundant availability worldwide. Although researchers have previously used a variety of approaches to tackle the problem of DG allocation and size in the power system network, the authors have not considered the actual field installation capacity of PV DG; instead, they have considered only the actual power to be injected. Whereas the output of the solar PV DG is a meteorological parameter and PV module parameter-dependent system, thus, it is imperative to calculate the actual size of the PV DG to be installed to inject the targeted power into the grid. The contribution of this work is presented below:
- The proposed HHO has been tested with complex benchmark functions;
- Assign a novel approach for appropriate allocation and sizing of PV DGs in IEEE 33 bus and IEEE 69 bus power system network using HHO to minimize the power losses and improve the voltage profile;
- Compare the simulation outcomes of the proposed technique together with the recently available methods such as the teaching–learning-based optimization (TLBO), genetic algorithm (GA), particle swarm optimization (PSO), quasi-oppositional TLBO (QOTLBO), comprehensive teaching learning-based optimization (CTLBO), CTLBO ε-method, improved multiobjective elephant herding optimization (IMOEHO), improved decomposition-based evolutionary algorithm (I-DBEA), bat algorithm (BA), simulated annealing (SA), invasive weed optimization (IWO), bacterial foraging optimization algorithm (BFOA), and moth–flame optimization (MFO) to determine the effectiveness of the proposed algorithm over the exciting ones;
- Calculate the actual/practical size of the solar PV DG units to be installed to inject the targeted power into the power system grid.
The remainder of this article is structured in the following order. The mathematical formulation of the problem with various constraints is detailed in Section 2. The detail of the proposed HHO and the solution approach for the considered problem is presented in Section 3. In Section 4, the problem is tested with a benchmark function and with standard test systems. Section 5 deals with the practical calculation of solar PV DG. Section 6 concludes with some final observations together the breadth of future development.
2. Formulation of the Mathematical Problem
2.1. Loss Minimization
The objective of the present work is to relax the congestion in power lines along with determining the proper size and optimal location of DGs while keeping the losses (202.67 kW and 224.9 kW for IEEE 33 and IEEE 69 bus RDS, respectively) to the minimum. The major objective function (OF) is framed in the form of total system losses. Therefore, the OF may be stated by Equation (1).
where
The various constraints of the proposed optimization problem are as stated in Equations (3)–(7).
where is the conductance of branch k; and are the magnitude of voltages at sending and receiving bus, respectively; and represent active and reactive power generation by DG; is the phase angle at ith and jth bus, respectively; and represents active power generation at ith bus.
In Equations (3)–(7), the superscripts max and min represent the upper and the lower limits of the respective variables. The major objective here is to reduce congestion in lines and minimize losses.
2.2. Practical Sizing of PV DG
The power output of the PV module depends on meteorological parameters (such as ambient temperature and solar irradiance at the particular location) and on the parameters of the PV modules. To address the dependence on solar irradiation, the beta probability density function was used to model the uncertain nature of solar irradiance. The distribution of solar irradiance may be written as Equation (8) [61].
where Γ(°) is defined as the gamma function, s is defined as the random variable of solar irradiance, is defined as the beta distribution function of s, α and β are defined as the parameters of the beta distribution function, μ and σ are defined as the mean and standard deviation of s.
Equations (11)–(13) have been used to address the effect of ambient temperature on the output of the PV module. The temperature of the PV module is influenced by the nominal operating module temperature (NOMT), solar irradiance, and ambient temperature, as shown by Equation (11) [62].
The output current of the PV module is a function of the solar irradiance, short-circuit current, temperature coefficient of current, and temperature of PV module, shown by Equation (12) [63].
The voltage of the PV module is a function of the open-circuit voltage, voltage temperature coefficient of the module, and its temperature, as shown by Equation (13).
Considering aforesaid environmental and PV module parameters correction factors, Equation (14) will be modified to Equation (15).
The output power of PV module, operating at maximum power point at solar irradiance s, may be estimated using Equation (16).
The output power of the PV plant, operating at maximum power point at solar irradiance s may be estimated using Equation (17) [64].
The power output from the PV module considering maximum power point may be obtained by Equations (14) and (15). The variables used are defined as follows: is the temperature of the PV module; is the ambient temperature; NOMT is the nominal operating module temperature; is the current of the PV module; is the voltage of the PV module; is the short-circuit current of PV module; is the open-circuit voltage of PV module; is the temperature coefficient of current; is the temperature coefficient of voltage; is the current at maximum power point at standard test condition (STC); is the voltage at maximum power point at STC; is defined as the fill factor; denotes the number of PV modules used in the PV plant; and is the power output from the PV module ()/plant at solar irradiance s.
The expected output power from the PV module considering the effect of solar irradiance s and ambient temperature may be calculated using Equation (18), and the expected total output power for a specific time period may be calculated using Equation (19) [64].
Monocrystalline silicon PERC PV module of the following specifications as presented in Table 2, was used for calculation [65].
Table 2.
PV module parameters.
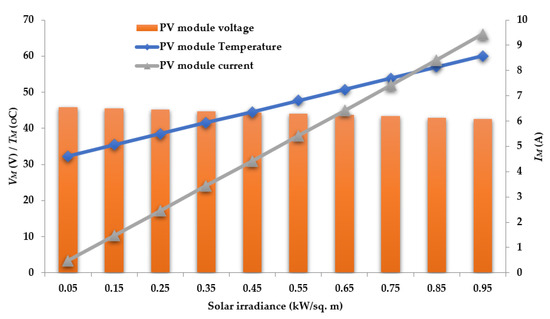
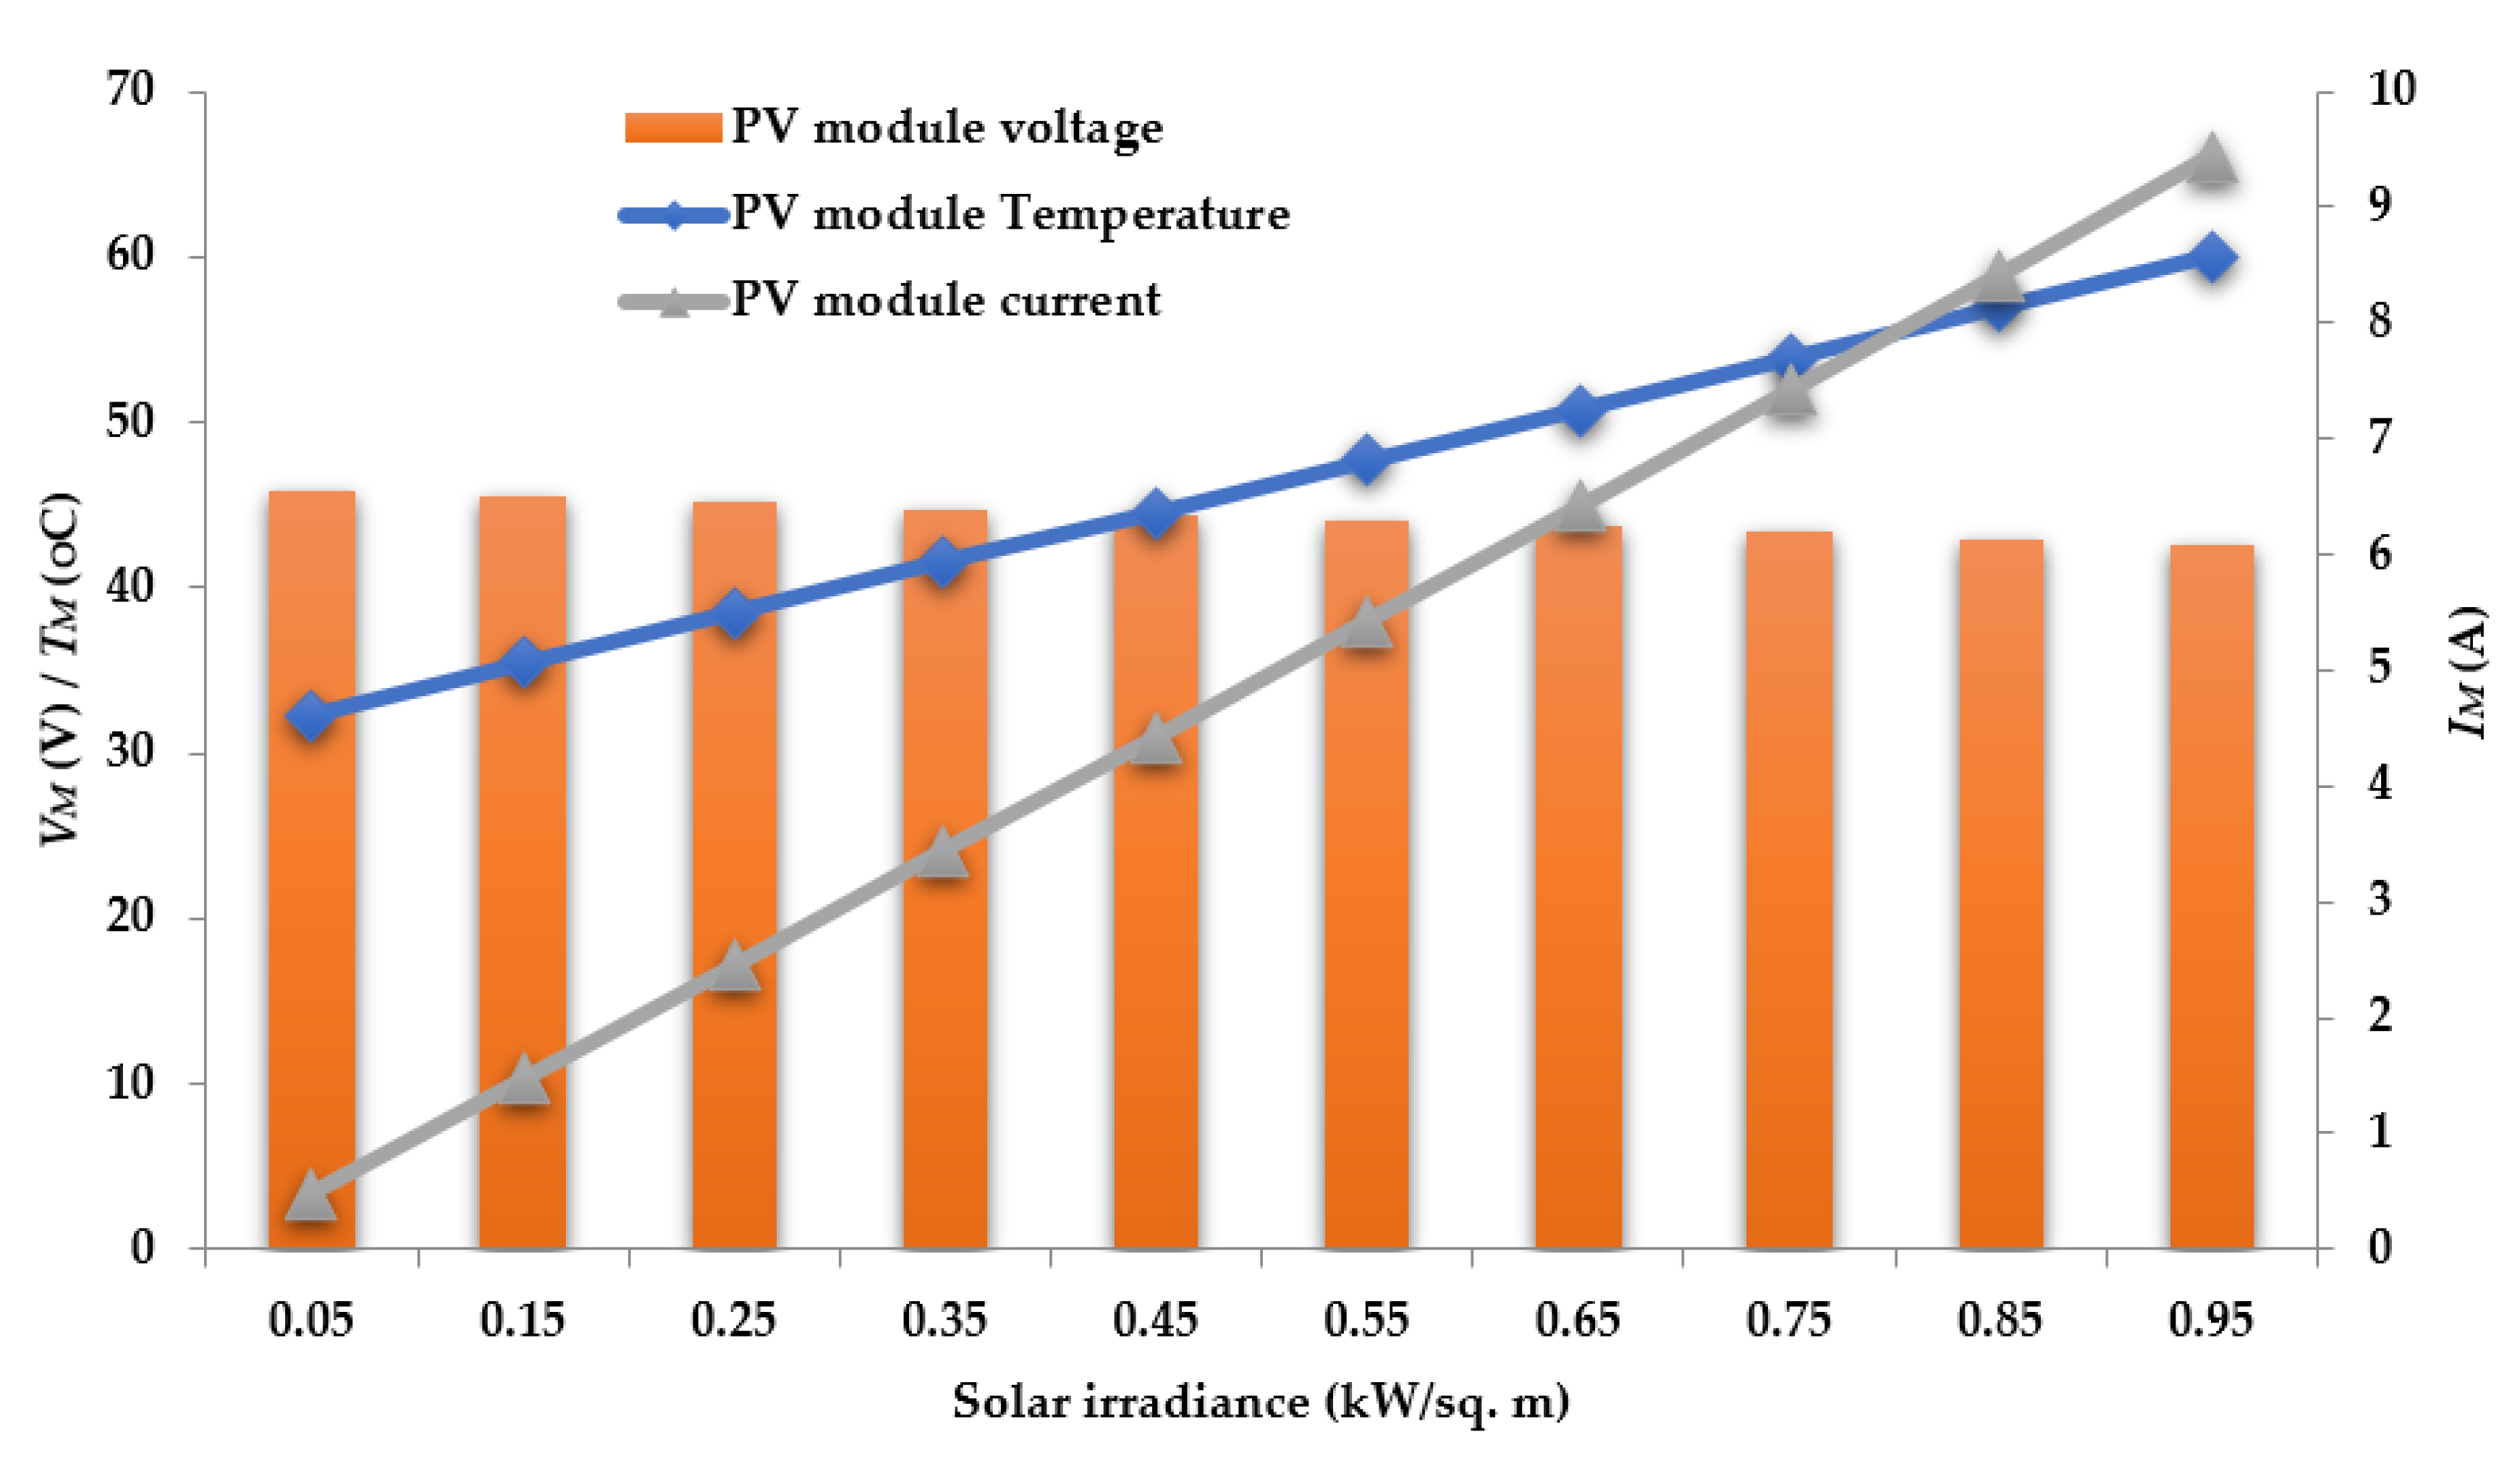
To convert the temperature coefficient of voltage and current from %/°C (Ti and Tv) to A/°C (ɛi) and V/°C (ɛv), Equations (20) and (21) are used, respectively. Impact of NOMT and irradiance on the temperature, voltage, and current of the PV module are depicted in Figure 1.
Figure 1.
Different PV module parameters considering the NOMT and solar irradiance.
Considering the parameters effecting the output of PV module, it is observed that the voltage and the current of the PV module varies from 45.85 to 42.62 V and 0.49 to 9.43 A, respectively, with the variation of solar irradiance. The temperature of the PV module varies from 32.3 to 60 °C as irradiance changes, as shown in Figure 1.
The ambient temperature, mean, and standard derivation of solar irradiance during a specified time period are considered as 30.76°, 0.52 kW/m2, and 0.21 kW/m2, respectively [61]. The expected output power from the PV module considering the effect of solar irradiance and ambient temperature, associated environmental parameters, PV module parameters and modeling parameters are tabulated in Table 3.
Table 3.
The expected output power from the PV module considering correction factors.
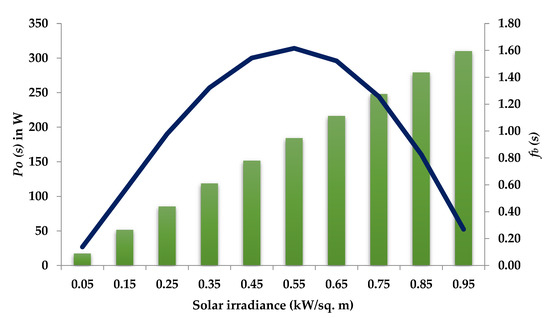
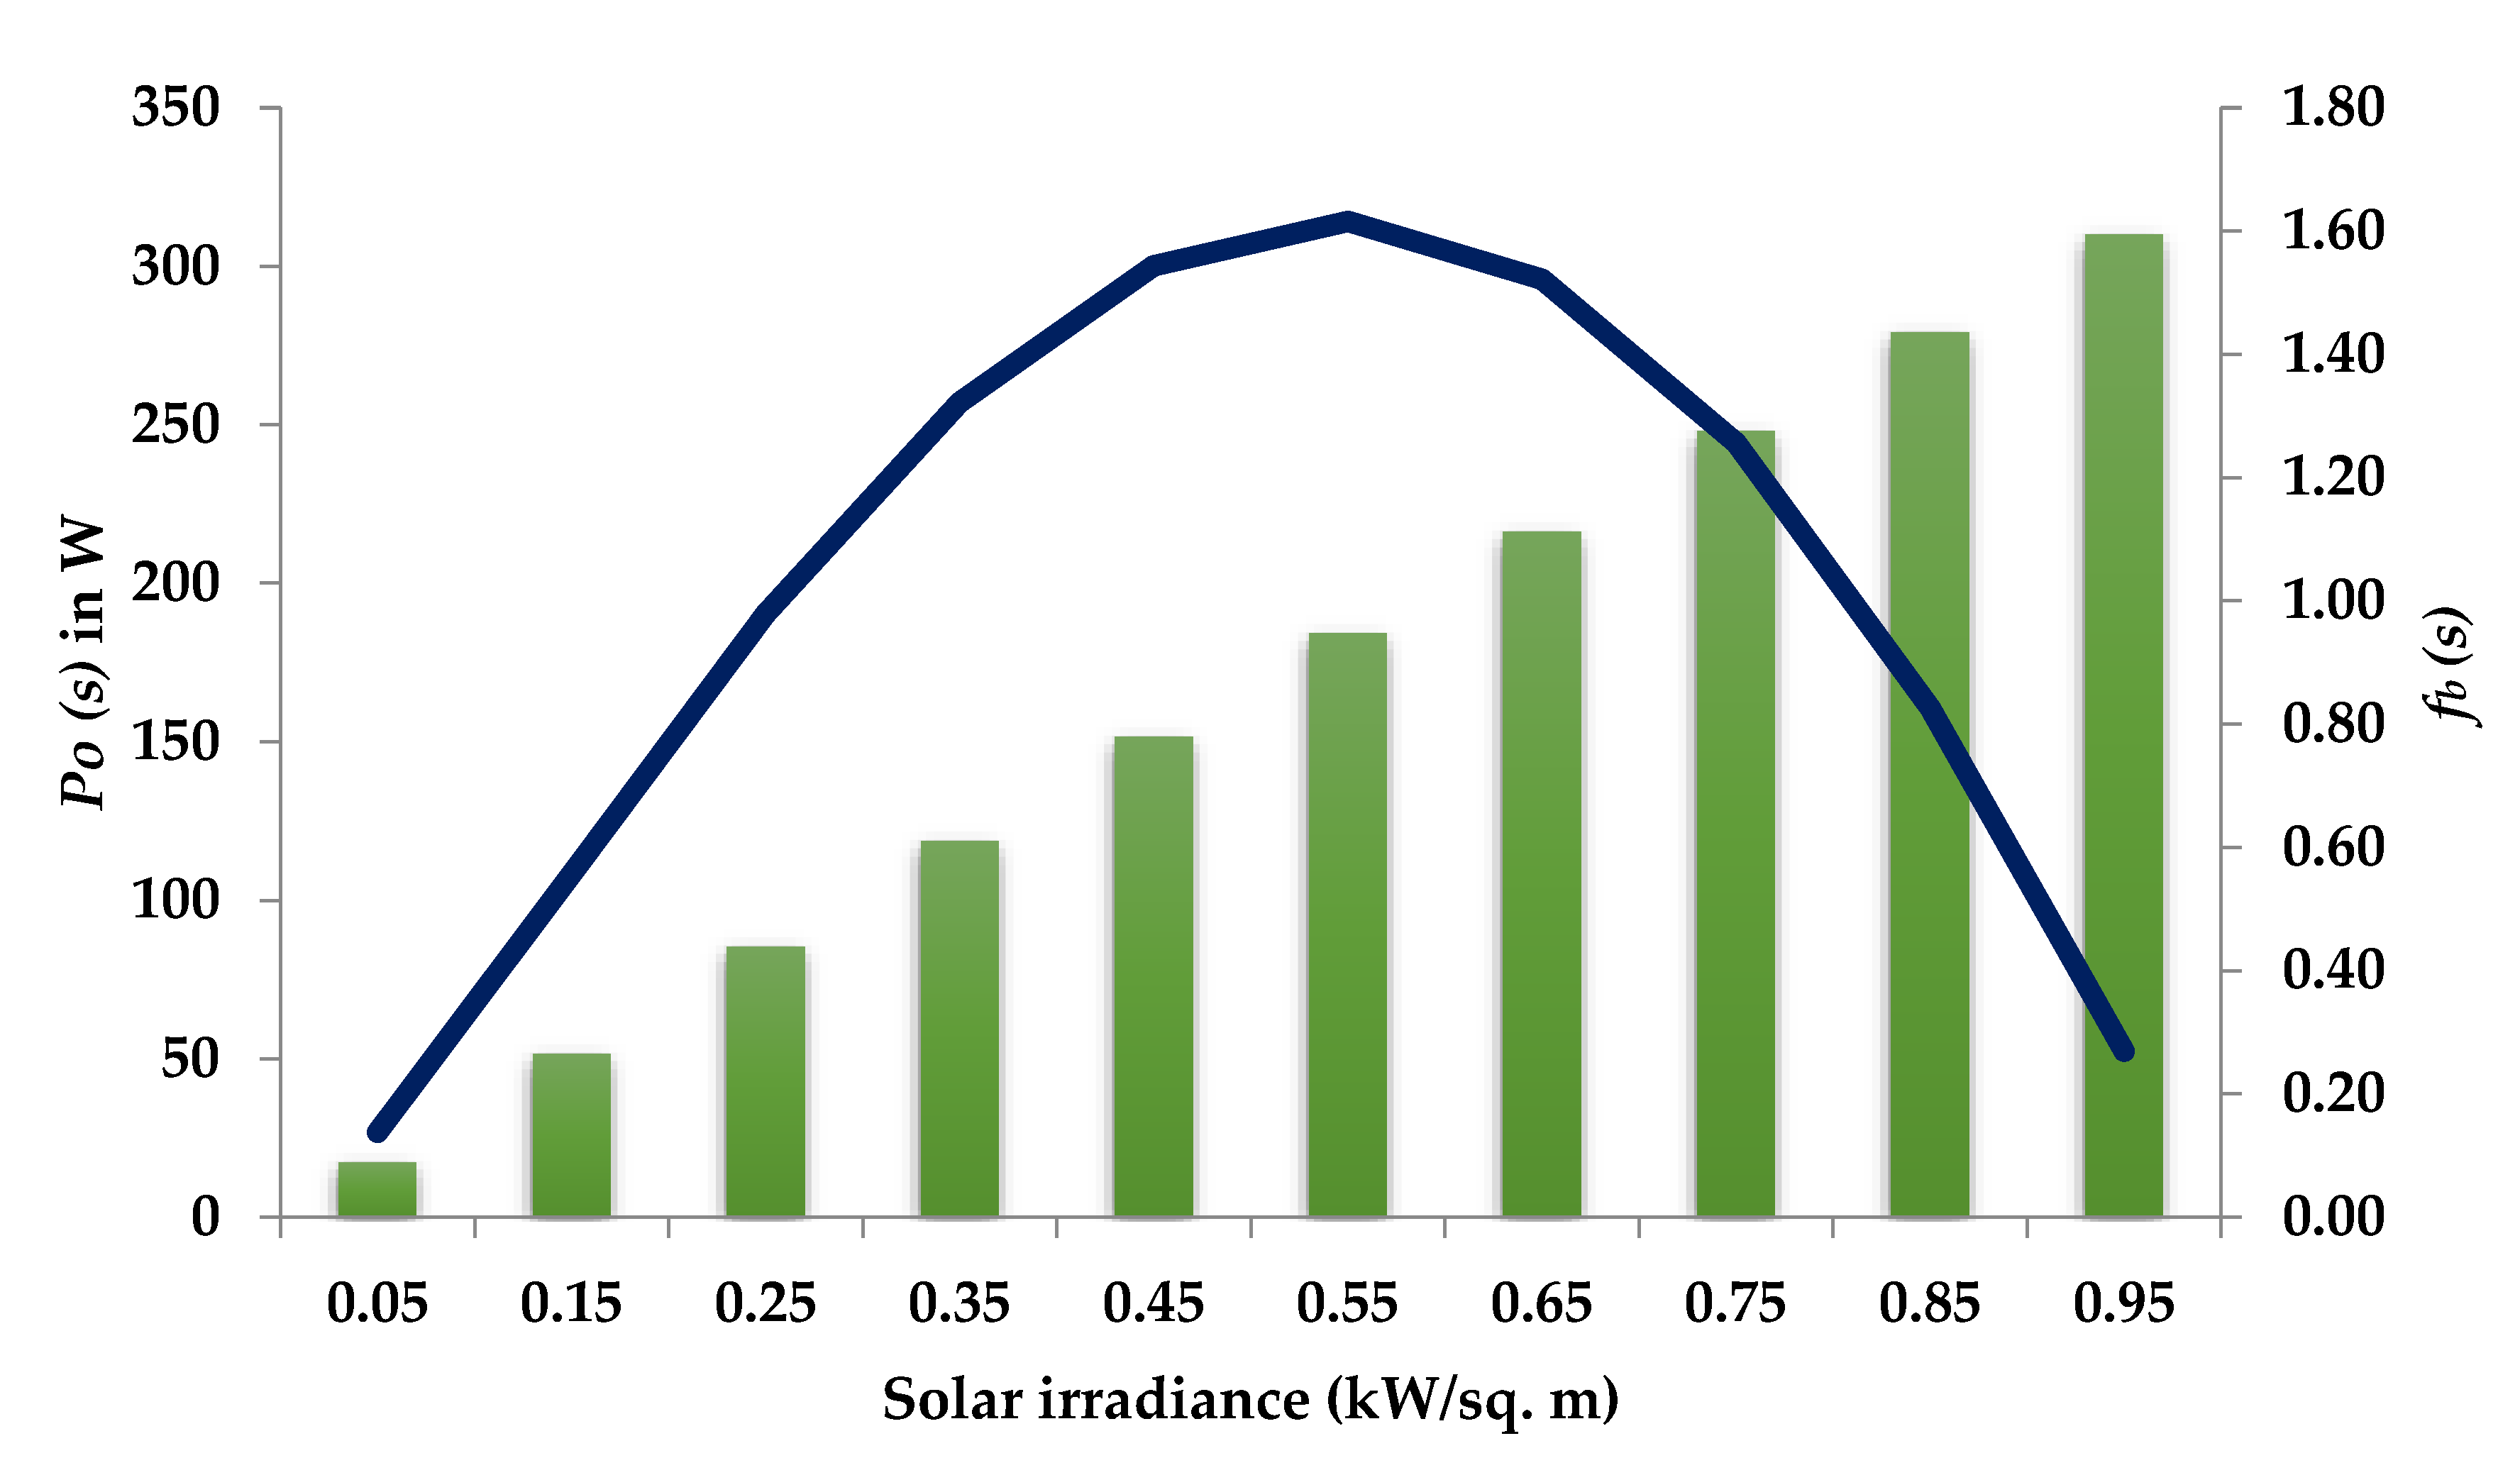
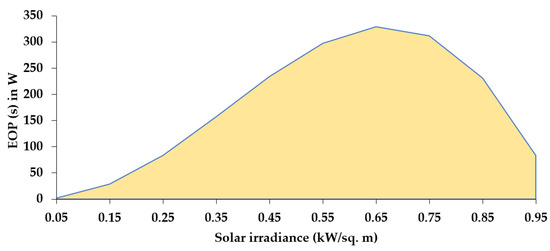
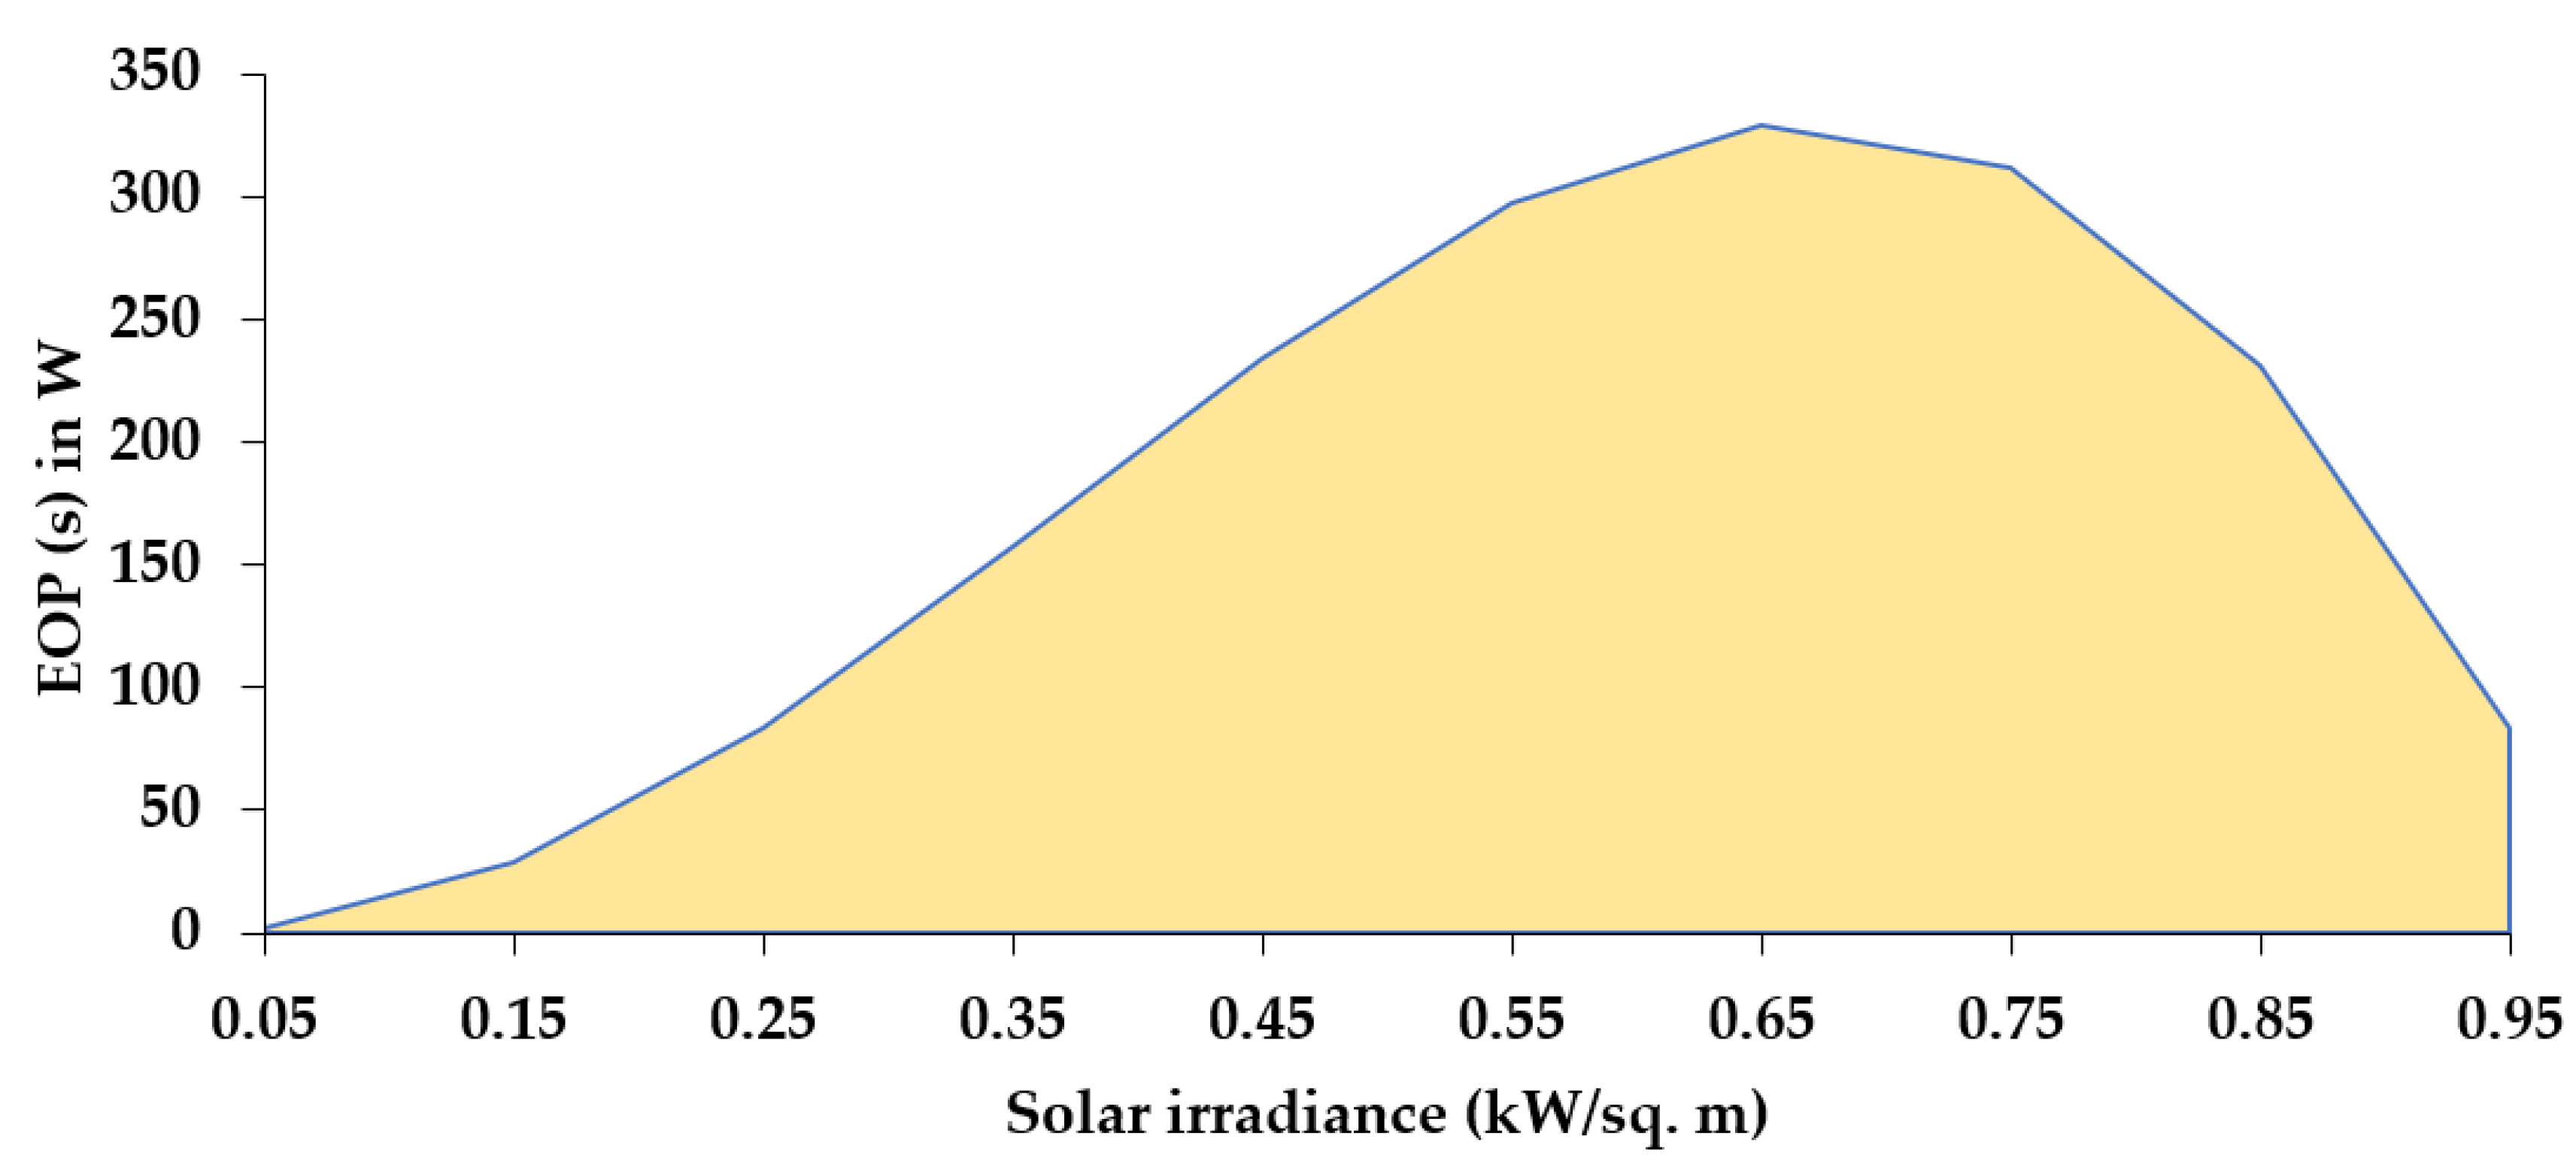
The power output from the PV module and with respect to solar irradiance s is presented in Figure 2.
Figure 2.
Output power from the PV module at different solar irradiance s.
The expected total power obtained from a single PV module is the average of , which is shown in Table 3 and depicted in Figure 3, i.e., 175.78 W.
Figure 3.
Expected output power from the PV module.
3. Proposed HHO and Solution Approach
3.1. HHO: Features
The Harris hawks is a recent population-based and gradient-free metaheuristic [66], hence, equally applicable to all optimization models or problems. The different phases of Harris hawks formulation are described in the next subsections.
3.2. Exploration Phase
In this phase, Harris hawks randomly search on locations and adopt a wait and watch strategy to catch the prey, as per Equation (22) [66].
where Xrabbit is the rabbit position and X (t+1) is the hawks’ position for next iteration; x (t) shows the current position of the hawks. The LB and are maximum and minimum of decision variables. is a randomly selected hawk from the current position. The random number in the range (0,1) is shown by the r(1–4).
where is the mean of the current population of hawks while N indicates the hawks’ total population.
Assuming the energy of the rabbit is given by
, , and T represent the escaping energy of prey, primary energy, and the maximum number of iterations taken, respectively.
3.3. Exploitation Phase
3.3.1. Soft Besiege
This behavior is demonstrated by Equation (25) [66].
where and J represent the difference between the position vector of the rabbit and the current location in iteration and the random jump strength of the rabbit, respectively.
3.3.2. Hard Besiege
This behavior is showcased by (27).
3.3.3. Soft Besiege along with Rapid Drives
In this behavior, it is assumed that hawks may choose their next step provided by the rule given in Equation (28) [66].
D, S, and LF are problem dimensions, a random number of order (1 × D), and levy flight function, respectively. In addition, u and v are random numbers (0 to 1 range), while beta is the default constant value (assuming 1.5).
Soft besiege updates the position of the hawks by
3.3.4. Hard Besiege along with Rapid Drives
Hard besiege condition given by the following rule:
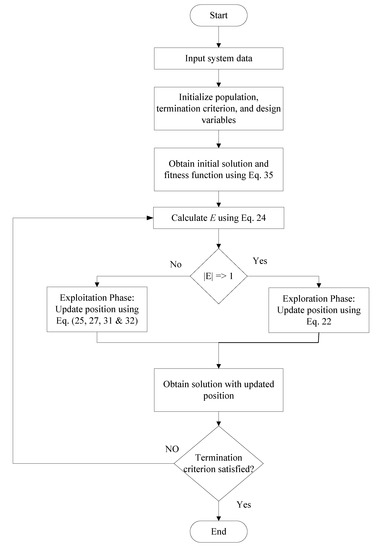
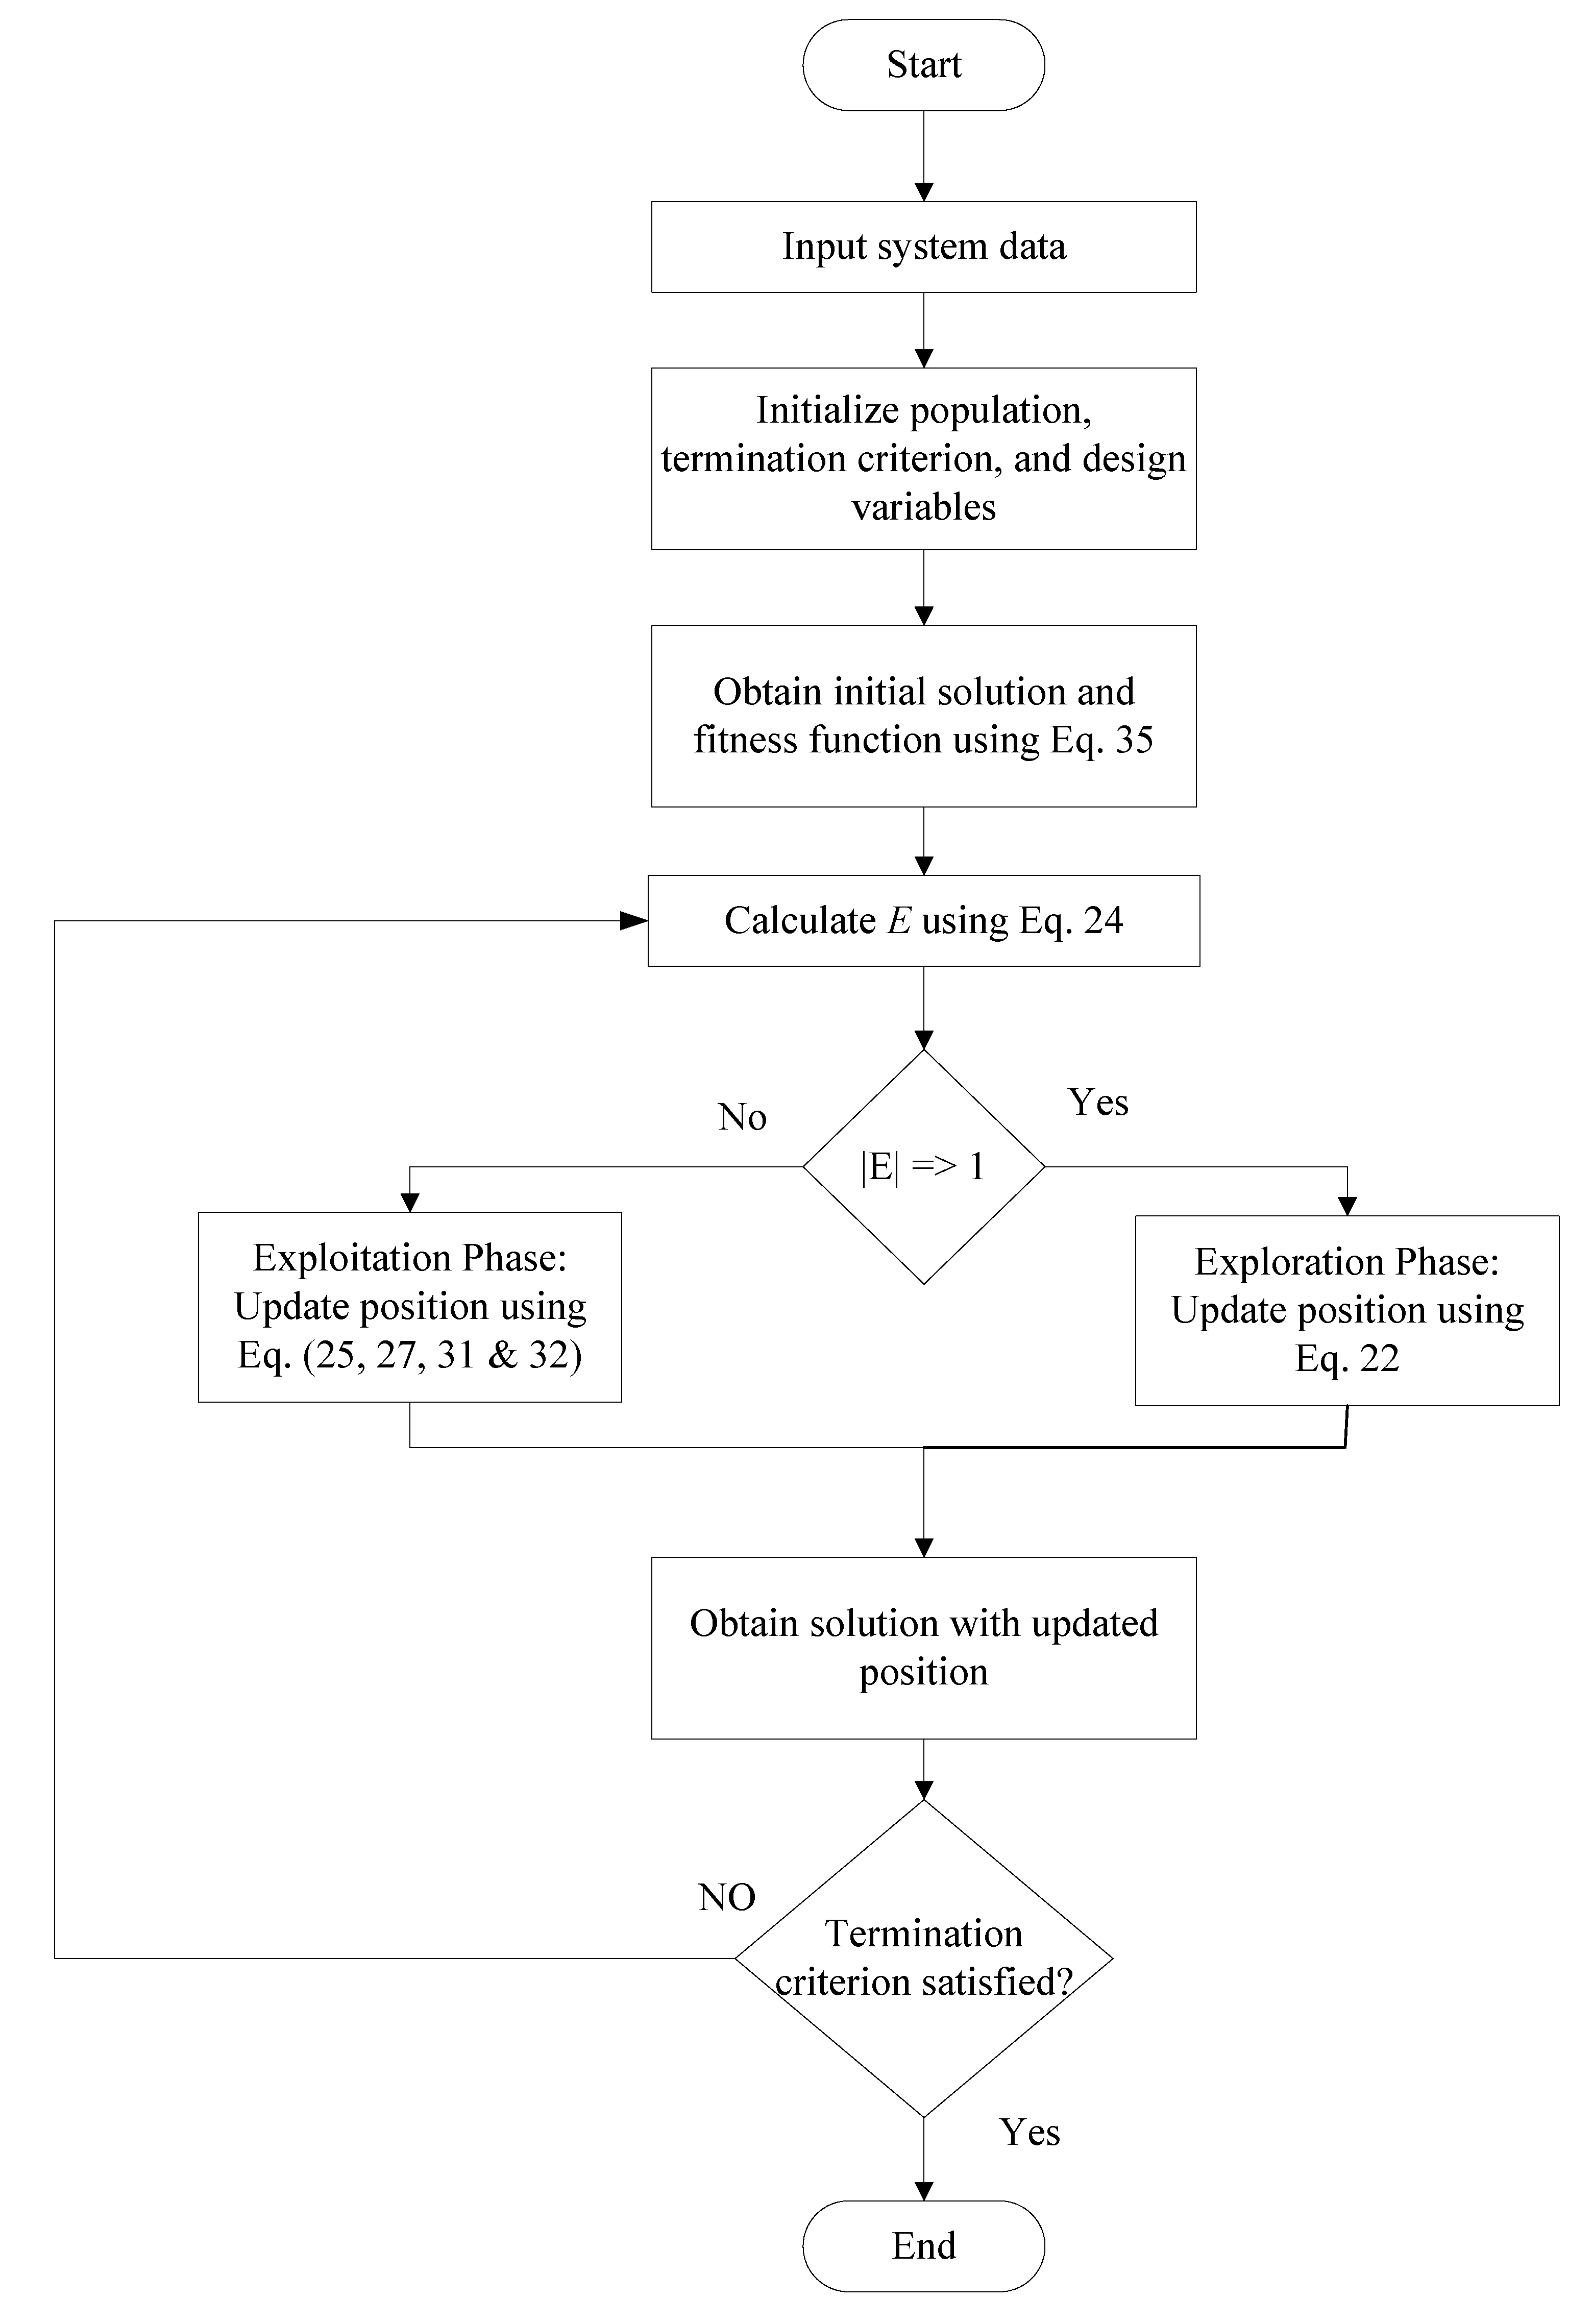
The step-by-step procedure of HHO is summarized to the pseudocode, as shown in Figure 4 [66].
Figure 4.
Flow chart of HHO. Reproduced from [66], Elsevier: 2019.
3.4. Solution Approch
3.4.1. HHO for PV DG Placement and Location
The major goal of this research is to determine the best placement and size for numerous PV DGs with the least amount of network power loss and a better voltage profile. In this work, the inequality constraints are converted to the penalty functions (PFs), and these PFs are added to the OF to construct the fitness function (FF) defined in Equation (35).
Here, FF is essential to be minimized in order to get minimum loss value, VB represents the set of overloaded lines and voltage violated load buses, and PF represents the penalty factor. The violation in inequality constraints such as load bus voltage and line power flows was handled using the penalty function approach. PF that represents penalty factor was taken as 10,000 throughout the simulation process.
3.4.2. Computational Practice of HHO for DG Location and Values
- Step 1
- Read the input data of the system, such as the maximum number of iterations, number of PV DG units, and population size.
- Step 2
- Generate the value of the size of PV DG within their upper (DGmax) and lower limits (DGmin). The same is shown in Equation (36).Here, DGi represents the size of ith DG unit. Now, constitute a vector Xj, that contains the possible locations (LOC) and size of DGs as mentioned in Equation (37).The LOC is generated randomly. Initial solution set X is then formulated as shown in Equation (38).
- Step 3
- Evaluation of the fitness function is processed using Equation (35) for individual Harris hawks, and the best hawk location is acknowledged.
- Step 4
- Calculate E using Equation (24).
- Step 5
- Exploration phase: Update the location of Harris hawks using Equation .
- Step 6
- Exploitation phase: Update the position using Equation
- Step 7
- Once the number of iterations reaches the maximum value, then terminate. Else, go back to Step 3.
4. Simulation Results and Discussions
4.1. Testing Strategies
The simulations were run on a MATLAB 9.9 computer with an Intel i3 CPU running at 2.4 GHz and 4 GB of RAM. The software utilized is MATPOWER 7.2, which is a well-known power modeling tool.
4.2. Case 1
In order to establish an algorithm, the proposed HHO was tested with selected extremely complex benchmark functions taken from CEC-2014 (see Table 4). The results obtained are tabulated in Table 5. The HHO seems to provide very competitive results as compared to other recent metaheuristic optimization techniques.
Table 4.
Summary of the CEC-2014 benchmark functions considered.
Table 5.
Comparative experimental outcomes on selected benchmark functions.
4.3. Case 2
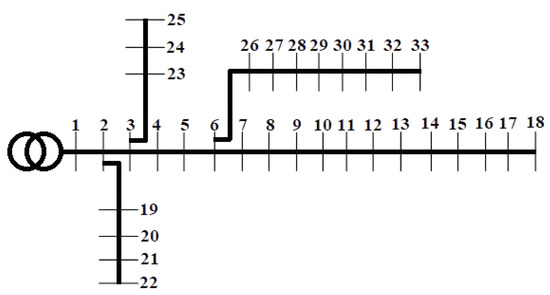
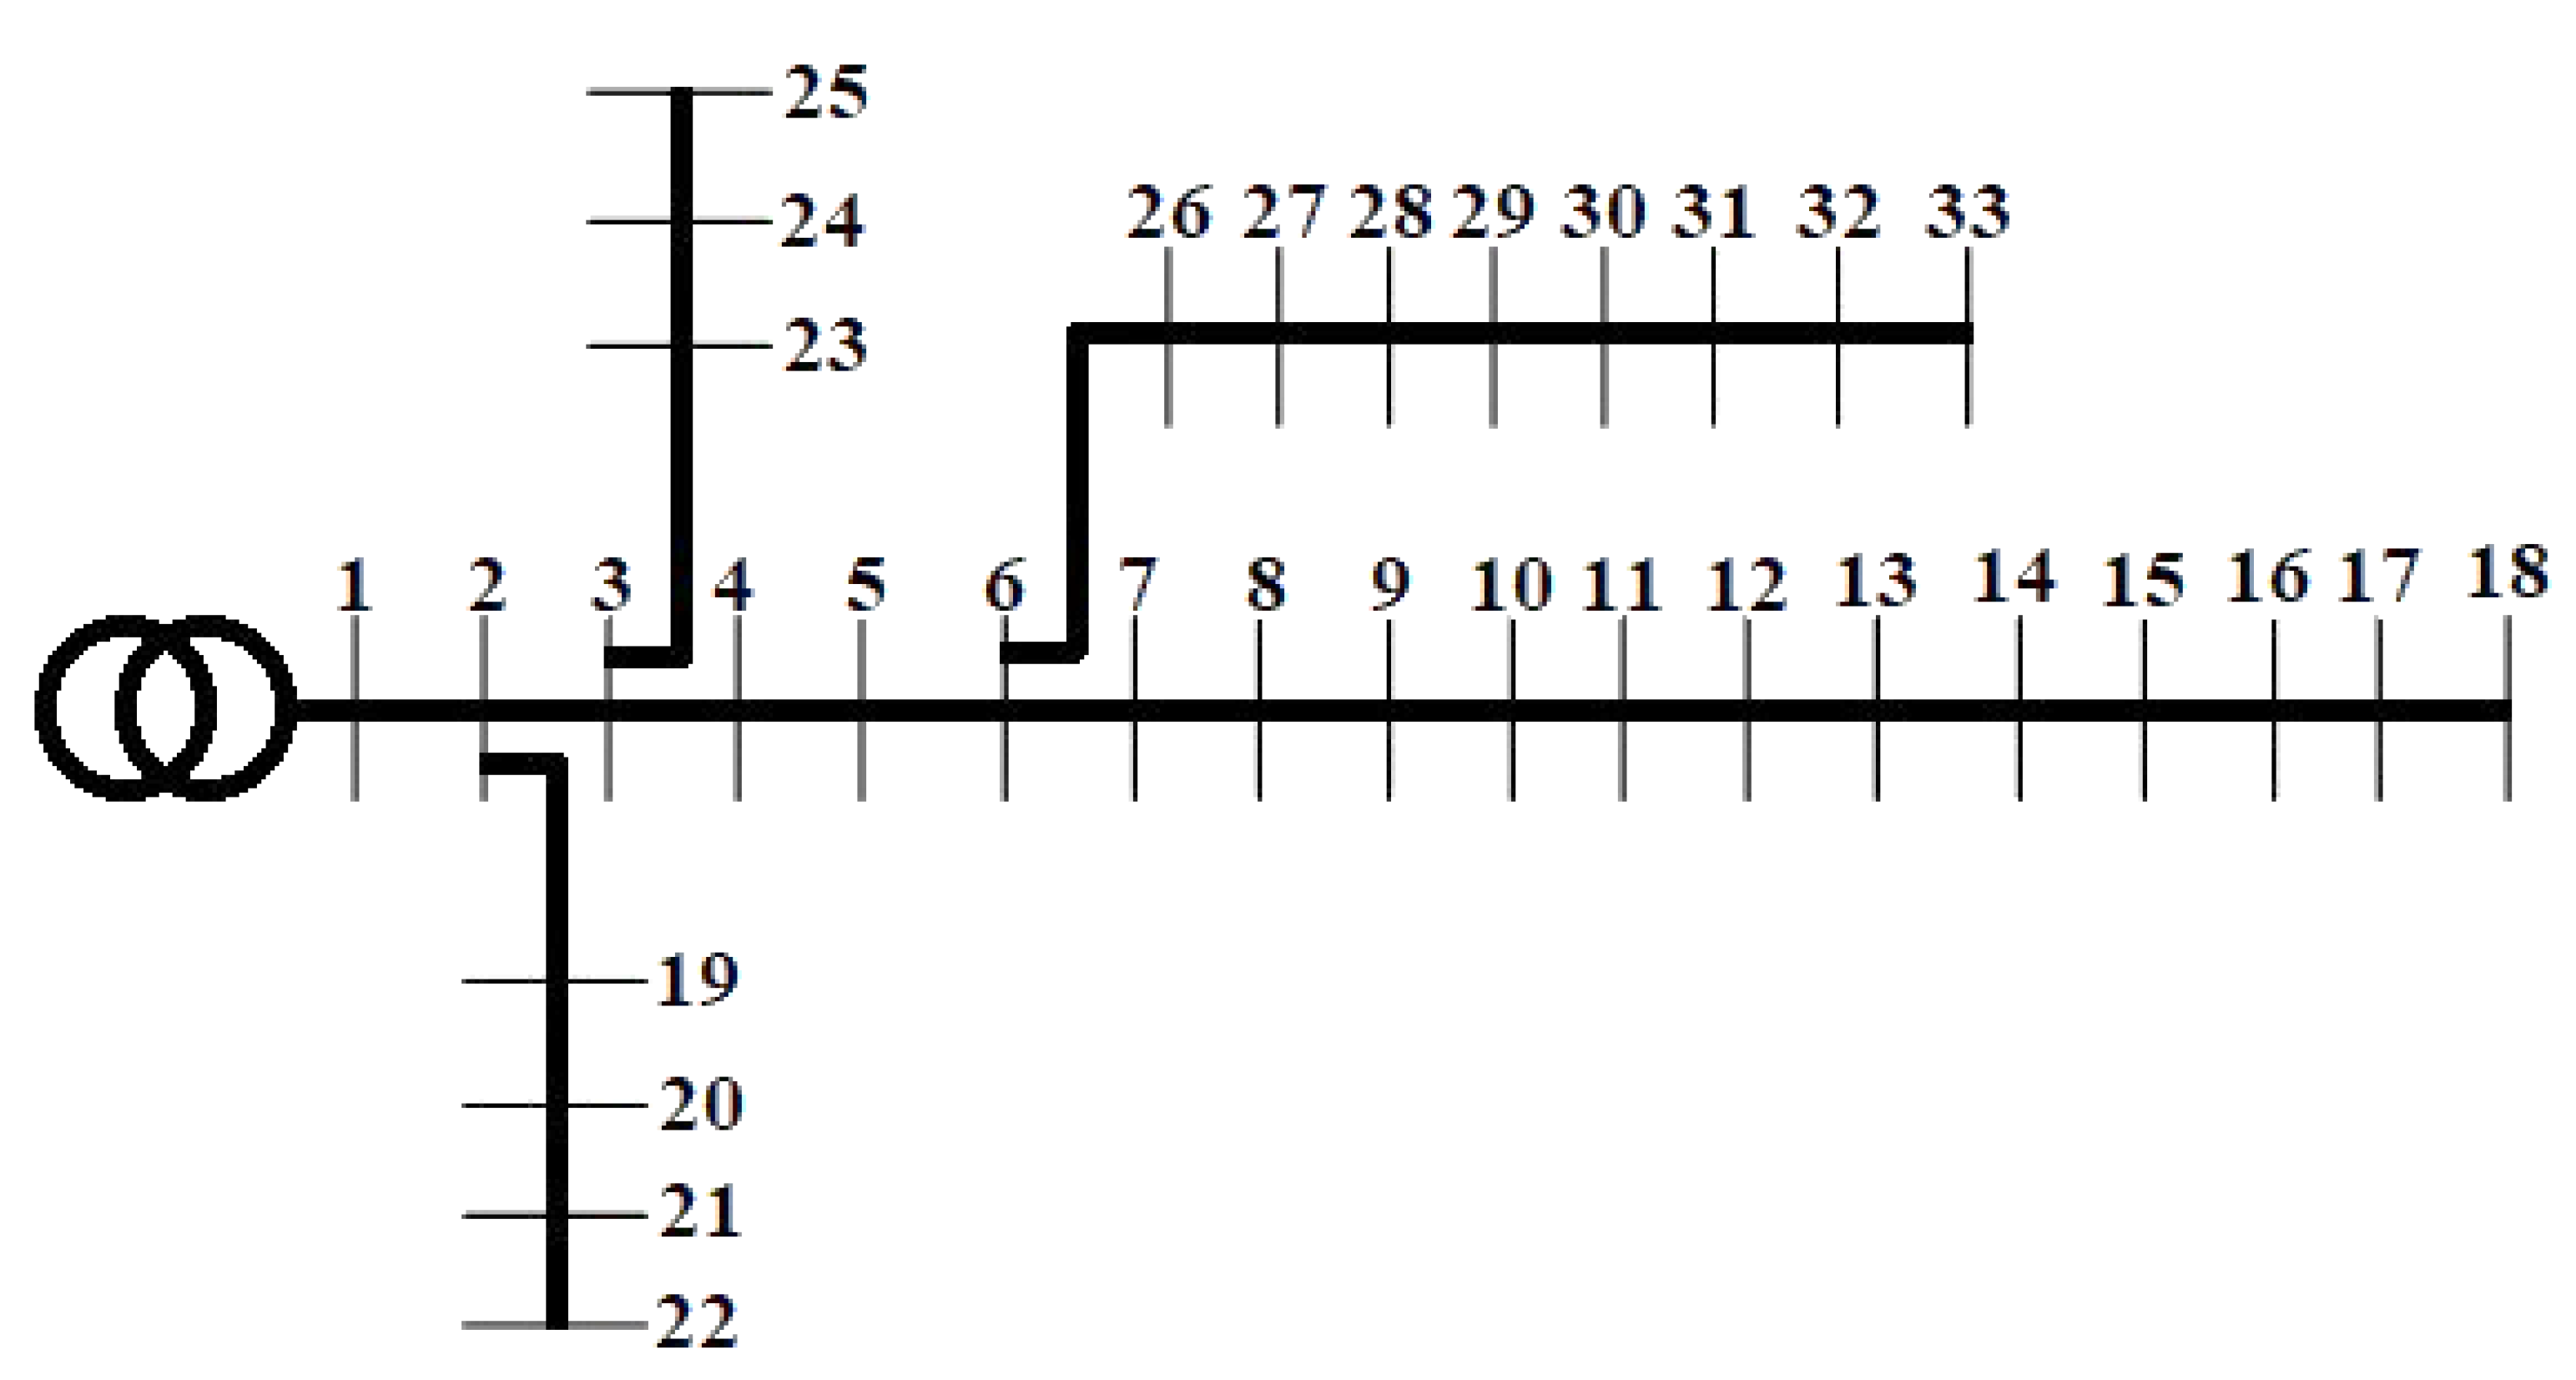
The proposed HHO-based approach is applied to find the suitable location and capacity of the DGs in the IEEE 33-bus RDS test system where the network and load data may be obtained from [67]. The single line diagram of the IEEE 33-bus RDS is shown in Figure 5. IEEE 33-bus RDS has a total of 33 buses, among which 32 are load buses and 1 is a generator bus. It can be visualized from Figure 5 that at bus no. 1 generator is connected; the other buses may have any type of load connected, as per the requirement. The total active power demand is 3.72 MW while reactive is 2.3 MVAR. Total power loss of the system is 202.67 kW.
Figure 5.
Single line diagram of IEEE 33-bus RDS.
In order to find candidate buses for locating a PV DG using this approach for each individual bus, it is assumed that there is a PV DG at that bus at a time. For optimal sizing of a PV DG at this stage, it is assumed that the PV DG may produce electric power in all possible ranges (e.g., 0–1 MW). The proposed HHO algorithm is applied for the minimization of overall loss as the objective function of the problem. First, only one PV DG is used to relax the congestion in lines, and the results obtained are tabulated in Table 6. With the application of proposed HHO on distribution problem, the losses are reduced to 129.2 from 202.67 kW with only one DG in installation of size 0.95 MW.
Table 6.
Variation in power loss with change in an optimal allocation of PV DGs.
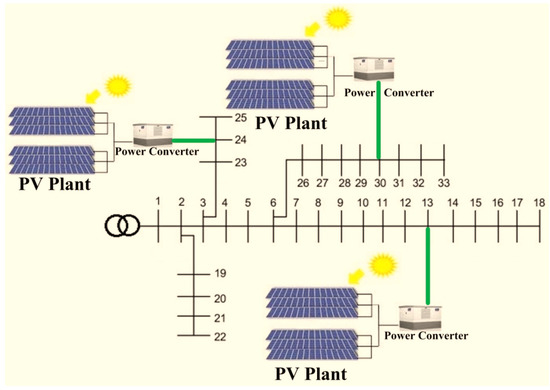
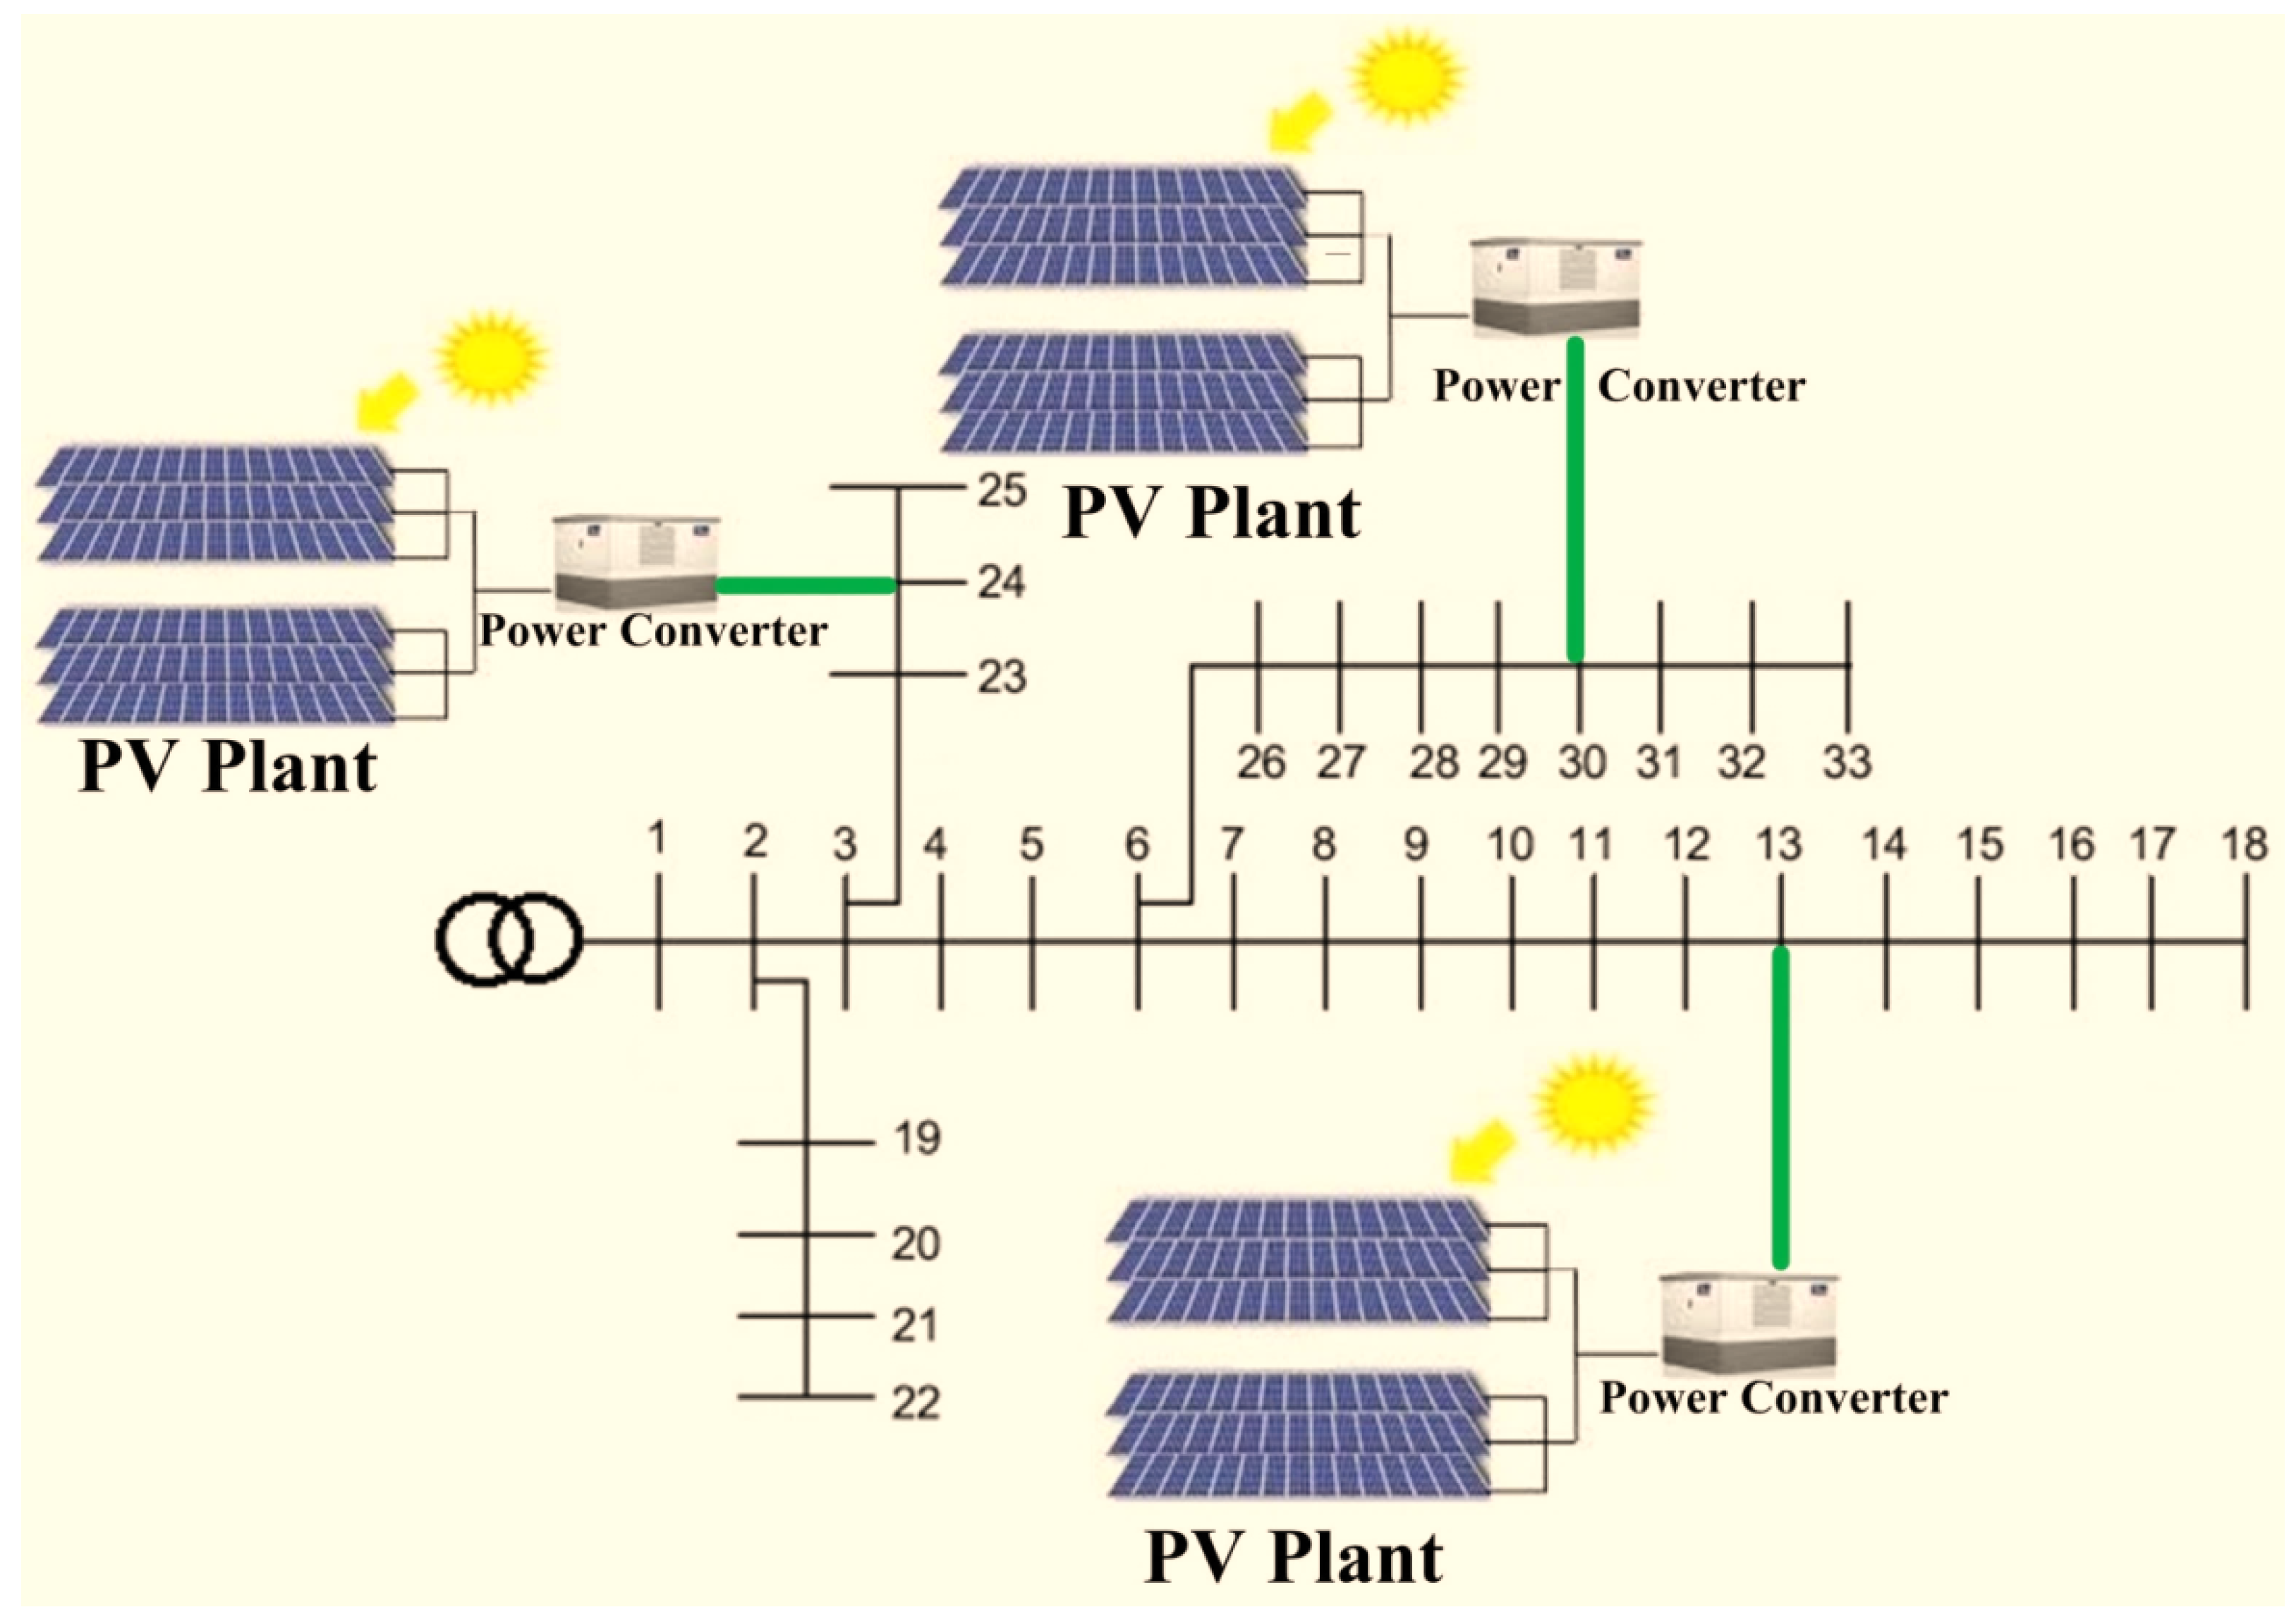
For further improvement, the problem is tested by installing two and three PV DGs in the power network. The results obtained are presented in Table 6. The overall active power losses decreased to 86.9 and 72.10 kW with the application of two and three PV DGs, respectively, using HHO. The comparative results are portrayed in Table 7 in terms of the best location and size of PV DGs. The locations suggested by HHO to install PV plants in IEEE 33 bus are depicted in Figure 6.
Table 7.
Comparative results for optimal location and values of PV DGs corresponding to case 2.
Figure 6.
IEEE 33 bus line diagram with PV plants at locations suggested by HHO.
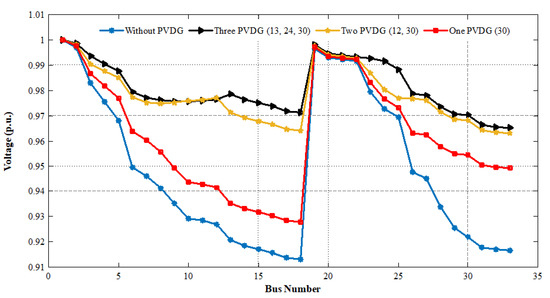
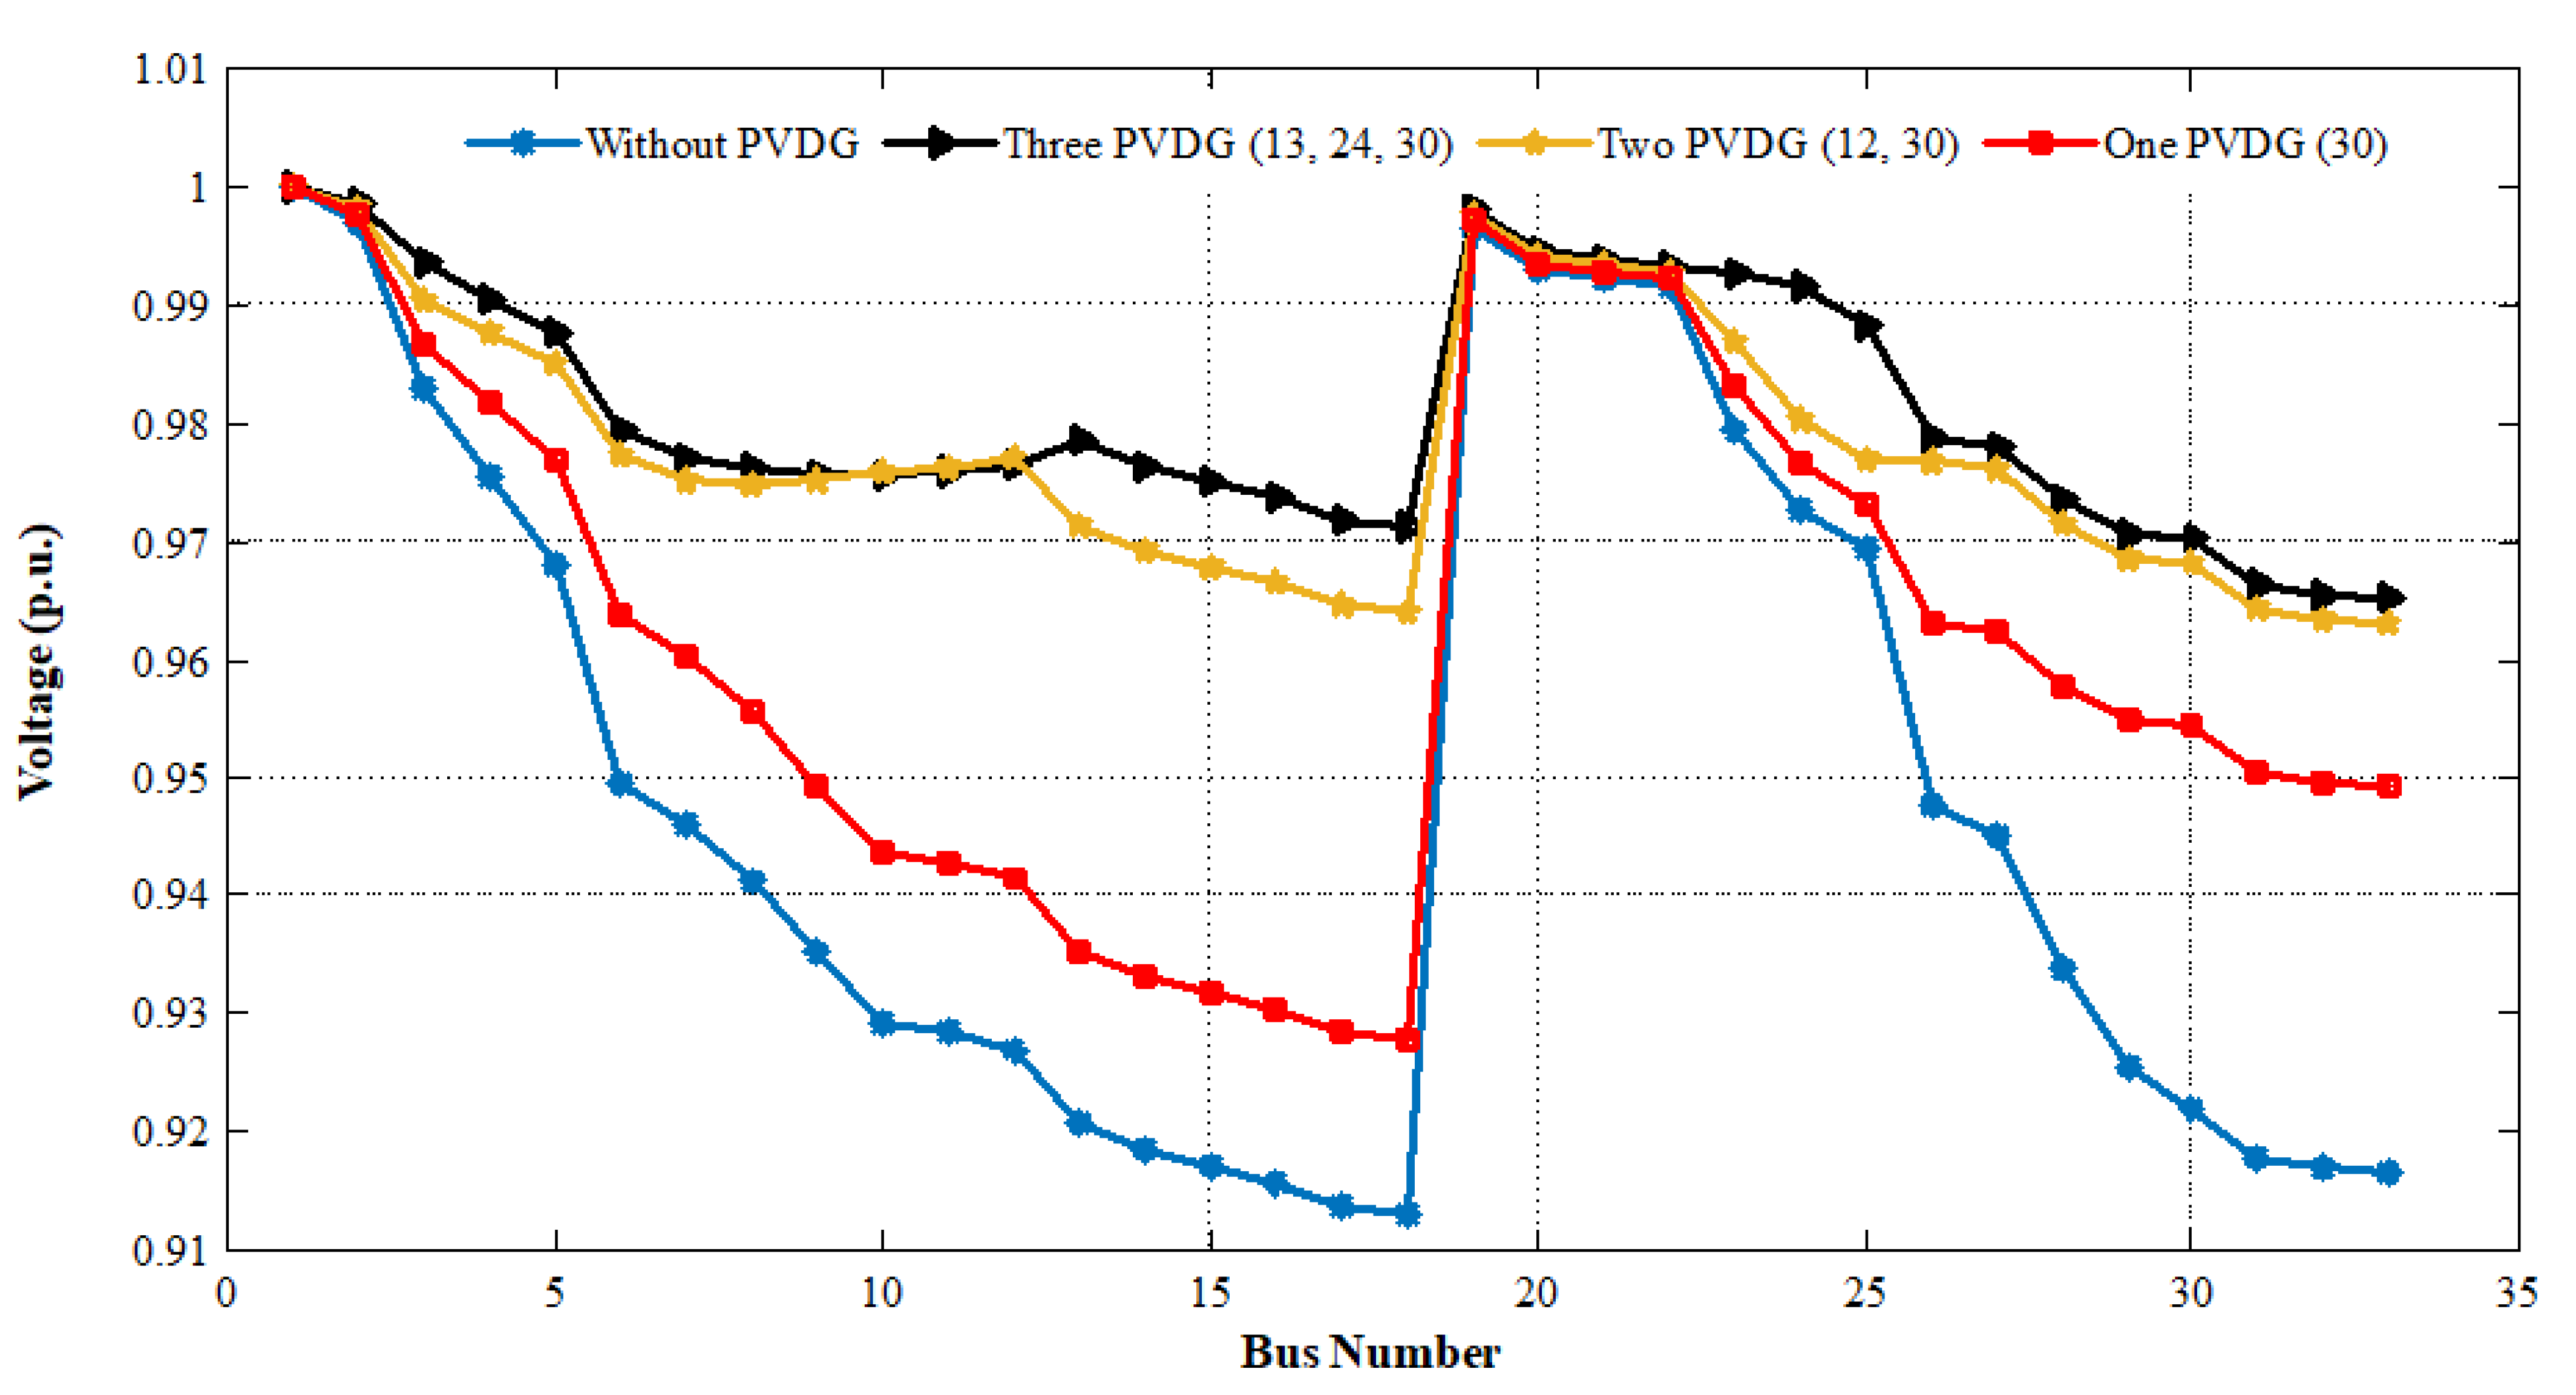
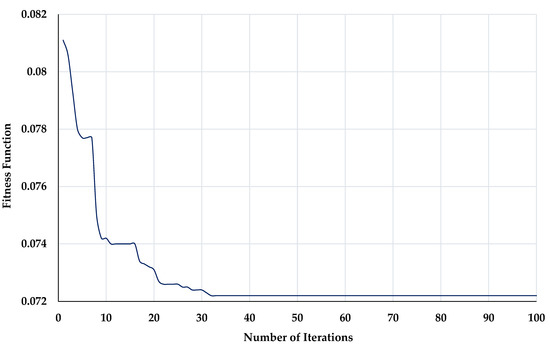
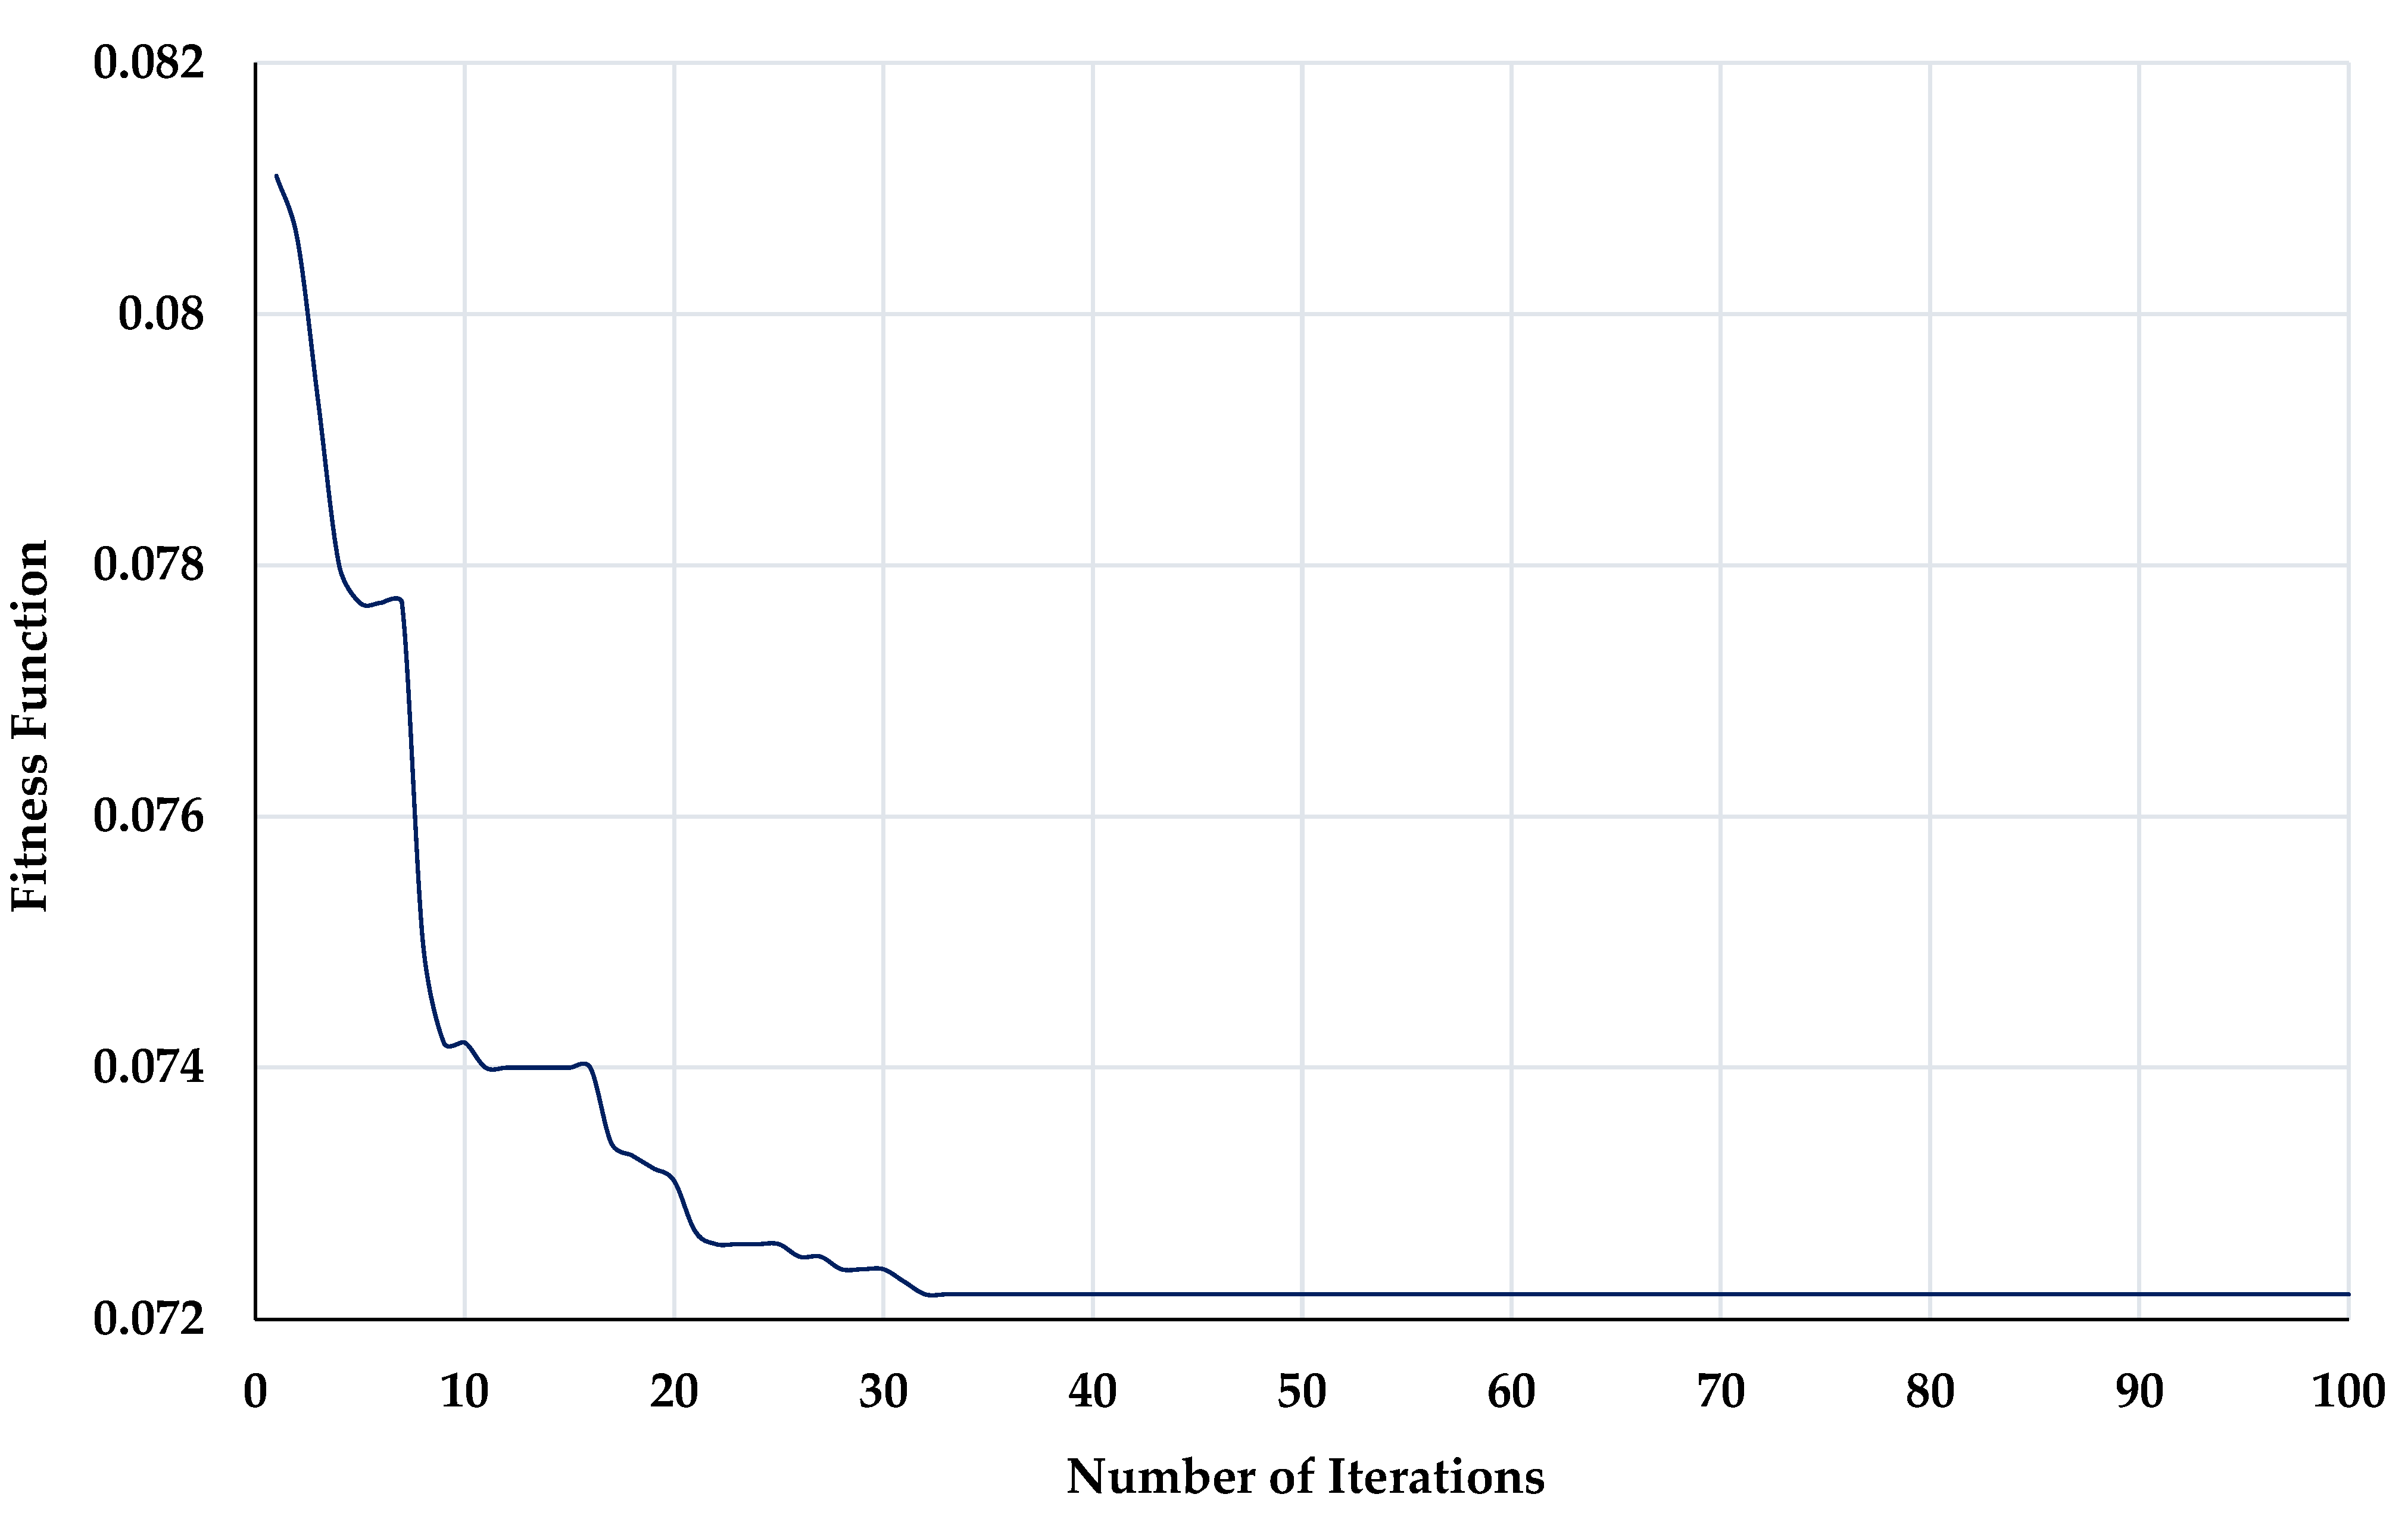
The size and location suggested by HHO (refer to Table 7) provide maximum reduction in losses as compared to TLBO [68], GA [69], PSO [69], GA/PSO [69], QOTLBO [68], CTLBO ε-method [70], IMOEHO [71], I-DBEA [72], CTLBO [70], and BA [39]. In addition, the voltage graph of all the buses obtained after utilization of PV DGs is showcased in Figure 7. The bus voltages are obtained from the load flow analysis. The bus voltage profile improves significantly under the application of three PV DGs at their respective optimal locations. The variation of fitness function against the number of iterations for installation with three PV DGs using HHO is showcased in Figure 8. The iterative graph shows that the HHO converges to an optimal solution value with very few iterations.
Figure 7.
Voltage graph for IEEE 33 bus system without and with PV DGs.
Figure 8.
Convergence characteristics of fitness function pertaining to case 2 (with three PV DG).
4.4. Case 3
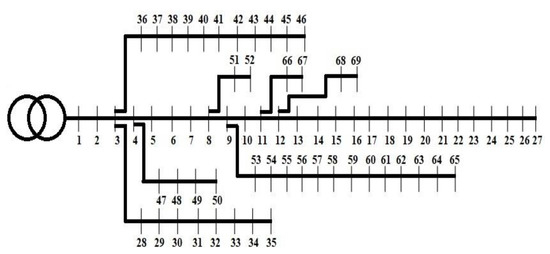
To test the effectiveness of the HHO on a larger system, the proposed approach is tested to find the suitable location and capacity (size) of the DGs in the IEEE 69 bus RDS test system where the load and branch data values may be obtained from [73]. The single line diagram of the IEEE 69-bus RDS is shown in Figure 9. IEEE 69-bus RDS consists of 69 buses, including 68 load buses and 1 generator bus. The generator is connected at bus no. 1 and a load of the required amount can be connected to the other buses. The total active power demand is 3.80 MW while reactive is 2.69 MVAR. Total power loss of the system is 224.9 kW.
Figure 9.
Single line diagram of IEEE 69-bus RDS.
For addressing the most suitable candidate buses for locating a PV DG using this approach for each individual bus, it is assumed that there is a PV DG at that bus at a time. For optimal sizing of a PV DG at this stage, it is assumed that the PV DG may produce electric power in all possible ranges (e.g., 0–1 MW). The proposed HHO algorithm is applied for the reduction/minimization of overall loss as the objective function of the problem. First, only one PV DG is used to relax the congestion and reduce losses in lines, and the results obtained are tabulated in Table 8. The installation of one optimum PV DG the line losses reduced by 48.86% with DG size of 0.95 MW.
Table 8.
Variation in power loss with change in an optimal allocation of PV DGs.
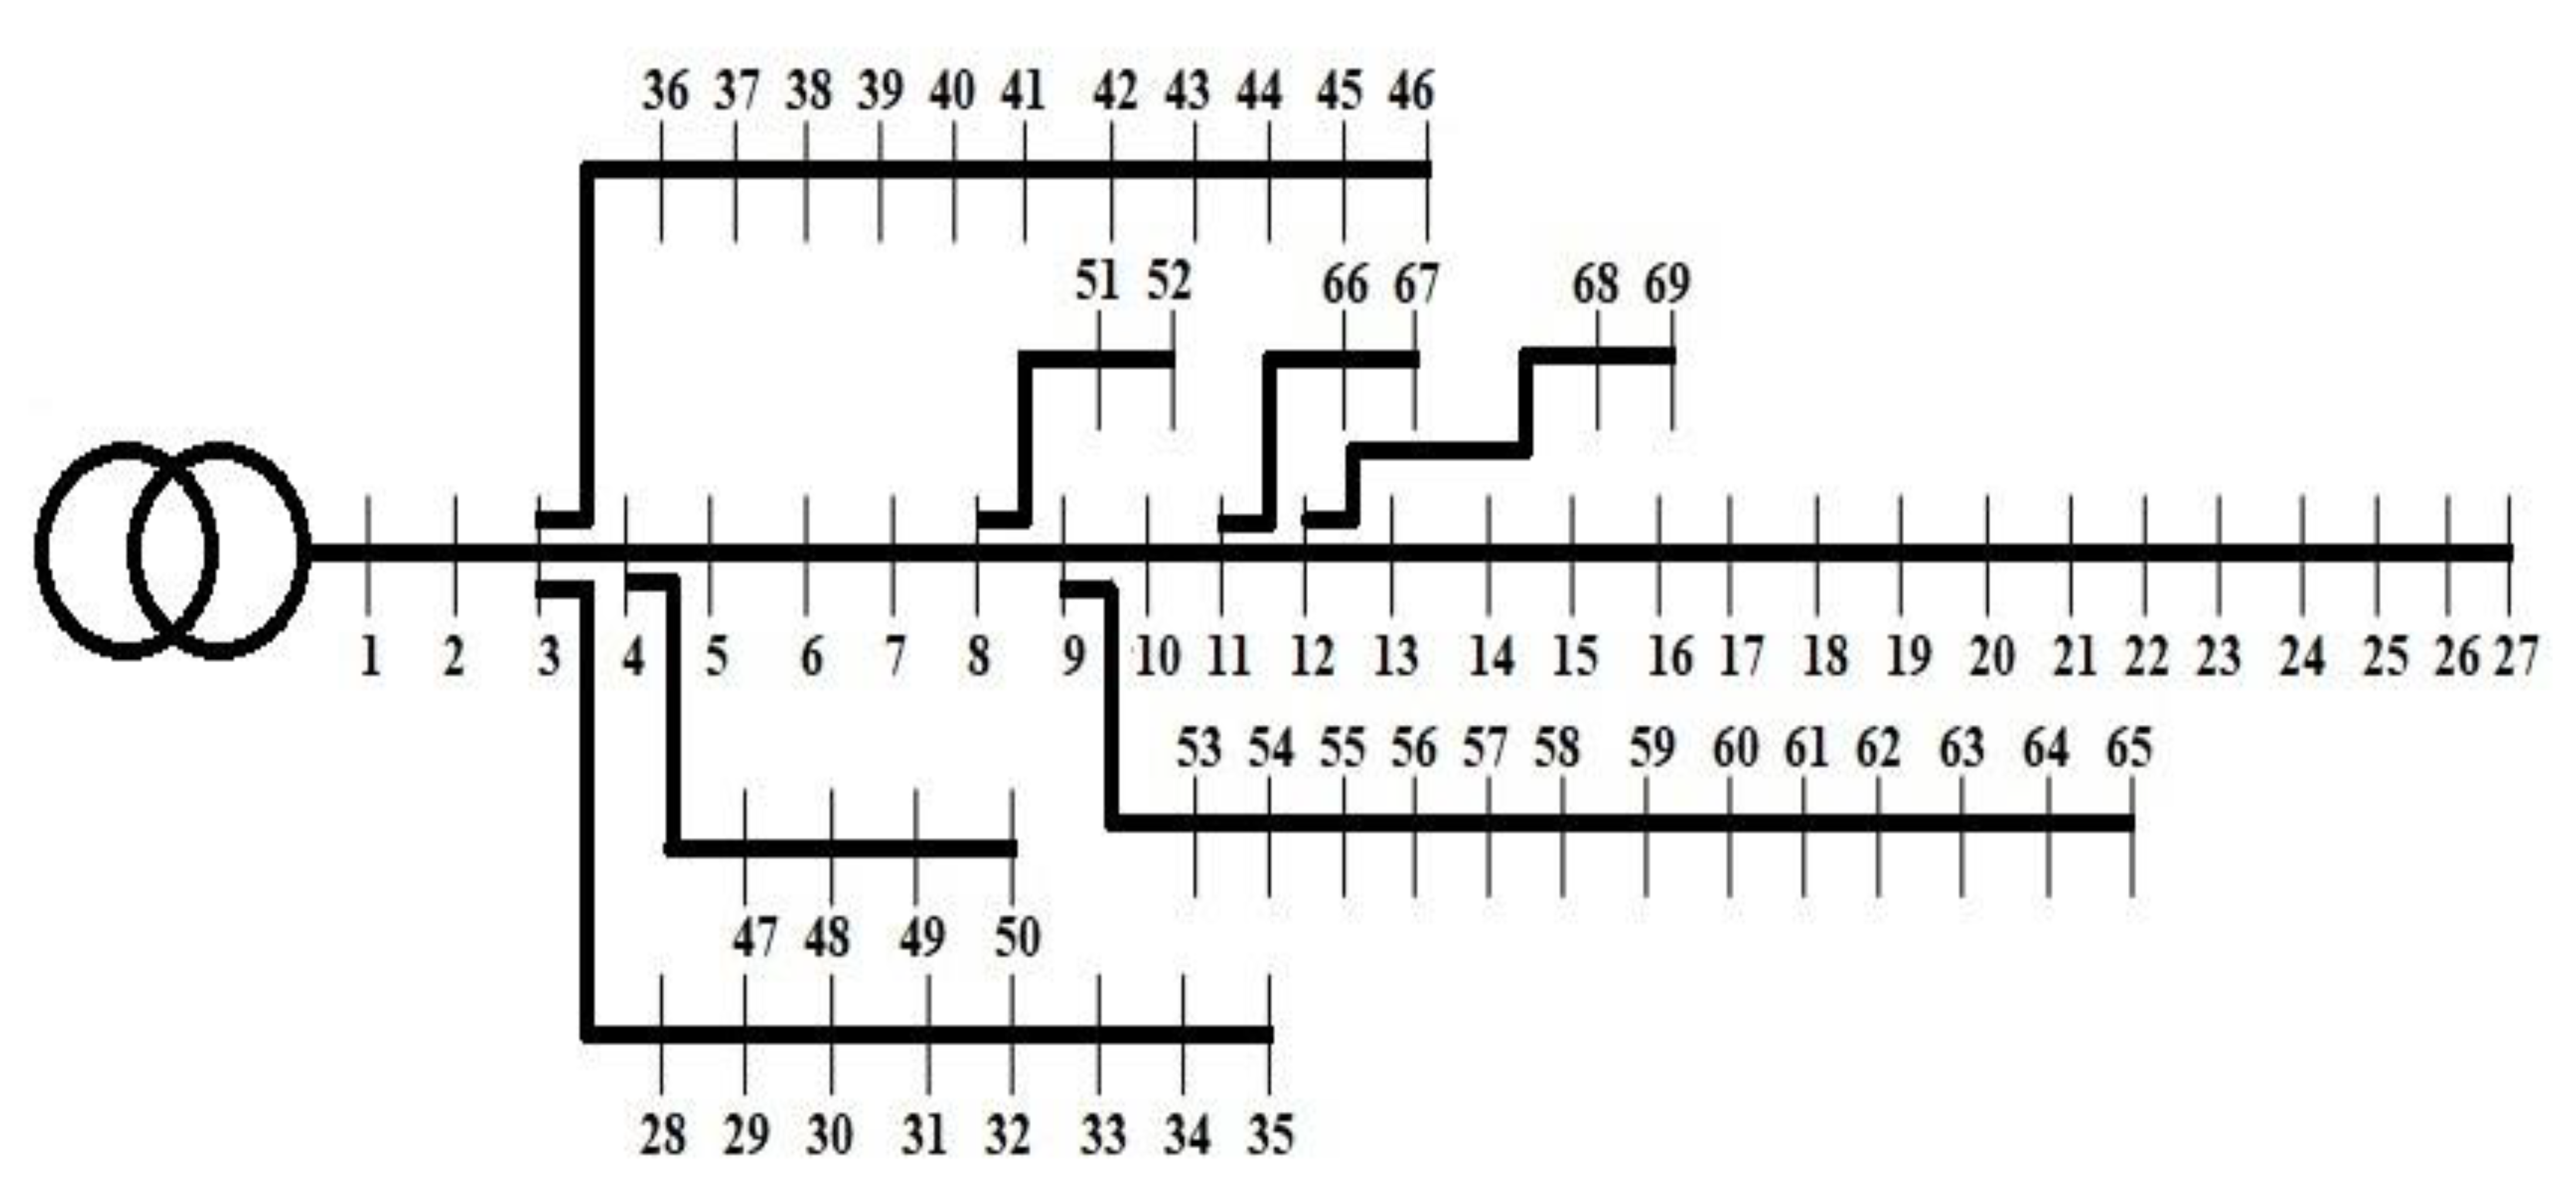
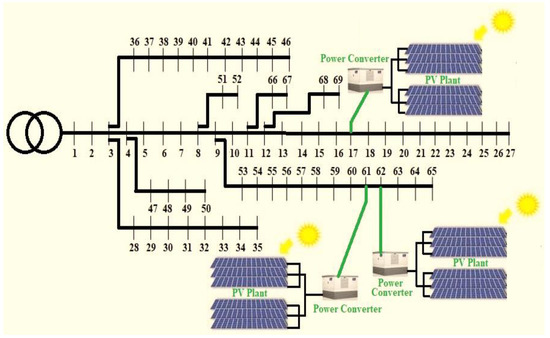
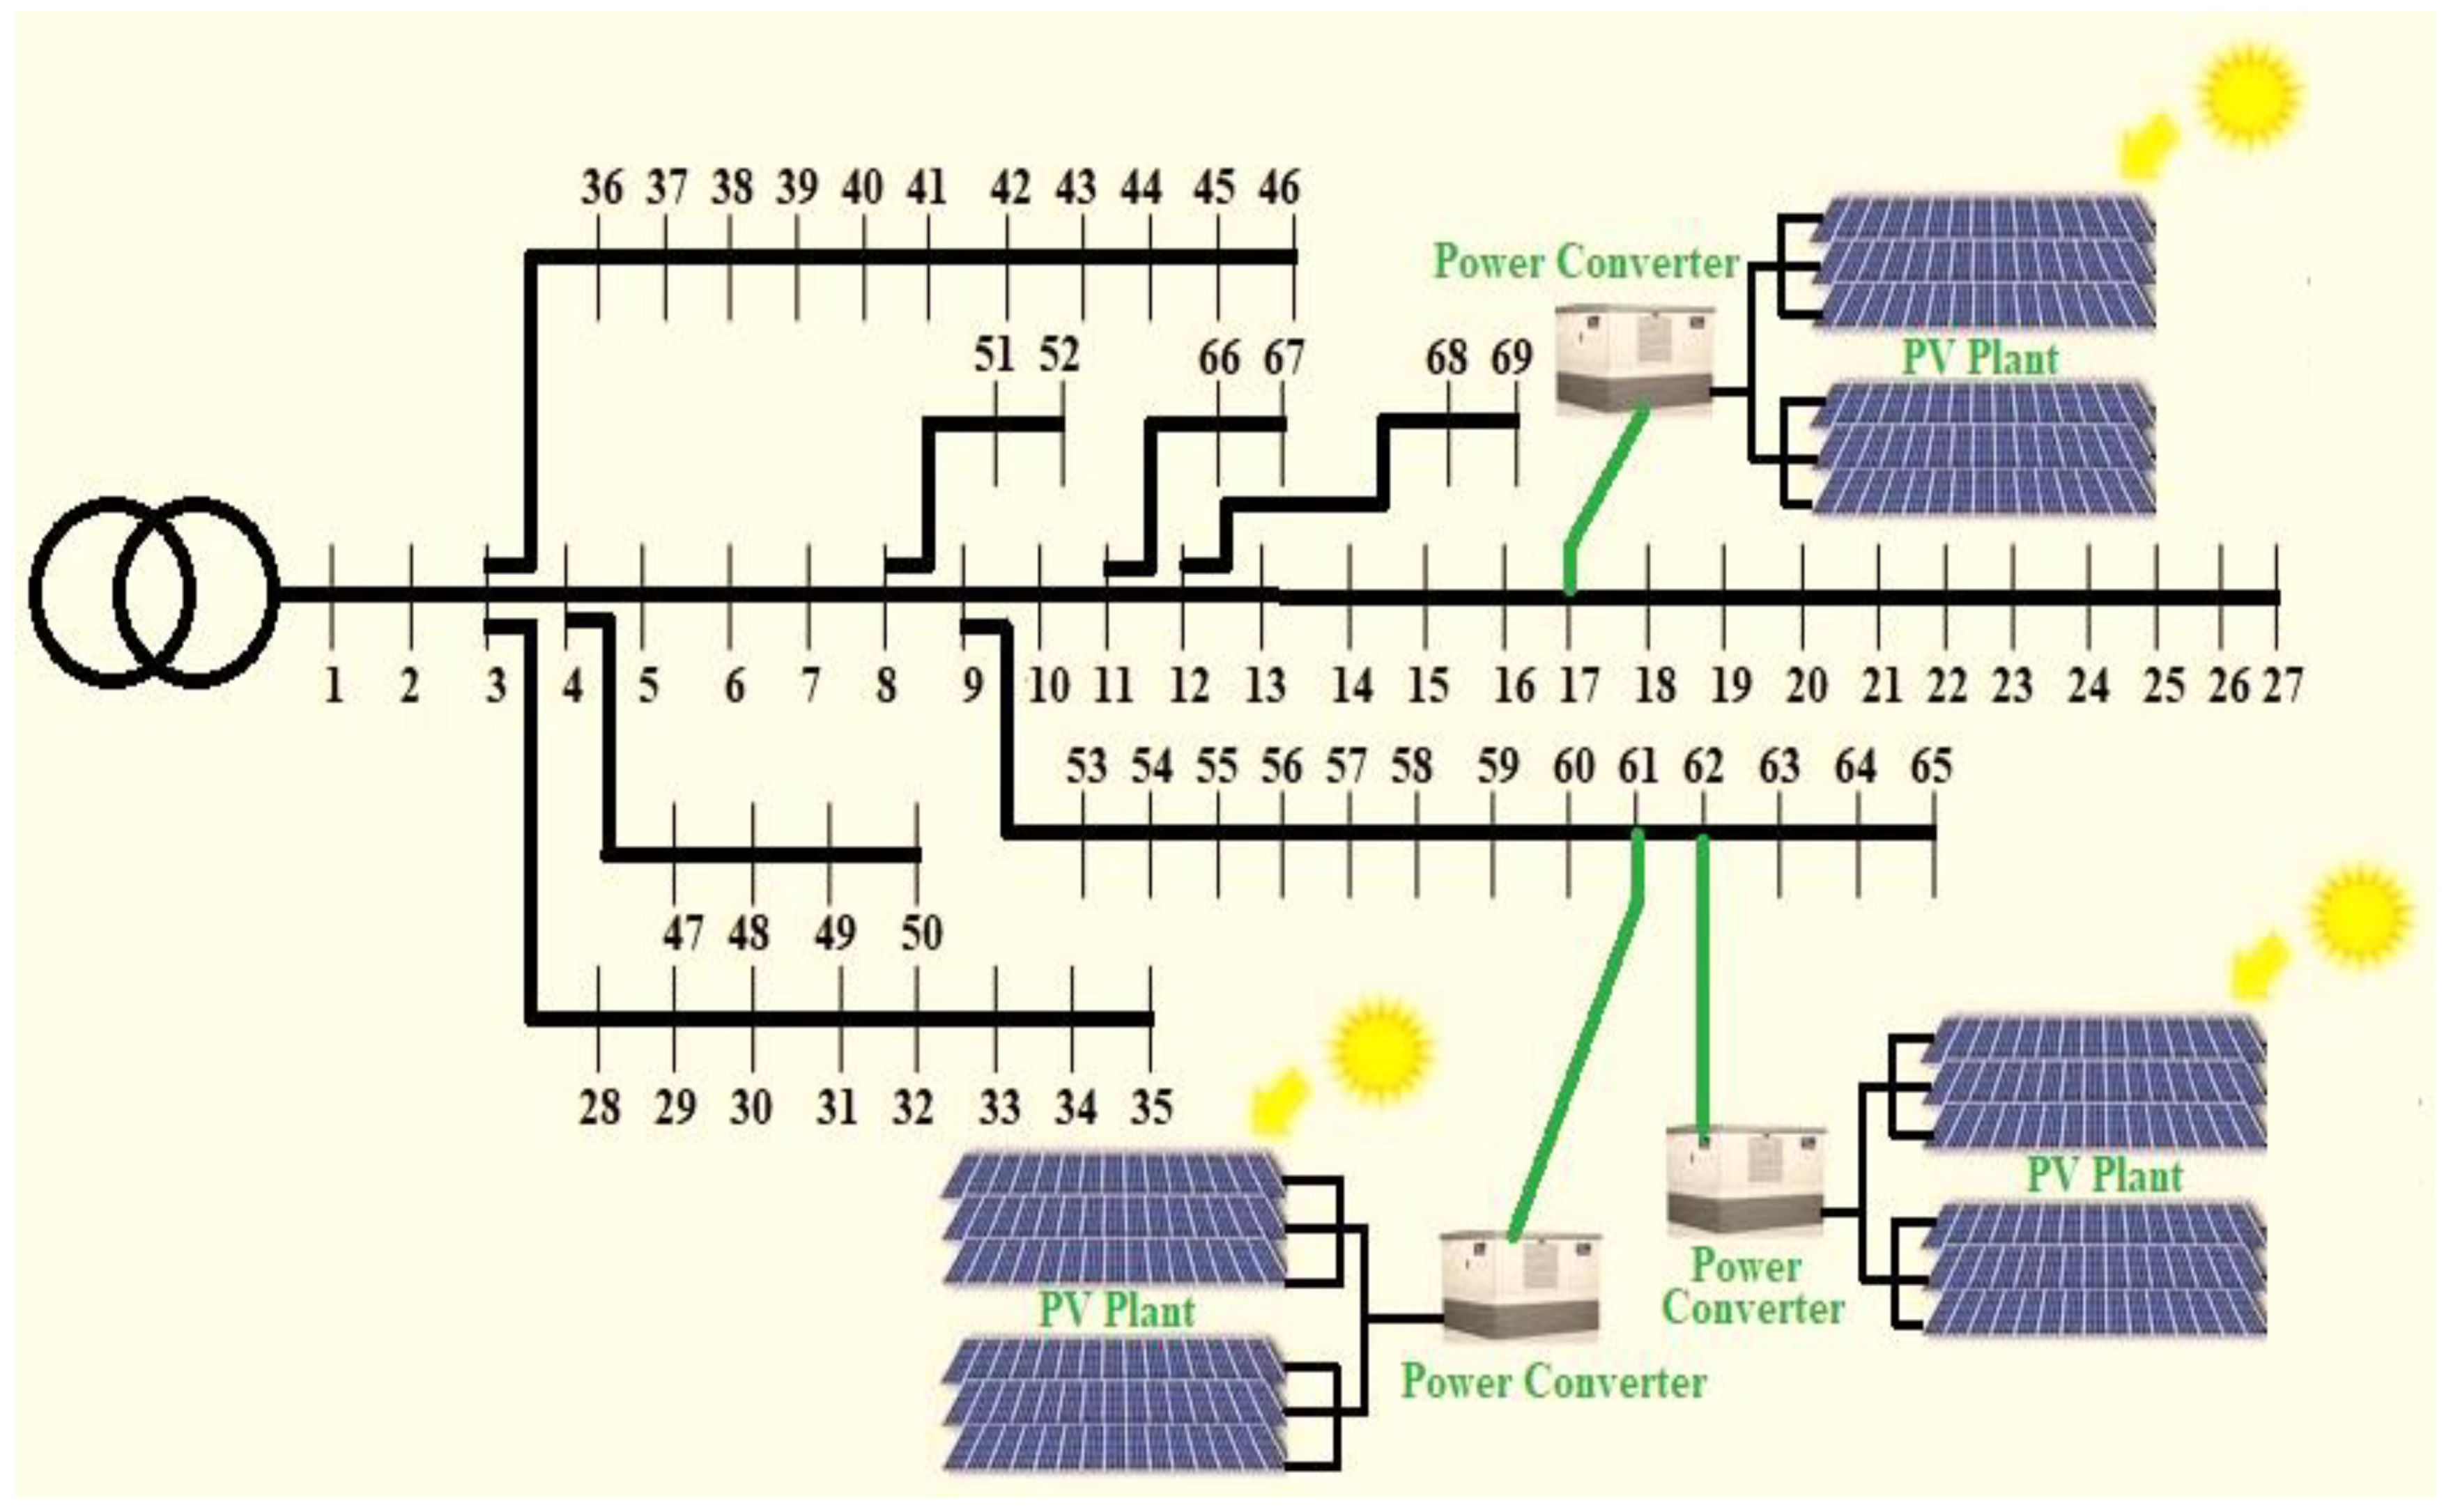
For further improvement, the problem is tested by installing two and three PV DGs in the power network. The results obtained are presented in Table 8. The overall active power losses decreased to 71.80 kW with the application of three PV DGs using HHO. The comparative results are portrayed in Table 9 in terms of the best location and size of PV DGs. The locations suggested by HHO to install PV plants in the IEEE 69 bus are depicted in Figure 10.
Table 9.
Comparative results for optimal location and values of PV DGs corresponding to case 3.
Figure 10.
IEEE 69 bus line diagram with PV plants at locations suggested by HHO.
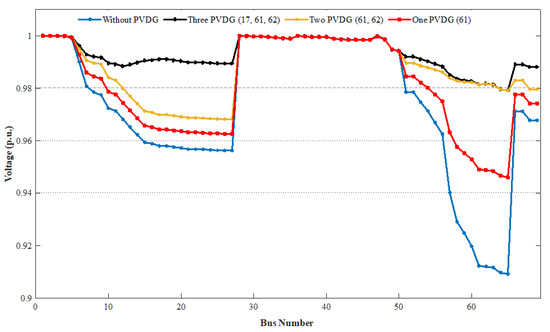
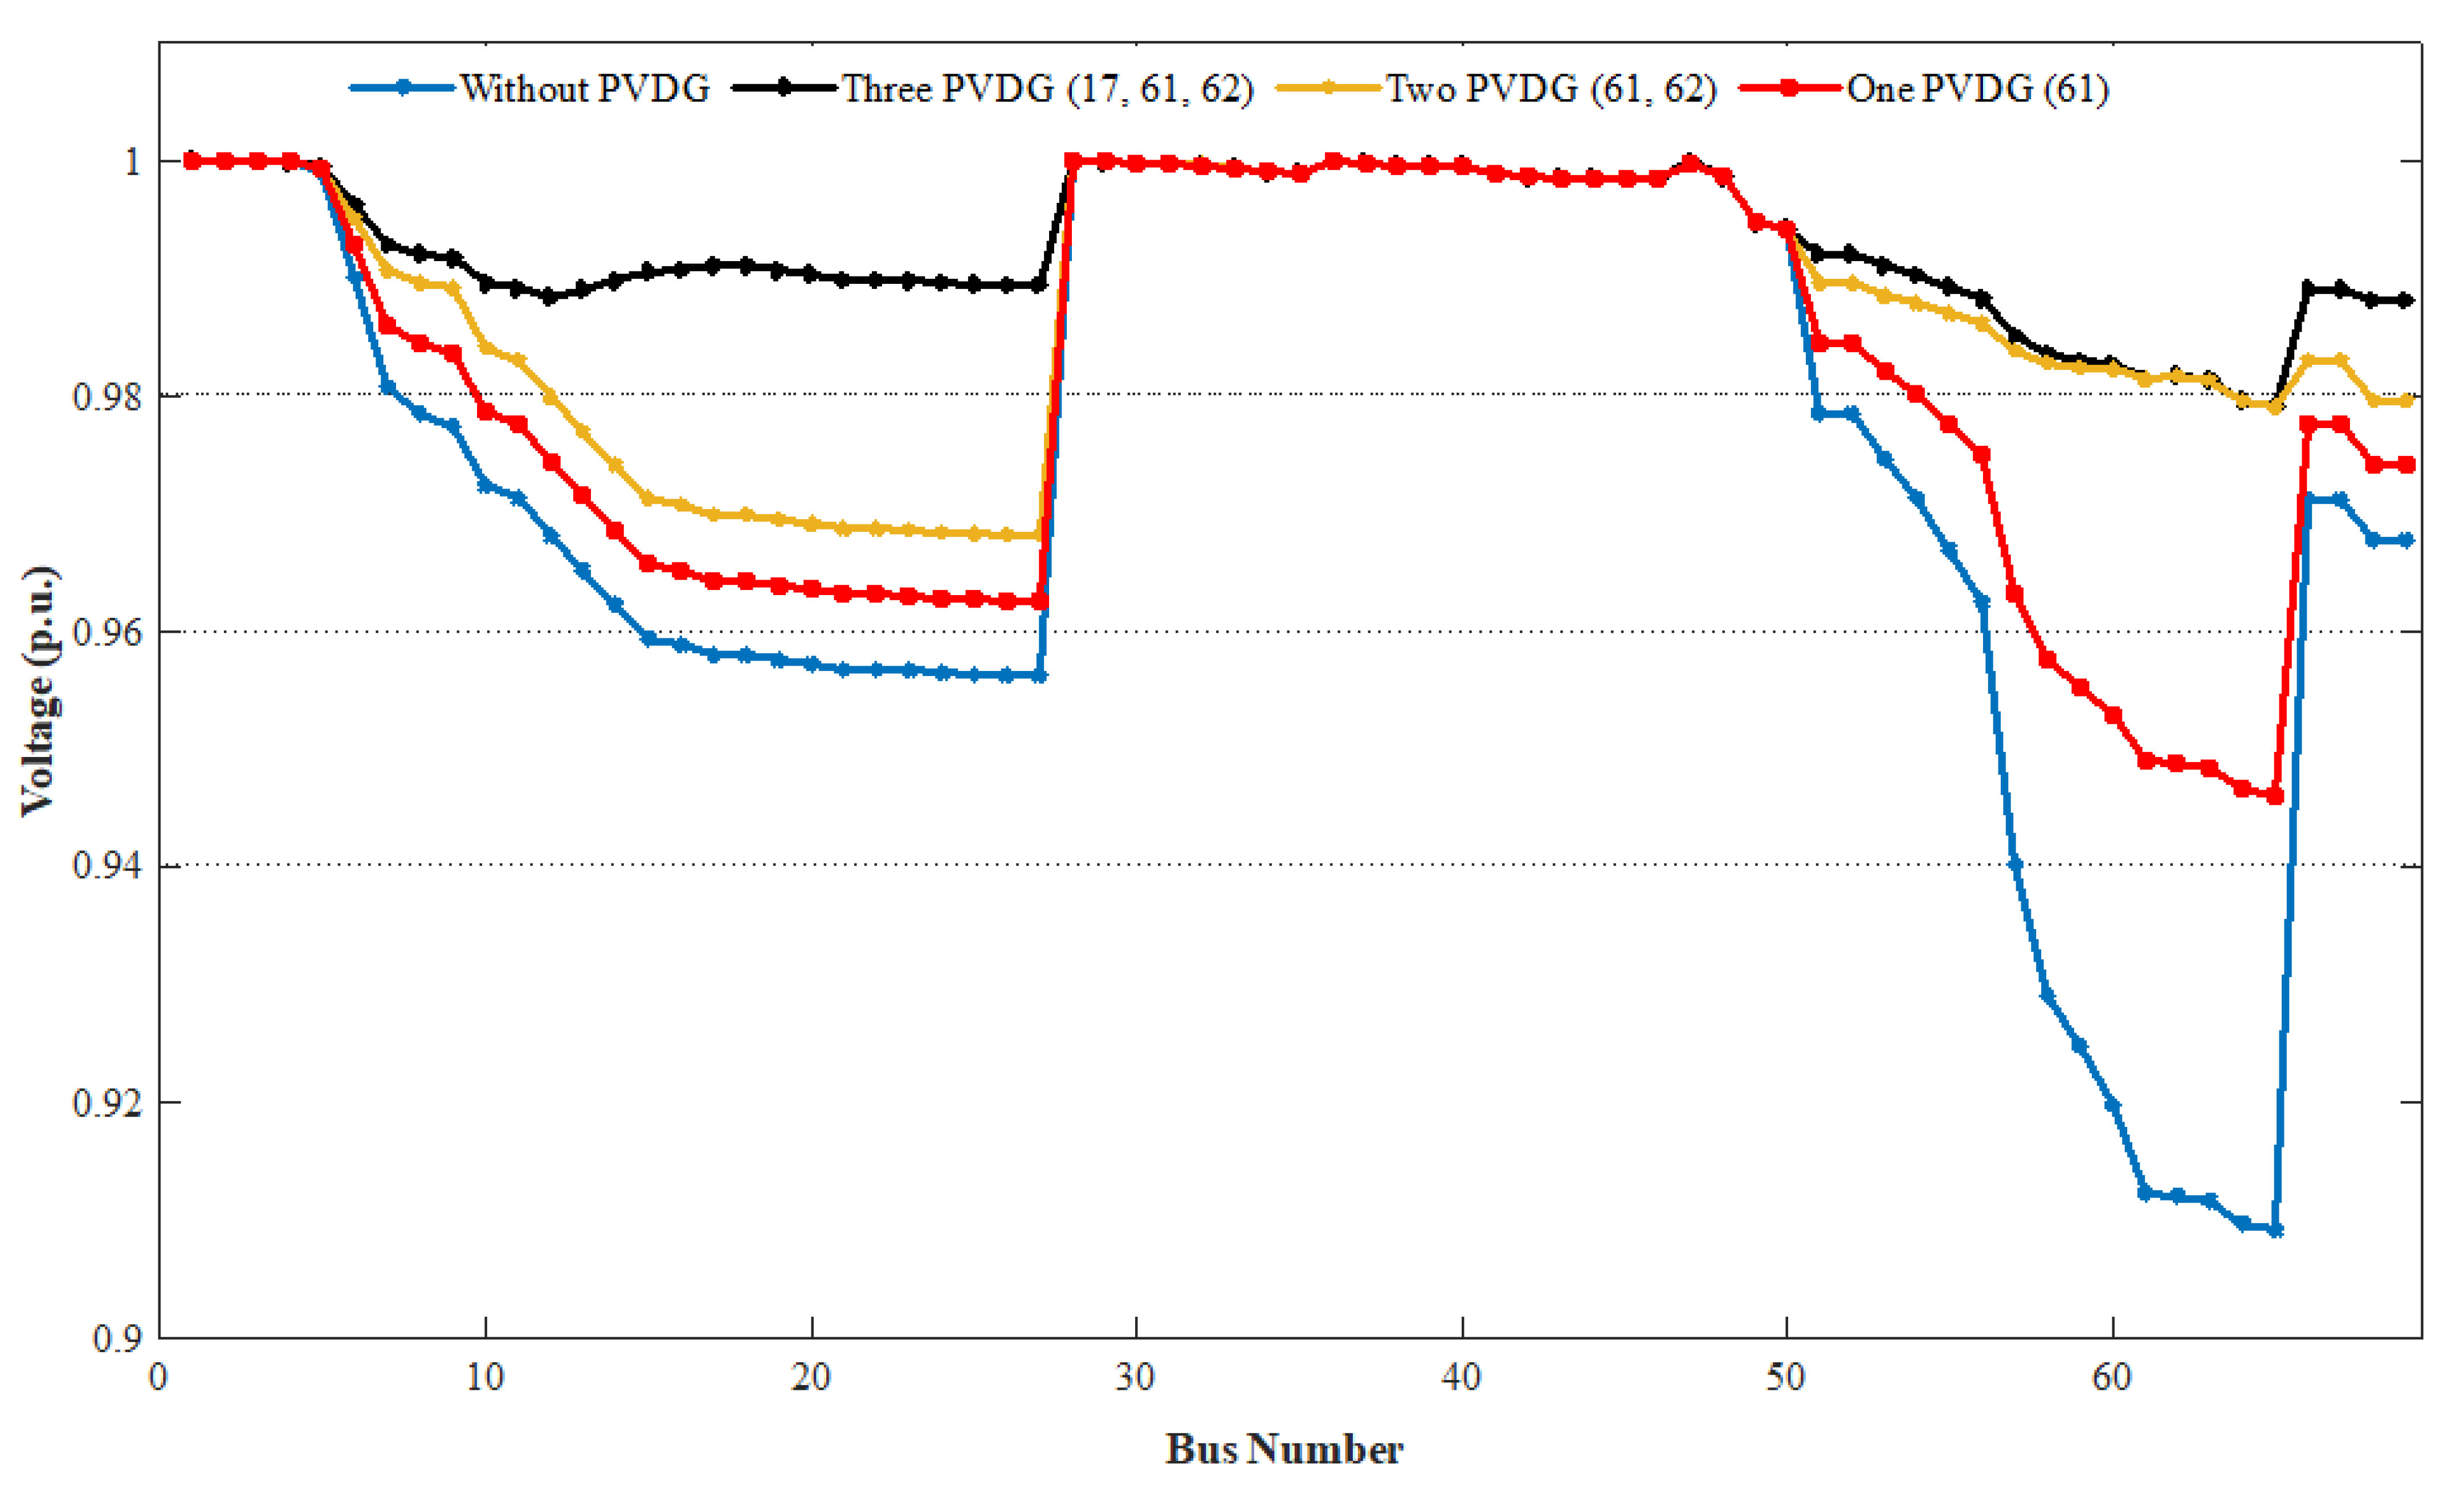
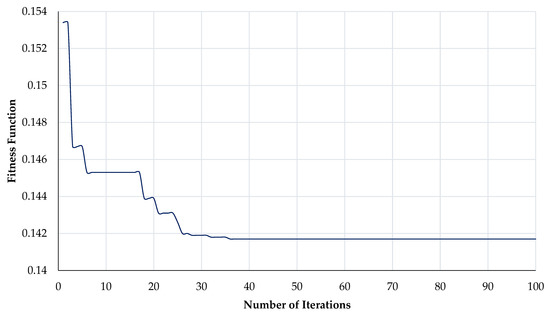
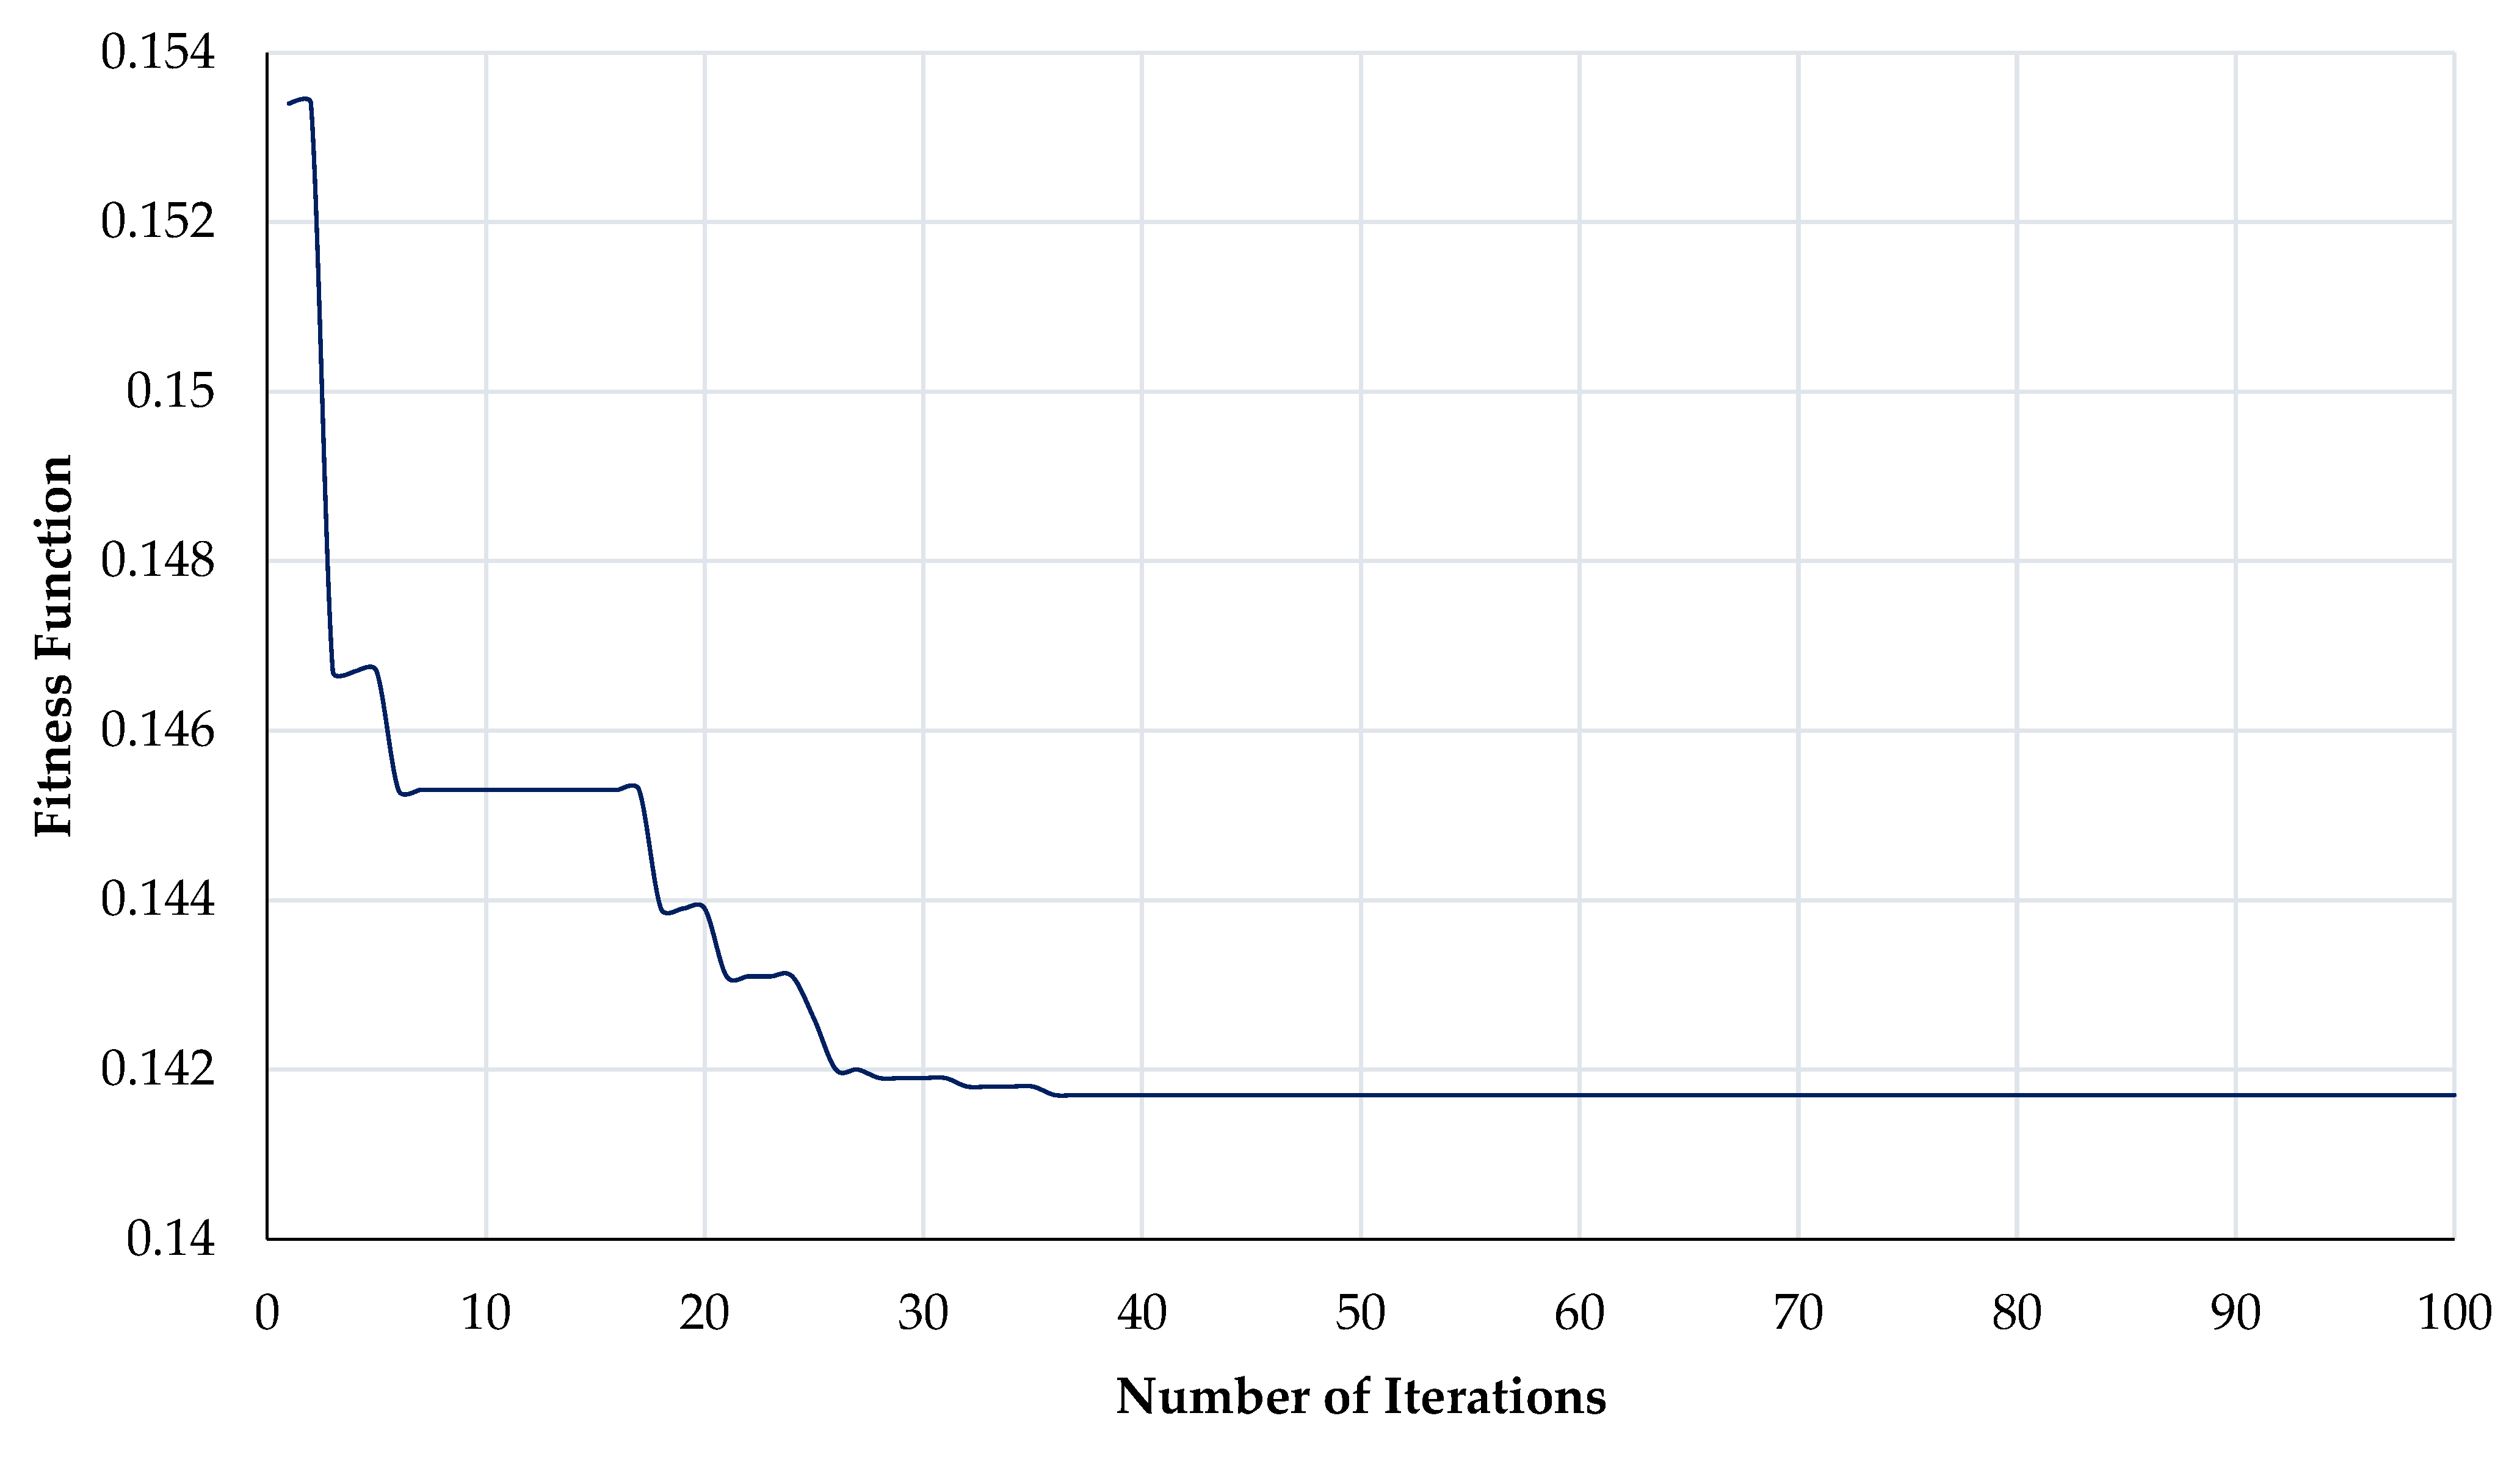
The size and location suggested by HHO (refer to Table 9) provides maximum reduction in losses as compared to GA [69], PSO [69], TLBO [68], GA/PSO [69], QOTLBO [68], CTLBO ε-method [70], I-DBEA [72], SA [74], CTLBO [70], IWO [75], BFOA [76], and MFO [77]. In addition, the voltage graph of all the buses obtained after utilization of PV DGs is showcased in Figure 11. The bus voltages are obtained from the load flow analysis. The bus voltage profile improves significantly under the application of three PV DGs at their respective optimal locations. The variation of fitness function against the number of iterations for installation with three PV DGs using HHO is showcased in Figure 12. The iterative graph shows that the HHO converges to an optimal solution value with very few iterations.
Figure 11.
Voltage graph for IEEE 69 bus system without and with PV DGs.
Figure 12.
Convergence characteristics of fitness function pertaining to case 3 (with three PV DGs).
5. Practical PV DG Size Analysis
The optimum allocation of PV DGs using HHO indicates (refer to Table 7) that PV DGs need to be installed at bus number 13, 24, and 30 in case 2 and at bus number 17, 61 and 62 in case 3 (refer to Table 9) for optimum results. The analysis based on calculation from Section 2.2 suggests that in case 2, power to be injected at bus number 13, 24, and 30 are 831, 950, and 950 kW, respectively. In case 3, power to be injected at bus number 17, 61, and 62 are 532.9, 950, and 822 kW, respectively. Practically, to inject the targeted power as calculated through HHO, DC overload needs to be considered as described in Section 2.2. The actual field size of the PV DG plant and the number of PV modules required for case 2 and case 3 are tabulated in Table 10.
Table 10.
Size of practical PV DG corresponding to case 2 and case 3 (with three PV DGs).
In case 2, the number of PV modules used in bus number 13 is 4728 to form a PV array of capacity 1.655 MWP. The PV array of capacity 1.891 MWP is proposed to be installed at bus number 24 and 30 using 5404 numbers of PV modules at each bus. In case 3, the practical size of the PV plant to be installed at bus number 17, 61, and 62 are of size 1.061, 1.892, and 1.637 MWP, respectively. The analysis shows that in practical conditions, approximately 50% DC overload exists on PV DGs installation. The allocation of PV DGs in-network without considering the practical size of the PV DG may lead to underperformance.
6. Conclusions
The proposed HHO-based approach is significantly effective in finding the optimum number, optimal locations, and optimal sizes of DGs. On conventional IEEE 33 and IEEE 69 bus test systems, the efficacy of the suggested technique is evaluated. With the employment of optimally sized DGs at their optimum location, voltage profiles of load buses are improved and the losses reduced noticeably. When more PV DGs are installed, the system’s performance improves. The comparison with the TLBO, GA, PSO, QOTLBO, CTLBO, CTLBO ε-method, IMOEHO, I-DBEA, SA, IWO, BFOA, MFO, and BA methods shows that the proposed method performs comparatively better among all. The active power loss is reduced by 64.42% and 68.07% using this approach with the installation of three PV DGs in IEEE 33 and IEEE 69 bus RDS, respectively. The collected findings demonstrate that the proposed technique reduces power loss by a greater proportion with a smaller DG size when compared to other algorithms, and it offers better convergence properties. According to the analysis, there is roughly a 50% DC overload on PV DGs installations under real-world situations. The in-network allocation of PV DGs without consideration of the PV DG’s realistic size may result in underperformance.
The HHO is established as a reliable optimization technique for tackling the congestion problem of power systems with the application of DGs. The proposed method provides an alternative way for both system operators and energy producers to tackle complex problems such as voltage instability, transmission congestion, and huge system losses in an impressive way. In addition, current work suggests the practical size of PV DGs that may be employed for producing effective outcomes.
Author Contributions
Writing—original draft, formal analysis, and validation, S.C.; writing—original draft, conceptualization, investigation, methodology, and software, S.V.; writing—original draft, resources, supervision, and visualization, A.S.; data curation, validation and investigation, R.M.E.; writing—review and editing, D.E.; writing—review and editing, L.M.-P.; All authors have read and agreed to the published version of the manuscript.
Funding
This research received no external funding.
Institutional Review Board Statement
Not applicable.
Informed Consent Statement
Not applicable.
Data Availability Statement
Not applicable.
Conflicts of Interest
The authors declare no conflict of interest.
References
- Sandhya, K.; Chatterjee, K. A review on the state of the art of proliferating abilities of distributed generation deployment for achieving resilient distribution system. J. Clean. Prod. 2021, 287, 125023. [Google Scholar] [CrossRef] [Scilit]
- Wang, H.; Wang, J.; Piao, Z.; Meng, X.; Sun, C.; Yuan, G.; Zhu, S. The optimal allocation and operation of an energy storage system with high penetration grid-connected photovoltaic systems. Sustainability 2020, 12, 6154. [Google Scholar] [CrossRef] [Scilit]
- Sahib, J.T.; Ghani, A.R.M.; Jano, Z.; Mohamed, H.I. Optimum allocation of distributed generation using PSO: IEEE test case studies evaluation. Int. J. Appl. Eng. Res. 2017, 12, 2900–2906. [Google Scholar]
- Saad, N.M.; Sujod, M.Z.; Hui Ming, L.; Abas, M.F.; Jadin, M.S.; Ishak, M.R.; Abdullah, N.R.H. Impacts of photovoltaic distributed generation location and size on distribution power system network. Int. J. Power Electron. Drive Syst. 2018, 9, 905. [Google Scholar] [CrossRef] [Scilit]
- Jabr, R.A. Linear decision rules for control of reactive power by distributed photovoltaic generators. IEEE Trans. Power Syst. 2018, 33, 2165–2174. [Google Scholar] [CrossRef] [Scilit]
- Al-Ammar, E.A.; Farzana, K.; Waqar, A.; Aamir, M.; Saifullah; Ul Haq, A.; Zahid, M.; Batool, M. ABC algorithm based optimal sizing and placement of DGs in distribution networks considering multiple objectives. Ain Shams Eng. J. 2021, 12, 697–708. [Google Scholar] [CrossRef] [Scilit]
- Kumawat, A.; Singh, P. Optimal placement of capacitor and DG for minimization of power loss using genetic algorithm and artificial bee colony algorithm. Int. Res. J. Eng. Technol. 2016, 3, 2482–2488. [Google Scholar]
- Zakaria, Y.Y.; Swief, R.A.; El-Amary, N.H.; Ibrahim, A.M. Optimal distributed generation allocation and sizing using genetic and ant colony algorithms. J. Phys. Conf. Ser. 2020, 1447, 012023. [Google Scholar] [CrossRef] [Scilit]
- Sambaiah, K.S.; Jayabarathi, T. Loss minimization techniques for optimal operation and planning of distribution systems: A review of different methodologies. Int. Trans. Electr. Energy Syst. 2020, 30, e12230. [Google Scholar] [CrossRef] [Scilit]
- Hassan, A.A.; Fahmy, F.H.; Nafeh, A.E.-S.A.; Abu-elmagd, M.A. Hybrid genetic multi objective/fuzzy algorithm for optimal sizing and allocation of renewable DG systems: Genetic/Fuzzy Optimization of Renewable DGS. Int. Trans. Electr. Energy Syst. 2016, 26, 2588–2617. [Google Scholar] [CrossRef] [Scilit]
- Patel, D.K.; Singh, D.; Singh, B. Genetic algorithm-based multi-objective optimization for distributed generations planning in distribution systems with constant impedance, constant current, constant power load models. Int. Trans. Electr. Energy Syst. 2020, 30, e12576. [Google Scholar] [CrossRef] [Scilit]
- Almabsout, E.A.; El-Sehiemy, R.A.; An, O.N.U.; Bayat, O. A hybrid local search-genetic algorithm for simultaneous placement of DG units and shunt capacitors in radial distribution systems. IEEE Access 2020, 8, 54465–54481. [Google Scholar] [CrossRef] [Scilit]
- Vatani, M.; Solati Alkaran, D.; Sanjari, M.J.; Gharehpetian, G.B. Multiple distributed generation units allocation in distribution network for loss reduction based on a combination of analytical and genetic algorithm methods. IET Gener. Transm. Distrib. 2016, 10, 66–72. [Google Scholar] [CrossRef] [Scilit]
- Madhusudhan, M.; Kumar, N.; Pradeepa, H. Optimal location and capacity of DG systems in distribution network using genetic algorithm. Int. J. Inf. Technol. 2021, 13, 155–162. [Google Scholar]
- Ayodele, T.R.; Ogunjuyigbe, A.S.O.; Akinola, O.O. Optimal location, sizing, and appropriate technology selection of distributed generators for minimizing power loss using genetic algorithm. J. Renew. Energy 2015, 2015, 83291. [Google Scholar] [CrossRef] [Scilit]
- Sattianadan, D.; Sudhakaran, M.; Dash, S.S.; Vijayakumar, K.; Ravindran, P. Optimal placement of DG in distribution system using genetic algorithm. In Swarm, Evolutionary, and Memetic Computing, 1st ed.; Panigrahi, B.K., Suganthan, P.N., Das, S., Dash, S.S., Eds.; Springer International Publishing: Cham, Switzerland, 2013; Volume 8298, pp. 639–647. [Google Scholar]
- Liu, L.; Xie, F.; Huang, Z.; Wang, M. Multi-objective coordinated optimal allocation of DG and EVCSs based on the V2G mode. Processes 2020, 9, 18. [Google Scholar] [CrossRef] [Scilit]
- Hassan, A.S.; Sun, Y.; Wang, Z. Multi-objective for optimal placement and sizing DG units in reducing loss of power and enhancing voltage profile using BPSO-SLFA. Energy Rep. 2020, 6, 1581–1589. [Google Scholar] [CrossRef] [Scilit]
- Fan, Z.; Yi, H.; Xu, J.; Liu, P.; Hou, H.; Cui, R.; Xie, C. Multi-objective planning of DGs considering ES and EV based on source-load spatiotemporal scenarios. IEEE Access 2020, 8, 216835–216843. [Google Scholar] [CrossRef] [Scilit]
- Liu, W.; Xu, H.; Niu, S.; Xie, J. Optimal distributed generator allocation method considering voltage control cost. Sustainability 2016, 8, 193. [Google Scholar] [CrossRef] [Scilit]
- Azam Muhammad, M.; Mokhlis, H.; Naidu, K.; Amin, A.; Fredy Franco, J.; Othman, M. Distribution network planning enhancement via network reconfiguration and DG integration using dataset approach and water cycle algorithm. J. Mod. Power Syst. Clean Energy 2020, 8, 86–93. [Google Scholar] [CrossRef] [Scilit]
- Phuangpornpitak, W.; Bhumkittipich, K. Principle optimal placement and sizing of single distributed generation for power loss reduction using particle swarm optimization. Res. J. Appl. Sci. Eng. Technol. 2014, 7, 1211–1216. [Google Scholar] [CrossRef] [Scilit]
- Tolba, M.A.; Tulsky, V.N.; Zaki Diab, A.A. Optimal allocation and sizing of multiple distributed generators in distribution networks using a novel hybrid particle swarm optimization algorithm. In Proceedings of the 2017 IEEE Conference of Russian Young Researchers in Electrical and Electronic Engineering (EIConRus), St. Petersburg/Moscow, Russia, 1–3 February 2017. [Google Scholar]
- Raj, V.; Kumar, B.K. An improved affine arithmetic-based optimal DG sizing and placement algorithm using PSO for radial distribution networks with uncertainty. In Proceedings of the 2020 21st National Power Systems Conference (NPSC), Gandhinagar, India, 17–19 December 2020. [Google Scholar]
- Katyara, S.; Shaikh, M.F.; Shaikh, S.; Khand, Z.H.; Staszewski, L.; Bhan, V.; Majeed, A.; Shah, M.A.; Zbigniew, L. Leveraging a Genetic Algorithm for the optimal placement of distributed generation and the need for energy management strategies using a fuzzy inference system. Electronics 2021, 10, 172. [Google Scholar] [CrossRef] [Scilit]
- Barik, S.; Das, D.; Bansal, R.C. Zero bus load flow method for the integration of renewable DGs by mixed-discrete particle swarm optimisation-based fuzzy max–min approach. IET Renew. Power Gener. 2020, 14, 4029–4042. [Google Scholar] [CrossRef] [Scilit]
- Bohre, A.K.; Agnihotri, G.; Dubey, M. Optimal sizing and sitting of DG with load models using soft computing techniques in practical distribution system. IET Gener. Transm. Distrib. 2016, 10, 2606–2621. [Google Scholar] [CrossRef] [Scilit]
- Yahaya, A.A.; AlMuhaini, M.; Heydt, G.T. Optimal design of hybrid DG systems for microgrid reliability enhancement. IET Gener. Transm. Distrib. 2020, 14, 816–823. [Google Scholar] [CrossRef] [Scilit]
- Cheng, R.; Jin, Y. A competitive swarm optimizer for large scale optimization. IEEE Trans. Cybern. 2015, 45, 191–204. [Google Scholar] [CrossRef] [Scilit] [PubMed]
- Ganguly, S. Multi-objective planning for reactive power compensation of radial distribution networks with unified power quality conditioner allocation using particle swarm optimization. IEEE Trans. Power Syst. 2014, 29, 1801–1810. [Google Scholar] [CrossRef] [Scilit]
- Tolabi, H.B.; Ali, M.H.; Rizwan, M. Simultaneous Reconfiguration, Optimal Placement of DSTATCOM, and Photovoltaic Array in a Distribution System Based on Fuzzy-ACO Approach. IEEE Trans. Sustain. Energy. 2015, 6, 210–218. [Google Scholar] [CrossRef] [Scilit]
- Oloulade, A.; Imano Moukengue, A.; Agbokpanzo, R.; Vianou, A.; Tamadaho, H.; Badarou, R. New multi objective approach for optimal network reconfiguration in electrical distribution systems using modified ant colony algorithm. Am. J. Electr. Power Energy Syst. 2019, 8, 120. [Google Scholar] [CrossRef] [Scilit]
- Das, C.K.; Bass, O.; Kothapalli, G.; Mahmoud, T.S.; Habibi, D. Optimal placement of distributed energy storage systems in distribution networks using artificial bee colony algorithm. Appl. Energy 2018, 232, 212–228. [Google Scholar] [CrossRef] [Scilit]
- Seker, A.A.; Hocaoglu, M.H. Artificial Bee Colony algorithm for optimal placement and sizing of distributed generation. In Proceedings of the 2013 8th International Conference on Electrical and Electronics Engineering (ELECO), Bursa, Turkey, 28–30 November 2013. [Google Scholar]
- Yuvaraj, T.; Ravi, K. Multi-objective simultaneous DG and DSTATCOM allocation in radial distribution networks using cuckoo searching algorithm. Alex. Eng. J. 2018, 57, 2729–2742. [Google Scholar] [CrossRef] [Scilit]
- Arya, L.D.; Koshti, A. Modified shuffled frog leaping optimization algorithm based distributed generation rescheduling for loss minimization. J. Inst. Eng. (India) Ser. B 2018, 99, 397–405. [Google Scholar] [CrossRef] [Scilit]
- Rajaram, R.; Sathish Kumar, K.; Rajasekar, N. Power system reconfiguration in a radial distribution network for reducing losses and to improve voltage profile using modified plant growth simulation algorithm with Distributed Generation (DG). Energy Rep. 2015, 1, 116–122. [Google Scholar] [CrossRef] [Scilit]
- Othman, M.M.; El-Khattam, W.; Hegazy, Y.G.; Abdelaziz, A.Y. Optimal placement and sizing of distributed generators in unbalanced distribution systems using supervised big bang-big crunch method. IEEE Trans. Power Syst. 2015, 30, 911–919. [Google Scholar] [CrossRef] [Scilit]
- Yuvaraj, T.; Ravi, K.; Devabalaji, K.R. DSTATCOM allocation in distribution networks considering load variations using bat algorithm. Ain Shams Eng. J. 2017, 8, 391–403. [Google Scholar] [CrossRef] [Scilit]
- Duong, M.; Pham, T.; Nguyen, T.; Doan, A.; Tran, H. Determination of optimal location and sizing of solar photovoltaic distribution generation units in radial distribution systems. Energies 2019, 12, 174. [Google Scholar] [CrossRef] [Scilit]
- Al-Bazoon, M. Harris Hawks Optimization for optimum design of truss structures with discrete variables. Int. J. Math. Eng. Manag. Sci. 2021, 6, 1157–1173. [Google Scholar]
- Moayedi, H.; Osouli, A.; Nguyen, H.; Rashid, A.S.A. A novel Harris hawks’ optimization and k-fold cross-validation predicting slope stability. Eng. Comput. 2021, 37, 369–379. [Google Scholar] [CrossRef] [Scilit]
- Paital, S.R.; Ray, P.K.; Mohanty, S.R. A robust dual interval type-2 fuzzy lead-lag based UPFC for stability enhancement using Harris Hawks Optimization. ISA Trans. 2021. [Google Scholar] [CrossRef] [Scilit]
- Parsa, P.; Naderpour, H. Shear strength estimation of reinforced concrete walls using support vector regression improved by Teaching–learning-based optimization, Particle Swarm optimization, and Harris Hawks Optimization algorithms. J. Build. Eng. 2021, 44, 102593. [Google Scholar] [CrossRef] [Scilit]
- Bandyopadhyay, R.; Basu, A.; Cuevas, E.; Sarkar, R. Harris Hawks optimisation with Simulated Annealing as a deep feature selection method for screening of COVID-19 CT-scans. Appl. Soft Comput. 2021, 111, 107698. [Google Scholar] [CrossRef] [Scilit]
- Abd Elaziz, M.; Yousri, D. Automatic selection of heavy-tailed distributions-based synergy Henry gas solubility and Harris hawk optimizer for feature selection: Case study drug design and discovery. Artif. Intell. Rev. 2021, 54, 4685–4730. [Google Scholar] [CrossRef] [Scilit]
- Malik, A.; Tikhamarine, Y.; Sammen, S.S.; Abba, S.I.; Shahid, S. Prediction of meteorological drought by using hybrid support vector regression optimized with HHO versus PSO algorithms. Environ. Sci. Pollut. Res. Int. 2021, 28, 39139–39158. [Google Scholar] [CrossRef] [Scilit]
- Sharma, R.; Prakash, S. HHO-LPWSN: Harris hawks optimization algorithm for sensor nodes localization problem in wireless sensor networks. ICST Trans. Scalable Inf. Syst. 2018, 168807. [Google Scholar] [CrossRef] [Scilit]
- Gerey, A.; Sarraf, A.; Ahmadi, H. Groundwater single- and multiobjective optimization using Harris Hawks and Multiobjective Billiards-inspired algorithm. Shock Vib. 2021, 2021, 4531212. [Google Scholar]
- Setiawan, I.N.; Kurniawan, R.; Yuniarto, B.; Caraka, R.E.; Pardamean, B. Parameter optimization of support vector regression using Harris hawks optimization. Procedia Comput. Sci. 2021, 179, 17–24. [Google Scholar] [CrossRef] [Scilit]
- Mansoor, M.; Mirza, A.F.; Ling, Q. Harris hawk optimization-based MPPT control for PV systems under partial shading conditions. J. Clean. Prod. 2020, 274, 122857. [Google Scholar] [CrossRef] [Scilit]
- Seyfollahi, A.; Ghaffari, A. Reliable data dissemination for the Internet of Things using Harris hawks optimization. Peer Peer Netw. Appl. 2020, 13, 1886–1902. [Google Scholar] [CrossRef] [Scilit]
- Rodríguez-Esparza, E.; Zanella-Calzada, L.A.; Oliva, D.; Heidari, A.A.; Zaldivar, D.; Pérez-Cisneros, M.; Foong, L.K. An efficient Harris hawks-inspired image segmentation method. Expert Syst. Appl. 2020, 155, 113428. [Google Scholar] [CrossRef] [Scilit]
- Tikhamarine, Y.; Souag-Gamane, D.; Ahmed, A.N.; Sammen, S.S.; Kisi, O.; Huang, Y.F.; El-Shafie, A. Rainfall-runoff modelling using improved machine learning methods: Harris hawks optimizer vs. particle swarm optimization. J. Hydrol. 2020, 589, 125133. [Google Scholar] [CrossRef] [Scilit]
- Jia, H.; Peng, X.; Kang, L.; Li, Y.; Jiang, Z.; Sun, K. Pulse coupled neural network based on Harris hawks optimization algorithm for image segmentation. Multimed. Tools Appl. 2020, 79, 28369–28392. [Google Scholar] [CrossRef] [Scilit]
- Sammen, S.S.; Ghorbani, M.A.; Malik, A.; Tikhamarine, Y.; AmirRahmani, M.; Al-Ansari, N.; Chau, K.-W. Enhanced artificial neural network with Harris hawks optimization for predicting scour depth downstream of ski-jump spillway. Appl. Sci. 2020, 10, 5160. [Google Scholar] [CrossRef] [Scilit]
- Islam, M.Z.; Wahab, N.I.A.; Veerasamy, V.; Hizam, H.; Mailah, N.F.; Guerrero, J.M.; Mohd Nasir, M.N. A Harris Hawks Optimization based single- and multi-objective Optimal Power Flow considering environmental emission. Sustainability 2020, 12, 5248. [Google Scholar] [CrossRef] [Scilit]
- Khalifeh, S.; Akbarifard, S.; Khalifeh, V.; Zallaghi, E. Optimization of water distribution of network systems using the Harris Hawks optimization algorithm (Case study: Homashahr city). MethodsX 2020, 7, 100948. [Google Scholar] [CrossRef] [Scilit]
- Yousri, D.; Babu, T.S.; Fathy, A. Recent methodology based Harris Hawks optimizer for designing load frequency control incorporated in multi-interconnected renewable energy plants. Sustain. Energy Grids Netw. 2020, 22, 100352. [Google Scholar] [CrossRef] [Scilit]
- Abbasi, A.; Firouzi, B.; Sendur, P. On the application of Harris hawks optimization (HHO) algorithm to the design of microchannel heat sinks. Eng. Comput. 2021, 37, 1409–1428. [Google Scholar] [CrossRef] [Scilit]
- Teng, J.-H.; Luan, S.-W.; Lee, D.-J.; Huang, Y.-Q. Optimal charging/discharging scheduling of battery storage systems for distribution systems interconnected with sizeable PV generation systems. IEEE Trans. Power Syst. 2013, 28, 1425–1433. [Google Scholar] [CrossRef] [Scilit]
- Chakraborty, S.; Kumar, R. Comparative analysis of NOCT values for mono and multi C-Si PV modules in Indian climatic condition. World J. Eng. 2015, 12, 19–22. [Google Scholar] [CrossRef] [Scilit]
- Chakraborty, S. Reliable energy prediction method for grid connected photovoltaic power plants situated in hot and dry climatic condition. SN Appl. Sci. 2020, 2, 317. [Google Scholar] [CrossRef] [Scilit]
- Hassan, A.S.; Othman, E.A.; Bendary, F.M.; Ebrahim, M.A. Distribution systems techno-economic performance optimization through renewable energy resources integration. Array 2021, 9, 100050. [Google Scholar] [CrossRef] [Scilit]
- Mechanical Characteristics Electrical Characteristics PERC 350 Wp SPV MODULE. Available online: https://www.waaree.com/documents/WSMP-350_4BB_40mm_datasheet.pdf (accessed on 7 July 2021).
- Heidari, A.A.; Mirjalili, S.; Faris, H.; Aljarah, I.; Mafarja, M.; Chen, H. Harris hawks optimization: Algorithm and applications. Future Gener. Comput. Syst. 2019, 97, 849–872. [Google Scholar] [CrossRef] [Scilit]
- Zimmerman, R.D.; Murillo-Sánchez, C.E.; Thomas, R.J. MATPOWER: Steady state operations, planning, and analysis tools for power systems research and education. IEEE Tran. Power Systems 2011, 26, 12–19. [Google Scholar] [CrossRef] [Scilit]
- Sultana, S.; Roy, P.K. Multiobjective quasi-oppositional teaching learning based optimization for optimal location of distributed genera- tor in radial distribution systems. Int. J. Electr. Power Energy Syst. 2014, 63, 534–545. [Google Scholar] [CrossRef] [Scilit]
- Moradi, M.H.; Abedini, M. A combination of genetic algorithm and particle swarm optimization for optimal DG location and sizing in distribution systems. Int. J. Electr. Power Energy Syst. 2012, 34, 66–74. [Google Scholar] [CrossRef] [Scilit]
- Quadri, I.A.; Bhowmick, S.; Joshi, D. A comprehensive technique for optimal allocation of distributed energy resources in radial distribution systems. Appl. Energy 2018, 211, 1245–1260. [Google Scholar] [CrossRef] [Scilit]
- Meena, N.K.; Parashar, S.; Swarnkar, A.; Gupta, N.; Niazi, K.R. Improved elephant herding optimization for multiobjective DER accommodation in distri- bution systems. IEEE Trans. Ind. Inform. 2018, 14, 1029–1039. [Google Scholar] [CrossRef] [Scilit]
- Ali, A.; Keerio, M.U.; Laghari, J.A. Optimal site and size of distributed generation allocation in radial distribution network using multiobjective optimization. J. Mod. Power Syst. Clean Energy 2021, 9, 404–415. [Google Scholar] [CrossRef] [Scilit]
- Zimmerman, R.D.; Murillo-Sánchez, C.E. Matpower [Software]. 2020. Available online: https://matpower.org (accessed on 9 July 2021). [CrossRef]
- Injeti, S.K.; Prema Kumar, N. A novel approach to identity optimal access point and capacity of multiple DGs in a small, medium, and large scale radial distribution systems. Electr. Power Energy Syst. 2013, 45, 142–151. [Google Scholar] [CrossRef] [Scilit]
- Rama Prabha, D.; Jayabarathi, T. Optimal placement and sizing of multiple distributed generating units in distribution networks by invasive weed optimization algorithm. Ain Shams Eng. J. 2016, 7, 683–694. [Google Scholar] [CrossRef] [Scilit]
- Mohamed Imran, A.; Kowsalya, M. Optimal size and siting of multiple distributed generators in distribution system using bacterial foraging optimization. Swarm Evol. Comput. 2014, 15, 58–65. [Google Scholar] [CrossRef] [Scilit]
- Saleh, A.A.; Mohamed, A.-A.A.; Hemeida, A.M.; Ibrahim, A.A. Comparison of different optimization techniques for optimal allocation of multiple distribution generation. In Proceedings of the 2018 International Conference on Innovative Trends in Computer Engineering (ITCE), Aswan, Egypt, 19–21 February 2018. [Google Scholar]

Publisher’s Note: MDPI stays neutral with regard to jurisdictional claims in published maps and institutional affiliations. |
© 2021 by the authors. Licensee MDPI, Basel, Switzerland. This article is an open access article distributed under the terms and conditions of the Creative Commons Attribution (CC BY) license (https://creativecommons.org/licenses/by/4.0/).