


Abstract
Classical velocity-storage models describe post-rotatory eye velocity as the observable output of direct and stored vestibular components, yet rotational testing is often summarized primarily by the decay time constant. We examined whether the magnitudes of directional output asymmetry and decay-persistence asymmetry covary. This single-center registry-based observational analysis used source-reconciled data from 40 fast-domain-eligible patients; 31 had complete bilateral post-rotatory slow-phase velocity (SPV) and time-constant (TC) measurements. SPV-AR and TC-AR were calculated as normalized absolute inter-directional differences, thus retaining asymmetry magnitude but not its sign. In the 31 complete datasets (16 women, 15 men; median age 56 years, IQR 40.5–61.5; range 19–78), the median SPV-AR was 26.9% (IQR 12.5–37.0) and the median TC-AR was 34.8% (IQR 12.7–59.6). The magnitudes of SPV-AR and TC-AR were not detectably associated (Spearman ρ = 0.091, p = 0.626; Pearson r = 0.031, p = 0.868). Mean post-rotatory SPV and mean TC also showed no statistically significant association. Output magnitude and temporal persistence provide complementary, non-interchangeable descriptors of the measured ocular response; this analysis does not establish directional sign concordance, physiological independence, or diagnostic thresholds.
1. Introduction
Post-rotatory nystagmus is a directly observable eye-movement response whose amplitude and decay reflect the combined dynamics of peripheral vestibular drive and central processing. Classical velocity-storage models were developed to explain why vestibular and optokinetic eye velocity can persist beyond the mechanical time constant of the semicircular canals. In the foundational Raphan–Cohen–Matsuo formulation, the measured ocular response arose from the interaction of direct pathways with an indirect storage process that had its own charging and discharging dynamics [1]. Raphan and Cohen subsequently emphasized that direct and stored processes converge to generate slow-phase eye velocity and that velocity storage participates in multidimensional vestibulo-ocular control [2]. Subsequent quantitative studies formalized the temporal behavior of vestibular nystagmus and optokinetic after-nystagmus and established the decay time constant as a central descriptor of this response [3,4,5,6].
The time constant, however, describes only one property of an eye-velocity trace: persistence. The same trace also contains information about response magnitude and directional balance. These quantities are related physiologically but are not mathematically interchangeable. Post-rotatory slow-phase velocity (SPV) quantifies the expressed ocular output at a given point in the response, whereas the time constant summarizes how rapidly that output decays. Treating either quantity as a complete representation of the post-rotatory response risks collapsing distinct features of eye-movement dynamics into a single scalar measure.
This distinction is consistent with the broader evolution of velocity-storage physiology. Contemporary models place the storage process within a multisensory, gravity-referenced network influenced by otolith signals, cerebellar regulation, adaptation, and internal estimates of self-motion [7,8,9,10,11,12,13,14]. In such a distributed system, the magnitude of the observable eye-velocity response need not map one-to-one onto the persistence of its decay. The measured post-rotatory response is therefore better regarded as a system output with multiple quantifiable dimensions than as a direct readout of a single integrator.
Previous rotational vestibular studies have described response magnitude, directional preponderance, and decay time constants, and clinical work has combined magnitude with temporal information; for example, through the gain–time-constant product in bilateral vestibular loss [15]. OPD does not claim that these underlying measurements are novel. Instead, the present analysis asks an explicitly comparative question that is not answered by reporting each parameter separately or combining them into a single product: across individual patients, does the magnitude of inter-directional post-rotatory SPV imbalance covary with the magnitude of inter-directional TC imbalance? These are continuous descriptors of different features of the same recorded response.
We therefore extracted bilateral post-rotatory SPV and post-rotatory TCs from multi-turn/Freyss recordings and calculated normalized absolute asymmetry magnitudes (SPV-AR and TC-AR). We use Output–Persistence–Directionality (OPD) as an exploratory reporting framework: output denotes measured SPV, persistence denotes TC, and directionality here denotes the extent of inter-directional imbalance, not its sign or the identity of the dominant direction. The primary aim was to assess the association of these two continuous asymmetry magnitudes. A secondary analysis examined mean post-rotatory SPV versus mean TC.
We hypothesized that the magnitudes of output asymmetry and persistence asymmetry would show limited correspondence in this clinically enriched cohort. The hypothesis does not assert that greater SPV occurs in a different rotation direction from longer TC, nor does it posit statistical independence, diagnostic thresholds, or a new disease category.
2. Materials and Methods
2.1. Study Design, Setting, and Cohort Construction
This study was a single-center registry-based observational analysis conducted at the MSA ENT Academy Center, Cassino (FR), Italy. The study period extended from 1 March 2026 to 18 September 2026, and the final analytical registry snapshot was locked on 18 September 2026. Original instrument-generated source reports were re-reviewed when they formed part of the clinical record of an included participant, irrespective of the acquisition date of the individual source examination; therefore, the dataset-lock date should not be interpreted as restricting every contributing vestibular examination to a single calendar interval. All included participants provided written informed consent at the MSA ENT Academy Center, Cassino (FR), Italy, before inclusion of their clinical and instrumental data in the registry and their anonymized use for research and publication. The VSD registry combines retrospectively harmonized and prospectively collected clinical observations under a structured registry framework. For the present analysis, the registry was re-adjudicated against the original clinical and instrument-generated source documents before final dataset locking.
The updated registry contained 45 records meeting registry-status criteria (confirmed, confirmed prudent, or confirmed/overlap Ménière). Forty fulfilled the prespecified fast-domain eligibility criteria without a frank dominant impulsive vestibular deficit. The present OPD analysis was then restricted to patients with complete reliable bilateral post-rotatory SPV and bilateral post-rotatory TC measurements. This yielded 31 complete OPD pairs. The updated analysis population therefore reflects both final source-document reconciliation and final fast-domain adjudication rather than simple accrual to the earlier registry snapshot.
The objective of the present analysis was not to define a new vestibular syndrome, but to test whether two continuous magnitudes of inter-directional asymmetry—one describing eye-velocity output and the other describing decay persistence—covary across patients in a clinically enriched cohort.
2.2. Cohort Enrichment and Exclusion Criteria
For the present analysis, registry selection enriched for patients with persistent or recurrent imbalance, dizziness, motion sensitivity, or vertigo not adequately accounted for by high-acceleration canal responses alone. Operationally, relative preservation of the fast domain referred to the recorded clinical interpretation of normal or relatively preserved vHIT/HIMP and/or SHIMP responses, or the absence of a frank dominant impulsive canal deficit that explained the syndrome. Sustained/integrative abnormality required a documented abnormal result or interpretation in at least one prolonged or integrative paradigm (e.g., optokinetic/optokinetic-after-nystagmus, sinusoidal rotation, post-rotatory multi-turn response, or time-constant assessment). Discordance was defined at the clinical-registry level as persistent symptoms or documented sustained/integrative abnormality despite relatively preserved fast-domain function; no new uniform numerical threshold was retroactively imposed on these heterogeneous tests. These qualitative eligibility rules reflect registry adjudication and should not be mistaken for prospectively validated cut-offs. Active typical BPPV and a frank dominant impulsive deficit explaining the complete clinical picture were handled as described below. The enriched sampling scheme does not permit prevalence or diagnostic-accuracy inferences.
Active typical BPPV was excluded when positional nystagmus fully explained the symptoms, as was a frankly pathological impulsive canal deficit that was itself coherent with the clinical syndrome without evidence of additional time-domain dissociation. Patients with unresolved central oculomotor/neurological signs or suspicious neuroimaging findings were handled cautiously within the clinical registry and were not used to make etiological claims in the present analysis.
2.3. Vestibular Test Battery and Source Data
The registry retained multidomain vestibular data, including vHIT/HIMP and SHIMP, optokinetic and other oculomotor measures, rotational testing, skull vibration-induced nystagmus, VEMPs, audiological findings, and neuroimaging when clinically indicated. For the present OPD paper, the primary quantitative source was rotational testing performed with the Synapsys Dynamic Videonystagmography System (DVNS; Synapsys, Marseille, France; software version 2.5.0 in the available reports).
The kinetic battery included sinusoidal rotation, square back-and-forth testing, and the multi-turn/Freyss analysis. Rotational testing used a manually operated SYNAPSYS MED4 chair with Nystalyze/SYNAPSYS DVNS video-oculography (Synapsys, Marseille, France; software version 2.5.0 in available reports). Under the software-guided multi-turn/Freyss protocol, the examiner followed the displayed prescribed chair-motion trajectory while video-oculography simultaneously recorded the ocular response; post-stop responses were evaluated for the two software-labelled rotation directions. This differs from a conventional motor-driven, precisely characterized velocity-step experiment: here, the chair was moved manually under real-time software guidance, and exact trial-level acceleration and velocity histories were not uniformly available for independent stimulus-kinematic reanalysis. The source reports provided software-derived direction-specific post-rotatory SPV endpoints (°/s) and decay time constants (seconds), which were transcribed from the Freyss results page only when available and technically interpretable. TC represents the DVNS-reported decay parameter; we did not independently fit raw traces or reverse-engineer the proprietary fitting routine, and therefore cannot specify an independently verified algorithm or fitting window. Visual review assessed the compatibility of the reported decay parameter with an identifiable post-rotatory response; it was not used to generate replacement values.
The slow-phase eye-velocity trace has a compensatory polarity relative to chair movement; therefore, graphical polarity or chart position was never used alone to infer chair direction. The original report’s stimulus-direction labels and the post-stop response endpoints governed the source audit. The absolute asymmetry ratios are invariant to swapping the two direction labels simultaneously. Crucially, because they omit the sign of the inter-directional difference, these ratios cannot establish whether the direction with the greater SPV is also the direction with the longer TC. Direction-of-dominance concordance was not a primary endpoint in this study.
2.4. OPD Variable Definitions
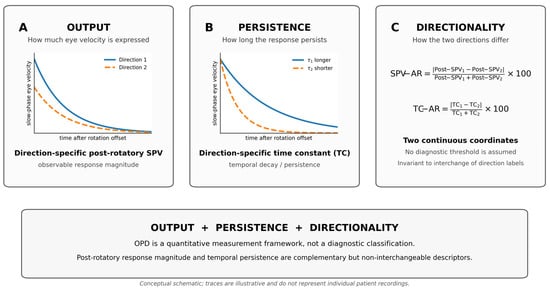
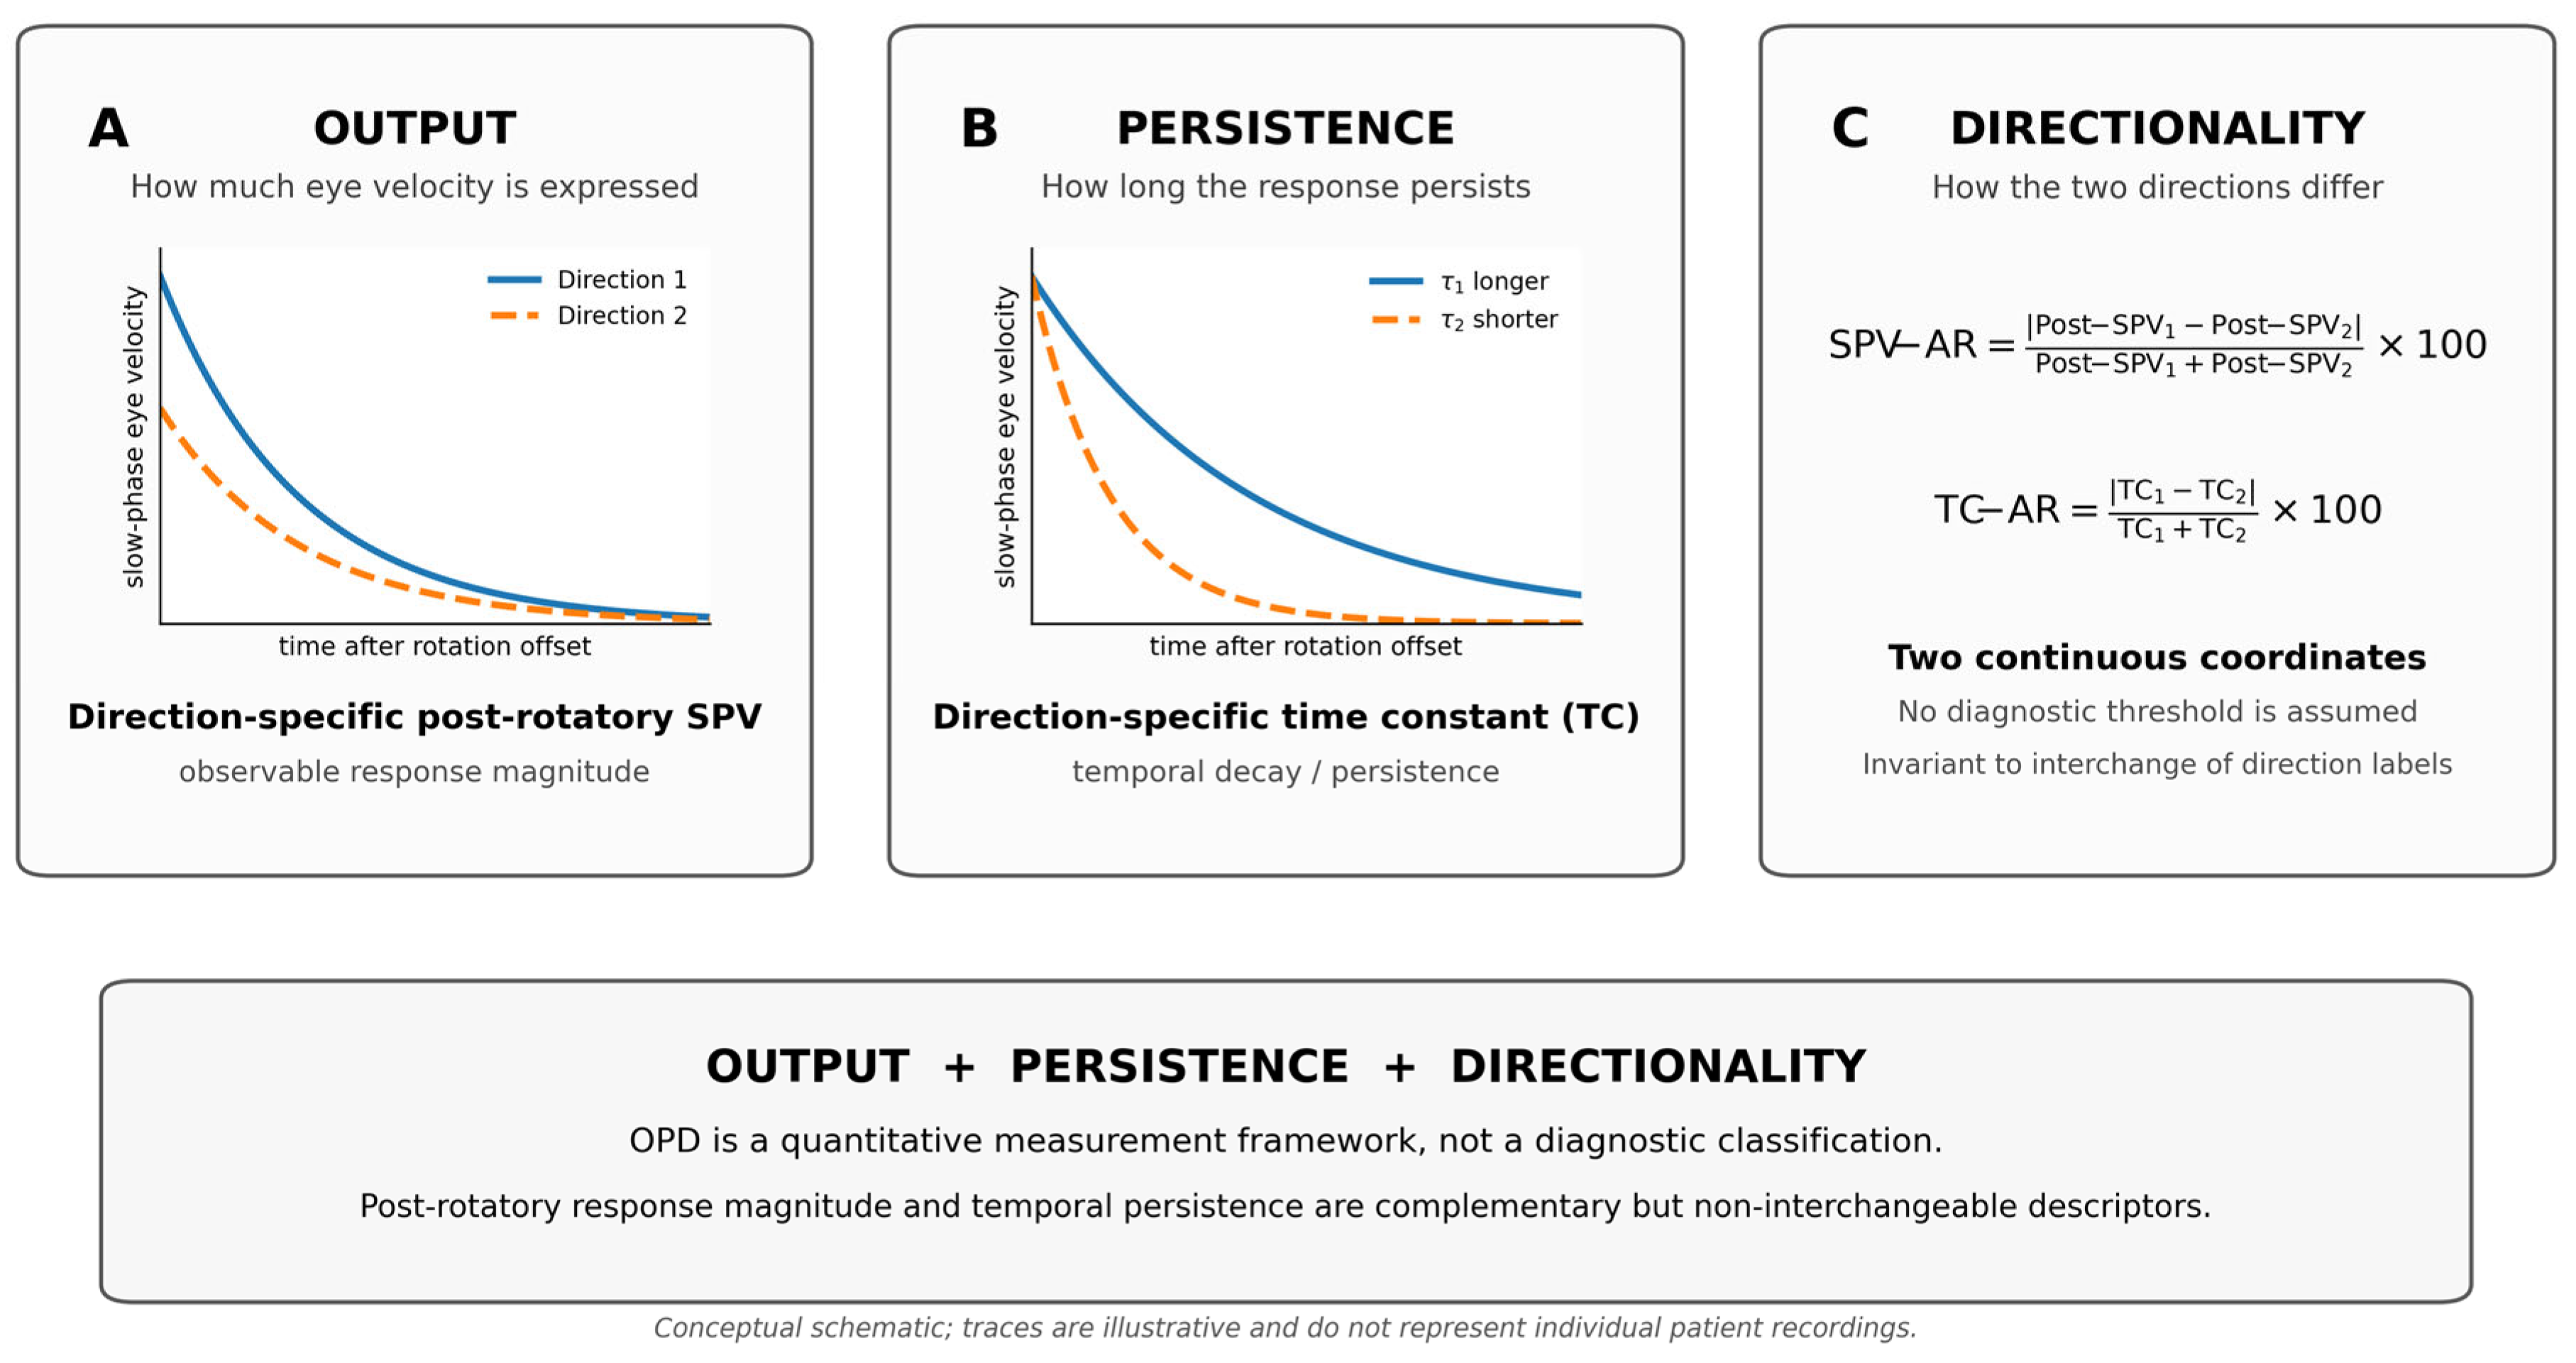
The conceptual structure of the OPD framework is summarized in Figure 1. SPV-AR and TC-AR were analyzed as continuous magnitudes of inter-directional asymmetry. An absolute ratio gives no information about which rotation direction has the larger value, and correlations of two absolute ratios cannot establish sign concordance or discordance. No diagnostic threshold was used in the primary statistical analysis. Descriptive labels (e.g., output-dominant, persistence-dominant, combined, or relatively balanced) merely illustrate positions in the continuous two-index space and are not group assignments or validated diagnostic categories. The operational definitions of all OPD variables are summarized in Table 1.
Figure 1.
Output–Persistence–Directionality (OPD) framework for quantitative analysis of post-rotatory eye-movement responses. (A) Output is represented by direction-specific post-rotatory slow-phase velocity (SPV), which describes the magnitude of the observable ocular response. (B) Persistence is represented by the direction-specific post-rotatory time constant (TC), which describes the temporal decay of the response. (C) Directionality is quantified separately for output and persistence using normalized absolute inter-directional asymmetry ratios: SPV-AR = |Post-SPV1 − Post-SPV2|/(Post-SPV1 + Post-SPV2) × 100 and TC-AR = |TC1 − TC2|/(TC1 + TC2) × 100. SPV-AR and TC-AR are treated as continuous quantitative coordinates rather than diagnostic categories. The traces in panels (A,B) are conceptual schematics and do not represent individual patient recordings.
Table 1.
OPD variables, operational definitions, units, and analytic roles.
2.5. Data-Quality Rules and Analysis Populations
The OPD re-review followed an explicit non-imputation rule. All 31 Freyss source reports contributing to the complete bilateral analysis were compared with registry entries. In seven source-audited cases (VSD-039, -041, -042, -044, -045, -048 and -049), the post-rotatory SPV endpoint originally entered in the registry had been selected from the wrong Freyss endpoint or directional field. Corrections used the numerical endpoints printed in the source reports, taking account of the stimulus-direction label and post-stop reversal; chart polarity alone was not used. Each corrected value was transcribed directly from an existing source report rather than inferred visually or estimated from the trace. SPV-AR, mean post-rotatory SPV and downstream statistics were then recalculated from the reconciled bilateral values. A missing TC was never inferred visually from the decay trace. If only one TC was available or the software did not quantify the second, the other was retained as missing. Automatically generated TC values were excluded only when absent, technically invalid, or visually incompatible with a quantifiable post-rotatory decay during structured re-review. The corrected source values and audit flags are retained in the locked master table; identifiable original records are not part of the public supplement.
Among the 40 fast-domain-eligible patients, bilateral post-rotatory SPV values were available in 38, a complete reliable bilateral TC pair was available in 32, and 31 had both bilateral SPV and bilateral TC measurements. The primary SPV-AR versus TC-AR analysis and the secondary mean post-SPV versus mean TC analysis were therefore restricted to these 31 complete bilateral datasets. The analysis used the source-verified direction-specific values rather than the asymmetry ratios alone, allowing all derived measures to be recalculated from the reconciled bilateral measurements.
2.6. Selection of Illustrative OPD Configurations
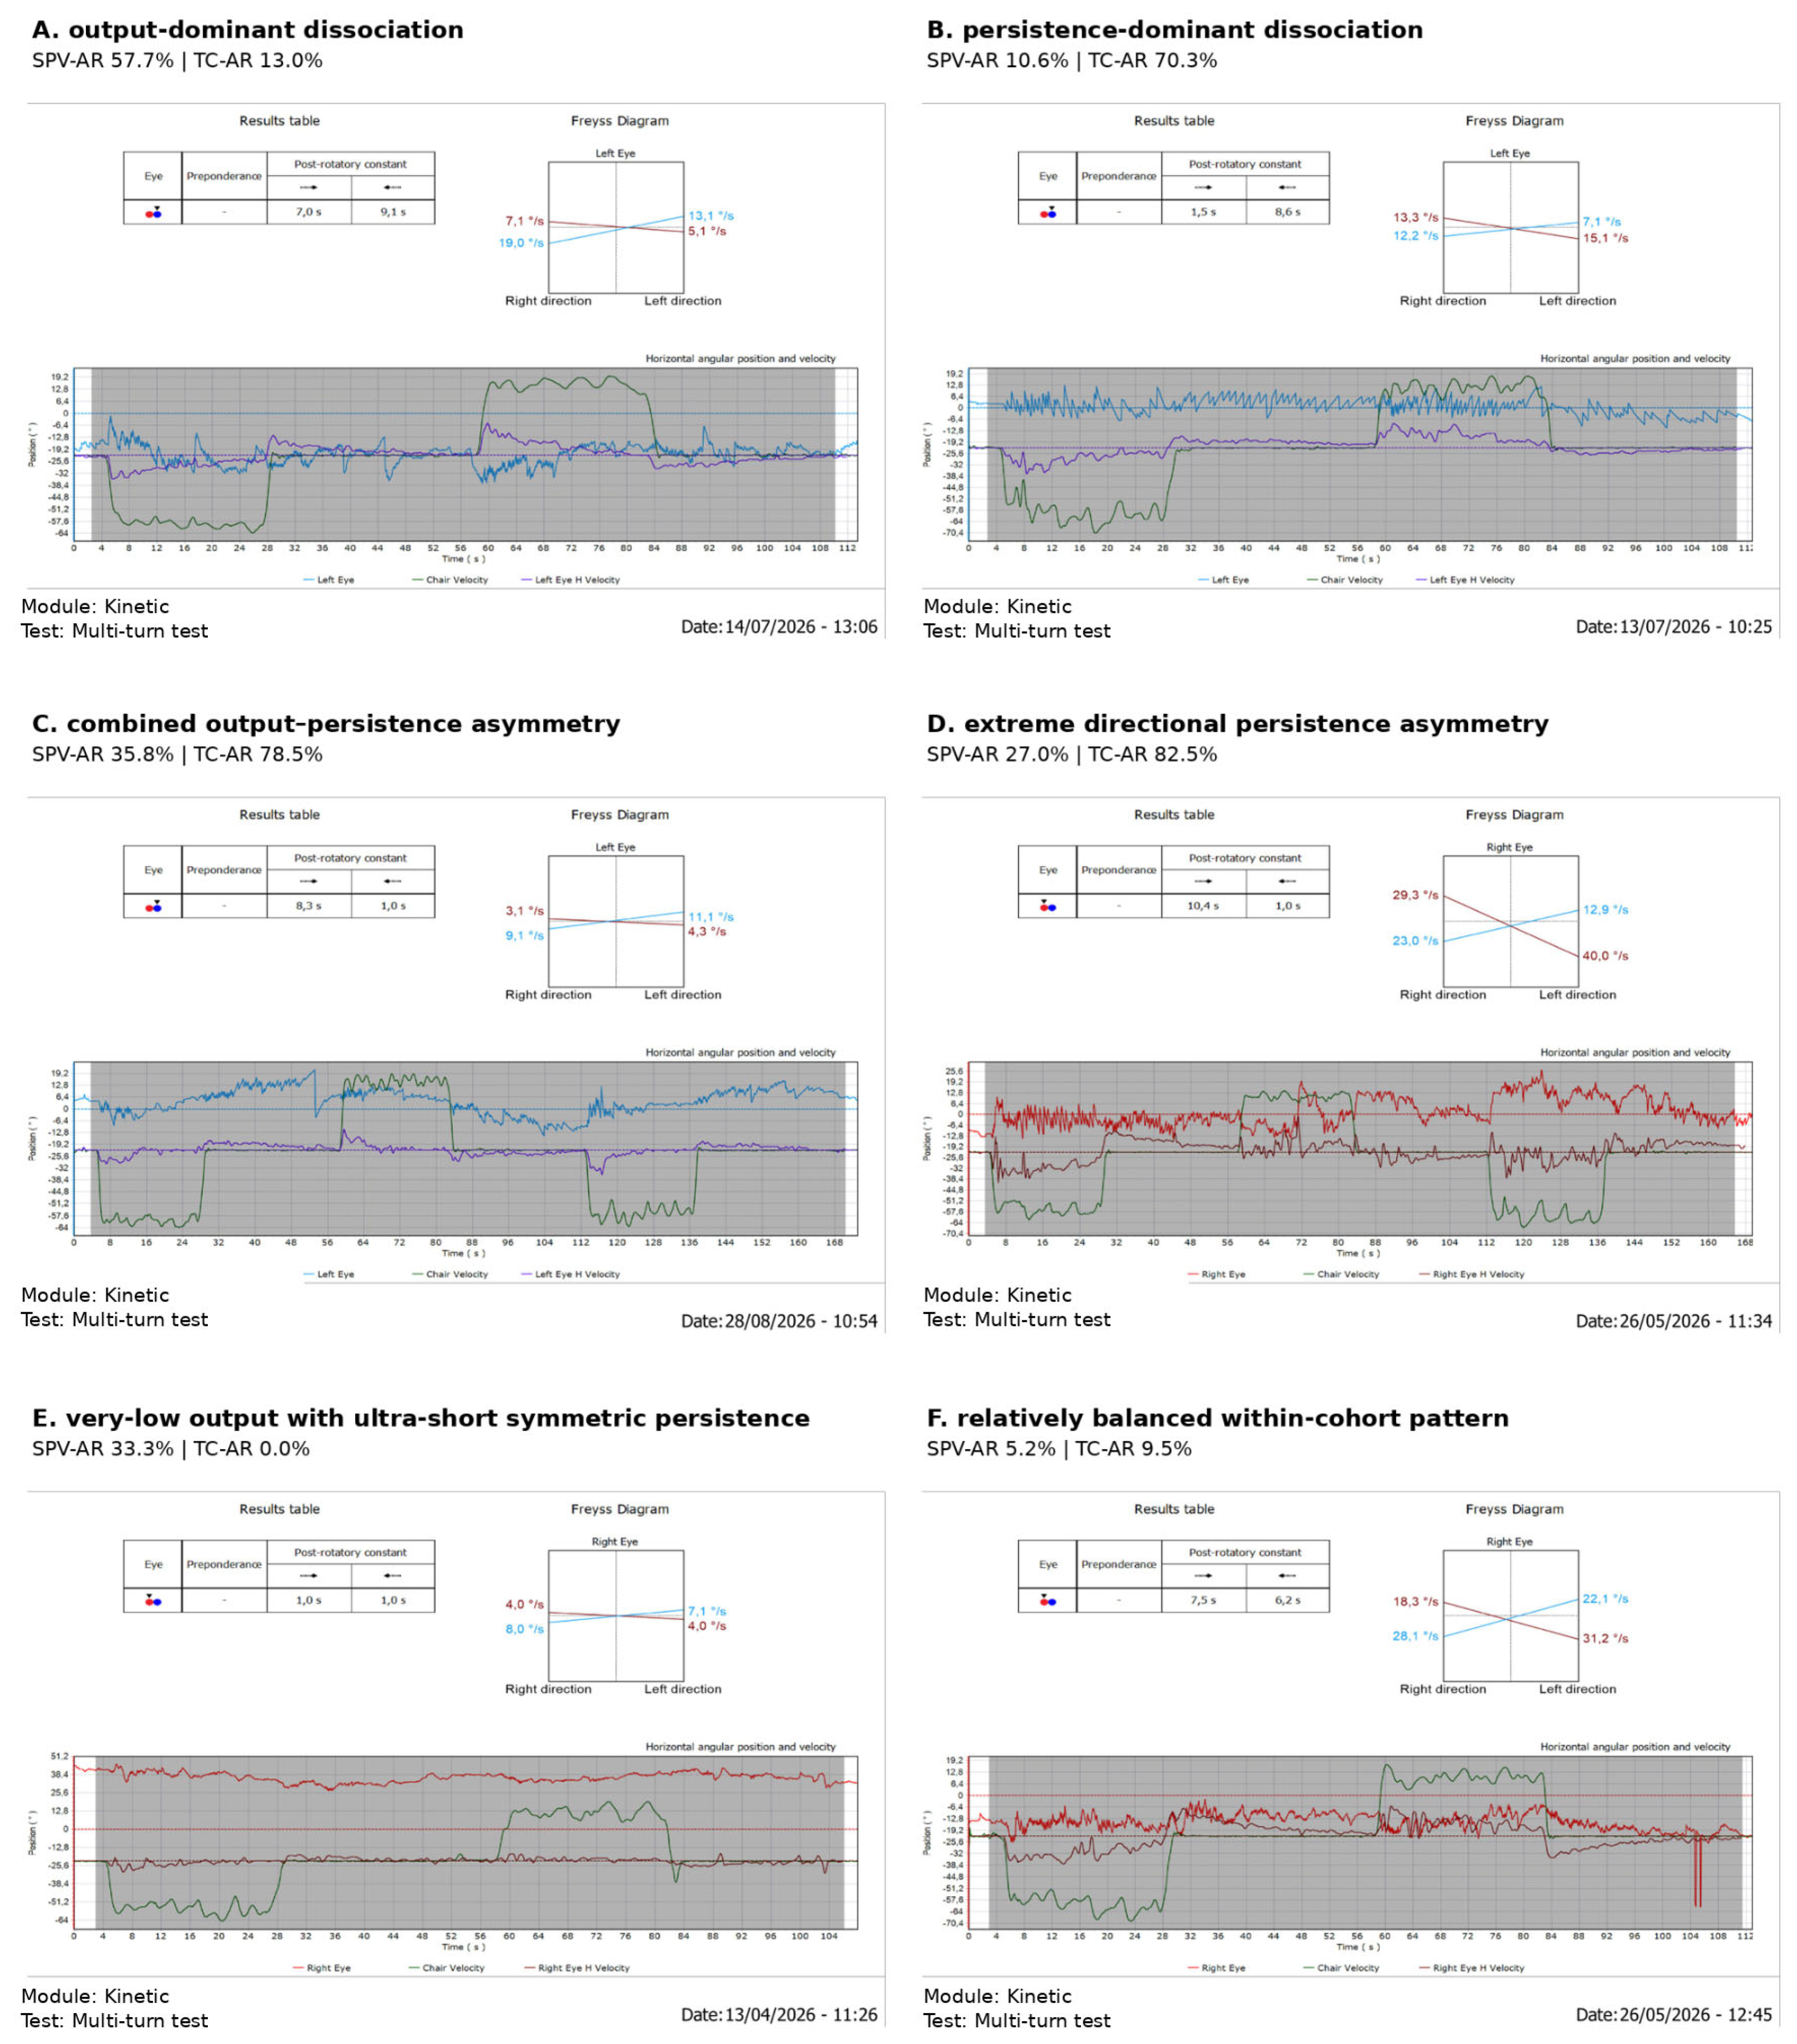
Representative Freyss examples were selected only after completion of the 31/31 source-document audit. Selection was based on four prespecified descriptive considerations: source verification of the bilateral post-rotatory SPV and TC values, coverage of distinct regions of the continuous SPV-AR/TC-AR space, visual interpretability of the original Freyss trace, and avoidance of examples dominated by recording artifact when a cleaner trace illustrating the same quantitative configuration was available. The final six illustrated cases were Case A (marked output asymmetry with relatively balanced persistence), Case B (near-symmetric output with marked persistence asymmetry), Case C (combined output and persistence asymmetry), Case D (extreme directional persistence asymmetry), Case E (very-low output with bilaterally ultra-short symmetric persistence), and Case F (a relatively balanced within-cohort pattern). These examples were selected for visualization of the observed continuum only; they did not determine cohort inclusion, statistical analysis, or diagnostic classification.
2.7. Statistical Analysis
Continuous variables were summarized using medians and interquartile ranges. The primary analysis examined the association between SPV-AR and TC-AR. Spearman rank correlation was used as the principal measure of association, with Pearson correlation reported as a complementary measure of linear association. The secondary analysis examined mean post-rotatory SPV versus mean TC using the same two correlation methods.
Two-sided p values were reported. Ninety-five percent confidence intervals for correlation coefficients were estimated by non-parametric bootstrap resampling with 10,000 resamples. No multiplicity correction was applied because SPV-AR versus TC-AR was the single primary comparison and the mean-output versus mean-persistence analysis was secondary/exploratory. Statistical calculations and figure generation were performed in Python using SciPy and Matplotlib. Statistical significance was evaluated at a two-sided alpha of 0.05, with emphasis on effect estimates and confidence intervals.
Quartiles were computed as the 25th and 75th percentiles using linear interpolation between adjacent ordered observations (equivalent to the NumPy “linear” or Hyndman–Fan type 7 convention), before rounding for display. Spearman correlations were calculated as Pearson correlations of average ranks, preserving tied observations. The bootstrap confidence intervals used 10,000 patient-level resamples with replacement; correlations were recalculated within each resample. The corrected secondary Spearman interval reported here was recalculated with a fixed random seed (20260918) using the percentile method.
To contextualize the precision of the N = 31 complete-pair analysis, we estimated the absolute Pearson population correlation required for approximately 80% power with a two-sided α of 0.05 using the Fisher-z normal approximation: |r| ≈ tanh[(z0.975 + z0.80)/√(N − 3)] = 0.485. This approximation pertains to Pearson correlation under standard assumptions and should not be interpreted as an empirically established sensitivity threshold for Spearman correlation.
2.8. Role of Non-Rotational Vestibular Measures
vHIT/SHIMP, optokinetic testing, SVIN, VEMPs, audiological findings, and neuroimaging remained part of the clinical phenotyping framework but were not included in the primary OPD correlation analyses. Their role in the present paper was contextual and hypothesis-generating, preserving the central quantitative question concerning the relationship between post-rotatory output and temporal persistence.
Supplementary Table S1 provides individual coded OPD measurements and source-documented clinical context (vHIT/SHIMP, SVIN/HST, and VEMPs) for all 31 complete bilateral datasets. Non-rotational entries reproduce the available registry descriptions; they were not used as OPD endpoints, and unspecified or pending tests are not treated as normal. Measurements obtained at follow-up are retained with their original date when documented. The table is descriptive and does not provide independently source-audited quantitative endpoints for every non-rotational test.
3. Results
3.1. Cohort Characteristics and Data Completeness
The final fast-domain-eligible cohort comprised 40 patients: 18 men (45.0%) and 22 women (55.0%). In the primary registry summary, age was recorded for 29/40 patients; the median age was 56 years (IQR, 48–60; range, 28–78 years). The complete Output–Persistence–Directionality analysis subset comprised 31 patients: 15 men (48.4%) and 16 women (51.6%). Exact dates of birth and index evaluation were available for all 31, allowing age to be derived without imputation: the median age was 56 years (IQR, 40.5–61.5; range, 19–78 years). The final analysis subset differed from the earlier registry snapshot because final source-document reconciliation and fast-domain re-adjudication altered both eligibility and data completeness.
Clinical context for the 31 complete-pair patients is summarized in Supplementary Table S1 using the registry descriptions of vHIT/SHIMP, SVIN/HST and VEMPs. These heterogeneous clinical descriptors were not converted into post hoc numeric eligibility cut-offs, and missing secondary tests were not assumed to be normal.
Within the 40 fast-domain-eligible patients, bilateral post-rotatory SPV values were available in 38/40 (95.0%), bilateral TCs in 32/40 (80.0%), and both bilateral SPV and bilateral TC data in 31/40 (77.5%). These 31 patients constituted the final complete OPD subset used for the primary association analyses. All 31 Freyss reports in the analytic subset were re-reviewed against the original DVNS source documents; seven direction-specific post-rotatory SPV registry entries were corrected during reconciliation. Missing or unreliable values were not imputed.
3.2. Distribution of Post-Rotatory Output and Persistence
Within the complete OPD subset (N = 31), the median post-rotatory SPV asymmetry ratio (SPV-AR) was 26.9% (IQR, 12.5–37.0%), whereas the median TC asymmetry ratio (TC-AR) was 34.8% (IQR, 12.7–59.6%). The median mean post-rotatory SPV was 18.70°/s (IQR, 13.65–29.18°/s), and the median mean post-rotatory TC was 4.75 s (IQR, 2.58–6.90 s). The unrounded Q3 for mean post-rotatory SPV was 29.175°/s (displayed as 29.18°/s); small differences at the second decimal can arise from differing percentile or rounding conventions. Descriptive statistics for the complete OPD subset are summarized in Table 2.
Table 2.
Descriptive statistics for the complete OPD subset.
3.3. Relationship Between Output Directionality and Persistence Directionality
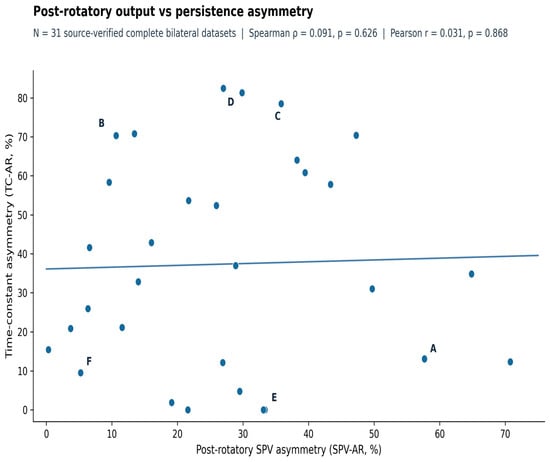
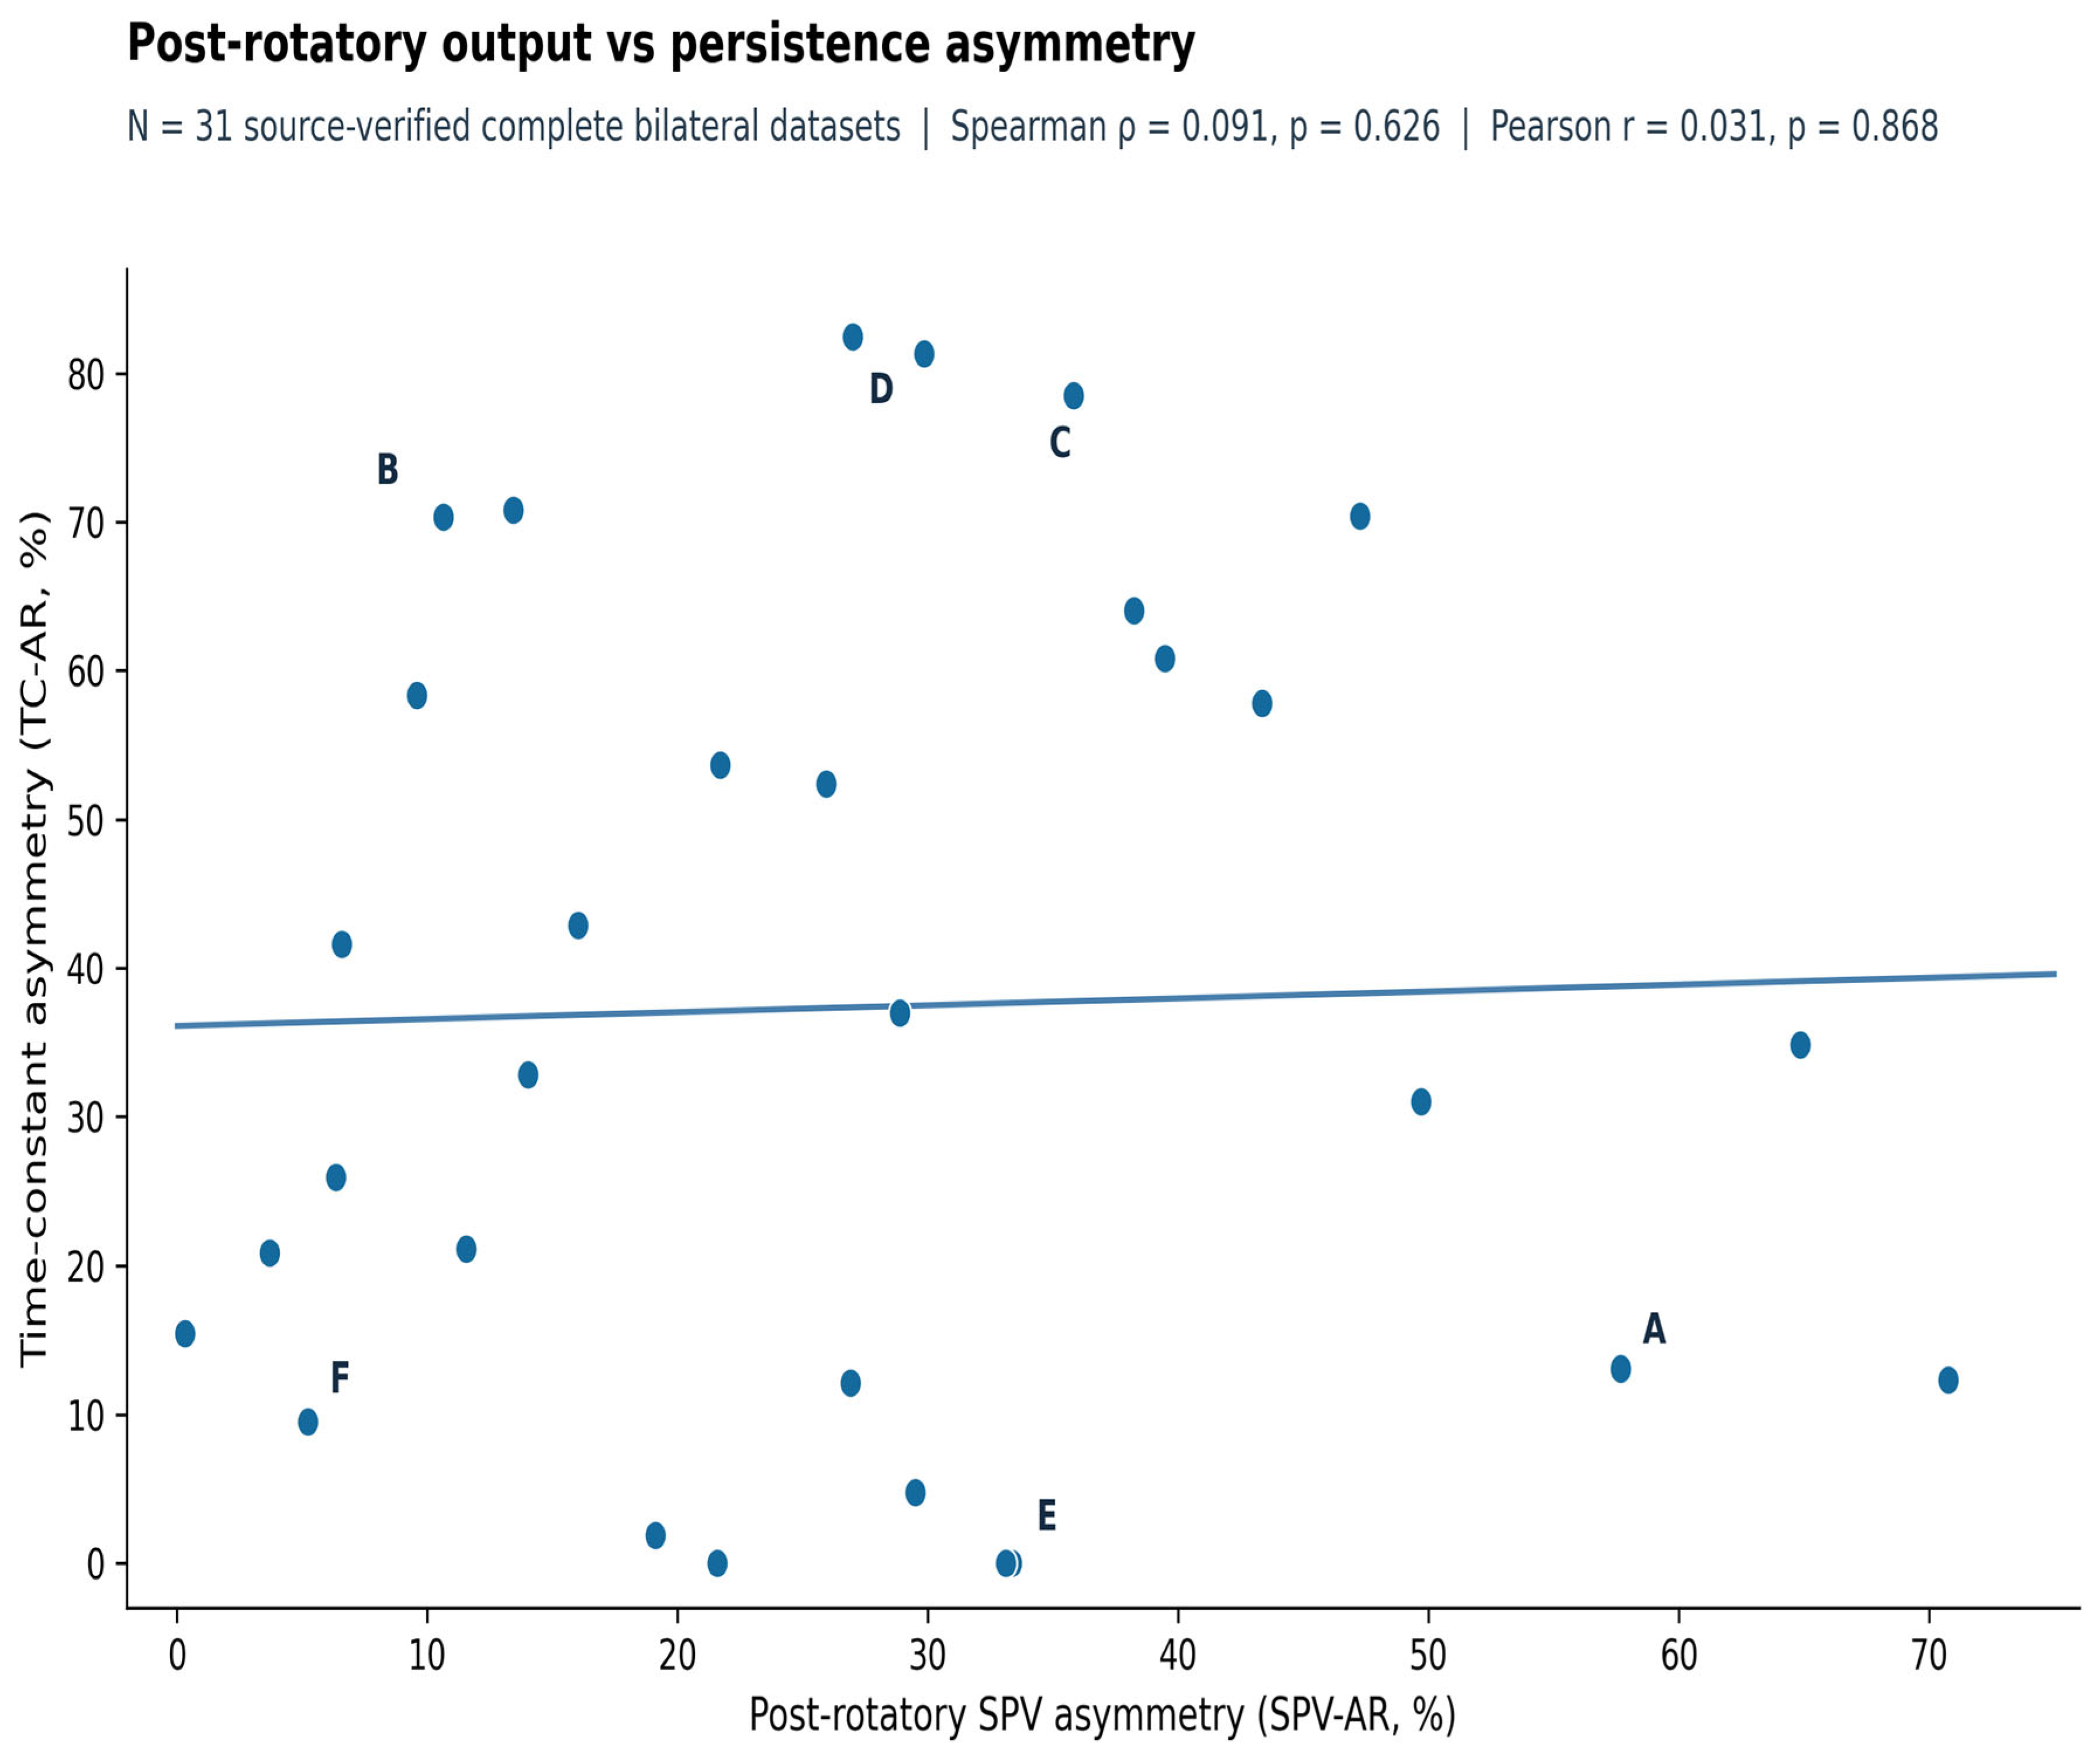
There was no detectable association between post-rotatory output asymmetry and time-constant asymmetry in the 31 patients with complete bilateral data. The Spearman rank correlation between SPV-AR and TC-AR was ρ = 0.091 (p = 0.626; bootstrap 95% CI, −0.224 to 0.396). The corresponding Pearson correlation was r = 0.031 (p = 0.868; bootstrap 95% CI, −0.249 to 0.353). The scatter distribution therefore included patients with marked output asymmetry but limited TC asymmetry, as well as patients with relatively balanced output but marked asymmetry of temporal persistence (Figure 2).
Figure 2.
Relationship between post-rotatory SPV asymmetry (SPV-AR) and time-constant asymmetry (TC-AR) in 31 source-verified complete bilateral datasets. Letters A–F identify illustrative individual cases: A, marked output asymmetry with relatively balanced persistence; B, near-symmetric output with marked persistence asymmetry; C, combined output and persistence asymmetry; D, extreme persistence asymmetry; E, very-low output with ultra-short symmetric persistence; F, relatively balanced within-cohort pattern. These examples do not define diagnostic groups. No statistically significant association was detected.
3.4. Illustrative Quantitative OPD Configurations
Inspection of individual source-verified Freyss patterns demonstrated a continuum of quantitative configurations. The final illustrative set was locked after the 31/31 source-document audit and retained because it jointly maximized quantitative contrast and trace interpretability. Case A showed marked output asymmetry (SPV-AR 57.7%) with comparatively balanced persistence (TC-AR 13.0%), whereas Case B showed the reciprocal configuration, with near-symmetric output (SPV-AR 10.6%) and marked persistence asymmetry (TC-AR 70.3%). Case C showed combined output and persistence asymmetry (SPV-AR 35.8%; TC-AR 78.5%). Case D had the highest TC asymmetry in the complete subset (TC-AR 82.5%), with TCs of 10.4 and 1.0 s. Case E showed very-low post-rotatory output (8.0 and 4.0°/s) with bilaterally ultra-short, symmetric TCs (1.0 and 1.0 s), whereas Case F showed a relatively balanced within-cohort configuration (SPV-AR 5.2%; TC-AR 9.5%). Patient identifiers are not used in the manuscript text or figure labels. These panels are illustrative examples rather than validated groups or disease subtypes. These six source-verified examples are shown in Figure 3.
Figure 3.
Source-verified illustrative multi-turn/Freyss patterns across the Output–Persistence–Directionality space. (A) Marked output asymmetry with relatively balanced persistence; (B) near-symmetric output with marked persistence asymmetry; (C) combined output and persistence asymmetry; (D) extreme directional persistence asymmetry; (E) very-low output with ultra-short symmetric persistence; (F) relatively balanced within-cohort pattern. These are individual examples, not disease subtypes. Patient identifiers are omitted.
3.5. Relationship Between Mean Output Magnitude and Mean Temporal Persistence
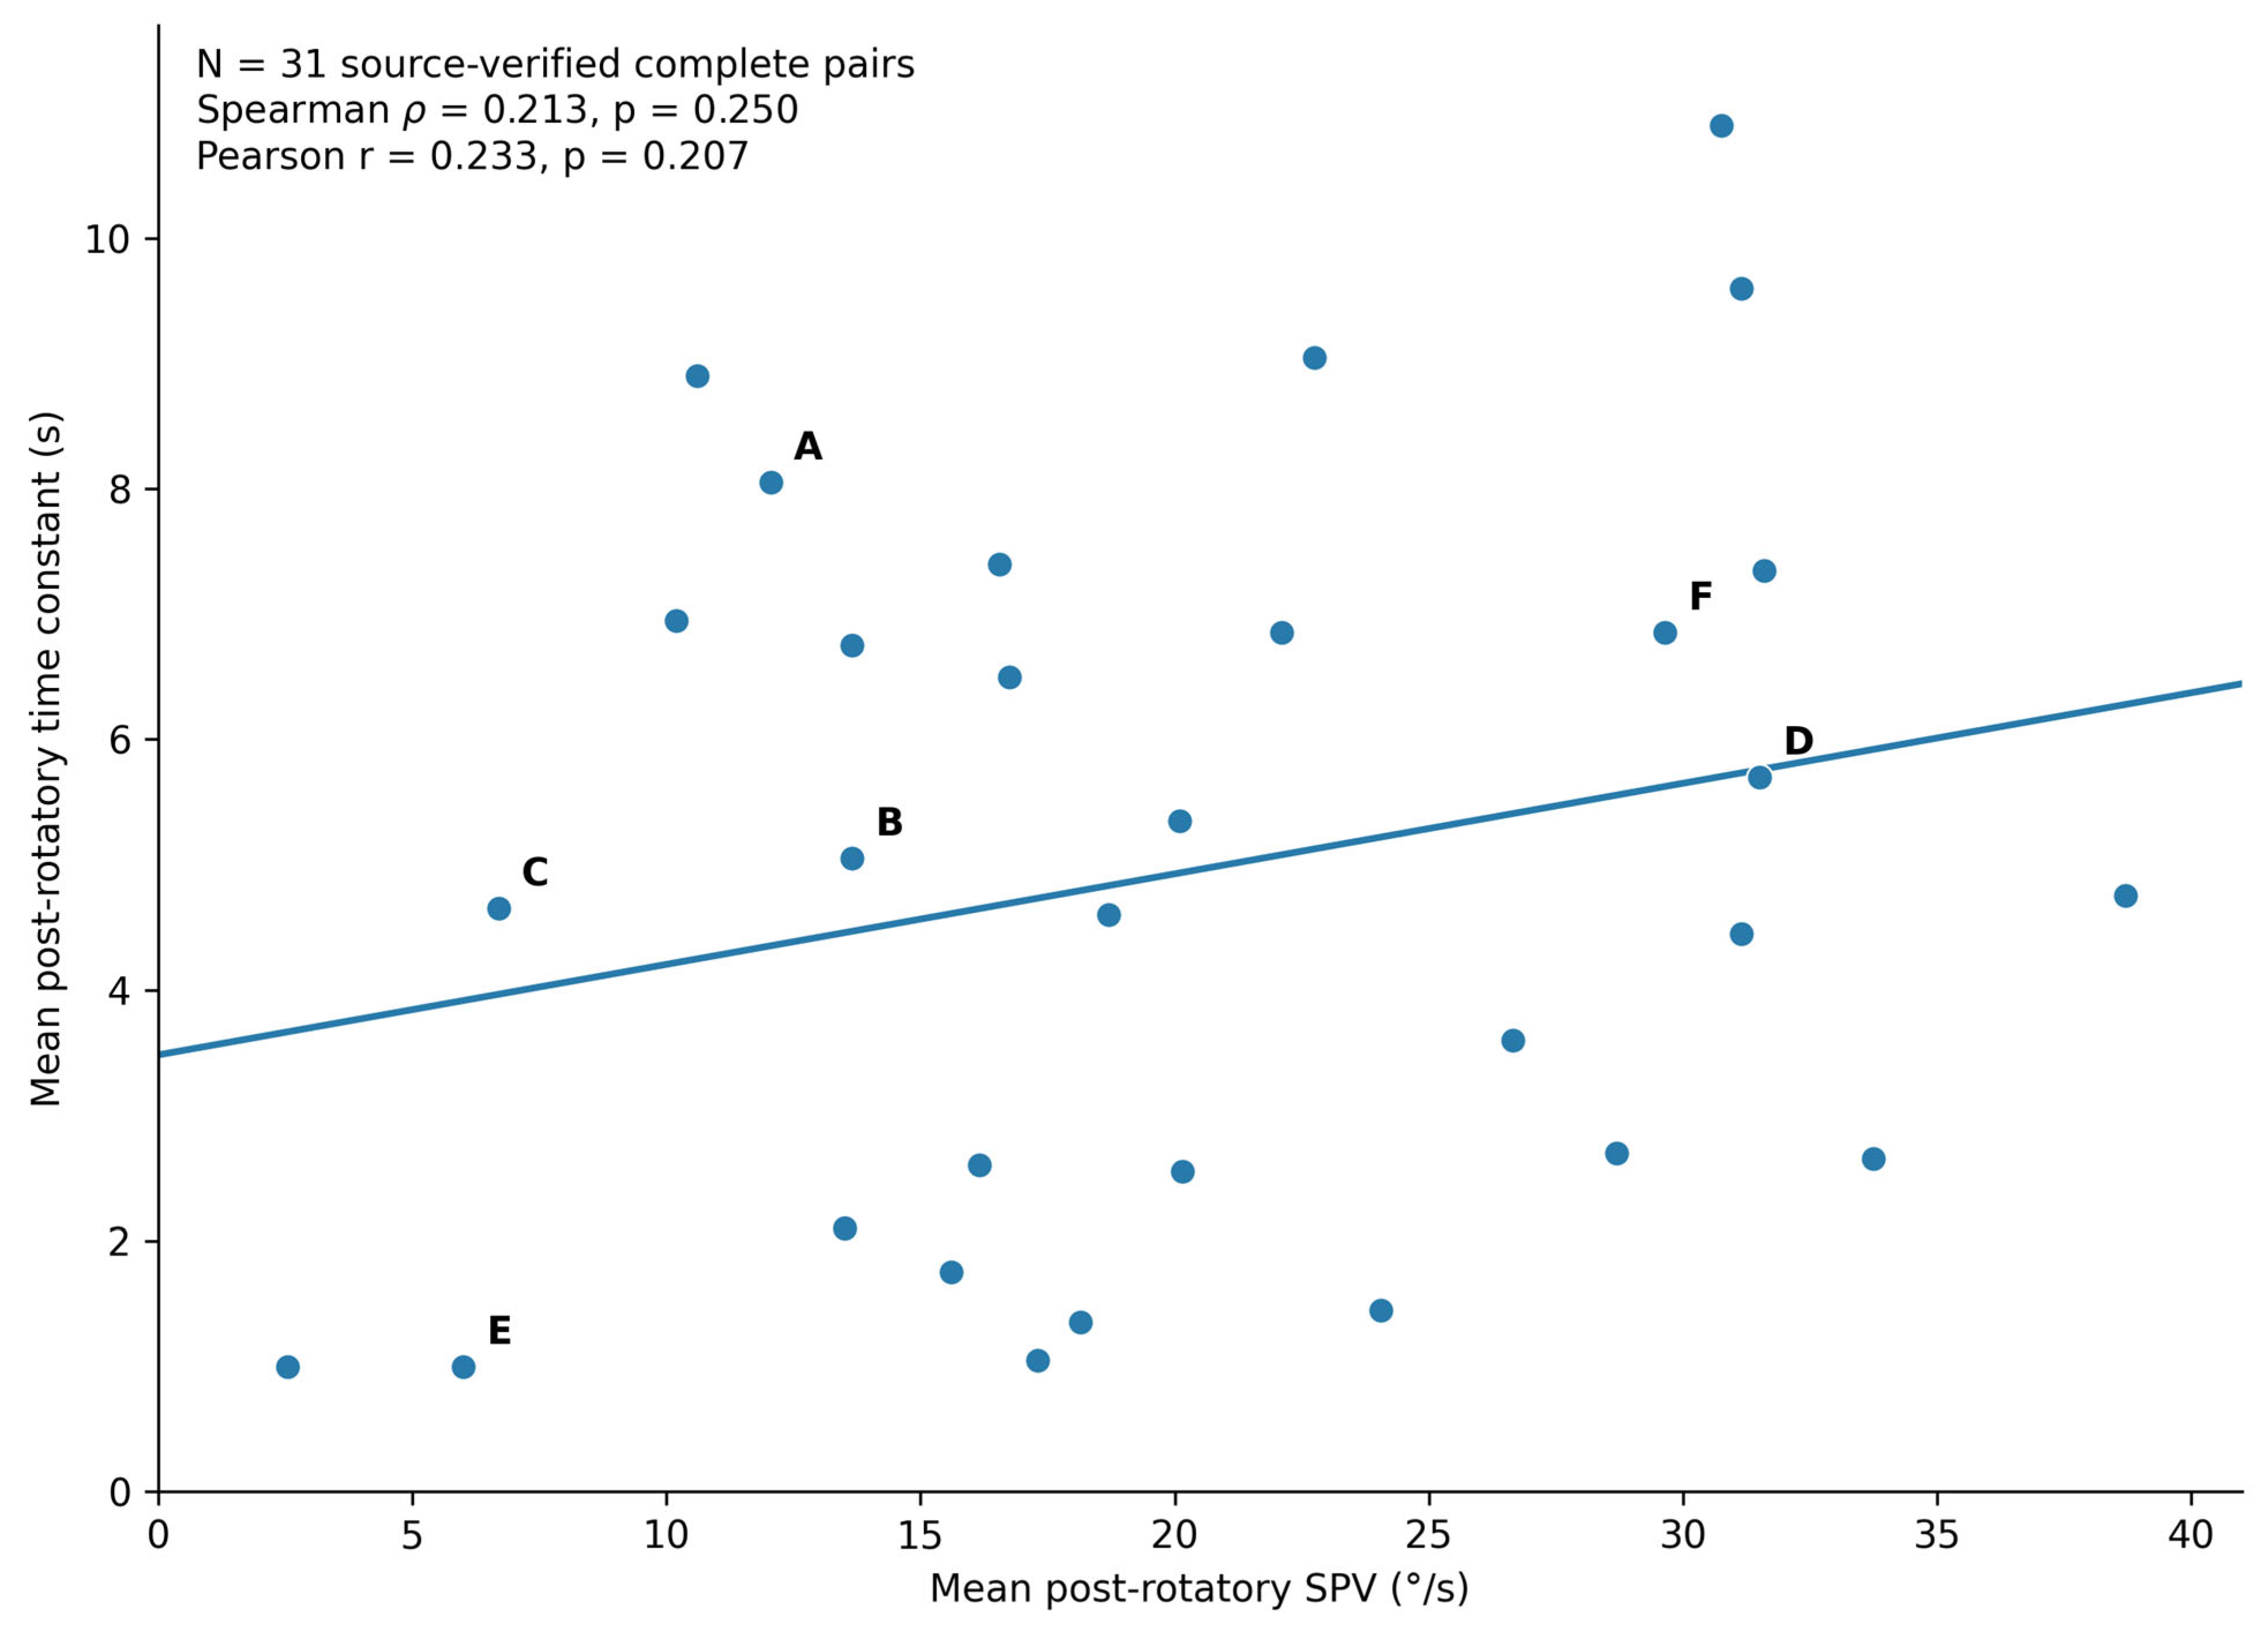
A secondary analysis examined whether the overall magnitude of the post-rotatory response was associated with its average temporal persistence. Mean post-rotatory SPV and mean TC showed a weak positive tendency that did not reach statistical significance. The Spearman correlation was ρ = 0.213 (p = 0.250; bootstrap 95% CI, −0.178 to 0.554), and the Pearson correlation was r = 0.233 (p = 0.207; bootstrap 95% CI, −0.128 to 0.531) (Figure 4).
Figure 4.
Relationship between mean post-rotatory SPV and mean post-rotatory time constant in 31 source-verified complete bilateral datasets. Letters A–F identify the same six illustrative individual cases described in Section 3.4 and shown in Figure 3; they do not denote diagnostic categories. A weak positive tendency was observed, but neither Spearman nor Pearson correlation was statistically significant.
3.6. Quantitative Summary
Taken together, the source-verified complete-pair analysis identified broad dispersion of both post-rotatory output asymmetry and temporal-persistence asymmetry, with no measurable correspondence between the two directional asymmetry indices. The absence of detectable association was robust to both rank-based and linear correlation analyses after 31/31 Freyss source-document reconciliation. By contrast, mean response magnitude and mean persistence showed only a non-significant positive tendency. These results define the quantitative observations carried forward to the subsequent interpretation of the OPD framework.
4. Discussion
4.1. Principal Finding: Output and Persistence Describe Different Properties of the Post-Rotatory Eye-Movement Response
The principal finding was that the magnitude of inter-directional post-rotatory SPV asymmetry showed no detectable association with the magnitude of inter-directional TC asymmetry. In the 31 complete source-verified bilateral datasets, both rank-based and linear association estimates were close to zero, but confidence intervals spanned zero and could not exclude modest associations. Because both primary indices are absolute, this result concerns the size of an imbalance; it does not show whether the direction with greater SPV is also the direction with longer decay persistence. The OPD framework is a descriptive measurement representation, not a demonstration of physiological or statistical independence.
These observations are compatible with the classical distinction between measured ocular output and stored temporal dynamics without requiring a one-to-one mapping of the two. In the Raphan–Cohen–Matsuo formulation, direct and stored components contribute to the recorded eye velocity, while the temporal behavior of the storage-related process is a separate model feature [1,2]. The present patient-level analysis does not identify neural mechanisms or directional sign concordance; rather, it evaluates whether the degree of imbalance in one observed quantity predicts the degree of imbalance in the other.
In measurement terms, SPV-AR describes the degree of imbalance in expressed post-rotatory output and TC-AR the degree of imbalance in fitted decay persistence. One magnitude did not predict the other detectably in this sample. Since both indices discard sign and can be affected by measurement variability, the finding neither establishes opposite dominance directions nor supports a mechanistic separation of circuits.
4.2. The Time Constant Is Specific, but Not Complete
The time constant remains an indispensable descriptor of post-rotatory decay [2,3,4,5,6,10,12]. Its value lies precisely in its specificity: it summarizes temporal persistence. It does not specify the initial or peak magnitude of the eye-velocity response, nor whether the directional balance of response magnitude matches the directional balance of decay. The 1977 formulation itself did not reduce velocity storage to a single decay constant; charging, discharge in darkness, visually induced discharge, and vestibular and optokinetic after-responses were treated as dynamically related but non-identical phenomena [1]. Importantly, Raphan and Cohen also noted that a single-integrator or single-exponential representation is a useful simplification rather than a uniquely complete description of the ocular decay, and that higher-order dynamics can better represent some responses [2].
Our secondary analysis reinforces this distinction. Mean post-rotatory SPV and mean TC showed only a weak, non-significant positive tendency. The data therefore do not support treating magnitude and persistence as interchangeable, while also not excluding some degree of physiological coupling. This interpretation is compatible with Karmali’s accuracy–precision framework, in which the velocity-storage time constant reflects a regulated compromise in temporal integration: extending the integration window can improve low-frequency motion-estimation accuracy while accumulating additional neural noise and reducing precision [10].
Likewise, a shortened TC need not identify a single failure mechanism. Computational work after peripheral vestibular damage suggests that reducing integration time may be adaptive when the signal-to-noise ratio is degraded, limiting noise accumulation at the cost of low-frequency accuracy [16]. Thus, the measured TC is a property of the observed decay, not a direct anatomical readout of one neural element.
Accordingly, an asymmetric or shortened TC identifies a temporal-decay feature but does not tell us whether the post-rotatory eye-velocity response is large, small, symmetric, or strongly directional. Conversely, an asymmetric SPV does not determine how long the response will persist in either direction. In measurement terms, the time constant is physiologically specific, but it is not a complete description of the eye-movement response.
4.3. Illustrative Reciprocal Configurations in Continuous OPD Space
The reciprocal positions of Cases A and B provide the clearest visual examples of the cohort-level result. Case A showed marked output asymmetry (SPV-AR 57.7%) with relatively balanced persistence (TC-AR 13.0%), whereas Case B showed the converse: near-symmetric output (SPV-AR 10.6%) with marked persistence asymmetry (TC-AR 70.3%). These contrasting illustrative positions in the SPV-AR/TC-AR plane demonstrate why output directionality and persistence directionality should be reported separately. They are illustrative response patterns, not independent validation of a classification scheme.
The wider cohort formed a continuum rather than discrete categories. Cases C–F occupied different regions of the same quantitative space, including combined asymmetry, extreme persistence asymmetry, very-low output with ultra-short symmetric persistence, and a relatively balanced pattern. The value of these examples is therefore descriptive: they show how distinct post-rotatory eye-movement traces can yield different combinations of output and decay without implying disease subtypes.
4.4. Eye-Movement Dynamics Within the Sustained Response
The present analysis is intentionally narrower than a general comparison of vestibular tests. Rotational and post-rotatory paradigms generate eye movements over a time scale in which peripheral mechanics, central storage, adaptation, gravity referencing, and multisensory integration interact [4,7,8,9,10,11,12,13]. By contrast, high-frequency and high-acceleration head rotations emphasize a different dynamical regime of the vestibulo-ocular reflex [17], consistent with the broader physiological distinction between transient and sustained vestibular processing [18]. Within the post-rotatory response itself, our data show that expressed slow-phase velocity and the persistence of its decay should not be assumed to vary together.
This adds an internal level of resolution to the sustained response itself. Even before comparing post-rotatory behavior with vHIT, caloric, vibration-evoked, or otolith-dependent measures, the post-rotatory trace already contains at least two non-redundant quantitative dimensions: how much eye velocity is expressed and how long that response persists. The present study isolates that within-response distinction rather than using other vestibular domains as endpoints.
Neither SPV nor TC should be interpreted as a direct anatomical readout of a discrete circuit. They are observable descriptors of a distributed ocular response generated by interacting vestibular and central processes [7,8,9,10,11,13,14].
4.5. Output–Persistence–Directionality as an Eye-Movement Measurement Framework
For descriptive purposes, we organize the response as Output–Persistence–Directionality (OPD). Output is the direction-specific measured post-rotatory SPV, persistence is the corresponding reported post-rotatory decay TC, and directionality denotes inter-directional comparison. In this paper, the latter is operationalized exclusively as the magnitude of normalized absolute asymmetry in each variable (SPV-AR and TC-AR). The term “directionality” therefore should not be read as evidence of directional dominance or SPV–TC sign concordance, which would require a separate signed analysis.
OPD is proposed as an exploratory, multidimensional reporting framework rather than a new test, novel raw variable, diagnostic classification or independent physiological model. Directional preponderance, post-rotatory response magnitude and decay time constants are well-established; the incremental contribution is the joint patient-level analysis of two explicitly defined asymmetry magnitudes and their continuous combined configurations, while retaining mean output and mean persistence separately. The dataset does not define thresholds or validated patient groups, and the weak correlation estimates do not establish statistical or physiological independence.
The framework also points toward richer analysis of the raw ocular signal. A software-derived TC compresses the decay into one parameter, whereas the underlying post-rotatory trace may contain information about decay shape, non-exponential components, adaptation, reversals, and direction-dependent kinetics. Future studies using standardized raw eye-velocity fitting could extend OPD with measures such as integrated eye velocity, area under the curve, decay-model comparison, and trial-to-trial reproducibility.
Recent in-vivo evidence complements this measurement-level approach. Rühl et al. [19] used galvanic-vestibular after-nystagmus and infratentorial fMRI to identify vestibular-nucleus and vestibulo-cerebellar correlates of human velocity storage, including nodulus–uvula circuitry. Their work addresses the distributed neural substrates of velocity storage; the present analysis addresses a distinct question about the correspondence between two observable post-rotatory eye-movement descriptors. No mechanistic localization or physiological independence is inferred from the present correlations.
4.6. Physiological Interpretation Without Over-Localization
Post-rotatory SPV should not be equated with velocity storage itself. In the classical Raphan–Cohen–Matsuo scheme, measured eye velocity reflects converging direct and stored components rather than the output of the storage integrator alone [1,2]. Likewise, TC is a descriptor of decay dynamics, not a direct anatomical measurement of an isolated integrator. The observed pair of values therefore characterizes the behavior of the ocular response, not the location of a lesion.
Modern internal-model formulations reinforce this caution. Velocity storage-related signals participate in estimates of rotational velocity, gravity orientation, and inertial acceleration and are shaped by otolith, cerebellar, multisensory, and behavioral-context influences [8,9,11,12,13,14]. The present study does not localize the neural source of the observed dissociations. Its contribution is to define a quantitative eye-movement description requiring prospective reproducibility testing that can be compared with mechanistic models in future work.
4.7. Implications for Quantitative Eye-Movement Reporting
The immediate implication is methodological. Reporting a post-rotatory response with a single decay metric can conceal substantial differences in eye-velocity magnitude and directional balance. Separate reporting of direction-specific post-rotatory SPV, mean SPV, SPV asymmetry, direction-specific TC, mean TC, and TC asymmetry preserves information that is otherwise lost when the response is reduced to one number.
Whether this additional information improves symptom correlation, physiological stratification, diagnostic discrimination, or prediction of longitudinal outcomes remains unknown. Those are prospective questions. The present study supports a reporting principle rather than a treatment algorithm: quantify the eye-movement response in more than one dimension before attempting clinical interpretation.
4.8. Limitations
Several limitations should be considered. First, this was a single-center cohort deliberately enriched for fast-versus-sustained discordance, limiting external validity. Second, only 31 of 40 fast-domain-eligible patients had complete bilateral SPV and TC measurements; missing and technically unreliable measurements were not imputed. Third, N = 31 yields wide correlation confidence intervals and does not establish independence or rule out modest associations. Fourth, by construction, absolute SPV-AR and TC-AR quantify imbalance magnitude but discard its direction; thus, the primary analysis cannot evaluate sign concordance between larger SPV and longer TC. Fifth, the time constants and SPV endpoints were obtained from software-generated Freyss reports rather than independent re-fitting of raw traces, and the proprietary fitting window and algorithm were not available for independent verification. Sixth, the manually moved but software-guided multi-turn chair did not retain uniformly analyzable trial-level kinematics. Seventh, the source audit corrected seven transcribed post-SPV endpoints, emphasizing the importance of reproducible endpoint conventions and automated future exports. Eighth, there was no contemporaneous healthy control group, and alertness, medication, stimulus history, visual conditions, compensation status and other potential covariates were not modeled. Finally, clinical eligibility used documented interpretations rather than uniformly prospectively applied numerical cut-offs. Standardized motor-driven or fully quantified stimulus protocols, raw eye-velocity fitting, prespecified eligibility thresholds, and test–retest studies are needed for external validation. A two-sided N = 31 correlation analysis has approximately 80% power only for Pearson |r| ≈ 0.485 under a Fisher-z approximation; thus, the analysis is underpowered to reliably detect smaller associations and non-significant findings should not be read as evidence of independence.
4.9. Conceptual Synthesis
The historical velocity-storage literature established that post-rotatory and optokinetic eye movements cannot be explained by peripheral canal mechanics alone and that the ocular response reflects interacting direct, stored, visual, otolith, and gravity-dependent processes [1,2,3,4,5,6,12]. The present data add a measurement-level distinction within the human post-rotatory response: response magnitude, directional balance, and temporal persistence provide complementary information and should not be collapsed into a single descriptor.
The time constant remains important, but it is not the whole eye-movement response.
5. Conclusions
In this clinically enriched human cohort, 31 source-verified complete bilateral datasets showed no detectable association between the magnitudes of post-rotatory SPV asymmetry and time-constant asymmetry. Within the precision permitted by this sample, the degree of imbalance in response magnitude and the degree of imbalance in decay persistence merit separate reporting. These absolute indices do not establish which direction dominates either parameter or whether the same direction dominates both.
Output–Persistence–Directionality provides a compact quantitative language for complementary properties of the post-rotatory ocular response. It does not replace the time constant, establish statistical independence, define diagnostic thresholds, or propose a disease entity. Its value is measurement-based: it preserves information about how much eye velocity is expressed, how long it persists, and whether those properties are directionally balanced.
Prospective studies with standardized stimulus delivery, healthy reference data, test–retest assessment, and raw eye-velocity fitting will be required to determine the reproducibility, normative range, and mechanistic significance of these dimensions.
Supplementary Materials
The following supporting information can be downloaded at: https://www.mdpi.com/article/10.3390/jemr19060130/s1, Table S1: Individual coded post-rotatory SPV and time-constant measurements, derived OPD indices, and available clinical descriptors (vHIT/SHIMP, SVIN/HST, and VEMPs) for the 31 complete bilateral datasets.
Author Contributions
Conceptualization, L.M.; methodology, L.M.; investigation, L.M. and M.S.M.; formal analysis, L.M.; data curation, L.M. and M.S.M.; visualization, L.M.; writing—original draft preparation, L.M.; writing—review and editing, L.M. and M.S.M.; supervision, L.M.; project administration, L.M. All authors have read and agreed to the published version of the manuscript.
Funding
This research received no external funding.
Institutional Review Board Statement
The study was conducted in accordance with the Declaration of Helsinki and approved by the Institutional Review Board of the MSA ENT Academy Center, Cassino, Italy (protocol code 002, 16 January 2026).
Informed Consent Statement
Informed consent was obtained from all subjects involved in the study.
Data Availability Statement
The de-identified data presented in this study are available on request from the corresponding author due to ethical and privacy restrictions.
Acknowledgments
During the preparation of this manuscript, the authors used OpenAI ChatGPT for language editing, document organization, formatting support, and computational cross-checking. The authors reviewed and edited the output and take full responsibility for the content of this publication. No source measurement or clinical adjudication was generated by the AI system.
Conflicts of Interest
The authors declare no conflicts of interest. A related article derived from the same CORE40/VSD registry has been published in the Journal of Personalized Medicine [20]. That study investigated multidomain vestibular phenotyping in the 40-patient fast-domain-eligible cohort, whereas the present JEMR study examines a distinct quantitative question in the 31-patient subset with complete bilateral post-rotatory SPV and TC measurements. Although the two studies share a registry source and some participants, their research questions, primary endpoints, statistical analyses, figures, and conclusions differ. The shared source cohort and the relationship between the studies are disclosed here to ensure editorial transparency and appropriate cross-referencing.
Abbreviations
The following abbreviations are used in this manuscript:
| BPPV | benign paroxysmal positional vertigo |
| CI | confidence interval |
| DVNS | dynamic videonystagmography system |
| HIMP | head impulse paradigm |
| IQR | interquartile range |
| OPD | output–persistence–directionality |
| SHIMP | suppression head impulse paradigm |
| SPV | slow-phase velocity |
| SPV-AR | slow-phase velocity asymmetry ratio |
| SVIN | skull vibration-induced nystagmus |
| TC | time constant |
| TC-AR | time-constant asymmetry ratio |
| VEMP | vestibular-evoked myogenic potential |
| VNG | videonystagmography |
| VOR | vestibulo-ocular reflex |
| VSD | velocity storage dysfunction registry |
| vHIT | video head impulse test |
References
- Raphan, T.; Cohen, B.; Matsuo, V. A velocity-storage mechanism responsible for optokinetic nystagmus (OKN), optokinetic after-nystagmus (OKAN), and vestibular nystagmus. In Control of Gaze by Brain Stem Neurons; Baker, R., Berthoz, A., Eds.; Elsevier/North-Holland Biomedical Press: Amsterdam, The Netherlands, 1977; Volume 1, pp. 37–47. [Google Scholar]
- Raphan, T.; Cohen, B. Velocity storage and the ocular response to multidimensional vestibular stimuli. In Adaptive Mechanisms in Gaze Control; Berthoz, A., Melvill Jones, G., Eds.; Elsevier Science Publishers: Amsterdam, The Netherlands, 1985; pp. 123–143. [Google Scholar]
- Cohen, B.; Matsuo, V.; Raphan, T. Quantitative analysis of the velocity characteristics of optokinetic nystagmus and optokinetic after-nystagmus. J. Physiol. 1977, 270, 321–344. [Google Scholar] [CrossRef] [Scilit] [PubMed]
- Raphan, T.; Matsuo, V.; Cohen, B. Velocity storage in the vestibulo-ocular reflex arc (VOR). Exp. Brain Res. 1979, 35, 229–248. [Google Scholar] [CrossRef] [Scilit] [PubMed]
- Cohen, B.; Henn, V.; Raphan, T.; Dennett, D. Velocity storage, nystagmus, and visual-vestibular interactions in humans. Ann. N. Y. Acad. Sci. 1981, 374, 421–433. [Google Scholar] [CrossRef] [Scilit] [PubMed]
- Raphan, T.; Sturm, D. Modeling the spatiotemporal organization of velocity storage in the vestibuloocular reflex by optokinetic studies. J. Neurophysiol. 1991, 66, 1410–1421. [Google Scholar] [CrossRef] [Scilit] [PubMed]
- Angelaki, D.E.; Cullen, K.E. Vestibular system: The many facets of a multimodal sense. Annu. Rev. Neurosci. 2008, 31, 125–150. [Google Scholar] [CrossRef] [Scilit] [PubMed]
- Laurens, J.; Straumann, D.; Hess, B.J.M. Processing of angular motion and gravity information through an internal model. J. Neurophysiol. 2010, 104, 1370–1381. [Google Scholar] [CrossRef] [Scilit] [PubMed]
- Laurens, J.; Angelaki, D.E. The functional significance of velocity storage and its dependence on gravity. Exp. Brain Res. 2011, 210, 407–422. [Google Scholar] [CrossRef] [Scilit] [PubMed]
- Karmali, F. The velocity storage time constant: Balancing between accuracy and precision. Prog. Brain Res. 2019, 248, 269–276. [Google Scholar] [CrossRef] [Scilit] [PubMed]
- Laurens, J. The otolith vermis: A systems neuroscience theory of the Nodulus and Uvula. Front. Syst. Neurosci. 2022, 16, 886284. [Google Scholar] [CrossRef] [Scilit] [PubMed]
- Lackner, J.R.; DiZio, P. Velocity storage: Its multiple roles. J. Neurophysiol. 2020, 123, 1206–1215. [Google Scholar] [CrossRef] [Scilit] [PubMed]
- Cullen, K.E. The vestibular system: Multimodal integration and encoding of self-motion for motor control. Trends Neurosci. 2012, 35, 185–196. [Google Scholar] [CrossRef] [Scilit] [PubMed]
- Cullen, K.E. Vestibular processing during natural self-motion: Implications for perception and action. Nat. Rev. Neurosci. 2019, 20, 346–363. [Google Scholar] [CrossRef] [Scilit] [PubMed]
- Hain, T.C.; Cherchi, M.; Perez-Fernandez, N. The gain-time constant product quantifies total vestibular output in bilateral vestibular loss. Front. Neurol. 2018, 9, 396. [Google Scholar] [CrossRef] [Scilit] [PubMed]
- Madhani, A.; Lewis, R.F.; Karmali, F. How peripheral vestibular damage affects velocity storage: A causative explanation. J. Assoc. Res. Otolaryngol. 2022, 23, 551–566. [Google Scholar] [CrossRef] [Scilit] [PubMed]
- Huterer, M.; Cullen, K.E. Vestibuloocular reflex dynamics during high-frequency and high-acceleration rotations of the head on body in rhesus monkey. J. Neurophysiol. 2002, 88, 13–28. [Google Scholar] [CrossRef] [Scilit] [PubMed]
- Curthoys, I.S.; MacDougall, H.G.; Vidal, P.-P.; de Waele, C. Sustained and transient vestibular systems: A physiological basis for interpreting vestibular function. Front. Neurol. 2017, 8, 117. [Google Scholar] [CrossRef] [Scilit] [PubMed]
- Rühl, M.; Kimmel, R.; Ertl, M.; Conrad, J.; zu Eulenburg, P. In Vivo Localization of the Human Velocity Storage Mechanism and Its Core Cerebellar Networks by Means of Galvanic-Vestibular Afternystagmus and fMRI. Cerebellum 2023, 22, 194–205. [Google Scholar] [CrossRef] [Scilit] [PubMed]
- Manzari, L.; Manzari, M.S. Beyond the Normal vHIT: Multidomain Vestibular Phenotyping in Patients with Sustained–Impulsive Discordance. J. Pers. Med. 2026, 16, 544. [Google Scholar] [CrossRef] [Scilit]

Disclaimer/Publisher’s Note: The statements, opinions and data contained in all publications are solely those of the individual author(s) and contributor(s) and not of MDPI and/or the editor(s). MDPI and/or the editor(s) disclaim responsibility for any injury to people or property resulting from any ideas, methods, instructions or products referred to in the content. |
© 2026 by the authors. Licensee MDPI, Basel, Switzerland. This article is an open access article distributed under the terms and conditions of the Creative Commons Attribution (CC BY) license.