


Abstract
A newly developed clinical method of indexing tibial torsion uses the medial surface of the tibia as the proximal reference; however, the selection of a specific landmark on the medial surface has not been justified. Three different surfaces relating to the tibial tuberosity were tested using 24 dry tibial bones to determine which provides the most accurate and reliable landmark for use as the proximal reference. The medial surface of the tibia at the inferior point of the tibial tuberosity was the most reliable proximal reference that yielded the highest level of association between the newly developed clinical method and true tibial torsion (r = 0.77). The new method has the potential to describe the anatomy of the leg and to improve the clinical measurement of tibiofibular torsion. (J Am Podiatr Med Assoc 95(5): 481–485, 2005)
Computed tomography (CT) is widely used to measure tibial torsion,[1] and it is considered the gold standard in providing accurate and consistent results.[2] More recently, the use of magnetic resonance imaging (MRI) has been advocated by some researchers[3] because subjects are not exposed to radiation. When CT and MRI are not available, or before these tests are conducted, the clinician must rely on physical examination of tibiofibular torsion using surface landmarks on the leg.[4] However, the validity and reliability of physical examination are unclear.[5–7
Traditional clinical measures of tibiofibular torsion are based on the assumption that the posterior surface of the tibial condyle lies either parallel to the horizontal or perpendicular to the longitudinal axis of the thigh.[6] Therefore, the longitudinal axis of the thigh and the horizontal plane, which are not part of the tibia, are used as the proximal references for these methods.[5] However, it is not possible to clinically verify that the posterior surface of the tibial condyle lies along these reference lines; furthermore, rotation at the hip and knee joints during measurement may easily introduce measurement error. Hence there is a need for a better clinical method of measuring tibiofibular torsion.
We developed an alternative clinical method of indexing tibiofibular torsion.[8] The new method (the tibiofibular torsion index) uses the medial surface of the tibia as the proximal reference instead of the posterior surface of the tibial condyle. The angle between the proximal and distal reference lines—a tangential line on the medial surface of the tibia and the transmalleolar axis—is defined as the tibiofibular torsion index. Each angle of the reference line with respect to the horizontal line is separately measured using an inclinometer, and the values are summed to represent the tibiofibular torsion index. Unlike previous methods, the new method showed very good in vivo reliability, with an intraclass correlation coefficient (ICC) of 0.96 and an SEM of 1.8°, whereas the ICC and SEM for an existing method were 0.78 and 4.0°, respectively.[8] The better reliability of the new method may have been due to the use of the medial surface of the tibia as the proximal reference, a surface that is clinically accessible and verifiable, in contrast to the horizontal line and the longitudinal axis of the thigh as fictitious proximal references. Nevertheless, the study[8] did not explore alternative landmarks on the medial surface of the tibia as the proximal reference in terms of the reliability and validity of measurements.
The purposes of our in vitro study were 1) to examine which of three proximal landmarks on the medial surface of the tibia would result in the most reliable results and 2) to determine the association between true tibial torsion and the tibial torsion index.
Methods
Measurement Procedure
We used dry tibial bones to exclude sources of error, such as leg movement and fat around the tibia, that may confound in vivo measurement. Therefore, instead of measuring true tibiofibular torsion and the tibiofibular torsion index in vivo, they were measured on dry bones. The tibial torsion index, defined as the angle between the tangential line of the medial surface of the tibia and the distal tibia (α + β in Fig. 1A), was measured on 24 tibial bones obtained from 24 half-skeletons (19 from India and 5 from France) from the School of Physiotherapy, Curtin University of Technology, Western Australia. Each tibia was set on a table to rest the posterior surface of the tibial condyle on the surface of the table parallel to the horizontal plane.
An analogue inclinometer (AcuAngleR Model A-100; MIM Productions Pte Ltd, Singapore) was used to measure the angles. The inclinometer has a rotating dial, which allows reading of the angle to the nearest 1.0°. Because the depth of the inclinometer at the base support was broad, a thin, rectangular, metal plate was placed on the medial surface of the tibia so that the tilt angle was consistently measured at the same place (Fig. 1B). The edge of the plate was used to determine where the tilt angle was measured, and the plate was adjusted to secure it to the medial surface of the tibia. The inclinometer was then secured on the other side (the top) of the plate (Fig. 1B).
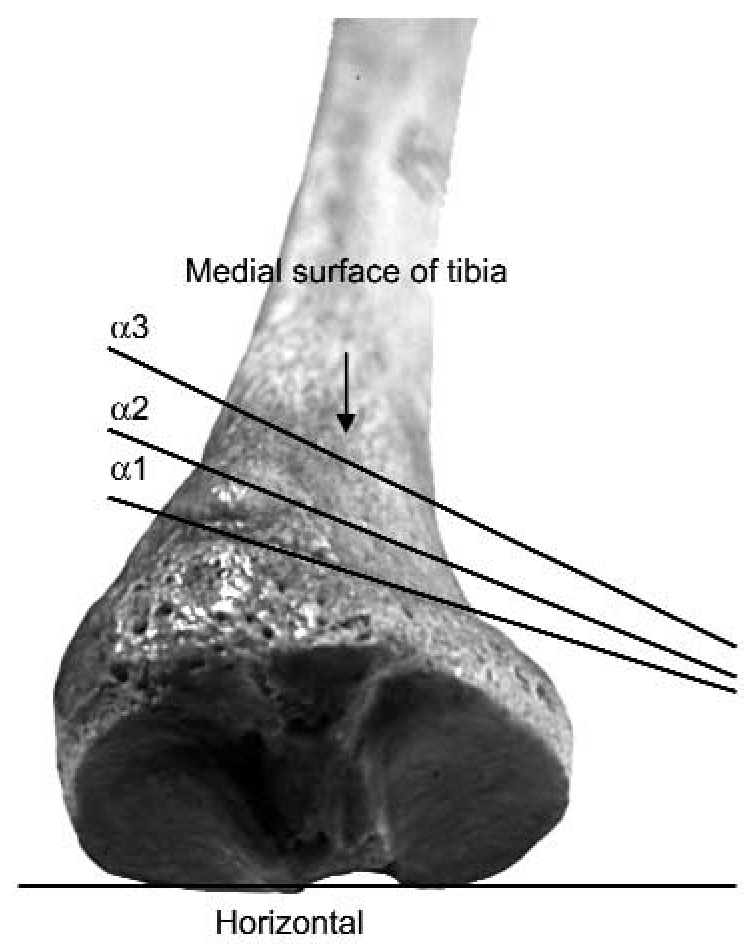
The angle between the tangential line of the medial surface of the tibia and the horizontal along the posterior surface of the tibial condyle was measured using three slightly different landmarks defining three different tilt angles of the medial surface of the tibia (αi in Fig. 2): α1, the angle at the level of the superior point of the tibial tuberosity; α2, the angle at the level of the anterior point of the tibial tuberosity; and α3, the angle at the level of the inferior point of the tibial tuberosity.
Distally, the tilt angle of the distal tibia (β in Fig. 1A) was defined as the angle between a line joining the midpoints of the medial malleolus and the fibular notch and the horizontal, and it was measured using the same inclinometer (Fig. 1C). Because the posterior surface of the tibial condyle lay in the horizontal during the measurements, β was a measurement of true tibial torsion. Tibial torsion indices were then calculated as αi + β.
In each dry bone, α1 was measured first, followed in order by α2, α3, and β. The four readings were then repeated two more times, and the average reading was calculated from three sets of data. The three sets of data for each variable were used for the reliability analysis.
Data Analysis
The mean, SD, maximum, and minimum values for αi, β, and αi + β were calculated. To analyze the degree of variation among all three trials of αi, the SEM was computed.[9] Reliability analysis was also performed for αi using a type (3,1) ICC[9] to assess which landmark among three different measurements—α1, α2, and α3—was the most reliable. The ICC was also calculated for β and αi + β.
One-way analysis of variance was performed to describe the differences among α1, α2, and α3, and post hoc analysis (the Tukey test) was then performed where significant differences among the variables were observed. The Pearson product moment correlation coefficient was used to examine the relationship between true tibial torsion (β) and the tibial torsion indices (αi + β). To estimate systematic differences between true tibial torsion (β) and the tibial torsion indices (αi + β), the regression constant from the linear equation between these variables was also computed. An α of .05 was considered to be the level of significance. Computer software programs—SPSS version 10.0 (SPSS Science, Chicago, Illinois) and MS Excel 2000 (Microsoft Corp, Redmond, Washington) —were used to calculate these statistics.
Results
The descriptive statistics are given in Table 1. The mean (SD) value of β (true tibial torsion) was 29.7° (7.4°). The SEMs for αi were between 0.7° and 1.3°, the smallest SEM being for the measurement of α3. Similarly, the SEMs for αi + β were between 1.3° and 1.7°, the smallest SEM being for the measurement of α3 + β. The results indicated that α3 had more consistent results among the three measurements than the other two landmarks. The ICC values were greater than 0.90 for all of the variables, indicating good reliability.
There was a significant difference among the three αi variables (F2,69 = 13.48; P < .01). Post hoc tests showed significant differences between α1 and α2 (P < .01) and between α1 and α3 (P < .01) but not between α2 and α3 (P = .84).
Positive correlation coefficients were observed between β (true tibial torsion) and αi + β (the tibial torsion indices), the strongest being between β and α3 + β (Table 2). The regression constants were 45.5°, 44.9°, and 43.0°, respectively, in the linear equations established between β and α1 + β, β and α 2 + β, and β and α3 + β.
Discussion
The results of the present study indicate that the tibiofibular torsion index in vivo will yield the highest reliability when the medial surface of the tibia at the inferior point of the tibial tuberosity (α3) is used as the proximal landmark. This landmark will also yield the strongest association with true tibiofibular torsion compared with the other two points relating to the tibial tuberosity.
Owing to the use of the medial surface of the tibia as the proximal reference, the results of the tibiofibular torsion index in vivo will yield a systematic difference of 40° to 45° from true tibiofibular torsion, although further in vivo investigation is warranted for confirmation. No previous study, to our knowledge, has reported the relationship between true tibial torsion and the torsion angle between the medial surface of the tibia and the distal end of the tibia, limiting how the results in the present study can be compared with those of others. The mean value of true tibial torsion in the present study was in agreement with values in previous cadaveric studies (30.0°–35.0°).[1,7
The reason for different correlation coefficients in different reference points relating to the tibial tuberosity may be the rough and rounded nature of the medial surface of the tibia, particularly at the superior point of the tibial tuberosity, because this point showed the lowest ICC and the highest SEM values among all three landmarks. Moreover, the tilt angles of the medial surface of the tibia at the superior point of the tibial tuberosity were significantly different from those at the anterior and inferior points of the tibial tuberosity. This difference reflects anatomical diversity and asymmetry in the proximal portion of the tibia, affecting the association between true tibial torsion and the tibial torsion index in different landmarks used.
The reliability and the level of association of the tibial torsion index with true tibial torsion were comparable when the anterior and inferior points of the tibial tuberosity were used. Furthermore, there was no significant difference in the angle of the medial surface of the tibia (α2 and α3) when these two points were used as the proximal landmarks. Therefore, when in vivo measurement of the tibiofibular torsion index using the medial surface of the tibia at the inferior point of the tibial tuberosity is not practical owing to fat around the bone, the examiner could move the measurement device, such as an electronic inclinometer, superiorly to the anterior point of the tibial tuberosity until the device can be secured.
The concept of the new technique is not to measure but to index true tibiofibular torsion because it measures different aspects of the structure of the tibia. The absolute value of the tibiofibular torsion index is systematically larger than true tibiofibular torsion. Nevertheless, the measurement provides useful information about the relative anatomical position of the tibial tuberosity with respect to the transmalleolar axis because the proximal reference of the measurement varies according to the position of the tibial tuberosity. Nagamine et al,[10] using CT images, investigated the anatomical relationship of the tibial tuberosity and the transmalleolar axis with respect to the distal femur in people with and without patellofemoral osteoarthritis. The results showed a significant lateral position of the tibial tuberosity with respect to the distal femur in the patient group, but no significant difference in the angle of the transmalleolar axis with respect to the distal femur was found between the groups. Miyanishi et al[11] also showed similar results between people with and without patellar instability. These studies suggested a potential malposition of the tibial tuberosity with respect to the transmalleolar axis, a malposition that may cause abnormal patellar tracking and knee joint pathologies.[10,11] The importance of measuring tibiofibular torsion using the tibial tuberosity and the transmalleolar axis using CT was also proposed by Nagamine et al.[12] The tibiofibular torsion index proposed in the present study uses the medial surface of the tibia relating to the tibial tuberosity; thus it could be well used clinically to describe the anatomical diversity of the tibial tuberosity in people with and without knee joint pathology, warranting further investigation.
Conclusion
The tibial torsion index was most reliable when the medial surface of the tibia at the inferior point of the tibial tuberosity was used as the proximal reference. In addition, the same landmark produced the strongest association between the index and true tibial torsion. The new method yields systematically different outcomes from true tibial torsion because it measures different aspects of the structure of the tibia. Nevertheless, the new method uses a part of the tibia as the proximal reference, and so measurement errors will not be easily introduced by rotation at the hip and knee joints, whereas this is likely to occur with traditional methods. Further research is warranted to examine the association of the tibiofibular torsion index with true tibiofibular torsion in vivo and the potential of the new method for describing the anatomy of the leg bones.

Table 1.
Descriptive Statistics and Reliability Coefficients for All Variables
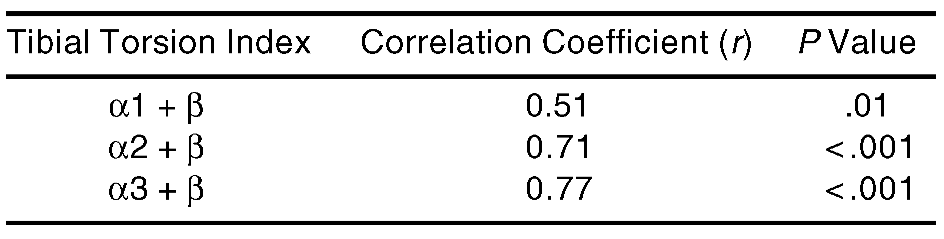
Table 2.
Correlation Coefficients Between the Tibial Torsion Indices (αi + β) and True Tibial Torsion (β) (n = 24)
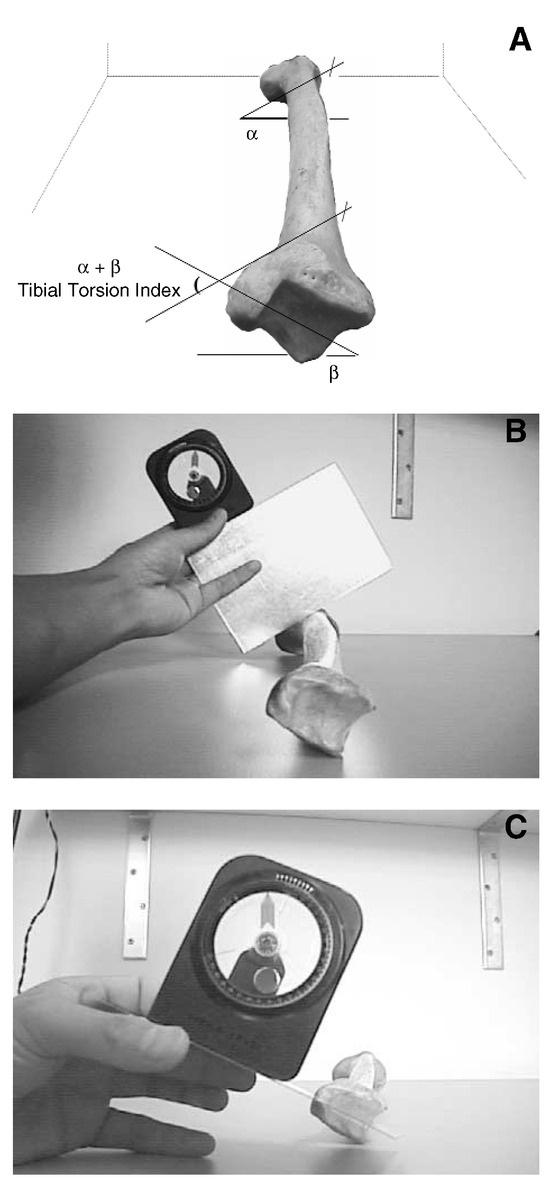
Figure 1.
Definition of the tibial torsion index (α + β). A, Reference lines at the proximal and distal parts of the tibia. B, Actual measurement procedure for the angle between the medial surface of the tibia and the horizontal (α). C, Actual measurement procedure for the angle between the distal axis of the tibia and the horizontal (β).
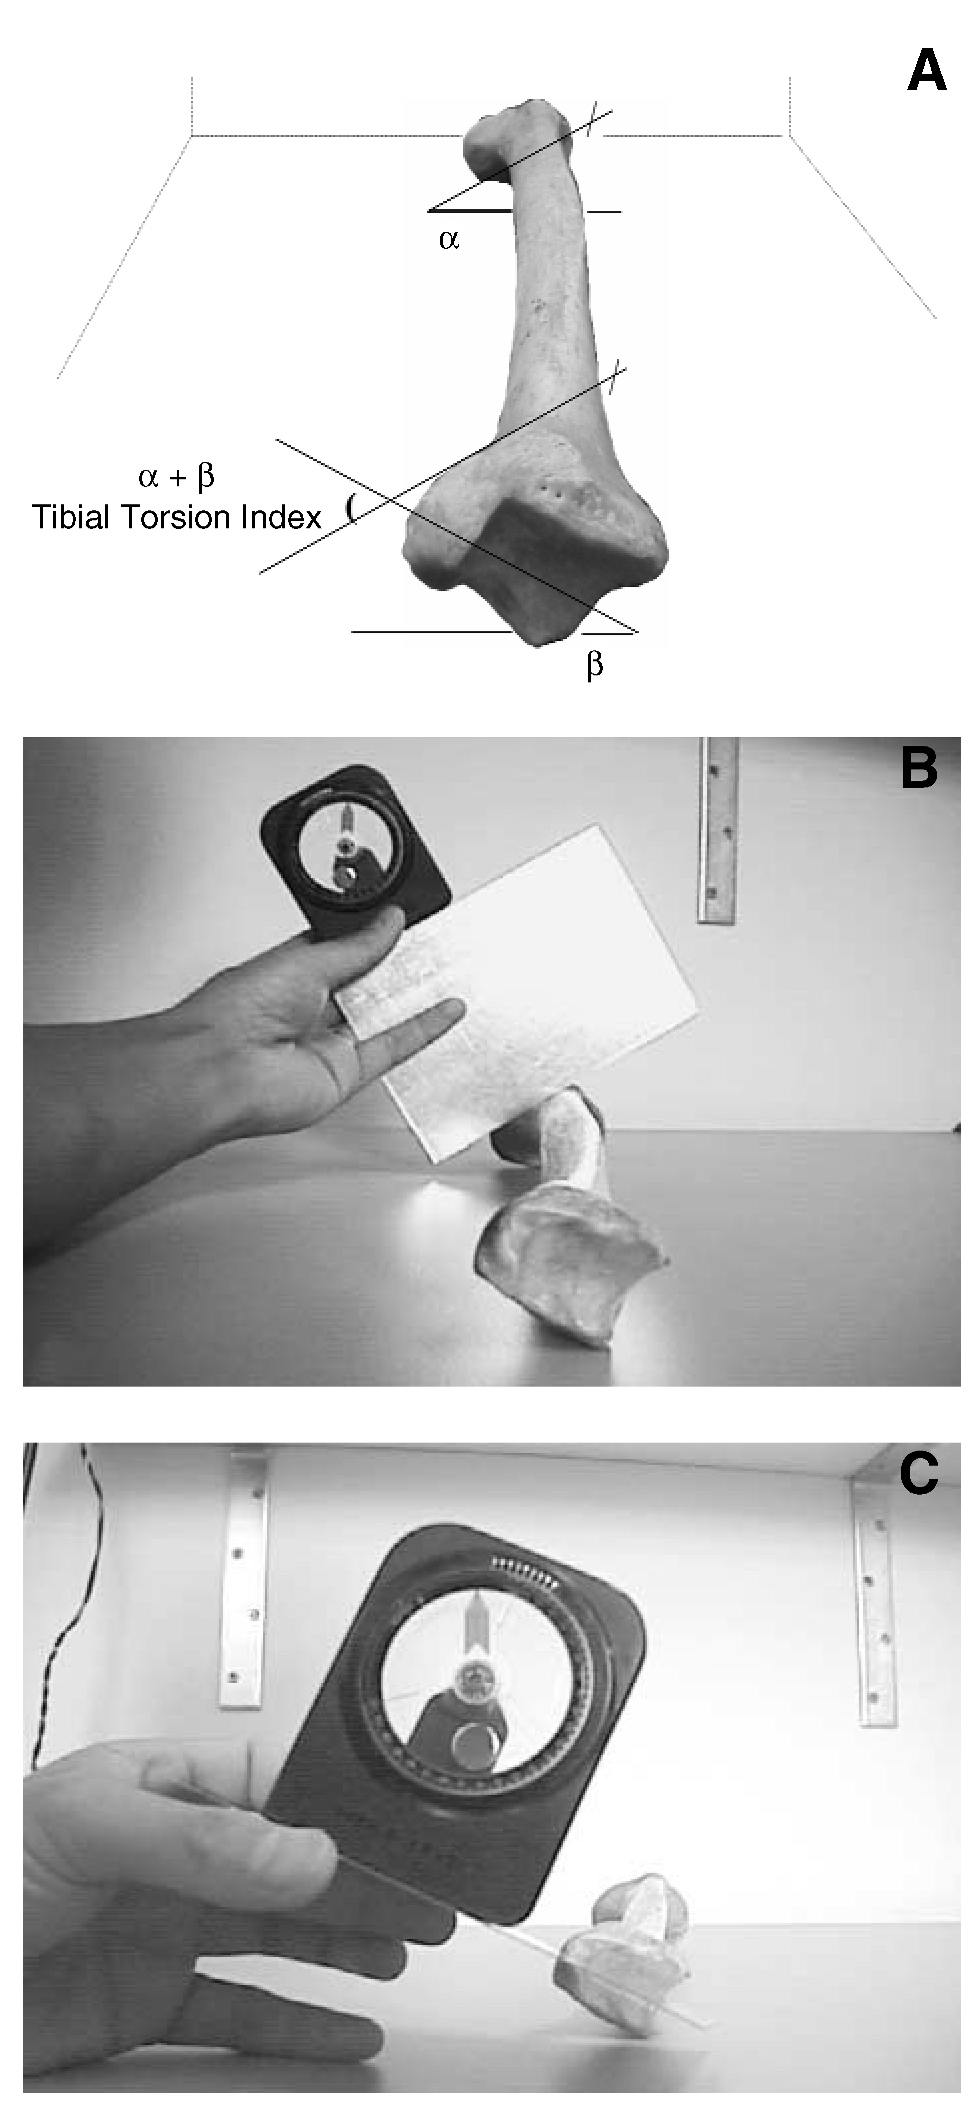
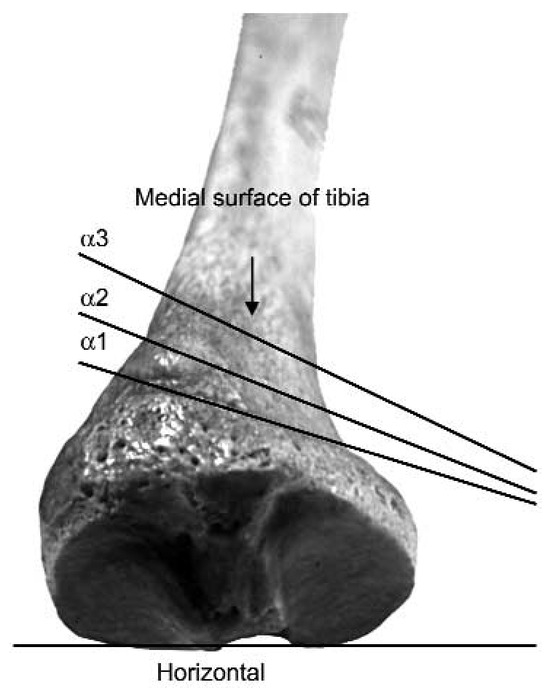
Figure 2.
Three different reference lines of the medial surface of the tibia relating to the tibial tuberosity. α1 indicates the angle at the level of the superior point of the tibial tuberosity; α2, the angle at the level of the anterior point of the tibial tuberosity; and α3, the angle at the level of the inferior point of the tibial tuberosity.
Acknowledgments
Linda Williams, MS, for her early input into the design of the study and review of the manuscript; John Owens, BSc, lecturer in anatomy at the School of Physiotherapy, Curtin University of Technology, for his anatomical advice; Marie Blackmore, PhD, Jurgen Sömmer, PhD, and Leanne Lester, MS, for statistical advice; Sue Jenkins, PhD, and Soumya Ghosh, PhD, for help with reviewing the manuscript; and Maureen Massam, PhD, for editing the English.
References
- Jakob RP, Haertel M, Stussi E: Tibial torsion calculated by computerised tomography and compared to other methods of measurement. .J Bone Joint Surg Br62::238. ,1980. .
- Bulter-Manuel PA, Guy RL, Heatley FW: Measurement of tibial torsion: a new technique applicable to ultrasound and computed tomography. .Br J Radiol65::119. ,1992. .
- Schneider B, Laubenberger J, Jemlich S, et al: Measurement of femoral antetorsion and tibial torsion by magnetic resonance imaging. .Br J Radiol70::575. ,1997. .
- Wynne-Davies R: Talipes equinovarus: a review of eighty-four cases after completion of treatment. .J Bone Joint Surg Br46::464. ,1964. .
- Stuberg W, Temme J, Kaplan P, et al: Measurement of tibial torsion and thigh-foot angle using goniometry and computed tomography. .Clin Orthop Relat Res272::208. ,1991. .
- Lang LM, Volpe RG: Measurement of tibial torsion. .JAPMA88::160. ,1998. .
- Milner CE, Soames RW: A comparison of four in vivo methods of measuring tibial torsion. .J Anat193::139. ,1998. .
- Tamari K, Tinley P: A new concept of estimating tibiofibular torsion: an in vivo reliability study. .J Orthop Sports Phys Ther33::85. ,2003. .
- Portney LG, Watkins MP: “Statistical Measures of Reliability,” in Foundations of Clinical Research: Applications to Practice, 2nd Ed, p 557, Prentice-Hall, Englewood Cliffs, NJ. ,2000. .
- Nagamine R, Miura H, Inoue Y, et al: Malposition of the tibial tubercle during flexion in knees with patellofemoral arthritis. .Skeletal Radiol26::597. ,1997. .
- Miyanishi K, Nagamine R, Murayama S, et al: Tibial tubercle malposition in patellar joint instability: a computed tomography study in full extension and at 30° flexion. .Acta Orthop Scand71::286. ,2000. .
- Nagamine R, Miyanishi K, Miura H, et al: Medial torsion of the tibia in Japanese patients with osteoarthritis of the knee. .Clin Orthop Relat Res408::218. ,2003. .
© 2005 American Podiatric Medical Association