


Abstract
Background: The definition of equinus varies from less than 08 to less than 258 of dorsiflexion with the foot at 908 to the leg. Despite its pervasive nature and broad association with many lower-extremity conditions, the prevalence of ankle equinus is unclear. Furthermore, there are few data to suggest whether equinus is predominantly a bilateral finding or isolated to the affected limb only. Methods: We conducted a prospective cohort study examining consecutive patients attending a single foot and ankle specialty practice. Participation involved an assessment of ankle joint range of motion by a single rater with more than 25 years of clinical experience. We defined ankle equinus as ankle joint dorsiflexion range of motion less than or equal to 08 and severe equinus as less than or equal to –58. Patients who had previously experienced an Achilles tendon rupture, undergone posterior group lengthening (ie, Achilles tendon or gastrocnemius muscle lengthening), or had conservative or surgical treatment of equinus previously were excluded. Results: Of 249 included patients, 61% were female and 79% nondiabetic. The prevalence of ankle equinus was 73% [183 of 249], and nearly all of these patients had bilateral restriction of ankle joint range of motion (prevalence of bilateral ankle equinus was 98.4% [180 of 183] among those with equinus). We also found that ankle equinus was more common in patients with diabetes, higher body mass indexes (BMIs), or overuse symptoms. Conclusions: The prevalence of ankle equinus in this sample was higher than previously reported, and nearly all of these patients had bilateral involvement. These data suggest that many people attending foot/ankle specialty clinics will have ankle equinus, and select groups (diabetes, increased BMI, overuse symptoms) are increasingly likely.
Limited dorsiflexion at the ankle joint, or ankle equinus, has been implicated in the development of several lower-extremity pathologic disorders.[1,2,3,4,5] This condition has been described using an array of terms, such as gastrocnemius equinus, functional equinus, ankle equinus, equinus contractures, and limited ankle dorsiflexion.[6] During normal gait, a minimum of approximately 108 of dorsiflexion is necessary during the stance and toeoff phases of gait.[7]
The superficial posterior compartment of the leg consists of the gastrocnemius, soleus, and plantaris muscles. These structures collectively form the most powerful tendon in the human body, commonly referred to as the calcaneal tendon or Achilles tendon.[8] Gastrocnemius soleus complex contracture has been thoroughly investigated regarding spastic and neurologic conditions, such as cerebral palsy. Additional research of the role of the isolated muscles of the superficial posterior compartment is warranted to fully understand the degree of contribution of each of these tendonmuscle complexes in equinus.[9]
The architecture of the Achilles tendon can result in significant variation in the structural properties and force capacity among individuals. Furthermore, such architecture can result in variations in the interaction between muscle and tendinous portions of this complex.[10] Hof et al[11] showed that tendon stiffness played a role in the interaction and load sharing of the triceps surae muscle and tendon components. Furthermore, multiple studies have shown agreement that there is greater knee and less ankle work absorption with increase in cadence.[12,13,14,15] Thus, the stresses on the major joints of the lower extremity are impacted differently in walking versus running, and likewise, pathologic gait influence will differ with cadence pace.
The gastrocnemius muscle plays a critical role in equinus and is at its longest length during the midstance phase of gait. This two-joint muscle, which crosses both the knee and ankle joint,[16] can demonstrate equinus independently or in conjunction with the soleus as a complex. Equinus gait is characterized by initiation of the gait cycle with forefoot strike and premature plantarflexion early in the midstance component. In addition, patients with extremely low or high gastrocnemius muscle flexibility expressed similar ankle kinematics.[17] Moreover, in an equinus gait the knee and hip demonstrate increased flexion throughout the stance phase. Thus, an increase in tightness of the gastrocnemius muscle can impact the joint angles of the ankle and knee individually or in combination.[18,19]
Several pathologic lower-extremity conditions have been reported to be associated with equinus. A flatfoot deformity combined with a tightened Achilles tendon could result in a pull of the hindfoot into a valgus position and further aggravate the midfoot collapse. On the contrary, midfoot collapse and hindfoot eversion can also lead to adaptive Achilles tendon tightness.[1]
There is no accepted definition of equinus across all of the literature, and it has varied from less than 08 to less than 258 of dorsiflexion with the foot at 908 to the leg.[12,16] The Silfverskiold test is a common clinical test used to evaluate the degree and origin of decreased ability of ankle dorsiflexion. In the podiatric medical community the definition of equinus, particularly in clinical settings, is generally accepted as less than 108 of dorsiflexion with the subtalar joint in neutral position,[11,12] but study definitions vary, and many have frequently used less than 08 or equal to or less than 08 as the threshold for defining ankle equinus.[2,20,22] Despite its pervasive nature, and broad association with many lowerextremity conditions, it is not clear just how prevalent ankle equinus actually is in ambulatory foot/ankle clinics. Furthermore, there are few data to suggest whether equinus is predominantly a bilateral finding or isolated to the affected limb only.
Materials and Methods
We conducted a prospective cohort study examining consecutive patients attending a single foot and ankle specialty practice based in the Midwestern United States. This is a diverse practice offering nonsurgical and surgical care for many common foot/ankle pathologic disorders and a special focus on high-level athletes and pediatric patients with complex deformities. Local institutional review board approval was obtained in November 2015, and data were collected on all of the consented consecutive patients until March 8, 2016. All of the participants signed an authorization for research form and informed consent or assent as appropriate. Patients who had previously experienced an Achilles tendon rupture, undergone posterior group lengthening, or had any previous conservative or surgical treatment of equinus were excluded from the study.
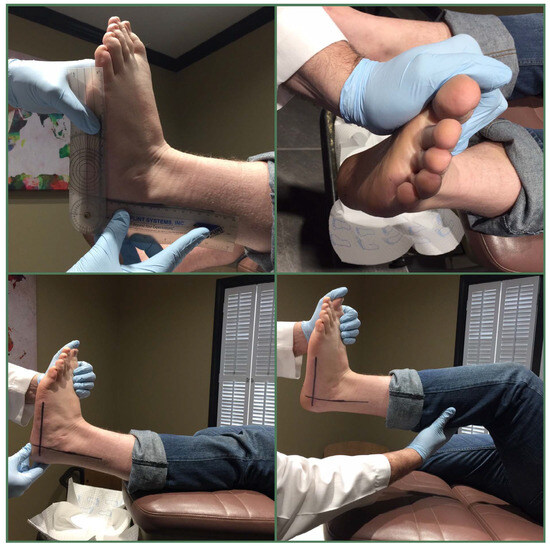
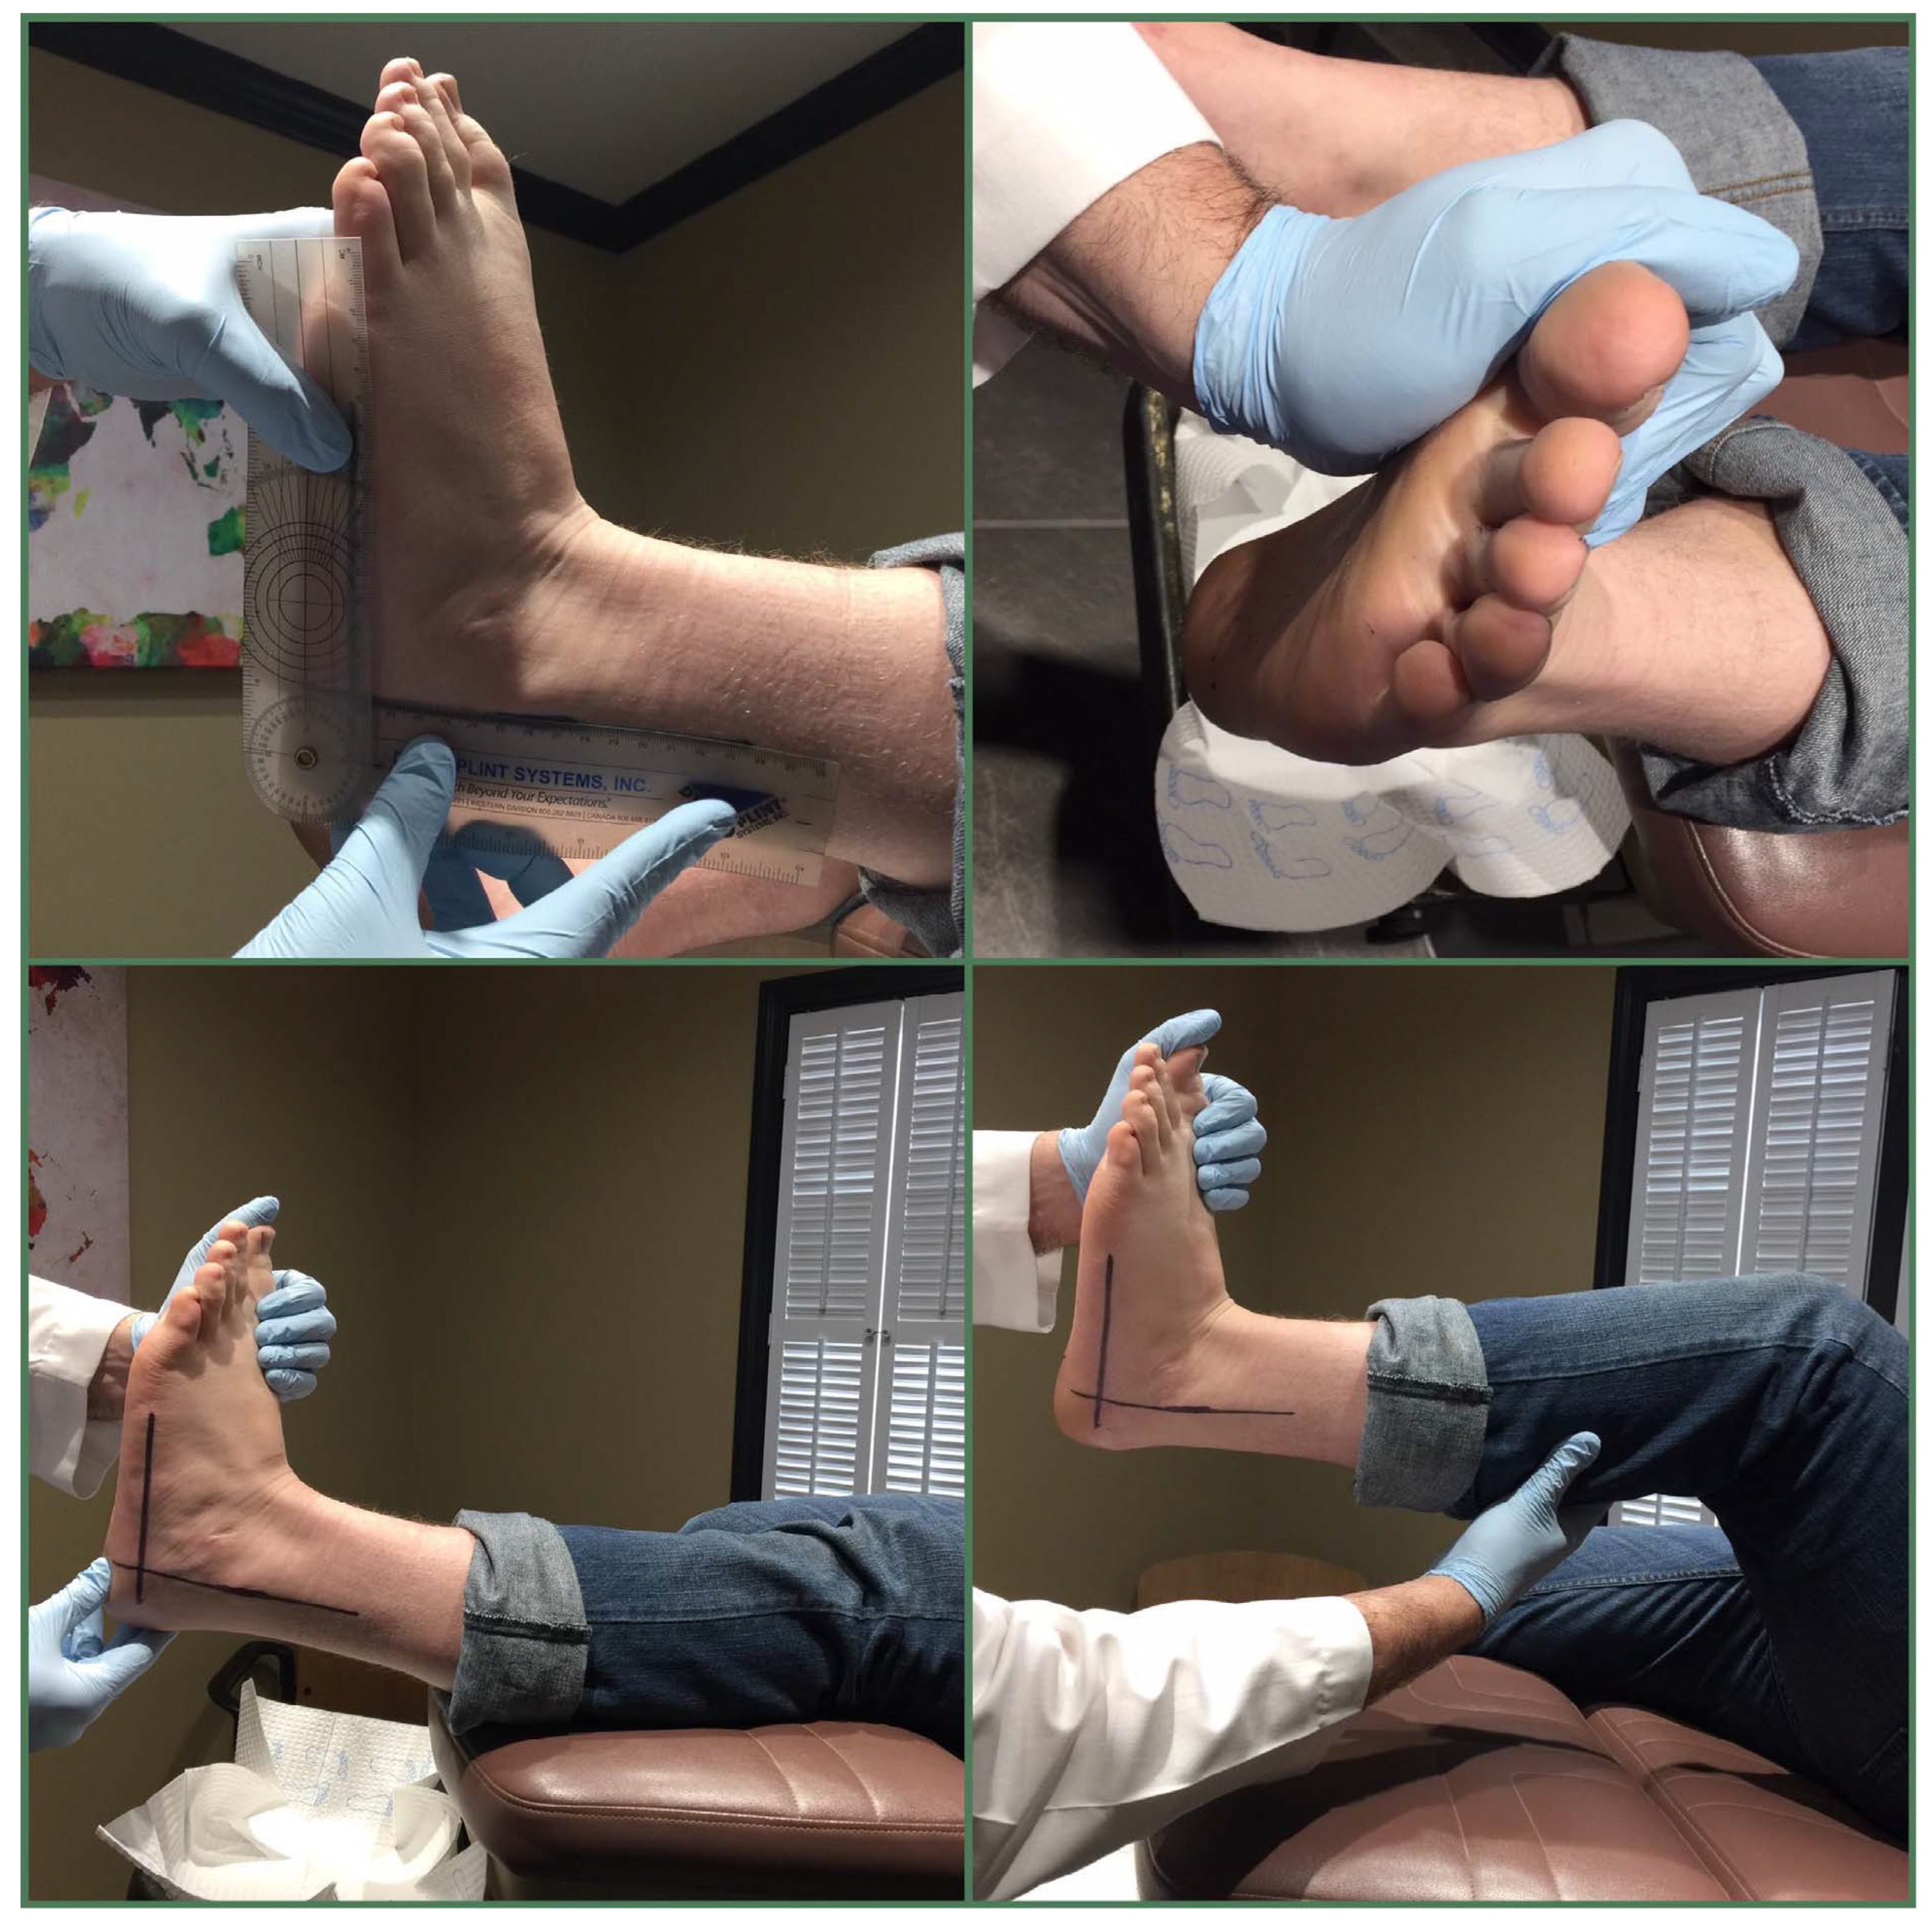
Participation involved an assessment of ankle joint range of motion by a single rater (P.A.D.) with more than 25 years of clinical experience and a special interest in ankle equinus. Both the left and right ankles were evaluated using a traditional, flexible goniometer with the apex or hinge just distal to the lateral malleolus (Figure 1). The foot was held with the subtalar joint in neutral and the midtarsal joint supinated, and while the knee was fully extended, the ankle was maximally dorsiflexed to its end point.
Figure 1.
Technique to measure ankle dorsiflexion.
Select demographics and comorbidities, as well as the patient’s presenting (primary) diagnosis, were recorded for each patient. Patients who had previously experienced an Achilles tendon rupture, undergone posterior group lengthening (ie, Achilles tendon or gastrocnemius muscle lengthening), or had any type of conservative or surgical treatment of equinus previously were excluded from the study.
Statistical Analysis
We defined ankle equinus as ankle joint dorsiflexion range of motion less than or equal to 08, similar to previous studies.[2,20,21] Similarly, severe equinus was defined as ankle joint dorsiflexion range of motion less than or equal to –58. Patients presenting with plantar fasciitis, foot and ankle tendinitis, or symptomatic pes planus were categorized as having overuse injuries. Other diagnoses were classified as nonoveruse complaints. Because there were no significant differences between ankle joint range of motion measured in the right ankle and that measured in the left ankle (P = .377), overall ankle joint dorsiflexion range of motion for each participant was used for the purposes of this analysis, where ankle joint dorsiflexion range of motion = ankle joint dorsiflexion range of motion right + ankle joint dorsiflexion range of motion left / 2.
Group differences were assessed using independent t tests or Wilcoxon rank sum tests. Differences for categorical variables were assessed using the v2 test or the Fisher exact test, as appropriate. Tests of linear correlation among continuous variables were also assessed using scatterplots and Pearson correlation coefficients. Continuous variables were assessed using receiver operating characteristic curves, and cutoff points were assessed by looking at thresholds that maximized the sum of the sensitivity and specificity. Variables in the univariate analysis with P < .25 were entered into the multivariable analysis. For the purposes of the analysis, models to predict ankle joint range of motion, plantar fasciitis, and overuse symptoms were examined. A P ≤ .05 was considered statistically significant, and all of the tests were 2-tailed.
Results
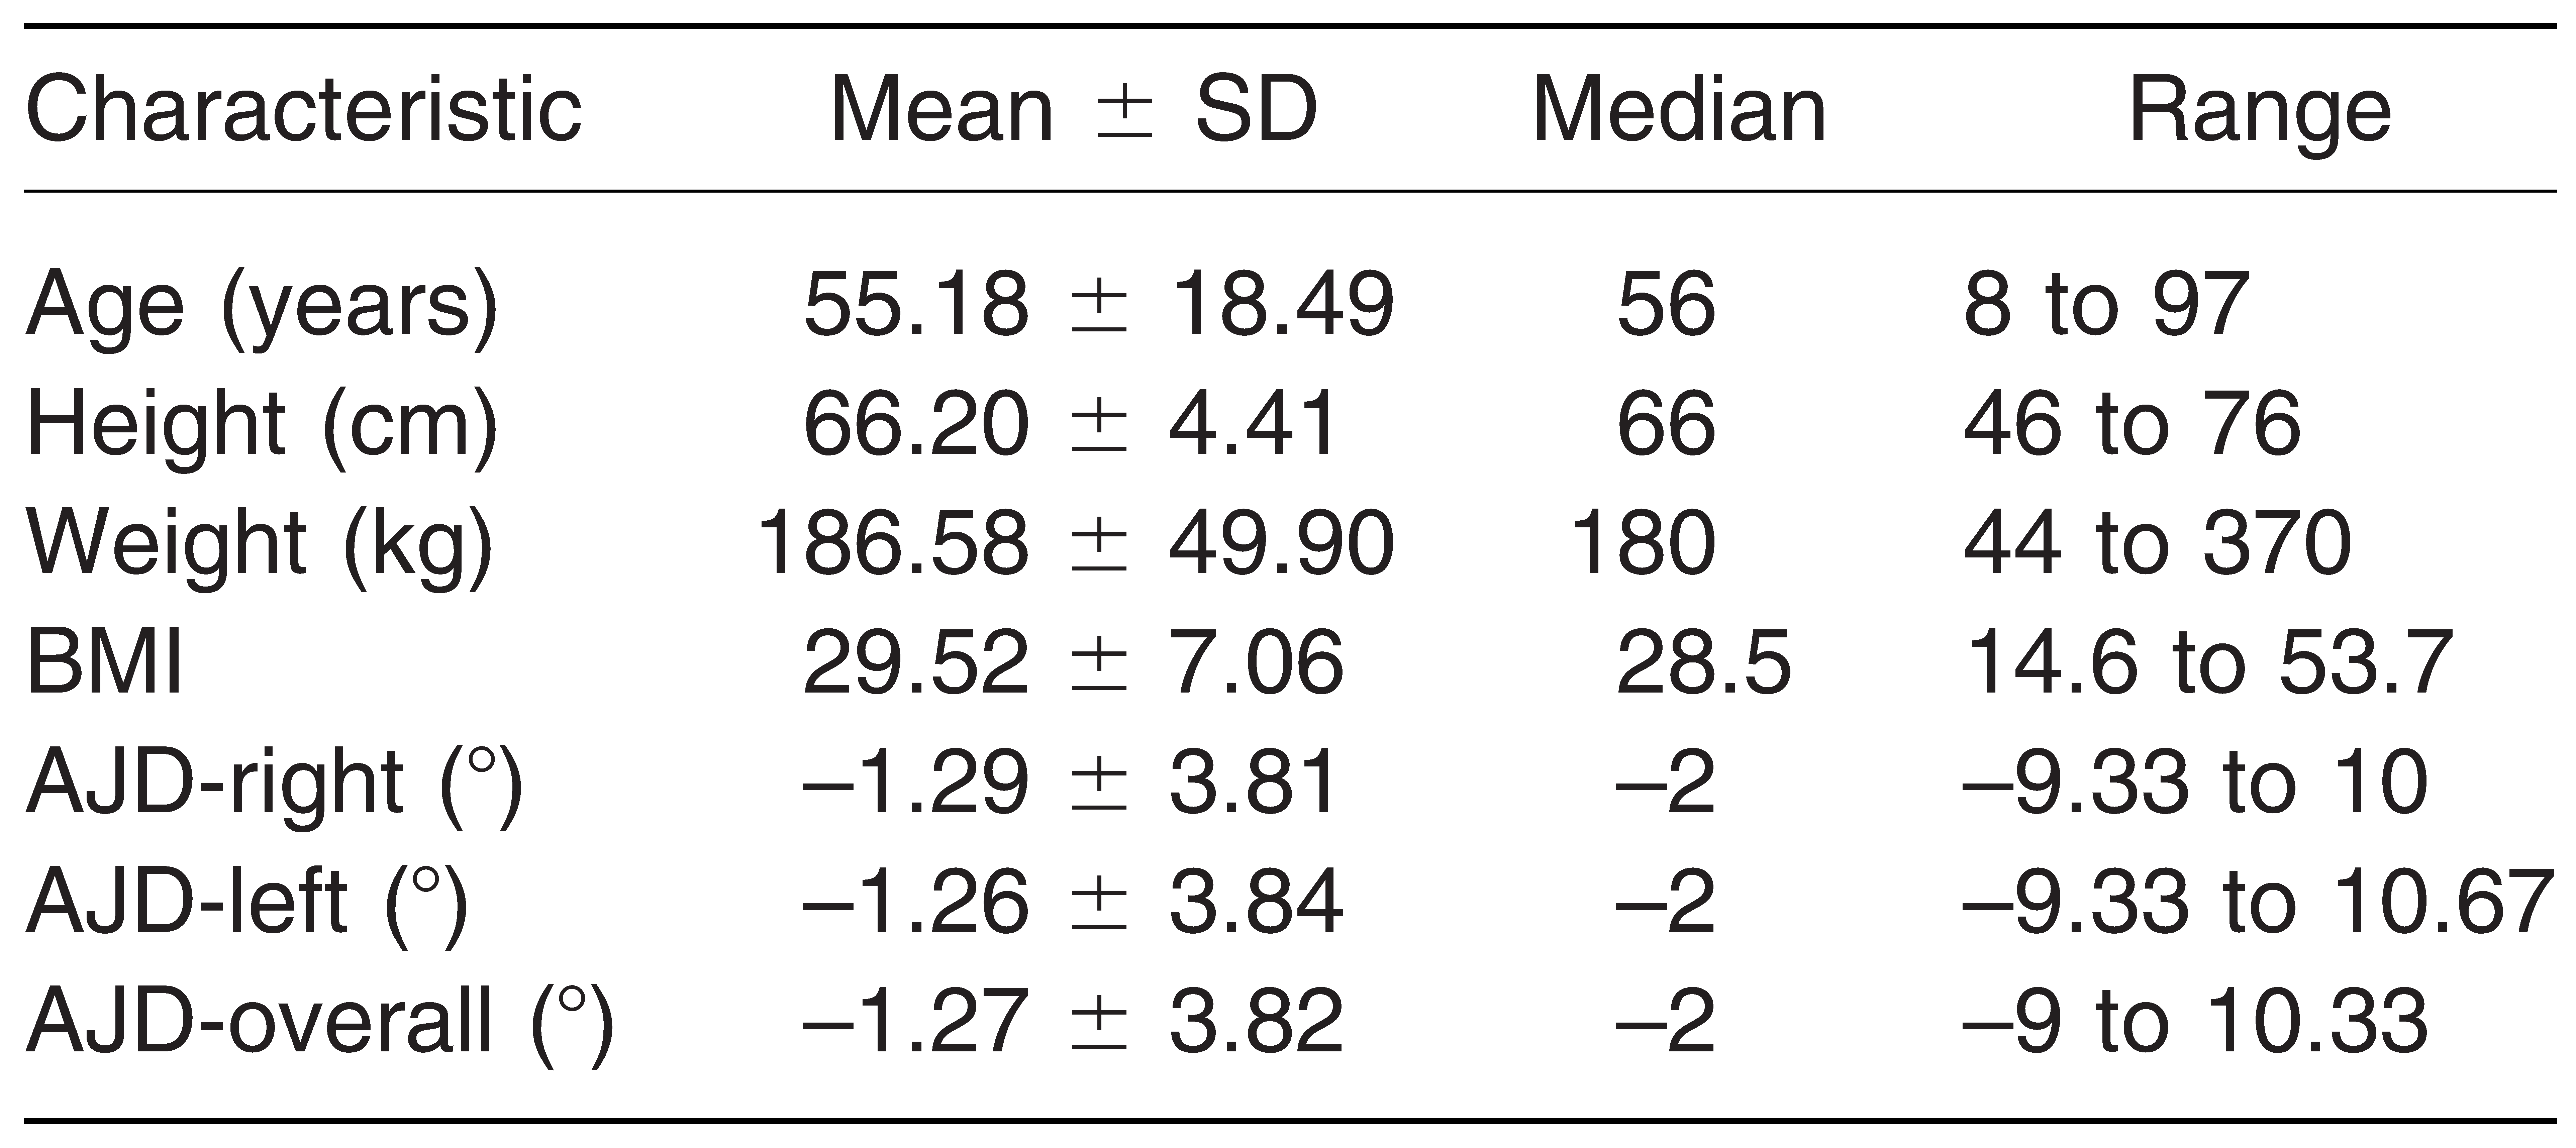
There were 249 patients included in the study. Descriptive statistics for the cohort are given in Table 1. More than half of the patients were female (61%), and most were nondiabetic (79%). The distribution of primary diagnoses for the study population is provided in Table 2. There were 55 patients with foot/ankle overuse pathologic disorders compared with 194 without overuse symptoms as their primary complaint. There were 36 patients with the complaint of plantar fasciitis, which represented approximately 14% of the sample. Ankle equinus was a common finding in this sample (73% [183 of 249]), and nearly everyone who had restricted motion in one ankle demonstrated ankle equinus in the contralateral limb (98.4% [180 of 183]). Furthermore, severe equinus was found in 14% of patients (34 of 249).
Table 1.
Descriptive Statistics of the 249 Study Patients.
Table 2.
Primary Diagnosis of Study Patient Population.
Univariate Analysis
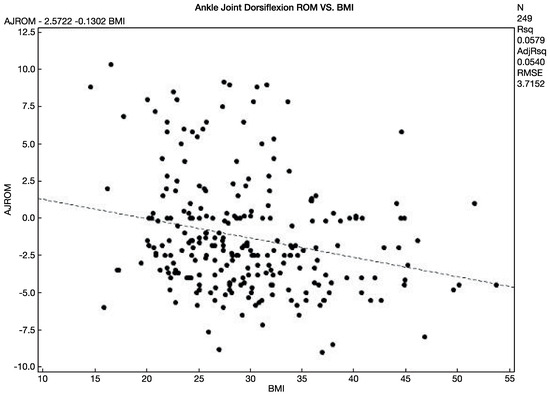
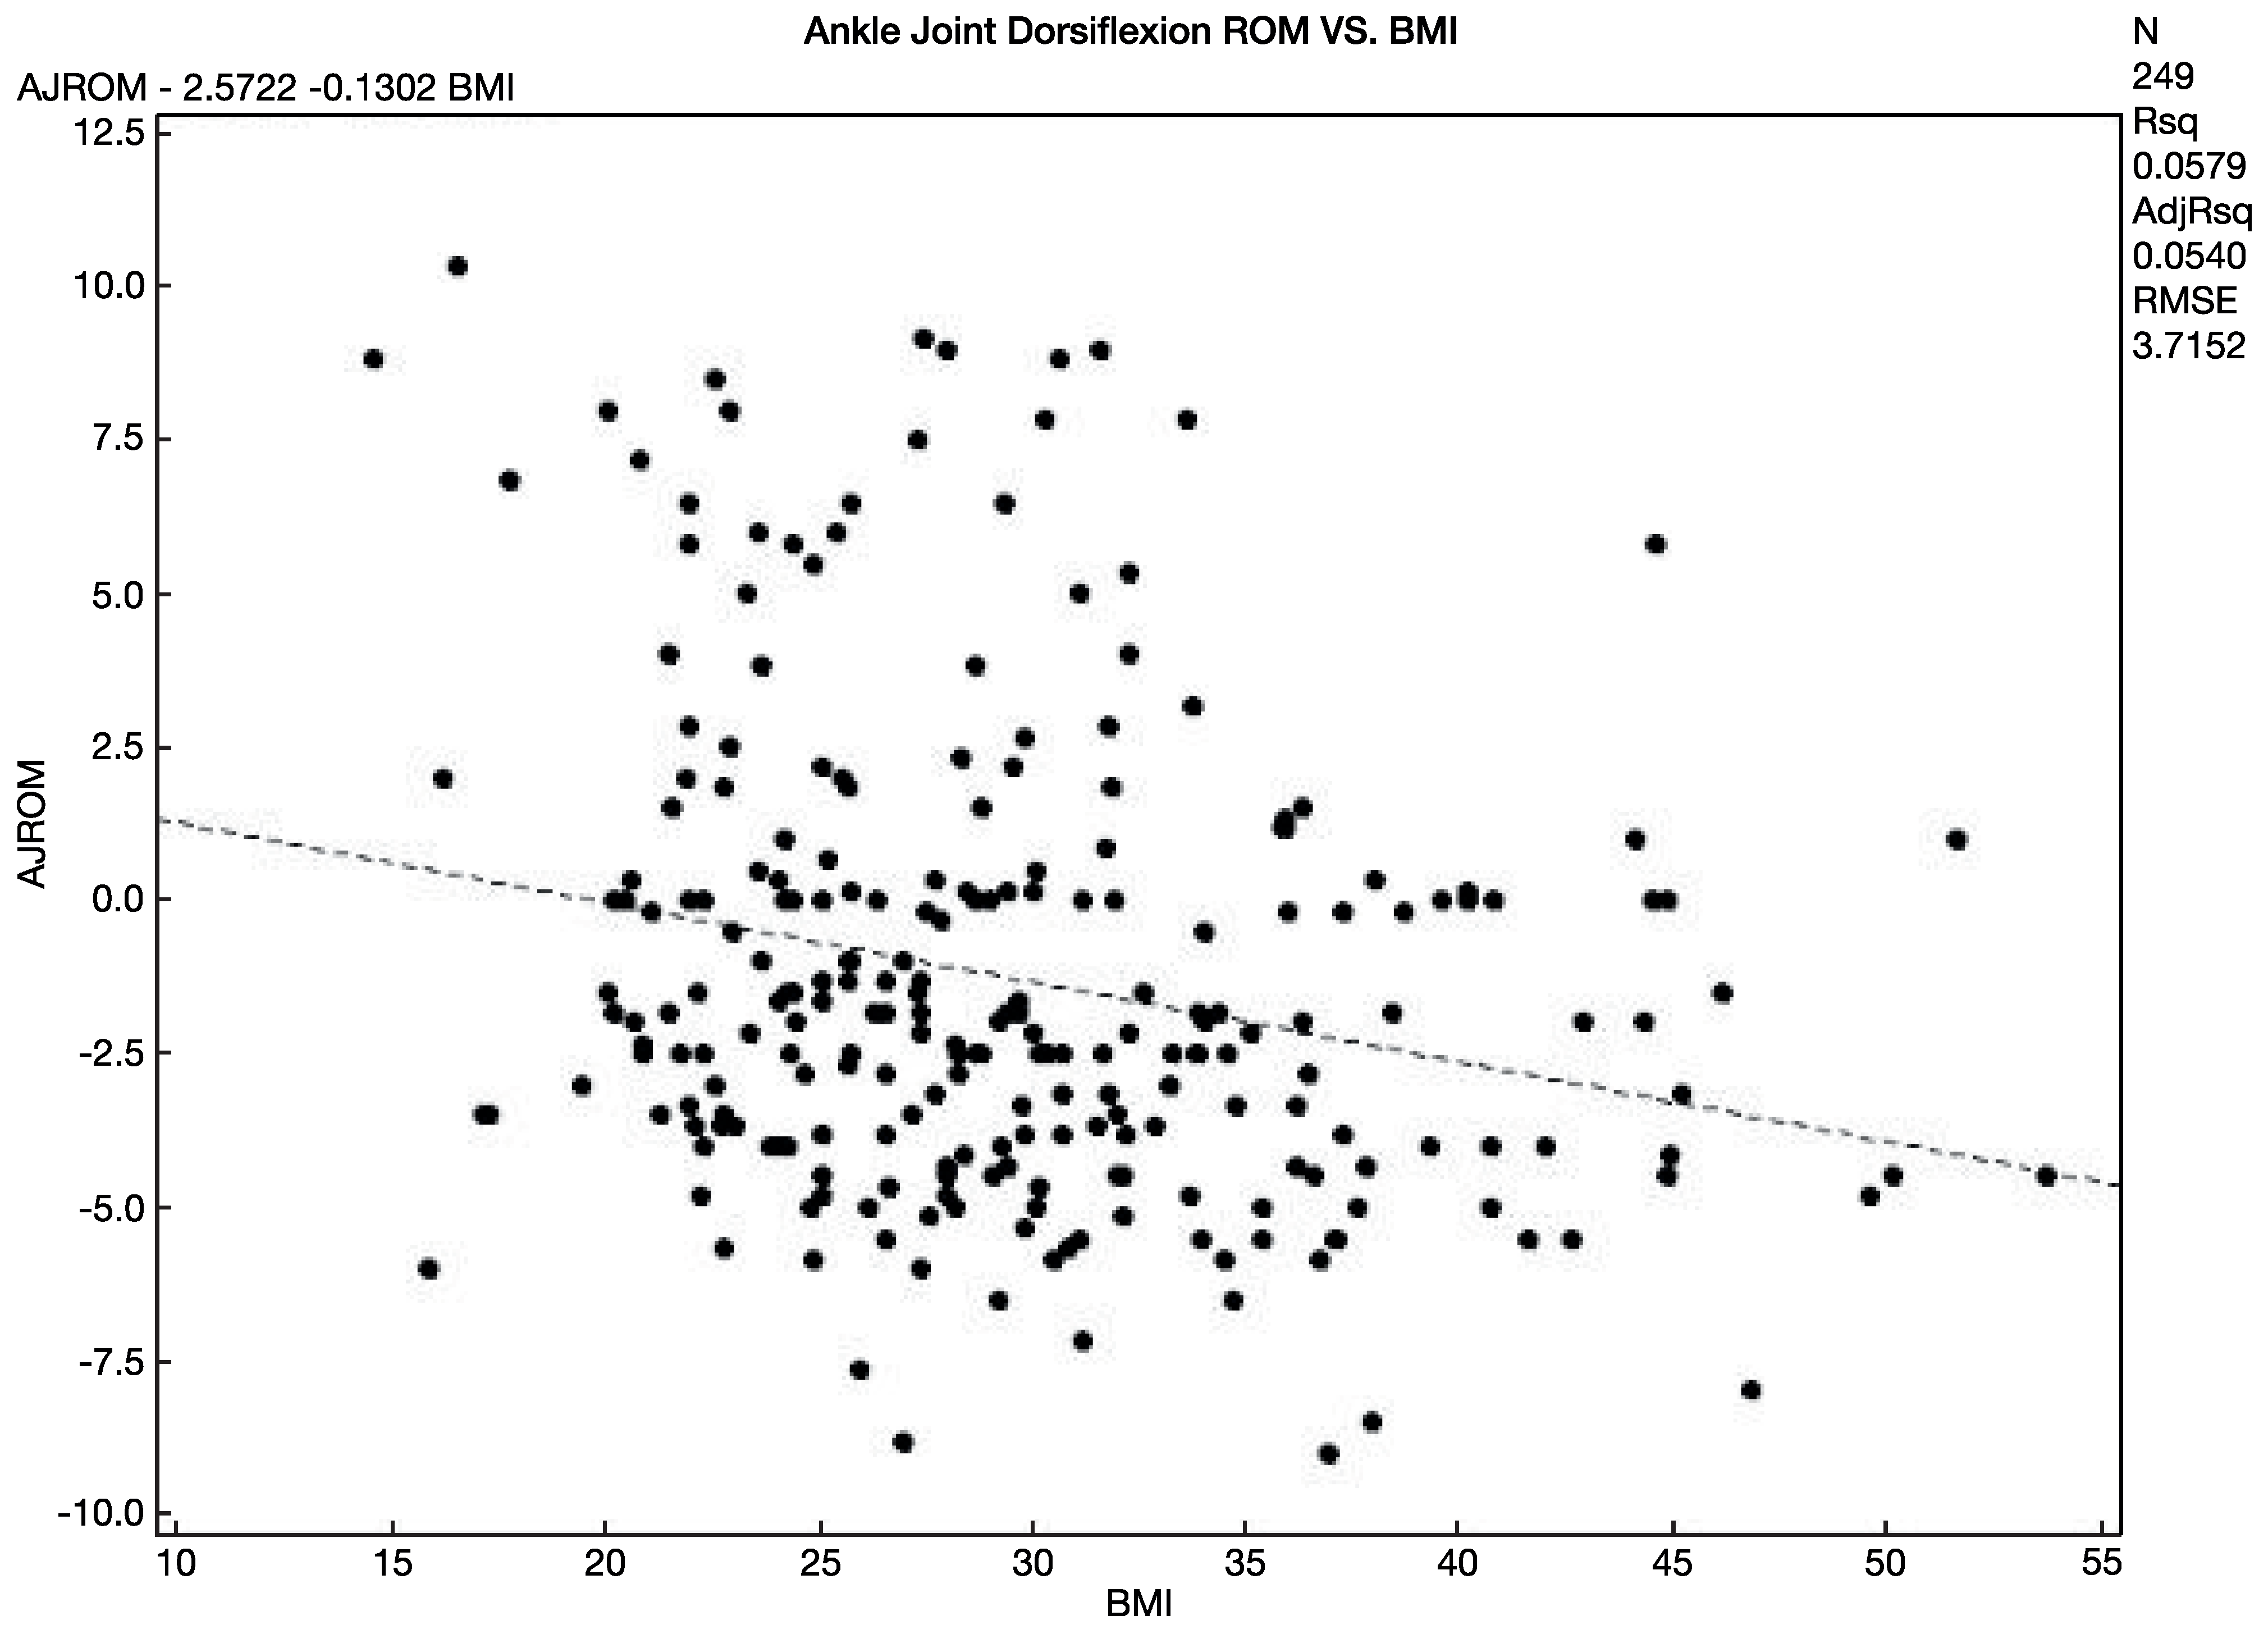
There was a very weak negative association (r = – 0.171; P = .0067) found between age and ankle joint dorsiflexion range of motion. There was a weak negative association (r = –0.240; P < .001) between body mass index (BMI) and ankle joint dorsiflexion range of motion (Figure 2). The BMI was associated with both equinus (odds ratio [OR], 1.053 [95% confidence interval (CI), 1.007–1.100]; P=.0233) and severe equinus (OR, 1.057 [95% CI, 1.007–1.109]; P= .0238) in the univariate analysis.
Figure 2.
Association between body mass index (BMI) and ankle joint dorsiflexion range of motion (AJROM).
A BMI greater than 30 was a significant risk factor for severe ankle equinus (OR, 2.672 [95% CI, 1.269–5.627]; P = .0097). Also, men demonstrated greater amounts of ankle equinus compared with women (mean ± SD, –1.887 ± 3.513 versus –0.883 ± 3.962, respectively; P = .0433). Patients with diabetes also demonstrated less ankle dorsiflexion range of motion compared with those without diabetes (mean ± SD, –0.924 ± 3.989 versus –2.584 ± 2.749 for nondiabetic and diabetic patients, respectively; P = .0051). Eighty-three percent of patients with diabetes (43 of 52) had equinus compared with 71% of patients without diabetes (140 of 197) (P = .091). This difference was not significant at the P < .05 level but was clearly trending toward significance. Furthermore, severe equinus seemed to be slightly more common in patients with diabetes than in those without diabetes (19.2% versus 12.1%; P = .188), but again this observation did not achieve statistical significance.
Greater amounts of ankle equinus were seen in patients presenting with overuse pathology (ie, plantar fasciitis, tendinitis, and symptomatic flatfoot) (mean ± SD, –0.894 ± 3.889 versus –2.600 ± 3.262 for nonoveruse versus overuse, respectively; P = .0033). Eighty-four percent of patients with pathologic overuse disorders (46 of 55) had equinus compared with only 71% of patients without overuse symptoms (137 of 194) (P = .0535). Severe equinus was also more common in patients with pathologic overuse disorders compared with those without (24% [13 of 55] versus 11% [21 of 194]; P=.0146; univariate OR, 2.550 [95% CI, 1.181–5.504]).
Finally, patients with plantar fasciitis, a pathologic overuse disorder, demonstrated greater amounts of ankle joint equinus (mean ± SD, –1.014 ± 3.968 versus –2.787 ± 2.290 for no plantar fasciitis versus plantar fasciitis, respectively; P = .0097). Eighty-six percent of patients with plantar fasciitis (31 of 36) had ankle equinus compared with only 71% of patients without plantar fasciitis (152 of 213) (P = .0637). Furthermore, severe equinus was not substantially more common in patients with plantar fasciitis compared with those without (19% [seven of 36] versus 13% [27 of 213]; P = .2740).
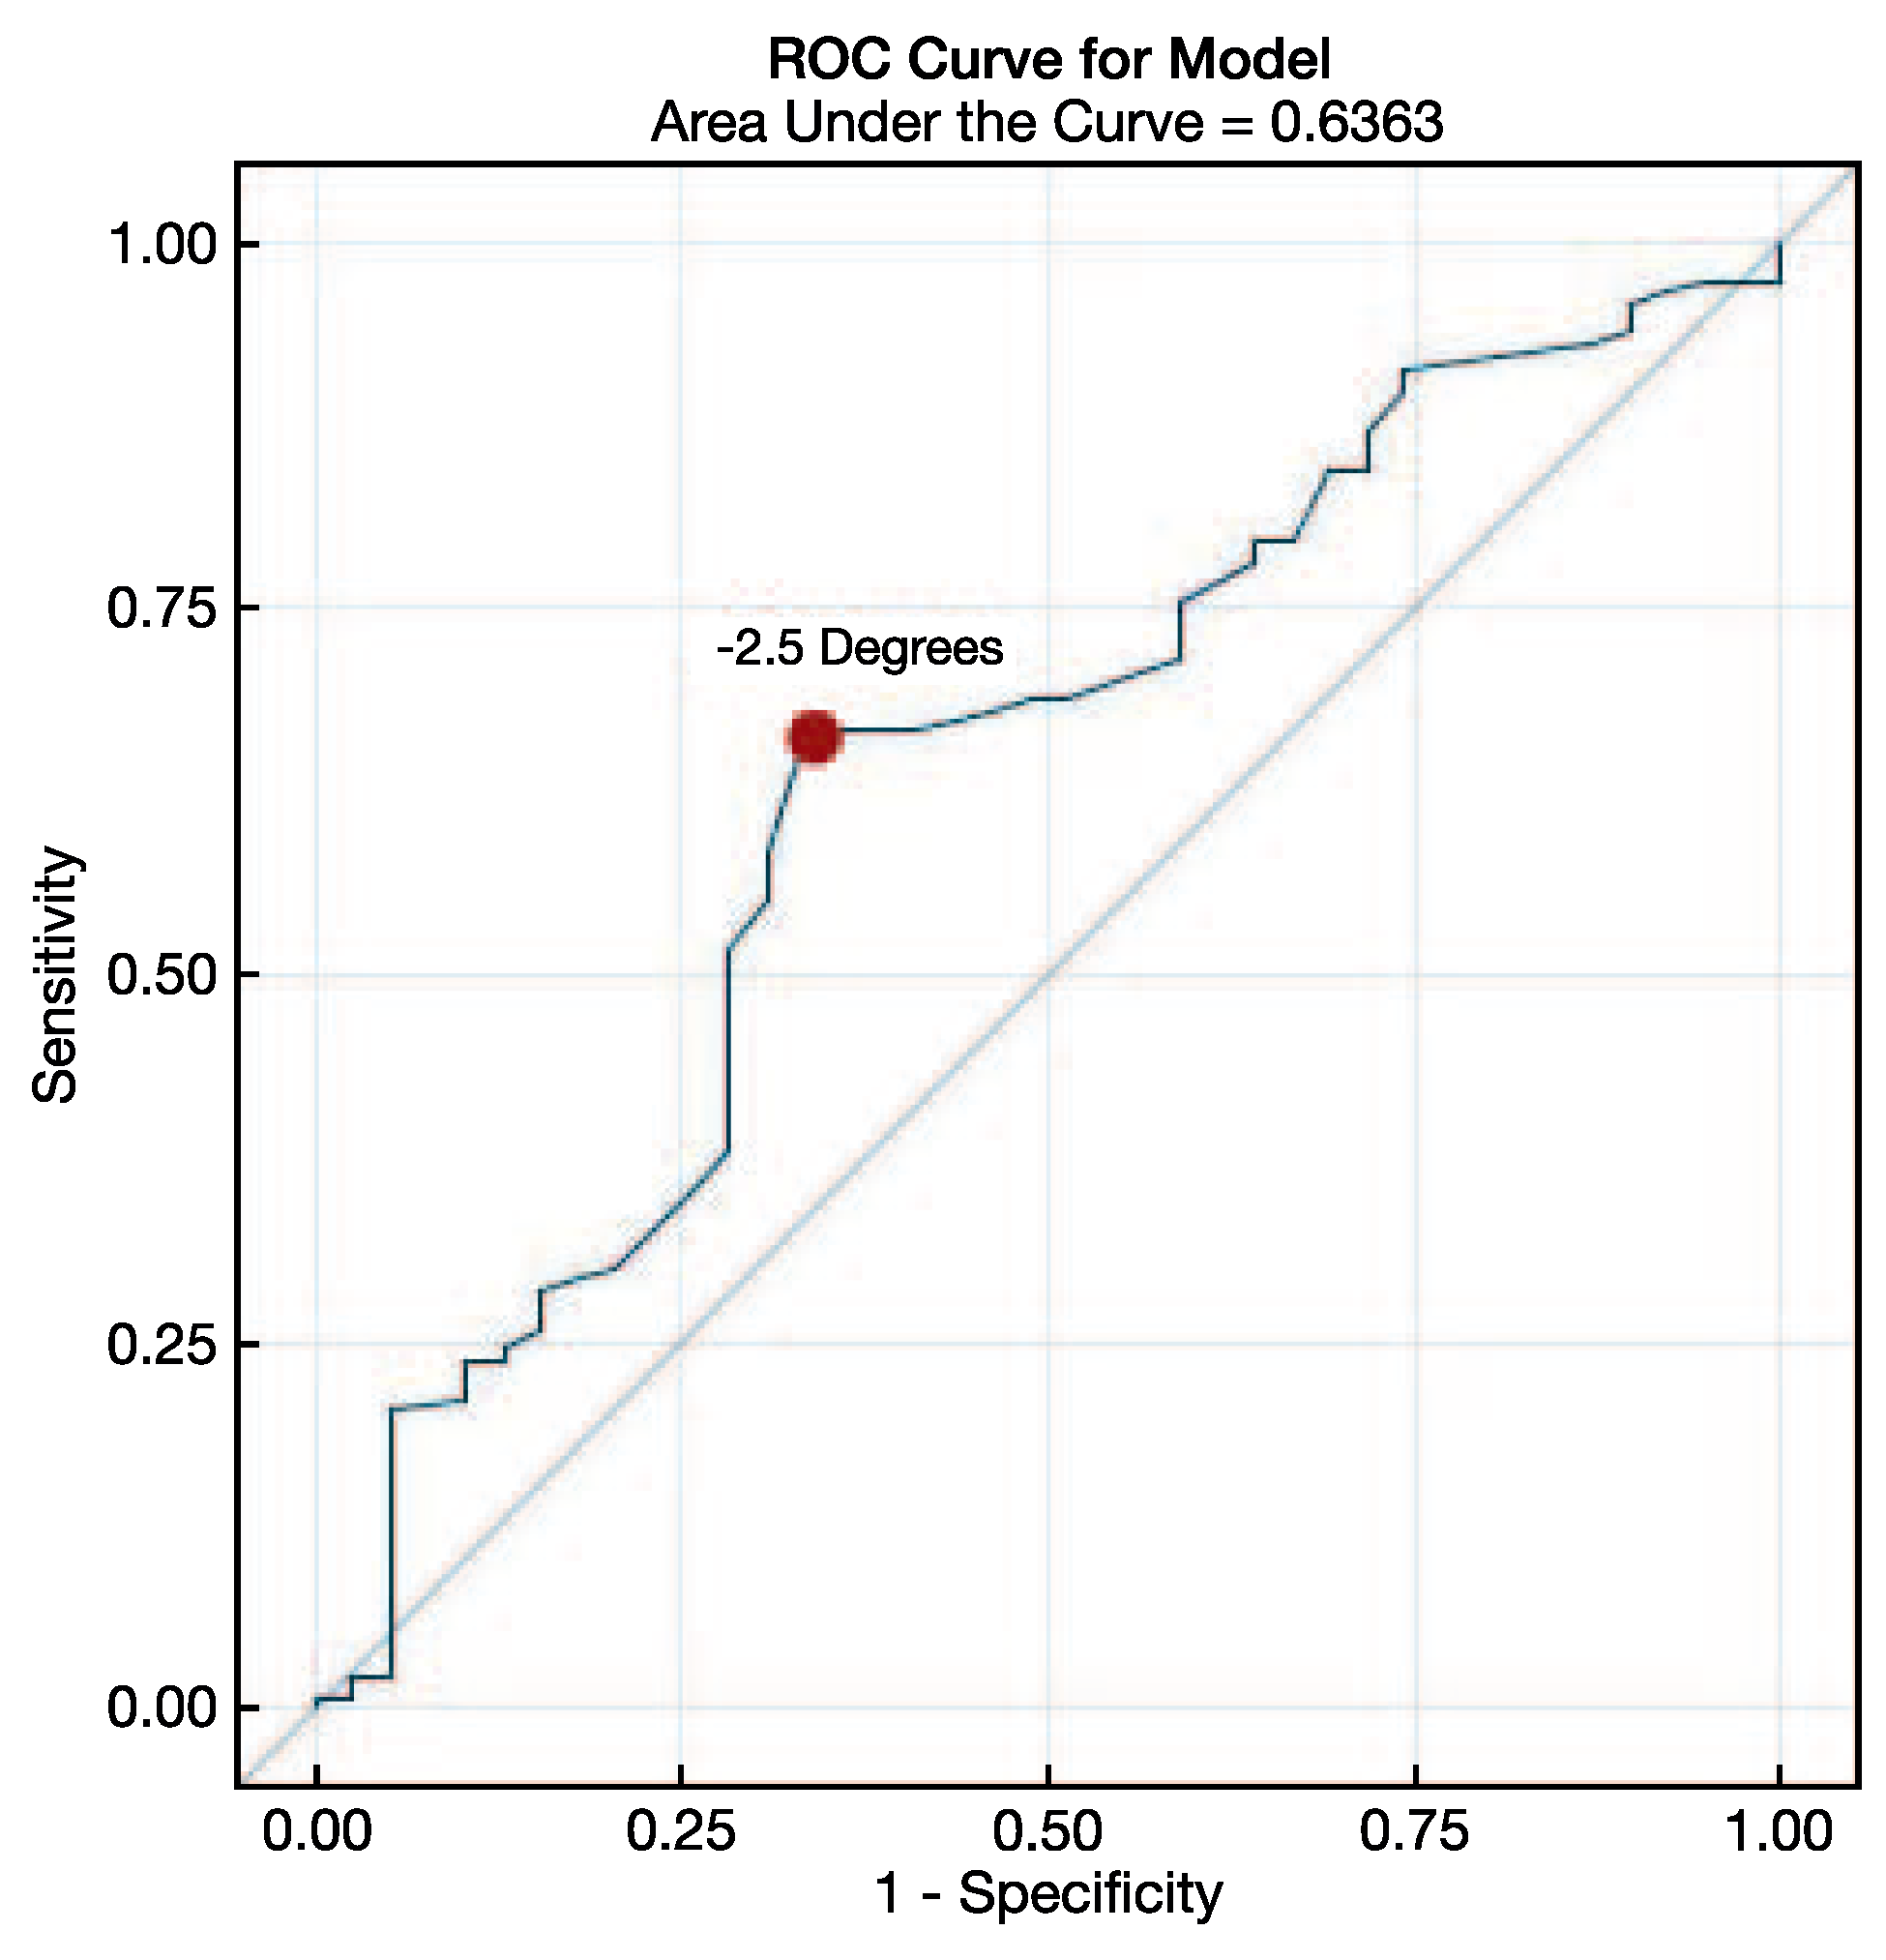
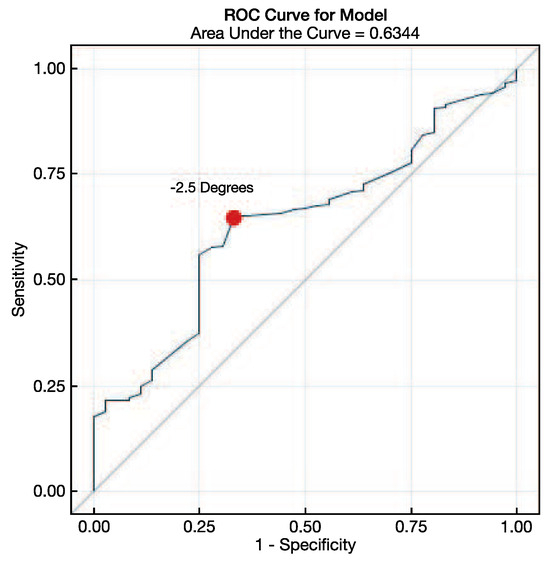
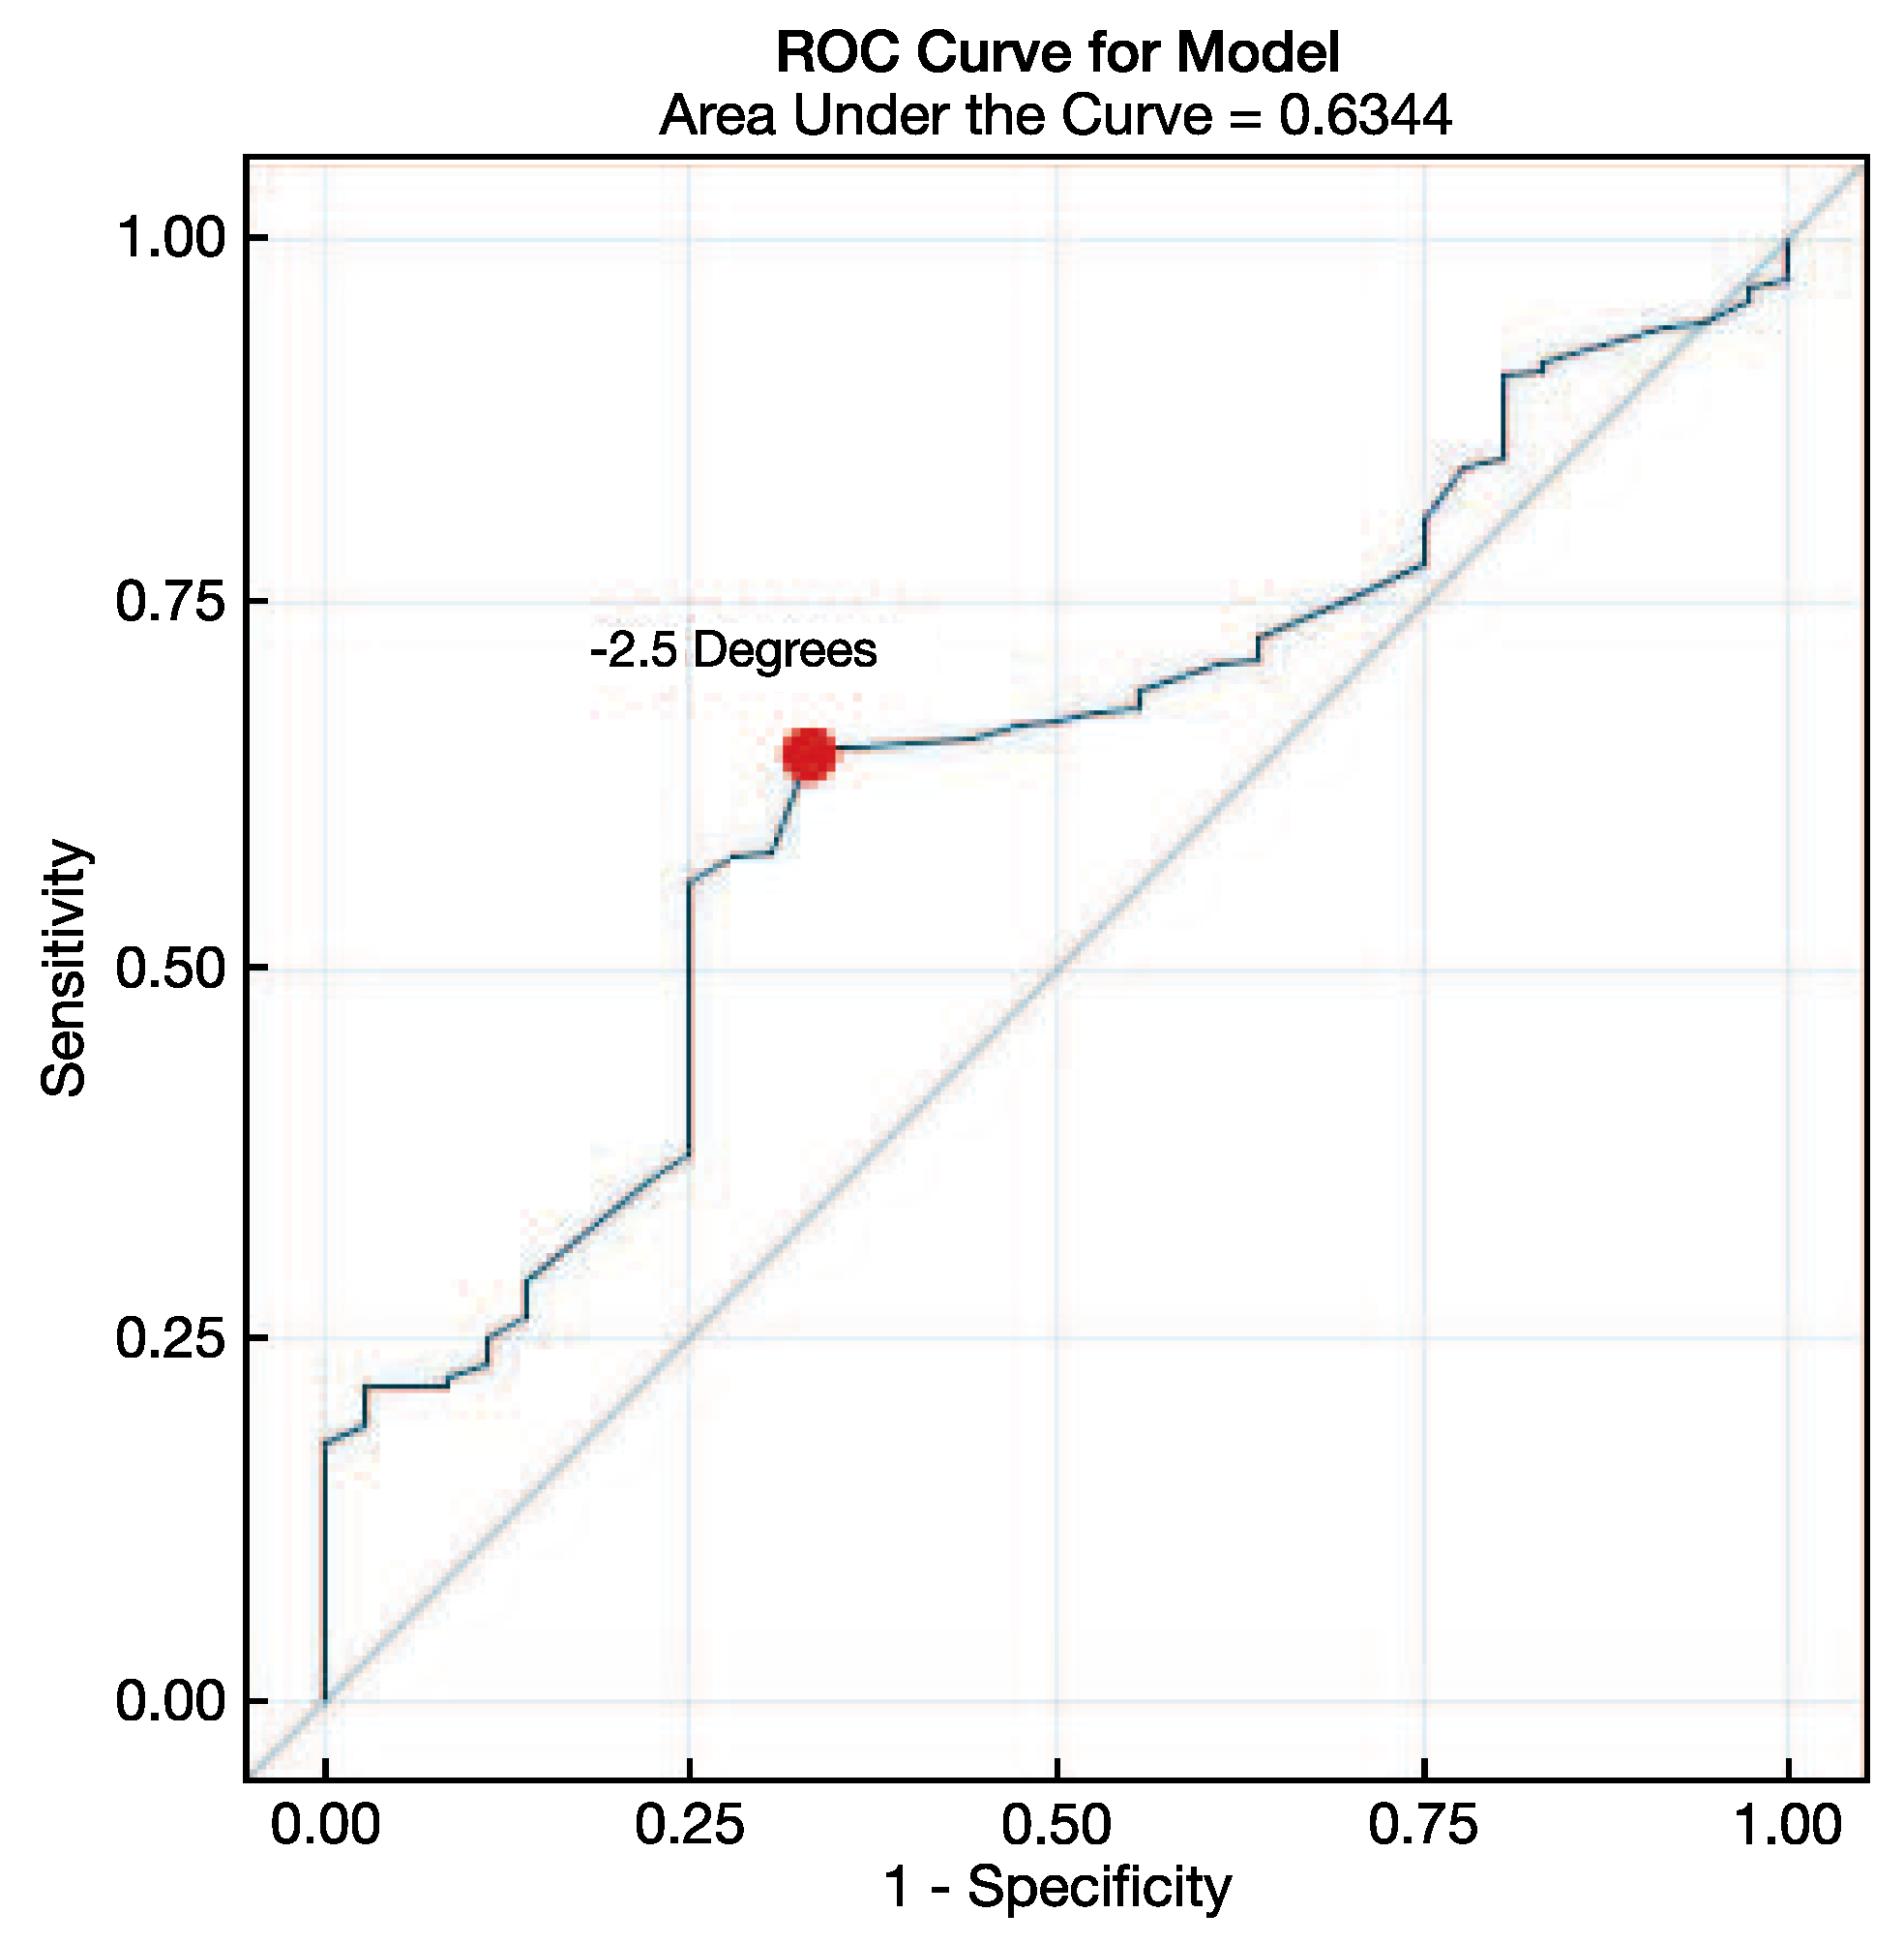
The receiver operating characteristic curve for ankle joint dorsiflexion range of motion and overuse symptoms is given in Figure 3 (area under the curve = 0.636; P= .0255). The cutoff point that maximized the sum of sensitivity and specificity was –2.58, which corresponded to an OR of 3.123 (95% CI, 1.659–5.879; P < .001). The receiver operating characteristic curve for ankle joint dorsiflexion range of motion and plantar fasciitis is provided in Figure 4 (area under the curve = 0.634; P = .011). The cutoff point that maximized the sum of sensitivity and specificity was –2.58, which corresponded to an OR of 5.444 (95% CI, 1.027–28.859; P=.046).
Figure 3.
Receiver operating characteristic curve for ankle joint dorsiflexion range of motion and overuse injuries. Area under the curve = 0.636.
Figure 4.
Receiver operating characteristic curve for ankle joint dorsiflexion range of motion and plantar fasciitis. Area under the curve = 0.634.
Multivariable Analysis
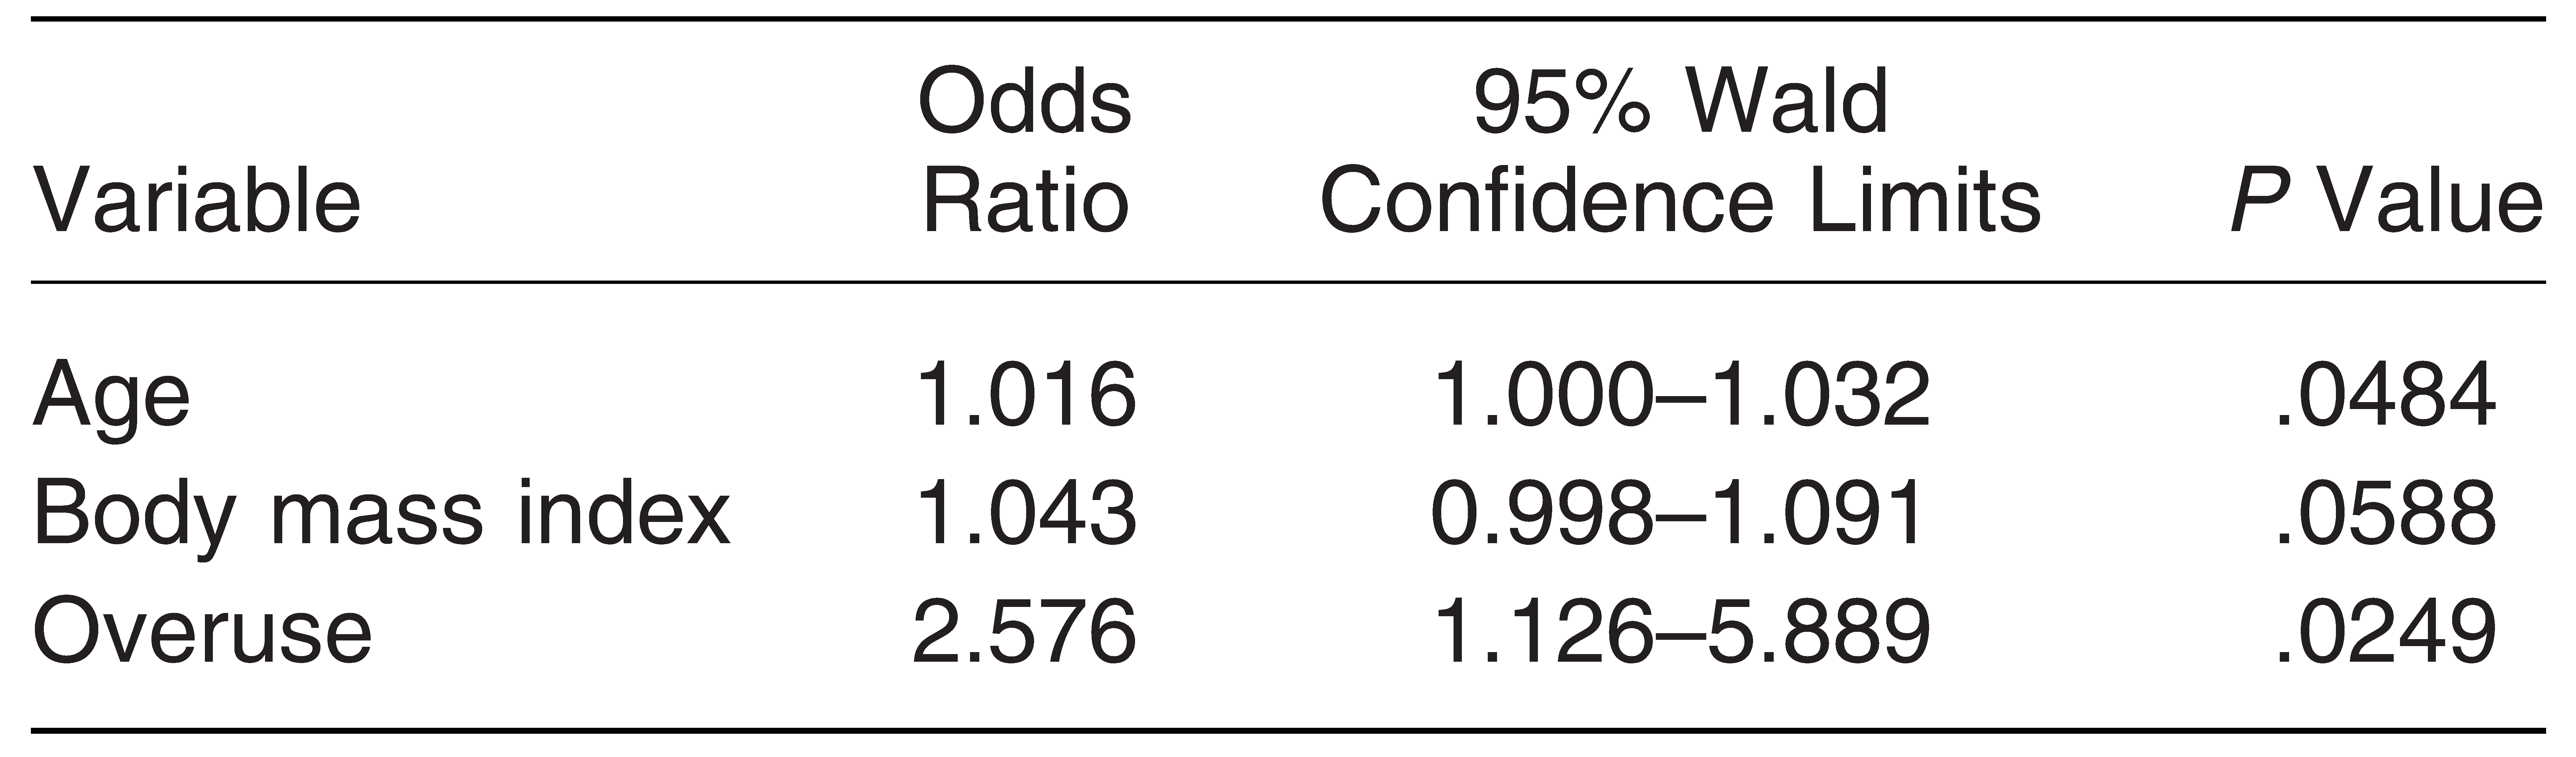
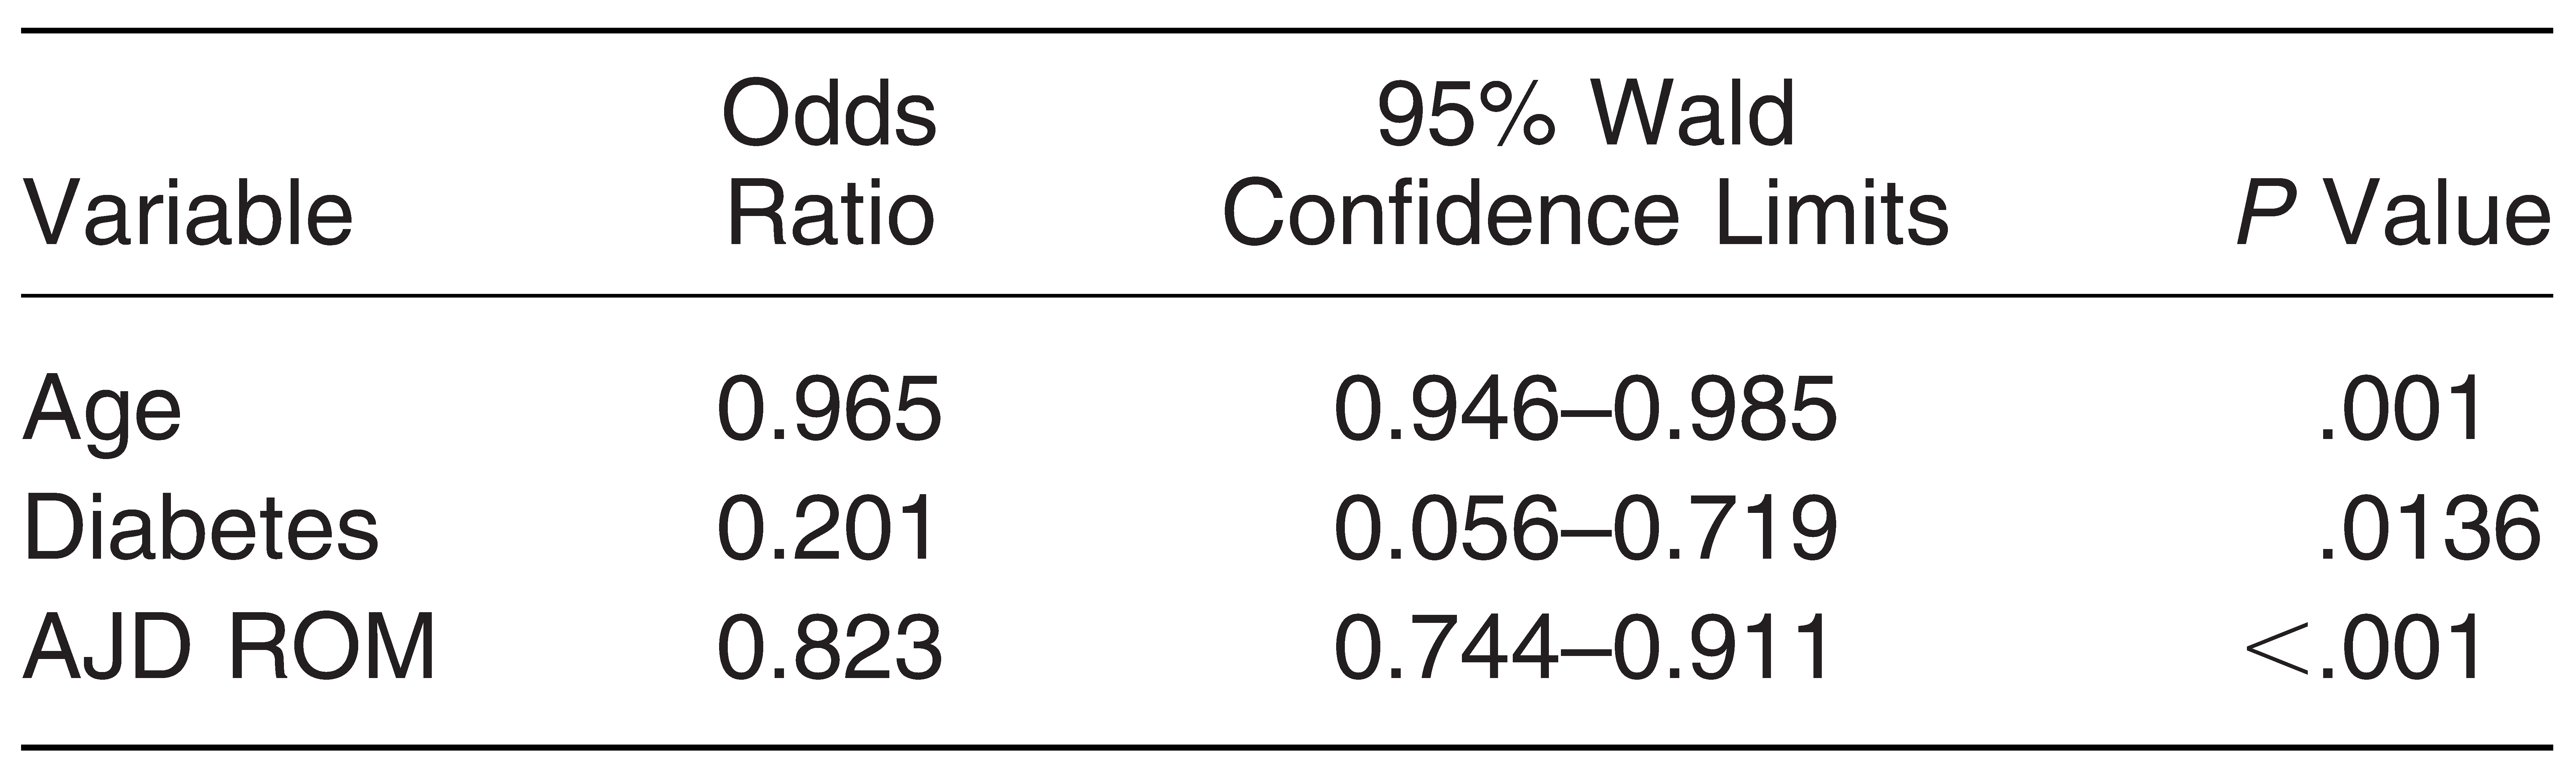
The variables entered into the multivariable regression analysis for predicting ankle joint dorsiflexion range of motion were BMI, age, sex, diabetes status, overuse injury, and plantar fasciitis. The final multivariate logistic regression models for predicting equinus, overuse injuries, and plantar fasciitis are provided in Table 2, Table 3 and Table 4.
Table 3.
Final Multivariable Logistic Regression Model for Predicting Ankle Equinus (N = 249, AUC = 0.630).
Table 4.
Final Multivariable Logistic Regression Model for Predicting Overuse Injury (N = 249, AUC = 0.759).
Discussion
The main goal of this study was to investigate and report on the prevalence of ankle equinus in a single foot and ankle specialty clinic population. We found that the prevalence of ankle equinus in this sample was much higher than that in previous reports using the same definition of ankle equinus. Frykberg et al,[20] for example, found that only 24.5% of 102 patients attending a veteran’s health administration foot clinic demonstrated equinus compared with 73% in the present sample. Similarly, Riddle et al[2] found only a 34% prevalence among patients with plantar fasciitis who were referred to their specialty physical therapy center. The increased prevalence that we observed may, at least partly, be explained by the different demographics and primary complaints seen in our clinic. But it is important to point out also that these previous studies actually examined populations that historically have a higher incidence of ankle equinus to begin with, namely, diabetic patients and those with plantar fasciitis. We also found that when ankle equinus was present on one side, it was typically (in fact, in all but three of the patients) found on the contralateral limb too, despite most patients presenting with unilateral symptoms. This finding suggests that ankle equinus is largely a symmetrical finding, and its deleterious effects on the contralateral limb may often be subclinical. This would support the use of stretching exercises and other methods for lengthening the Achilles in both the injured and noninjured limbs.
Measurement differences may also account for the discrepancies in prevalence seen across studies. Although the study investigated ankle equinus with the knee extended, others incorporated testing with the knee flexed. A study by Nakale et al,[4] for example, defined gastrocnemius muscle tightness as maximal ankle dorsiflexion that is less than 58 with the knee in full extension that corrects when the knee is flexed to 908. Furthermore, these authors defined gastrocnemius and soleus muscle tightness as less than 108 of maximal dorsiflexion regardless of knee position. In the population without foot and ankle pathology, isolated gastrocnemius muscle tightness has a reported incidence of 24% to 44%. Nakale et al[4] found that 45.3% of patients had a positive Silfverskiold test. In addition, and similar to the present study, they found that in the patients with a positive test for isolated gastrocnemius muscle tightness, the prevalence was similar in the left and right feet.[4]
Table 5.
Final Multivariable Logistic Regression Model for Predicting Plantar Fasciitis (N = 249, AUC = 0.748).
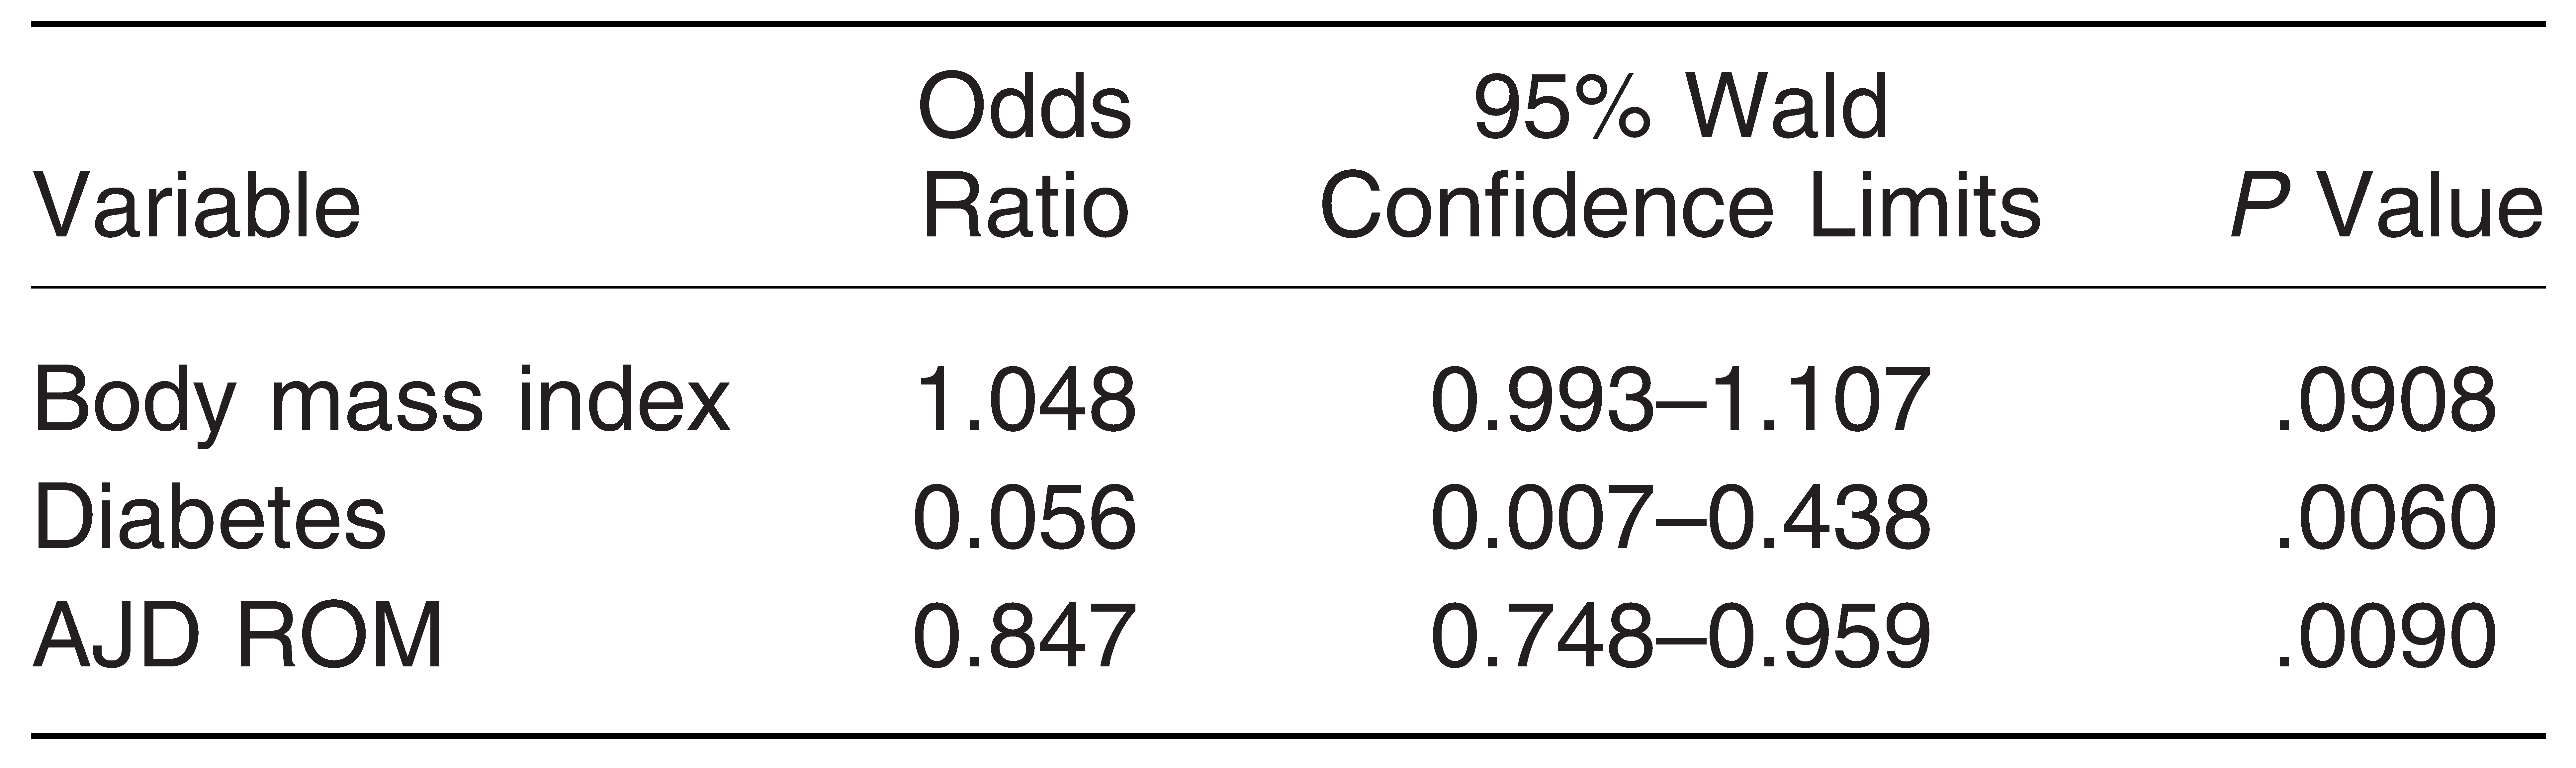
Similar to Frykberg and colleagues,[20] we found decreased ankle joint dorsiflexion range of motion in patients with diabetes attending the specialty clinic. Glycosylation and cross-linking in the Achilles tendon itself is the likely contributing factor here. Similarly, we found that BMI greater than 30 was associated with higher rates of ankle equinus in the sample. This makes sense intuitively because previous studies have noted that patients with greater amounts of obesity, estimated by BMI, also have increased joint stiffness.[24]
Another finding of the present study, consistent with previous literature, was that pathologic overuse disorders were accompanied by an increased prevalence of equinus. Studying runners, McNamee,[25] for example, found a strong link between equinus and plantar fasciitis. Riddle et al[2] found that as the range of ankle dorsiflexion decreased, the risk of plantar fasciitis increased in their patients. Patients with less than 08 of dorsiflexion had a 23.3 times greater risk of experiencing plantar fasciitis compared with an asymptomatic control group. In addition, the authors concluded that limited ankle dorsiflexion was the most important risk factor for plantar fasciitis due to compensatory pronation.[2] This compensatory pronation can dramatically impact risk of injury, as shown in the work of Becker et al,[3] who found that the injured participants demonstrated statistically significantly higher standing tibia varus angles, reduced static dorsiflexion range of motion, more rearfoot eversion at heel-off, and a longer duration of eversion. In addition, these authors found that for every 1% increase in the duration of eversion during the stance phase, the odds of being in the injured group increased by 1.08.[3]
Although there is mounting evidence that lengthening the Achilles tendon can be therapeutic for many pathologic overuse conditions, it is not clear what threshold actually poses the greatest risk for developing symptoms.[2,4,5,21,25,26] In the present work, –2.58 of ankle joint dorsiflexion seemed to be the threshold at which greatest risk was conferred for presenting with overuse symptoms (which included plantar fasciitis). So, this may be the number we should be shooting for to see a therapeutic effect and improvements in overuse symptoms. Further work will, of course, be needed to elaborate on this hypothesis.
The strengths of this work include a single rater from a single center using a validated instrument for ankle joint range-of-motion assessments and the study’s prospective cohort design. The limitations of this study include the potential for residual confounding because only select variables were obtained from the study participants. In addition, the data were obtained over 3 months, so a larger sample size would perhaps allow for a truer population representation.
Conclusions
The prevalence of ankle equinus in this sample was higher than previously reported (73% [183 of 249]), and nearly all of these patients had bilateral involvement. We also found that ankle equinus was more common in patients with diabetes, patients with higher BMIs, and patients with plantar fasciitis and other overuse symptoms. These data suggest that many people attending foot/ankle specialty clinics will have ankle equinus, and select groups are increasingly likely.
Financial Disclosure
None reported.
Conflicts of Interest
Dr. DeHeer is the designer of The Equinus Brace (IQ Med LLC) device. This device was not used in this study but is used to treat the pathologic disorder that is the focus of this study.
References
- RONG, K; GE, W; LI, X; ET, AL. Mid-term results of intramuscular lengthening of gastrocnemius and/or soleus to correct equinus deformity in flatfoot. Foot Ankle Int 2015, 36, 1223. [Google Scholar] [CrossRef] [Scilit] [PubMed]
- RIDDLE, DL; PULISIC, M; PIDCOE, P; et al. Risk factors for plantar fasciitis: a matched case-control study [thesis]. J Bone Joint Surg Am 2003, 85, 872. [Google Scholar] [CrossRef] [Scilit] [PubMed]
- BECKER, J; JAMES, S; WAYNER, R; et al. Biomechanical factors associated with Achilles tendinopathy and medial tibial stress syndrome in runners. Am J Sports Med 2017, 45, 2614. [Google Scholar] [CrossRef] [Scilit] [PubMed]
- NAKALE, NT; STRYDOM, A; SARAGAS, NP. ET AL: Association between plantar fasciitis and isolated gastrocnemius tightness. Foot Ankle Int 2018, 39, 271. [Google Scholar] [CrossRef] [Scilit]
- SEARLE, A; SPINK, MJ; CHUTER, VH. Association between ankle equinus and plantar pressures in people with diabetes: a systematic review and meta-analysis. Clin Biomech 2017, 43, 8. [Google Scholar] [CrossRef] [Scilit]
- GATT A, CHOCKALINGAM N: Clinical assessment of ankle joint dorsiflexion: a review of measurement techniques. JAPMA 2011, 101, 59. [CrossRef] [Scilit]
- LINDSJO, U; DANCKWARDT-LILLIESTROM, G. SAHLSTEDT B: Measurement of the motion range in the loaded ankle. Clin Orthop Relat Res 1985, 199, 68. [Google Scholar] [CrossRef] [Scilit]
- DALMAU-PASTOR, M; FARGUES-POLO, B, JR.; CASANOVA-MARTI´NEZ D, JR. ET AL: Anatomy of the triceps surae: a pictorial essay. Foot Ankle Clin 2014, 19, 603. [Google Scholar] [CrossRef] [Scilit]
- DIGIOVANNI, CW; KUO, R; TEJWANI, N. ET AL: Isolated gastrocnemius tightness. J Bone Joint Surg Am 2002, 84, 962. [Google Scholar] [CrossRef] [Scilit]
- LICHTWARK, GA; WILSON, AM. Is Achilles tendon compliance optimised for maximum muscle efficiency during locomotion? J Biomech 2007, 40, 1768. [Google Scholar] [CrossRef] [Scilit]
- HOF, AL; VAN ZANDWIJK, JP; BOBBERT, MF. Mechanics of human triceps surae muscle in walking, running and jumping. Acta Physiol Scand 2002, 174, 17. [Google Scholar] [CrossRef] [Scilit]
- CHEN, IH; KUO, KN; ANDRIACCHI, TP. The influence of walking speed on mechanical joint power during gait. Gait Posture 1997, 6, 171. [Google Scholar] [CrossRef] [Scilit]
- TEIXEIRA-SALMELA, LF; NADEAU, S; MILOT, MH. ET AL: Effects of cadence on energy generation and absorption at lower extremity joints during gait. Clin Biomech 2008, 23, 769. [Google Scholar] [CrossRef] [Scilit]
- GRAF, A; JUDGE, J; OUNPUU, S; ET, AL. The effect of walking speed on lower-extremity joint powers among elderly adults who exhibit low physical performance. Arch Phys Med Rehabil 2005, 86, 2177. [Google Scholar] [CrossRef] [Scilit]
- YOU, JY; LEE, HM; LUO, HJ. ET AL: Gastrocnemius tightness on joint angle and work of lower extremity during gait. Clin Biomech 2009, 24, 744. [Google Scholar] [CrossRef] [Scilit]
- ORENDURFF, MS; SEGAL, AD; AIONA, MD. ET AL: Triceps surae force, length and velocity during walking. Gait Posture 2005, 21, 157. [Google Scholar] [CrossRef] [Scilit]
- MOSELEY, AM; CROSBIE, J. ADAMS R: High and low ankle flexibility and motor task performance. Gait Posture 2003, 18, 73. [Google Scholar] [CrossRef] [Scilit]
- BADDAR, A; GRANATA, K; DAMIANO, DL; et al. Ankle and knee coupling in patients with spastic diplegia: effects of gastrocnemius-soleus lengthening. Bone Joint Surg Am 2002, 84, 736. [Google Scholar] [CrossRef] [Scilit] [PubMed]
- MATJACIC, Z; OLENSEK, A; BAJD, T. Biomechanical characterization and clinical implications of artificially induced toe-walking: differences between pure soleus, pure gastrocnemius and combination of soleus and gastrocnemius contractures. J Biomech 2006, 39, 255. [Google Scholar] [CrossRef] [Scilit]
- ROOT, ML; ORION, WP; WEED, JH. Normal and Abnormal Function of the Foot; Clinical Biomechanics Corp: Los Angeles, 1977. [Google Scholar]
- LAVERY, LA; ARMSTRONG, DG; BOULTON, AJM. Diabetex Research Group: Ankle equinus deformity and its relationship to high plantar pressure in a large population with diabetes mellitus. JAPMA 2002, 92, 479. [Google Scholar] [CrossRef] [Scilit] [PubMed]
- FRYKBERG, RG; BOWEN, J; HALL, J. ET AL: Prevalence of equinus in diabetic versus nondiabetic patients. JAPMA 2012, 102, 84. [Google Scholar] [CrossRef] [Scilit] [PubMed]
- WROBEL, JS; FLEISCHER, AE; MATZKIN-BRIDGER, J; et al. Physical examination variables predict response to conservative treatment of nonchronic plantar fasciitis: secondary analysis of a randomized, placebo-controlled footwear study. PM R 2016, 8, 436. [Google Scholar] [CrossRef] [Scilit] [PubMed]
- EDWARDS WT: Effect of joint stiffness on standing stability. Gait Posture 2007, 25, 432. [CrossRef] [Scilit]
- MCNAMEE MJ: Analysis of plantar fasciitis risk factors among intercollegiate and recreational runners: a matched case-control study. Texas State University, 2016.
- HUERTA, JP. The effects of the gastrocnemius on the plantar fascia. Foot Ankle Clin 2014, 19, 701. [Google Scholar] [CrossRef] [Scilit] [PubMed]

© 2021 American Podiatric Medical Association