


Abstract
Background: Ankle dorsiflexion motion and plantarflexor stiffness measurement offer clinical insight into the assessment and treatment of musculoskeletal and neurologic disorders. We aimed to determine reliability and concurrent validity of an ankle arthrometer in quantifying dorsiflexion motion and plantarflexor stiffness. Methods: Ten healthy individuals were assessed for dorsiflexion motion and plantarflexor stiffness using an ankle arthrometer with a 6 degree-of-freedom kinematic linkage system and external strain gauge to apply dorsiflexion torque. Two investigators each performed five loads to the ankle at different combinations of loads (10 or 20 Nm), rates (2.5 or 5 Nm/sec), and knee angles (10° or 20°). Anteroposterior displacement and inversion-eversion rotation were also assessed with arthrometry, and functional dorsiflexion motion was assessed with the weightbearing lunge (WBL) test. Results: Good-to-excellent intrarater reliability was observed for peak dorsiflexion (intraclass correlation coefficient [ICC][2,k] = 0.949–0.988) and plantarflexor stiffness (ICC[2,k] = 0.761–0.984). Interrater reliability was good to excellent for peak dorsiflexion (ICC[2,1] = 0.766–0.910) and poor to excellent for plantarflexor stiffness (ICC[2,1] = 0.275–0.914). Reliability was best for 20-Nm loads at 5 Nm/sec. Strong correlations were observed between peak dorsiflexion and anteroposterior displacement (r = 0.666; P = 0.035) and WBL distance (r = -0.681; P = 0.036). Conclusions: Using an ankle arthrometer to assess peak dorsiflexion and plantarflexor stiffness seems reliable when performed to greater torques with faster speeds; and offers consistency with functional measures. Use of this readily available tool may benefit clinicians attempting to quantify equinus and dorsiflexion deficits in pathological populations.
Dorsiflexion is a critical motion at the ankle required for nearly all functional movements in athletic and general populations. The lack of dorsiflexion, sometimes referred to as equinus, is associated with multiple pathologic disorders of the foot, including nerve entrapment, plantar fasciitis, and ankle sprains [1,2,3,4]. After ankle injuries, restoring full sagittal plane range of motion is often a priority for clinicians, with restrictions in this plane often associated with negative outcomes [5,6]. The motion in this plane is affected by multiple factors, including adhesions in the ankle joint capsule and stiffness of the triceps surae muscle group [1,7]. The ability to accurately and reliably quantify the amount of dorsiflexion motion and associated plantarflexor stiffness at the ankle would be an important tool for both the clinician attempting to address functional deficits and the researcher attempting to better understand the pathoetiology of ankle injuries [1,8]. Ankle arthrometers and other joint measurement devices have functioned toward this goal in a way but often lack clinically relevant or reliable methods for measuring the functional sagittal plane motion of the ankle [8,9].
Current techniques for quantifying sagittal plane ankle stiffness can be stratified into clinically oriented and laboratory techniques, in which there is a trade-off between convenience and precision of measurement [10]. For example, among the clinically oriented techniques are goniometry and the weightbearing lunge (WBL) test, with each providing a gross measurement of dorsiflexion motion without isolating the contributing components to that peak excursion (ie, musculotendinous and capsular stiffness) [11,12]. Alternately, laboratory techniques are able to provide quantification of joint stiffness using complex devices and mathematical derivations. For example, oscillometry quantifies the dampening characteristics of the musculotendinous unit, thereby allowing for the indirect calculation of a stiffness coefficient [13]. Three-dimensional motion analysis can also be used to compute joint forces via inverse dynamics, and, with excursion of the joint during functional activities, can be used to derive the joint stiffness during a functional task [14]. Although accurate, these techniques are not convenient for the practicing clinician.
Customized devices have been previously used to quantify ankle joint excursion and joint stiffness. These devices typically secure the foot, ankle, and lower leg while a motor or handheld force is used to apply a load to the ankle joint [8]. Resultantly, stiffness is quantified by measuring the torque required to move the ankle a certain excursion. Devices that use motors to apply a joint load offer high degrees of reliability and experimental control but, similar to laboratory-oriented measures, require equipment not available to clinicians [15]. Alternately, some handheld devices have the capability of being used in a clinical setting, but these devices are often custom-made and not readily accessible [16,17,18,19,20].
The ankle arthrometer is a popular device used to quantify ankle joint laxity and capsuloligamentous stiffness; however, measurements are often performed for anterior translations or frontal plane rotations given the load cell capabilities of the arthrometer [9,21]. However, an external strain gauge mounted to the handle with the ability to apply a sagittal plane rotational force could use the arthrometer's 6 degree-of-freedom linkage system to quantify dorsiflexion motion and subsequent ankle joint stiffness. However, before implementation of such a device, its reliability and relation to current measures of ankle joint stiffness must be established. It was, therefore, the purpose of this study to determine the reliability of a dorsiflexion strain gauge mounted to the ankle arthrometer to quantify dorsiflexion excursion and plantarflexor stiffness in a healthy population across a range of loading conditions. In addition, we aimed to establish a degree of concurrent validity by exploring correlations between these measures and traditional measures of ankle joint laxity and stiffness.
Methods
Participants
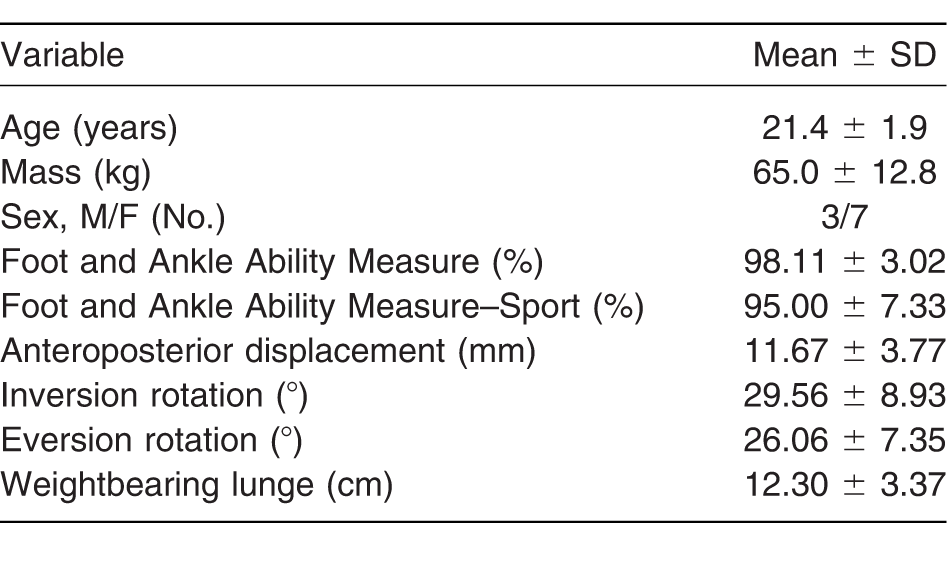
Ten healthy participants with no history of recent (within 6 months) lower-extremity injury volunteered for this study. All of the participants provided university-approved informed consent and completed screening questionnaires to determine eligibility, demographics, and ankle function (Foot and Ankle Ability Measure). Participants reported no history of ankle sprains, no lower-extremity injury in the 6 months before testing, and Foot and Ankle Ability Measure scores greater than 90% on the activities of daily living and sport subscales. Participant demographic characteristics are reported in Table 1.
Table 1.
Participant Demographics, Including Arthrometer Measurement Values and Performance on the Weightbearing Lunge Test
Instrumentation
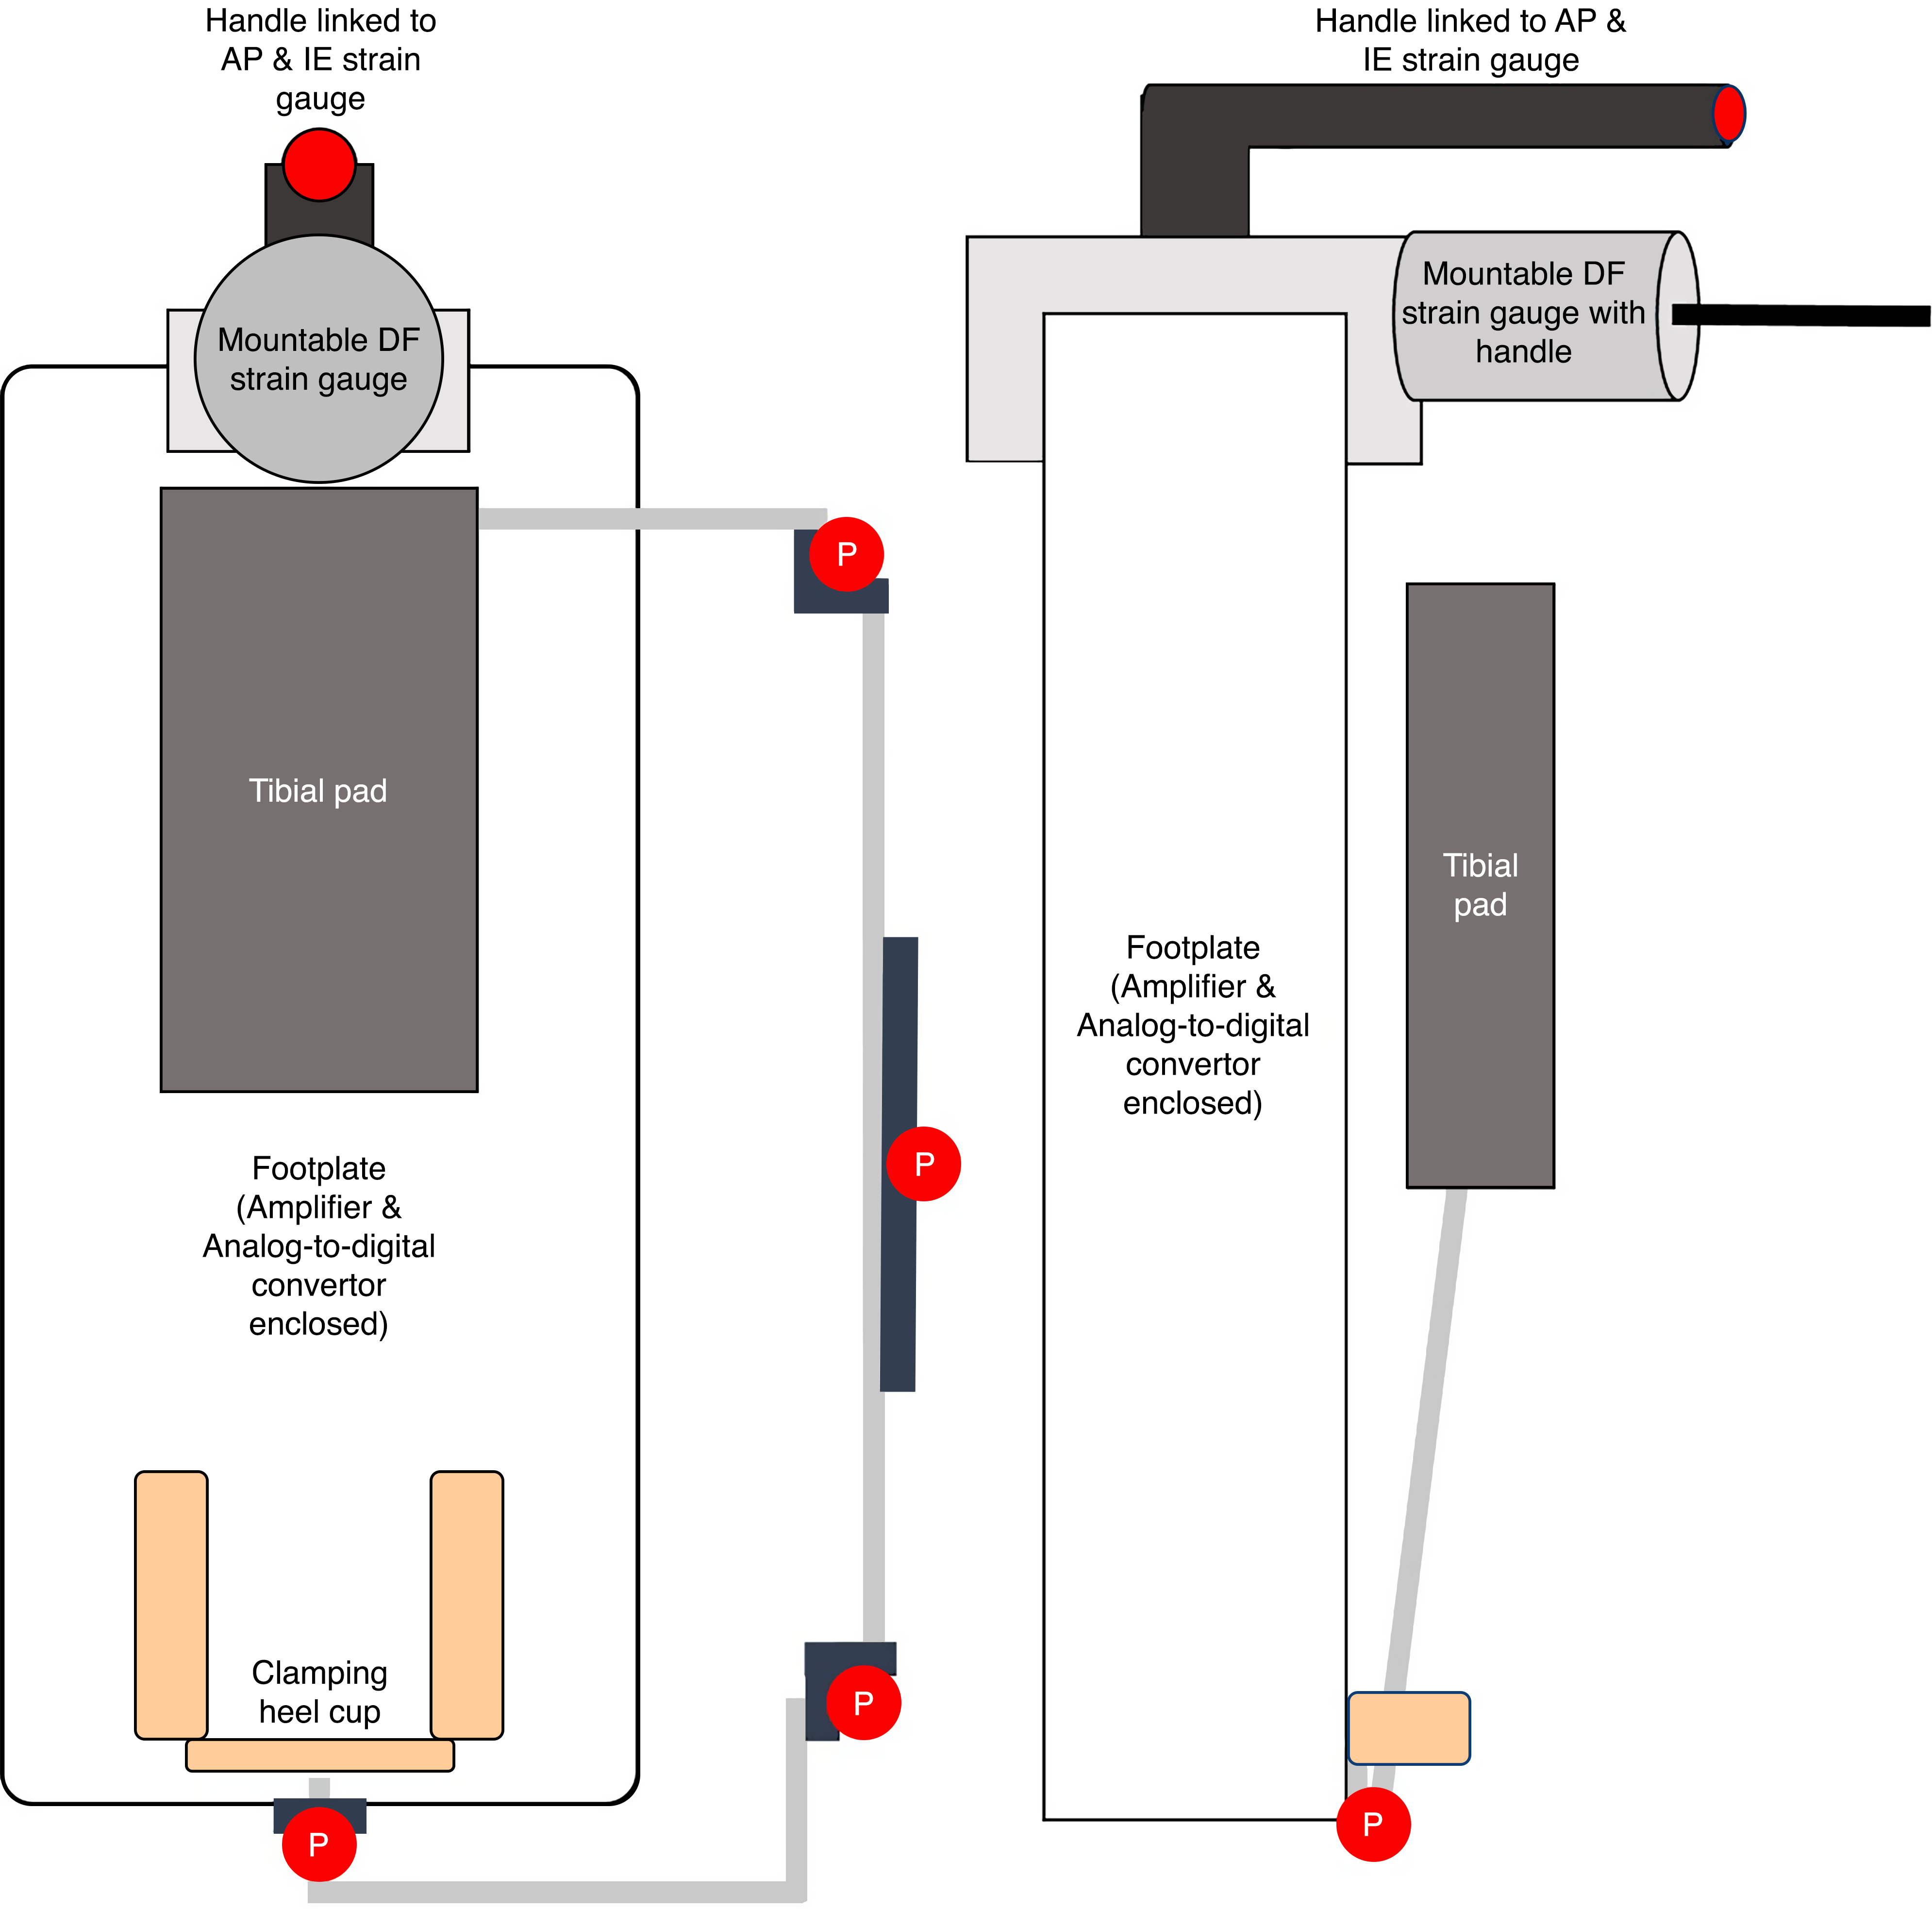
Ankle laxity and stiffness were assessed using an instrumented ankle arthrometer (Blue Bay Research, Milton, Florida). The arthrometer consists of a strain gauge mounted to a foot plate, and a tibial pad that is connected to the foot plate via a 6 degree-of-freedom kinematic linkage system. The arthrometer strain gauge is designed to measure linear forces in the sagittal plane (anteroposterior displacement) and rotational forces in the frontal plane (inversion-eversion rotation) [9,21]. An external adapter developed by the manufacturer was attached to the distal end of the arthrometer, containing a strain gauge (model LCL-40; Omega Engineering, Norwalk, Connecticut) attached to a cable and handle such that a rotation force could be applied in the sagittal plane, in the direction of dorsiflexion (Figs. 1 and 2). The external strain gauge was connected to the analog-to-digital converter located in the ankle arthrometer (model NI 6210; National Instruments, Austin Texas) such that dorsiflexion forces were synchronized with displacement and rotation from the kinematic linkage system.
Figure 1.
Experimental setup and positioning of the ankle arthrometer. The arthrometer was affixed to the foot as previously reported, with an additional strain gauge, connected to a cord and force application handle used to apply a dorsiflexion moment. A second investigator supported the weight of the arthrometer between trials.
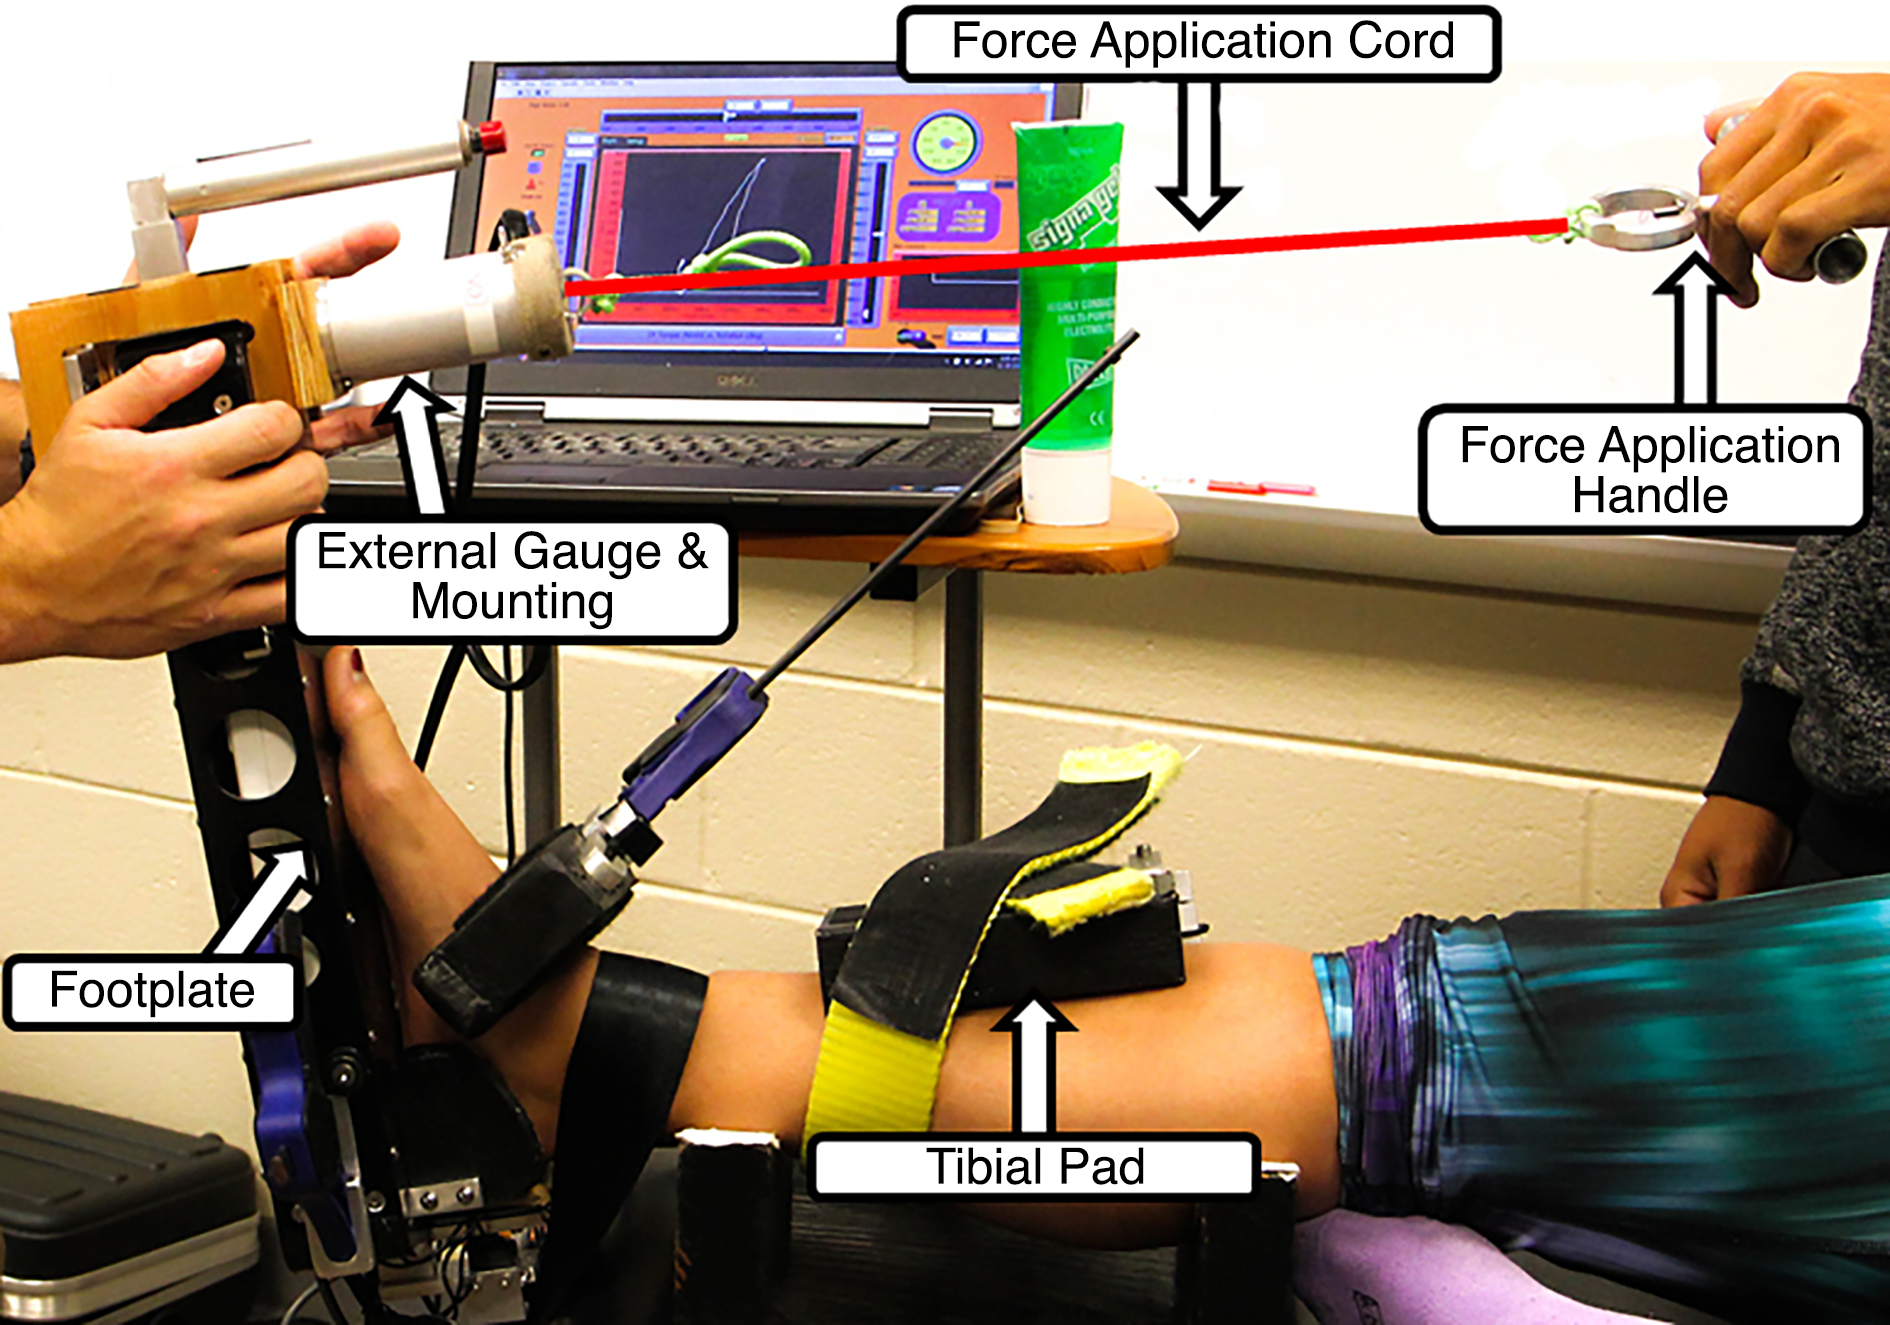
Figure 2.
Schematic representation of the ankle arthrometer with external strain gauge. The left image depicts the front view and the right image depicts the side view. The tibial pad represents a movable element, with potentiometers (P) positioned to track rotation and sliding of the arm connecting the tibial pad to the footplate. DF, dorsiflexion; IE, inversion-eversion.
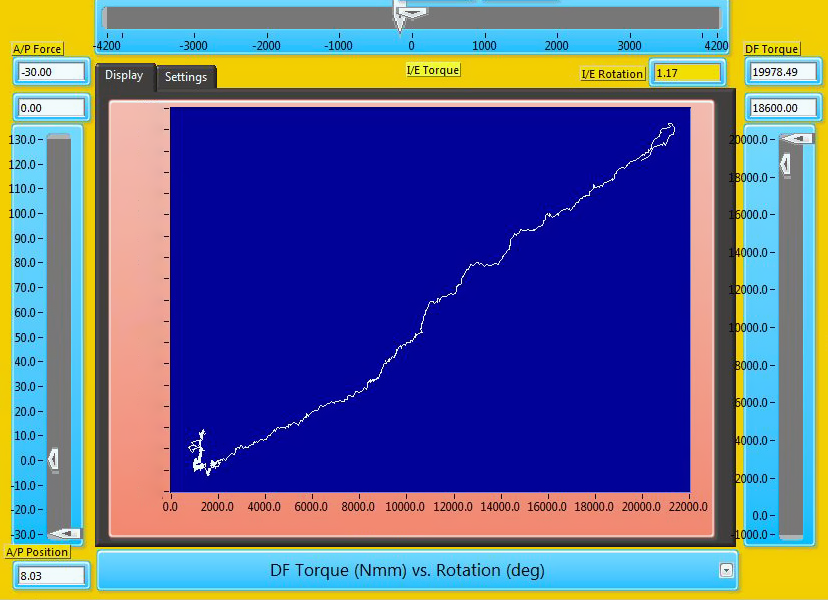
All of the data were collected in LabVIEW software (National Instruments) at 100 Hz. The program displayed a selectable stiffness curve for anteroposterior displacement, inversion-eversion rotation, and dorsiflexion rotation that displayed the force/torque applied on the Y-axis and displacement/rotation measured on the X-axis. In addition, sliders were placed along the graph that displayed the force applied and included a cursor set to custom parameters to provide augmented feedback on load and loading rate to the assessors.
Procedures
Participants reported for a single testing session. After providing informed consent and completing screening questionnaires, participants were asked to lay supine on a padded table with the foot barefoot. The test leg was randomly selected for each participant using a coin flip. The testing protocol consisted of two assessors (M.K.M., Z.J.F.) applying a load in the direction of ankle dorsiflexion under eight different conditions. Conditions varied the peak load (10 or 20 Nm), the loading rate (2.5 or 5 Nm/sec), and the knee joint angle (10° or 90°). Peak loads were based on those previously reported in research, and loading rate was determined during pilot testing as reasonable rates to maintain consistent loading [8,22]. Dorsiflexion was tested at 10° and 90° of knee flexion to test overall triceps surae stiffness (with the knee extended) and to prevent the gastrocnemius muscle from affecting joint stiffness (with the knee flexed) [22]. The order was randomized using cards in an envelope, with the exception that all measurements would be taken at one knee angle before repositioning the participant; however, whether 10° or 90° of knee flexion was performed first was also randomized. In addition, the order of assessors was randomized across participants.
After determining the order of testing, the assessor would position the participant appropriately, placing a calf pad under the leg if 10° was selected or positioning boxes under the calf to achieve 90° of knee flexion. The assessor would then secure a strap around the distal tibia to stabilize the lower leg while the arthrometer was applied by securing heel and dorsal clamps tightly and strapping the tibial pad to its proper location on the shin. For each of the eight conditions, each assessor performed five trials, bringing the ankle into dorsiflexion, beginning from a neutral ankle position (10° plantarflexed, confirmed using a digital inclinometer). After the first assessor completed the measurement for a condition, the arthrometer would be removed and reattached so that the second assessor could repeat the same condition.
To explore the relationships between plantarflexor stiffness as assessed with the arthrometer and other measures of ankle joint mechanics, ankle laxity was assessed using standard procedures with the Hollis ankle arthrometer. With the knee flexed 10°, the arthrometer was secured and five anteroposterior translations from –30 to 130 N were applied (50 N/sec), followed by five inversion-eversion (IE) rotations from –4.2 to 4.2 Nm (1 Nm/sec). In addition, functional dorsiflexion range of motion was assessed using the WBL test according to procedures described by Bennell et al [23].
Data Reduction and Analysis
All of the data were analyzed separately in LabVIEW software. All of the arthrometer data were low-pass filtered (10 Hz) and partitioned to capture the beginning and end of loading (Fig. 3). Each load displacement curve was assessed by a third investigator (A.R.N.), and trials that did not reach peak torque or visually achieve a consistent rate of loading (from overlaid plots of trials) were removed. From each trial, variables extracted included the peak dorsiflexion angle, defined as the maximal sagittal plane rotation value, and plantarflexor stiffness, defined as the linear slope of the load displacement curve from 1 Nm to peak torque. Slope was calculated by determining the change in load divided by the change in displacement between 1 Nm and peak torque. Similar procedures were followed for anteroposterior and IE rotations, where total anteroposterior displacement (maximum displacement subtracted by minimum displacement), peak inversion angle (maximal rotation frontal plane rotation angle), and peak eversion angle (minimum frontal plane rotation angle) were extracted for analysis [21,24]. For the WBL test, the peak distance from the wall was recorded as a measure of functional dorsiflexion range of motion [23].
Figure 3.
Screenshot from LabVIEW data collection software. The center display presents the torque-rotation curve for dorsiflexion (DF) rotation, with torque on the horizontal axis and rotation on the vertical axis. Slider scales on the left, top, and right represent a target cursor (narrow) moved by the software and a responsive movement cursor (wide) responsive to force provided by the assessor. The left scale is used for anteroposterior force application, the top scale is used for inversion-eversion (IE) rotation, and the right scale is used for DF rotation.
The primary aim of this study was to explore the reliability of an arthrometer for quantifying plantarflexor stiffness. This was confirmed using intraclass correlation coefficients (ICCs) to test intrarater and interrater reliability. Intrarater reliability was assessed for each of the eight conditions using model 2,k ICCs. Interrater reliability was assessed for the averages of each assessor for each of the eight conditions using model 2,1 ICCs. These were computed for peak dorsiflexion angle and plantarflexor stiffness. The ICCs were interpreted such that less than 0.5 indicated poor reliability, 0.5 to 0.75 indicated moderate reliability, greater than 0.75 to 0.9 indicated good reliability, and greater than 0.9 indicated excellent reliability [25]. A secondary aim of this investigation was to determine how other mechanical measures of ankle function relate to plantarflexor stiffness. To assess these relationships, Pearson product-moment correlation coefficients were used to explore the relationships between measures of plantarflexor stiffness and dorsiflexion range of motion and traditional measures of ankle laxity and motion (peak anteroposterior displacement, IE rotation, and associated stiffness). An a priori level of significance was set at α=.05.
Results
Interrater Reliability
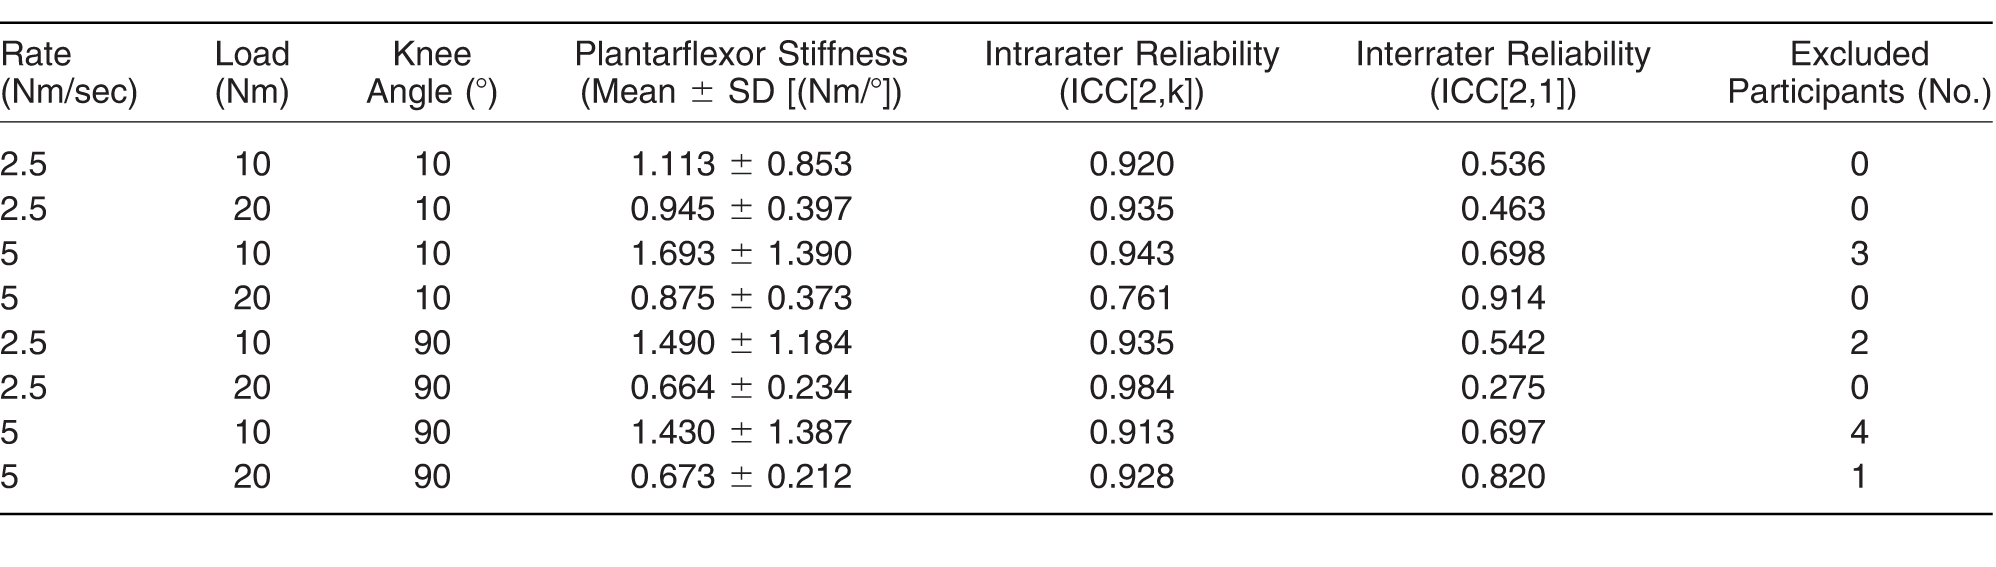
Interrater reliability is presented in Tables 2 and 3. For peak dorsiflexion, reliability was good to excellent (ICC[2,1] = 0.766–0.910). For plantarflexor stiffness, reliability was poor to excellent (ICC[2,1] = 0.275–0.914). Reliability was generally lower when the ankle was loaded at 2.5 Nm/sec. The strongest reliability across both dorsiflexion motion and plantarflexor stiffness measurements was generally seen at loads of 20 Nm at rates of 5 Nm/sec.
Table 2.
Intraclass Correlation Coefficients (ICCs) for Peak Dorsiflexion at All of the Rate, Loading, and Knee Angle Combinations
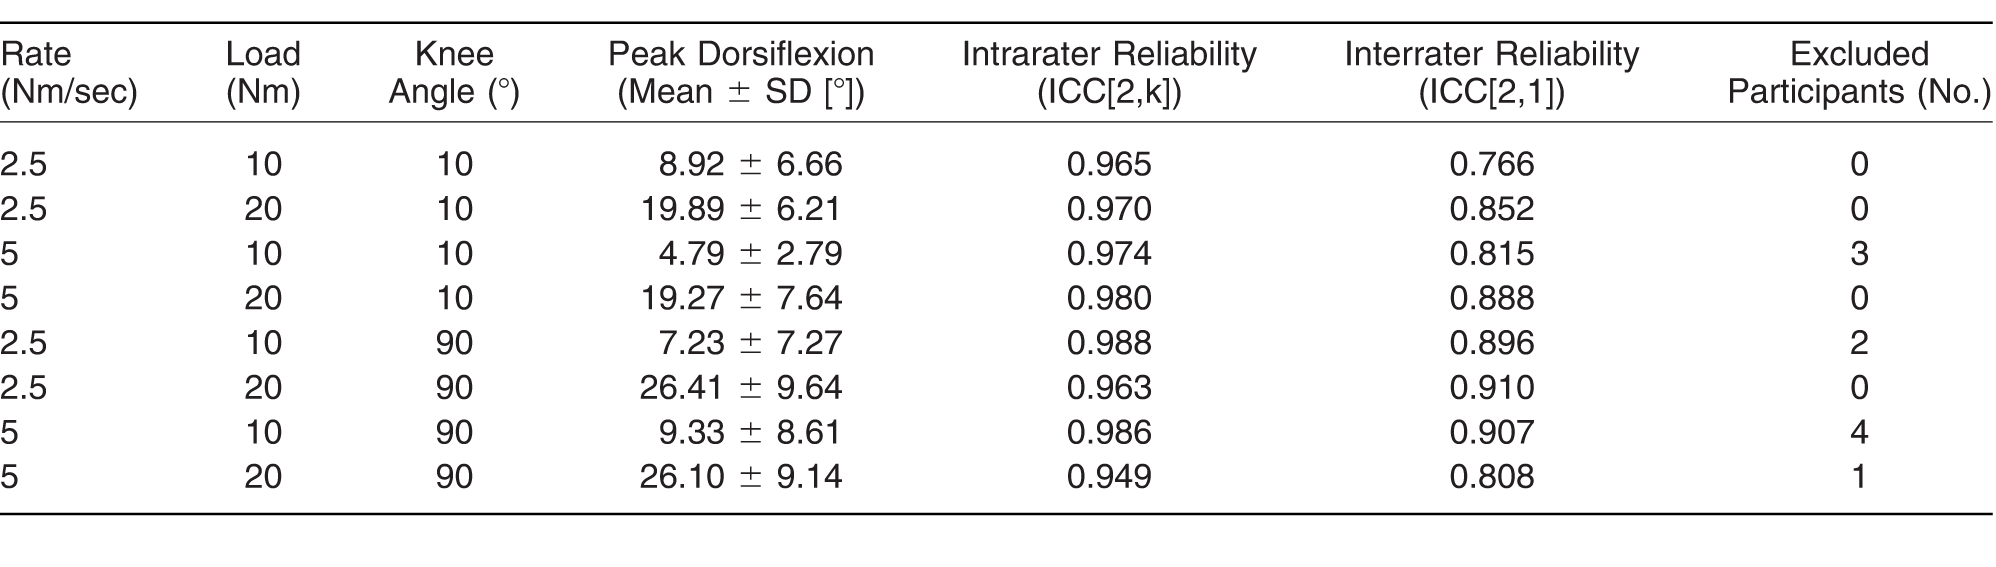
Table 3.
Intraclass Correlation Coefficients (ICCs) for Plantarflexor Stiffness at All of the Rate, Loading, and Knee Angle Combinations
Intrarater Reliability
Intrarater reliability is also presented in Tables 2 and 3. Results of ICC for intrarater reliability revealed excellent reliability for peak dorsiflexion (ICC[2,k] = 0.949–0.988) and good-to-excellent reliability for plantarflexor stiffness (ICC[2,k] = 0.761–0.984). The only ICC to fall below 0.9 was plantarflexor stiffness at a load of 20 Nm at 5 Nm/sec and 10° of knee flexion.
Correlations
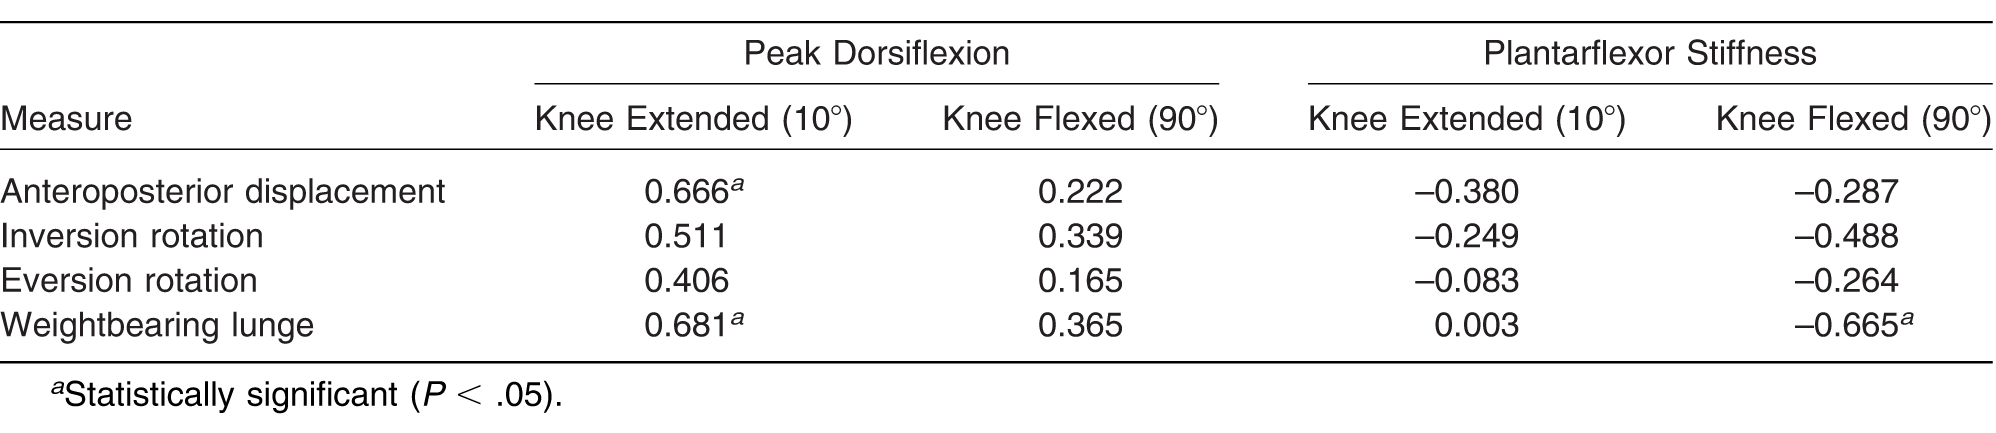
To limit comparisons and thus minimize chances of type I error, correlations were calculated only for the loading conditions that provided the overall greatest intrarater and interrater reliability. The overall greatest reliability was observed for loading to 20 Nm at 5 Nm/sec, with the knee flexed 10° or 90°. The correlations are presented in Table 4. Significant correlations were observed between peak dorsiflexion with the knee flexed 10° and both peak anteroposterior displacement (r = 0.666; P = .035) and WBL distance (r = –0.681; P = .030). Plantarflexor stiffness with 90° of knee flexion correlated with WBL distance (r = –0.665; P = .036).
Table 4.
Pearson Product-Moment Correlation Coefficients Between Dorsiflexion Motion and Plantarflexor Stiffness Measurements with Traditional Measures of Arthrometer-Quantified Ankle Laxity and the Weightbearing Lunge
Discussion
The present study aimed to describe the reliability of a modified ankle arthrometer for quantifying dorsiflexion motion and plantarflexor stiffness in a cohort of uninjured individuals. The present findings indicated good-to-excellent intrarater reliability across all of the measures and loading combinations, and good-to-excellent interrater reliability across specific loading combinations. When loading to 20 Nm, the reported values for dorsiflexion range of motion, both with and without the knee flexed, were consistent with values previously reported in the literature [26,27].; however, 10-Nm values were notably lower, indicating that the end range of motion was likely not achieved. Furthermore, given the lack of a true gold standard test for this measurement, we demonstrated a degree of concurrent validity using these techniques compared with the WBL test, a measure of functional dorsiflexion range of motion, as well as some relationship to the degree of sagittal plane ankle laxity. The results of this study demonstrate promise for the use of this device in the assessment of dorsiflexion deficits in a clinical setting.
Reliability
Two measures were assessed in this investigation across eight combinations of ankle peak torques, loading rates, and knee joint angles, and with two assessors trained in obtaining this measurement. For both measures of peak dorsiflexion and plantarflexor stiffness, good-to-excellent intrarater reliability was observed for all loading combinations, indicating consistency in measures for each tester individually [25]. However, when considering interrater reliability, greater variability was observed between measures and loading combinations. For peak dorsiflexion, good-to-excellent reliability was observed between the two assessors; however, reliability for plantarflexor stiffness was far more varied, ranging from poor (0.275 at 20 Nm, 2.5 Nm/sec, and 90° flexion) to excellent (0.914 at 20 Nm, 5 Nm/sec, and 10° knee flexion). Furthermore, as the loading rate was increased and the time of application decreased, there were a greater number of failed trials, contributing to participants being excluded, particularly at 5 Nm/sec and 10-Nm load. Based on the overall reliabilities across the two dependent variables, we concluded that loads of 20 Nm at 5 Nm/sec regardless of knee position yielded the best overall interrater and intrarater reliability, although multiple other loading combinations would provide similar reliability for dorsiflexion motion.
To date, instrumented ankle arthrometry has largely been used to assess ligamentous laxity and stiffness of the ankle joint complex [21,24,28]. Using this technique, similar levels of reliability have been reported, with ICCs ranging from 0.80 to 0.92 in previous literature [21,29]. Arthrometry offers several advantages over more traditional measures of quantifying dorsiflexion motion, such as goniometry. Although goniometry presents with good-to-excellent intrarater reliability, its interrater reliability is often negatively affected due to difficulty in aligning the goniometer axis with the functional axis of the ankle joint, and varying levels of force application to assess the end range of motion [8,11,30,31]. Ankle arthrometry resolves some of these issues, as a kinematic linkage system provides measures of motion between a foot plate to which the foot complex is secured and a plate securely fixed to the shank to provide joint angles and translations in three planes of motion [9]. Most devices available on the market use a form of protractor or goniometer in a custom apparatus to calculate joint rotation angles, but this presents limitations as the axis of the ankle joint shifts through dorsiflexion, and these measurements are prone to user alignment errors [16,18,20,32,33,34]. Furthermore, the use of multiple strain gauges allows for consistent application of forces, and software allows for augmented feedback to the tester to maintain consistent rates of loading [35]. Torque application varies largely across available devices, with papers reporting manual force application with and without feedback, [17,20,33]. the use of motorized implements, [27,36]. or the use of torque wrenches or wheels to gradually apply torque [18,30]. Although these devices offer varying degrees of accuracy, the arthrometer setup allows for potentially improved consistency in applied moment across individuals combined with strong accuracy of foot-to-shank moment that few other devices are able to replicate and that offers important clinical advantages.
The experimental control provided by the ankle arthrometer contributed to strong reliability for peak dorsiflexion angle, which extracts a discrete value of motion. However, the simultaneous collection of applied torque and motion allows for the computation of plantarflexor stiffness using this technique. Reliability for this dependent variable was far more varied given different amounts and rates of applied torque. Several factors may have explained this discrepancy as well as why the most reliable values (across raters) were observed at greater loads and faster speeds. The most important variable to note is the manner in which the load was applied, with the assessor receiving augmented real-time feedback of force application rate rather than being applied through a motor or controlled mechanism. This manual application, while practical in clinical settings, allowed for variability, particularly when not reaching the end range of motion (ie, with 10-Nm absolute loads) or when required to pull very quickly or slowly. The assessors in this study reported the most difficulty maintaining consistent loading when loading at 5 Nm/sec to 10 Nm, meaning load application occurred over 2 sec. This was expressed by a high number of excluded individuals for these speeds. Although some good intrarater reliability was observed at slower loading rates, it is possible that the reason these did not produce strong values for interrater reliability was similarly due to the length of force application (ie, 8 sec to achieve 20 Nm at 2.5 Nm/sec), allowing for greater variability in the consistency of load application.
We concluded that the most reliable load application was at 5 Nm/sec to a load of 20 Nm regardless of knee position. Throughout previous investigations using dorsiflexion measurement devices, debate has remained pertaining to the size of the moment needed to quantify motion and stiffness [8,22]. Values have typically varied between 10 and 20 Nm, with only one study going higher than this value. Notable differences in peak dorsiflexion and plantarflexor stiffness were observed in this study, indicating that 10 Nm was unlikely to reach the end range of motion. Although it is possible that moments greater than 20 Nm may have elicited greater angles, we are confident that across this cohort, the end range of motion was achieved as indicated by the end of the torque rotation curve. Regarding speed, most manual dorsiflexion measurement devices have not attempted to quantify the rate of loading at the joint. The exception are devices that aim to quantify plantarflexor spasticity, a property of muscle that requires loads be applied across a range of velocities to determine the stretch sensitivity of the muscles [37]. The goal of this study was to quantify passive stiffness, minimizing the neuromuscular responses to a joint perturbation that may be elicited at faster velocities. However, it does seem to be an important limiting factor in previous studies that speed has not been regulated. The viscoelastic properties of the static and dynamic restraints surrounding the ankle indicate that faster loads would elicit greater resistance, as was observed in this study [38]. Thereby, the ability to offer assessor feedback to monitor this loading rate is a clear advantage capable of offering insights related to viscoelastic and spasticity-related components of muscle stiffness.
Concurrent Validity
A limiting factor in the implementation of dorsiflexion measurement devices is the lack of reliable and true gold standards for comparison, except for radiograph-integrated measurements [16]. Although goniometry is generally accepted as the most commonly used measurement method clinically, its validity and reliability across assessors are often drawn into question [31]. Although the present study did not compare this device with a reference gold standard, comparisons were drawn between the results of this study and other measures of ankle stiffness and dorsiflexion range of motion that have previously demonstrated strong reliability and validity for quantifying mechanical ankle function [12,21,24]. Specifically, we determined the concurrent validity of the arthrometer compared with the WBL test, a measure of functional dorsiflexion range of motion, as well as how the values compared with ligamentous laxity measures surrounding the ankle joint [12,23]. We observed that peak dorsiflexion with the knee extended and plantarflexor stiffness with the knee flexed significantly correlated with values on the WBL test, indicating that those with greater functional dorsiflexion range of motion had more peak dorsiflexion with the knee extended and less plantarflexor stiffness with the knee flexed. These values represent a degree of concurrent validity for these two assessment techniques. Although it is curious that peak dorsiflexion at 90° did not correlate with WBL performance, this might imply that the WBL test is best at assessing stiffness of the triceps surae (and specifically soleus) rather than the absolute peak dorsiflexion range of motion. Furthermore, although it is curious that plantarflexor stiffness with the knee extended did not correlate with WBL performance, this may be explained by the fact that the WBL test is performed with the knee flexed, thereby testing soleus stiffness more than that of the entire triceps surae. One previous study reported that weightbearing assessment of dorsiflexion did not strongly correlate with passive nonweightbearing dorsiflexion goniometric assessment, which the authors had attributed to different mechanisms regulating stiffness in each condition (ie, arthrokinematic versus musculotendinous restrictions) [39]. The present data seem to potentially support this, and further studies integrating measures of both capsuloligamentous and musculotendinous stiffness with these gross measurements are warranted.
Last, correlations were observed between anteroposterior displacement and peak dorsiflexion with the knee extended, although no relationships were observed with the knee flexed, and neither were any correlations observed for IE rotation. These findings indicate that, as hypothesized, relationships between joint laxity and ankle range of motion are plane specific, and generalized joint laxity did not predict dorsiflexion motion or plantarflexor stiffness. The relationship between anteroposterior displacement and dorsiflexion motion is likely more complicated than this study is able to describe. Only peak dorsiflexion with the knee extended correlated, indicating that laxity affects ankle motion when the gastrocnemius is limiting ankle motion but not when removed. Although this finding could indicate that a true peak angle was not assessed when the knee was flexed, the present values of dorsiflexion were consistent with previously published work, and, therefore, an alternate explanation may be related to the arthrokinematics of the ankle joint. Standard protocols with the instrumented ankle arthrometer load the ankle to 30 N posteriorly followed by 130 N anteriorly to test the integrity of the anterior talofibular ligament [21,24]. However, a relationship is well understood between posterior talar translation and dorsiflexion range of motion, with posterior mobilizations of the talus frequently implemented to correct dorsiflexion motion deficits [40]. Further studies may aim to better evaluate the relationship between posterior talar excursion and dorsiflexion motion using this device, as well as the effects of treatment.
Limitations
There are certain limitations that may limit the interpretation of the data from this investigation. First and foremost, the cohort in this study consisted of healthy individuals without foot or ankle injury and with high function scores. As such, the reliability and validity of this device should be investigated across a range of individuals with ankle pathology. Furthermore, validity measures were considered concurrent with the WBL test and ligamentous laxity. There is a lack of gold standard in this technique; however, there are certainly more techniques capable of determining ankle stiffness, such as oscillometry. In addition, as we attempted to establish torque and rate of loading limits for this study by basing values on those previously reported in the literature, some loading combinations were difficult to achieve with a manual force application device, leading to a loss of some participants to analysis due to the inability to maintain consistent loading. Although this could be a limitation to the present reliability analysis, it also provides valuable information for selecting loading parameters in subsequent studies and with additional devices.
Clinical Recommendations
The use of ankle arthrometry has allowed clinicians to obtain quick, objective measures of ankle laxity in healthy individuals and those with ligamentous injury to the ankle. Data from this study indicate that the same tool may be useful in obtaining similar measurements of dorsiflexion motion and stiffness, expanding the use of the arthrometer beyond the assessment of individuals with ligamentous pathology. Although the use of 10° versus 90° of knee flexion would be relevant to the specific application and the need to include or eliminate contributions of the triceps surae, it seems clear that an absolute of 20 Nm of loading would be recommended to improve interrater reliability. Although our recommendation is to use a loading rate of approximately 5 Nm/sec, further investigations into pathologic populations may lead to modifications of this rate.
Conclusions
These study results indicate that the use of a modified ankle arthrometer seems to be a reliable method for quantifying dorsiflexion range of motion, although further research may be required to demonstrate validity. Although multiple devices have been described to measure peak dorsiflexion or plantarflexor stiffness, this device offers several potential advantages because it is commercially available and can allow for better regulation of loading rate and peak loads. The present findings indicate that this tool may not only demonstrate clinical use for quantifying the type and degree of dorsiflexion deficits, but also the high reliability values indicate utility toward tracking patient outcomes over time. Similar to many other measures of dorsiflexion motion, the intrarater reliability remained higher than the interrater reliability, suggesting that including measurements by the same assessor may be preferred; however, interrater reliability is improved by increasing the absolute load and rate of loading. Beyond the use of this device in patients with equinus, the ability to control the loading rate may provide further utility toward assessing patients with neurologic disorders that contribute toward spasticity and rigidity.
Acknowledgment
J. Marcus Hollis, PhD, for his assistance in developing the dorsiflexion gauge arthrometer addition used in this study with input from the investigators.
Financial Disclosure:
None reported.
Conflict of Interest:
None reported.
References
- Charles, J.; Scutter, SD.; Buckley, J. Static ankle joint equinus: toward a standard definition and diagnosis. JAPMA 2010, 100, 195. [Google Scholar]
- Drewes, LK.; McKeon, PO.; Kerrigan, DC.; et al. Dorsiflexion deficit during jogging with chronic ankle instability. J Sci Med Sport 2009, 12, 685. [Google Scholar]
- Hoch, MC.; Staton, GS.; Medina McKeon, JM.; et al. Dorsiflexion and dynamic postural control deficits are present in those with chronic ankle instability. J Sci Med Sport 2012, 15, 574. [Google Scholar]
- Youdas, JW.; McLean, TJ.; Krause, DA.; et al. Changes in active ankle dorsiflexion range of motion after acute inversion ankle sprain. J Sport Rehabil 2009, 18, 358. [Google Scholar]
- Terada, M.; Pietrosimone, BG.; Gribble, PA. Therapeutic interventions for increasing ankle dorsiflexion after ankle sprain: a systematic review. J Athl Train 2013, 48, 696. [Google Scholar]
- Hoch, MC.; Staton, GS.; McKeon, PO. Dorsiflexion range of motion significantly influences dynamic balance. J Sci Med Sport 2011, 14, 90. [Google Scholar]
- Chimera, NJ.; Castro, M.; Davis, I.; et al. The effect of isolated gastrocnemius contracture and gastrocnemius recession on lower extremity kinematics and kinetics during stance. Clin Biomech (Bristol, Avon) 2012, 27, 917. [Google Scholar]
- Gatt, A.; Chockalingam, N. Clinical assessment of ankle joint dorsiflexion: a review of measurement techniques. JAPMA 2011, 101, 59. [Google Scholar]
- Kovaleski, JE.; Gurchiek, LR.; Heitman, RJ.; et al. Instrumented measurement of anteroposterior and inversion-eversion laxity of the normal ankle joint complex. Foot Ankle Int 1999, 20, 808. [Google Scholar]
- Needle, AR.; Baumeister, J.; Kaminski, TW.; et al. Neuromechanical coupling in the regulation of muscle tone and joint stiffness. Scand J Med Sci Sports 2014, 24, 737. [Google Scholar]
- Konor, MM.; Morton, S.; Eckerson, JM.; et al. Reliability of three measures of ankle dorsiflexion range of motion. Int J Sports Phys Ther 2012, 7, 279. [Google Scholar]
- Hoch, MC.; McKeon, PO. Normative range of weight-bearing lunge test performance asymmetry in healthy adults. Man Ther 2011, 16, 516. [Google Scholar]
- Blackburn, JT.; Padua, DA.; Weinhold, PS.; et al. Comparison of triceps surae structural stiffness and material modulus across sex. Clin Biomech (Bristol, Avon) 2006, 21, 159. [Google Scholar]
- McGinnis, K.; Snyder-Mackler, L.; Flowers, P.; et al. Dynamic joint stiffness and co-contraction in subjects after total knee arthroplasty. Clin Biomech (Bristol, Avon) 2013, 28, 205. [Google Scholar]
- Needle, AR.; Kaminski, TW.; Baumeister, J.; et al. The relationship between joint stiffness and muscle activity in unstable ankles and copers. J Sport Rehabil 2017, 26, 15. [Google Scholar]
- Gatt, A.; Chockalingam, N. Validity and reliability of a new ankle dorsiflexion measurement device. Prosthet Orthot Int 2013, 37, 289. [Google Scholar]
- Greisberg, J.; Drake, J.; Crisco, J.; et al. The reliability of a new device designed to assess gastrocnemius contracture. Foot Ankle Int 2002, 23, 655. [Google Scholar]
- Kobayashi, T.; Leung, AK.; Hutchins, SW. Design of a manual device to measure ankle joint stiffness and range of motion. Prosthet Orthot Int 2011, 35, 478. [Google Scholar]
- Larsen, P.; Nielsen, HB.; Lund, C.; et al. A novel tool for measuring ankle dorsiflexion: a study of its reliability in patients following ankle fractures. Foot Ankle Surg 2016, 22, 274. [Google Scholar]
- Meyer, DC.; Werner, CM.; Wyss, T.; et al. A mechanical equinometer to measure the range of motion of the ankle joint: interobserver and intraobserver reliability. Foot Ankle Int 2006, 27, 202. [Google Scholar]
- Kovaleski, JE.; Hollis, J.; Heitman, RJ.; et al. Assessment of ankle-subtalar-joint-complex laxity using an instrumented ankle arthrometer: an experimental cadaveric investigation. J Athl Train 2002, 37, 467. [Google Scholar]
- Wilken, J.; Rao, S.; Estin, M.; et al. A new device for assessing ankle dorsiflexion motion: reliability and validity. J Orthop Sports Phys Ther 2011, 41, 274. [Google Scholar]
- Bennell, KL.; Talbot, RC.; Wajswelner, H.; et al. Intra-rater and inter-rater reliability of a weight-bearing lunge measure of ankle dorsiflexion. Aust J Physiother 1998, 44, 175. [Google Scholar]
- Disanto, TJ.; Swanik, CB.; Swanik, KA.; et al. Concurrent validity of the anterior drawer test and an arthrometer in evaluating ankle laxity. Athl Train Sports Health Care 2011, 3, 15. [Google Scholar]
- Koo, TK.; Li, MY. A guideline of selecting and reporting intraclass correlation coefficients for reliability research. J Chiropr Med 2016, 15, 155. [Google Scholar]
- Krause, DA.; Cloud, BA.; Forster, LA.; et al. Measurement of ankle dorsiflexion: a comparison of active and passive techniques in multiple positions. J Sport Rehabil 2011, 20, 333. [Google Scholar]
- Moseley, AM.; Crosbie, J.; Adams, R. Normative data for passive ankle plantarflexion: dorsiflexion flexibility. Clin Biomech (Bristol, Avon) 2001, 16, 514. [Google Scholar]
- Kovaleski, JE.; Norrell, PM.; Heitman, RJ.; et al. Knee and ankle position, anterior drawer laxity, and stiffness of the ankle complex. J Athl Train 2008, 43, 242. [Google Scholar]
- Hubbard, TJ.; Kovaleski, JE.; Kaminski, TW. Reliability of intratester and intertester measurements derived from an instrumented ankle arthrometer. J Sport Rehabil 2003, 12, 208. [Google Scholar]
- Charles, J. The design, development, and reliability testing of a new innovative device to measure ankle joint dorsiflexion. JAPMA 2016, 106, 338. [Google Scholar]
- Elveru, RA.; Rothstein, JM.; Lamb, RL. Goniometric reliability in a clinical setting: subtalar and ankle joint measurements. Phys Ther 1988, 68, 672. [Google Scholar]
- Donnery, J.; Spencer, RB. The biplane goniometer: a new device for measurement of ankle dorsiflexion. JAPMA 1988, 78, 348. [Google Scholar]
- Weaver, K.; Price, R.; Czerniecki, J.; et al. Design and validation of an instrument package designed to increase the reliability of ankle range of motion measurements. J Rehabil Res Dev 2001, 38, 471. [Google Scholar]
- Assal, M.; Shofer, JB.; Rohr, E.; et al. Assessment of an electronic goniometer designed to measure equinus contracture. J Rehabil Res Dev 2003, 40, 235. [Google Scholar]
- Needle, AR.; Baumeister, J.; Farquhar, WB.; et al. The relationship between the sensory responses to ankle-joint loading and corticomotor excitability. Int J Neurosci 2018, 128, 435. [Google Scholar]
- Chesworth, BM.; Vandervoort, AA. Reliability of a torque motor system for measurement of passive ankle joint stiffness in control subjects. Physiother Can 1988, 40, 300. [Google Scholar]
- Lorentzen, J.; Grey, MJ.; Geertsen, SS.; et al. Assessment of a portable device for the quantitative measurement of ankle joint stiffness in spastic individuals. Clin Neurophysiol 2012, 123, 1371. [Google Scholar]
- Sobolewski, EJ.; Ryan, ED.; Thompson, BJ. Influence of maximum range of motion and stiffness on the viscoelastic stretch response. Muscle Nerve 2013, 48, 571. [Google Scholar]
- Whitting, JW.; Steele, JR.; McGhee, DE.; et al. Passive dorsiflexion stiffness is poorly correlated with passive dorsiflexion range of motion. J Sci Med Sport 2013, 16, 157. [Google Scholar]
- Loudon, JK.; Reiman, MP.; Sylvain, J. The efficacy of manual joint mobilisation/manipulation in treatment of lateral ankle sprains: a systematic review. Br J Sports Med 2014, 48, 365. [Google Scholar]
© 2020 American Podiatric Medical Association