


Abstract
Background: Plantar pressure measurement is effective for assessing plantar loading and can be applied to evaluating foot performance. We sought to explore the characteristics of plantar pressures in elite sprinters and recreational runners during static standing and walking. Methods: Arch index (AI) values, regional plantar pressure distributions (PPDs), and footprint characteristics were examined in 80 elite sprinters and 90 recreational runners using an optical plantar pressure measurement system. Elite sprinters' pain profiles were examined to evaluate their most common pain areas. Results: In recreational runners, AI values in males were in the normal range and in females were high arch type. The AI values were significantly lower in elite sprinters than in recreational runners. In elite sprinters, particularly males, the static PPD of both feet was higher at the medial metatarsal bone and the lateral heel and lower at the medial and lateral longitudinal arches. Elite male sprinters' PPD of both feet was mainly transferred to the medial metatarsal bone and decreased at the lateral longitudinal arch and the medial heel during the midstance phase of walking. The lateral knee joint and biceps femoris were the most common sites of musculoskeletal pain in elite sprinters. Conclusions: Elite sprinters' AI values could be classified as high arches, and their PPD tended to parallel the features of runners and high-arched runners. These findings correspond to the profile of patellofemoral pain syndrome (PFPS)–related plantar pressure. The pain profiles seemed to resonate with the symptoms of high-arched runners and PFPS. A possible link between high-arched runners and PFPS warrants further study.
A sprint, known as a short-distance running race in track and field, is a high-intensity and anaerobic activity that highly depends on instantaneous force, muscle strength, and lower-limb speed. The lengths of sprint events are divided into 100, 200, and 400 m. According to previous studies, runners tend to be more susceptible to excessive eversion of ankle joints than people engaging in other sports activities mainly because of wear and tear on the inner sides of runners' sole heels and their fast pace in running.[1] Overuse running injuries commonly arise in knees, ankles, feet, and lower legs and are usually related to plantar fasciitis, Achilles tendinitis, and medial tibial stress syndrome.[2-4]
Foot arch, an anatomical structure of the foot, comprises ligaments, muscles, and bones, and it can be regarded as a shock absorber in the human body.[5] In walking and running, the medial longitudinal arch (MLA) provides adequate elastic forces and twisting forces for absorbing the ground reaction force, and this is helpful for attenuating the shock from movement, mitigating injuries, and deferring fatigue.[6] Height of the MLA is generally treated as the influential and key determinant of the function of the foot and lower limbs.[7] Abnormal arch height is ineffective in absorbing the ground reaction force, and, thus, runners are prone to injuries.[8] High arches are usually associated with more laterally located bony injuries of the foot, ankle, and knee and with lower-extremity stress fractures.[9] Low-arched people tend toward a greater incidence of soft-tissue injuries medially, such as patellar tendinitis, plantar fasciitis, and knee pain.[9,10] Apart from radiographs and ultrasonographic methods that provide direct measurements of MLA height, the arch index (AI) of footprints could be considered a reliable and valid method to characterize the foot and MLA height.[11-16] Recently, assessment of static arch mobility, associated with lower extremity and footprint measures, seemed to be put at the core of understanding the overall function of the foot and lower extremities during running.[17]
Plantar pressure assessment of footprints is an effective method for evaluating plantar loading characteristics during functional activities such as running.[18] The parameters can be incorporated into the assessment and evaluation of foot and lower-limb function[19] and can assist in detecting foot abnormalities.[20] In addition, parameters used for demonstrating the arch change in 6- to 17-year-old individuals could serve as an effective approach to understanding foot growth and maturity in morphology.[21] Static arch height and arch height ratio measurements may assist the clinician in estimating foot posture during dynamic activities in patients with lower-limb injuries.[22] Clinicians also commonly use static MLA posture to infer dynamic foot function and assess the potential for several foot-specific abnormalities[23] and lower-extremity dysfunctions, which may increase injury risk.[24] For example, greater regional plantar loadings are usually involved with forefoot rheumatoid arthritis, hallux valgus deformity,[25] medial midfoot osteoarthritis,[26] and posterior tibialis tendon dysfunction leading to flatfoot deformity.[23] In addition, a recent prospective study noted that static characteristics of flatfoot, high-arched foot, and rearfoot ranges of motion seemed to be risk factors for lower-extremity overuse injuries.[27] When plantar pressure in each region of the foot is distributed evenly, sports injuries can be reduced effectively.[28] Despite the benefits of plantar pressure assessment, the characteristics of individuals with specific musculoskeletal fatigue are likely to affect the reliability of the plantar pressure measurements.[29,30] Previous studies have confirmed the correlation between variations in anatomical structures of the foot and pressure distributions.[11,31,32] The relationships between plantar loading characteristics and patellofemoral pain syndrome (PFPS) in dynamic states have also been of concern for some time, as is evidenced by studies of plantar pressure distribution (PPD) during walking and running.[33-36] Furthermore, it seems to be widely accepted that PFPS, also known as runner's knee, is the most prevalent injury among runners and is characterized by pain under or around the kneecap.[4,37,38]
Plantar pressure has been examined mostly in adults during walking and running in the available literature.[36,39-42] Yet, little is currently known about static PPD in healthy people.[43] To our knowledge, few studies have been undertaken to explore static plantar loading characteristics in elite sprinters and predict their potential pain profiles, such as PFPS. Therefore, the purpose of this study was to explore the differences between elite sprinters and recreational runners in terms of their plantar pressure characteristics during static standing and walking. To accomplish this purpose, we examined the following parameters: AI; regional PPDs of the forefoot, midfoot, and rearfoot; six distinct subregional PPDs; and the footprint characteristics of both feet. Moreover, the pain assessment and self-reported health status of all elite sprinters were examined to accurately evaluate the areas where pain occurred frequently. We hypothesized that the elite sprinters in the present study were more likely to be classified into high arch types, and their PPD was mainly concentrated in the forefoot and rearfoot regions. Furthermore, plantar loading characteristics and pain profiles may be related to the features of high-arched runners and PFPS.
Methods
Participant Selection
The study included 170 college and university students in Taiwan categorized into two groups: elite sprinters (n = 80) and recreational runners (n = 90). The elite sprinters (42 men and 38 women), who specialized in 100-, 200-, and 400-m sprints, were mainly recruited from the National Taiwan University of Sport, College of Kinesiology, University of Taipei and three city sports centers in Taipei, Taiwan. Individuals had to have more than 4 successive years of sprinting experience to be considered elite. Their routine training included gymnastics on Monday, Wednesday, and Friday mornings; weight training on Tuesday, Thursday, and Saturday mornings; and 3 to 4 hours of high-intensity interval sprint training 5 to 7 days per week. The average running speed of the 100-m sprint performances was 11.34 sec (8.818 m/sec) for men and 12.94 sec (7.728 m/sec) for women.
The recreational runners (54 men and 36 women) were in the same age range (17–21 years old) as the elite sprinters. The recreational runners were recruited from five city sports centers in Taipei and were required to run at least 10 km per week on the treadmill or at the stadium for 6 months before study initiation.
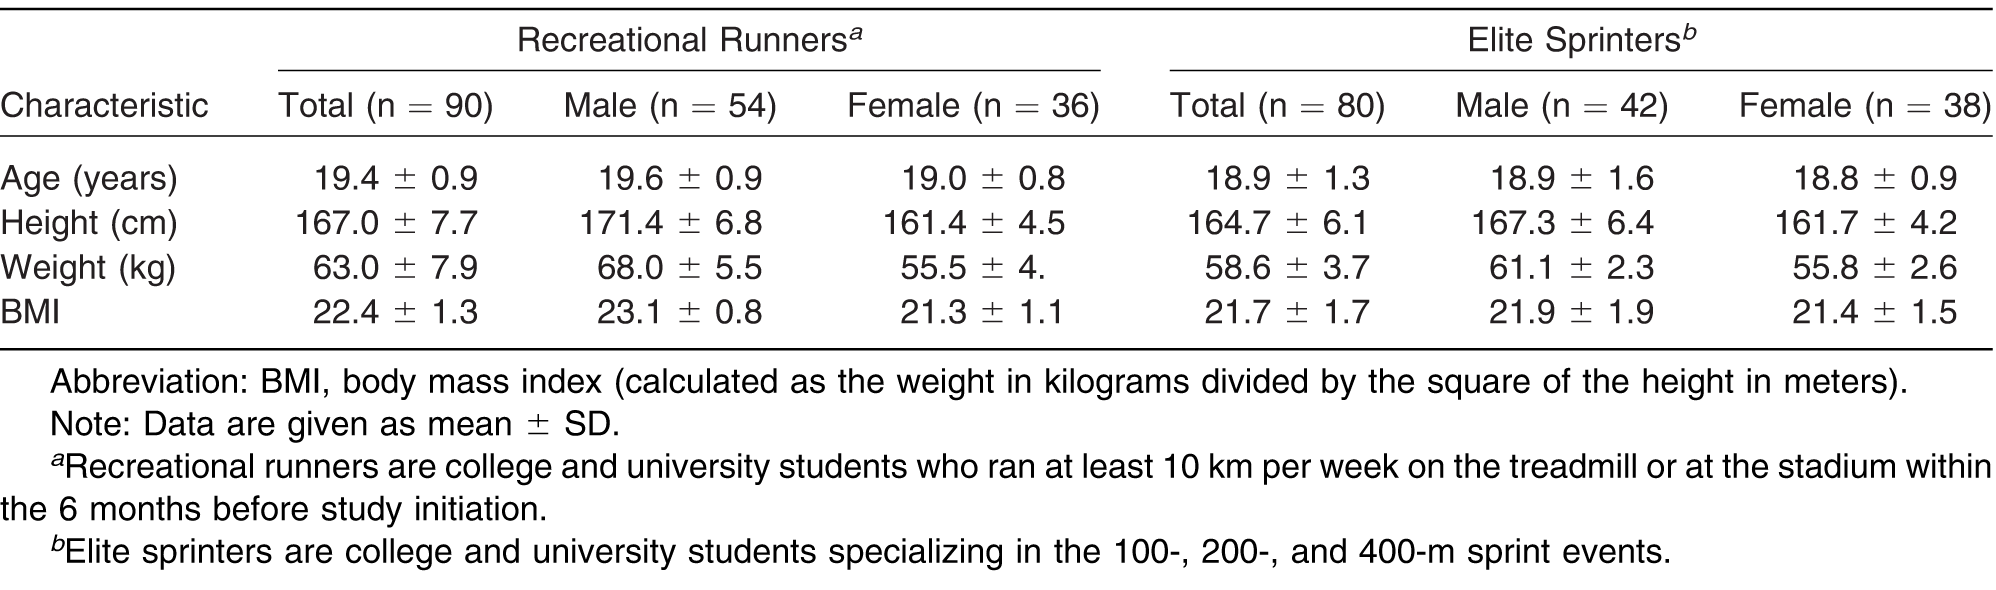
Age, sex, height, body weight, and body mass index (BMI) (calculated as the weight in kilograms divided by the square of the height in meters) were recorded for each participant (Table 1). It has been widely accepted in many studies that the arch shape changes when gaining weight in the process of growth and development, and there seems to be a strong link between obesity and flat feet. Considering the effect of body weight on the shape characteristics of the foot arch, the requisite BMI for each individual was 18.5 to 24. This particular range of BMI is defined by the World Health Organization as healthy weight.
Table 1.
Demographic Characteristics of the 170 Study Participants.
Pain and health assessments were conducted via the self-report survey based on the physiotherapist's history and physical examination. Individuals' personal data were collected through the questionnaires. The diagnoses were made by the professional physiotherapist at the rehabilitation department of Tri-service General Hospital in Taipei, Taiwan. Individuals with a history of fracture and surgery and those with injuries in their ankle joints, knee joints, hip joints, spine, and bones and muscles of their lower limbs in the 12 months before the study were excluded. Before the study began, all of the participants were informed of the study purpose and processes and signed an informed consent form. This study followed the guidelines of the Research Ethics Office of National Taiwan University and the recommendations of the Declaration of Helsinki.
Instruments and Equipment
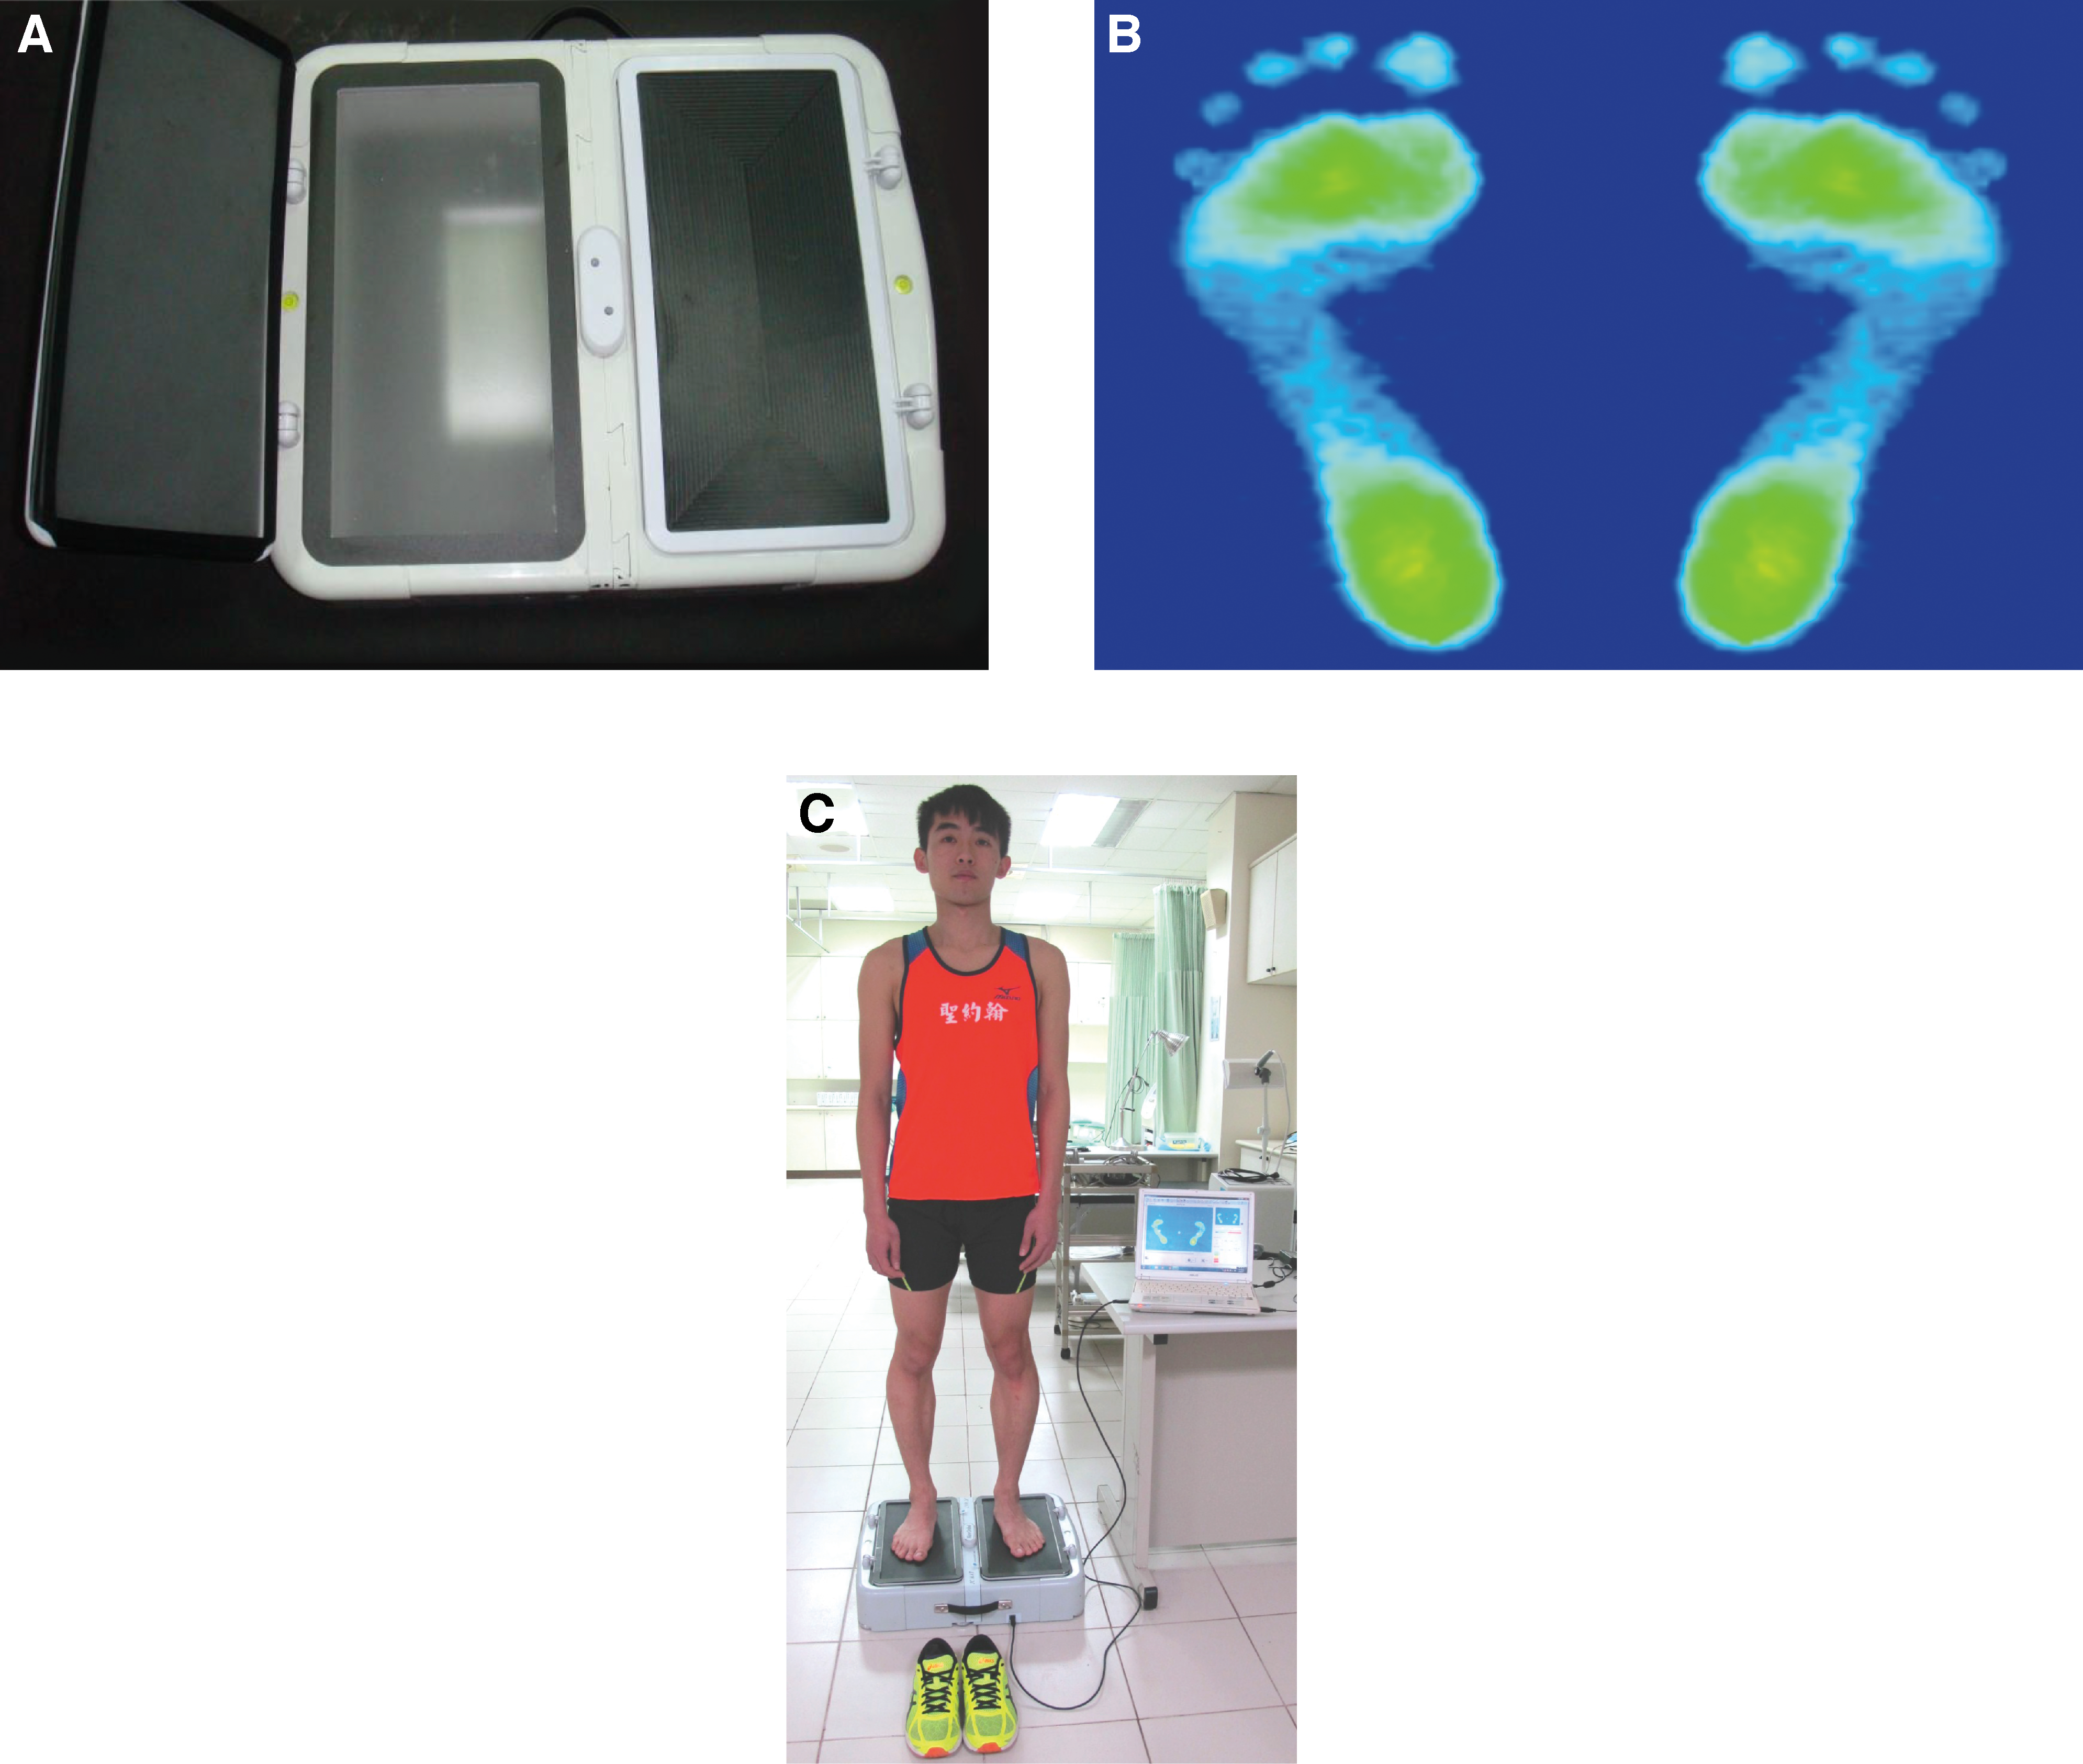
To measure plantar pressure and PPD, we used the JC Mat optical plantar pressure analysis system (View Grand International Co Ltd, New Taipei City, Taiwan). The footprint image in Figure 1 demonstrates the PPD measuring process using JC Mat. The measurement technology and principles of JC Mat are similar to the operation principles of the Harris footprint measurement instrument. The key attributes of JC Mat are as follows: 1) the subtle characteristics of the foot are easily distinguished; 2) the PPD and footprints coincide with the weight calibration data (data not shown); 3) there are 25 sensors in each square centimeter for plantar pressure measurement, and, thus, 13,600 sensors are on each side (32 × 17 cm) of JC Mat; 4) the pressure sensing is sensitive and the scope of the sensor is large (a smooth and delicate plantar pressure image is shown in the form of round dots); 5) the pressure profiles from footprints and barefoot images are captured instantly; and 6) the built-in FPDS-Pro software is competent for analyzing AI, plantar pressure values, balance of the center of gravity, toe angles, and footprints.
Figure 1.
A, JC Mat, an optical instrument for plantar pressure measurement. Instant capture of the footprint image (B) and illustration of participant measurement of plantar pressures (C) during bipedal standing.
Procedures
It took approximately 7 months to select the participants and conduct the experiments for this study. For the sake of consistency and trustworthiness of the experiments, each experiment was undertaken between 3 and 5 pm. All of the participants were required to measure their body weight and height when the experiments were conducted. This was helpful for recording the basic and accurate data of participants' physiologic conditions in terms of weight and height.
Static footprint data were acquired using brief trials of static upright standing in the following steps:
- 1)
- Roll both trouser legs up to above the knees if necessary to prevent the clothing from limiting extremity movements.
- 2)
- Stand with bare feet on the sensing cushion within the marks of the specific measuring range of JC Mat.
- 3)
- Relax the body; then, control and balance the center of gravity by standing with feet shoulder-width apart and body weight evenly distributed on both feet.
- 4)
- Stampede for 6 to 8 steps, and then stand still in a natural and comfortable posture, with arms hanging straight down at the sides.
- 5)
- Face the guide of the experiment, and look the guide straight in the eye. Keep the body stationary and balanced until there are no obvious changes in the pressure values of both feet measured by JC Mat.
When the condition in step 5 was met, pressure profiles from the static footprints were acquired immediately. In follow-up measurement of the dynamic footprints, participants were asked to walk at a self-selected speed over a 4-m-long walkway in which JC Mat was embedded. Multiple walking trials were completed until at least three steps for each limb were correctly acquired (ie, the sensing cushion within the marks of the specific measuring range of JC Mat was struck with a single foot).
Data Analysis
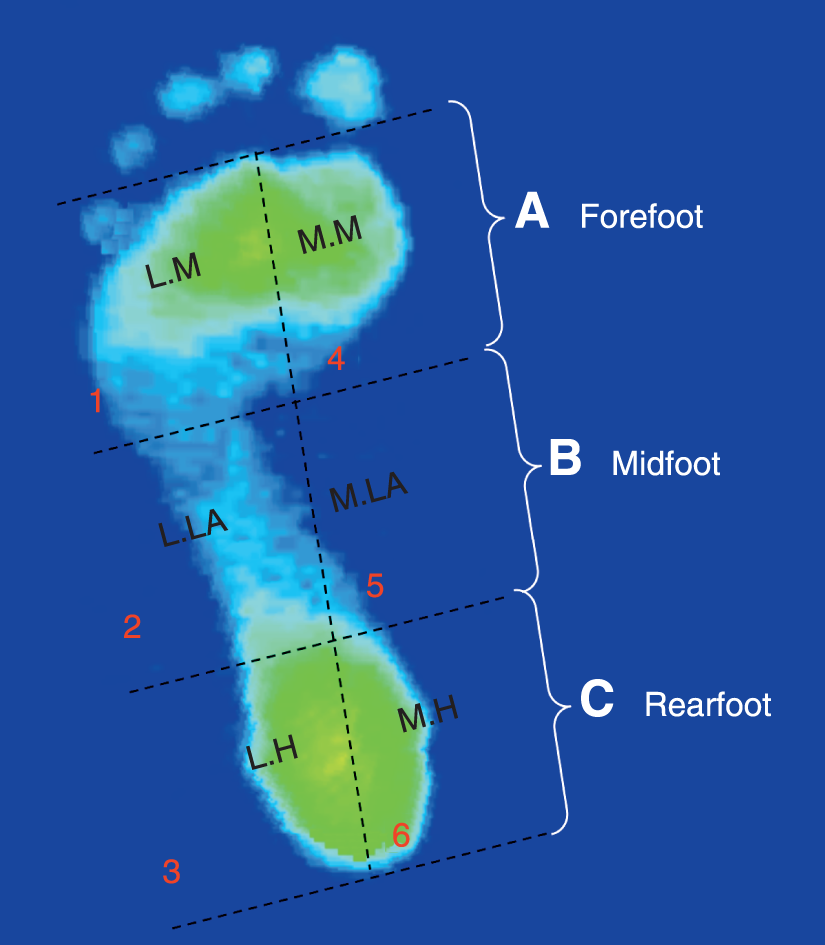
To examine the PPDs in three regions and six subregions of both feet, the images of the static and midstance walking footprints of both feet were digitized and imported into the specific computer program (FPDS-Pro software). The software inserted a perpendicular line on the footprint images that extended from the tip of the second toe to the center of the heel; it was then drawn tangential to the most anterior and posterior parts of the footprint, excluding the toes. The software automatically generated four parallel lines that were perpendicular to the first line and divided the outlined footprint into three equal regions and six distinct subregions (Fig. 2). Regions A, B, and C of the footprint were defined as the forefoot, midfoot, and rearfoot regions, respectively. The six subregions were defined as follows: 1, lateral metatarsal bone; 2, lateral longitudinal arch; 3, lateral heel; 4, medial metatarsal bone; 5, MLA; and 6, medial heel. The AI ratio method developed by Cavanagh and Rodgers assumes that the AI was calculated as the ratio of the area of the middle third of the footprint divided by the entire footprint area excluding the toes, ie, AI = B / (A + B + C). Based on Cavanagh and Rodgers' assertion, an AI ratio less than 0.21 defines a high-arched foot, 0.21 to 0.26 a normal-arched foot, and greater than 0.26 a flat-arched foot.
Figure 2.
Illustration of the three equal regions (forefoot, midfoot, and rearfoot) and six distinct subregions (lateral metatarsal bone [LM], lateral longitudinal arch [LLA], lateral heel [LM], medial metatarsal bone [MM], medial longitudinal arch [MLA], and medial heel [MH]) used to assess the plantar pressures.
Pain Assessment and Self-Reported Health Status of the Participants
The process of pain assessment and self-reported health status of the participants was conducted by a professional physiotherapist at the rehabilitation department of Tri-service General Hospital in Taipei, Taiwan. This process functioned as the basis for the participant selection criteria, the physiologic symptom assessment, and confirmation of pain locations. All of the participants underwent the skeleton arrangement and soft-tissue pain assessment after the completion of plantar pressure measurement. Specifically, lower-limb pain was defined as musculoskeletal pain that occurred during the past month and originated from the foot, ankle, knee, lower leg, or thigh. This definition excludes intermittent cramps, dermatologic conditions, digital calluses, and nighttime paresthesia from the analysis. A standardized protocol of the questioning and examination techniques was used to determine the precise nature of the complaint (eg, metatarsalgia and plantar fasciitis). The procedure used to evaluate the areas where pain occurred frequently was as follows:
- 1)
- The physiotherapist evaluated and documented participants' self-reported health status and areas where pain occurred frequently in the body.
- 2)
- The participants were asked to stand barefoot and to roll both trouser legs up to above the knees if necessary.
- 3)
- The physiotherapist inspected the participants' lower extremities by pressing on the foot (including the phalanges, metatarsal bones, navicular bone, cuboid bone, and calcaneus), ankle joint, knee joint, hip joints, tibia, fibula, and femur and then assessing the arrangement of the bones of the lower extremities.
The procedure for assessing soft-tissue pain was as follows:
- 1)
- The physiotherapist pressed on the participants' self-reported pain areas and rechecked the corresponding locations on the opposite side of the pain areas.
- 2)
- Based on clinical experience, the physiotherapist pressed on and examined the specific points in the participants' common pains areas, including the plantar metatarsal heads, the plantar fascia, the inferior margins of navicular bones, the Achilles tendon, the medial and lateral sides of the ankle joints, the medial and lateral fossae of the knee joints, the gastrocnemius, the tibialis anterior and posterior, and the biceps and quadriceps femoris. This allowed the physiotherapist to confirm the pain areas in the body.
Statistical Analysis
Descriptive statistics are used to summarize age, height, weight, and BMI values. Numerical data are presented as mean ± SD. The parameters gained from the plantar pressure measurement—AI, three regional PPDs, and six distinct subregional PPDs—were compared between groups using independent-samples t test. Statistical significance was defined as P < .05, and highly significant as P < .01. All of the statistics were calculated with a statistical software program (PASW Statistics for Windows, version18.0; SPSS Inc, Chicago, Illinois).
Results
Arch Index
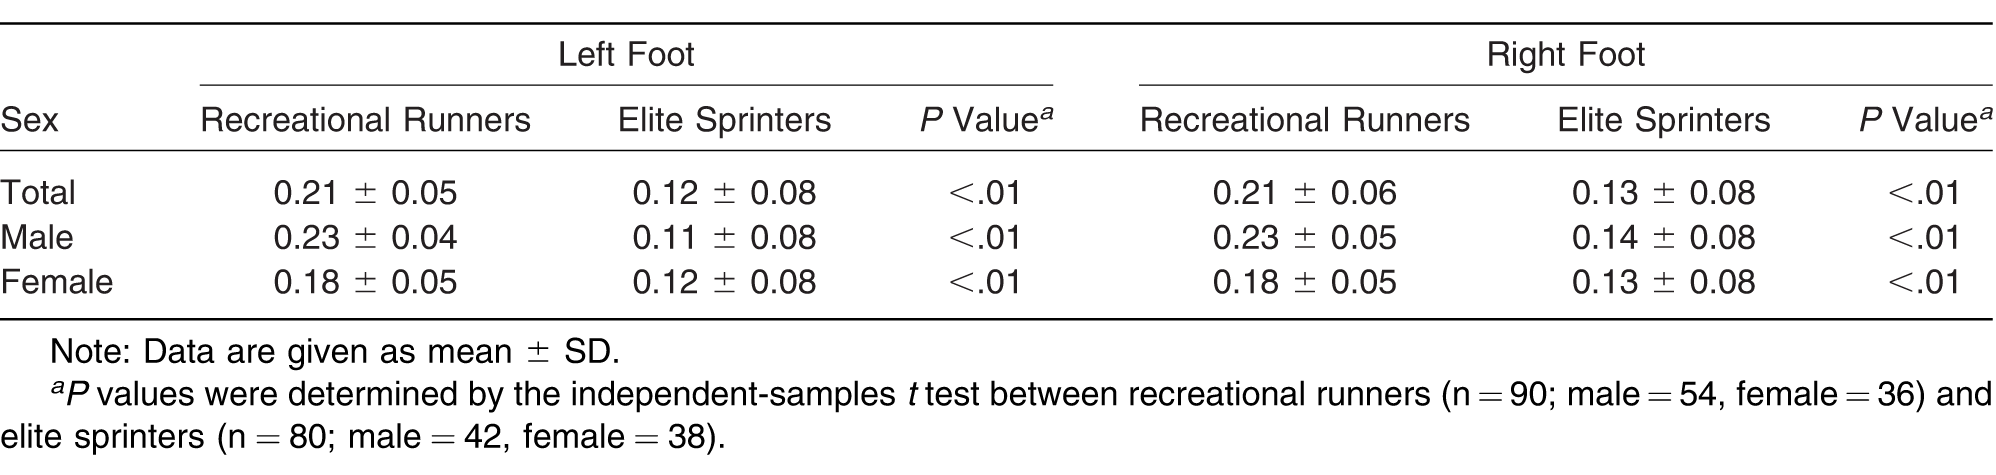
The mean AI values of the male and female recreational runners were 0.23 and 0.18, respectively (Table 2). There was no statistically significant difference between male and female recreational runners. Yet, the AI of both feet in elite sprinters was significantly smaller than that in recreational runners (P < .01), suggesting that the arch type was higher in elite sprinters than in recreational runners.
Table 2.
Arch Index of the Foot in Static Standing.
PPDs of the Forefoot, Midfoot, and Rearfoot Regions
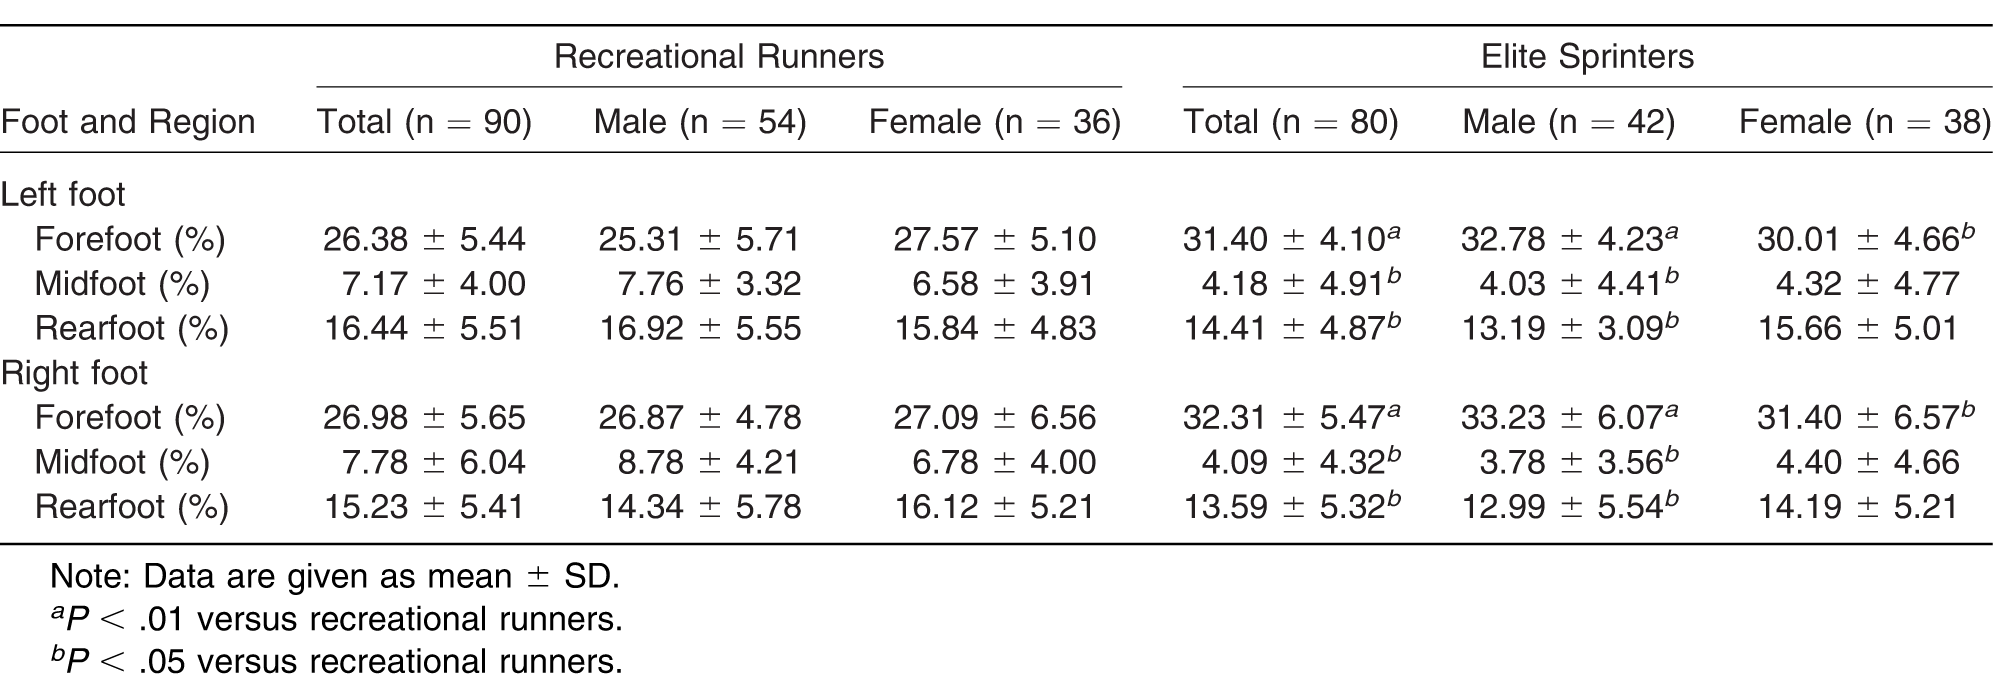
The PPDs are given as percentages of the relative load. During static standing, the relative load in the forefoot region of both feet was higher in elite sprinters, males in particular, than in recreational runners (P < .01) (Table 3). The relative load in the midfoot region of both feet was found to be significantly lower in elite sprinters than in recreational runners (P < .01). In addition, the relative load in the rearfoot region of both feet was higher in elite sprinters, males in particular, than in recreational runners (P < .05). However, during the midstance phase of walking, the relative load of both feet was higher in the forefoot region but lower in the midfoot and rearfoot regions in elite sprinters, males in particular, than in recreational runners (P < .05) (Table 4).
Table 3.
Relative Load of the Forefoot, Midfoot, and Rearfoot Regions During Static Standing.
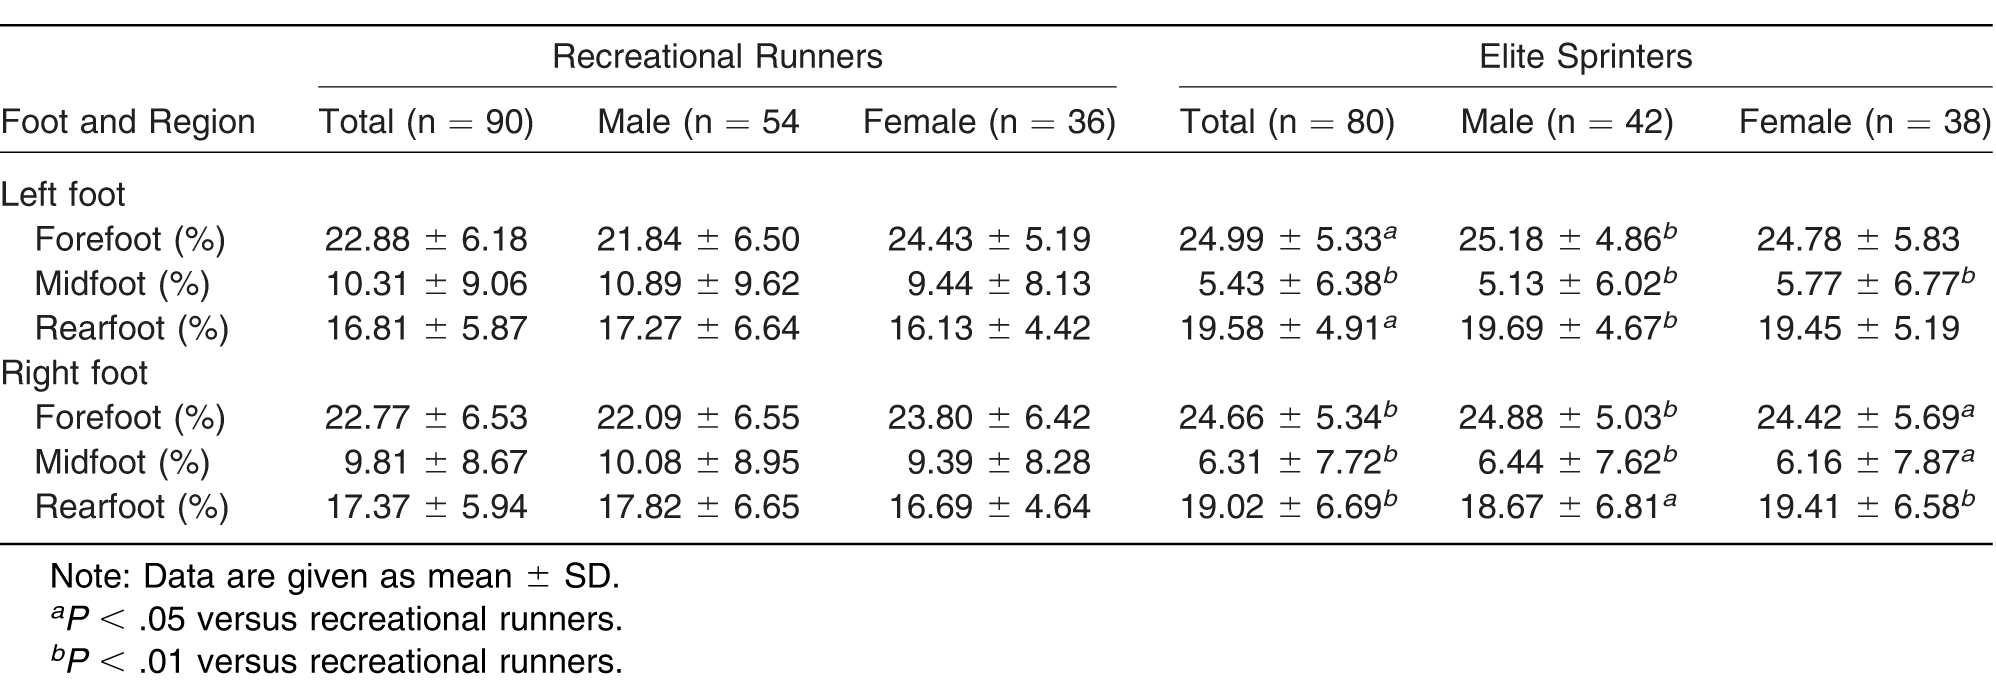
Table 4.
Relative Load of the Forefoot, Midfoot, and Rearfoot Regions During the Midstance Phase of Walking.
PPDs of the Six Subregions
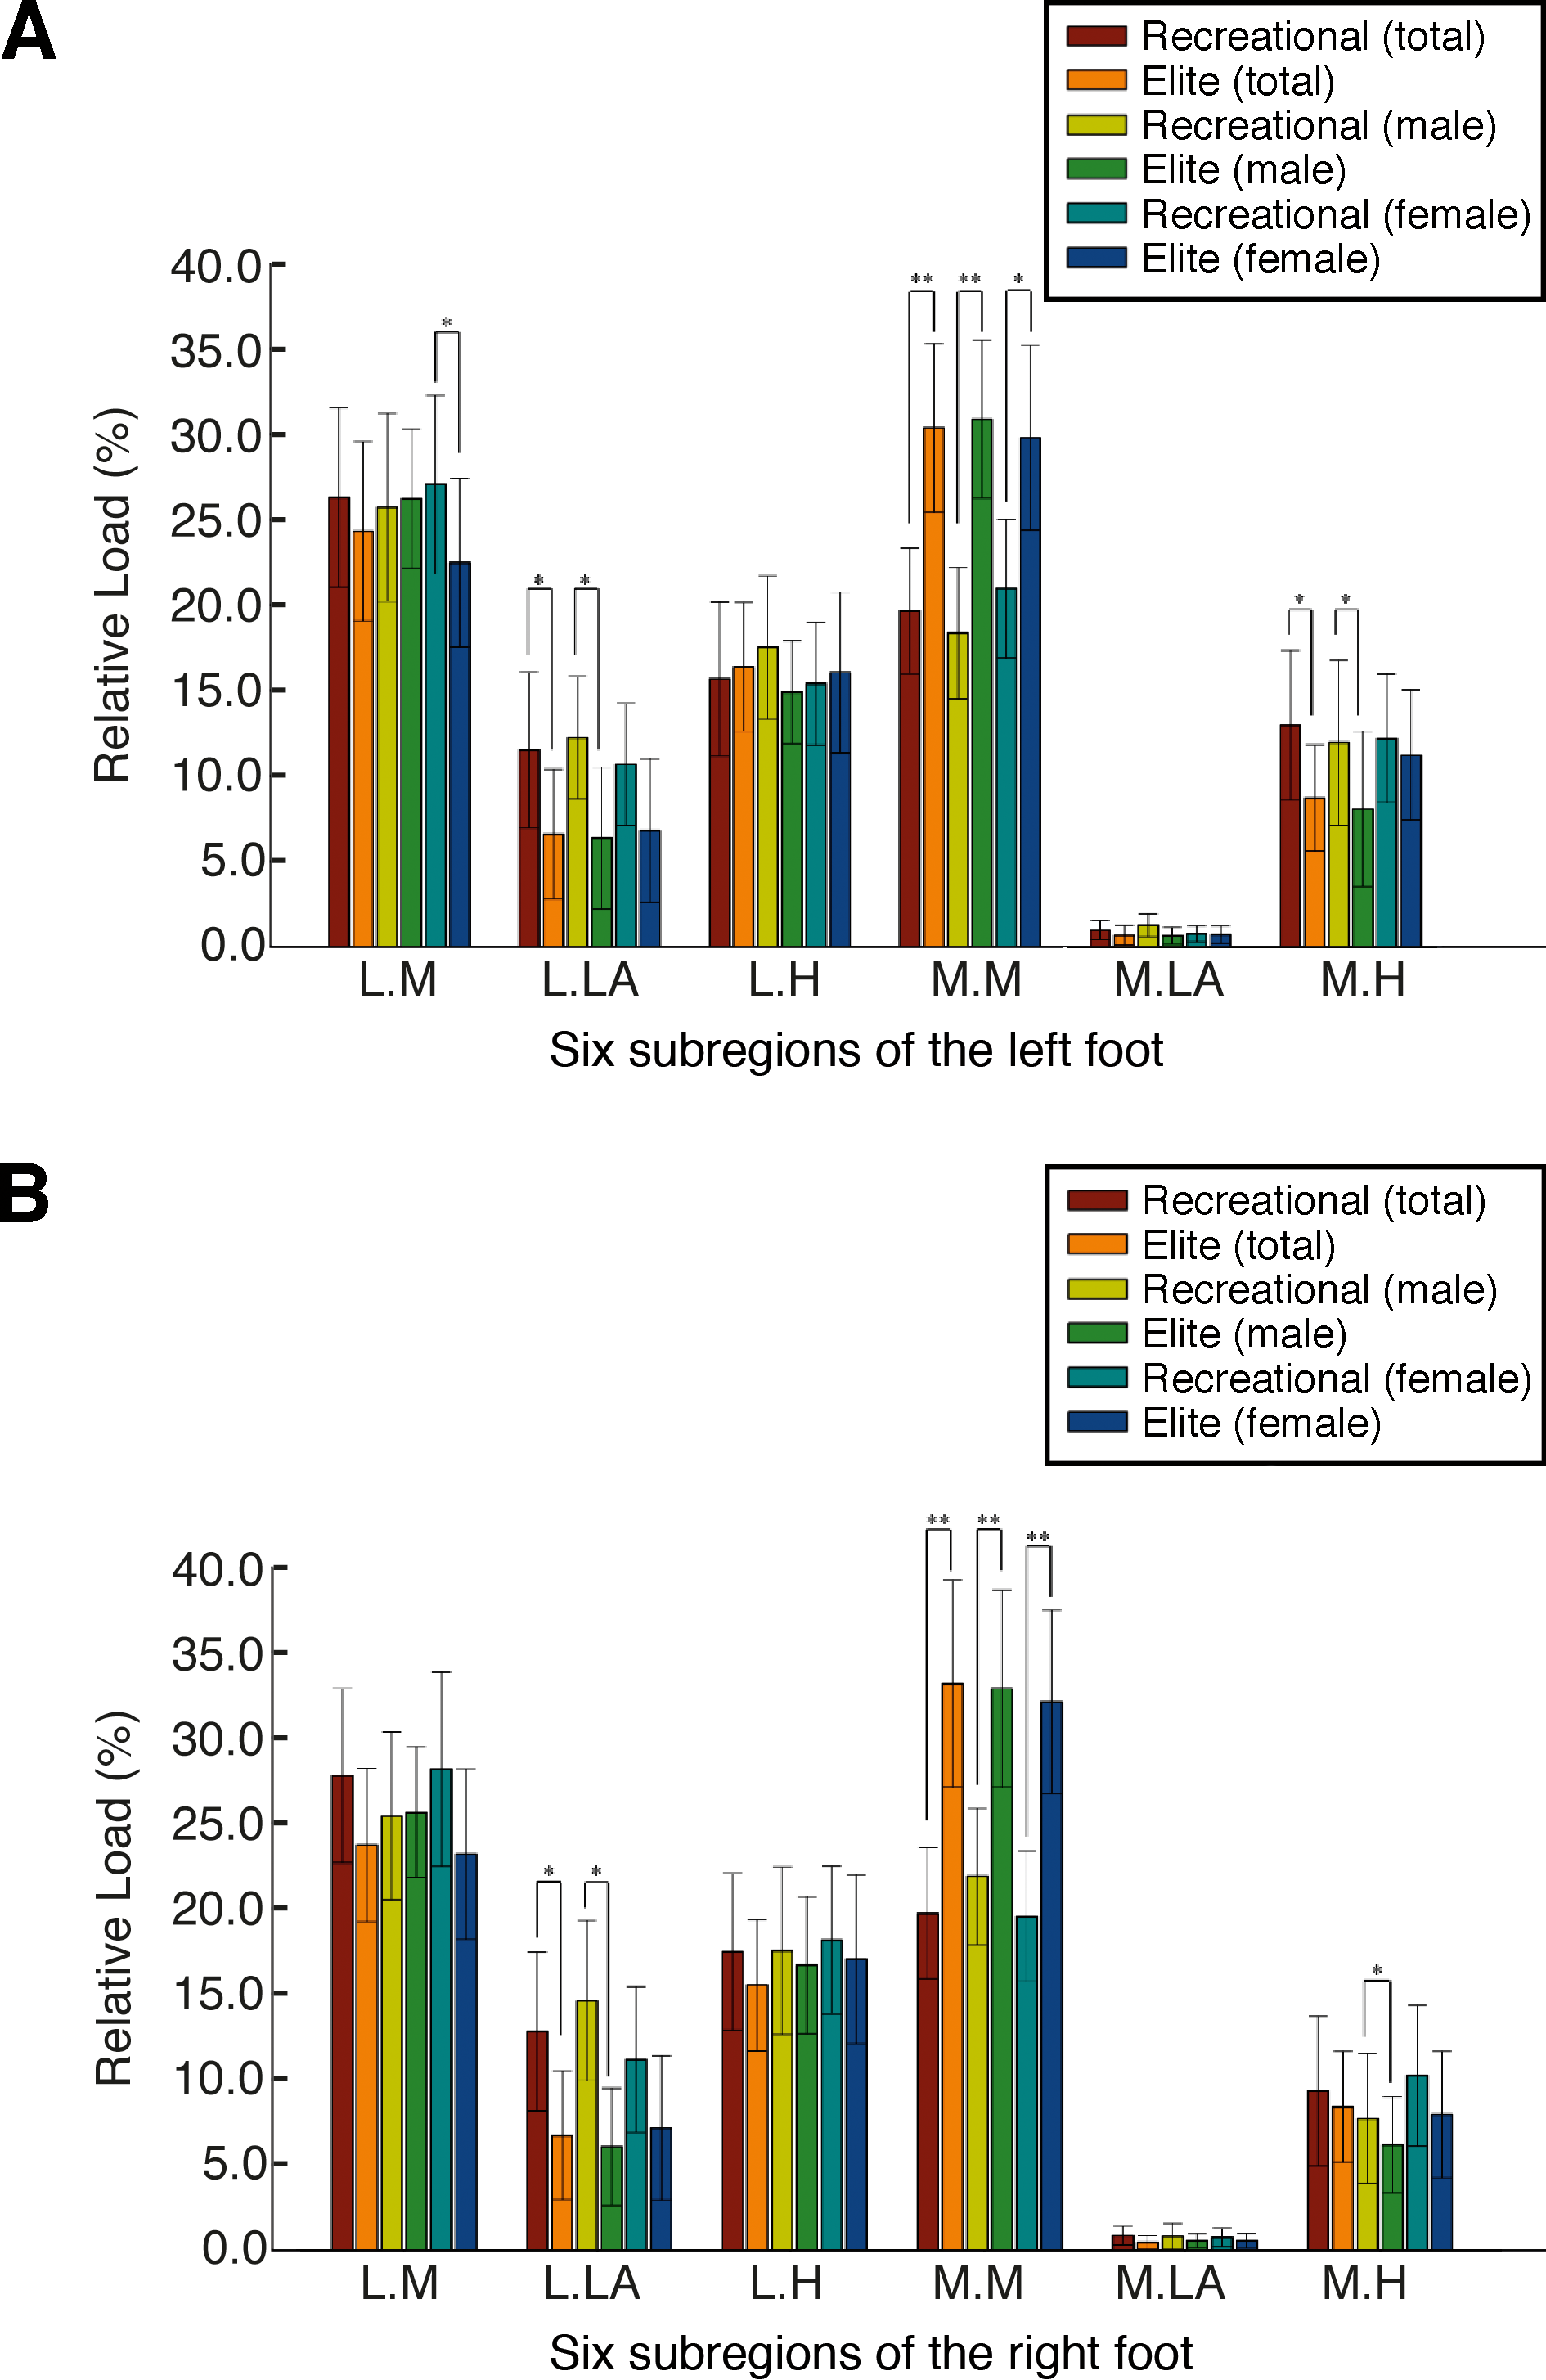
The relative loads at the six distinct subregions were derived from the data from the three equal regions. During static standing, the relative load in the forefoot region of both feet in elite sprinters was higher at the medial metatarsal bone than in recreational runners (P < .05). In the midfoot region, the relative load at the lateral longitudinal arch of both feet was significantly lower in elite sprinters compared with recreational runners (P < .01). The mean ± SD relative load at the MLA of both feet was found to be significantly lower in elite sprinters, males in particular (left foot: 1.45% ± 0.63%; right foot: 0.79% ± 0.56%), than in recreational runners (left foot: 1.80% ± 0.81%; right foot: 1.67% ± 1.00%) (P < .01). In the rearfoot region, the mean ± SD relative load at the lateral heel of both feet was higher in elite sprinters, males in particular (left foot: 21.95% ± 3.88%; right foot: 24.13% ± 4.28%), than in recreational runners (left foot: 16.19% ± 5.10%; right foot: 17.10% ± 4.97%) (P < .05). In addition, the mean ± SD relative load at the medial heel of both feet was significantly lower in elite sprinters, males in particular (left foot: 17.42% ± 4.30%; right foot: 13.21% ± 3.81%), than in recreational runners (left foot: 18.35% ± 7.79%; right foot: 18.55% ± 7.97%) (P < .01) (Fig. 3). The results from the midstance phase of walking showed that the mean ± SD relative load in the forefoot region of both feet was exerted more on the medial metatarsal bone in elite sprinters, males in particular (left foot: 35.45% ± 5.31%; right foot: 37.34% ± 6.56%), compared with recreational runners (left foot: 21.08% ± 4.41%; right foot: 24.86% ± 4.54%) (P < .01). Nonetheless, the relative load at the lateral longitudinal arch and the medial heel of both feet was lower in elite sprinters, males in particular, compared with recreational runners (P < .05) (Fig. 4).
Figure 3.
Plantar pressure distributions of the six subregions of the left (A) and right (B) feet in static standing. *P < .05 and **P < .01 are significantly different between elite sprinters and recreational runners by the independent-samples t test. LH, lateral heel; LLA, lateral longitudinal arch; LM lateral metatarsal bone; MH, medial heel; MLA, medial longitudinal arch; and MM, medial metatarsal bone.
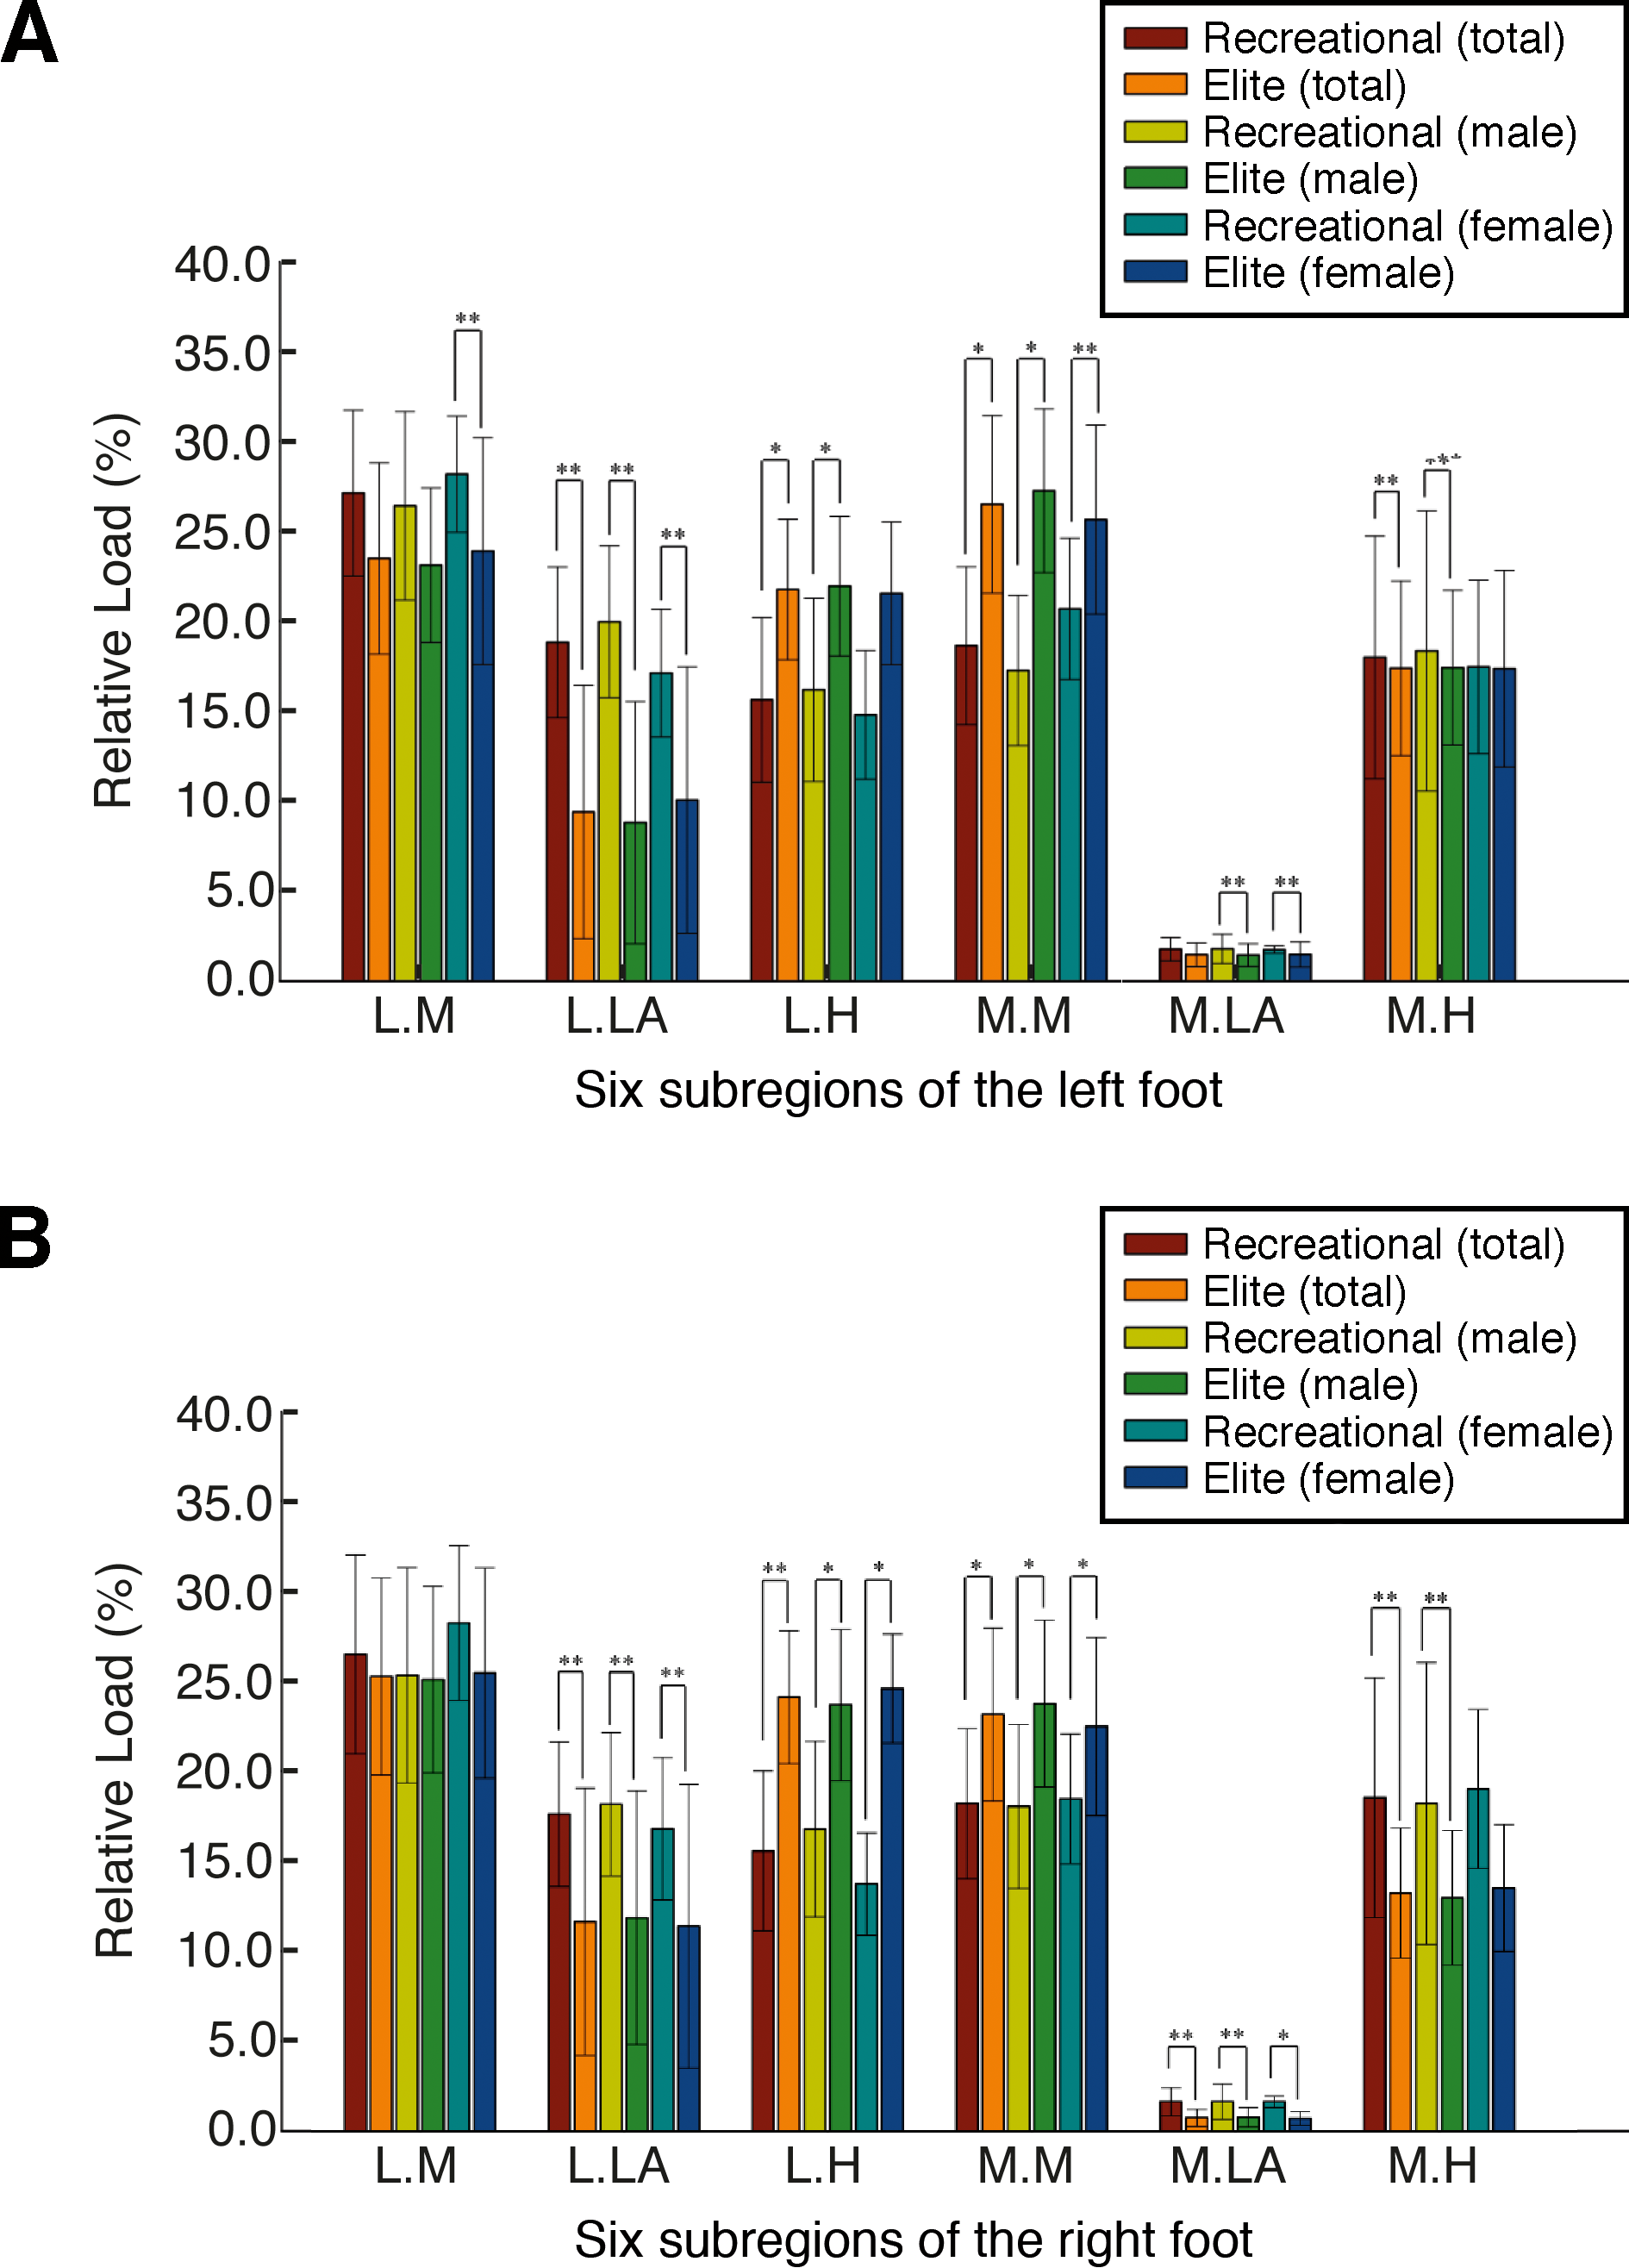
Figure 4.
Plantar pressure distributions of the six subregions of the left (A) and right (B) feet during the midstance phase of walking. *P < .05 and **P < .01 are significantly different between elite sprinters and recreational runners by the independent-samples t test. LH, lateral heel; LLA, lateral longitudinal arch; LM lateral metatarsal bone; MH, medial heel; MLA, medial longitudinal arch; and MM, medial metatarsal bone.
Footprint Characteristics
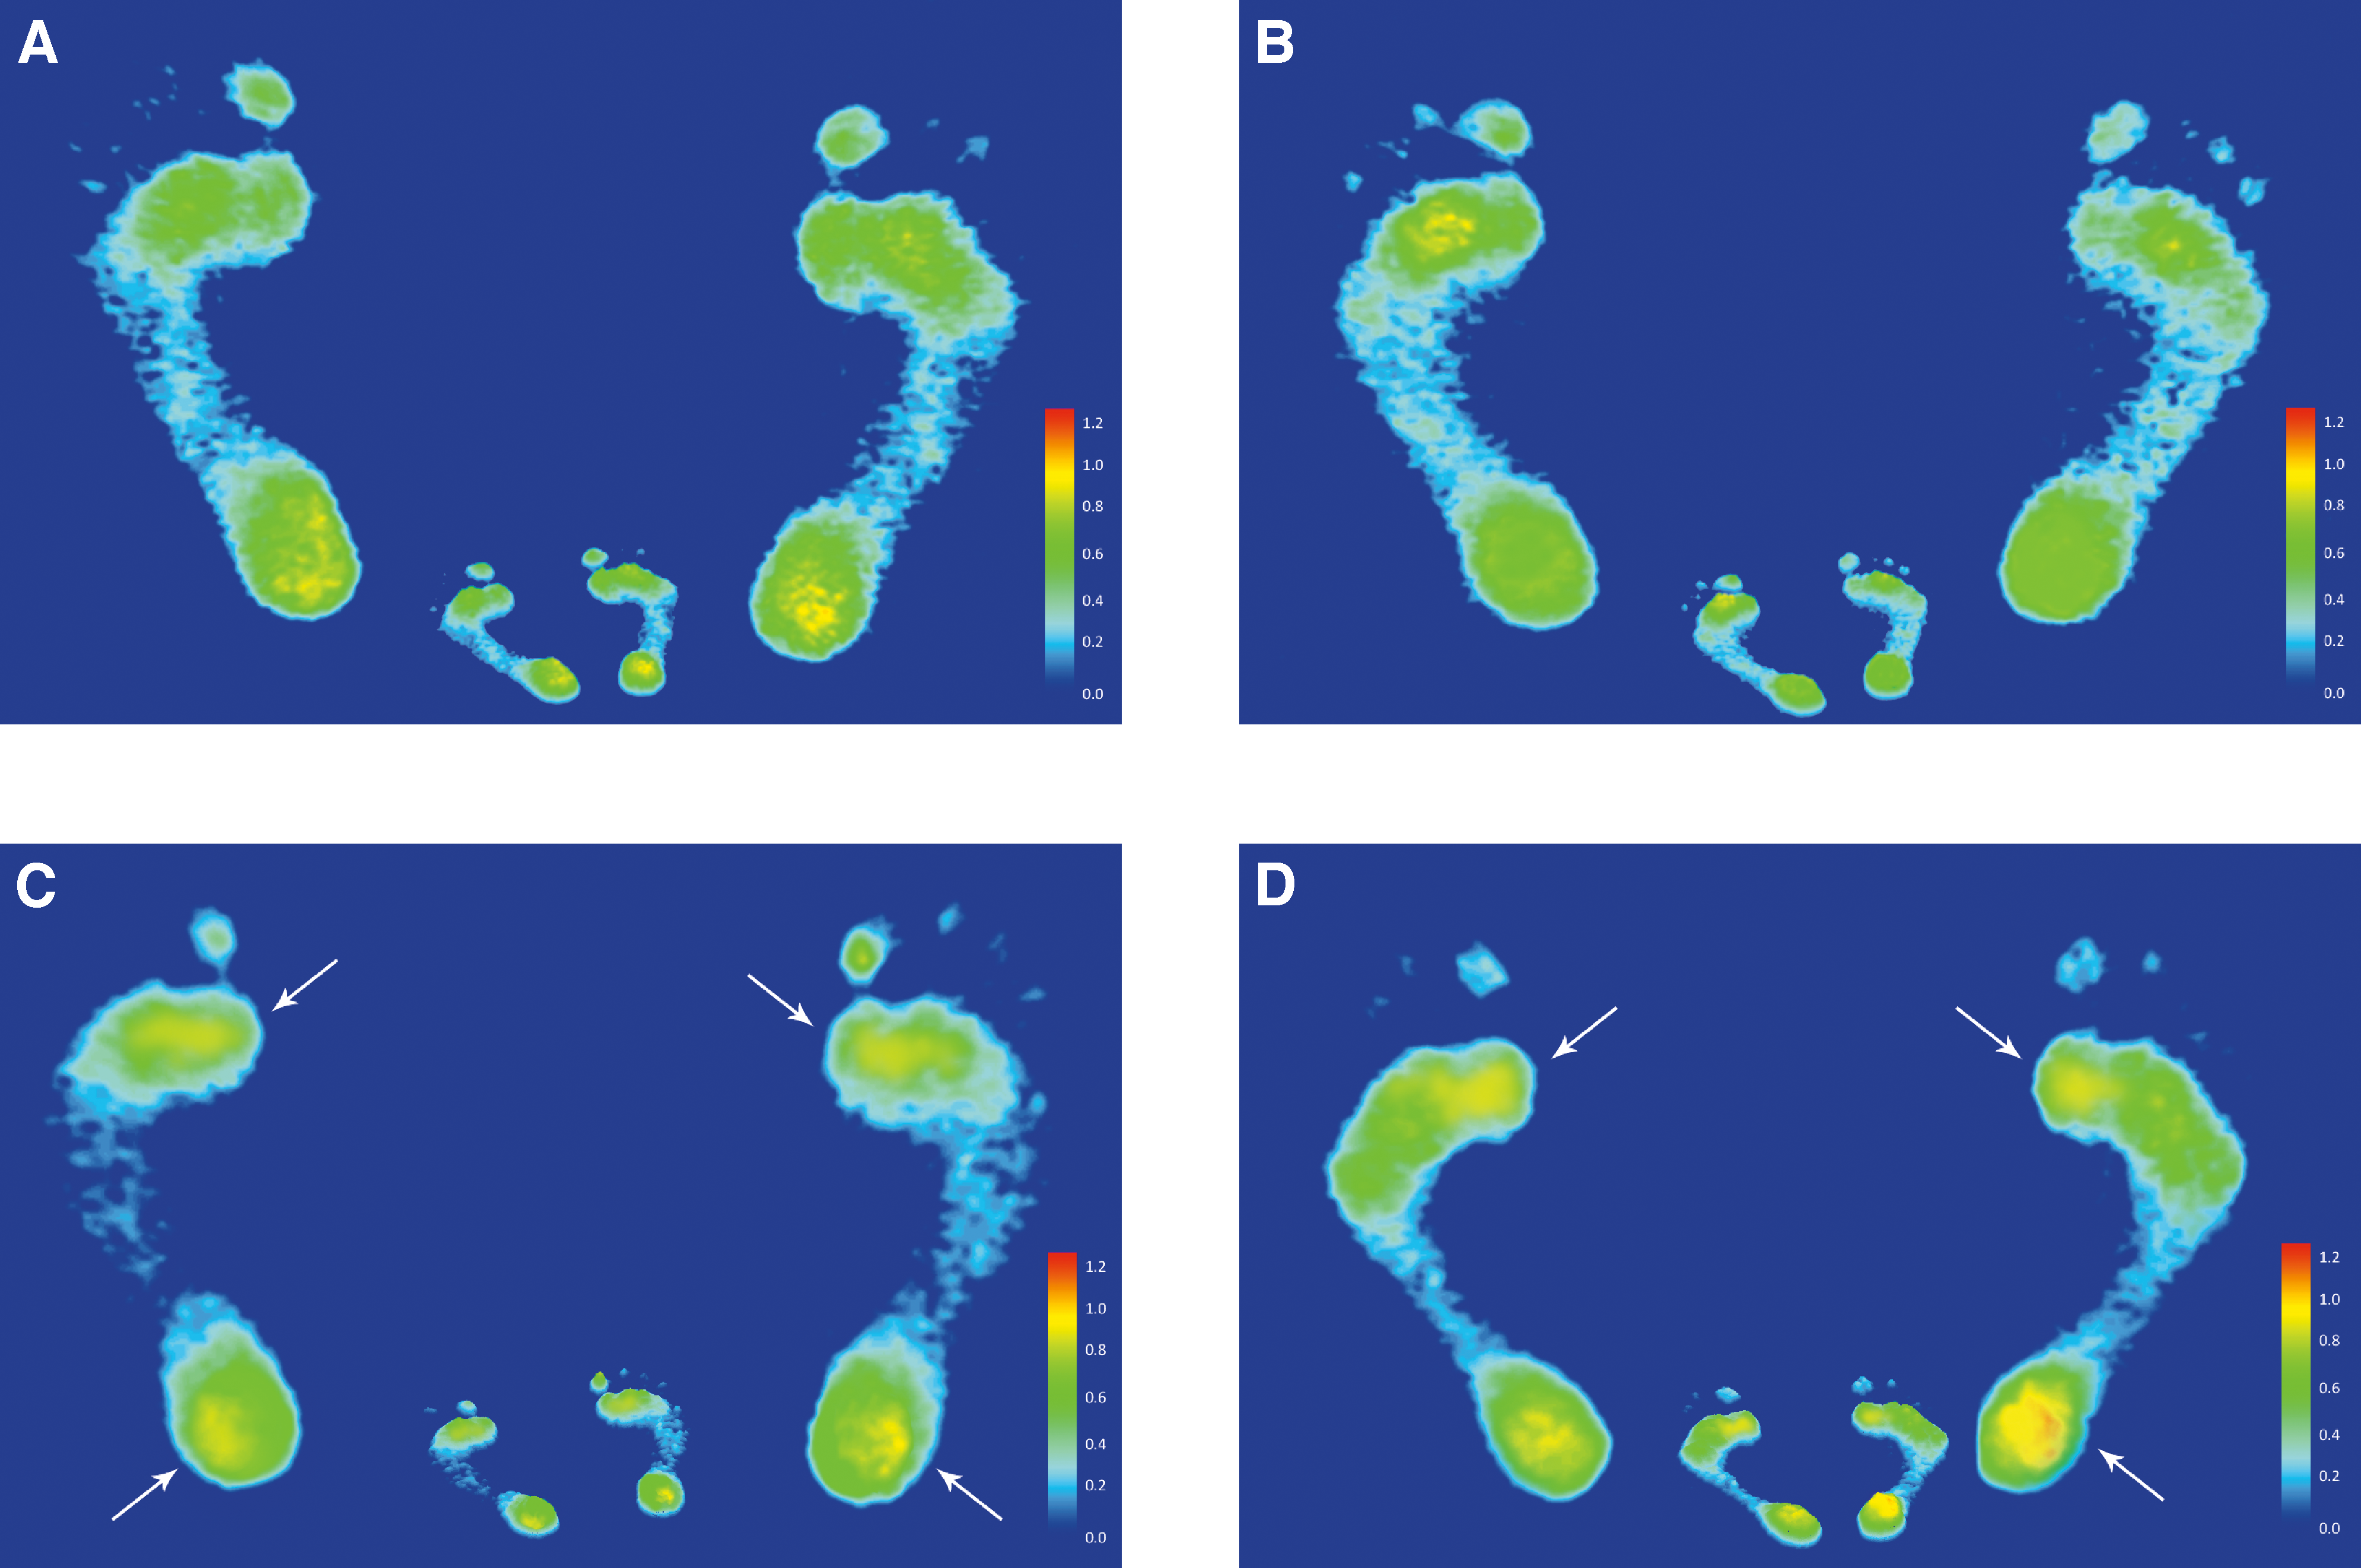
The static footprints of elite sprinters showed lower pressure profiles in the midfoot region of both feet and higher pressure profiles in the forefoot and rearfoot regions of both feet compared with recreational runners (Fig. 5). To a certain extent, these findings indicate that the arch type was higher in elite sprinters than in recreational runners.
Figure 5.
Static footprints of both feet from a male recreational runner (A), a female recreational runner (B), a male elite sprinter (C), and a female elite sprinter (D). White arrows indicate higher pressure areas.
Pain Assessment and Self-Reported Health Status of the Participants
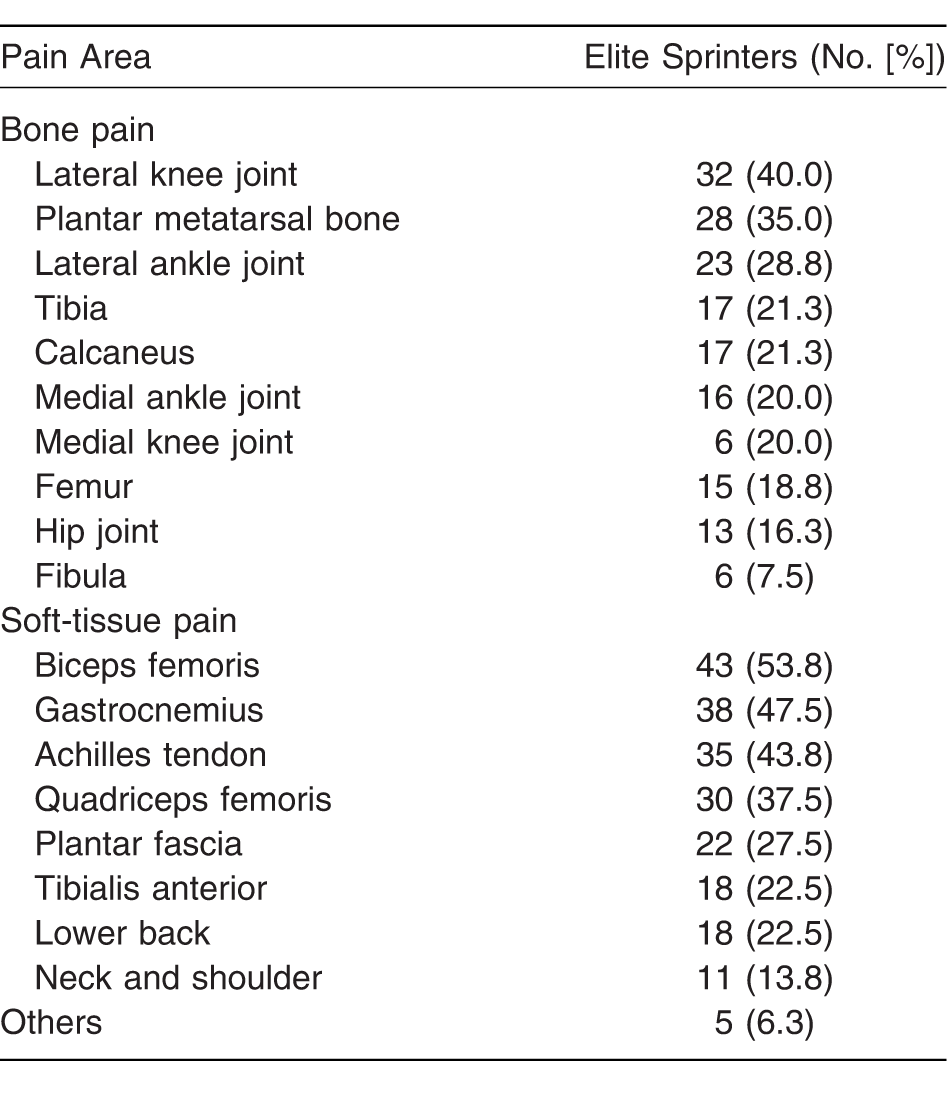
According to findings from the elite sprinters' pain assessment and self-reported health status, the ten most common pain areas are the lateral knee joint (40.0%); the plantar metatarsal bone, particularly the first to the third metatarsal heads (35.0%); the lateral ankle joint (28.8%); the tibia (21.3%); the calcaneus (21.3%); the medial ankle joint (20.0%); the medial knee joint (20.0%); the femur (18.8%); the hip joint (16.3%); and the fibula (7.5%) (Table 5). The eight most common sites of soft-tissue pain were the biceps femoris (53.8%), the gastrocnemius (47.5%), the Achilles tendon (43.8%), the quadriceps femoris (37.5%), the plantar fascia (27.5%), the tibialis anterior (22.5%), the lower back (22.5%), and the neck and shoulder (13.8%).
Table 5.
Pain Assessment and Self-Reported Health Status in the 80 Elite Sprinters.
Discussion
The purpose of this study was to examine the differences in plantar pressure characteristics between elite sprinters and recreational runners during static standing and walking. The static AI values of both feet were considerably close to each other within the respective groups. The AI of both feet was lower in elite sprinters than in recreational runners. According to previous studies, the AI of the footprints could be considered a predictor of arch height,[11-16] and normal AI values ranged from 0.21 to 0.26.[13] On this basis, male recreational runners' foot arches could be classified into the normal range, whereas female recreational runners may be categorized as high-arched foot. Differences within the recreational runners group could be attributed to sex and BMI. As evidenced in many studies, arch types are usually considered to correlate with sex.[44] Body weight is also thought to be a key cause of flatfoot.[12] Similar to these assertions, other researchers agree that age, sex, and BMI function as influential determinants of the AI.[14,45,46] Furthermore, male and female elite sprinters generally fell into the high arch type. It is well-known that a high-arched individual with increased height of the MLA often experiences a supinated foot and decreased pronation during the stance phase.[42] An oversupinated foot was defined as increased calcaneal inversion and may provide an advantage in reducing contact time when running.[47] Hasegawa et al[47] indicated that runners who had the greatest degree of heel inversion at foot strike also had the shortest contact time. A shorter contact time and a higher frequency of inversion at foot contact might contribute to higher running economy.[47] Therefore, deformation of foot arches seemed to be crucial for force transfer and shock absorption, especially in impact sports, such as jump and sprint.[48]
The three regional PPDs were found to be consistent with the AI. During static standing, the relative load in the midfoot region of both feet in elite sprinters was smaller than that in recreational runners. In addition, the regional plantar loading of elite sprinters, particularly in males, was mainly concentrated in the forefoot and rearfoot regions of both feet. During the midstance phase of walking, the relative load of both feet in elite sprinters was generally concentrated more in the forefoot region and less in the midfoot and rearfoot regions. The results tended to coincide with previous studies that verified that the young male runners' peak plantar pressure, associated with the related impulse, was lower in the midfoot region but higher in the forefoot region after a 30-min intense run.[29] The studies by Willems et al[36] went further, arguing that after a long-distance fatiguing run, runners' plantar pressure was found to be concentrated in the forefoot and inside of the foot. Stolwijk et al[39] maintained that after long-distance walking, plantar pressure was mainly concentrated at the inside of the toes and heels. Based on the studies by Fourchet et al,[40] when jogging, the relative load increased under the medial and central forefoot regions but decreased under the lesser toes.
Findings from the six distinct subregional PPDs can be summarized as follows: During static standing, the plantar loadings in elite sprinters, particularly males, were mainly exerted on the medial metatarsal bone and the lateral heel of both feet. Yet, they were found to be relatively low on the medial and lateral longitudinal arches of both feet. Furthermore, during the midstance phase of walking, the elite sprinters' plantar loadings were mainly transferred to the medial metatarsal bone and decreased at the lateral longitudinal arch and the medial heel of both feet. These findings seem to be consistent with those from previous studies. As many studies have pointed out, peak plantar pressure and the related impulse in runners were generally concentrated more at the metatarsal and less at the lateral regions of the toes.[41] Keller et al[49] maintained that the plantar pressures on the toes and heel increased when walking at a higher speed (>80 m·min–1). Ho et al[50] went further, stressing that the plantar pressures on the heel, medial and central metatarsals, and toes were significantly higher when walking speed increased from 57 m·min–1 to 80 m·min–1. In addition, higher peak forces usually occur underneath the second and third metatarsals, particularly after a fatiguing race.[36] Bisiaux and Moretto[29] observed significant decreases in peak pressure and relative impulse under the medial heel 30 min after a fatiguing run. Moreover, people with high arches tend to experience oversupination, and this results not only in a decrease in pronation throughout the stance phase but also in an increase in supination in the forefoot and rearfoot regions of the foot during exercise.[42] Therefore, plantar pressure and the integration of pressure over time are usually higher in the metatarsal and calcaneal regions. This could lead to a high risk of injury on the lateral sides of the knee and ankle joints.[9]
Plantar pressure and impact forces on the foot have been widely accepted as one of the main causes of running injuries.[9,10] In the present study, the common bony pains in elite sprinters were at the lateral knee joint, the first to the third metatarsal heads, the lateral ankle joint, the tibia, and the calcaneus. Soft-tissue pain occurred most frequently in the biceps femoris, the gastrocnemius, the Achilles tendon, and the quadriceps femoris. The results seemed to be consistent with previous studies that revealed that high-arched runners were more likely to experience bone injuries on the lateral portion of the lower extremity and injuries at the foot.[9,17] Molgaard et al[51] maintained that high-arched runners had a high probability of ankle injuries, heel pains, and stress fractures. These injuries may be the result of runners' high-arched feet moving with a stiffer lower extremity and higher loading rates during running.[17] Moreover, compared with low-arched runners, high-arched runners tend to have a lower eversion-to-tibial internal rotation ratio, which could be viewed as the main cause of placing more stress on the knee secondary to a relative increase in transverse plane motion of the tibia.[52] Therefore, high-arched individuals are prone to tibial and femoral stress fractures.[9] In addition, findings from the present research are in agreement with those from previous studies that verified that high peak forces considerably increased underneath the second and third metatarsals after a fatiguing race[36] and that loading decreased at the medial heel[29] and the lateral toes[41] in running. However, the pressure profiles seemed to correspond to those from previous studies that revealed that runners with PFPS exerted a significantly higher vertical peak force underneath the lateral heel and the second and third metatarsals during running.[33-36] The pressure exerted on the forefoot region may cause Achilles tendonitis,[36] whereas the pressure exerted on the medial side of the pronated foot was found to be the main reason for a runner's heel eversion. This may stress the medial structure of the knee[9] and result in anterior knee pain and tibialis anterior pain.[36] Runners' calcaneal valgus in the stance phase of the gait cycle makes them likely to have fatigued calf muscles, such as fatigued gastrocnemius and fatigued soleus, and this may make their ankles and feet unstable.[53]
This study was limited by its focus on the plantar pressure characteristics of 80 elite sprinters and 90 recreational runners aged 17 to 21 years who were college and university students in Taiwan. It is inevitable that the results of the small subset of participants in this research limit the possibilities for generalization. However, little research is currently being undertaken to examine the plantar loading characteristics of healthy people[43] and runners by focusing exclusively on static standing. It is anticipated that the findings from this study may shed light on the static pressure profiles and pain profiles of college elite sprinters, particularly in Taiwan. Thus, it is expected that the results of the present research, associated with the literature on dynamic states discussed in this study, will contribute to illuminating the issues of the possible correlation between pressure profiles and pain profiles.
To conclude, it seems that the AI and plantar loading characteristics in elite sprinters in the present study were generally classified as high-arched feet and that their PPD was categorized into the features of the calcaneal valgus (pronated foot) of runners and the calcaneal varus (supinated foot) of high-arched runners. These findings also corresponded to the pressure profiles of runners with PFPS. The results of the pain assessment and self-reported health status revealed that the lateral knee joint and biceps femoris were the most common sites of musculoskeletal pain in elite sprinters. The results were also consistent with the symptoms in high-arched runners. Although many studies have stressed the link between PFPS and running,[33-38,54] there is limited information about whether there are strong relationships between PFPS and high arches. However, the findings from this research reflect the possible link between high arches and PFPS. Therefore, the correlation between high-arched runners and PFPS development warrants further study.
Funding
This work was supported by grant NSC 101-2622-H-129-001-CC3 from the Ministry of Science and Technology, Taipei, Taiwan.
References
- Cavanagh PR.Rodgers MM.Iiboshi A.Pressure distribution under symptom-free feet during barefoot standing. Foot Ankle7: 262, 1987.
- Ferber R.Hreljac A.Kendall KD.Suspected mechanisms in the cause of overuse running injuries: a clinical review. Sports Health1: 242, 2009.
- Eckenrode BJ.Stackhouse SK.Improved pressure pain thresholds and function following noxious electrical stimulation on a runner with chronic Achilles tendinopathy: a case report. Int J Sports Phys Ther10: 354, 2015.
- Knobloch K.Yoon U.Vogt PM.Acute and overuse injuries correlated to hours of training in master running athletes. Foot Ankle Int29: 671, 2008.
- Simkin A.Leichter I.Giladi M.et al: Combined effect of foot arch structure and an orthotic device on stress fractures. Foot Ankle10: 25, 1989.
- Kaye RA.Jahss MH.Tibialis posterior: a review of anatomy and biomechanics in relation to support of the medial longitudinal arch. Foot Ankle11: 244, 1991.
- Razeghi M.Batt ME.Foot type classification: a critical review of current methods. Gait Posture15: 282, 2002.
- Butts JF.Gebke KB.Getting injured runners back on track. J Fam Pract60: 646, 2011.
- Williams DSIII, McClay IS.Hamill J.Arch structure and injury patterns in runners. Clin Biomech16: 341, 2001.
- Dahle LK.Mueller M.Delitto A.et al: Visual assessment of foot type and relationship of foot type to lower extremity injury. J Orthop Sports Phys Ther14: 70, 1991.
- McCrory JL.Young MJ.Boulton AJM.et al: Arch index as a predictor of arch height. The Foot7: 79, 1997.
- Mickle KJ.Steele JR.Munro BJ.The feet of overweight and obese young children: are they flat or fat?Obesity14: 1949, 2006.
- Cavanagh PR.Rodgers MM.The arch index: a useful measure from footprints. J Biomech20: 547, 1987.
- Wearing SC.Hills AP.Byrne NM.et al: The arch index: a measure of flat or fat feet?Foot Ankle Int25: 575, 2004.
- Williams DS.McClay IS.Measurements used to characterize the foot and the medial longitudinal arch: reliability and validity. Phys Ther80: 864, 2000.
- Chu WC.Lee SH.Chu W.et al: The use of arch index to characterize arch height: a digital image processing approach. IEEE Trans Biomed Eng42: 1088, 1995.
- Williams DSIII, Tierney RN.Butler RJ.Increased medial longitudinal arch mobility, lower extremity kinematics, and ground reaction forces in high-arched runners. J Athl Train49: 290, 2014.
- Cousins SD.Morrison SC.Drechsler WI.The reliability of plantar pressure assessment during barefoot level walking in children aged 7-11 years. J Foot Ankle Res5: 8, 2012.
- Orlin MN.McPoil TG.Plantar pressure assessment. Phys Ther80: 399, 2000.
- Wafai L.Zayegh A.Woulfe J.et al: Identification of foot pathologies based on plantar pressure asymmetry. Sensors15: 20392, 2015.
- Stavlas P.Grivas TB.Michas C.et al: The evolution of foot morphology in children between 6 and 17 years of age: a cross-sectional study based on footprints in a Mediterranean population. J Foot Ankle Surg44: 424, 2005.
- Franettovich MM.McPoil TG.Russell T.et al: The ability to predict dynamic foot posture from static measurements. JAPMA97: 115, 2007.
- Imhauser CW.Siegler S.Abidi NA.et al: The effect of posterior tibialis tendon dysfunction on the plantar pressure characteristics and the kinematics of the arch and hindfoot. Clin Biomech19: 161, 2006.
- Jonely H.Brismée JM.Sizer PSJr, et al: Relationships between clinical measures of static foot posture and plantar pressure during static standing and walking. Clin Biomech26: 873, 2011.
- Minns RJ.Craxford AD.Pressure under the forefoot in rheumatoid arthritis: a comparison of static and dynamic methods of assessment. Clin Orthop Relat Res187: 235, 1984.
- Menz HB.Munteanu SE.Zammit GV.et al: Foot structure and function in older people with radiographic osteoarthritis of the medial midfoot. Osteoarthritis Cartilage18: 317, 2010.
- Kaufman KR.Brodine SK.Shaffer RA.et al: The effect of foot structure and range of motion on musculoskeletal overuse injuries. Am J Sports Med27: 585, 1999.
- Sneyers CJ.Lysens R.Feys H.et al: Influence of malalignment of feet on the plantar pressure pattern in running. Foot Ankle Int16: 624, 1995.
- Bisiaux M.Moretto P.The effects of fatigue on plantar pressure distribution in walking. Gait Posture28: 693, 2008.
- Escamilla-Martínez E.Martínez-Nova A.Gómez-Martín B.et al: The effect of moderate running on foot posture index and plantar pressure distribution in male recreational runners. JAPMA103:121, 2013.
- Krauss I.Grau S.Mauch M.et al: Sex-related differences in foot shape. Ergonomics51: 1693, 2008.
- Zifchock RA.Davis I.Hillstrom H.et al: The effect of gender, age, and lateral dominance on arch height and arch stiffness. Foot Ankle Int27: 367, 2006.
- Willson JD.Ellis ED.Kernozek TW.Plantar loading characteristics during walking in females with and without patellofemoral pain. JAPMA105: 1, 2015.
- Thijs Y.Van Tiggelen D.Roosen P.et al: A prospective study on gait-related intrinsic risk factors for patellofemoral pain. Clin J Sport Med17: 437, 2007.
- Thijs Y.De Clercq D.Roosen P.et al: Gait-related intrinsic risk factors for patellofemoral pain in novice recreational runners. Br J Sports Med42: 466, 2008.
- Willems TM.De Ridder R.Roosen P.The effect of a long-distance run on plantar pressure distribution during running. Gait Posture35: 405, 2012.
- Willy RW.Manal KT.Witvrouw EEet al: Are mechanics different between male and female runners with patellofemoral pain?Med Sci Sports Exerc44: 2165, 2012.
- Lenhart RL.Thelen DG.Wille CM.et al: Increasing running step rate reduces patellofemoral joint forces. Med Sci Sports Exerc46: 557, 2014.
- Stolwijk NM.Duysens J.Louwerens JW.et al: Plantar pressure changes after long-distance walking. Med Sci Sports Exerc42: 2264, 2010.
- Fourchet F.Kelly L.Horobeanu C.et al: Comparison of plantar pressure distribution in adolescent runners at low vs. high running velocity. Gait Posture35: 685, 2012.
- Nagel A.Fernholz F.Kibele C.et al: Long distance running increases plantar pressures beneath the metatarsal heads: a barefoot walking investigation of 200 marathon runners. Gait Posture27: 152, 2008.
- Nigg BM.Cole GK.Nachbauer W.Effects of arch height of the foot on angular motion of the lower extremities in running. J Biomech26: 909, 1993.
- Pomarino D.Pomarino A.Plantar static pressure distribution in healthy individuals: percentiles for the evaluation of forefoot loading. Foot Ankle Spec7: 293, 2014.
- Gilmour JC.Burns Y.The measurement of the medial longitudinal arch in children. Foot Ankle Int22: 493, 2001.
- Volpon JB.Footprint analysis during the growth period. J Pediatr Orthop14: 83, 1994.
- Chang JH.Wang SH.Kuo CL.et al: Prevalence of flexible flatfoot in Taiwanese school-aged children in relation to obesity, gender, and age. Eur J Pediatr169: 447, 2010.
- Hasegawa H.Yamauchi T.Kraemer WJ.Foot strike patterns of runners at the 15-km point during an elite-level half marathon. J Strength Cond Res21: 888, 2007.
- Chang YW.Hung W.Wu HW.et al: Measurements of foot arch in standing, level walking, vertical jump and sprint start. Int J Sports Med2: 35, 2010.
- Keller TS.Weisberger AM.Ray JL.et al: Relationship between vertical ground reaction force and speed during walking, slow jogging, and running. Clin Biomech11: 253, 1996.
- Ho IJ.Hou YY.Yang CH.et al: Comparison of plantar pressure distribution between different speed and incline during treadmill jogging. J Sports Sci Med9: 154, 2010.
- Mølgaard C.Lundbye-Christensen S.Simonsen O.High prevalence of foot problems in the Danish population: a survey of causes and associations. Foot20: 7, 2010.
- Nawoczenski DA.Cook TM.Saltzman CL.The effect of foot orthotics on three-dimensional kinematics of the leg and rearfoot during running. J Orthop Sports Phys Ther21: 317, 1995.
- Pohl MB.Rabbito M.Ferber R.The role of tibialis posterior fatigue on foot kinematics during walking. J Foot Ankle Res3: 6, 2010.
- Luedke LE.Heiderscheit BC.Williams DS.et al: Association of isometric strength of hip and knee muscles with injury risk in high school cross country runners. Int J Sports Phys Ther10: 868, 2015.
© 2018 American Podiatric Medical Association