


Abstract
Background: Podiatric physicians are increasingly using pedobarographs to measure plantar pressure. However, normal values of static pedobarographic variables for healthy men and women are lacking, which makes it difficult to evaluate abnormal foot positioning in standing patients with low- or high-arched feet or painful feet. Methods: During upright standing, a computerized pedobarograph measured the maximal (Pmax) and mean (Pmean) plantar pressures, total foot area, and forefoot and rearfoot areas in 84 healthy women and 84 healthy men, aged 18 to 83 years. After calibration of the pedobarograph, a correction factor was applied to area measurements, and data repeatability was assessed. Results: The Pmax and Pmean values were not correlated with age but with weight, body mass index, and shoe size. Total foot area was significantly higher in male participants and correlated with body weight, body mass index, and shoe size but not with age. In both sexes, forefoot area was significantly lower than rearfoot area. Significant positive correlations were observed between forefoot and rearfoot areas and weight and shoe size. The forefoot-rearfoot area ratio did not vary with sex, weight, shoe size, and age. Conclusions: These data provide relationships between Pmax, Pmean, and foot areas and weight and shoe size and clearly indicate no age dependence of pedobarographic data. They also provide stable values of the forefoot-rearfoot area ratio. These data should help clinicians evaluate abnormal foot placement in standing patients.
The sole of the foot constitutes the obligatory interface between our body and the ground surface when standing upright, walking, or running. During upright standing, the contact duration with the ground of the different sole portions is much longer than during walking. Thus, podiatric physicians usually choose to characterize the pattern of the sole of the foot placement in their patients when they stay upright.
Podiatric physicians and surgeons are increasingly using plantar pressure measurement technology in both clinical practice and research. Computerized pedobarographs are commonly used to measure the pressures and contact surfaces under static as well as dynamic conditions (walking). Normative data are essential for clinical practice to compare the values of the plantar pressures and areas of foot-to-ground contact of individual patients with those of healthy individuals with asymptomatic feet. However, the literature data mostly refer to measurements during walking. Normal reference range values for peak pressure, mean pressure, and pressure-time integral were obtained by using a two-step recording technique during walking by Quaney et al[1] in 21 individuals, by Bryant et al[2] in 31, by Maetzler et al[3] in 23 (14 females and nine males), and by Putti et al[4] in 53 (17 females and 36 males). Putti et al[5] also reported foot pressure differences between men and women. In static condition, Gravante et al[6] reported the normal values on the plantar support in 34 normal-weight young volunteers, but they did not report the effect of age or sex. Hills et al[7] and Birtane and Tuna[8] performed both static and dynamic pedobarographic evaluations in 35 and 25 nonobese individuals, respectively, and compared them with data obtained in obese patients to evaluate the effects of body mass index (BMI; calculated as weight in kilograms divided by height in meters squared). Imamura et al[9] reported pedobarometric data during both static and dynamic evaluations in 100 healthy adult men aged 20 to 49 years, but they did not examine the effects of age, and they focused their study on the differences between the dominant and nondominant sides in static plantar peak pressure evaluations at the forefoot and midfoot. Only Tanaka et al[10] reported data on age-related changes in postural control associated with the location of the center of gravity and foot pressure.
In the absence of sufficient data on normal values of static pedobarographic data at a wide range of ages, we collected data on 168 young students and the relatives of patients consulting at a school of podiatry and a private office to obtain normal values of foot sole pressures and areas related to the age, weight, and sex of healthy individuals.
Methods
Ethical Approval
This research adheres to the principles of the latest revision of the Declaration of Helsinki. Written informed consent was obtained from all of the participants, and the protocol was approved by the Institutional Ethics Committee of Aix-Marseille University (Marseille, France).
Participants
A total of 168 healthy white adults (84 women and 84 men; age range, 18–83 years) participated in the study. None were involved in an exercise training program. The participants were selected among the students and the relatives of patients being treated at the School of Podiatry (Marseille, France) and at a podiatric medical private practice. The inclusion criteria were a BMI of 18 to 25 kg/m2; the absence of any concerns about foot placement during walking and running; the absence of a history of foot, leg, and spine trauma; and a minimum age of 18 years. Clinical examination eliminated individuals with navicular drop and navicular drift. We used a podoscope to identify individuals with low- and high-arched feet so they could be excluded from the study population. The morphologic characteristics of the participants are shown in Table 1. Participants were grouped into five 10-year age brackets (18-27, 28-37, 38-47, 58-57, 58-67) with the remainder of participants aged 68-83 years in the sixth group, each one including 14 women and 14 men.
Table 1.
Characteristics of the Study Participants

Pedobarographic Measurements
All of the measurements were performed during upright standing in double-limb stance. During data collection, the participant stayed upright, the arms stretched alongside the trunk with the hands in the supinated position, the feet forming an open angle of 30°. Two computerized 530 × 600-mm stationary pedobarographic platforms (Win-Pod; Medicapteurs SA, Toulouse, France) were used. They were constituted by 2,304 (8 × 8 mm) resistive load cells, and the sampling frequency was 100 images.s−1. For each load cell the extreme pressure range was 0.4 to 100 N. The computer program gave measurements of the maximal plantar pressure (Pmax), mean plantar pressure (Pmean), mean plantar surface, and, for each foot, the forefoot and rearfoot areas and the forefoot-rearfoot area ratio. The software for the Wind-Pod platforms did not give absolute values of Pmax in different regions of the foot but only relative values expressed as a percentage of total pressure. We did not rely on these values because the resistive load cells of the Win-Pod platform measured contact areas only, with pressure values being further deduced by dividing the body weight by these areas. Thus, the computation of Pmax in different regions of the foot multiplies the calculation errors. The Pmax reported was the ratio of body weight by the total foot area, minimizing the calculation error. Moreover, the software clearly gave the location of the Pmax on the plantar surface.
Calibration of the Pedobarographic Platforms
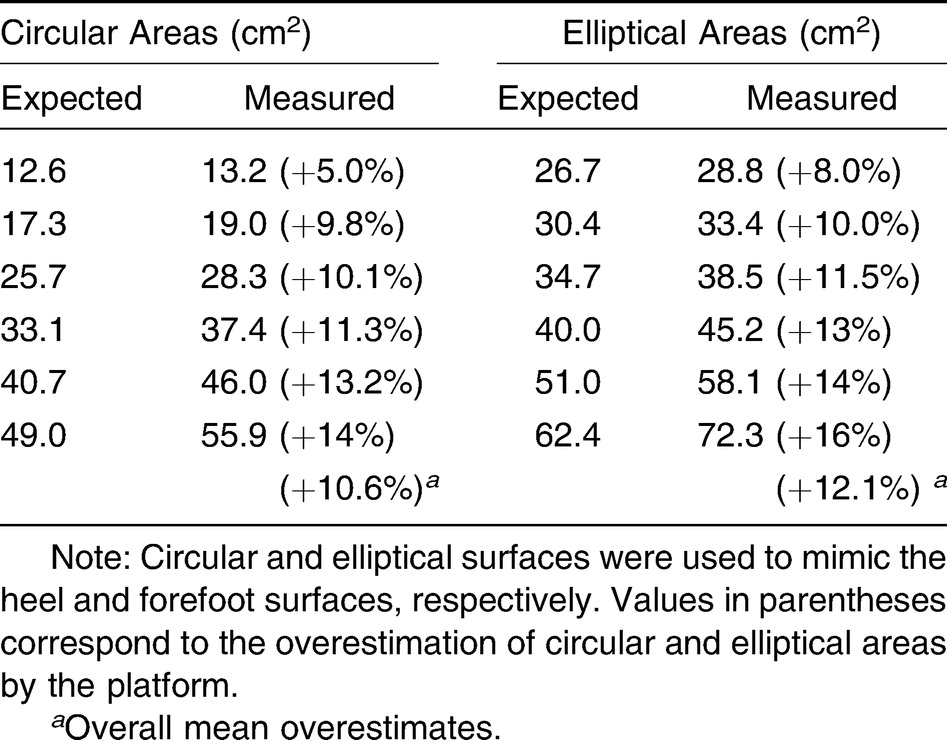
The computer program for the Win-Pod platforms did not allow us to control the calibration procedure. Thus, following the method of Giacomozzi,[11] who reported an overestimation of the sole of the foot surfaces and an underestimation of pressures by pedobarographs, we decided to calibrate each device using rigid circular and elliptical cardboard pieces mimicking the contact surfaces of the heel and the forefoot, respectively. Each one supported a 30-kg weight. Different cardboard surfaces were chosen considering the range of heel and forefoot surfaces measured in several participants. Each surface was measured with a digital planimeter (Table 2). For each of the two Win-Pod platforms used in the present study, the linear regression built between the true surfaces and those measured by the device gave a correction coefficient. Among the platforms, the foot areas were overestimated by 10% to 12% (Table 2), and this coefficient was used to correct both area and pressure data.
Table 2.
The Different Cardboard Areas Used to Calibrate Each Win-Pod Platform Supporting a 30-kg Weight
Repeatability of Measurements
Twenty individuals were chosen at random among the 168 participants. Twenty pedobarographic measurements were repeated in the static condition at the same time (before lunch) on each of 10 days. The variation coefficient (SD/mean) of plantar surface measurements was 0.03.
Statistical Analyses
Data are presented as mean (SEM). The normal distribution of the variables was verified with the Kolmogorov-Smirnov test. Least squares regressions with 95% confidence intervals were computed between each variable and the participant's age, BMI, weight, and shoe size. Analysis of variance was used to compare the mean values of data measured in women and men. Significance was accepted at P < .05.
Results
Pmax and Pmean
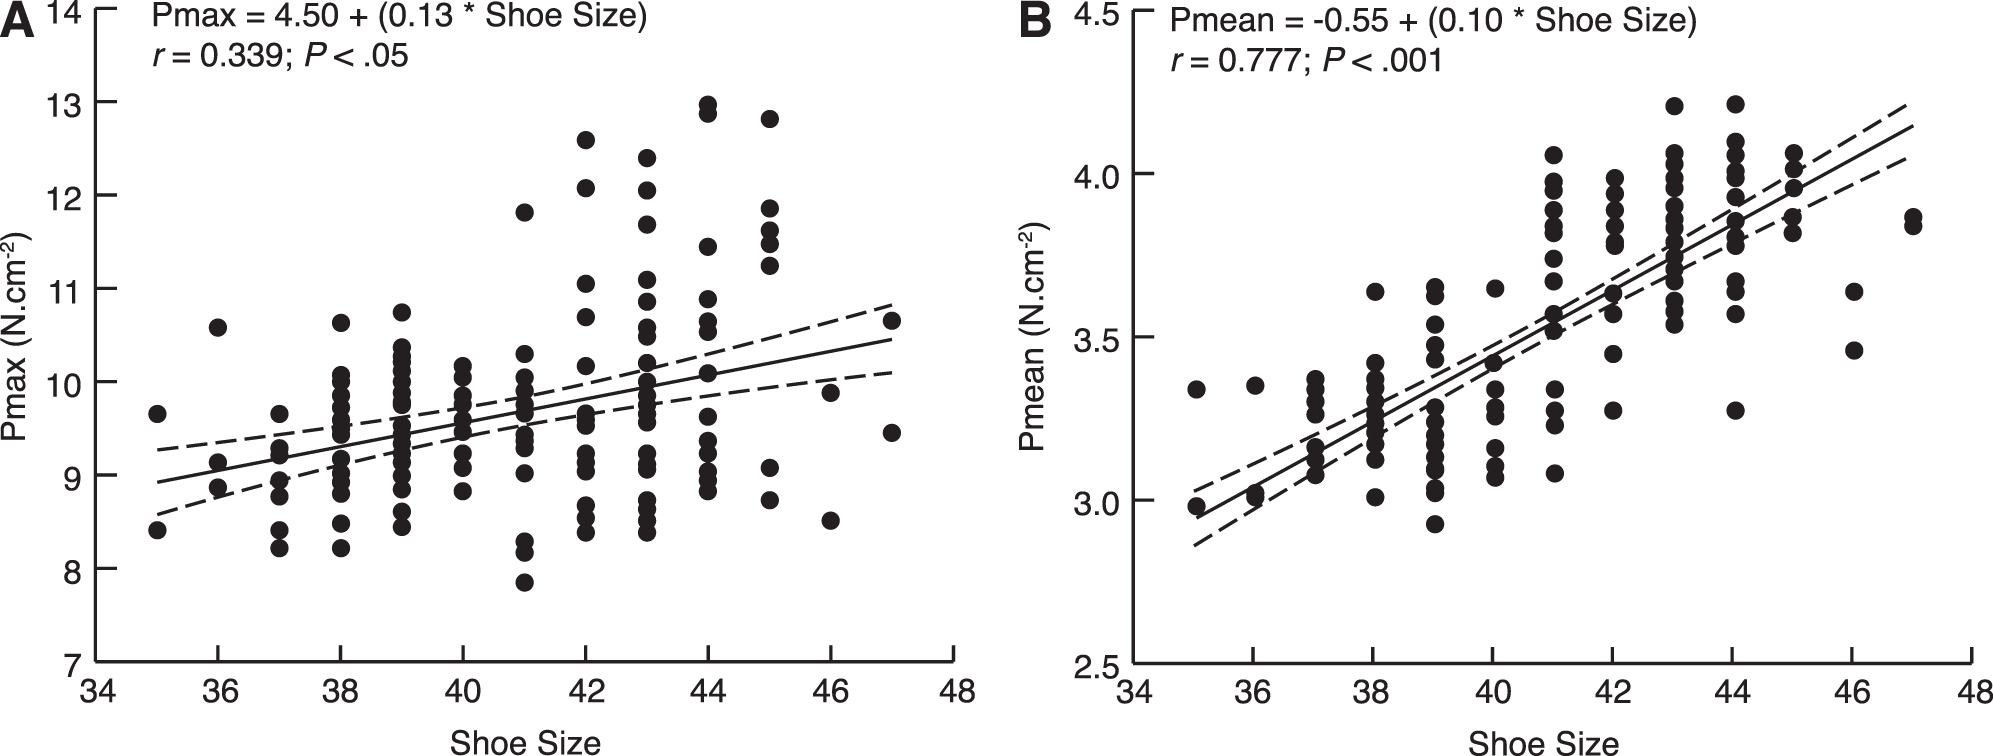
Table 3 reports the mean Pmax and Pmean values measured in women and men, showing that they were significantly higher in men. No correlation was found between the age of the participants and the Pmax and Pmean values. On the other hand, Pmax and Pmean values were significantly correlated with weight (Fig. 1 A and C), BMI (Fig. 1 B and D), and shoe size (Fig. 2 A and B). In 91% of study participants (both sexes), the Pmax point was located on the rearfoot.
Table 3.
Pedobarographic Variables by Sex
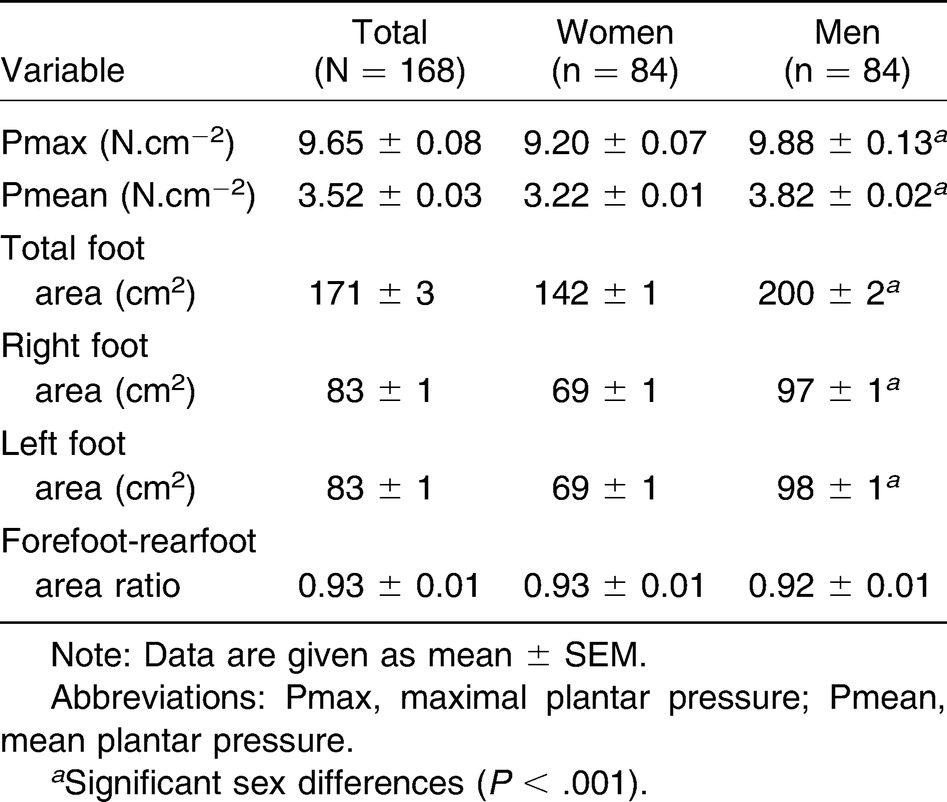
Figure 1.
Least squares regression analyses with 95% confidence intervals between maximal plantar pressure (Pmax) and body weight (A) or body mass index (BMI) (B) and between mean plantar pressure (Pmean) and weight (C) or BMI (D). The regression equations with value of the r coefficient and its significance against zero are shown in each panel.
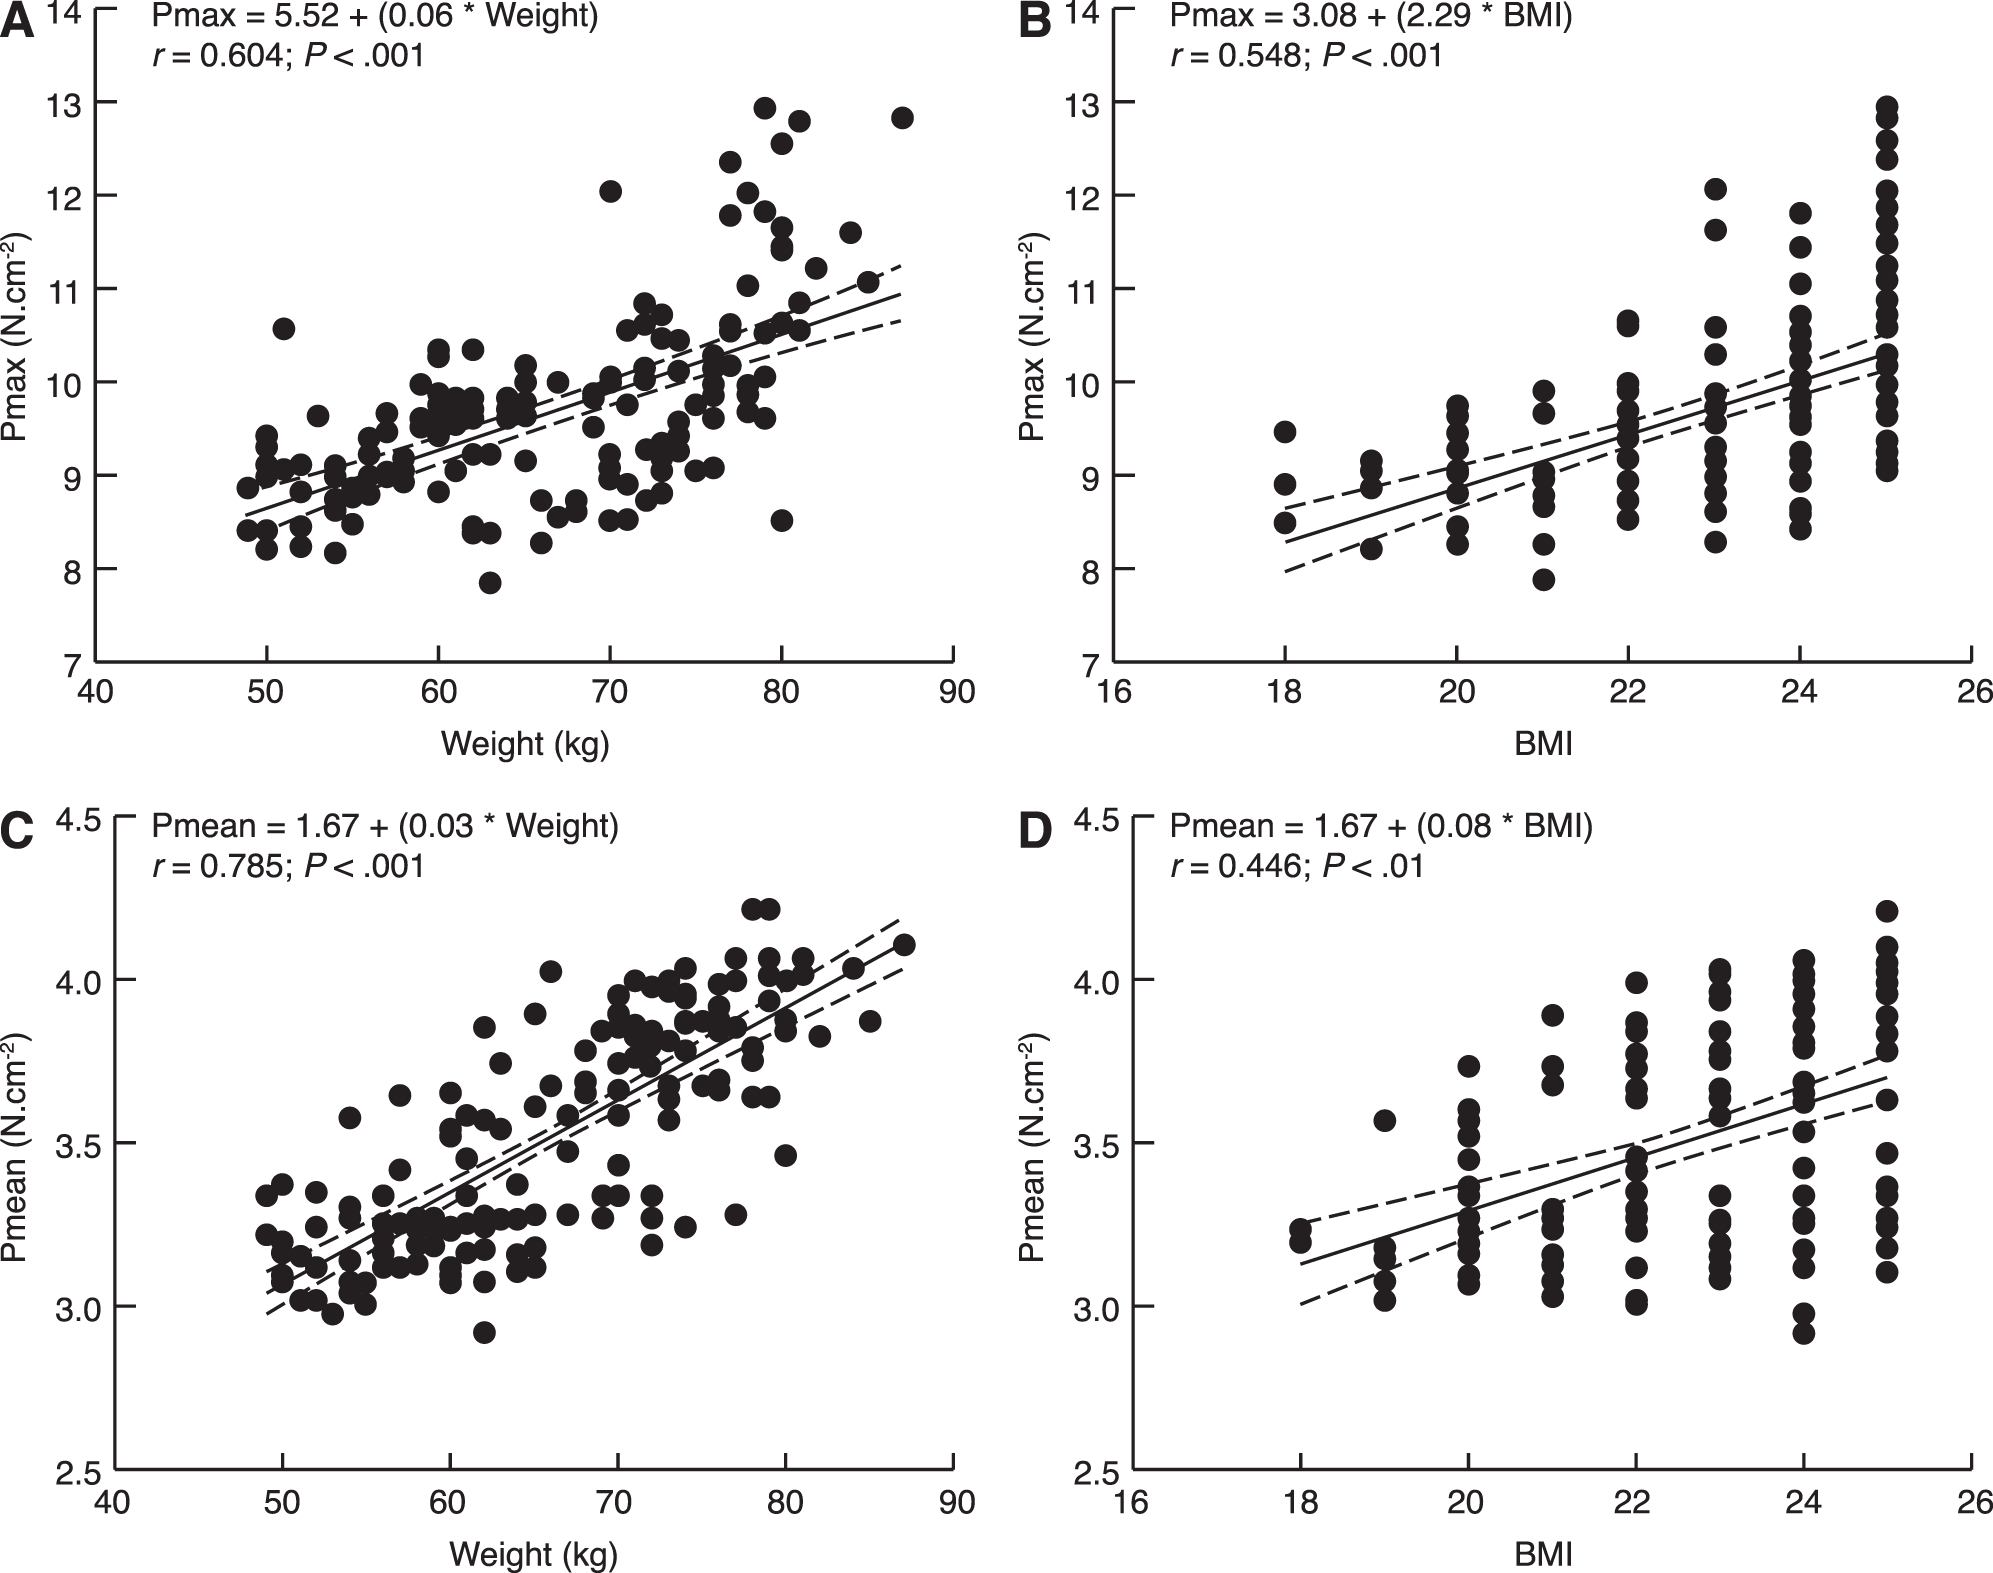
Figure 2.
Least squares regression analyses with 95% confidence intervals between maximal (Pmax) (A) or mean (Pmean) (B) plantar pressures and shoe size. The regression equations with value of the r coefficient and its significance against zero are shown in each panel.
Mean and Local Foot Sole Surfaces
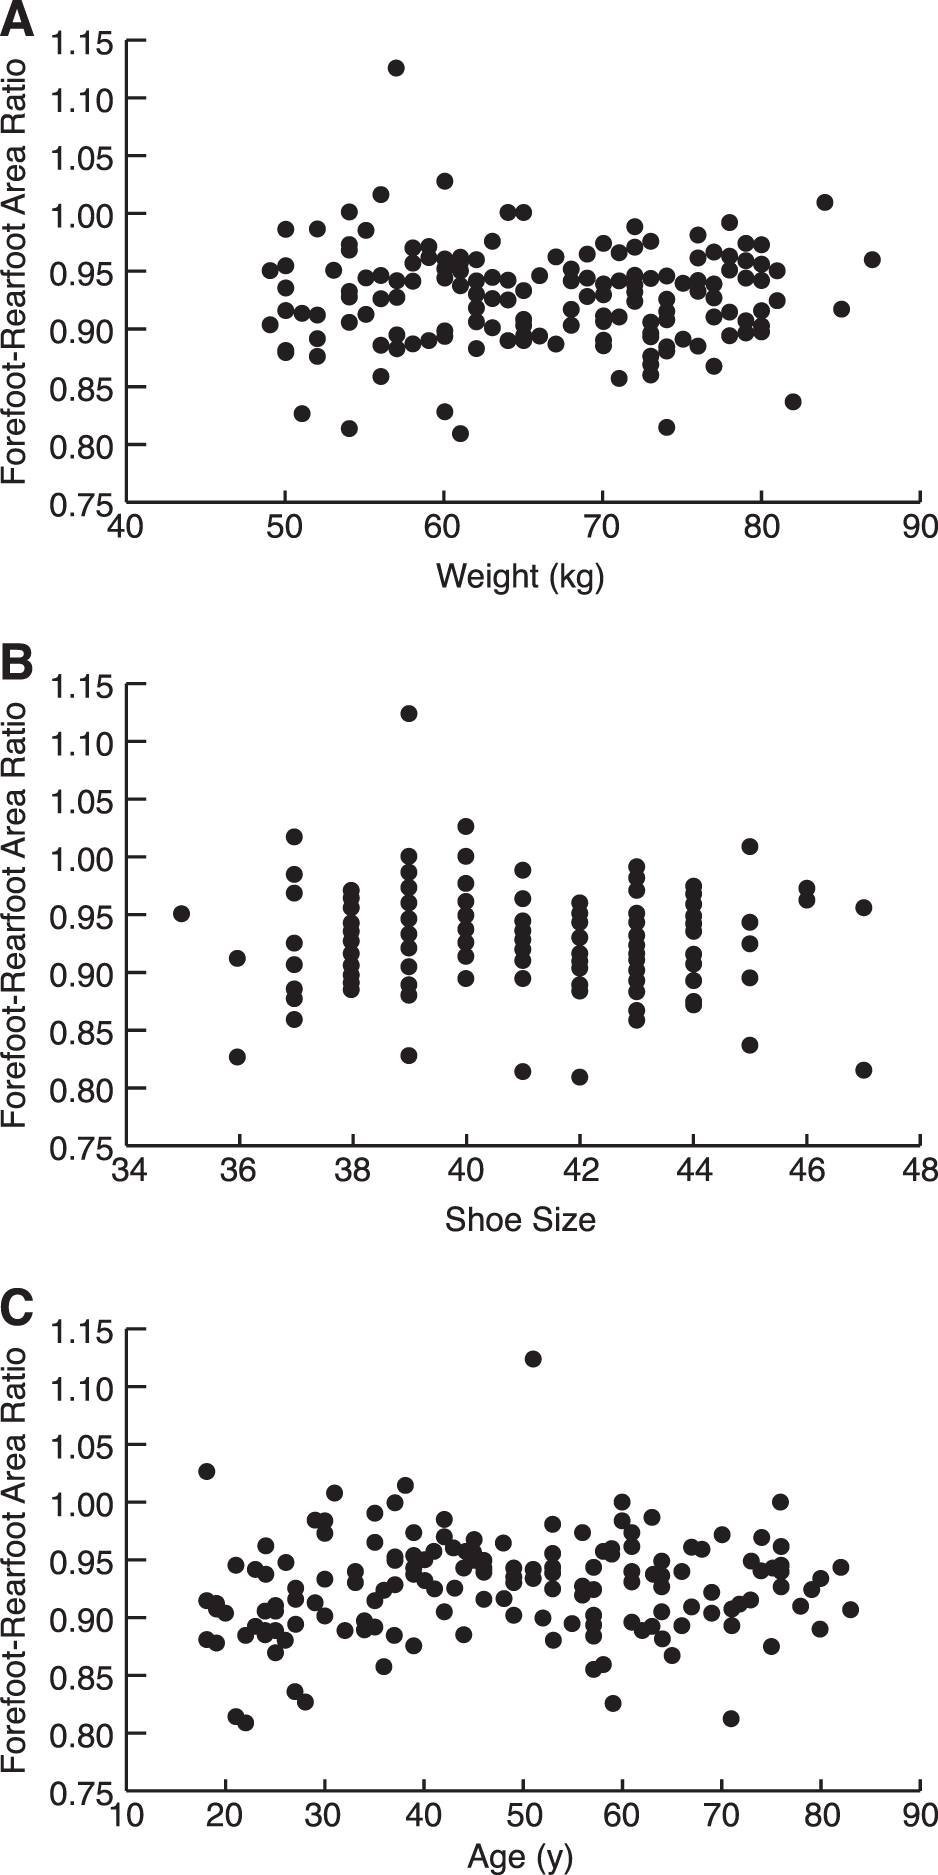
The total foot area of both feet and that of the right and left feet were significantly higher in men (Table 3). The total foot area was significantly correlated with body weight (Fig. 3A), BMI (Fig. 3B), and shoe size (Fig. 3C). No correlation was found between the total foot area or the area of each foot and the age of the participants. In both sexes, the mean ± SEM forefoot areas (left: 37.7 ± 0.6 cm2; right: 37.7 ± 0.6 cm2) were significantly lower than the rearfoot areas (left: 40.8 ± 0.7 cm2; right: 40.7 ± 0.8 cm2) (P < .01). Significant positive correlations were obtained between the forefoot and rearfoot areas and weight (Fig. 4 A and C) and shoe size (Fig. 4 B and D) (P < .001). The mean ± SEM value of the forefoot-rearfoot area ratio was 0.928 ± 0.003. In both sexes, this ratio was the same (Table 3) and did not vary with weight (Fig. 5A), shoe size (Fig. 5B), and age (Fig. 5C).
Figure 3.
Least squares regression analyses with 95% confidence intervals between the total foot sole area and weight (A), body mass index (BMI) (B), and shoe size (C). The regression equations with value of the r coefficient and its significance against zero are shown in each panel.
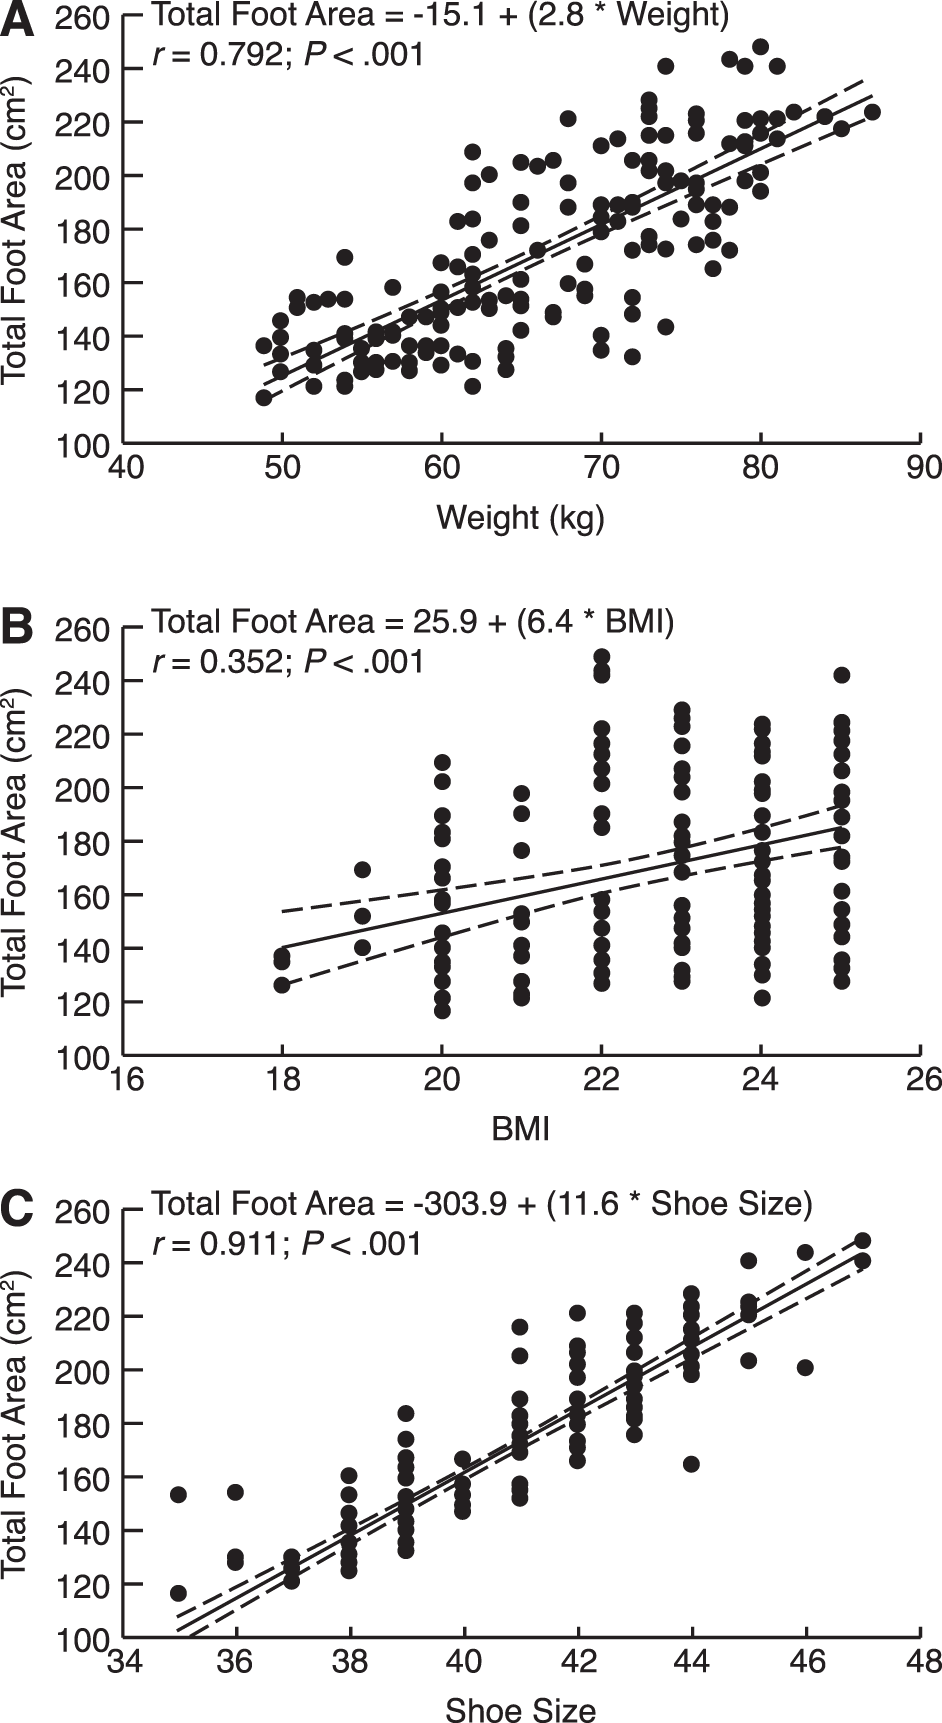
Figure 4.
Least squares regression analyses with 95% confidence intervals between the total forefoot surface (A and B) or the total rearfoot surface (C and D) and weight (A and C) or shoe size (B and D). The regression equations with value of the r coefficient and its significance against zero are shown in each panel.
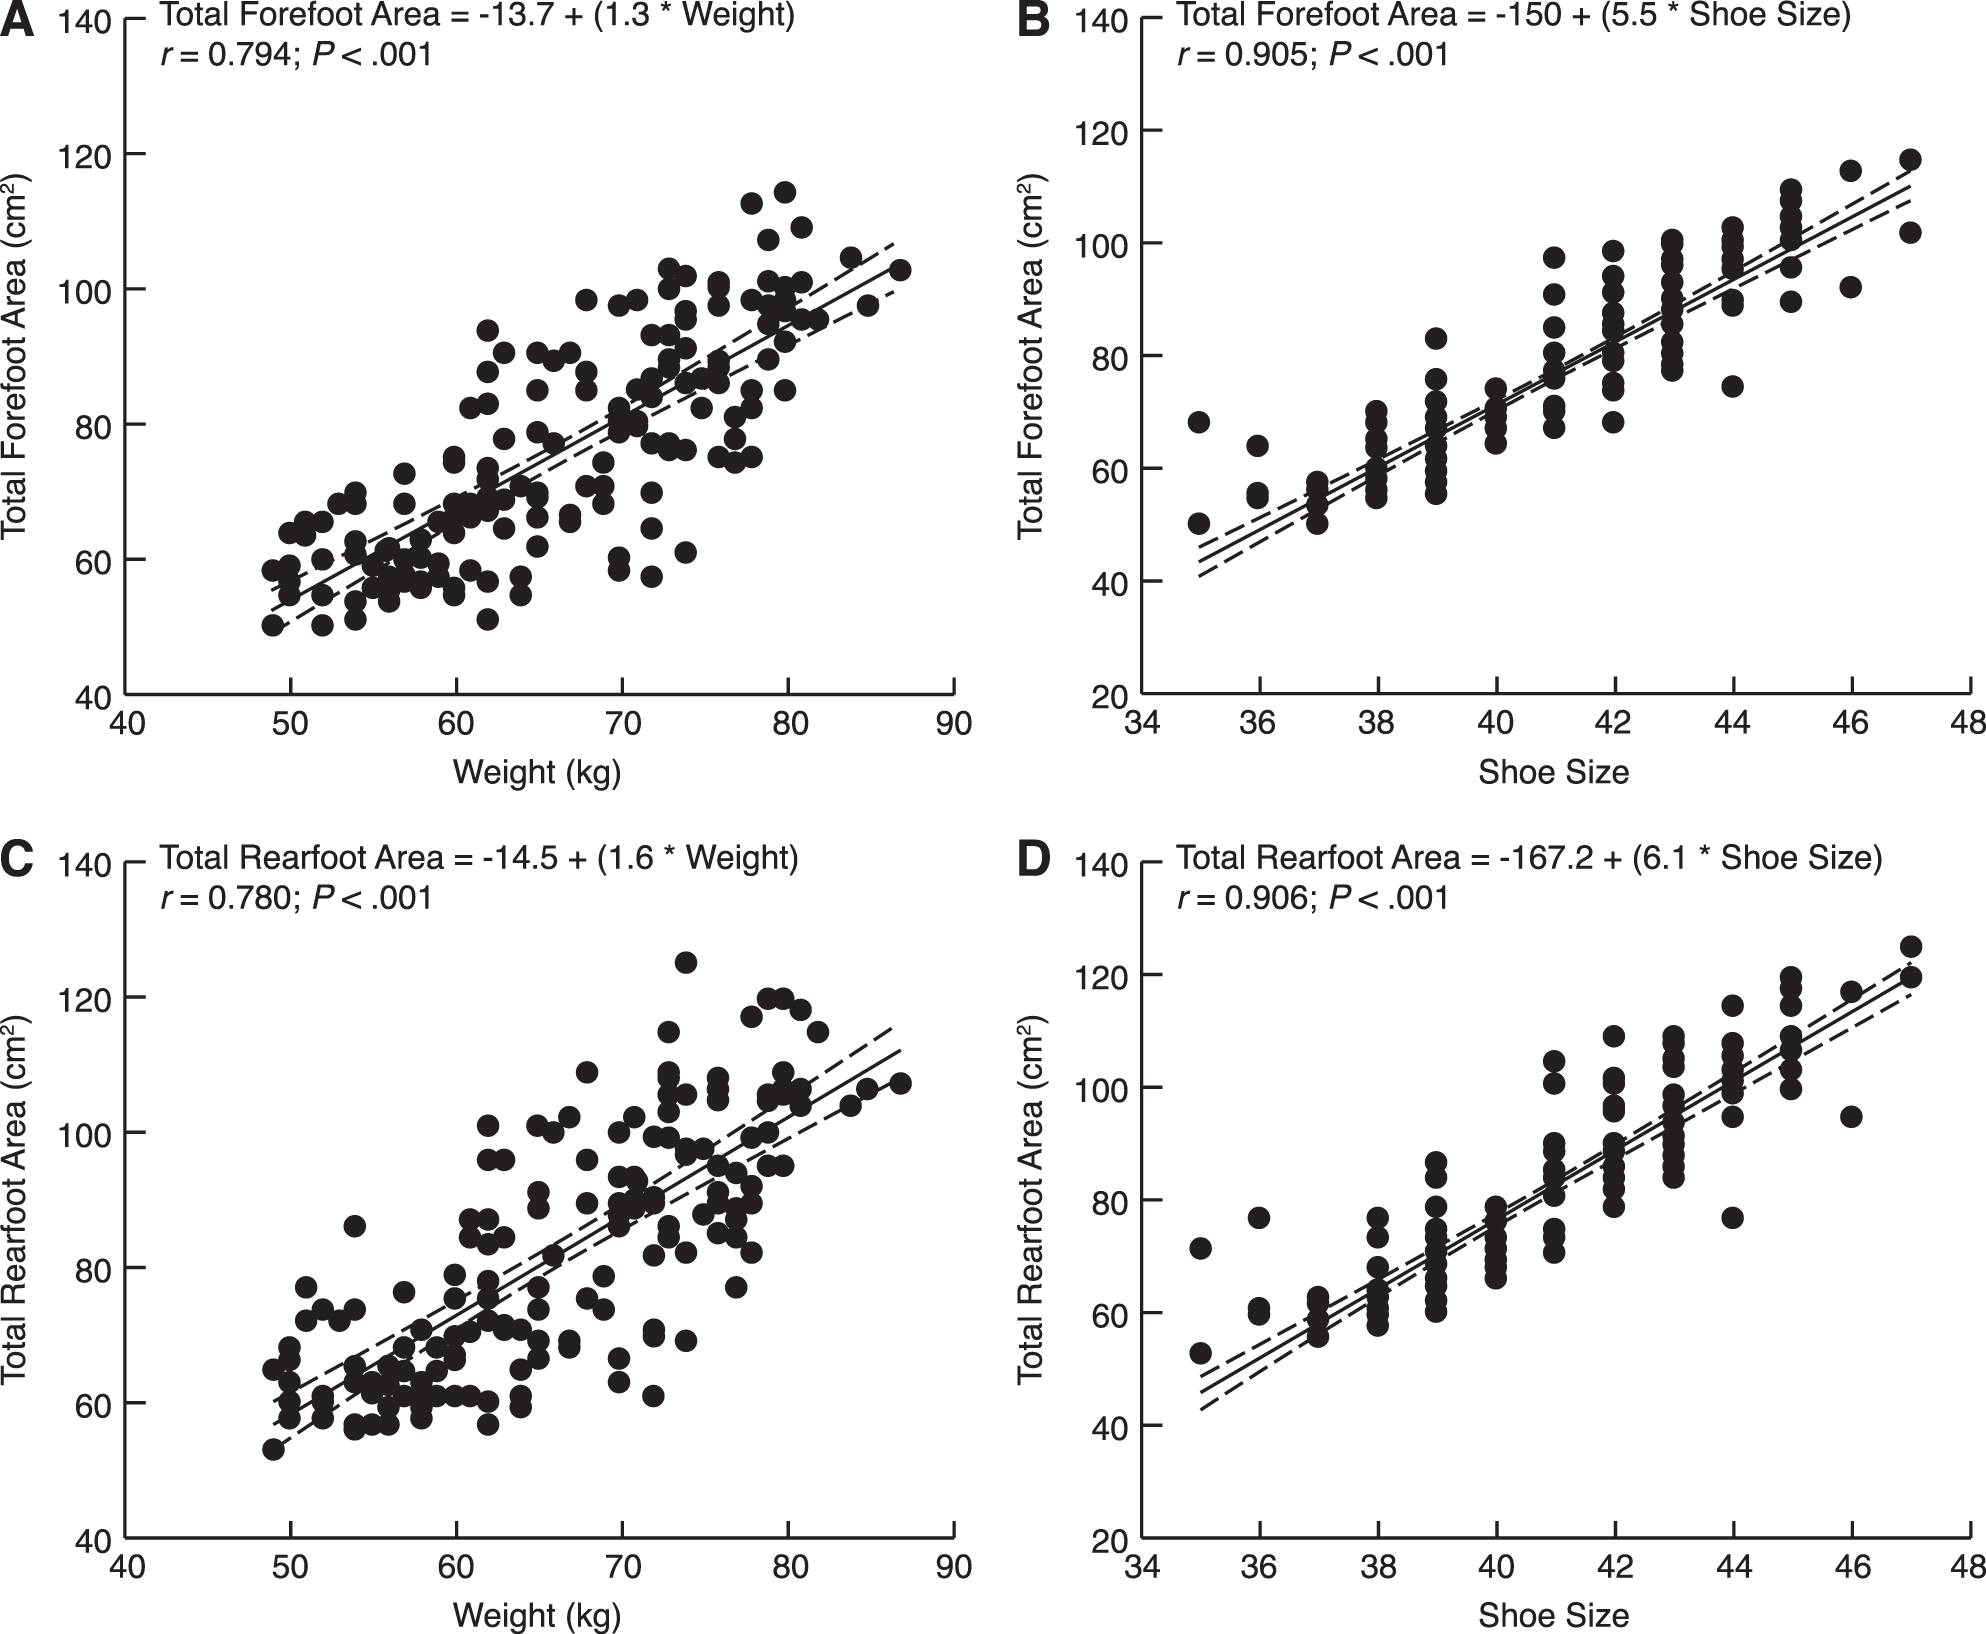
Figure 5.
No least squares regressions were found between the forefoot-rearfoot area ratio and weight (A), shoe size (B), age (C).
Discussion
Data Summary
We reported static pedobarographic data in a large number of healthy individuals of both sexes at a wide range of ages. In the static condition, the pressures and foot sole areas did not vary with age but only depended on the participant's weight and shoe size. Another finding was that the stability of the forefoot-rearfoot area ratio was independent of sex, age, weight, and shoe size.
Potential Instrumentation Limitations
The methodological study by Giacomozzi[11] incited us to verify the calibration coefficient of the Win-Pod pedobarographs. Owing to overlapping of the foot sole contact with several load cells at the periphery of the plantar area, the Win-Pod pedobarograph gave an overestimation of the true surfaces and, thus, underestimated the pressure values. Our calibration procedure was not as sophisticated as that used in the study by Giacomozzi[11] but it allowed us to measure a correction coefficient similar in the two platforms used. Thus, we may suppose that the pedobarographic data reported herein are close to the true values of pressure and foot sole surfaces measured with the Win-Pod system during upright standing. Static pedobarography gives lower plantar pressure values than dynamic ones measured during gait. Thus, the present data cannot be extrapolated to measurements in walking participants. The validity of these findings and correction methods should be tested in future studies.
Comparison with Literature Data
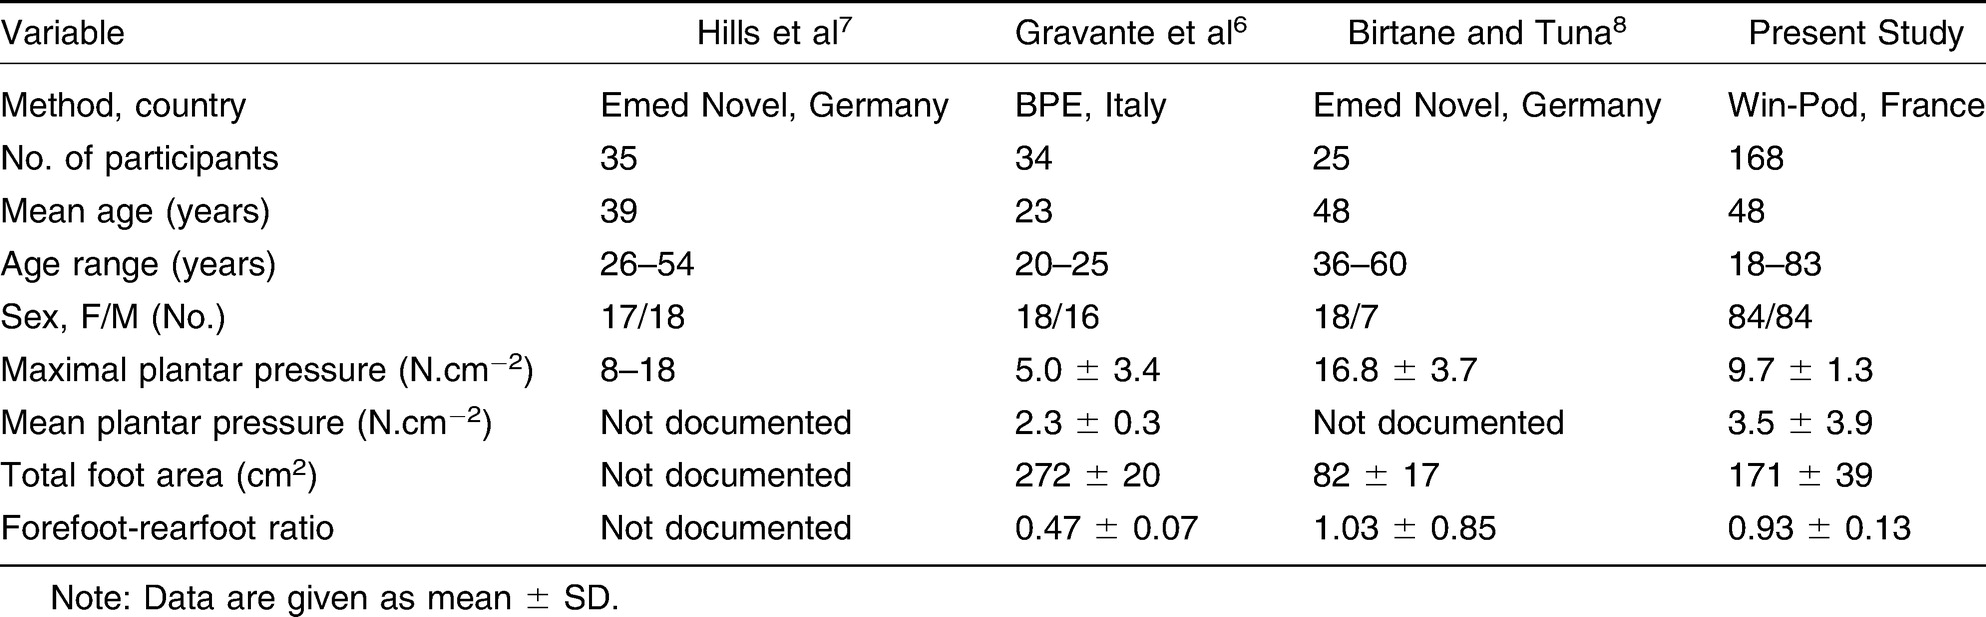
Table 4 compares static pedobarographic data reported in four studies, including the present one. In our study, we used the French Win-Pod system, whereas Hills et al[7] and Birtane and Tuna[8] used the German Emed Novel system, and Gravante et al[6] used an Italian pedobarograph. Compared with our study, the total number of healthy individuals and their age range were markedly lower in the aforementioned studies. However, the Pmax measured by the authors of the previously mentioned studies did not markedly differ from that measured in our study, as well as the Pmean, which was reported only by Gravante et al.[6] Surprisingly, the total foot area and the forefoot-rearfoot area ratio were very different among the studies. However, owing to the large SD value in the study by Birtane and Tuna,[8] the forefoot-rearfoot area ratio did not significantly differ from that measured in our study.
Table 4.
Comparison of Literature Data on Static Pedobarography in Healthy Individuals
We previously stated that very few static pedobarographic studies have reported data on the changes in plantar pressures and foot areas with age. Only Tanaka et al[10] observed that the forefoot area of their young participants was significantly greater than that of their elderly ones. We do not confirm these data. Besides, several studies compared postural sway during dual tasks in young and elderly adults.[10,12] On the other hand, data exist on the consequences of an excess in weight.[7,13-15] In obese patients, Hills et al[7] reported excessive forefoot pressure and an enlarged support area. During quiet standing, Fabris et al[13] reported a significant increase in peak pressure on the forefoot and plantar ground contact area in the obese group compared with controls. Gravante et al[14] compared young normal-weight and obese individuals and found that obesity was associated in both sexes with significantly larger plantar contact areas and pressures. In normal-weight individuals, Vela et al[15] studied the effects of increased weight on pedobarographic data and reported a significant increase in mean peak plantar foot pressures under the metatarsal heads, heel, and midfoot for each incremental increase in weight. Thus, the present correlations between BMI or weight and pressures and foot sole areas are logical.
We may be astonished by the absence of any correlation between the age of the participants and the pressures, the foot sole areas, and the forefoot-rearfoot area ratio. Indeed, females and males wear different shoe types, which probably vary during their lifetime. This individual “shoe history” could affect contact with the ground of the different sole portions and also modify the distribution of plantar pressures and the forefoot-rearfoot area ratio. These data indicate that the repartition of plantar pressures and areas was independent of age in female and male participants. This finding could signify that aging does not affect the control of posture during upright standing.
Conclusions
Normal static pedobarographic variables of healthy adults could be useful for the diagnosis of foot placement abnormalities during upright standing in patients with diabetic foot ulceration or low- or high-arched feet. This will constitute the subject of further comparative studies.
Financial Disclosure
None reported.
Conflicts of Interest
None reported.
References
- Quaney B, Meyer K, Cornwall MW, et al: A comparison of the dynamic pedobarograph and EMED systems for measuring dynamic foot pressures. Foot Ankle Int16: 562, 1995.
- Bryant AR, Tinley P, Singer KP: Normal values of plantar pressure measurements determined using the EMED-SF system. JAPMA90: 295, 2000.
- Maetzler M, Bochdansky T, Abboud RJ: Normal pressure values and repeatability of the Emed® ST2 system. Gait Posture32: 391, 2010.
- Putti AB, Arnold GP, Abboud RJ: Foot pressure differences in men and women. Foot Ankle Surg16: 21, 2010.
- Putti AB, Arnold GP, Cochrane LA, et al: Normal pressure values and repeatability of the Emed ST4 system. Gait Posture27: 501, 2008.
- Gravante G, Pomara F, Russo G, et al: Plantar pressure distribution analysis in normal weight young women and men with normal and claw feet: a cross-sectional study. Clin Anat18: 245, 2005.
- Hills AP, Hennig EM, McDonald M, et al: Plantar pressure differences between obese and non-obese adults: a biomechanical analysis. Int J Obes Relat Metab Disord25: 1674, 2001.
- Birtane M, Tuna H: The evaluation of plantar pressure distribution in obese and non-obese adults. Clin Biomech19: 1055, 2004.
- Imamura M, Imamura ST, Salomão O, et al: Pedobarometric evaluation of the normal adult male foot. Foot Ankle Int23: 804, 2002.
- Tanaka T, Takeda H, Izumi T, et al: Age-related changes in postural control associated with location of the center of gravity and foot pressure. Phys Occup Ther Geriatr15: 1, 1997.
- Giacomozzi C: Appropriateness of plantar pressure measurement devices: a comparative technical assessment. Gait Posture32: 141, 2010.
- Prado JM, Stoffregen TA, Duarte M: Postural sway during dual tasks in young and elderly adults. Gerontology. 53: 274, 2007.
- Fabris SM, Valezi AC, de Souza SA, et al: Computerized baropodometry in obese patients. Obes Surg16: 1574, 2006.
- Gravante G, Russo G, Pomara F, et al: Comparison of ground reaction forces between obese and control young adults during quiet standing on a baropodometric platform. Clin Biomech18: 780, 2003.
- Vela SA, Lavery LA, Armstrong DG, et al: The effect of increased weight on peak pressures: implications for obesity and diabetic foot pathology. J Foot Ankle Surg37: 416, 1998.
© 2021 American Podiatric Medical Association