Next Article in Journal
Cost-Effectiveness of Becaplermin Gel on Diabetic Foot Ulcer Healing
Previous Article in Journal
Normal Values of Pressures and Foot Areas Measured in the Static Condition
 
 
Journal of the American Podiatric Medical Association is published by MDPI from Volume 116 Issue 1 (2026). Previous articles were published by another publisher in Open Access under a CC-BY (or CC-BY-NC-ND) licence, and they are hosted by MDPI on mdpi.com as a courtesy and upon agreement with American Podiatric Medical Association.
Article

A Novel Method of Quantifying Gait Deviations Using Plantar Pressure Patterns

by
Kevin Deschamps
1,2,*,
Filip Staes
1,
Dirk Desmet
3,
Philip Roosen
4,
Giovanni Arnoldo Matricali
5,6,
Noel Keijsers
7,
Frank Nobels
8,
Jos Tits
9 and
Herman Bruyninckx
3
1
Department of Rehabilitation Sciences, Musculoskeletal Rehabilitation Research Group, KU Leuven, Tervuursevest 101, B-3001 Leuven (Heverlee), Belgium
2
Laboratory for Clinical Motion Analysis, University Hospital Pellenberg, KU Leuven, Leuven, Belgium
3
Department of Mechanical Engineering, KU Leuven, Leuven, Belgium
4
Department of Rehabilitation Sciences and Physiotherapy, Musculoskeletal Rehabilitation Research Group, Ghent University, Ghent, Belgium
5
Department of Development and Regeneration, KU Leuven, Leuven, Belgium
6
Multidisciplinary Diabetic Foot Clinic, University Hospitals Leuven, KU Leuven, Leuven, Belgium
7
Research Department, Sint Maartenskliniek Nijmegen, Nijmegen, the Netherlands
8
Department of Internal Medicine-Endocrinology, Multidisciplinary Diabetic Foot Clinic, Onze-Lieve-Vrouw Ziekenhuis Aalst, Aalst, Belgium
9
Department of Internal Medicine-Endocrinology, Multidisciplinary Diabetic Foot Clinic, Ziekenhuis Oost-Limburg, Genk, Belgium
*
Author to whom correspondence should be addressed.
J. Am. Podiatr. Med. Assoc. 2016, 106(4), 299-304; https://doi.org/10.7547/14-140
Published: 1 July 2016

Abstract

Background: Comparing the dynamic pedobarographic patterns of individuals is common practice in basic and applied research. However, this process is often time-consuming and complex, and commercially available software often lacks powerful visualization and interpretation tools. Methods: We propose a simple method for displaying pixel-level pedobarographic deviations over time relative to a so-called reference pedobarographic pattern. This novel method contains four distinct automated preprocessing stages: 1) normalization of pedobarographic fields (for foot length and width), 2) temporal normalization, 3) a pixel-level z-score–based calculation, and 4) color coding of the normalized pedobarographic fields. Group and patient-level comparisons were illustrated using an experimental data set including diabetic and nondiabetic patients. Results: The automated procedure was found to be robust and quantified distinct temporal deviations in pedobarographic fields. Conclusions: The advantages of the novel method cover several domains, including visualization, interpretation, and education.

In the past three decades, it has become common to measure ground contact forces during clinical gait analysis by means of plantar pressure measurements (PPMs). Despite some technical considerations and shortcomings,[1] the noninvasive nature of this approach has been particularly appealing in analyzing and quantifying foot and lower-limb dysfunction.[2,3] However, PPMs are not easy to analyze and, therefore, are difficult to interpret. To overcome these challenges, regional metrics (eg, mean pressure, peak pressure, and pressure-time integrals) are typically captured using so-called subsampling methods.[4] Unfortunately, this approach is characterized by a high degree of subjectivity and a low-resolution perspective. For example, it has been shown that subsampling may provide incorrect statistical trends.[5] Finally, it should be highlighted that one loses visual representation of the complete pedobarographic pattern as well as the three-dimensional (3-D) content, inevitably affecting the decision-making process.
Fortunately, a variety of methods have been developed that embrace high-resolution perspectives.[6,7] The theoretical concept behind these methods is that inferential analysis of field characteristcs en masse is afforded. To our knowledge, two distinct methods have been introduced to date to perform such pixel-level pedobarographic inferential analyses: statistical parametric mapping[7] and nonparametric statistical testing.[8,9] Both methods have been extracted from the neuroimaging literature. They showed powerful features in the context of clinical and fundamental research involving PPM.[4,10] The utility of these methods in the context of clinical gait analysis is, at this moment, unknown, especially when one aims at maintaining the 3-D form of the PPM through their decision-making process. The inclusion of this third dimension (time) in the decision-making process has been found to be difficult and is typically neglected in clinical gait analysis. The present study is aimed at addressing this challenge. We propose a simple and clinically applicable method for displaying deviations among normalized pedobarographic patterns (NPPs). Herein, the original 3-D form of the PPM is maintained, and differences among NPPs are color coded according to pixel-level z-score calculations. In this article, we describe the preprocessing and color-coding method and some clinical visualization on patient data.

Methods

Experimental Data Set

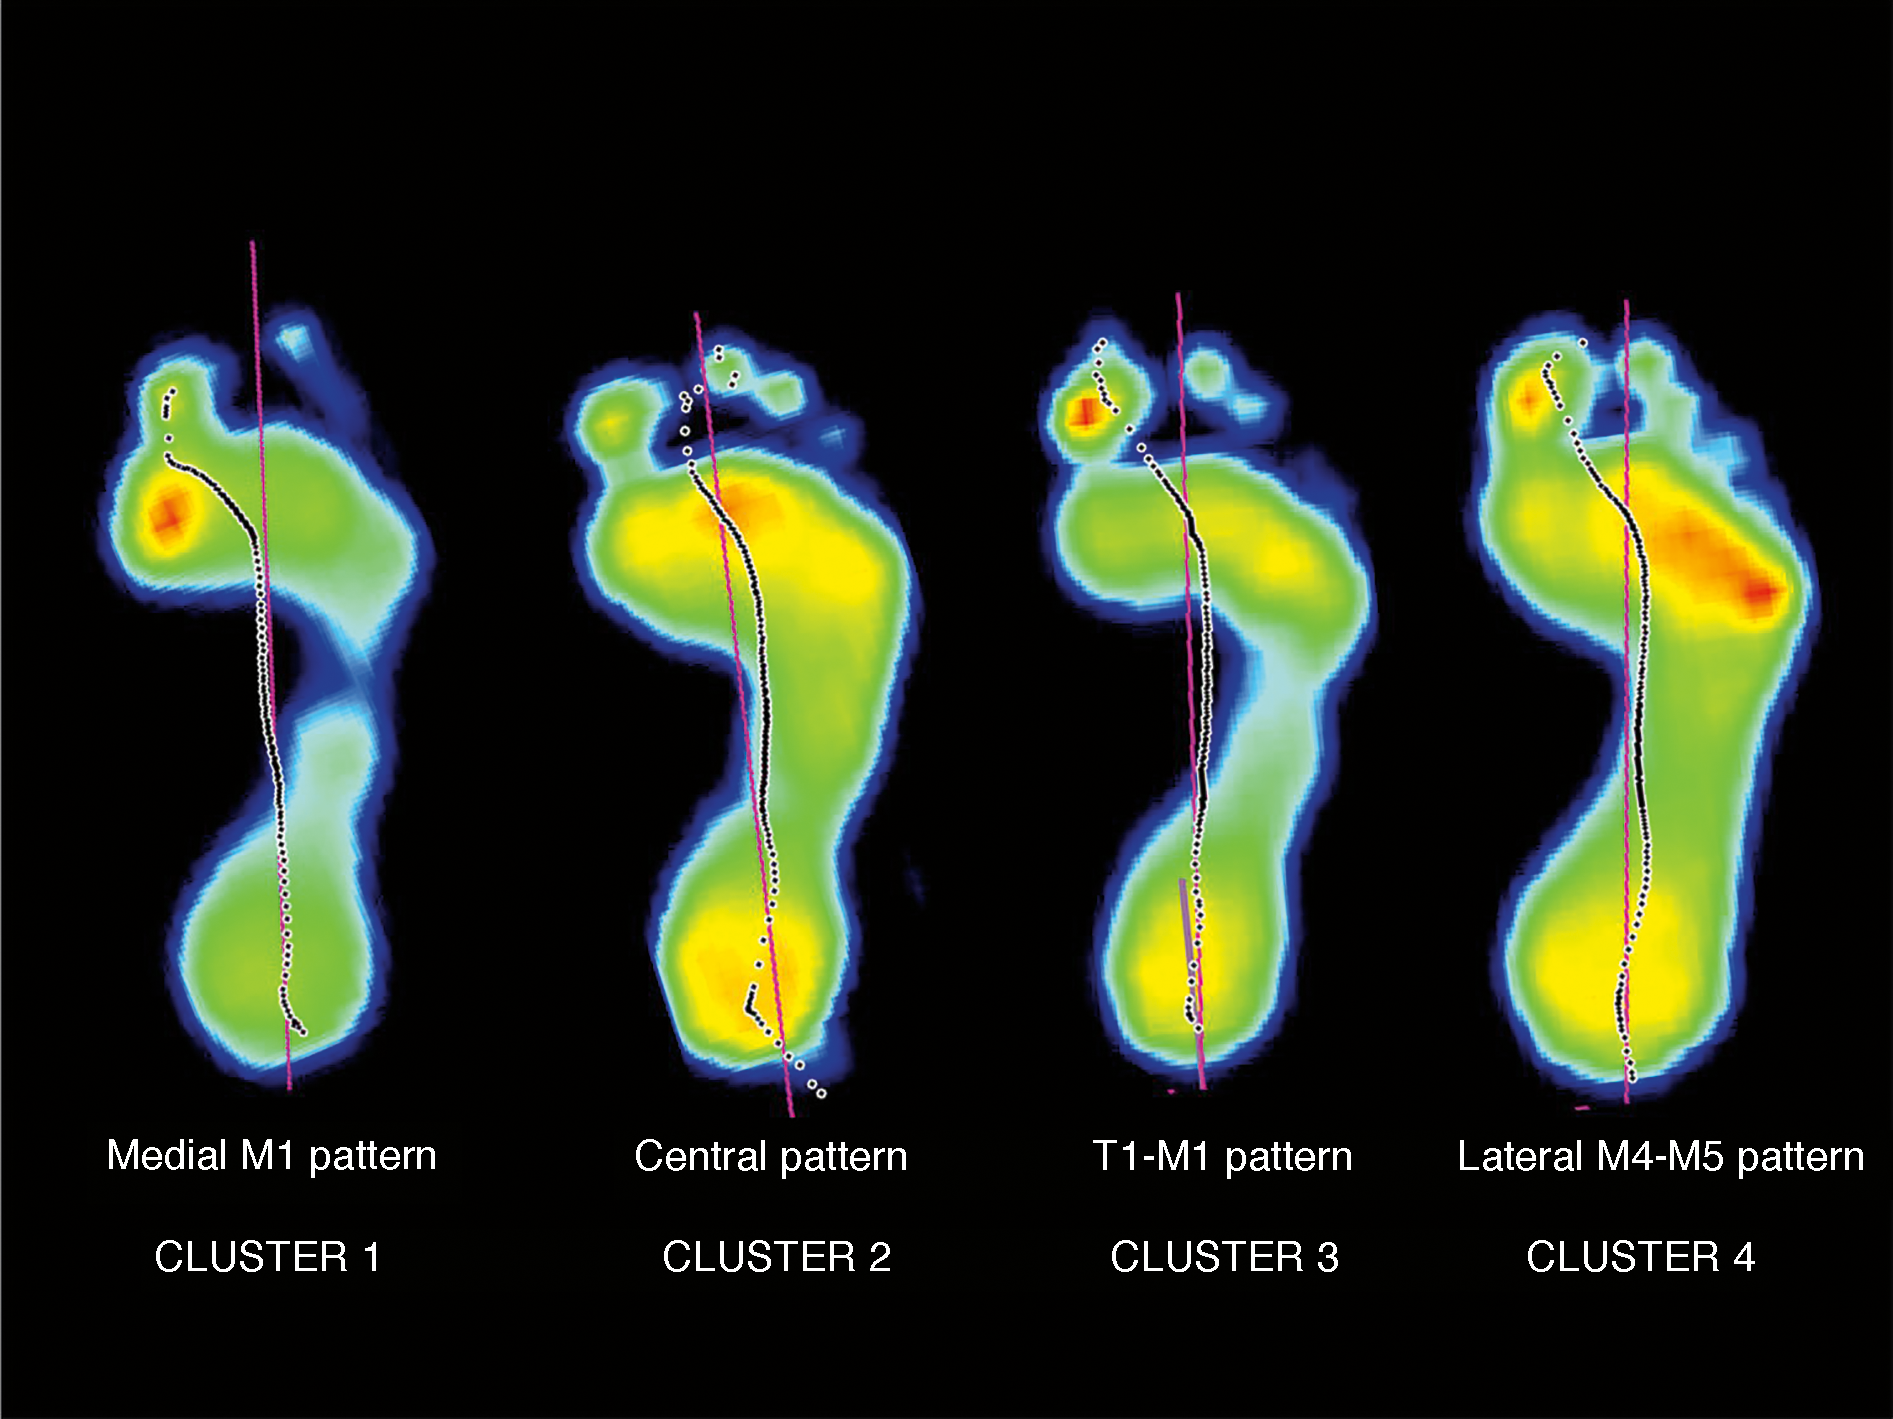
Experimental data belonging to the recently developed PPM classification system[11] were used. This classification system, encompassing four distinct pressure patterns (the medial M1, central, T1-M1, and lateral M4-M5 patterns) (Fig. 1), was recently partitioned after k-means cluster analysis on relative regional impulses of six forefoot regions of diabetic and nondiabetic persons. A subset of this experimental data set, namely, individuals with a medial M1 pattern and a lateral M4-M5 pattern, was selected to illustrate the novel method. The medial M1 pattern encompassed PPMs from 41 diabetic and nine nondiabetic patients (mean ± SD age, 64.1 ± 7.8 years; mean ± SD body mass index [calculated as weight in kilograms divided by height in meters squared], 28.6 ± 4.7). The lateral M4-M5 pattern consisted of PPMs from 30 diabetic patients (mean ± SD age, 66.4 ± 7.9 years; mean ± SD body mass index, 29.3 ± 5.5). Barefoot PPMs were recorded using a pressure platform (0.5 × 0.4 m; 4,096 resistive sensors; spatial resolution, 2.8 sensors/cm2) (RSscan International, Olen, Belgium), which was dynamically calibrated using a custom-made force plate (AMTI, Newton, Massachusetts). All of the diabetic and nondiabetic participants in this study gave written informed consent.
Figure 1. Example of a peak pressure footprint belonging to each cluster of the classification system published by Deschamps et al.[11]
Japma 106 00299 f01

Preprocessing of PPMs: Creation of 2-D and 3-D Normalized Plantar Pressure Patterns

The first stage of this novel technique involved a normalization procedure of the above-mentioned pedobarographic fields for foot size and foot progression angle (FPA). The method recently published by Keijsers et al[6] was implemented. A MATLAB routine (The MathWorks Inc, Natick, Massachusetts) was developed to fully automatically estimate the foot tangent lines and the foot length (defined herein as the distance between the back of the heel and the forefoot line). A brief summary of this routine is provided in the following paragraphs.
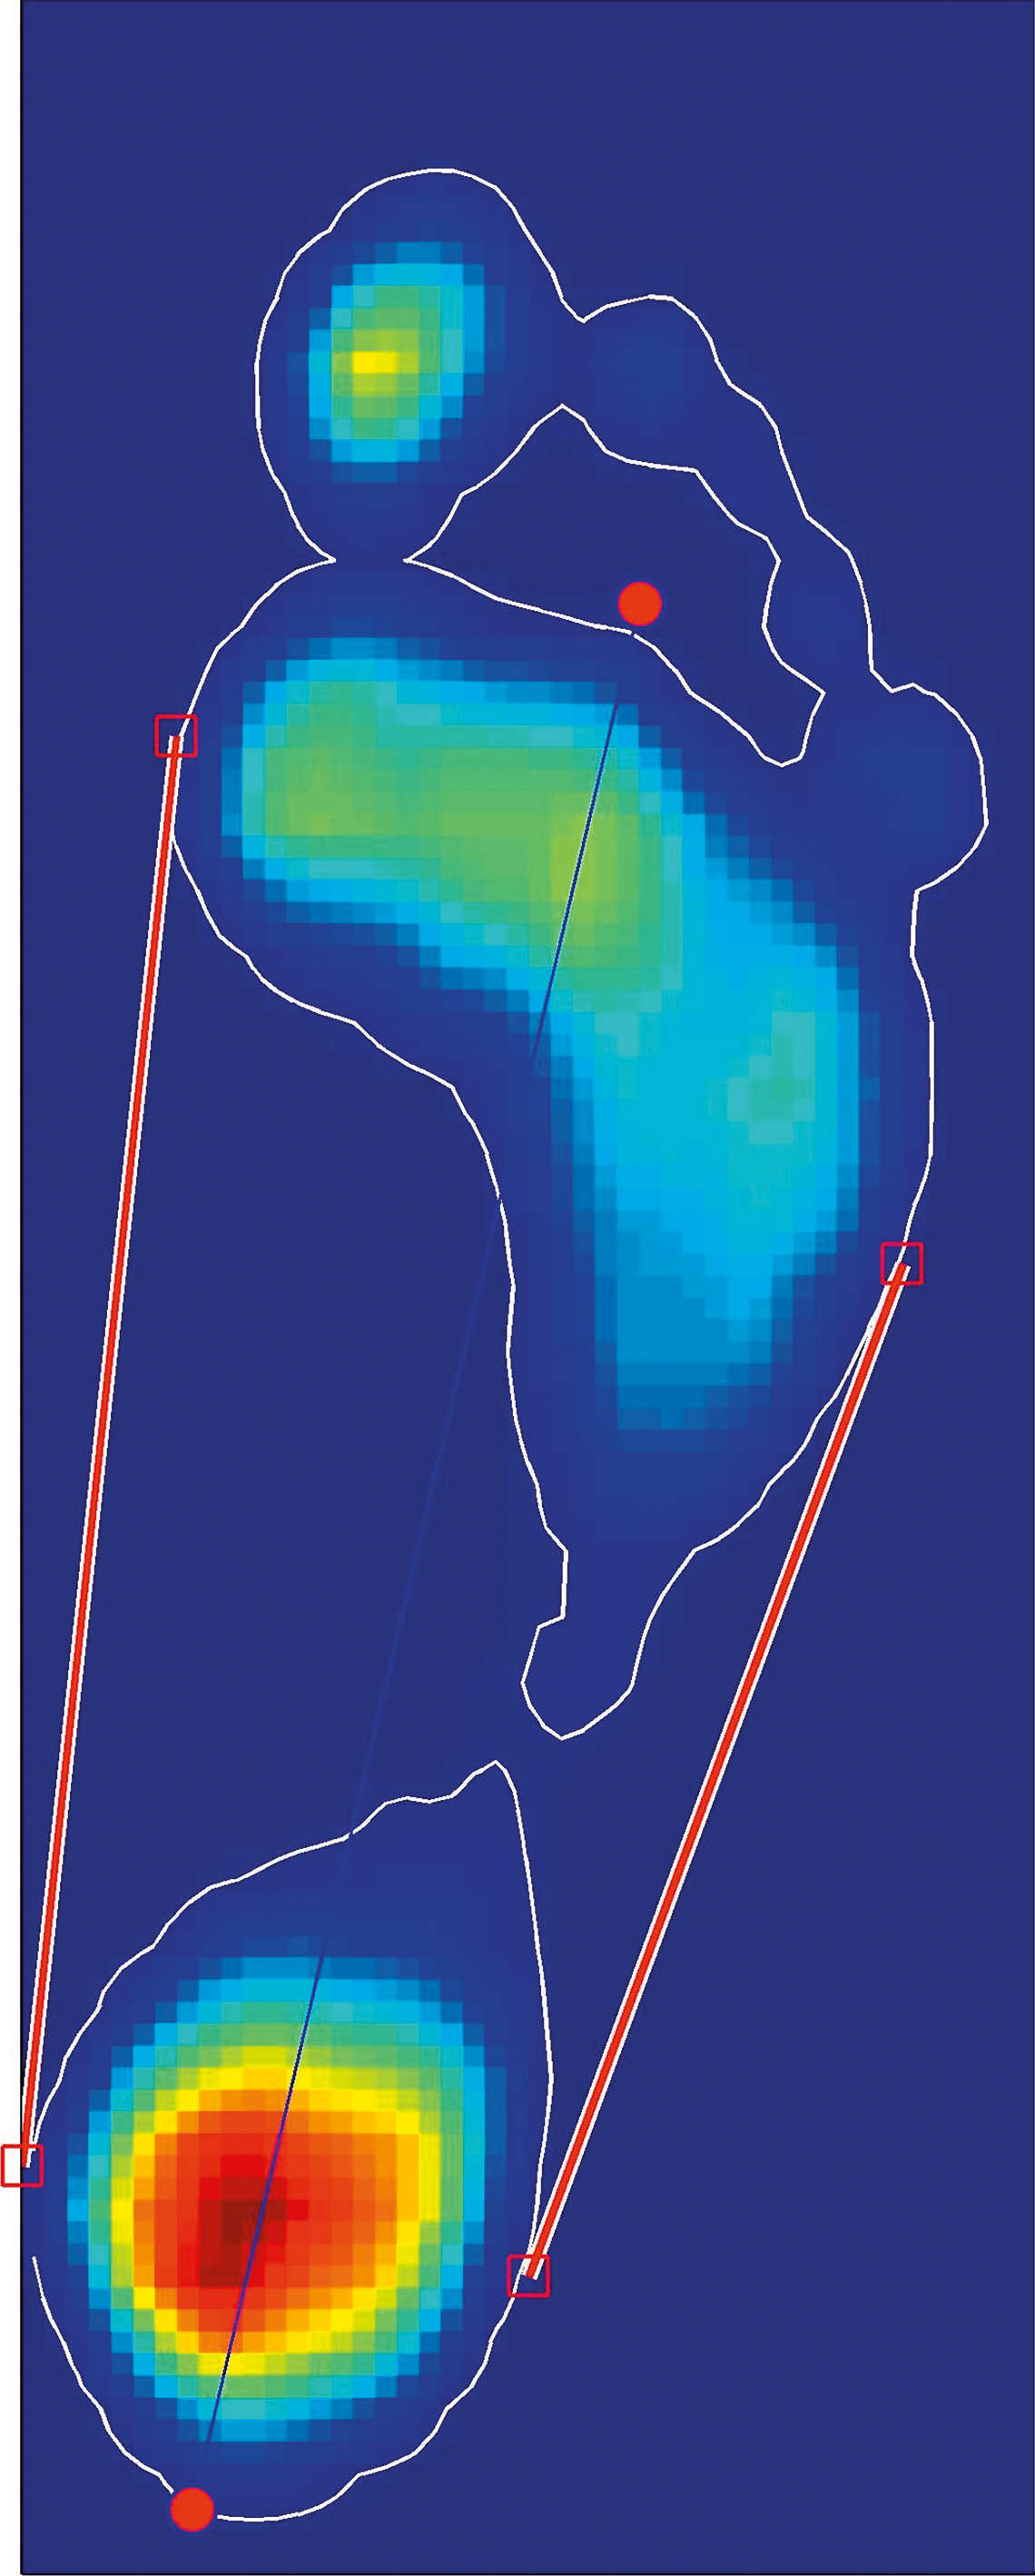
First, mean pressure per sensor during the stance phase was calculated, and this image was then resampled to square pixels (size, 0.25 cm) (Fig. 2). The region where the mean pressure was higher than 5 kPa defined the boundaries of the pedobarographic field, and the MATLAB routine regionprops was used to compute the orientation and the convex hull of this pedobarographic field.
Figure 2. Mean right pedobarographic footprint of a person with a 5-kPa contour line (white line). The red lines represent the tangent lines; the middle blue line indicates foot length.
Japma 106 00299 f02
The convex hull is defined as the smallest convex polygon that can contain the region. The orientation gives a first estimation of the FPA. The two sides of the convex hull, which have the longest distance parallel to the estimated progression angle, were taken as the tangent lines.
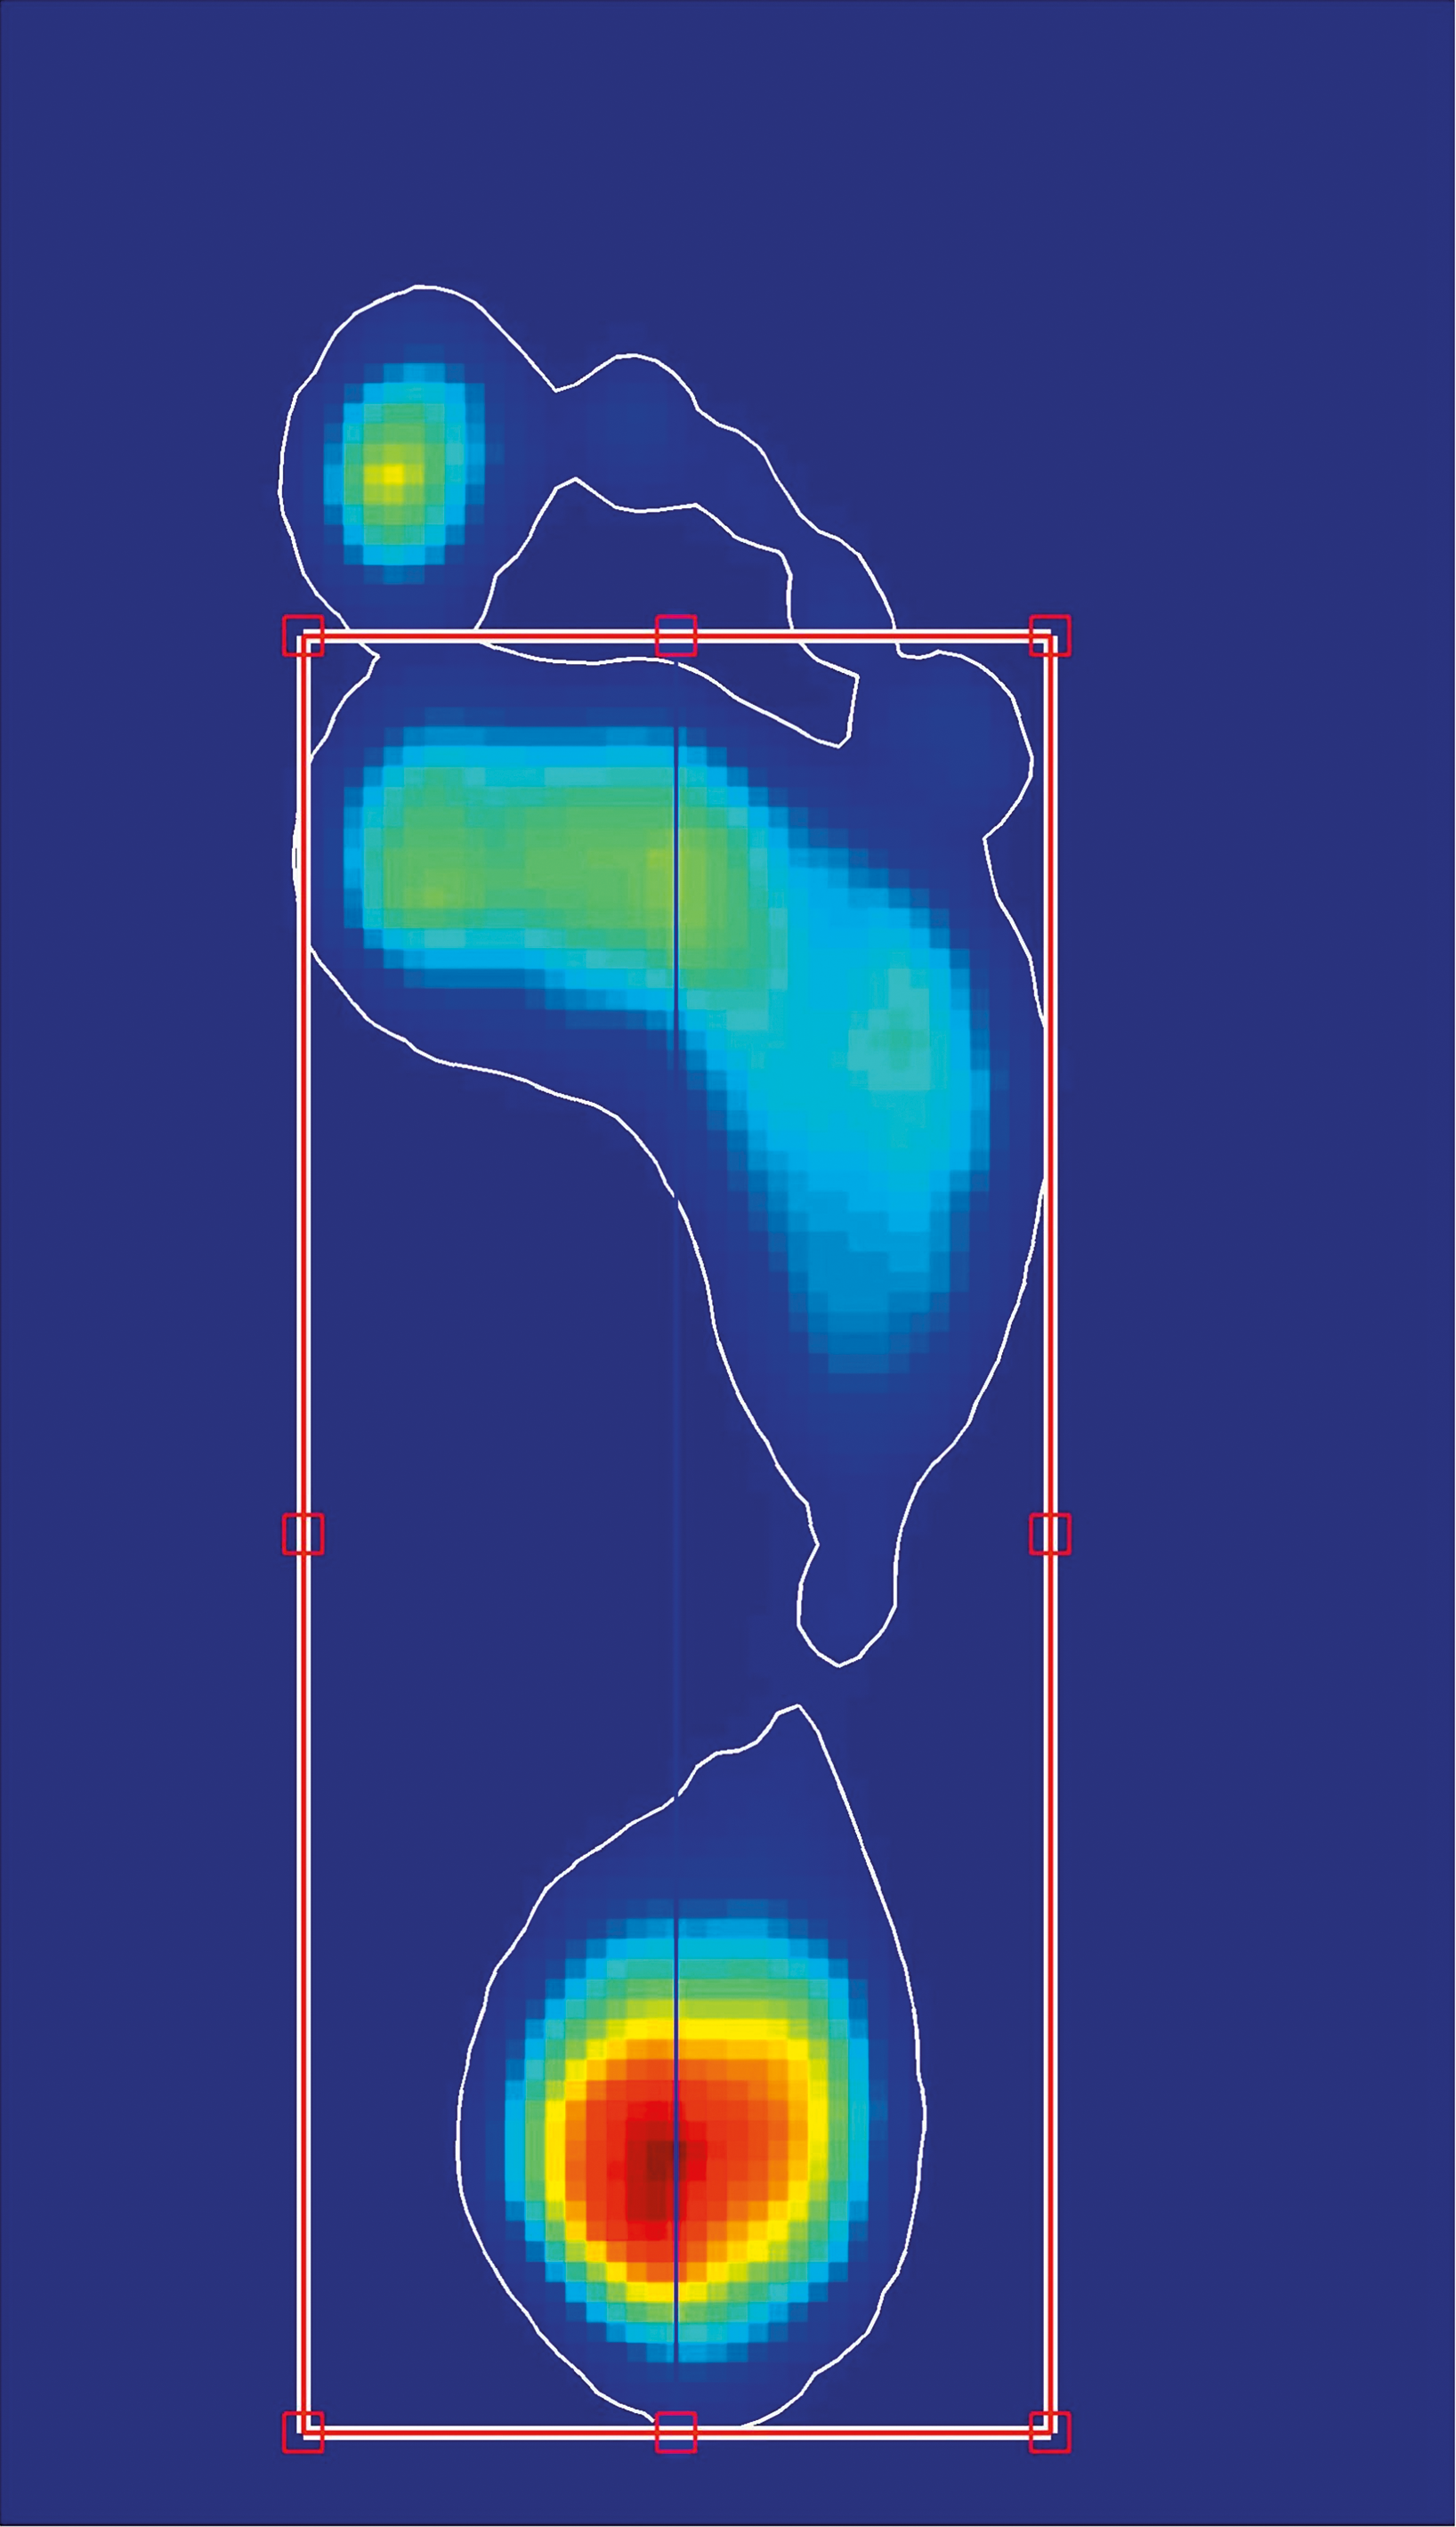
The FPA was defined as the average angle between the two tangent lines (Fig. 3). Next, the pedobarographic field was rotated over the FPA (Fig. 3), and the regionprops routine was used again to automatically calculate the bounding box of the rotated foot shape, which determined the position of the posterior aspect of the plantar heel, and the mediolateral foot width. The cross section of the mean pressure along the vertical midline of the bounding box was subsequently used to estimate the correct position of the forefoot line.
Figure 3. Same footprint as in Figure 2 after rotation (around the foot progression angle) and normalization (with respect to foot length).
Japma 106 00299 f03
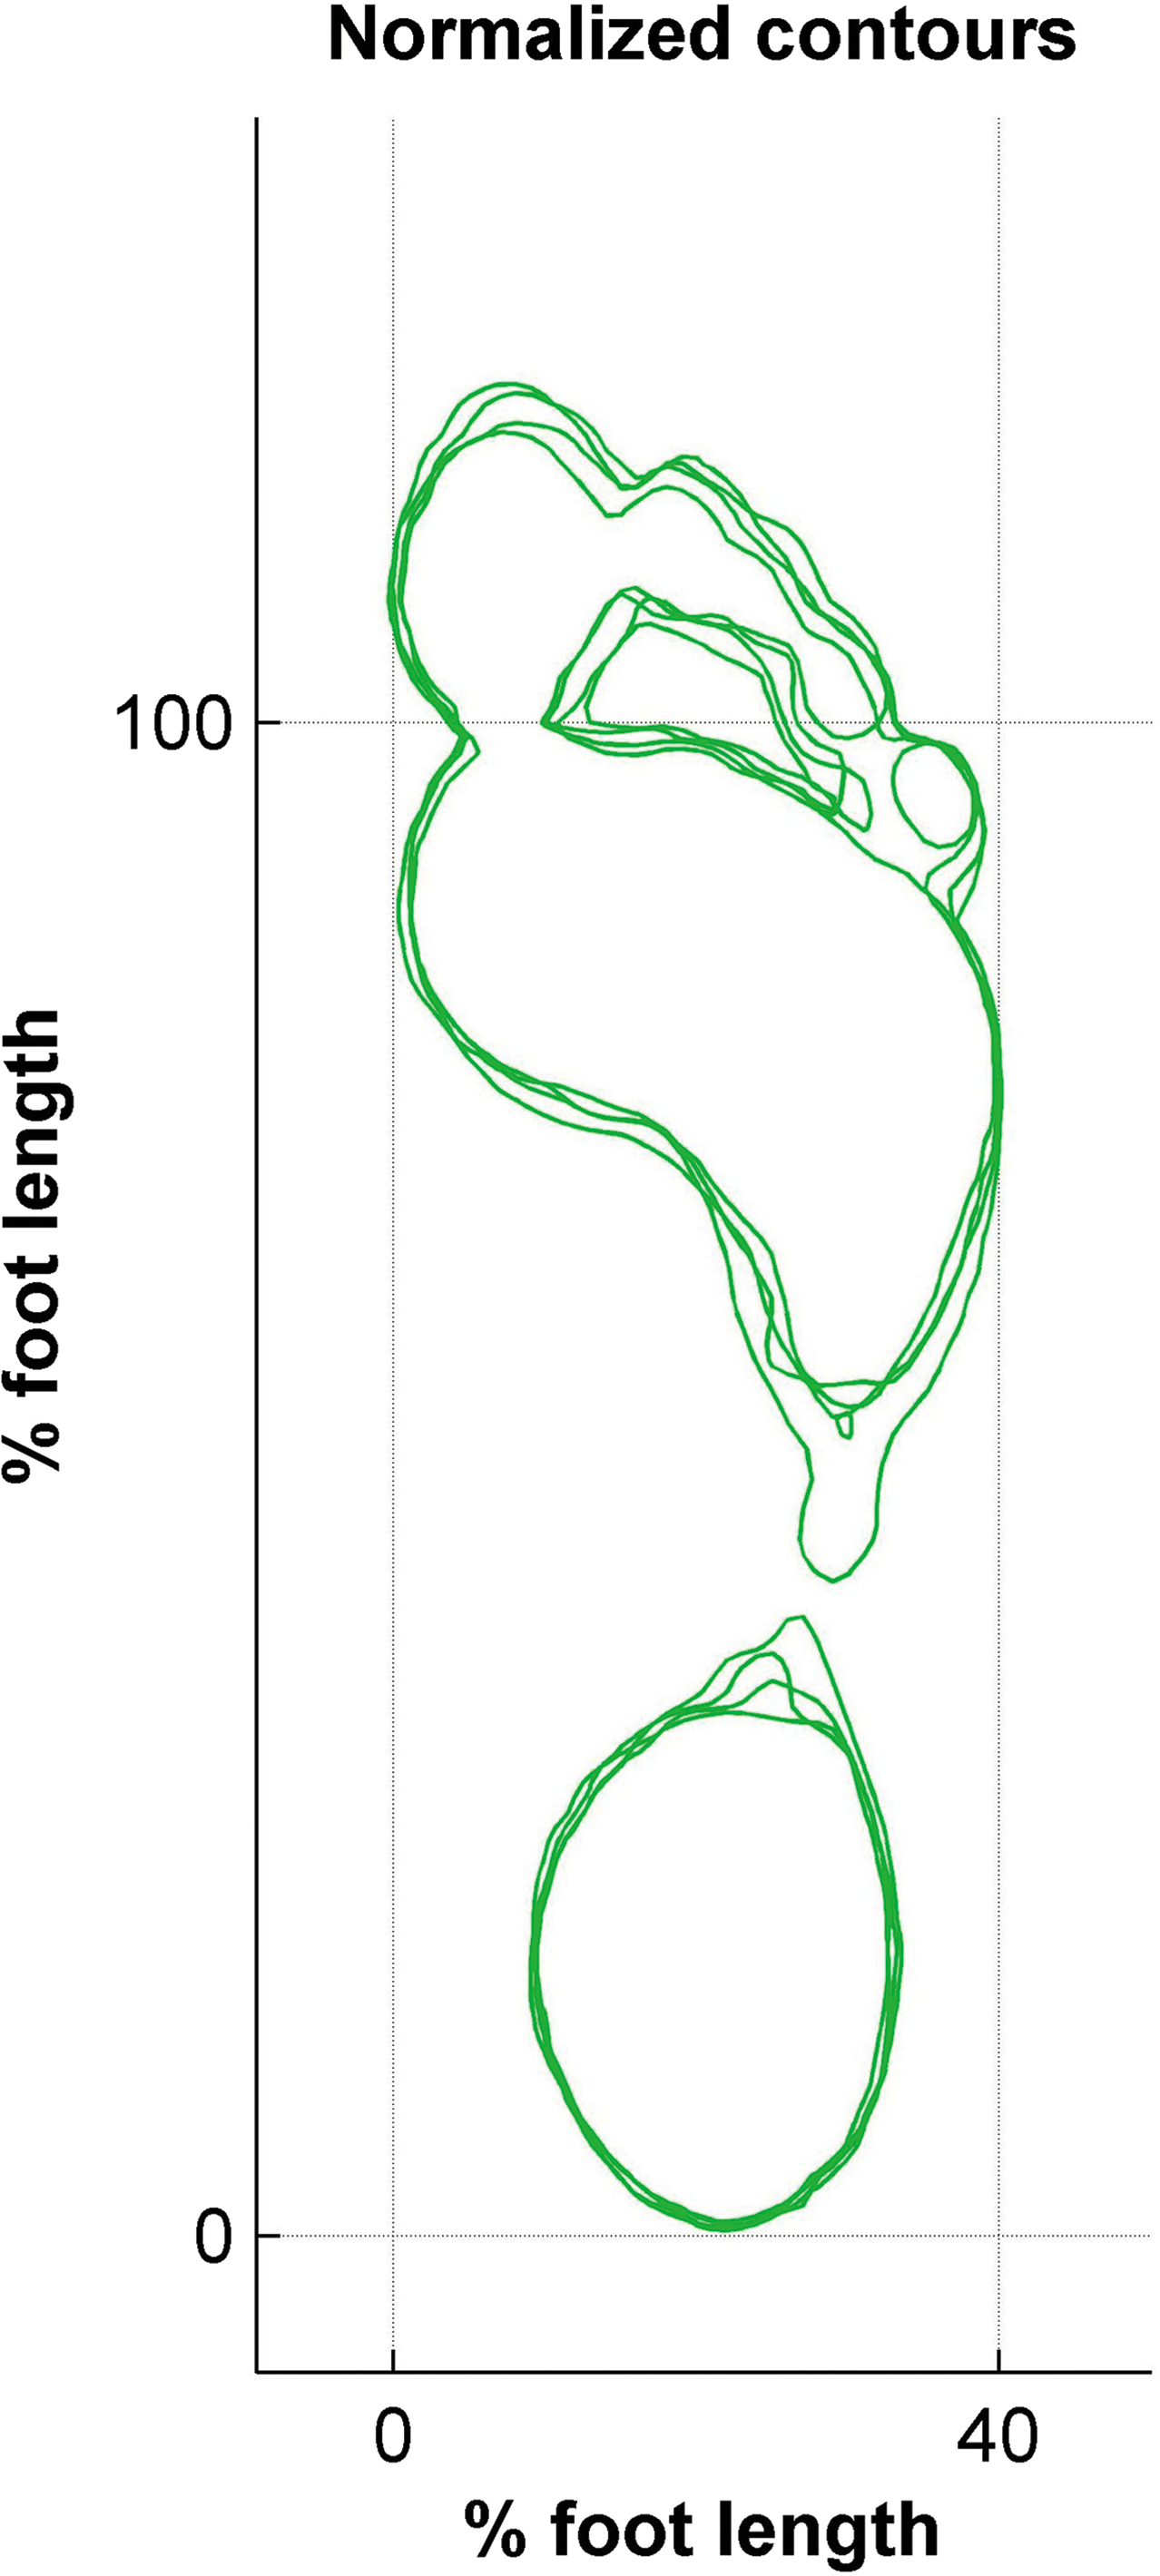
Next, the rectangular area of the rotated pedobarographic field defined by the foot width and length, as described perviously herein, was projected onto a 100 × 40 rectangle because the foot width was arbitrarily fixed to 40% of the foot length (2-D normalized plantar pressure pattern [2-D_NPPP]) (Fig. 4). The data were scaled so that the total force per time sample remained equal. Left and right foot data can be easily combined by flipping the data over the vertical axis because after normalization the middle line of the data image corresponds to the foot axis.
Figure 4. Superimposition of the contour lines of five trials of the same patient after normalization.
Japma 106 00299 f04
Finally, normalization of the time dimension (third dimension) was needed to allow temporal comparison of 2-D_NPPP. The 2-D_NPPP of the stance phase, as defined previously herein, was resampled in the time dimension using linear interpolation to 50 time samples, where the time step corresponds to 2% of the stance phase. By doing so, the 3-D_NPPP was created.

Implementation of the Color-Coding Method

Deviations among 3-D_NPPPs were subsequently visualized by implementing a color-coding method. A MATLAB routine was developed that first calculated the difference at each time sample between the mean values of a so-called reference 3-D_NPPP and a so-called observation 3-D_NPPP. Note that the reference and observation 3-D_NPPPs can be calculated on an individual level (eg, a person's left PPM) or on a group level (eg, based on the PPMs of several individuals) because all of the PPMs were first normalized for foot size and FPA (see the previous section). Subsequently a z-score was calculated on pixel level and per time frame by dividing the respective difference images by the corresponding frame-related standard deviation of the reference 3D_NPPP. This difference, in the range of ±3 SDs, was color coded as described by Manal and Stanhope.[12] Because we found it more intuitive to use red color for higher pressures and blue color for lower pressures, we chose to invert the color scheme proposed by these authors.[13]
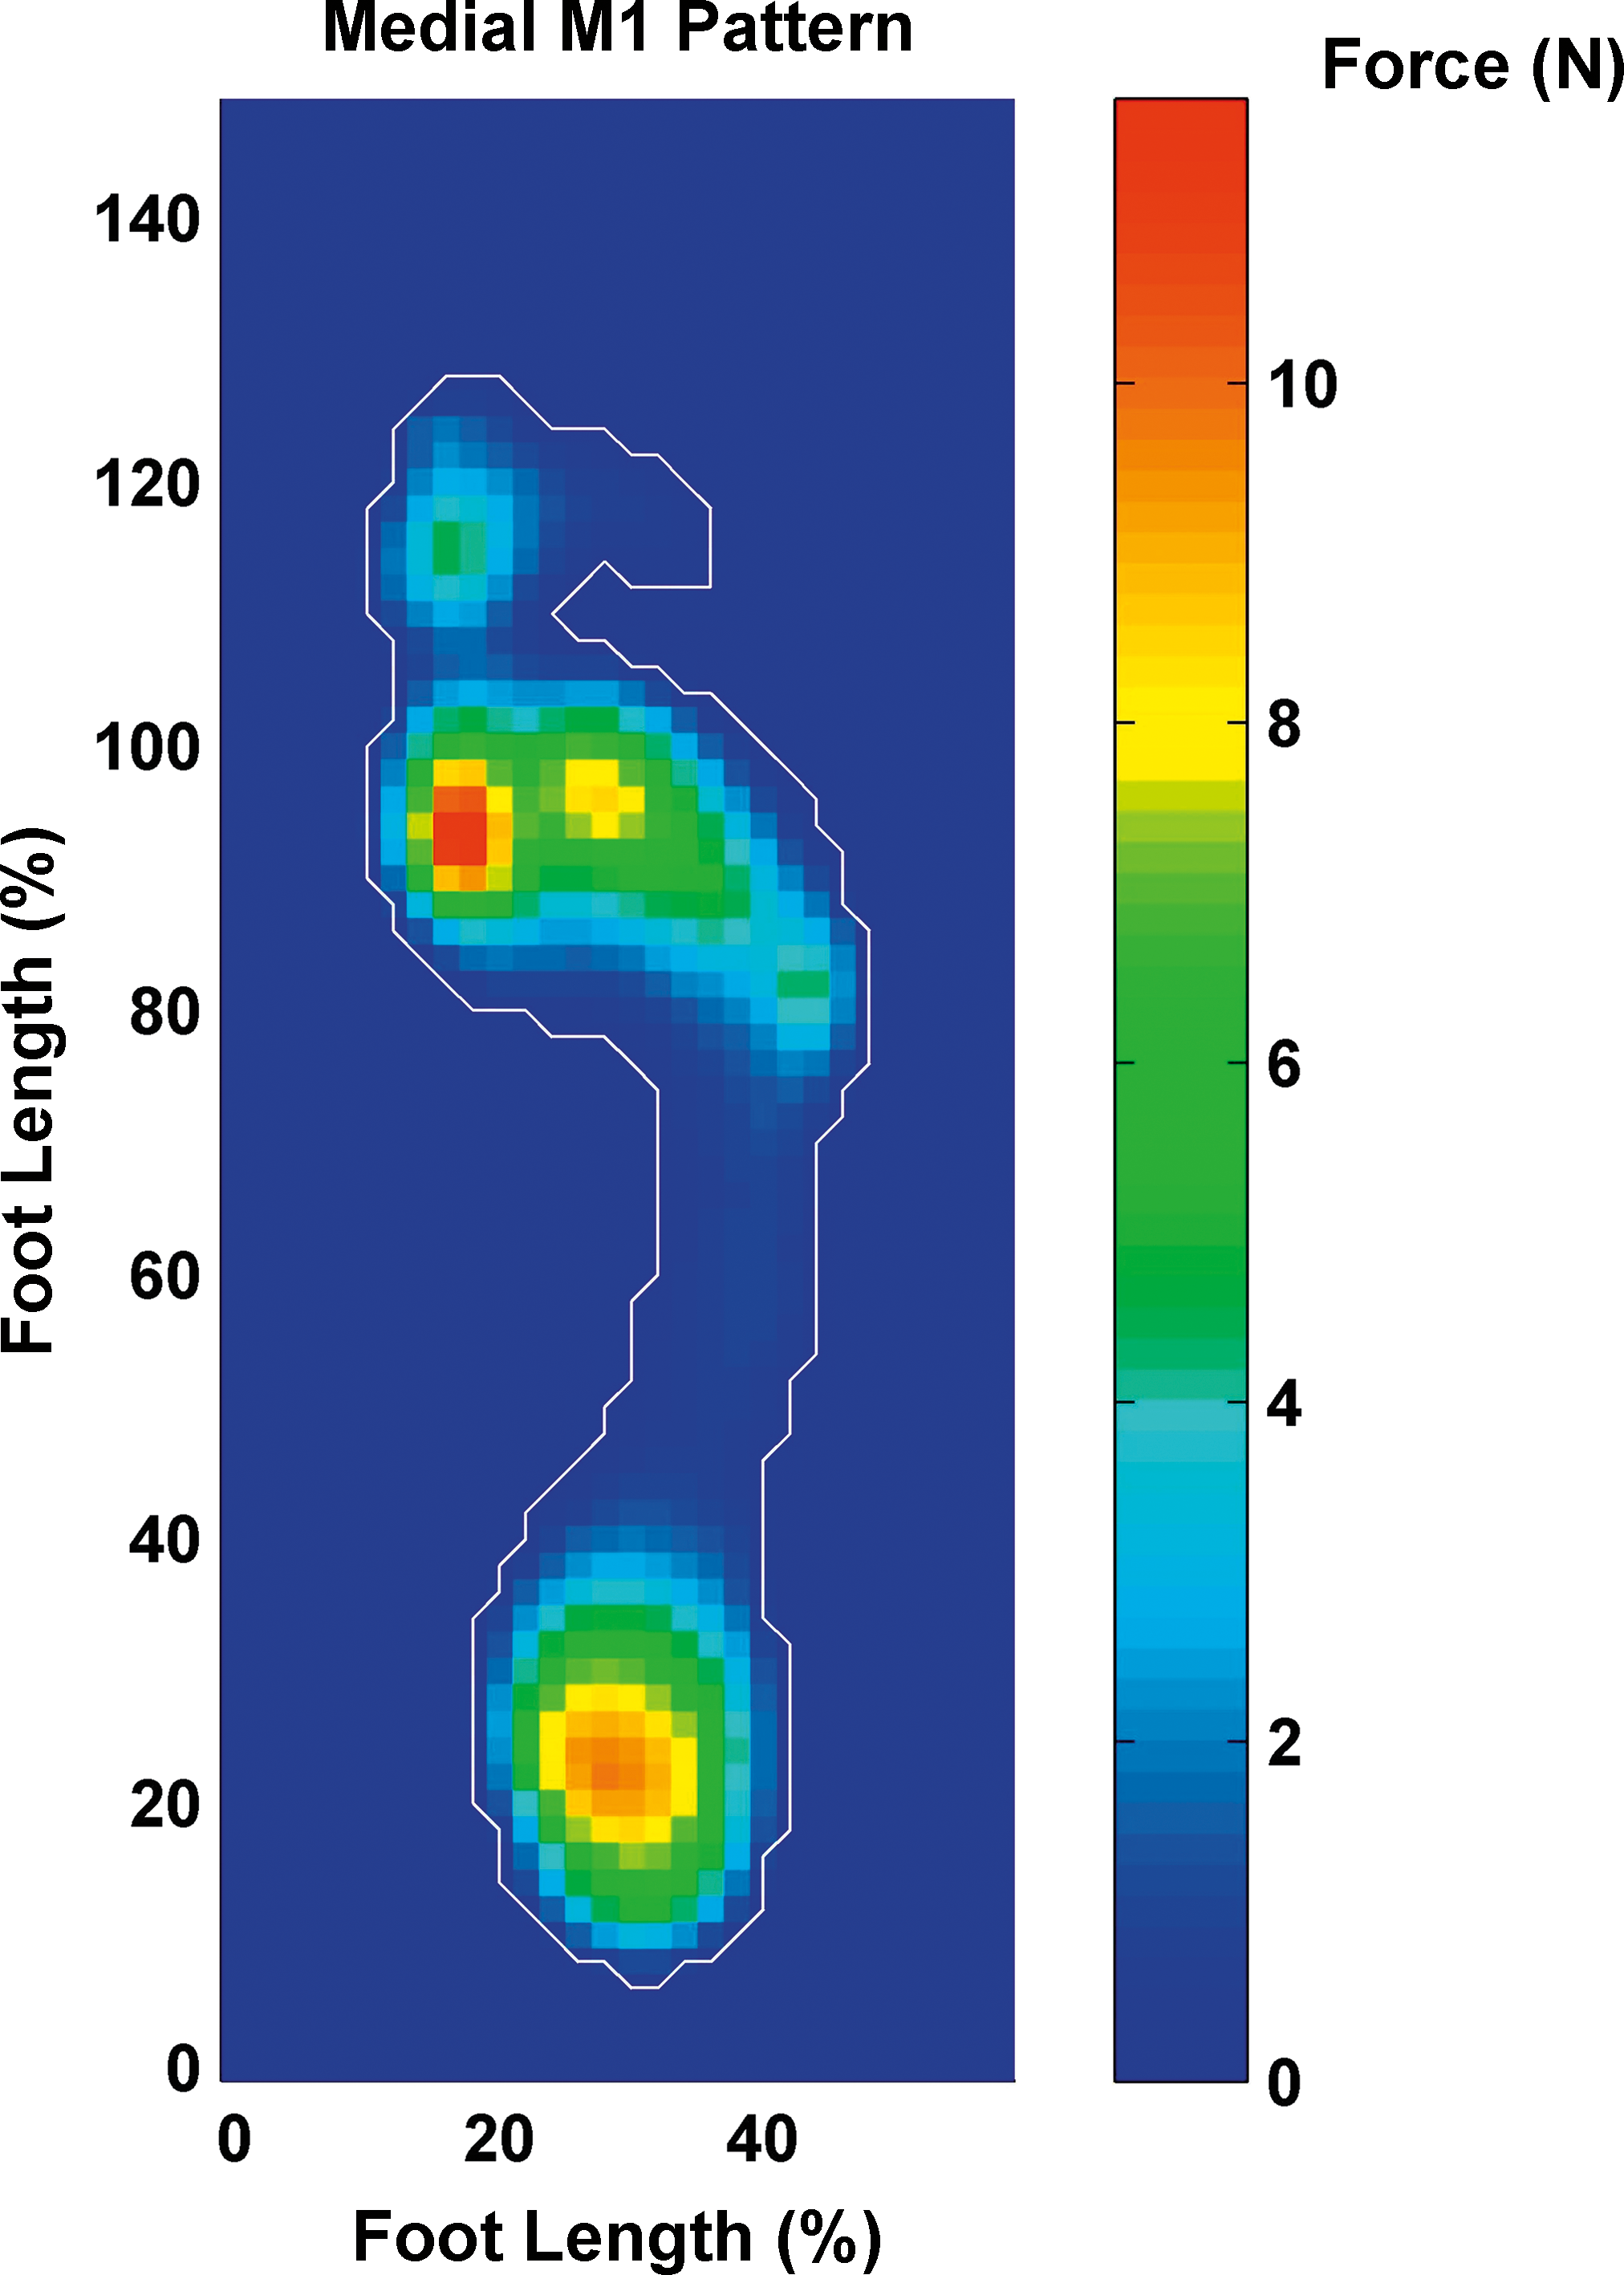
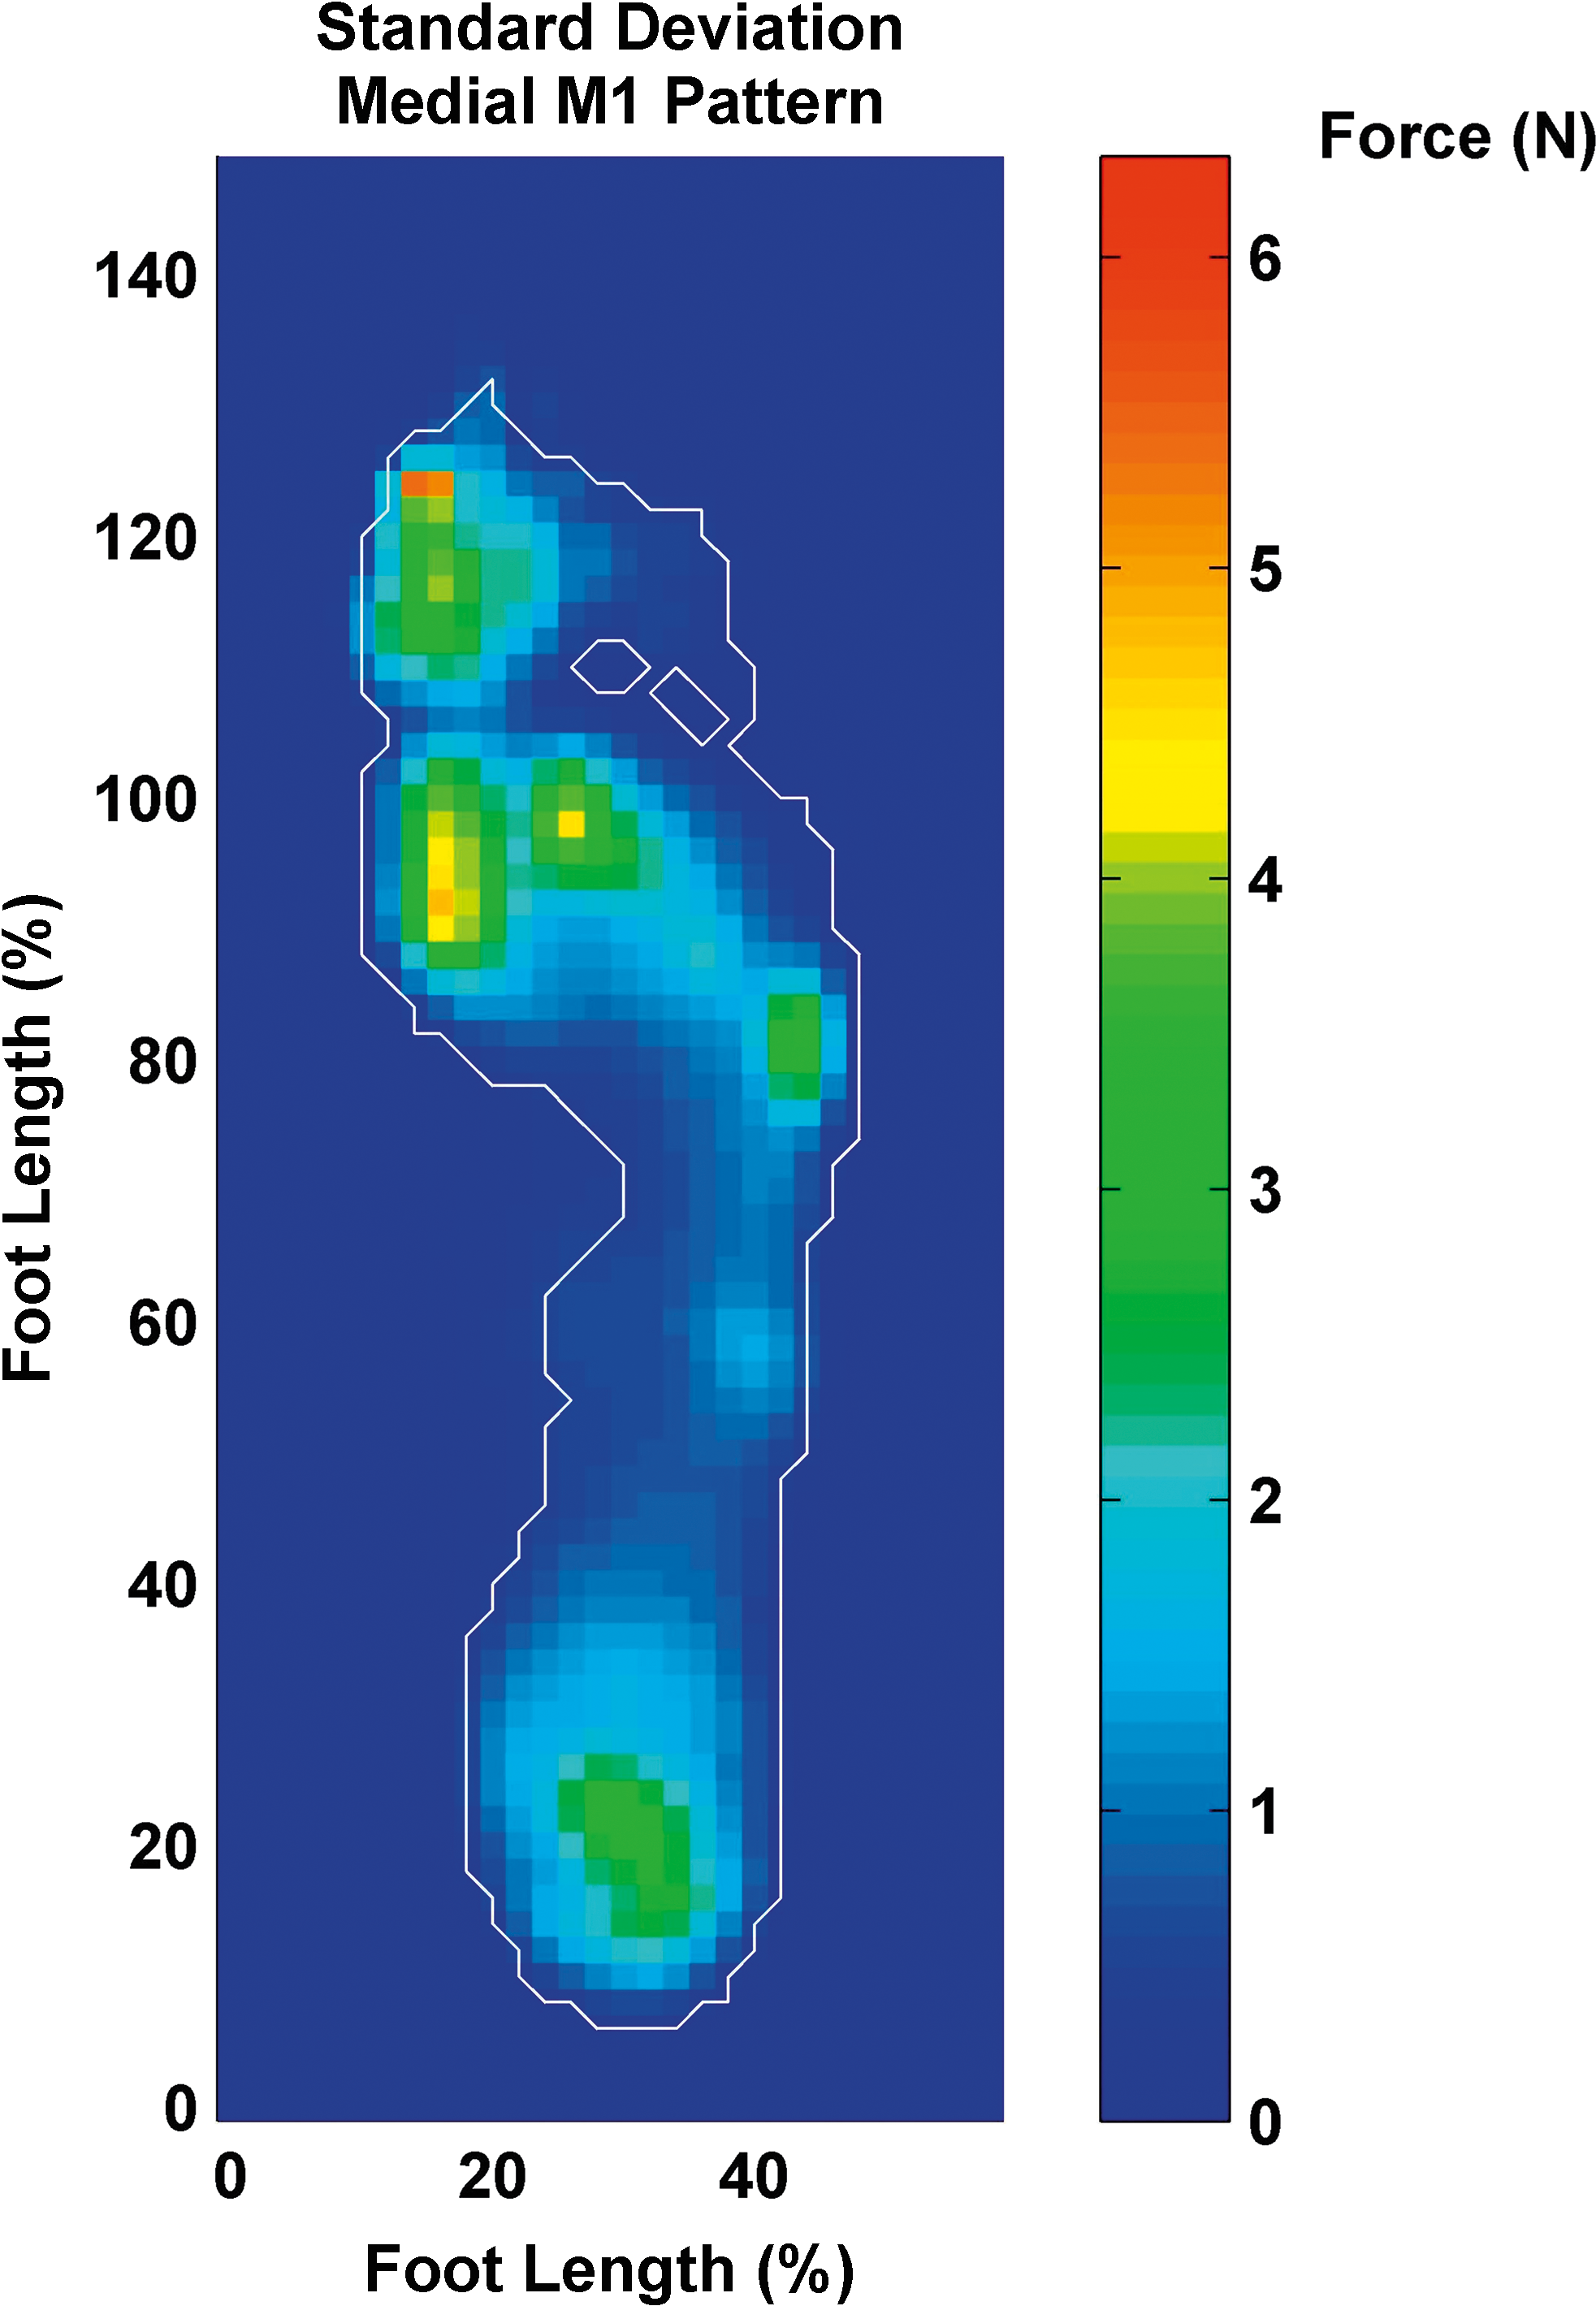
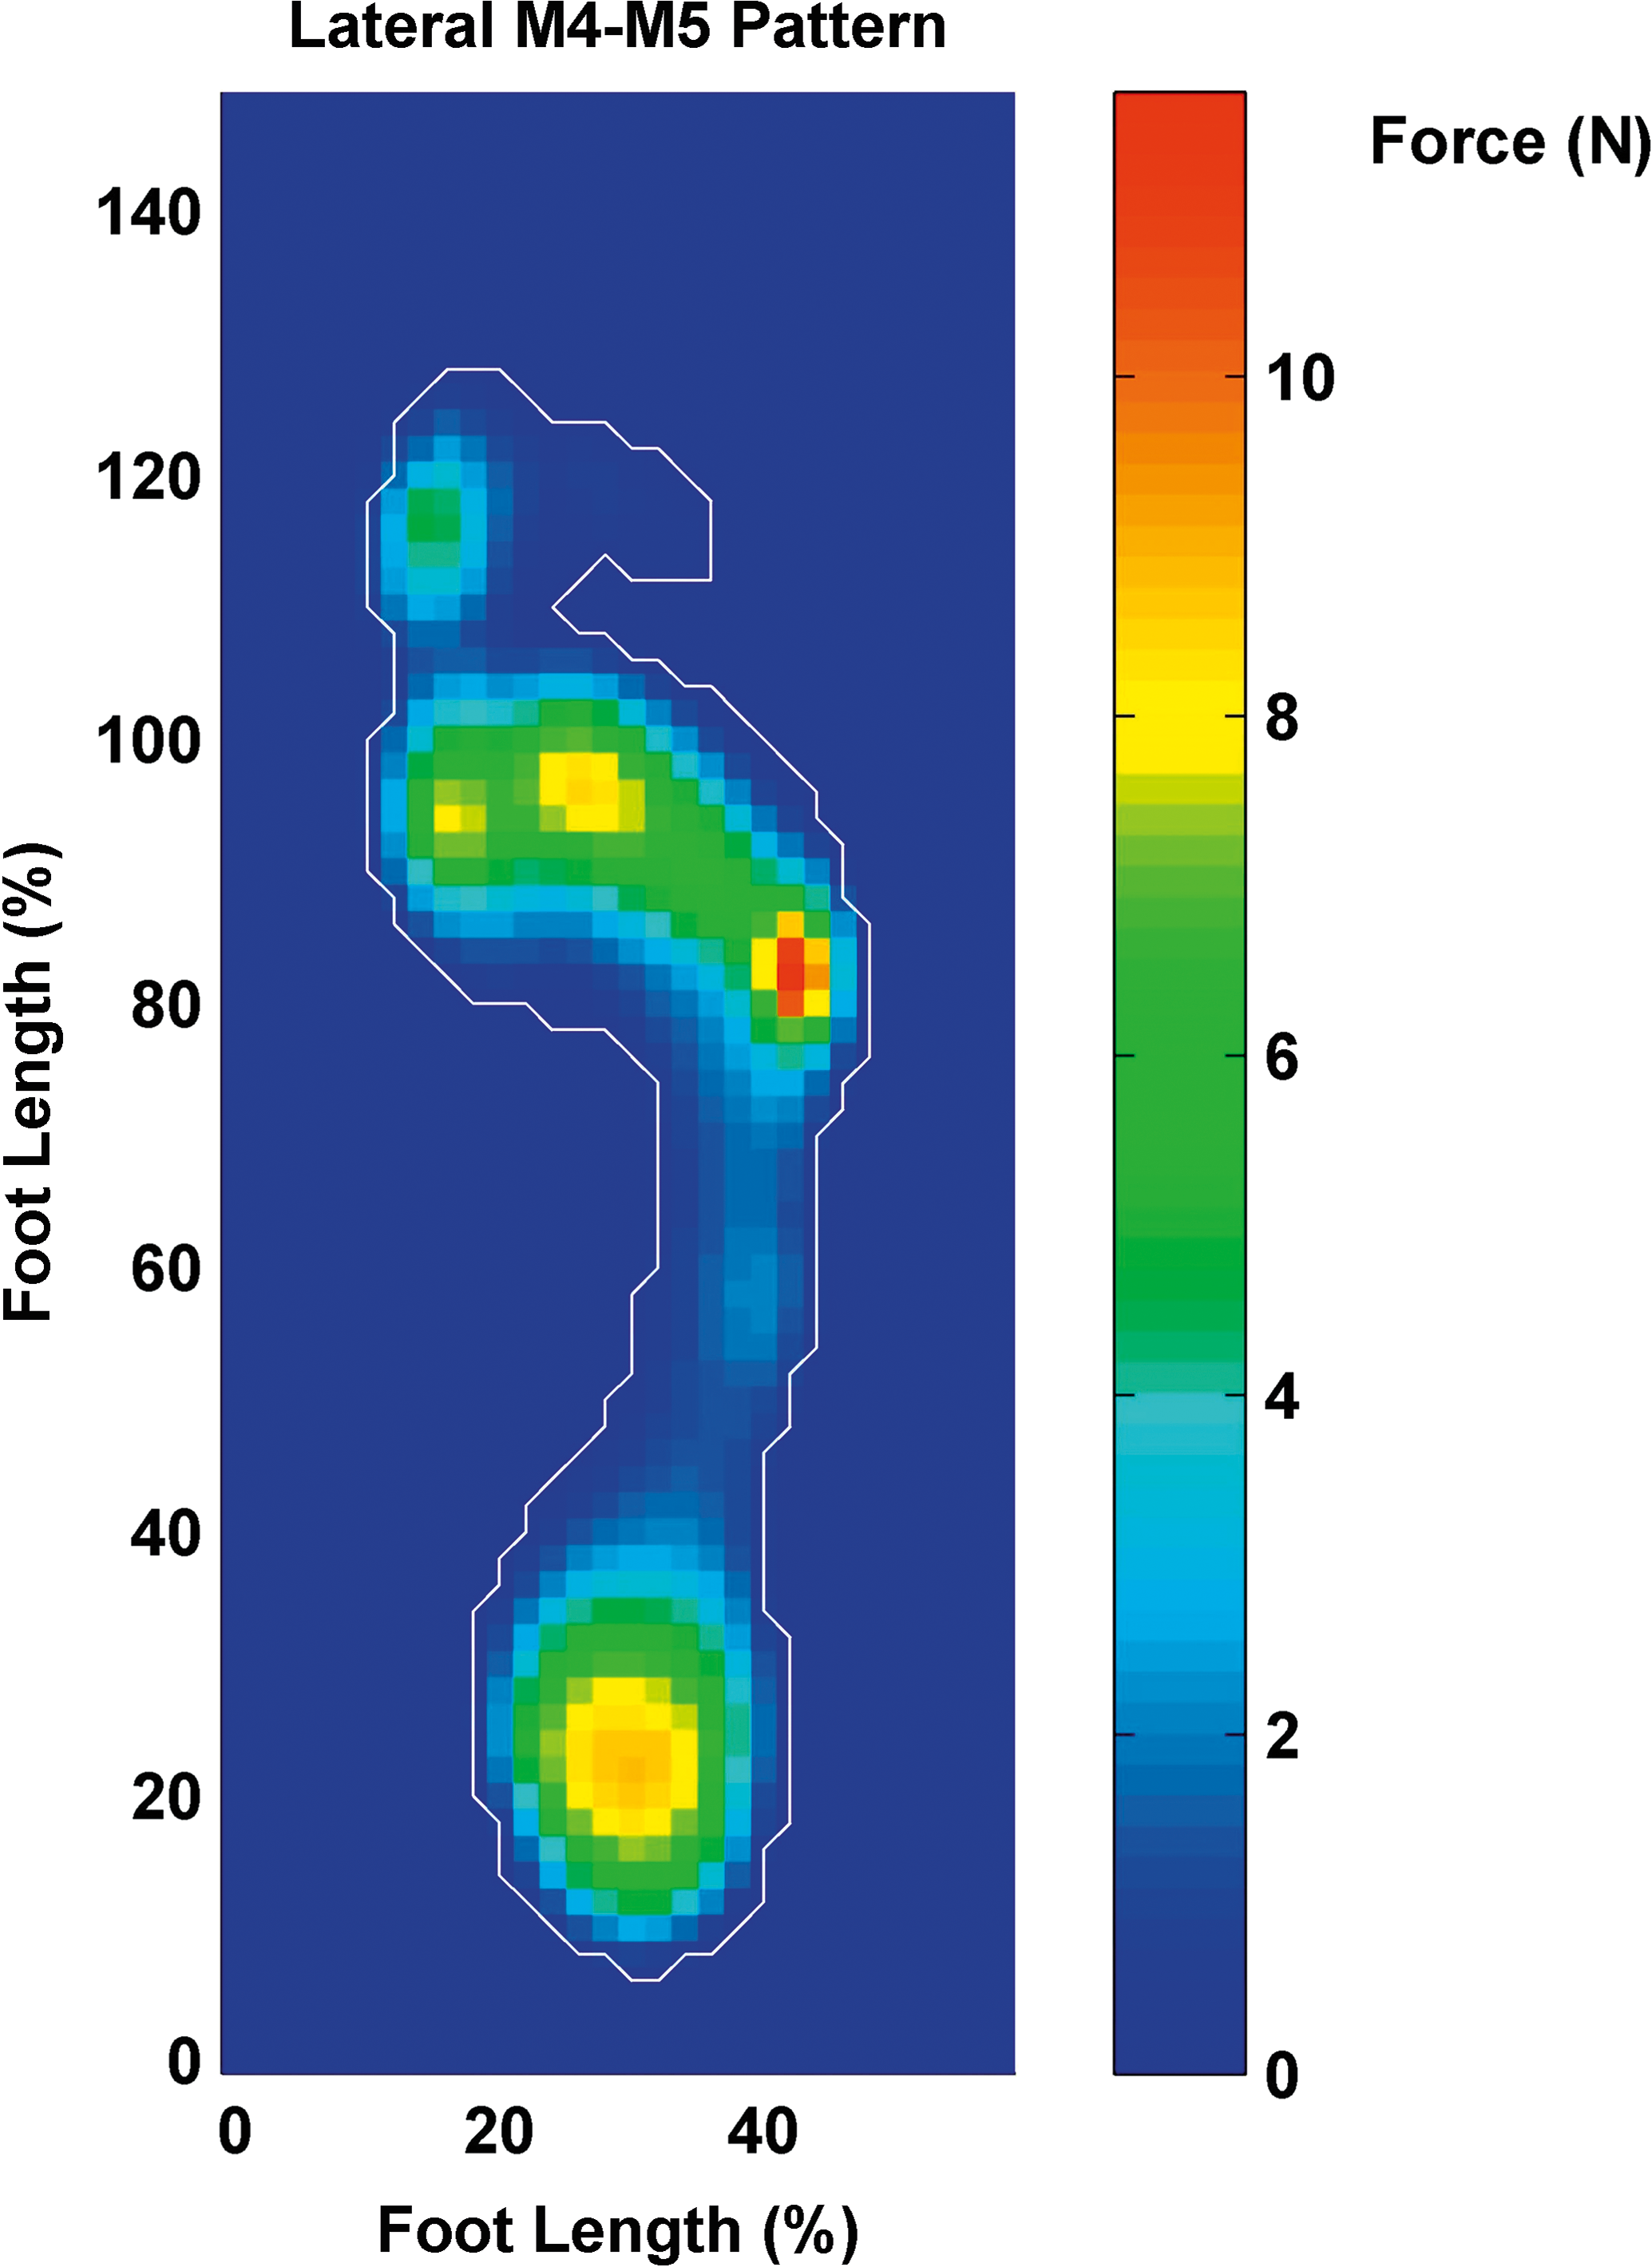
In the present article, one type of illustration was considered. A group-level analysis illustrates the color-coded output when the medial M1 pattern group (Figs. 5 and 6) serves as the reference group and the lateral M4-M5 pattern serves as the observation group (Fig. 7). All of the computations were performed in ACEPManager (Advanced Clinical Examination Platform), a MATLAB-based framework for acquisition and analysis of biomechanical measurements.
Figure 5. Illustration of the so-called reference three-dimensional normalized pedobarographic pattern at a certain time point of the stance phase (persons with the medial M1 pattern).
Japma 106 00299 f05
Figure 6. Standard deviation of the reference three-dimensional normalized pedobarographic pattern at the same time point of the stance phase as in Figure 5.
Japma 106 00299 f06
Figure 7. Mean three-dimensional normalized pedobarographic pattern of a so-called observation group at the same time point as in Figure 5 (here with the lateral M4-M5 pattern).
Japma 106 00299 f07

Results

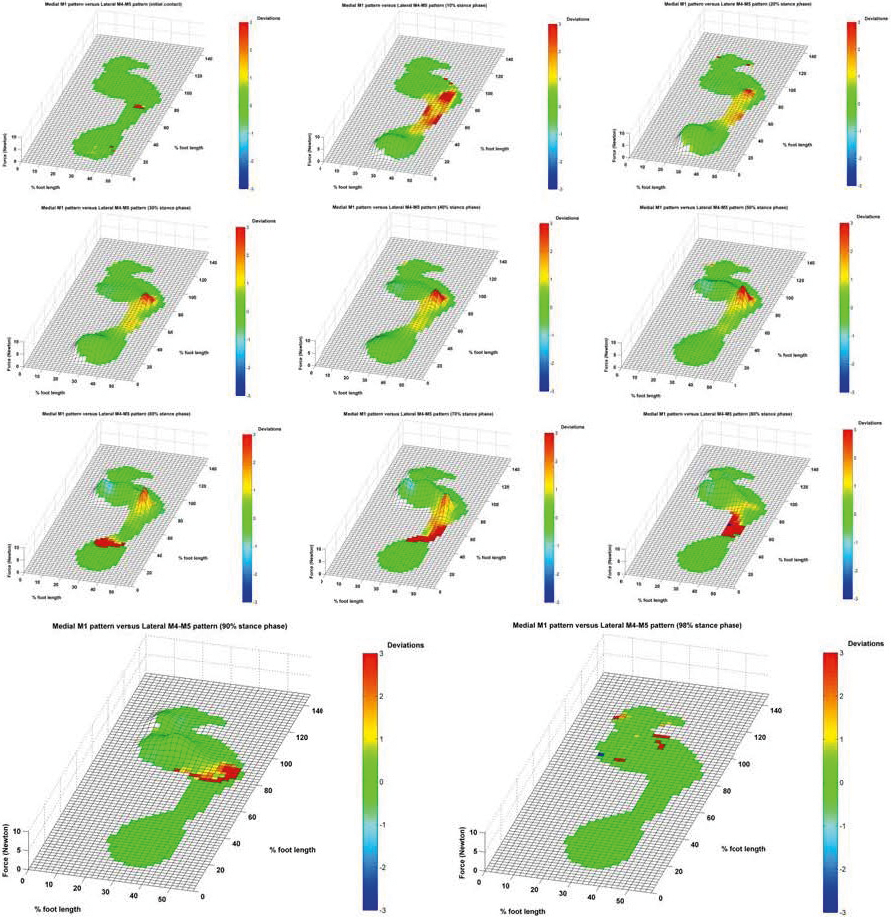
The automated preprocessing routine associated with this novel method was succesful in 95% of the cases, and manual adjustment was needed to correct the automatic estimation in the remaining cases. Considering the group analysis, frame-by-frame color coding of the force deviation at the level of the lateral M4-M5 pattern illustrated nicely the temporal behavior of this deviation (Fig. 8). The loading of the midfoot and lateral forefoot achieved already at 10% of stance the 3-SD benchmark from the reference group (the medial M1 pattern). This visualization was maintained for the rest of stance. An opposite visualization was observed at the first metatarsal head. In fact, between 50% and 80% of stance, a distinct blue coloring was observed in this region (−2 SD). Similar color-coded feedback was obtained for the patient-level analysis.
Figure 8. Temporal deviation of the lateral M4-M5 group compared with the medial M1 group. Ten-percent intervals were selected to reduce the number of figures.
Japma 106 00299 f08

Discussion

We illustrated a simple and straightforward method that can be used for the interpretation of PPMs. Frame-by-frame deviations in the PPMs were nicely captured, highlighting its interpretative and educational value. For the purpose of the present article, time normalization was arbitrarily set at 50 time points; however, this will be mainly guided by the objective of the study and the associated gait speed. In this perspective, it is also reasonable to consider multi-event normalization. In the latter, time normalization would be based not only on two gait events (typically initial contact and last foot contact) but also on additional events associated with rollover of the foot. A typical example of such events is the first metatarsal contact, forefoot flat, and heel off as described by De Cock et al.[14] In the perspective of comparative analyses, it may also be indicated to perform pixel-level normalization procedures for body weight and walking speed. The method presented in this paper addresses how the 3D_NPPP of an individual or a group differs from another individual or group. Here, color was used to depict the magnitude and direction of the deviation. An additional advantage of the present method is that a synthesis is provided in one 3-D plantar pressure field, which simplifies the interpretation considerably. The method implemented to color code the deviations is an RGB monochromatic color scheme. Other types of color schemes can be used, but we believe that the proposed color scheme is in best agreement with the typical color scheme used in PPM.
A trait of the method that might be considered a limitation is that the resulting 3-D color-coded pedobarographic field may, in some cases, be scattered. This is typically observed when pressure pattern alterations occur at a high rate. However, using the above-mentioned normalization procedures may help in providing a clearer view. One should also be careful during interpretation of the data because the resulting color-coded field relates mainly to the pixel-level standard deviation of the reference 3-D_NPPP. We are strongly convinced that this novel method is useful for the interpretation of PPMs on the one hand and can be the basis for other inferential analyses on the other hand.

Financial Disclosure

This cross-sectional study was partially funded by the Agency for Innovation by Science and Technology Flanders (grant 080659).

Conflicts of Interest

None reported.

References

  1. Giacomozzi C, Keijsers N, Pataky TC, et al: International scientific consensus on medical plantar pressure measurement devices: technical requirements and performance. Ann Ist Super Sanità48: 259, 2012.
  2. Willems TM, De Clercq D, Delbaere K, et al: A prospective study of gait related risk factors for exercise-related lower leg pain. Gait Posture23: 91, 2006.
  3. Najafi B, Crews RT, Armstrong DG, et al: Can we predict outcome of surgical reconstruction of Charcot neuroarthropathy by dynamic plantar pressure assessment? a proof of concept study. Gait Posture31: 87, 2010.
  4. Pataky TC, Maiwald C: Spatiotemporal volumetric analysis of dynamic plantar pressure data. Med Sci Sports Exerc43: 1582, 2011.
  5. Pataky TC, Caravaggi P, Savage R, et al: New insights into the plantar pressure correlates of walking speed using pedobarographic statistical parametric mapping (pSPM). J Biomech41: 1987, 2008.
  6. Keijsers NLW, Stolwijk NM, Nienhuis B, et al: A new method to normalize plantar pressure measurements for foot size and foot progression angle. J Biomech5: 87, 2009.
  7. Pataky TC, Goulermas JY: Pedobarographic statistical parametric mapping (pSPM): a pixel-level approach to foot pressure image analysis. J Biomech41: 2136, 2009.
  8. Keijsers NLW, Stolwijk NM, Louwerens JWK, et al: Classification of forefoot pain based on plantar pressure measurements. Clin Biomech (Bristol, Avon)28: 350, 2013.
  9. Maris E, Oostenveld R: Nonparametric statistical testing of EEG- and MEG-data. J Neurosci Methods164: 177, 2007.
  10. Stolwijk NM, Duysens J, Louwerens JWK, et al: Flat feet, happy feet? comparison of the dynamic plantar pressure distribution and static medial foot geometry between Malawian and Dutch adults. PLoS One8: e57209, 2013.
  11. Deschamps K, Matricali GA, Roosen P, et al: Classification of forefoot plantar pressure distribution in persons with diabetes: a novel perspective for the mechanical management of diabetic foot?PLoS One8: e79924, 2013.
  12. Manal K, Stanhope SJ: A novel method for displaying gait and clinical movement analysis data. Gait Posture20: 222, 2004.
  13. Manal K, Chang C-C, Hamill J, et al: A three-dimensional data visualization technique for reporting movement pattern deviations. J Biomech38: 2151, 2005.
  14. De Cock A, De Clercq D, Willems T, et al: Temporal characteristics of foot roll-over during barefoot jogging: reference data for young adults. Gait Posture21: 432, 2005.