


Abstract
Background: Anthropometric status can influence gait biomechanics, but there is relatively little published research regarding foot and ankle characteristics in the obese pediatric population. We sought to compare the structural and functional characteristics of the foot and ankle complex in obese and non-obese children. Methods: Twenty healthy children (ten obese and ten normal weight) were recruited for a cross-sectional research study. Anthropometric parameters were measured to evaluate active ankle dorsiflexion, arch height (arch height index, arch rigidity index ratio, and arch drop), foot alignment (resting calcaneal stance position and forefoot-rearfoot alignment in unloaded and loaded positions), and foot type (malleolar valgus index). Independent t tests determined significant differences between groups for all assessed parameters. Statistical significance was set at P < .0125. Results: Compared with non-obese participants, obese participants had significantly greater arch drop (mean ± SD: 5.10 ± 2.13 mm versus 2.90 ± 1.20 mm; P =.011) and a trend toward lower arch rigidity index ratios (mean ± SD: 0.92 ± 0.03 versus 0.95 ± 0.02; P = .013). In addition, obese participants had significantly less active ankle dorsiflexion at 90° of knee flexion versus non-obese participants (mean ± SD: 19.57 ± 5.17 versus 29.07 ± 3.06; P < .001). No significant differences existed between groups for any other anthropometric measurements. Conclusions: The decreased active ankle dorsiflexion in the obese group can increase foot contact for a longer period of the stance phase of gait. Obese participants also presented with a more flexible foot when bearing weight.
Obesity is the most common chronic illness in Western countries, and pediatric obesity is considered an epidemic by public health officials.[1] Since the National Health and Nutrition Examination Survey in 1980, the number of obese children (6–11 years of age) has doubled to encompass 16.5% of children in the United States.[2] Orthopedic conditions are associated with pediatric obesity, including deleterious anatomical and biomechanical changes.[3] In the first cohort study to examine the musculoskeletal consequences of pediatric obesity, Taylor et al [3] found that obese children had more musculoskeletal pain, greater impaired mobility, and a higher prevalence of lower-extremity malalignments than did non-obese children. The higher prevalence of lower-extremity orthopedic conditions in obese children can result in changes to body biomechanics and mobility.[3] Therefore, it is imperative to understand the degree of structural malalignments in the pediatric obese population.
Although limited research has assessed foot anthropometrics and obesity, obese children have demonstrated broader, higher, and thicker structural features in their ankles and feet than non-obese children.[4,5] Previous studies [4,6] indicate that obese children have a lower longitudinal medial arch and a lower mean arch height, which are associated with a decrease in the integrity of the foot as a weightbearing structure. These structural changes increase pressures in the foot [4,6] and the risk of musculoskeletal injury.[5] It has been reported that mean peak plantar pressures and pressure-time integrals are greater under the midfoot and the second to fifth metatarsal heads of obese children.[4,7] The increased pressures may cause structural dysfunction, resulting in collapse of the longitudinal arch and increased risk of stress fracture, increased pain, and decreased participation in weightbearing activities.
The few anthropometric studies completed on obese children [4,6] have focused on plantar pressures and arch indices. Functional characteristics, such as flexibility, alignment, and foot type, are important contributing factors to changes in gait biomechanics (ie, subtalar joint pronation and center of pressure excursions) throughout the lower-extremity kinetic chain.[8–11] The purpose of this study was to determine whether anthropometric differences exist in the foot and ankle complex between obese and non-obese children.
Methods
Participants
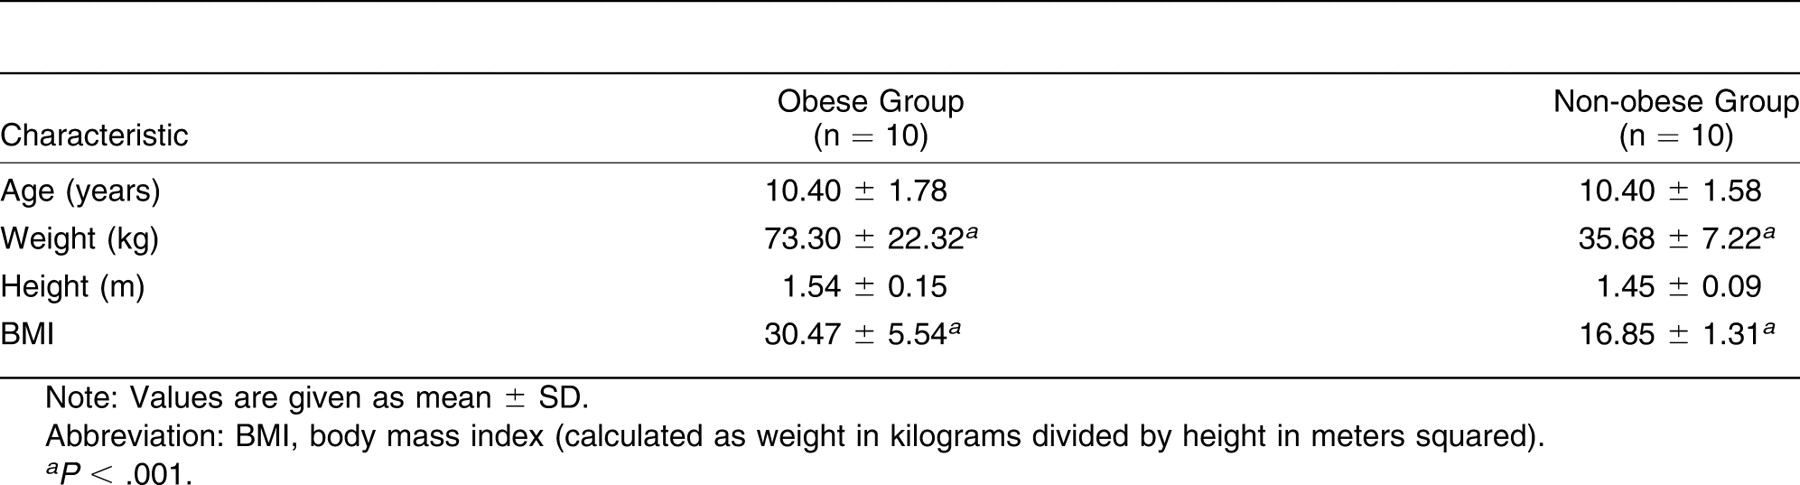
Ten obese and ten non-obese children (14 boys and 6 girls) participated in this study. All of the participants were 8 to 12 years of age and were recruited from physician referrals at Temple University Children’s Hospital (Philadelphia, Pennsylvania) and advertisements. Descriptive characteristics of the participants are presented in Table 1. All of the obese participants had a calculated body mass index greater than the 95th percentile.[12] In non-obese participants, the body mass index was less than the 75th percentile, and this group was age- and sex-matched to obese participants. Children were excluded if their health history included neuromusculoskeletal disease, non–insulin-dependent diabetes mellitus, or previous lower-extremity surgery. This study was approved by the Temple University institutional review board. All of the participants signed approved informed assent forms, and the guardians of all of the participants signed approved informed consent forms.
Table 1.
Descriptive Characteristics of the Obese and Non-obese Groups
Measurements
Primary Outcome: Arch Height. The arch height index measurement system, developed at the Temple University School of Podiatric Medicine, was used for all of the arch height measurements. The arch height index measurement system device consisted of a heel cup and a series of sliding calipers (Fig. 1), and it appears similar to a Brannock measurement device for determining shoe size.[13]
Figure 1.
Arch height index measurement system device positioned to the foot. The foot is positioned on two platforms, without support for the midfoot. The calcaneus rests against the heel cup. The horizontal sliding bars measure total and truncated foot length, and the vertical sliding bar measures dorsum height.
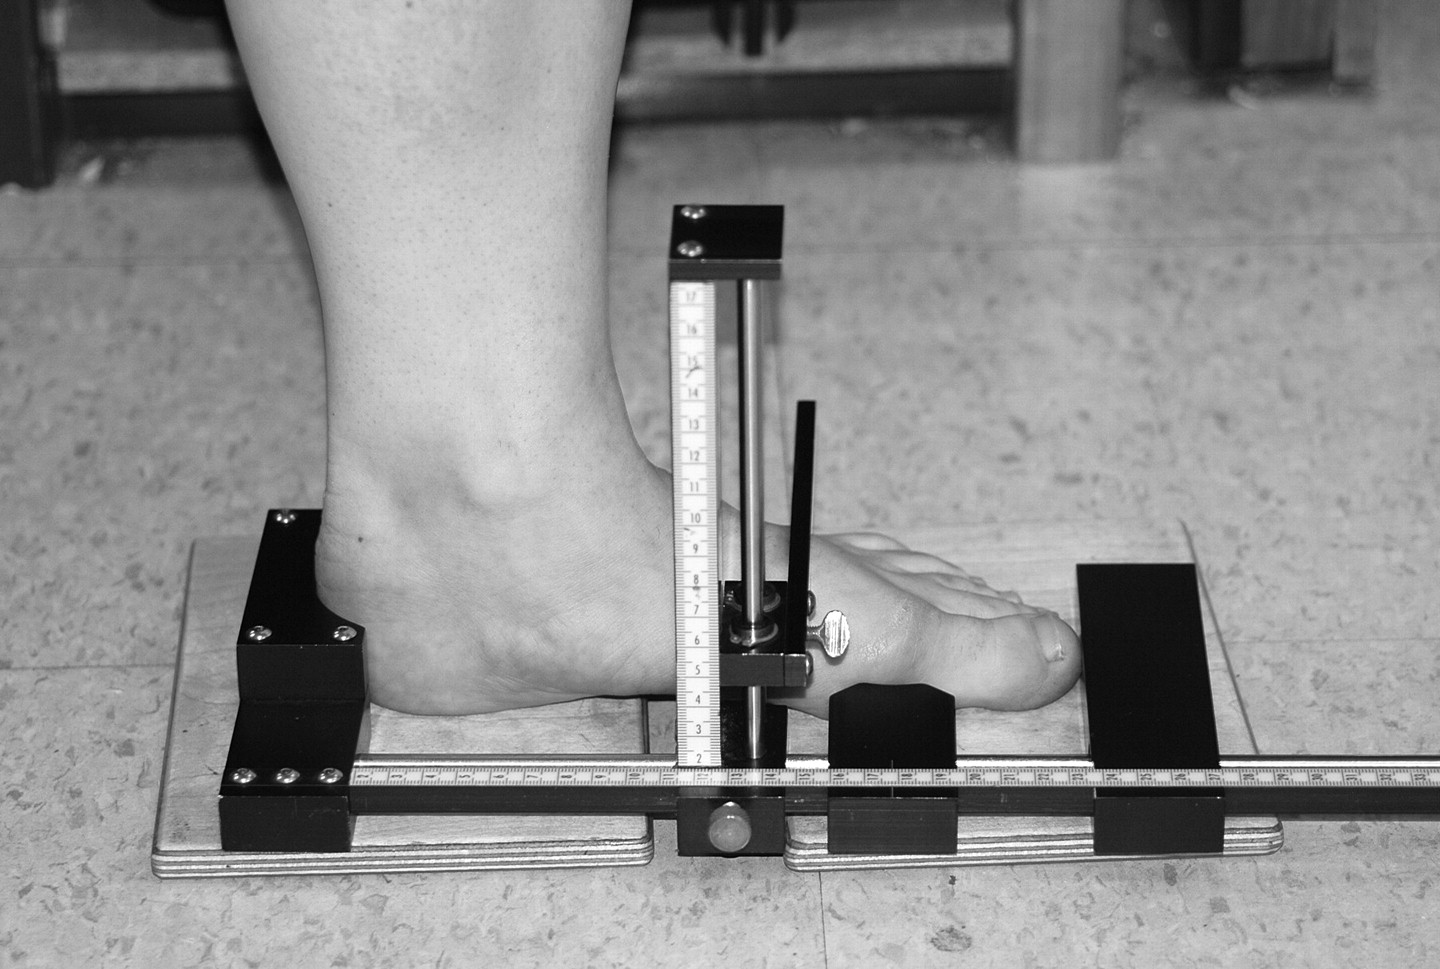
All of the participants were tested barefoot with their feet positioned shoulder-width apart. Measurements were taken while the participant was sitting (nonweightbearing) and standing (weightbearing). Two 5-cm-thick platforms supported the forefoot and the hindfoot, allowing for maximum collapse of the medial longitudinal arch. The participant’s foot was positioned on the instrument with the calcaneus against the heel rest (Fig. 1). The long horizontal sliding arm was aligned with the distal end of the longest toe to measure the foot length. The shorter horizontal sliding arm was aligned with the medial border of the first metatarsophalangeal joint to measure truncated foot length. The vertical sliding bar was positioned at 50% of the foot length to measure the dorsum height (ie, arch height) of the midfoot. The height of the midfoot was recorded as arch height.
Arch height parameters were calculated to assess the effect of excess mass on foot mobility.[13,14] Arch height index was used to measure foot flexibility when moving from a seated to a standing position. Arch height index was calculated by dividing the recorded arch height by the ipsilateral truncated foot length. The arch rigidity index ratio describes the ability of the foot to maintain the structural arch when placed in a weightbearing position.[14] The arch rigidity index ratio was determined by dividing the standing arch height index by the sitting arch height index. A lower arch rigidity index ratio indicates a decrease in the ability to maintain the longitudinal arch while in a weightbearing position. Arch drop was used to determine the amount of flexibility that occurs in the foot when transferring from a nonweightbearing to a weightbearing position.[14] Arch drop was calculated by subtracting the recorded arch height at standing from the recorded arch height at sitting. An increase in the arch drop value indicates greater flexibility in the longitudinal arch while in a weightbearing position. Intrarater and interrater reliabilities for arch height index measurements have been published with intraclass correlation coefficient (ICC) values of 0.94 and 0.99, respectively.[13]
Secondary Outcomes. Foot Alignment. The bisection of the calcaneus was determined before measuring any foot alignment parameter. To identify this landmark, the calcaneus was palpated along its medial and lateral borders. A line was drawn with a felt-tipped pen on the participant through the superior to inferior aspects of the posterior calcaneus to indicate the midline of the bone.
The forefoot-rearfoot relationship was used to describe the effect of the forefoot on pronation through the identification of foot type (ie, planus, rectus, or cavus).[10] The assessment measured the position of the forefoot (ie, the metatarsal rays) in relation to the rearfoot (ie, the midline of the calcaneus) and was completed in the unloaded and loaded positions. The participant was positioned prone with the foot hanging over the edge of the plinth. During the unloaded position, the subtalar joint was maintained in a neutral position while the edge of the stationary arm of the goniometer was placed against the fifth metatarsal head and the movement arm was aligned perpendicular to the rearfoot bisection.[15] During the loaded position, the investigator applied a consistent passive dorsiflexion loading force across the five metatarsal heads. The goniometer was aligned in a similar manner as in the unloaded position. Measurements were assessed in degrees, with varus (negative degrees) and valgus (positive degrees) describing the direction of the angle. A foot is considered planus if the alignment is greater than 4° varus and as cavus if the alignment is greater than 4° valgus.[16] One trial was performed bilaterally.
The resting calcaneal stance position was used to describe the position of the hindfoot (ie, varus or valgus) as it relates to biomechanical function (ie, pronation). The resting calcaneal stance position was measured with the participant standing and the feet positioned shoulder-width apart. The calcaneal bisection was evaluated using the same protocol described for the measurement of forefoot-rearfoot alignment. The axis of the goniometer was aligned with the calcaneal tuberosity, the stationary arm of the goniometer was aligned with the ground, and the movement arm was aligned with the calcaneal bisection. The resting calcaneal stance position was measured in degrees and was used to determine whether the hindfoot was in a varus or valgus position. A varus position (negative degrees) was defined as greater than 90° on the goniometer. A valgus position (positive degrees) was defined as less than 90° on the goniometer. One trial was performed bilaterally.
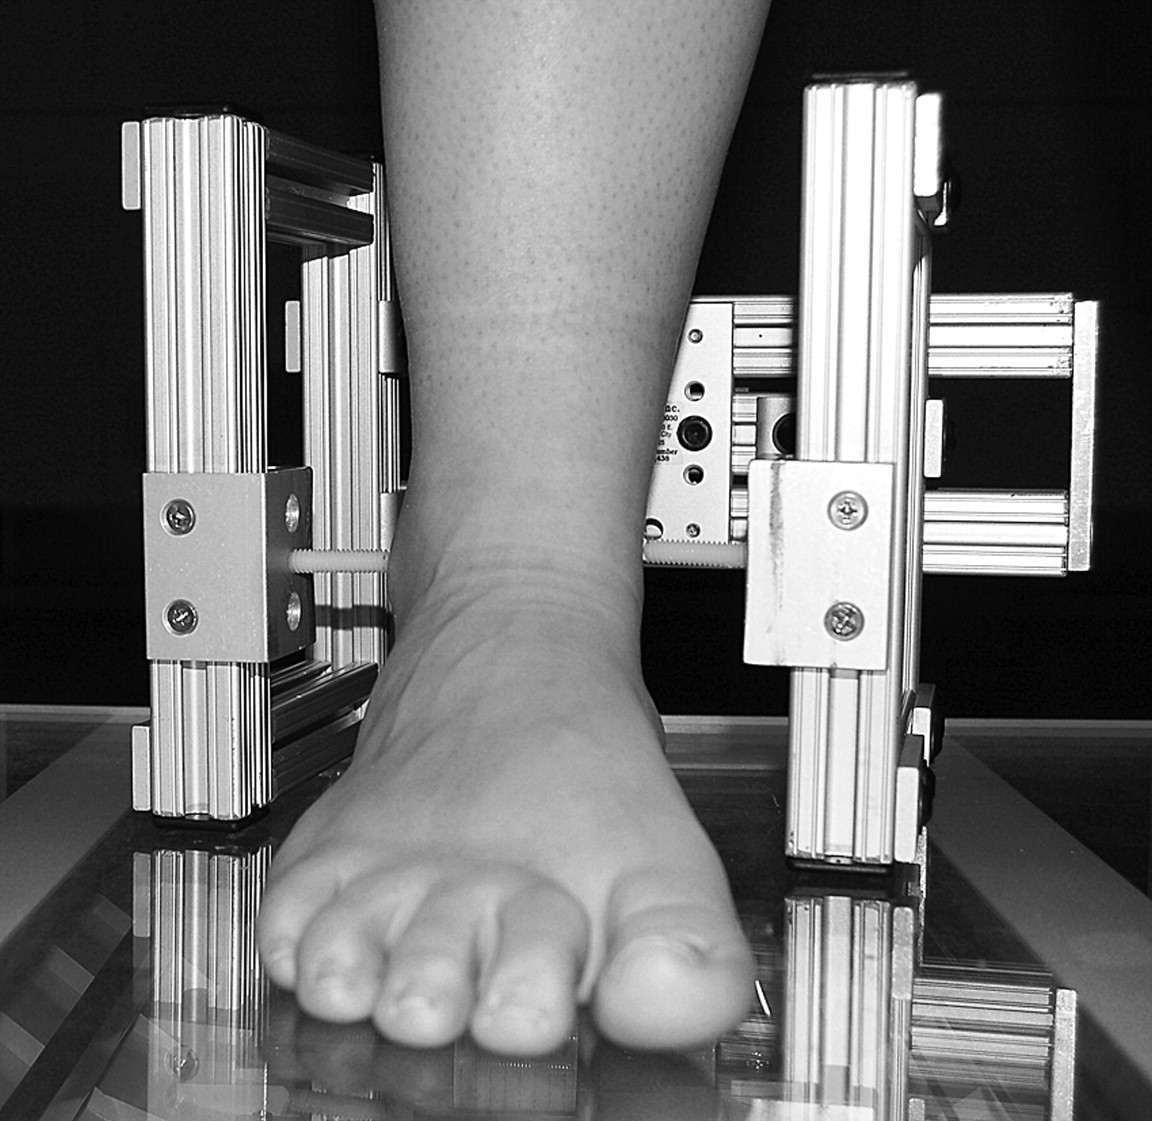
Foot Type. The malleolar valgus index is used to quantify the degree of pronatory malalignment in the rearfoot while weightbearing.[8,10] The malleolar valgus index was assessed using a scanned image of the foot in the resting calcaneal stance position. The malleolar valgus index jig, developed at the Gait Study Center at Temple University School of Podiatric Medicine, was used to standardize foot position, and it was adjusted to the most prominent points of the malleoli on the test foot. A scanned image of the participant’s test foot was collected while he or she stood comfortably in a neutral base of support and angle of stance on a 2.24-cm-thick platform with one foot over an optical flatbed scanner (HP Scanjet 7400c; Hewlett-Packard Co, Palo Alto, California) (Fig. 2). An illustration of the foot image in the weightbearing position was made in 8-bit grayscale. The scanned image was transported into photo-editing software (Adobe Photoshop Elements; Adobe Systems Inc, San Jose, California) to correct for aspect ratio error and was expressed in eight levels of gray. One trial was completed bilaterally for each participant.
Figure 2.
The malleolar valgus index setup. The jig is adjusted to the width and height of the malleoli by adjusting the medial and lateral extension bars to the bony prominences of the medial and lateral malleoli.
In the scanned image, the medial and lateral malleoli positions were identified, and a foot coordinate system was created using the anterior, posterior, medial, and lateral borderlines of the foot. The foot bisection was determined using the midpoints of the anterior and posterior borderlines. The malleolar bisection was found along the posterior borderline, at the median of the lateral and medial malleoli.[10] The malleolar valgus index, reported as a percentage, was determined using the following formula: [BC/(ML – MOV)] × 100, where BC is the distance between the foot bisection and the malleolar bisection, ML is the distance between the medial and lateral reference points of the malleolar valgus index jig, and MOV is the malleolar valgus constant (99.7 mm), which defines the distance between the outer edges of the jig and the end points of the sliding arms adjusted to the malleoli. Therefore, ML – MOV describes the distance between the lateral and medial malleoli. A value greater than or equal to 13.6% is classified as a pes planus foot type. A value ranging from 3.61% to 13.5% is classified as a rectus foot type.[15]
Tertiary Outcome: Active Ankle Dorsiflexion. Active ankle dorsiflexion was measured with the participant prone on a plinth and the knee at 0° of extension and 90° of flexion. Assessment was measured in degrees using a 1°-increment goniometer (Fred Sammons Inc, Bissell Healthcare Corp, Brookfield, Illinois). The axis, stationary arm, and movement arm of the goniometer were aligned with the lateral malleolus, lateral border of the fibula, and lateral border of the foot, respectively.[17] With the knee at 0° of extension and the subtalar joint in a neutral position, the participant actively dorsiflexed his or her foot, and the angle was measured. Data from three trials were collected and averaged to the nearest degree. This process was repeated with the knee at 90° of flexion.
Statistical Analysis. As part of a more comprehensive biomechanical study by Shultz et al,[18] a priori sample size was completed on the kinetic and kinematic variables examined, with ten per group proving to be adequate for significant biomechanical differences. Arch height, foot morphologic features, and ankle range of motion were categorized as primary, secondary, and tertiary outcomes, respectively. The a posteriori power analysis on the anthropometric variables resulted in sufficient power for two of the three primary outcomes and the tertiary outcomes. The power of the secondary outcomes was such that the numbers required to reach significance were beyond the scope of this study.
Clinical measures were completed by the same researcher to eliminate between-tester variability. Within-tester reliability was statistically analyzed using ten healthy, non-obese participants during intrasession testing to determine ICC values. The ICCs were calculated for all of the anthropometric parameters. Active ankle dorsiflexion had ICC values of 0.86 (knee at 0° of extension) and 0.89 (knee at 90° of flexion). Arch height index ratio, arch rigidity index ratio, and arch drop had an ICC of 0.99. Forefoot-rearfoot alignment (unloaded and loaded) and resting calcaneal stance position had ICC values of 0.61, 0.71, and 0.56, respectively. The malleolar valgus index had an ICC of 0.91. Based on commonly referenced guidelines for ICC values, within-tester reliability showed substantial to very strong correlations for each anthropometric parameter. The weaker ICC values could be the result of a small sample size and were not indicative of tester reliability.
Analyses for the Pearson correlation were used to determine the dependent relationships between the anthropometric parameters. Analyses revealed that the parameters were correlated based on the categorization used to rank outcomes: arch height (arch height index ratio at sitting and standing, arch drop, and arch rigidity index ratio), foot morphologic features (forefoot-rearfoot alignment unloaded and loaded, resting calcaneal stance position, and malleolar valgus index), and ankle range of motion (active ankle dorsiflexion at 0° and 90°). Independent Student t tests were performed to determine group differences in active ankle dorsiflexion, arch height index ratio, arch rigidity index ratio, arch drop, forefoot-rearfoot alignment, resting calcaneal stance position, and malleolar valgus index. Three malleolar valgus index data points were flawed at the data acquisition level and were removed during statistical analysis. Bonferroni corrections were completed according to the categorized parameters for outcomes. The maximum number of variables for each outcome is four; therefore, a Bonferroni correction was applied to the data so that P ≤ .05/4 = .0125.
Results
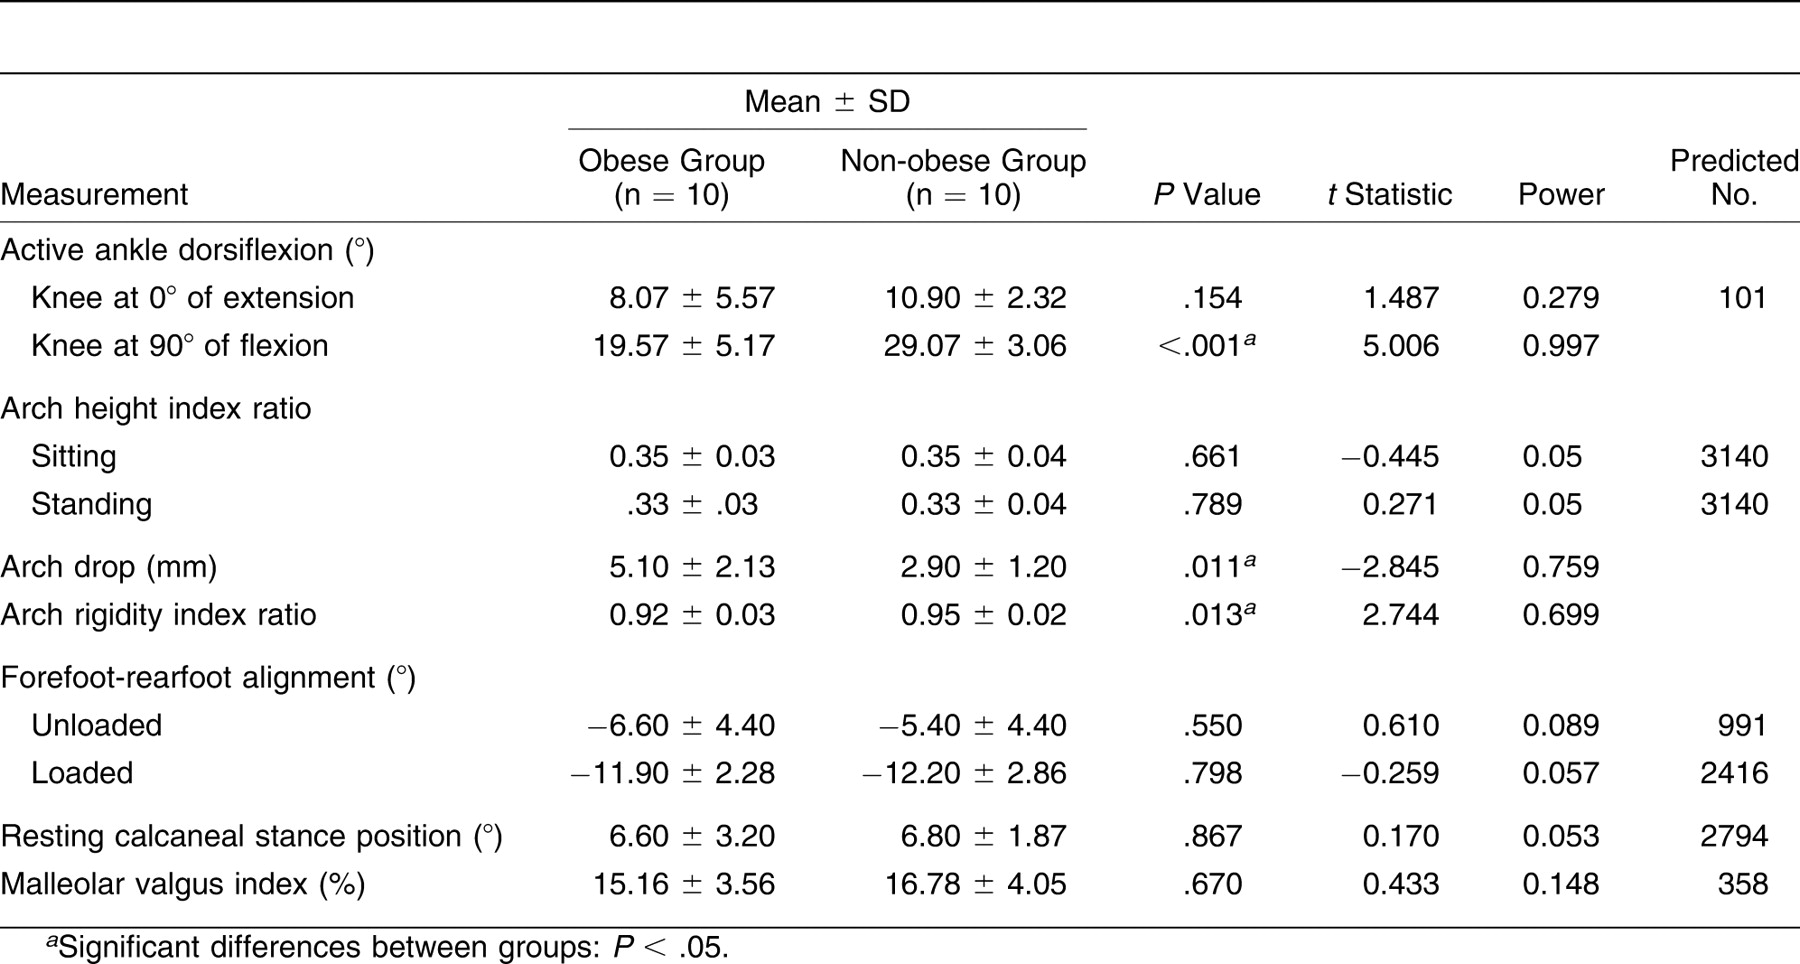
Anthropometric parameters of the obese and non-obese participants are reported in Table 2. Independent t tests revealed significant differences between groups for active ankle dorsiflexion (P < .001) and arch drop (P = .011) and a trend toward significant differences in arch rigidity index ratio (P = .013). The obese participants had 33% less active ankle dorsiflexion at 90° of knee flexion than did the non-obese participants. The obese participants had 76% greater arch drop and a 3% lower arch rigidity index ratio than did the non-obese participants. There were no significant differences between obese and non-obese children for any other anthropometric measurements.
Table 2.
Anthropometric Measurements in the Obese and Non-obese Groups
Discussion
This is the first study to our knowledge to comprehensively evaluate the anthropometric parameters of the foot and ankle complex in the weightbearing and nonweightbearing positions of obese children compared with non-obese children. Although no significant findings existed in the foot morphology parameters, significant differences in active ankle dorsiflexion and several arch height parameters were found between obese and non-obese children. The data collected on a relatively small sample size indicate changes to the foot and ankle complex with increased mass.
Arch Height Parameters
All arch height index calculations were based on previously published studies using the same protocol.[13,14] By these definitions, the arch rigidity index is normalized to foot length and determines the relative flexibility of the foot. Although it was not included as a separate anthropometric parameter, obese children did have increased foot length compared with non-obese children. These differences were not significant; however, the increased length could explain the lower deltas between groups for the arch rigidity index ratio compared with the differences seen in arch drop. The arch drop parameter is a calculation of the absolute flexibility of the foot, and the larger difference between groups indicates a more flexible foot in obese children. This difference is the result of excess weight and supports previous research that found indirect changes to arch height [6] and no significant difference in the plantar fat pads of obese and non-obese children.[19] Because the arch height index measurement system device used in this study eliminates the support of the midfoot during testing, the effect of the plantar fat pad is negligible. The findings from this study support the loss of structural integrity in the medial longitudinal arch without the presence of an excess fat pad. The increased surface area of the foot combined with excess mass during weightbearing activity can potentially increase plantar pressures in the foot, which has been previously reported.[4,20] The arch rigidity index ratio and arch drop calculations are the only arch height parameters assessed in this study that identified changes between nonweightbearing and weightbearing positions. Because these parameters were also the only arch height measurements to have significant differences between obese and non-obese children, excess mass can be considered a primary contributing factor for changes to the medial longitudinal arch.
Foot Morphologic Profile
There were no significant differences between obese and non-obese children in forefoot-rearfoot alignment, resting calcaneal stance position, or malleolar valgus index. The lack of findings in the goniometric measurements of foot type with the concurrent significant findings in a more specific measurement of foot type (arch rigidity index and arch drop) are unusual but could indicate the need for a more specific tool to assess changes in the feet of overweight children. The large increments in degrees, coupled with the variation and error often associated with goniometric measurements, could suggest that the resting calcaneal stance position and forefoot-rearfoot alignment are not sensitive enough measures for assessing an obese child’s foot, a structure that is often considered thick and difficult to palpate. A new method for improving measurement reliability for the resting calcaneal stance position has been published using a cadaveric model [21] but has not examined a pediatric or obese population. Therefore, further research is needed to investigate a more accurate method for determining foot morphologic features in obese children.
Both groups exhibited a varus forefoot-rearfoot alignment and a valgus resting calcaneal stance position, classifying the foot as pes planus.[16] The malleolar valgus index values for both groups support this classification. The pes planus profile is typically associated with a flatter medial longitudinal arch and a larger contact area on the plantar surface of the foot.[11] The significant findings of the arch rigidity index and arch drop also indicate a flatter, more flexible foot and support the classification of pes planus as the foot type for obese children. The prevalence of pes planus in the non-obese group is not surprising because pes planus is the most common foot classification, and most children are classified as pes planus at birth.[22] By 7 years of age, a percentage of children are anticipated to develop a normal foot morphologic profile.[23] Dynamically, pes planus foot type is correlated with subtalar pronation [24] and a smaller total area of center of pressure excursion.[11] Because the plantar pressures under the forefoot increase with excess mass [4] and there is a decrease in the total area of center of pressure excursion,[11] obese children may have an increased risk of stress fractures compared with non-obese children. Pronated, or pes planus, foot types have also been associated with chronic weightbearing injuries in the lower extremity, such as medial tibial stress syndrome and plantar fasciitis.[11] The risk of these injuries could potentially increase with the excess mass seen in obese children, but no longitudinal research, to our knowledge, has investigated this aspect of pediatric obesity.
Active Ankle Dorsiflexion
The obese children had less active ankle dorsiflexion than did the non-obese children during 90° of knee flexion. The loss of range of motion at 90° of knee flexion reduces the amount of dorsiflexion that occurs at maximal knee flexion during the swing phase of gait in preparation for ground contact. This finding supports previous research [25] that has shown more plantarflexion during the swing phase and a flatter foot at heel strike in the gait of obese children. The increased foot contact throughout a longer period of the stance phase can increase stability in the obese population.[5] In addition, there was no significant difference between obese and non-obese children in active ankle dorsiflexion at 0° of knee extension. However, the 10° of dorsiflexion that is necessary during the stance phase of gait is present in both groups for active ankle dorsiflexion with the knee extended. Dynamically, obese children have been found to walk with a stiff and upright posture.[25] Because obese children flex their knee less during the stance phase of gait, the ankle could compensate by having a normal range of dorsiflexion when the knee is extended.
Conclusions
Previous research has found that obese children have more difficulty sustaining high-intensity physical activity,[26,27] which can be influenced by commonly reported musculoskeletal pain in the back, knees, and feet.[28,29] Because of the flexibility in the medial longitudinal arch, weightbearing physical activity can exacerbate any injury and foot pain already occurring in the obese child. To offset the foot pain and injury associated with weightbearing activity, obese children should use footwear that can support the pes planus foot type. However, future research is needed to understand the effects of different footwear on excess mass in children. The use of orthotic devices should also be considered but warrants investigation for the anticipated therapeutic effect. Nonweightbearing physical activity (eg, swimming, cycling, and seated weight lifting) should be offered as alternative treatments in exercise prescriptions for obese children because foot structure can remain unaffected, resulting in decreased foot pain during activity. The structural integrity of the medial longitudinal arch should be further investigated for its importance in physical activity compliance of obese children. Future research should include the effects of physical activity intervention on changes to foot and ankle anthropometry and the effects of weight loss on changes to the foot and ankle complex.
Financial Disclosure
None reported.
Conflict of Interest
None reported.
References
- LeMura, LM and MTMaziekas: Factors that alter body fat, body mass, and fat-free mass in pediatric obesity. .Med Sci Sports Exerc34: 487, 2002.
- Ogden, CL, MDCarroll, LRCurtin, et al: Prevalence of overweight and obesity in the United States, 1999–2004. .JAMA295: 1549, 2006.
- Taylor, ED, KRTheim, MCMirch, et al: Orthopedic complications of overweight in children and adolescents. .Pediatrics117: 2167, 2006.
- Dowling, AM, JRSteele, and LABaur: Does obesity influence foot structure and plantar pressure patterns in prepubescent children. ?Int J Obes Relat Metab Disord25: 845, 2001.
- Wearing, SC, EMHennig, NMByrne, et al: The impact of childhood obesity on musculoskeletal form. .Obes Rev7: 209, 2006.
- Riddiford-Harland, DL, JRSteele, and LHStorlien: Does obesity influence foot structure in prepubescent children. ?Int J Obes Relat Metab Disord24: 541, 2000.
- Dowling, AM, JRSteele, and LABauer: What are the effects of obesity in children on plantar pressure distributions. ?Int J Obes Relat Metab Disord28: 1514, 2004.
- Lamm, BM, RWMendicino, ARCatanzariti, et al: Static rearfoot alignment: a comparison of clinical and radiographic measures. .JAPMA95: 26, 2005.
- Lundberg, A: Kinematics of the ankle and foot: in vivo roentgen stereophotogrammetry. .Acta Orthop233: 1, 1989.
- Song, J, HJHillstrom, DSecord, et al: Foot type biomechanics: comparison of planus and rectus foot types. .JAPMA86: 16, 1996.
- Wong, L, AHunt, JBurns, et al: Effect of foot morphology on center-of-pressure excursion during barefoot walking. .JAPMA98: 112, 2008.
- Kuczmarski, RJ, CLOgden, LMGrummer-Strawn, et al: CDC growth charts: United States. .Adv Data314: 1, 2000.
- Butler, RJ, HHillstrom, JSong, et al: Arch height index measurement system: establishment of reliability and normative values. .JAPMA98: 102, 2008.
- Williams, DS and ISMcClay: Measurements used to characterize the foot and the medial longitudinal arch: reliability and validity. .Phys Ther80: 864, 2000.
- Mueller, MJ, JVHost, and BJNorton: Navicular drop as a composite measure of excessive pronation. .JAPMA83: 198, 1993.
- Root, ML, WOrien, and JHWeed: “Abnormal Motion of the Foot. ,” inNormal and Abnormal Function of the Foot, p295, Clinical Biomechanics, Los Angeles, 1977.
- Norkin, CC and DJWhite: Measurement of Joint Motion: A Guide to Goniometry, ,2nd Ed, FA Davis Co, Philadelphia, PA, 1995.
- Shultz, SP, MRSitler, RTTierney, et al: Effects of pediatric obesity on joint kinematics and kinetics during two walking cadences. .Arch Phys Med Rehabil90: 2146, 2009.
- Mickle, KJ, JRSteele, and BJMunro: The feet of overweight and obese young children: are they flat or fat. ?Obesity14.:1949, 2006.
- Hills, AP, EMHennig, NMByrne, et al: The biomechanics of adiposity: structural and functional limitations of obesity and implications for movements. .Obes Rev3: 35, 2002.
- LaPointe, SJ, CPeebles, ANakra, et al: The reliability of clinical and caliper-based calcaneal bisection measurements. .JAPMA91: 121, 2001.
- Gould, N, MMoreland, RAlvarez, et al: Development of the child’s arch. .Foot Ankle9: 241, 1989.
- Valmassy, RL: “Biomechanical Evaluation of the Child. ,” inClinical Biomechanics of the Lower Extremity, p243, Mosby, London, 1996.
- Riegger-Krugh, C and JJKeysor: Skeletal malalignments of the lower quarter: correlated and compensatory motions and postures. .J Orthop Sports Phys Ther23: 164, 1996.
- Hills, AP and AWParker: Gait characteristics of obese children. .Arch Phys Med Rehabil72: 403, 1991.
- Grund, A, BDilba, KForberger, et al: Relationships between physical activity, physical fitness, muscle strength and nutritional state in 5- to 11-year-old children. .Eur J Appl Physiol82: 425, 2000.
- Watts, K, TWJones, EADavis, et al: Exercise training in obese children and adolescents: current concepts. .Sports Med35: 375, 2005.
- Stovitz, SD, PEPardee, GVazquez, et al: Musculoskeletal pain in obese children and adolescents. .Acta Paediatr97: 489, 2008.
- de Sa, Pinto, ALde Barros, PMHolanda, ASRadu, et al: Musculoskeletal findings in obese children. .J Paediatr Child Health42: 341, 2006.
© 2012 American Podiatric Medical Association