


Abstract
Background: We sought to determine the changes in the size of the edema observed on MRI scans and its relation to the patient’s pain during activity and pain during rest in bone marrow edema. Methods: A total of 26 patients were followed up at 3-month intervals for a period of 1 year. During the follow-ups, magnetic resonance imaging scans of the patients’ ankles were obtained; the scores obtained on the American Orthopaedic Foot and Ankle Society functional rating scale and visual analog scale were determined. The changes in these parameters and the correlation between them were examined. Results: The size of the edema as observed on magnetic resonance imaging scans decreased, and the pain during activity and rest decreased. Although there is a correlation between the decrease in the edema size observed on magnetic resonance imaging scans and decrease in the pain during activity, there is no correlation between the decrease in the edema size observed on magnetic resonance imaging scans and the decrease in pain during rest. Conclusions: Patients can be informed more precisely, that the pain during rest and activity may not decrease after the third and sixth month, respectively. Magnetic resonance imaging may not alter after the ninth month, so it may not be necessary to be performed again. (J Am Podiatr Med Assoc 101(5): 430–436, 2011)
Bone marrow edema syndrome (BMES) is diffuse subacute ischemia of the bone, which generally heals completely with an adequate repair mechanism.[1–3] Radiological findings of BMES can be observed only after 4 to 6 weeks; however, mild demineralization is characteristic of the late stages of BMES. Diffuse extension of bone marrow edema, lack of morphological alterations, absence of trauma history, and reversibility are the characteristics of BMES.[1–4] Spontaneous recovery is observed in 3 to 12 months (average, 6 months). Increased signal intensity over the bone marrow, by means of magnetic resonance imaging (MRI) on fat-suppressed or short T1 inversion recovery (STIR) sequences can radiologically be seen in bone marrow edema syndrome as well as in trauma, osteoarthritis, and osteonecrosis.[1–7]
Bone marrow edema is an MRI finding accompanying pain. Patients with BMES of the talus complain of ankle pain. No objective examinations exist presently for the follow-up of these patients. Pain and the functional condition of the patients are the most important parameters examined in the follow-up. During follow-ups, clinical alterations are observed in addition to alterations in the size of the edema observed on MRI scans. However, the clinical condition of the patient and whether a correlation exists between the clinical condition and the lesion size observed in the MRI scans is not clear. The clarification of this situation may provide significant information to establish the follow-up criteria for patients with BMES of the talus.
The relationship between the size of BME of the talus and magnitude of ankle pain has not been previously investigated. A similar study was previously undertaken between the BME and knee pain.[8] We aimed to determine the course and direction of the alterations in the size of edema of the talus observed in the MRI scans, in rest pain and in activity pain of BMES patients. We also aimed to determine the correlations between these three factors during the follow-ups. We hypothesized that there is no correlation between ankle pain and the size of the edema observed on MRI scans.
Materials and Methods
Exclusion Criteria
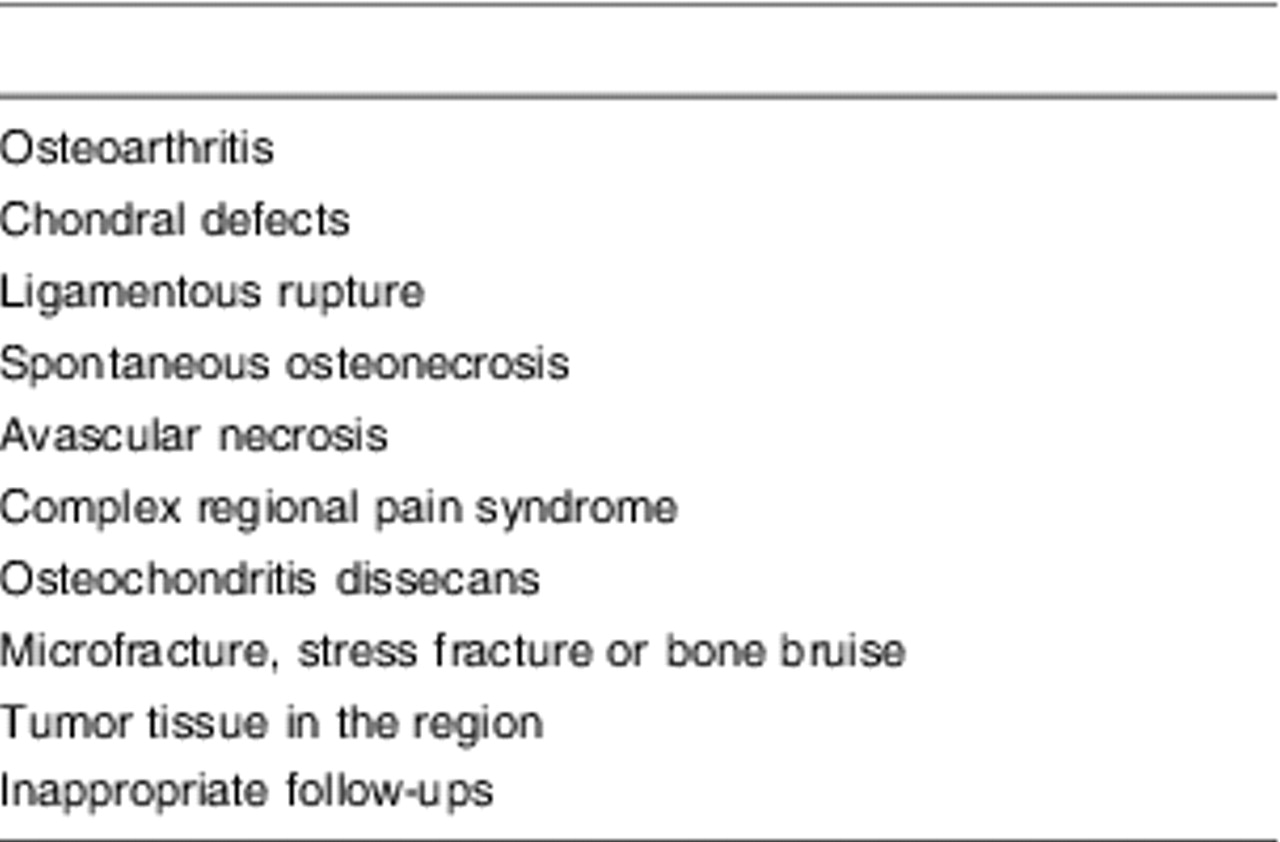
Over a period of 4 years (2005 to 2009), 142 patients were diagnosed with bone marrow edema by means of MRI scans and complained of ankle pain. Only BME patients with no significant history of ankle trauma history were included in this study. Exclusion criteria were: (a) patients with osteoarthritis, which narrows the joint gap, determined by bilateral nonweightbearing and weight-bearing radiographs; (b) patients with any chondral defect in any of the ankle compartments diagnosed on the basis of MRI findings; (c) patients with any ligamentous rupture on MRI before or during follow-ups; (d) patients with spontaneous osteonecrosis on MRI before or during follow-ups—the findings on MRI are large cystic cavity in the subchondral bone and surroundings, with bone marrow edema, buckling of hyaline cartilage, and an area of irregular cartilage on the center of the weightbearing surface; (e) patients with osteonecrosis (avascular necrosis) on MRI; (f) patients with complex regional pain syndrome in the ankle region—clinical signs are changes in temperature, discoloration of the skin, swelling and sudomotor activities, patchy subchondral osteopenia on standard radiographs, and bone marrow edema on MRI; (g) patients with osteochondritis dissecans; (h) patients with microfracture, stress fracture, or bone bruise in the initial diagnosis or follow-ups; bone bruises could be distinguished from BME in the case of patients who had a history of major ankle injury and for whom microfractures were observed on MRI; (i) patients with tumor tissue in the region with bone marrow edema; and (j) patients in whom follow-ups were not possible and whose reports could not be obtained (Table 1).
Table 1.
Exclusion Criteria
Clinical Examinations
The clinical examinations of the patients for this study were performed at 0, 3, 6, 9 and 12 months. Any tenderness or pain in the ankle region and any limitation in range of motion in the ankle joint are looked for during the physical examination. The functional outcome was graded by the American Orthopaedic Foot and Ankle Society’s (AOFAS) clinical rating system and the physical examination.[9] This rating system, despite its questionable validity and reliability due to its lack of sound methodological construct, has been used because of its high familiarity among the authors. A visual analog scale (VAS) was used for the assessment of pain.[10] The measurements were classified into three categories (pain at rest, pain when walking barefoot, and pain at work). A horizontal 100-mm long scale, anchored by “no pain” (0) and “worst pain imaginable” (100) was applied. Although very subjective, a questionnaire concerning satisfaction with the outcome of the operative treatment, the patients’ perception of the cosmetic appearance, pain relief, and the ability to wear preferred shoes, (all rated as either very satisfied, satisfied, or not satisfied) was administered at each follow-up assessment. This satisfaction rating can only be used during follow-ups when deciding whether patients are going to join the next examination, and the results are not conclusive.
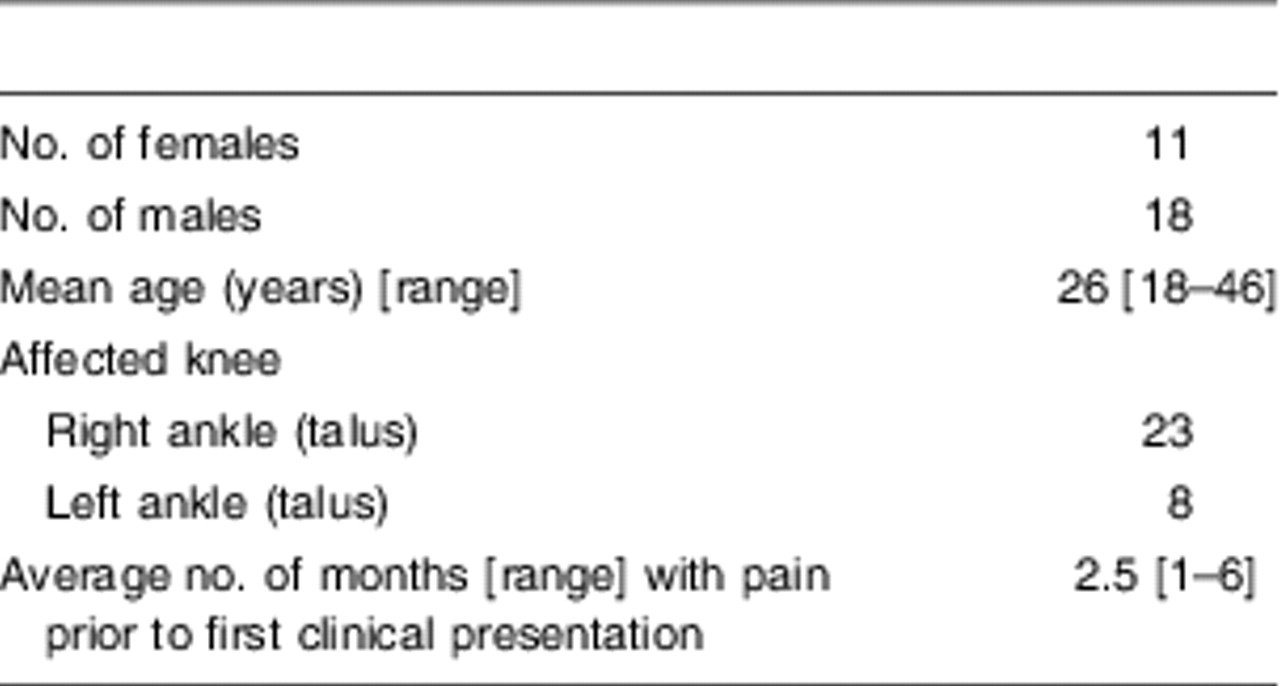
There were 18 male and 11 female patients in the study group with a mean age of 26 years (range, 18–46 years). Thirty one ankles (23 right, 8 left) of 29 patients were affected, and 26 were at the dominant site (Table 2).
Table 2.
Patient Characteristics
Treatment
The patients underwent standard conservative treatment after they were diagnosed with BMES during the first examination. For the first 3 weeks of this treatment, the patients were instructed to walk with crutches without weightbearing, and in the following 3 weeks, to walk with partial weightbearing. Nonsteroidal anti-inflammatory medication was also administered. The design and the noninvasive, nonradiating nature of the study made ethical committee approval unnecessary.
Magnetic Resonance Imaging Follow-ups and Assessment
Radiological follow-up included MRI of the ankle and were performed at 0, 3, 6, 9 and 12 months, and were performed simultaneously with the physical examination. In the subsequent follow-ups in cases where MRI revealed complete disappearance of lesions, further follow-ups included only clinical examination, and MRI was not performed. Twenty-six patients who completed the follow-up were included in the study.
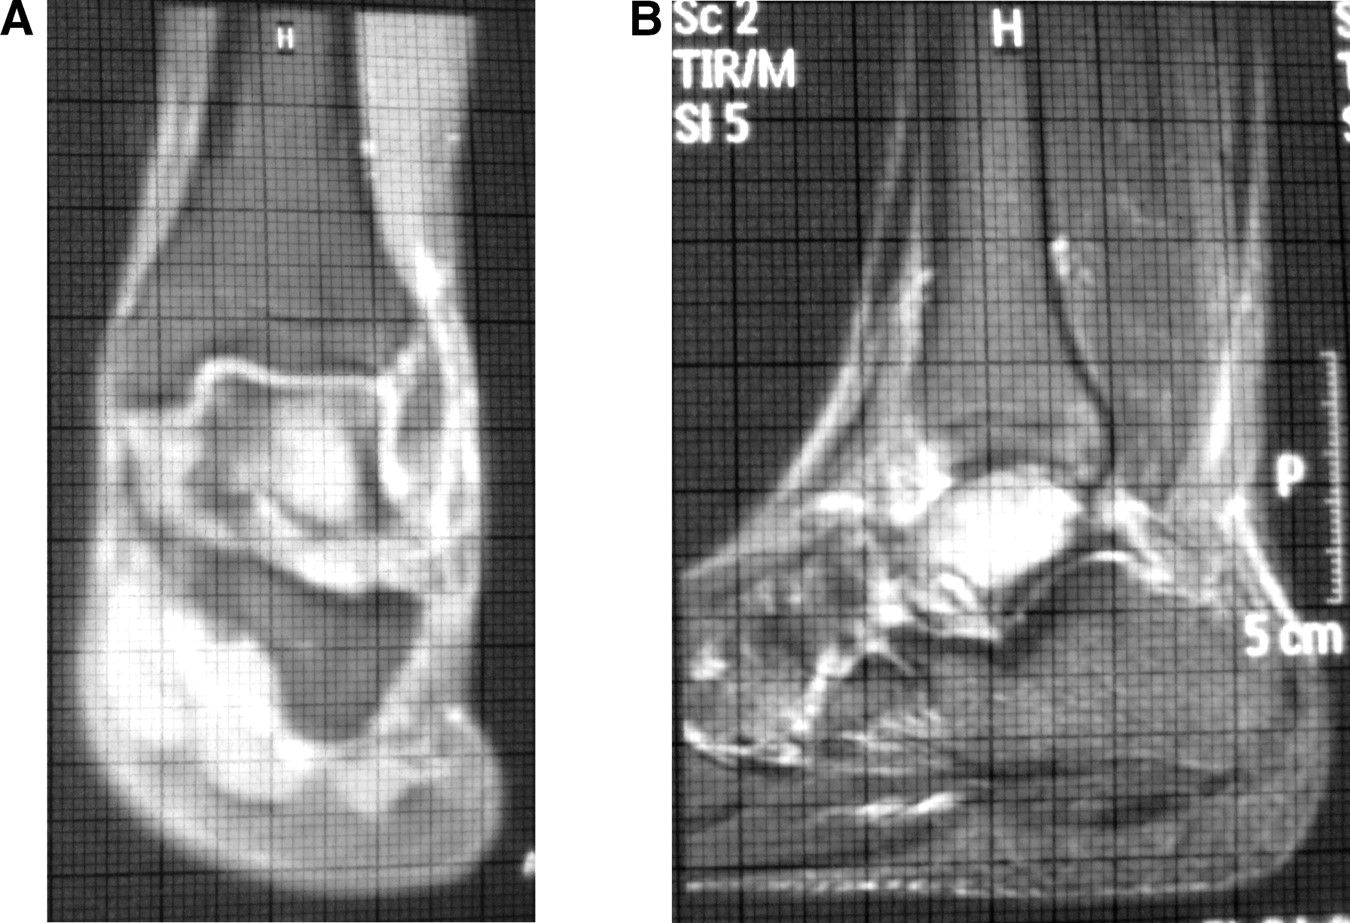
All MRI examinations were performed at the same center by the same radiologist (A.G.) and with the same MRI device (1.5 T superconductor magnet; Magnetom Expert, Siemens, Erlangen, Germany). The bone marrow edemas of the patients were measured by performing MRI of their ankles at 0, 3, 6, 9, and 12 months. We used coronal T2-weighted fat-saturated images to evaluate bone marrow lesions. In the sagittal plane, measurements were made using all of the cross-sections of the entire length of the edema. In all cross sections, the measurement was carried out by using a transparent measurement template consisting of 1-mm multiple squares (mm2) (Fig. 1). For site evaluation the coronal planes were used. All measurements were carried out by the same physician (A.Y.G). All 1-mm squares with bone marrow edema were counted, and the total area of all these squares was calculated and recorded as the bone marrow edema of the patient during that follow-up period. When the size of the lesion measured in the MRI scan was zero for a patient, MRI was not performed in the subsequent follow-ups of that patient.
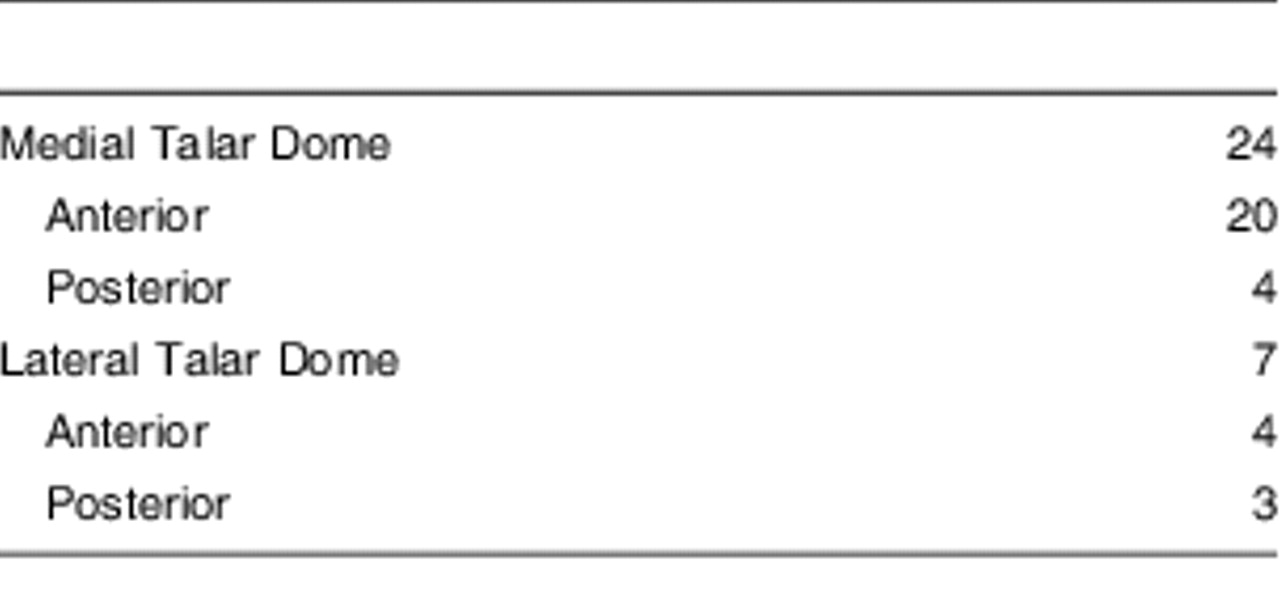
The starting region of the lesion and the region where the lesion was concentrated, identified in the coronal planes, were together identified as comprising the anatomical region of the edema. The data regarding the anatomic localization of bone marrow edema in the patients has been provided in Table 3.
Statistical Methods
Power analysis was performed so that for continuous variables there was an 80% chance of detecting an effect size of approximately 0.60 when the significance level was 0.05. We used SPSS version 11.0 (SPSS, Inc, Chicago, IL) for all statistical analyses. A Friedman test was used for the comparison of repetitive measurements of AOFAS, VAS, and edema size observed in the MRI for the assessment of the data. To determine the trends among these comparisons and the course of alterations occurring between follow-ups, the Student’s t test was used. To determine the correlations between VAS and AOFAS, AOFAS and BME, and VAS and BME size, the Pearson correlation test was used. A P value of <0.05 was considered to be statistically significant.
Results
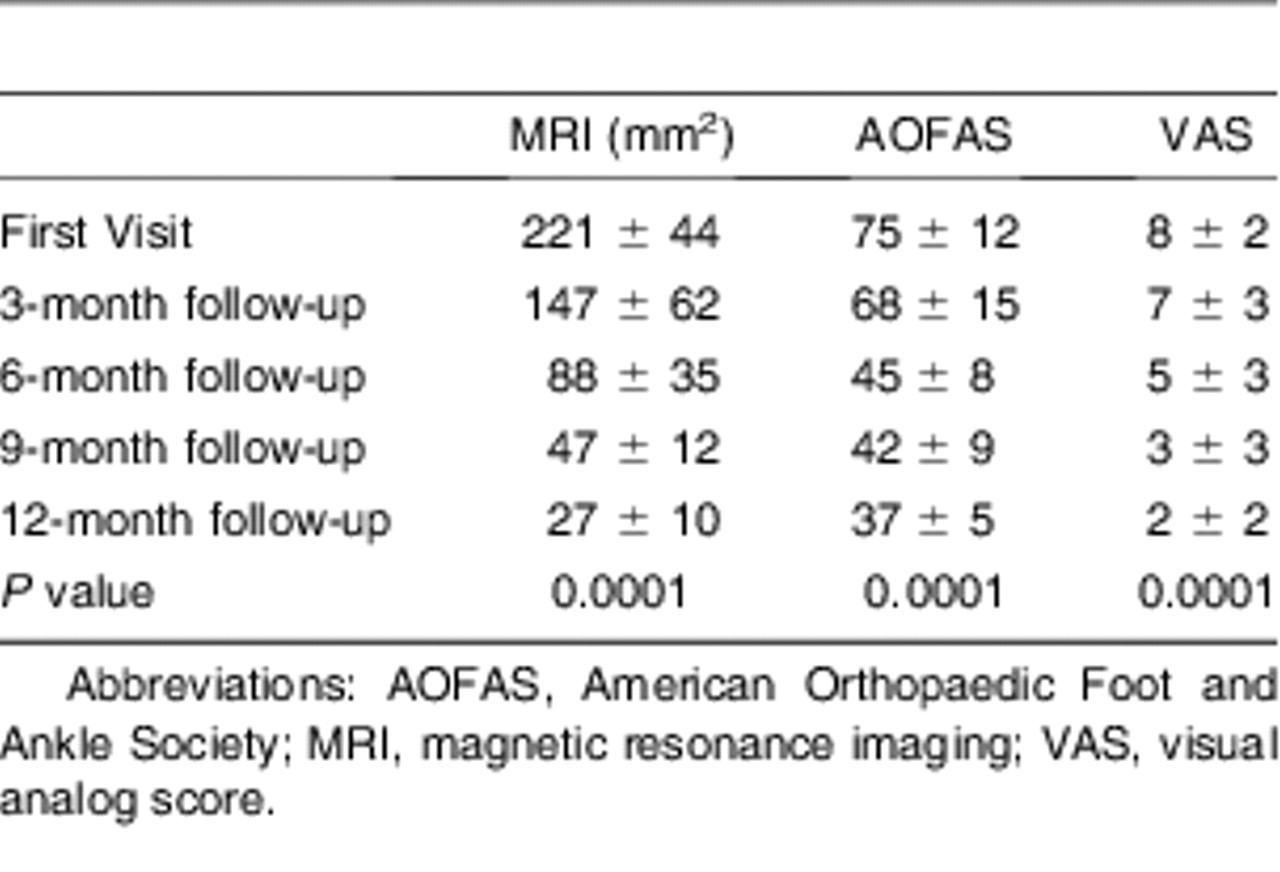
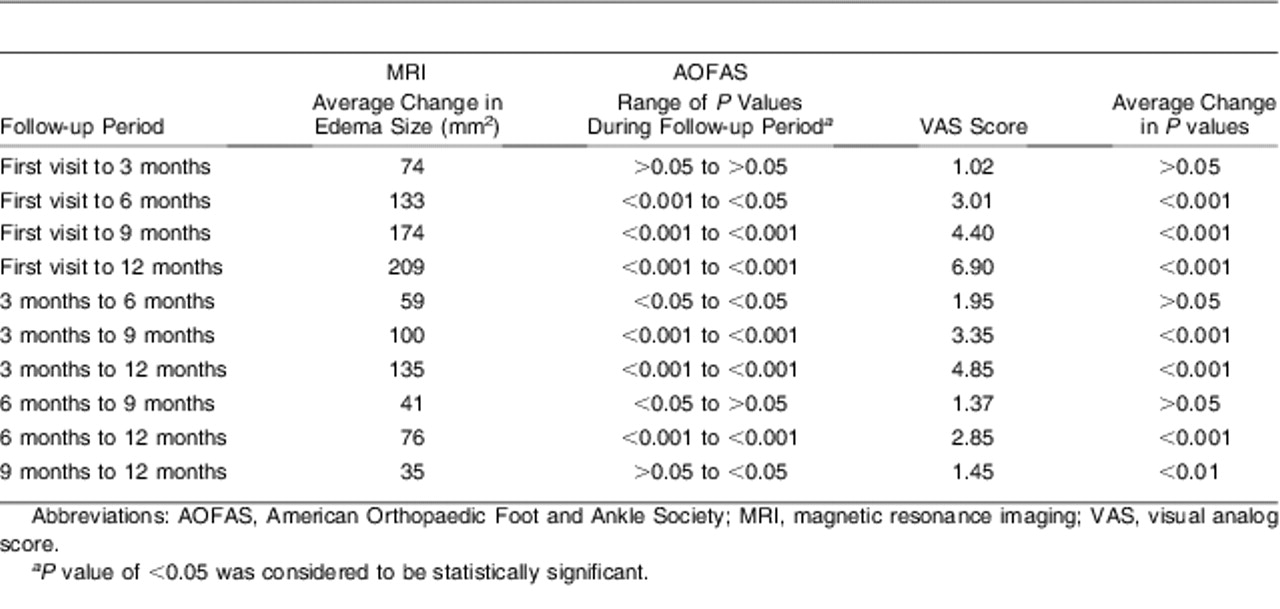
A statistically significant decrease was observed in the average area of the edema observed on MRI scans in the first visit and the third, sixth, ninth, and 12th months (P = 0.0001) (Table 4). No statistically significant differences were observed between the values for the first visit and third month, and ninth and 12th months obtained during the control examinations (P > 0.05; P > 0.05, respectively), but the differences observed in the other intervals of the months were statistically significant (Table 5).
A statistically significant decrease was observed in the AOFAS averages obtained in the first visit and in the third, sixth, ninth, and 12th months (P = 0.0001) (Table 4). No statistically significant differences were observed between the first visit and third month, and sixth and ninth month values obtained during the control examinations (P > 0.05), but the differences observed in the intervals of the other months were statistically significant (Table 5).
Figure 1.
Edema measurement by magnetic resonance imaging with 1-mm transparent measurement template. A, Anteroposterior plane; B, Lateral plane.
A statistically significant decrease was observed in the VAS score averages in the first visit and the third, sixth, ninth, and 12th months (P = 0.0001) (Table 4). No statistically significant differences were observed between the first visit and the third month, between the third and sixth months, and between the sixth and ninth month values obtained during the control examinations (P > 0.05; P > 0.05; P > 0.05, respectively), but the differences observed in the intervals of the other months were statistically significant (Table 5).
Statistically significant positive correlations were observed between the decrease in edema size observed on MRI scans and the recoveries in the AOFAS scores (r = 0.313; [P = 0.025]); and between the recovery in the AOFAS scores and the recovery in the VAS scores (r = 0.943; [P = 0.0001]). No statistically significant positive correlation was observed between the decrease in edema area observed on MRI scans and the recoveries in the VAS score (r = 0.203; [P = 0.153]).
Table 3.
Anatomical Localizations of the Edema (N = 31 Ankles)
We observed that the patients did not strictly comply with the instructions of using crutches without weightbearing. Decrease in pain within 2 to 3 weeks had led to irregular use of the crutches by the patients.
At 1 year after follow-up, 25 (85%) patients stated that they would have the same procedure again and were satisfied with the procedure. The remaining four patients complained of some persistent mild pain, responding to analgesic medications, in the ankle region.
Table 4.
Follow-up and Statistical Test Results of MRI, AOFAS, and VAS
Discussion
The principal finding of the present study was the presence of a correlation between the decrease in bone marrow edema size on MRI and decrease in activity pain with the absence of a similar correlation between the decrease in edema size and decrease in rest pain. It is important to define the relationship between the size of bone marrow edema and the pain of the patient, so as to make a treatment strategy for such patients. It is necessary to take into account the clinical and radiologic progress of the disease while defining the follow-up criteria. We tried to determine the activity or rest pain and the progress of pain of the patients with BMES. We also tried to define the relationship between these clinical conditions and the results of MRI examinations.
Table 5.
The Follow-ups and the Statistical Results of MRI, AOFAS, and VAS
There were some limitations in this study. The small number of the patients is the main limiting factor. We believe that for relevant conclusions a larger group has to be followed. We also did not examine the interobserver and intraobserver differences in the MRI measurements that were used. However, the measurements were made by a single physician. In literature, alternative measurements and classifications have been mentioned for bone marrow edema.[11–13] In these studies, bone marrow edema is classified into three types according to the size of the lesion. However, our measurement technique, the same as performed previously for the knee, is more valuable for statistical studies.[8] It was difficult to handle a very focal bone marrow edema; therefore, minimal errors in the bone marrow edema measurements could be ignored.
The follow-up interval in our study was 3 months. Even shorter intervals would increase the value of such studies; however, it might be ethically inappropriate to request the patient to visit the clinic to undergo MRI. The compliance of the patients with the instructions to be followed during the prescribed conservative treatment was not uniform. This makes the group heterogeneous with respect to the prescribed treatment. However, there are no significant evidences indicating that the conservative treatments prescribed for bone marrow edema alter the clinical condition of patients.[1–4] Nonsteroidal anti-inflammatory treatment does not alleviate the pain.[1–4] However, conservative modalities such as a prostacyclin analogue, iloprost, has been under investigation and reported to be efficient in alleviating ankle pain in patients with BMES of the talus.[14, 15] It is also known that using crutches has a limited effect, and the patients experience relief from pain only during the night.[1–4]
The patients underwent follow-up for 1 year; therefore, our data and conclusions are relevant only for this time period. However, differences in the date of visit to the clinic and the date of onset of pain, and the failure to precisely determine the date of onset of bone marrow edema from the MRI scan, will inevitably result in a heterogeneous group in such studies. Although the slice thickness used (4 mm) was the same as that conventionally used for MRI of the ankle, it may have hindered the determination of the size of the edema. In follow-ups of bone marrow edema cases, decreases in the size of the lesions are observed over a period of time.[1–4] In our study, the sizes of the edema observed on MRI scans were significantly lower than the initial measurements obtained in the first visit. This trend of decreases continued in the third and sixth months. However, in the ninth and 12th months, no significant changes were observed. This indicates that the decrease in the lesion size continued until the ninth month, after which no significant changes occurred in the size of the lesion. This may be attributable to two reasons. First, the patients whose bone marrow edema lesion is maintained until the ninth month may have another etiological factor. None of our patients subsequently displayed findings of spontaneous osteonecrosis, so no exclusion could be made. However, in some of the patients, whose lesions have not decreased to date, spontaneous osteonecrosis or osteoarthritis, or both, are expected to develop after the first year.[16–18] Second, there might be no changes in the size of edema between the ninth and 12th months during the natural progression of the disease. Some of the patients, in whom edema had disappeared before the second measurement, may have already been in the recovery period.
There are no defined clinical forms of or scores for bone marrow edema. Objective data specific to the disease are important to establish clinical forms. For follow-up of the patients, we used AOFAS functional rating scale, which is a form of functional scoring and assesement of activity pain.[9] During our study, a significant recovery was observed between the values in the first visit and those in the follow-ups. However, there was no decrease in activity pain between the sixth and ninth months. This finding indicates that if the functional recovery is not completed by the sixth month, this process will continue for some more time without alteration.
In BMES, pain is the most important symptom, which helps to establish the identity of the condition.[19, 20] With the help of VAS, pain, which is subjective, may be scored. In our study, the rest pain of the patients had significantly decreased as compared to the rest pain reported during the first visit. However, in some cases, there is no decrease in rest pain between the third and sixth months, and the sixth and ninth months. In this case, it is possible to say that the complaints of a patient, whose rest pain does not decrease after the third month, will continue into the ninth month.
In patients with BMES, the method of follow-up of patients is important. Patients complain of pain and request a remedy. The functional restriction of the patients depends on the severity of pain.[20] There are no defined symptomatic mechanical problems. In our study, significant correlations were found between the edema size observed on MRI scans and AOFAS functional rating scale recovery and also between AOFAS functional rating scale and VAS recoveries. In other words, the activity pain of the patient and the decrease in the edema size are parallel. In this case, since the functional progress of the disease corresponds with the decreasing edema size observed on MRI scans, MRI can be used as functional follow-up and may support clinical findings. However, there are no correlations between edema sizes observed in MRI and VAS recoveries. In this case, the definition of the rest pain symptoms by the patients is not consistent with the edema sizes observed on MRI scans. Considering that pain is the sole symptom of bone marrow edema, we believe that the edema size observed on MRI scans is not a valuable finding in the follow-up of bone marrow edema. Bone marrow edema may persist until the ninth month. Bone marrow edema that persists beyond this duration may be related to osteoarthritis.[7, 16–21] The etiology of continued bone marrow edema must be clarified.
Similar results with the aforementioned study have been obtained in our sample.[8] Progress in the edema size observed on MRI scans, and activity and rest pain have been defined. In bone marrow edema follow-ups, decrease in edema size, decrease in activity pain, and decrease in rest pain were observed. There is no decrease in edema size between the ninth and 12th months, no decrease in activity pain between the sixth and ninth months, and no decrease in rest pain between the third and sixth months and the sixth and ninth months. While there is a correlation between the decrease in edema size and decrease in activity pain, there is no correlation between the decrease in edema sizes and decrease in rest pain.
As a conclusion, patients can be informed more precisely, that the rest and activity pain may not decrease after the third and sixth month, respectively. Moreover, radiological evaluation by means of MRI may not alter after the ninth month, so it may not be necessary to be performed again.
Financial Disclosure: None reported. | |
Conflict of Interest: None reported. |
References
- Hofmann, S, WSchneider, MBreitenseher, et al. :“Transient osteoporosis” as a special reversible form of femur head necrosis. Orthopade 29:411, 2000.
- Gigena, LM, CBChung, NLektrakul, et al. :Transient bone marrow edema of the talus: MR imaging findings in five patients. Skeletal Radiol 31:202, 2002.
- Radke, S, JVispo-Seara, MWalther, et al. :Transient bone marrow oedema of the foot. Int Orthop 25:263, 2001.
- Hofmann, S, JKramer, AVakil-Adli, et al. :Painful bone marrow edema of the knee: differential diagnosis and therapeutic concepts. Orthop Clin North Am 35:321, 2004.
- Beltran, J and SShankman. :Magnetic resonance imaging of bone marrow disorders of the knee. Magn Reson Imaging Clin N Am 2:463, 1994.
- PlenkJr, H, SHofmann, MBreitenseher, et al. :Pathomorphological aspects and repair mechanisms of femur head necrosis. Orthopade 29:389, 2000.
- Brem, MH, PMSchlechtweg, JBhagwat, et al. :Longitudinal evaluation of the occurrence of MRI-detectable bone marrow edema in osteoarthritis of the knee. Acta Radiol 21:1, 2008.
- Unay, K, OPoyanli, KAkan, et al. :The relationship between bone marrow edema size and knee pain. Knee Surg Sports Traumatol Arthrosc 17:1298, 2009.
- Kitaoka, HB, IJAlexander, RSAdelaar, et al. :Clinical rating systems for the ankle-hindfoot, midfoot, hallux, and lesser toes. Foot Ankle Int 15:349, 1994.
- Cedell, CA and MAstrom. :Proximal metatarsal osteotomy in hallux valgus. Acta Orthop Scand 53:1013, 1982.
- Hayes, CW, DAJamadar, GWWelch, et al. :Osteoarthritis of the knee: comparison of MR imaging findings with radiographic severity measurements and pain in middle-aged women. Radiology 237:998, 2005.
- Link, TM, LSSteinbach, SGhosh, et al. :Osteoarthritis: MR imaging findings in different stages of disease and correlation with clinical findings. Radiology 226:373, 2003.
- Ozbaydar, MU, MTonbul, ACTekin, et al. :Arthroscopic rotator cuff repair: evaluation of outcomes and analysis of prognostic factors. Acta Orthop Traumatol Turc 41:169, 2007.
- Meizer, R, CRadda, GStolz, et al. :MRI-controlled analysis of 104 patients with painful bone marrow edema in different joint localizations treated with the prostacyclin analogue iloprost. Wien Klin Wochenschr 117:278, 2005.
- Aigner, N, GPetje, GSteinboeck, et al. :Treatment of bone-marrow oedema of the talus with the prostacyclin analogue iloprost. An MRI-controlled investigation of a new method. J Bone Joint Surg Br 83:855, 2001.
- Felson, D, CEChaisson, CLHill, et al. :The association of bone marrow lesions with pain in knee osteoarthritis. Ann Intern Med 134:541, 2001.
- Felson, DT, SMcLaughlin, JGoggins, et al. :Bone marrow edema and its relation to progression of knee osteoarthritis. Ann Intern Med 139:330, 2003.
- Kornaat, PR, MKloppenburg, RSharma, et al. :Bone marrow edema-like lesions change in volume in the majority of patients with osteoarthritis; associations with clinical features. Eur Radiol 17:3073, 2007.
- Breitenseher, MJ, JKramer, MEMayerhoefer, et al. :Differential diagnosis of bone marrow edema of the knee joint. Radiologie 46:46, 2006.
- Hofmann, S, JKramer, MBreitenseher, et al. :Bone marrow edema in the knee. Differential diagnosis and therapeutic possibilities. Orthopade 35:463, 2006.
- Elias, I, JWJung, SMRaikin, et al. :Osteochondral lesions of the talus: change in MRI findings over time in talar lesions without operative intervention and implications for staging systems. Foot Ankle Int 27:157, 2006.
© 2011 American Podiatric Medical Association