


Abstract
Background: The medial longitudinal arch of the foot is important because it helps protect the foot from injury. Researchers have developed many measures to quantify the characteristics of the arch, and there is ongoing debate about the suitability of these different metrics. This article compares the various measures related to the foot arch, including a new metric, the midfoot dorsal angle, and then investigates the differences in the dimensional measures among various foot types. Methods: The right feet of 48 healthy individuals (24 men and 24 women) were measured, and various metrics, including the arch height index, the navicular height to arch length ratio, the arch index, the footprint index, the subjective ranking, the modified arch index, the malleolar valgus index, and the midfoot dorsal angle, were determined. Results: Correlation analyses showed that the arch index obtained from the inked footprint has a moderate to high correlation (Pearson correlation coefficients >0.50]) with all measured foot-type metrics except for the malleolar valgus index. There were no differences in participant age, stature, weight, body mass index, foot length, foot width, and midfoot height among high, normal, and low foot arches. However, the high-arched group had significantly shorter arch lengths but larger navicular heights and higher mid-foot dorsal angles compared with the low-arched group. There were differences in force distributions and peak pressures as well. The rearfoot had more loading and greater peak pressure whereas the midfoot had less load in the high-arched group compared with the low-arched group. Conclusions: The midfoot dorsal angle may be an appropriate metric for characterizing the foot arch because it is quick and easy to measure, without the tedious procedures associated with area calculations and dimension measurements. (J Am Podiatr Med Assoc 100(1): 14-24, 2010)
There is no doubt that the shape of a foot is useful for generating a proper-fitting shoe, [1,2] especially in the construction of orthopedic footwear. [3] One of the more important and highly variable structural characteristics of the human foot is its medial longitudinal arch, [4,5,6] which provides necessary shock absorption for the foot during activity. [5,6,7] Variations in arches and severe gait problems are “treated” with orthotic devices. [7,8,9,10,11,12,13,14,15,16] When orthotic devices are prescribed for use in running, they have positive effects in only approximately 70% to 80% of runners. [17,18,19] The design, development, and fabrication of orthoses are critical to their effectiveness. Orthoses that effectively support the longitudinal arches of the foot have been found to significantly decrease strain in the plantar aponeurosis. [20]
Traditionally, feet are classified as being high, normal, or low arched. A high-arched foot is supposed to be at increased risk for injury to the bony structures on the lateral side of the foot (oversupinated), whereas a low-arched foot can be at greater risk for soft-tissue damage on the medial side of the foot (overpronated). [11] It is, therefore, important to have a relatively easy and reliable way to classify the foot arch. There are many indices to quantify the arch, including the following:
- Footprint parameters such as the arch index, [4,21] the arch length index, [22] Staheli’s index, [23] the Chippaux-Smirak index, [24] the arch or footprint angle, [25] the footprint index, [26] the truncated arch index, [22] the modified arch index, [5] and the Brucken index. [27] The fundamental premise of these indices is that the height of the arch is related to the footprint.
- Posture-related indices such as the valgus index, [15] the malleolar valgus index, [28] and the foot posture index. [29]
- Dimension-related indices such as arch height or navicular height, [13,30] navicular height/foot length, navicular height/truncated foot length, [7] dorsum height/ foot length, dorsum height/truncated foot length, [7] navicular drop, [31,32] navicular drift, [32,33] and talar head height/arch length. [34]
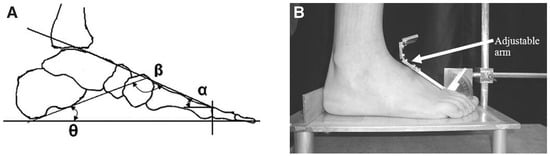
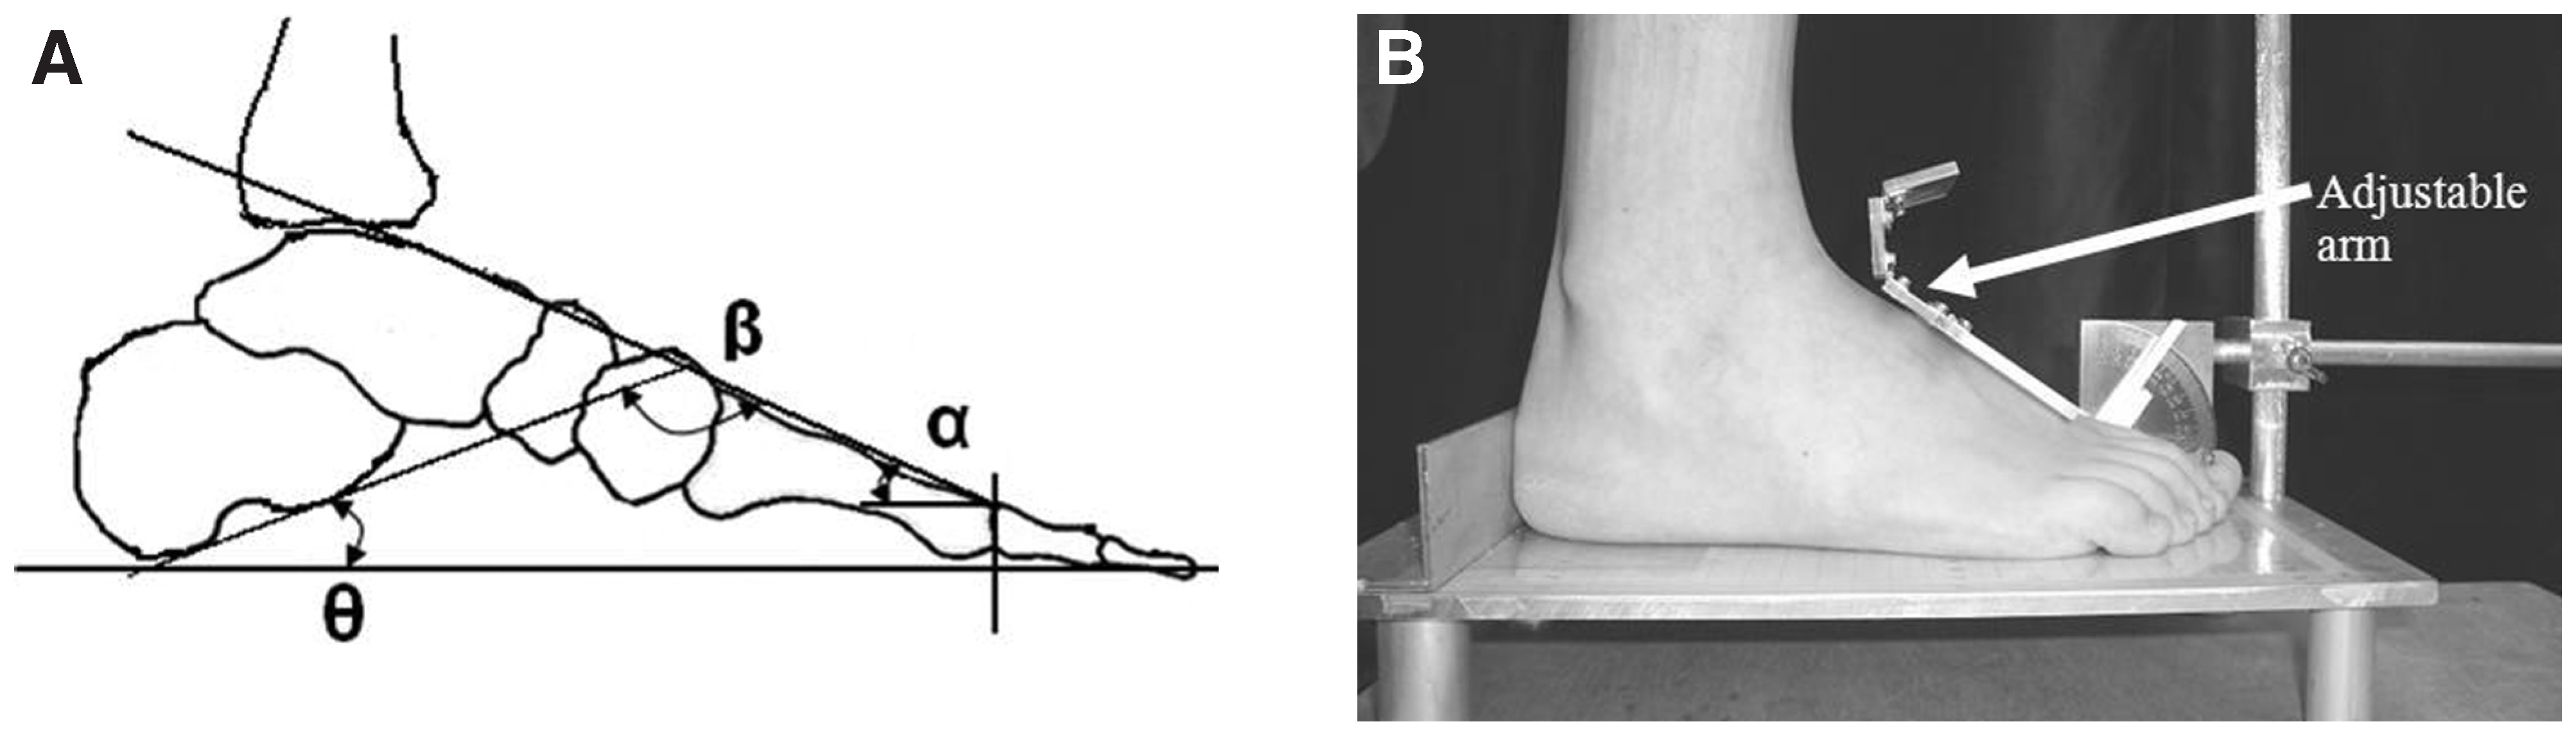
- Angle-related indices such as the longitudinal arch angle, [35] the rearfoot angle, [36] the calcaneal inclination angle, [34] and the calcaneal–first metatarsal angle [37] (Figure 1A).
- Foot function–related indices such as the rear-foot-forefoot angle [38] and the center-of-pressure excursion index. [28]
- Visual observation, which depends on the clinician’s experience. [6,39]
Figure 1.
A, Representation of the calcaneal inclination angle (θ), the calcaneal–first metatarsal angle (β), and the proposed midfoot dorsal angle (α). B, Apparatus for measuring the midfoot dorsal angle (α) and foot dimensions.
Various techniques are used to determine these indices, including footprinting, pressure mapping, radiographic imaging, ultrasound imaging, and observation. The reliabilities of each of these indices have been reported in the literature. [32,40,41] Although the ink footprint technique has been frequently used by researchers, some limitations exist with this technique. Uncertainties inherent in interpreting the acquired footprint and lack of efficient, accurate means of extracting footprint parameters have been identified as major disadvantages that hinder clinicians from using this technique to judge foot type. With the development of pressure-mapping techniques, some of these inherent limitations can be overcome. However, issues related to the differences among the various indices have not been addressed. Investigators such as William and Morrison [42] and Phelps and Kiphuth [43] have disputed the ability of footprints to indicate foot type because factors other than arch type can contribute to these differences. Cobey and Sella [44] suggested that feet having similar structures can exhibit different footprints because of softtissue influences. Thus it is no surprise that Wearing et al [45] found that the arch index is more a measure of fat feet than of flat feet. The arch index can explain approximately 50% of the variance in arch height. [5,13] What accounts for the other 50% of the variance?
Navicular drop has gained increasing acceptance in recent years, although the reliability of this technique is considered to be moderate, [46] possibly because it has excellent face validity in assessment of the medial longitudinal arch. However, it has been noted that navicular drop should be considered relative to the size of the foot. [47] The metric proposed herein, the midfoot dorsal angle, overcomes most of the limitations of navicular drop. Williams and Mc-Clay [7] proposed the arch height index, which is the height of the dorsal surface of the foot at 50% of the foot length divided by the truncated foot length. The arch height index has been shown to be a reliable method for foot classification. [11,48] Xiong et al [49] showed that the height at 50% of the foot length largely depends on the height at the first metatarsal joint and that the midfoot dorsal angle (α) (Figure 1) seems to follow a pattern among different individuals having different arch types. The midfoot dorsal angle (α) is equal to [180 − the calcaneal inclination angle (θ) − the calcaneal–first metatarsal angle (β)]. The angles θ and β determined from radiographs have been used to quantify the arch. The midfoot dorsal angle, α, is bound to have an impact on the arch type and could possibly be a significant improvement over the arch height index as a metric for arch height. A special jig with an adjustable arm was fabricated to measure the α angle (Figure 1B). The adjustable arm was designed to account for variations in the length of the midfoot region among individuals. [49]
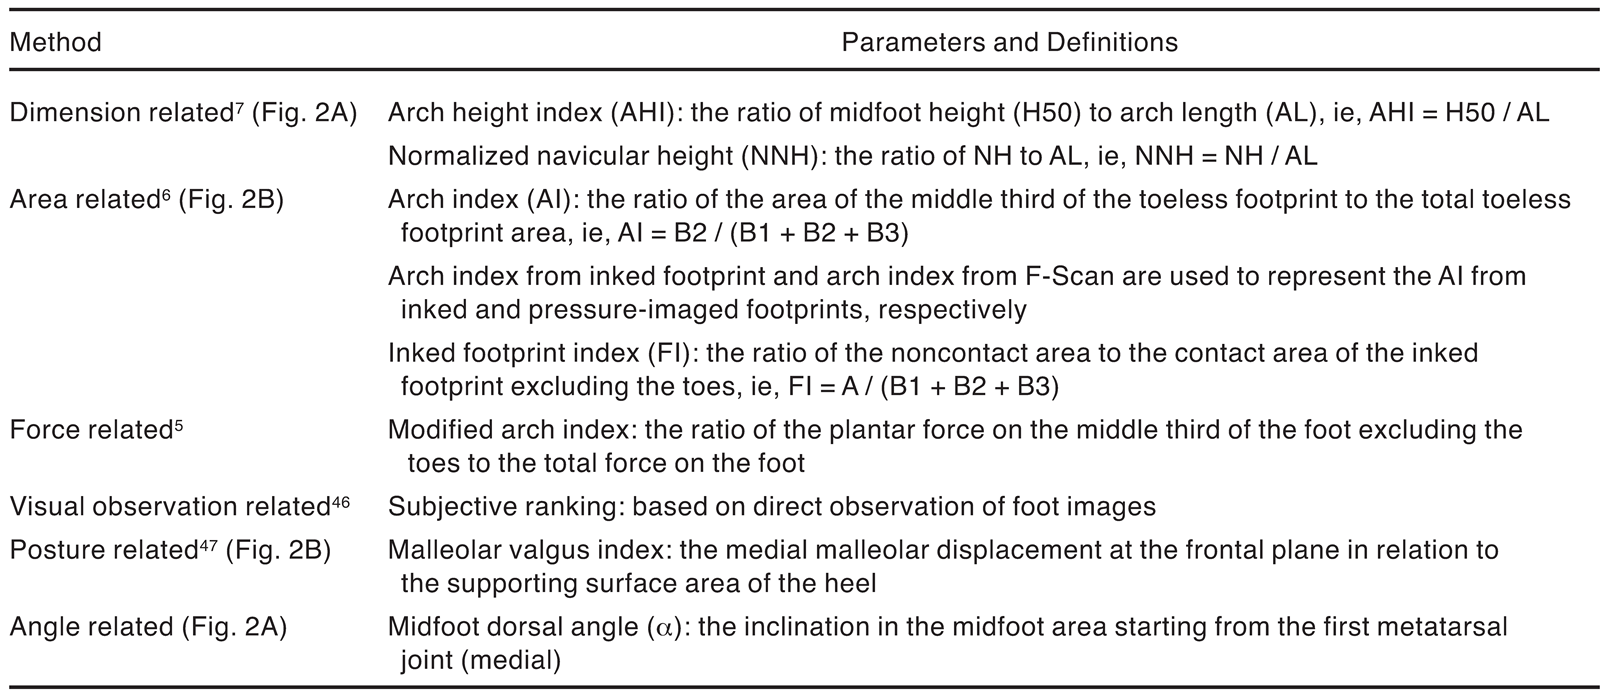
This article compares the various measures related to the foot arch (Table 1), including the midfoot dorsal angle, and then investigates the differences in the dimensional measures among various foot types.
Table 1.
Methods and Corresponding Parameters for Foot-Type Classification.
Methods
Participants
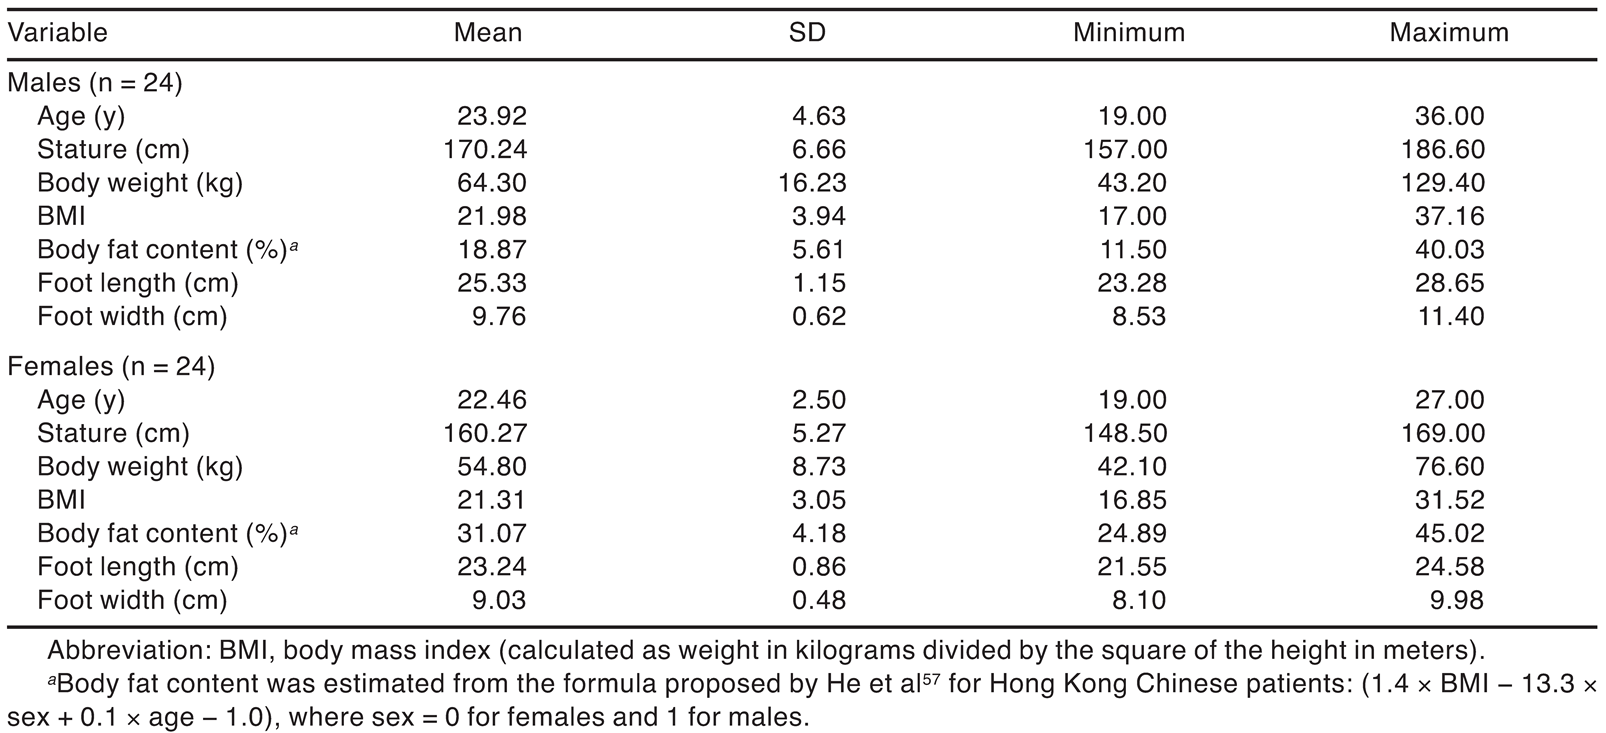
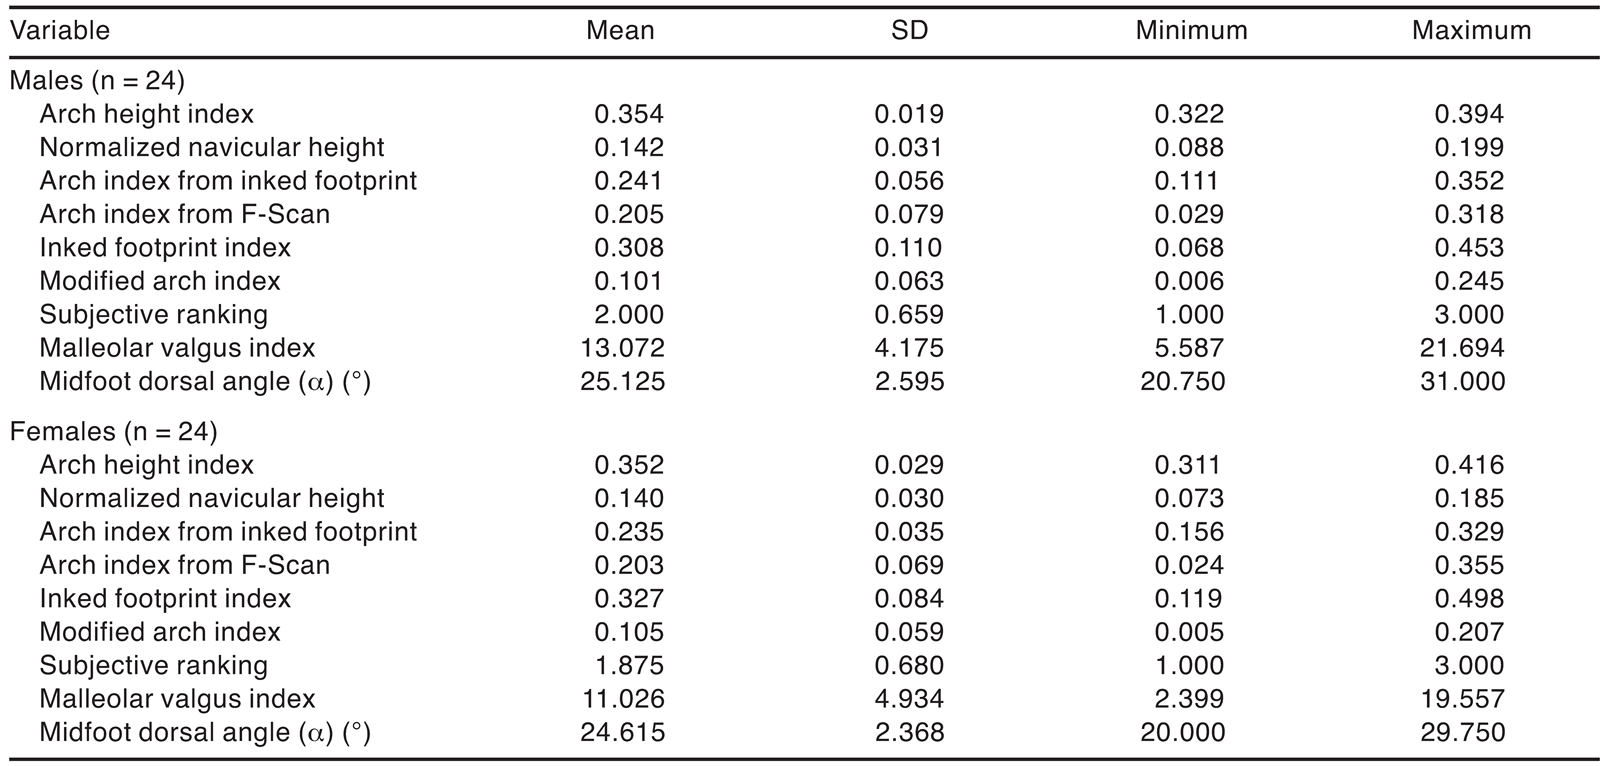
Forty-eight Hong Kong Chinese adults (24 men and 24 women) participated in the experiment, and none of them had any visible foot abnormalities or a history of significant lower-limb injury. Each participant completed a consent form before the experiment. The study was approved by the Hong Kong University of Science and Technology research ethics committee. The descriptive statistics of age, stature, body weight, body mass index, estimated body fat content, and basic foot size dimensions of the participants are given in Table 2.
Table 2.
Descriptive Statistics of the 48 Participants.
Experimental Design and Procedure
Experimental Design. Six common methods for measuring arch height were the independent variables in this study (Table 1). Based on these six methods, we identified nine dependent variables: the arch height index, [7,40,48] normalized navicular height, the arch index from inked footprint, the arch index from pressure-imaged footprint (F-Scan; Tekscan Inc, South Boston, Massachusetts), the footprint index, the modified arch index, the subjective ranking, the malleolar valgus index, and the midfoot dorsal angle (α). All of the measures were collected with the participant in a balanced standing condition.
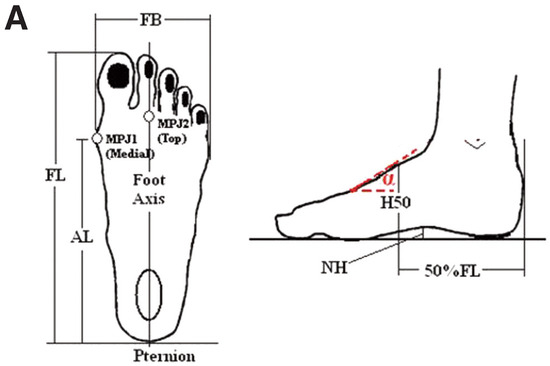
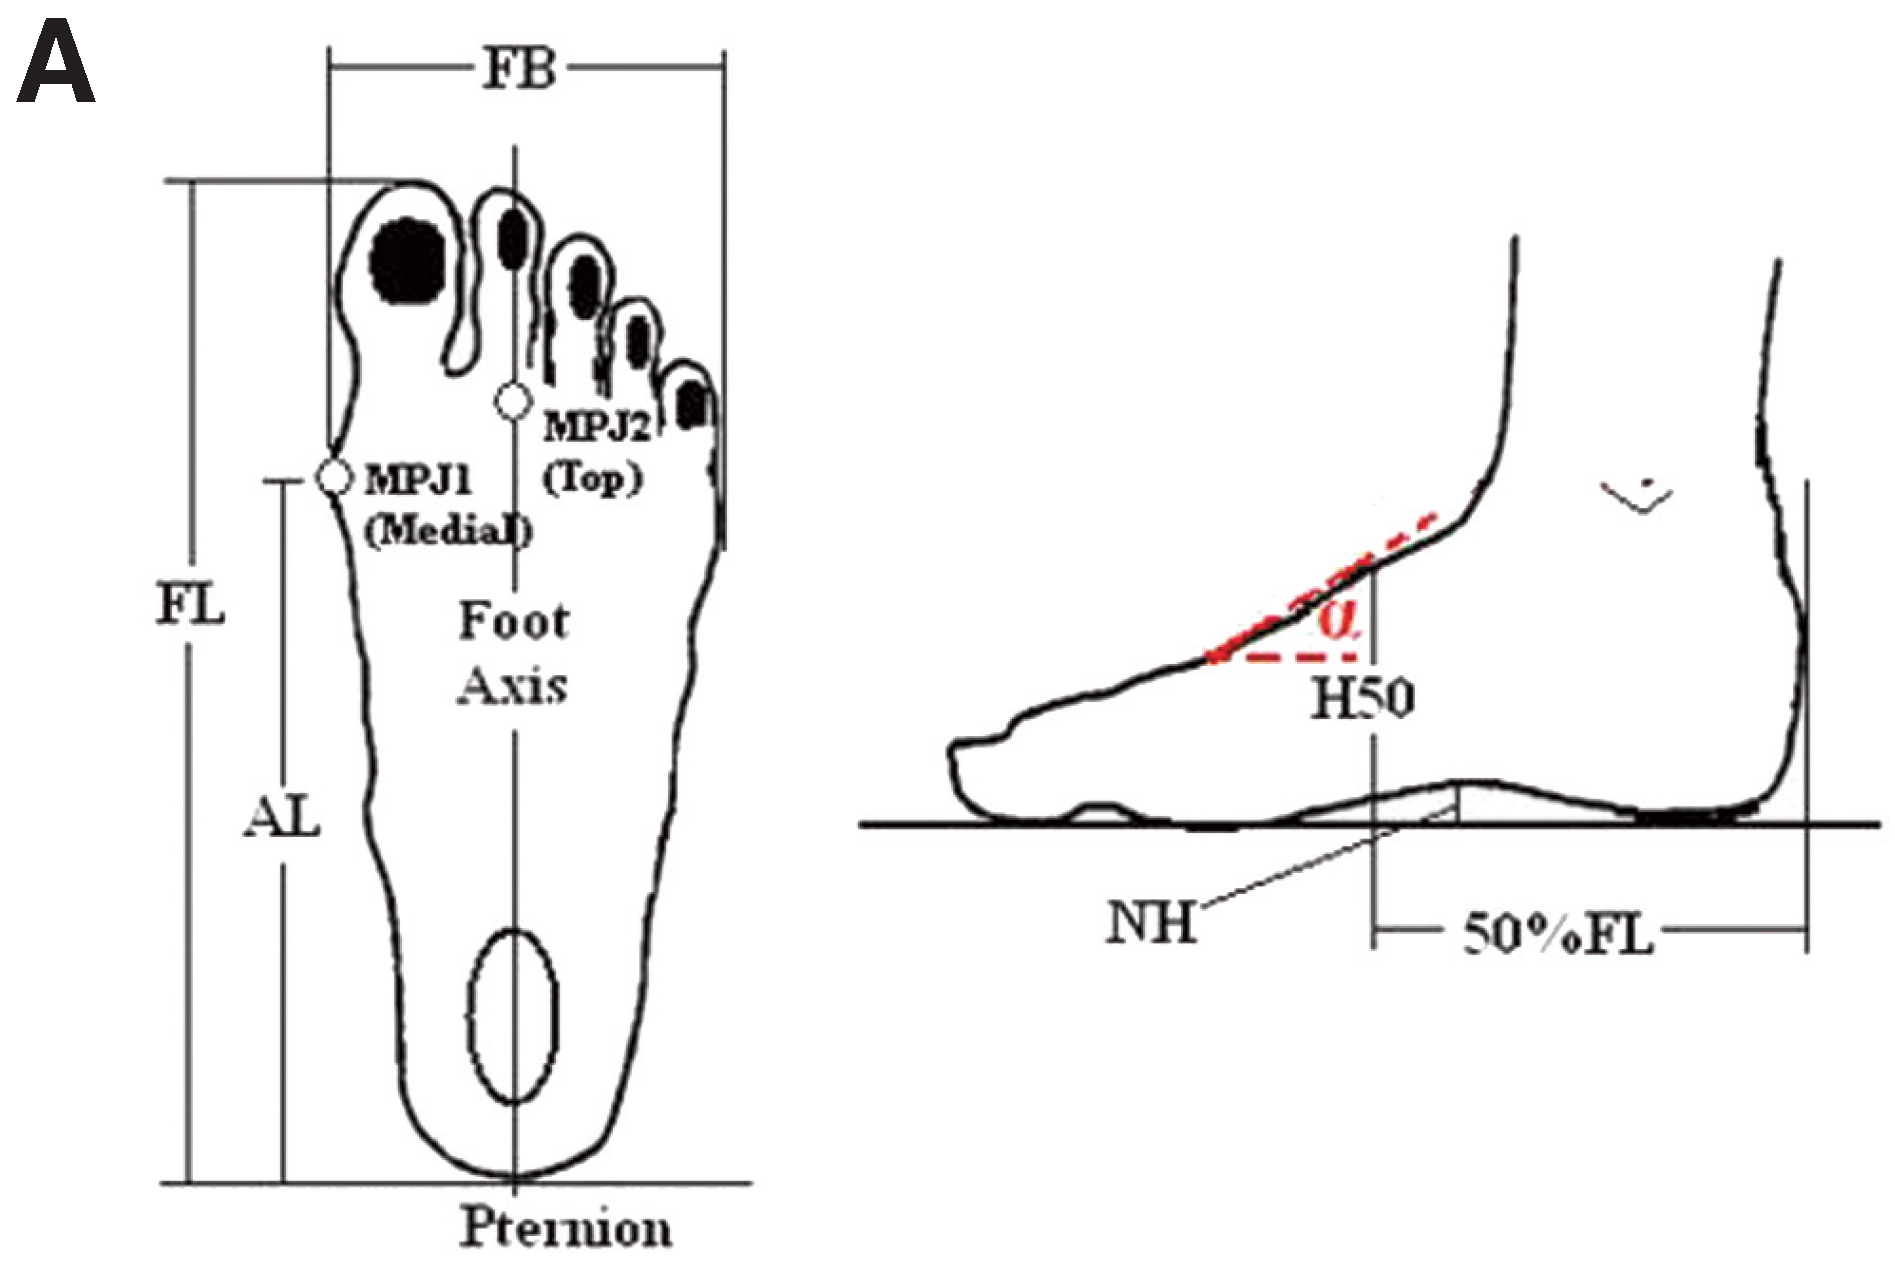
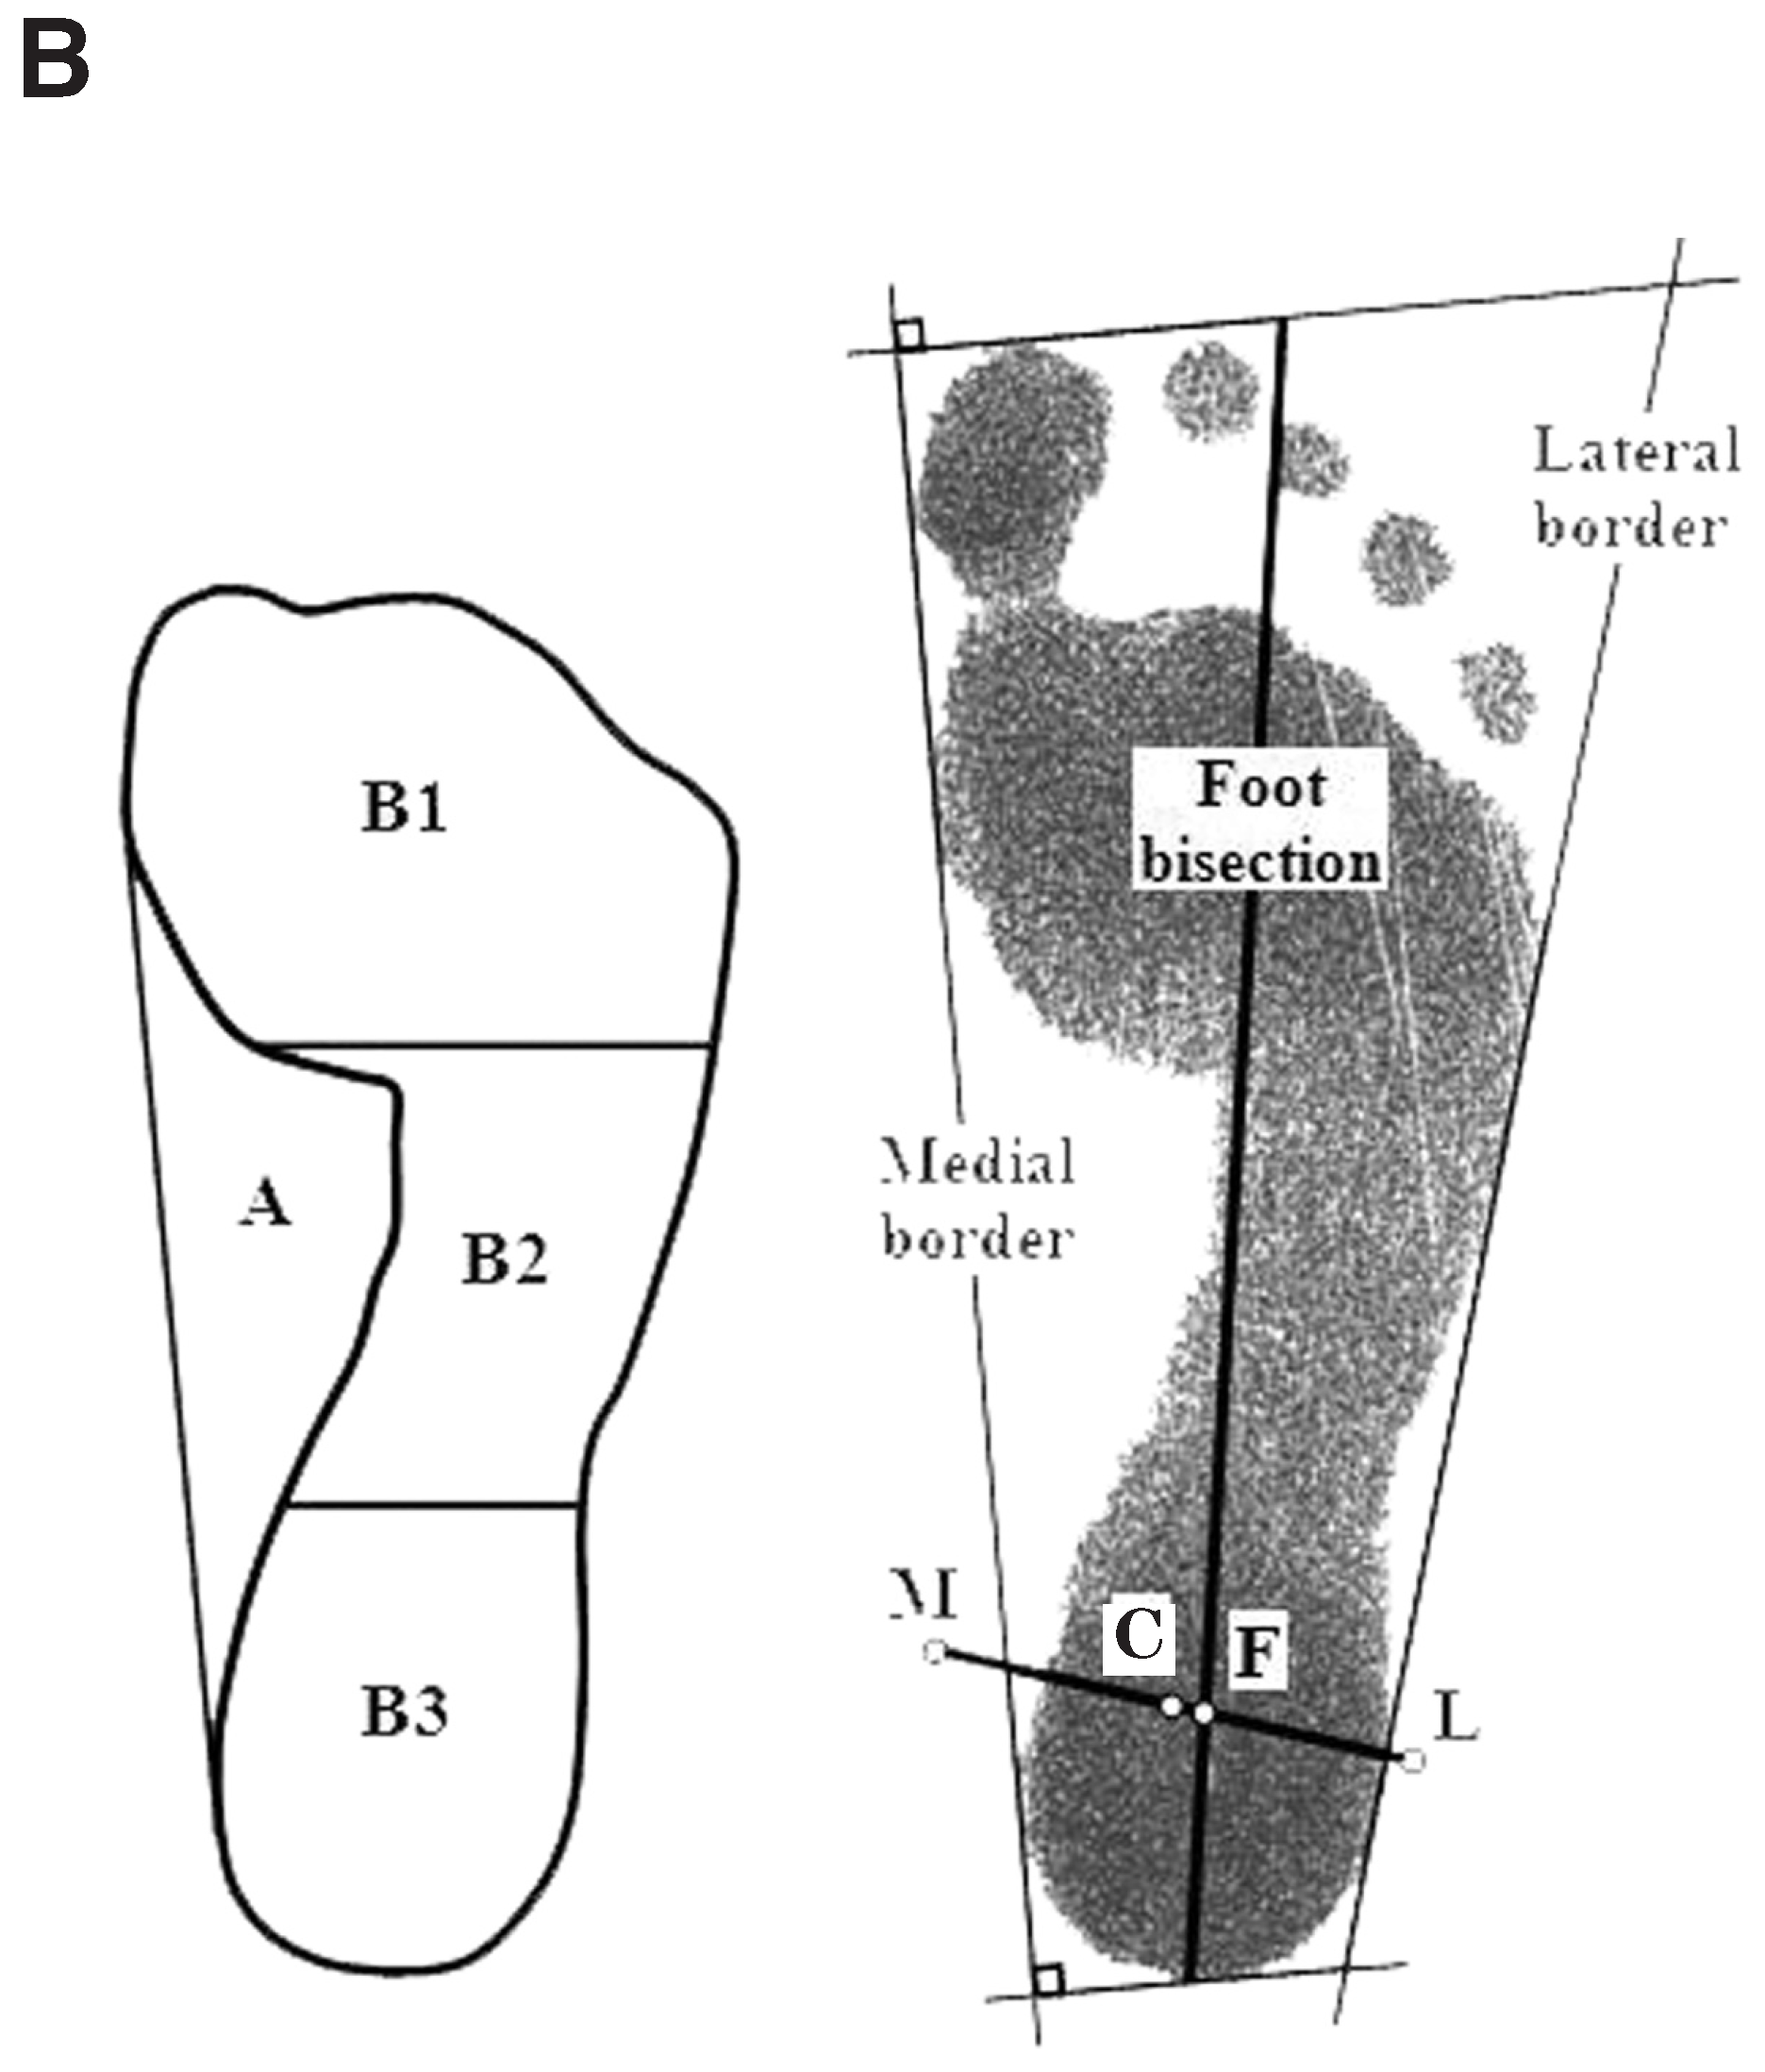
Experimental Procedure. After the participant’s right foot was cleaned, one operator (S.X.) measured the six foot dimensions of foot length, foot width, arch length, midfoot height, navicular height, and midfoot dorsal angle (α) (Figure 2A) twice, with half of the body weight on each foot with the help of set squares, a measuring tape, and a special apparatus (Figure 1B). The participants were asked to place their feet shoulder-width apart and to turn their toes out by 7°. [50] They were asked to bear half of their body weight on each foot. Thereafter, their footprints were obtained with inked paper and an F-Scan pressure measurement system, [51] which has a total of 954 sensels laid out in a 60 × 21 matrix with a spatial resolution of 3.9 sensels/cm2. The sensor mat has a thickness of 0.15 mm. The static pressure was acquired over a duration of 10 sec at a sampling rate of 50 frames per sec. The three-dimensional shape of the right foot when bearing half the body weight was obtained with the Yeti laser scanner [52] (Vorum Research Corp, Vancouver, British Columbia, Canada) with 14 stickers 6 mm in diameter placed on anatomical landmarks that included the medial and lateral malleoli. The malleolar valgus index was determined from the three-dimensional scan. [53]
Figure 2.
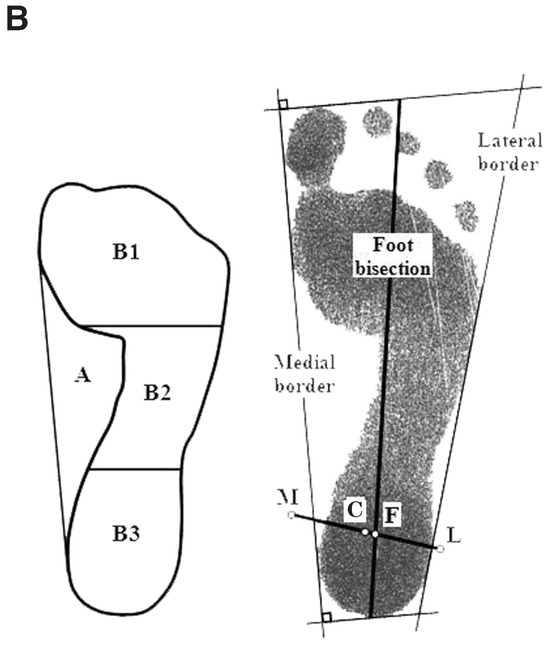
A, Six manual foot measurements. AL indicates arch length; FB, foot width; FL, foot length; H50, midfoot height; MPJ, metatarsophalangeal joint; NH, navicular height; and α, midfoot dorsal angle. B, A sample of arch-related parameters from a traditional inked footprint: arch index = B2 / (B1 + B2 + B3), footprint index = A / (B1 + B2 + B3), and malleolar valgus index = (LC − LF) / LM * 100, where C is the bisection of the medial malleolus (M) and the lateral malleolus (L), and F is the intersection between the foot bisection line and line ML.
Data Processing
The F-Scan software was used to determine the contact area, forces, and mean and peak pressures of the 500 frames of data, equivalent to 10 sec, in the heel, midfoot, and forefoot thirds of the foot, excluding the toe areas. The mean of the 500 frames was then used to calculate the two parameters related to the pressures: the arch index from F-Scan and the modified arch index. The footprint parameters arch index from inked footprint and footprint index have generally been determined with a planimeter or by counting the number of squares of known area within an enclosed region. Instead, a C++ program was developed to calculate the areas from the scanned inked footprints (Figure 2B). The program was validated with AutoCAD (2004.00.0 version), and the error related to the area calculation was estimated to be within 1.0% (mean [SD], 0.05% [0.31%]). The malleolar valgus index was calculated from the two-dimensional foot outline obtained from the laser scan in conjunction with the two malleolar landmarks as proposed by Song et al. [28]
Results
The Metrics
The means, SDs, maximums, and minimums of the various parameters are presented in Table 3. A two-sample t test showed no gender differences in the nine parameters. Hence, the data from the male and female participants were pooled together in subsequent analyses.
Table 3.
Descriptive Statistics of the Foot-Type Classification Parameters for Male and Female Participants.
The intraclass correlation coefficient (ICC) type (2,1)54 was determined to assess the reliability of each metric from two trials by the same operator (S.X.) on 48 participants. The ICC values were as follows: arch index from inked footprint, 0.960; arch index from F-Scan, 0.982; footprint index, 0.962; modified arch index, 0.982; arch height index, 0.963; normalized navicular height, 0.984; midfoot dorsal angle (α), 0.940; and subjective ranking, 0.767.
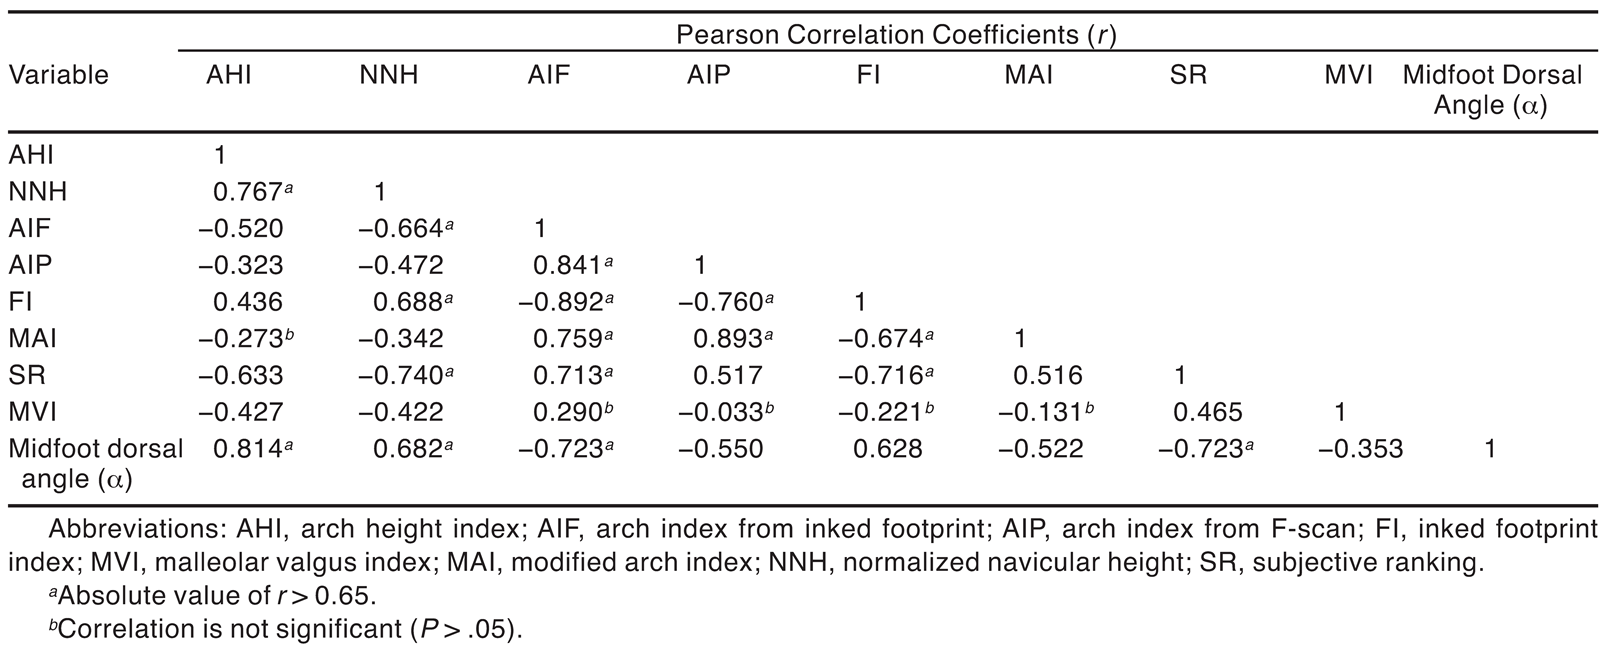
The Pearson correlation coefficients (r) among the foot arch parameters are summarized in Table 4. Correlations among all investigated parameters were significant (P < .05) except for some correlations with malleolar valgus index and between modified arch index and arch height index. In particular, the arch index from the traditional ink footprint method showed moderate to strong correlations (range, 0.520–0.892) with all of the other parameters except for the malleolar valgus index.
Table 4.
Pearson Correlation Coefficients Among the Different Metrics.
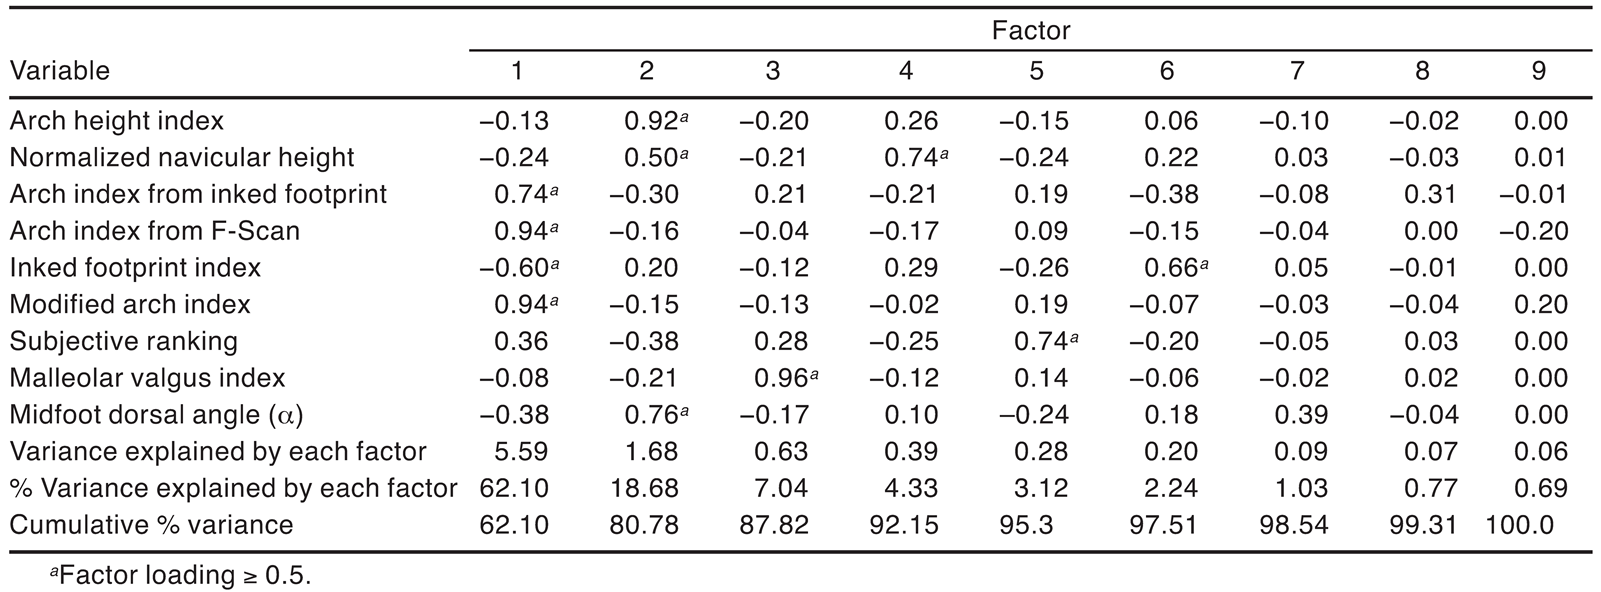
When correlations exist among the variables investigated, factor analysis provides a method for analyzing the underlying structure of the interrelationships by determining a set of common underlying dimensions called factors. [55] The factor analysis using the principal component method with varimax rotation showed the emergence of three dominant groups that explain 87.8% of the variance (Table 5). The first group is dominated by the area-related measures of arch index from inked footprint, arch index from F-Scan, and footprint index and the force-related parameter modified arch index; the second group includes the foot dimension–related measures of arch height index, normalized navicular height, and the midfoot dorsal angle (α); and the third group includes the foot posture–related parameter malleolar valgus index.
Table 5.
Factor Analysis of the Nine Metrics Using the Principal Component Method with Varimax Rotation.
Effect of Arch Type on the Physical Measures
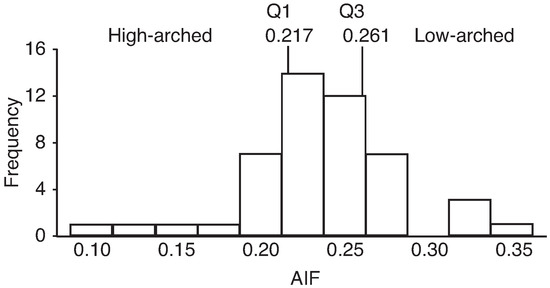
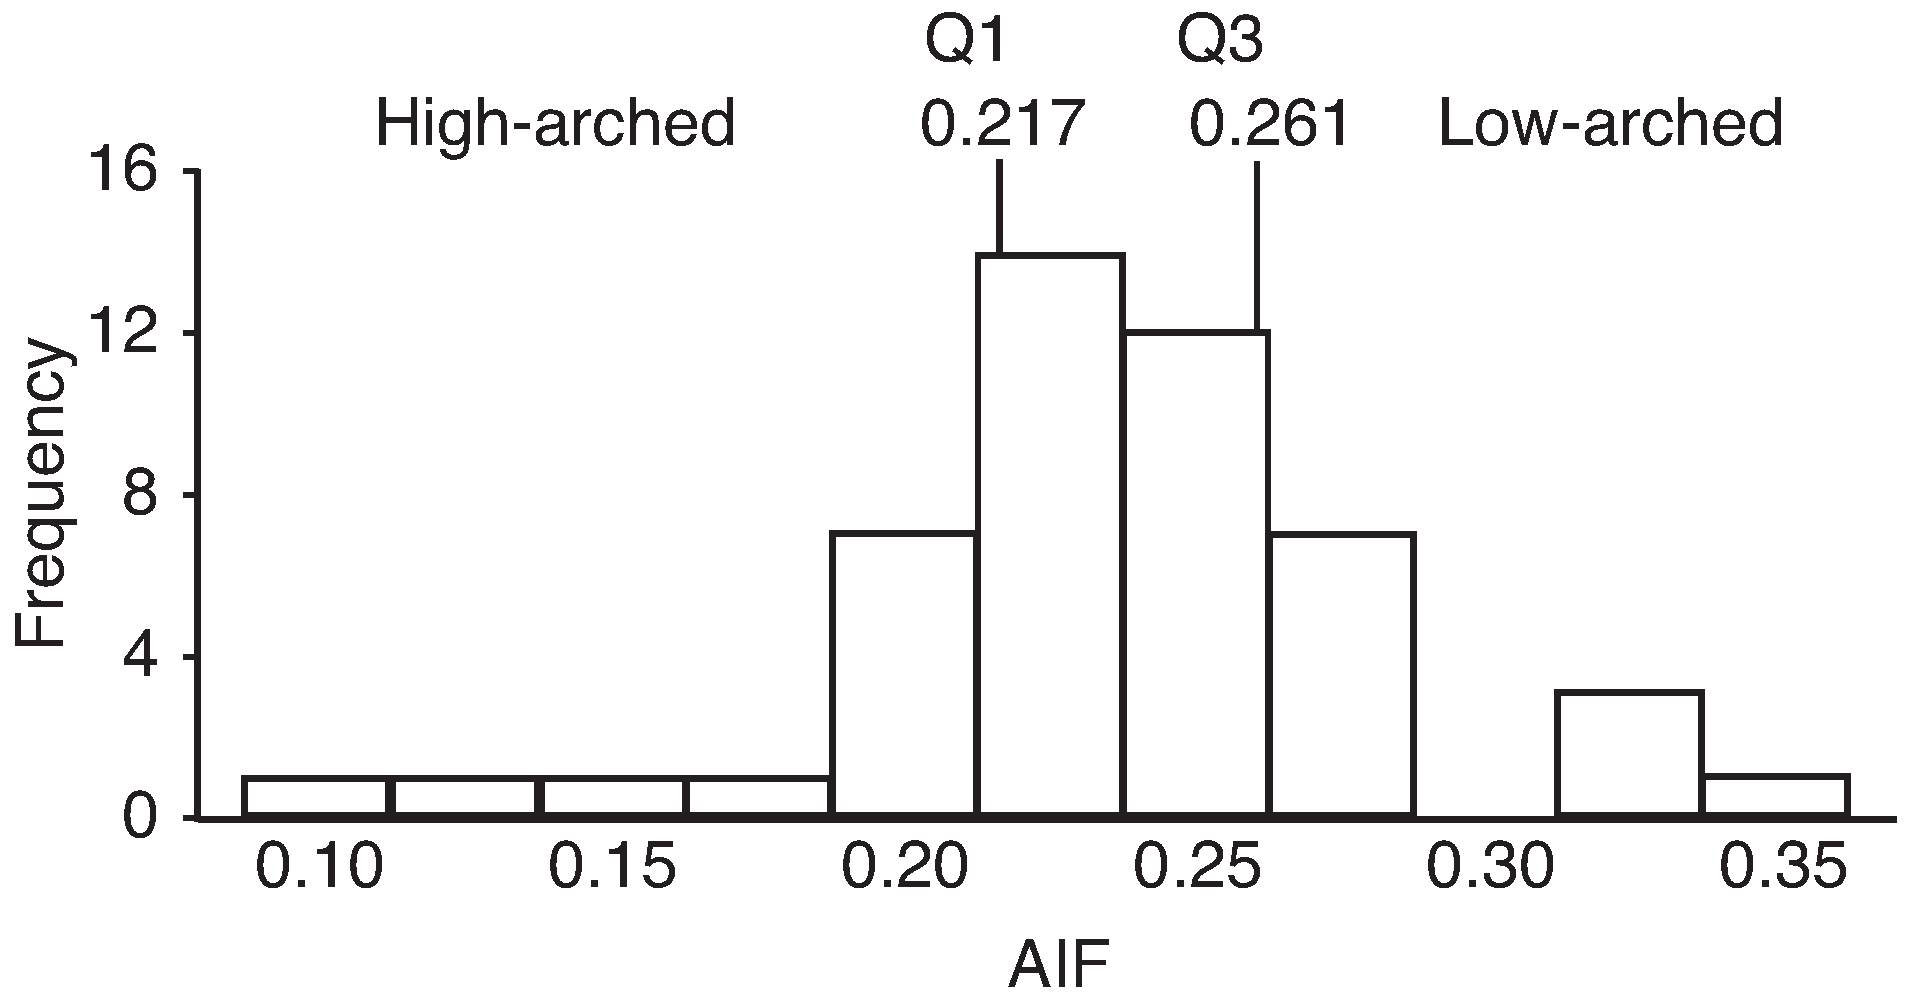
The arch index from inked footprint showed moderate to high correlations (r = 0.52–0.89) with all of the measures except for malleolar valgus index. Hence, the arch index from inked footprint was used to classify the feet into high-, normal-, and low-arched groups. The arch index from inked footprint distribution of all of the participants is shown in Figure 3. The feet were classified with the first and third quartiles, as suggested by Cavanagh and Rodgers [4]: the arch index from inked footprint was less than 0.217 for higharched feet, 0.217 to less than 0.261 for normal-arched feet, and 0.261 or greater for low-arched feet. These ranges are similar to those suggested by Cavanagh and Rodgers [4] and are discussed later herein. Based on the previous criterion, 12 of the participants had high-arched feet, 24 had normal-arched feet, and 12 had low-arched feet.
Figure 3.
Distribution of the arch index from inked footprint (AIF) values with the first (Q1) and third (Q3) quartiles to classify foot arch types (AIF < Q1 is high arched, Q1 ≤ AIF < Q3 is normal arched, and AIF ≥ Q3 is low arched).
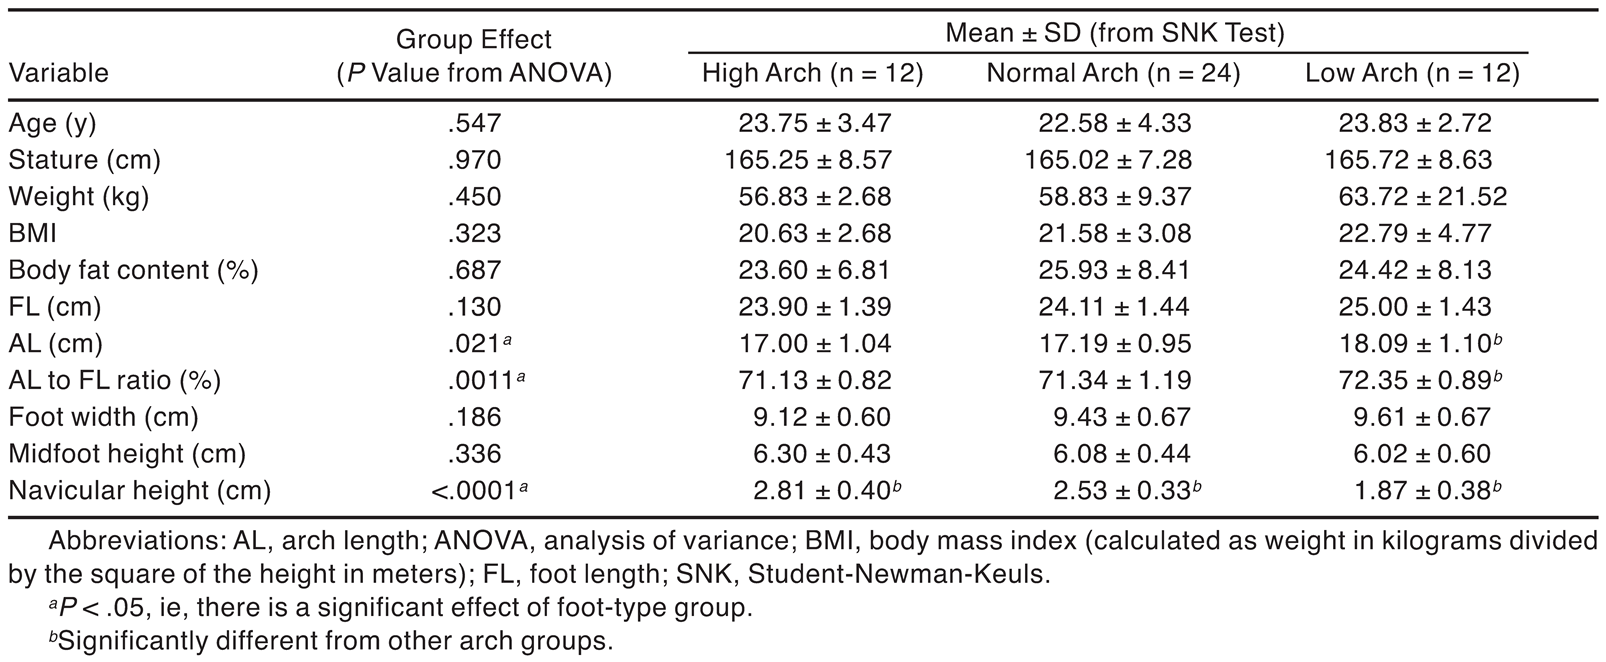
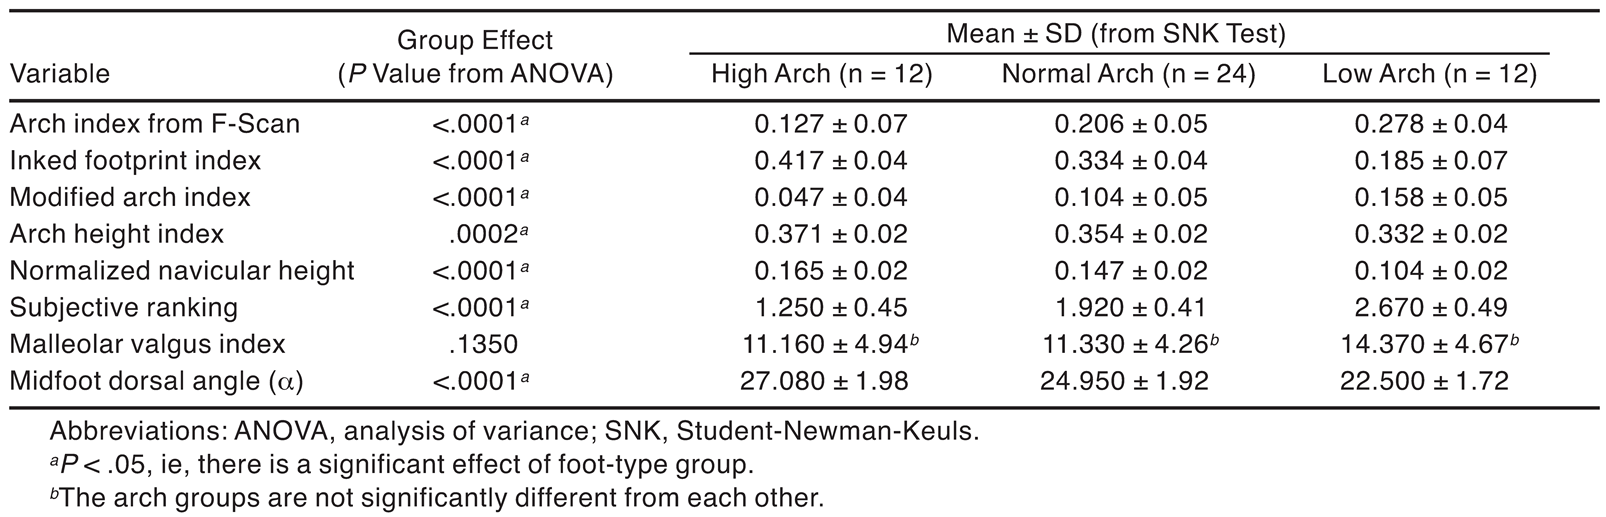
An analysis of variance was performed to determine whether there were any differences among the three foot types (Table 6 and Table 7). The results showed no significant differences in age, stature, weight, body mass index, estimated body fat content, foot length, foot width, and midfoot height (P > .05) (Table 6). However, arch length, the arch length to foot length ratio, and navicular height were significantly different among the three groups (P < .05). As expected, the low-arched group had significantly longer arch lengths than the normal- and high-arched groups by approximately 1.0 cm. Navicular height, the midfoot dorsal angle (α), the arch index from F-Scan, the footprint index, the modified arch index, the arch height index, normalized navicular height, and the subjective ranking were significantly different among the three groups (Table 7). The malleolar valgus index was the only variable that was not significant among the three types of feet primarily because of the high variance among the participants.
Table 6.
Age, Stature, Weight, and Manual Foot Measurements by Foot-Type Group.
Table 7.
Foot-Type Classification Parameters by Foot-Type Group.
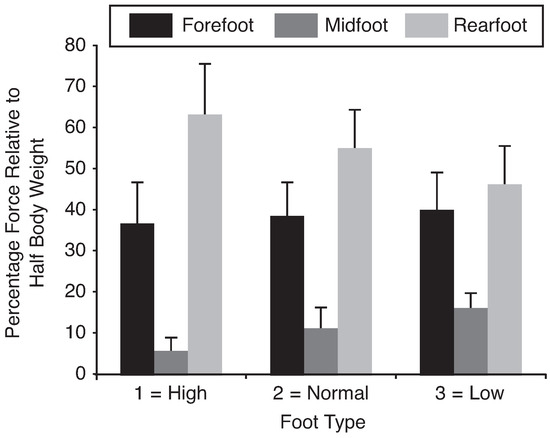
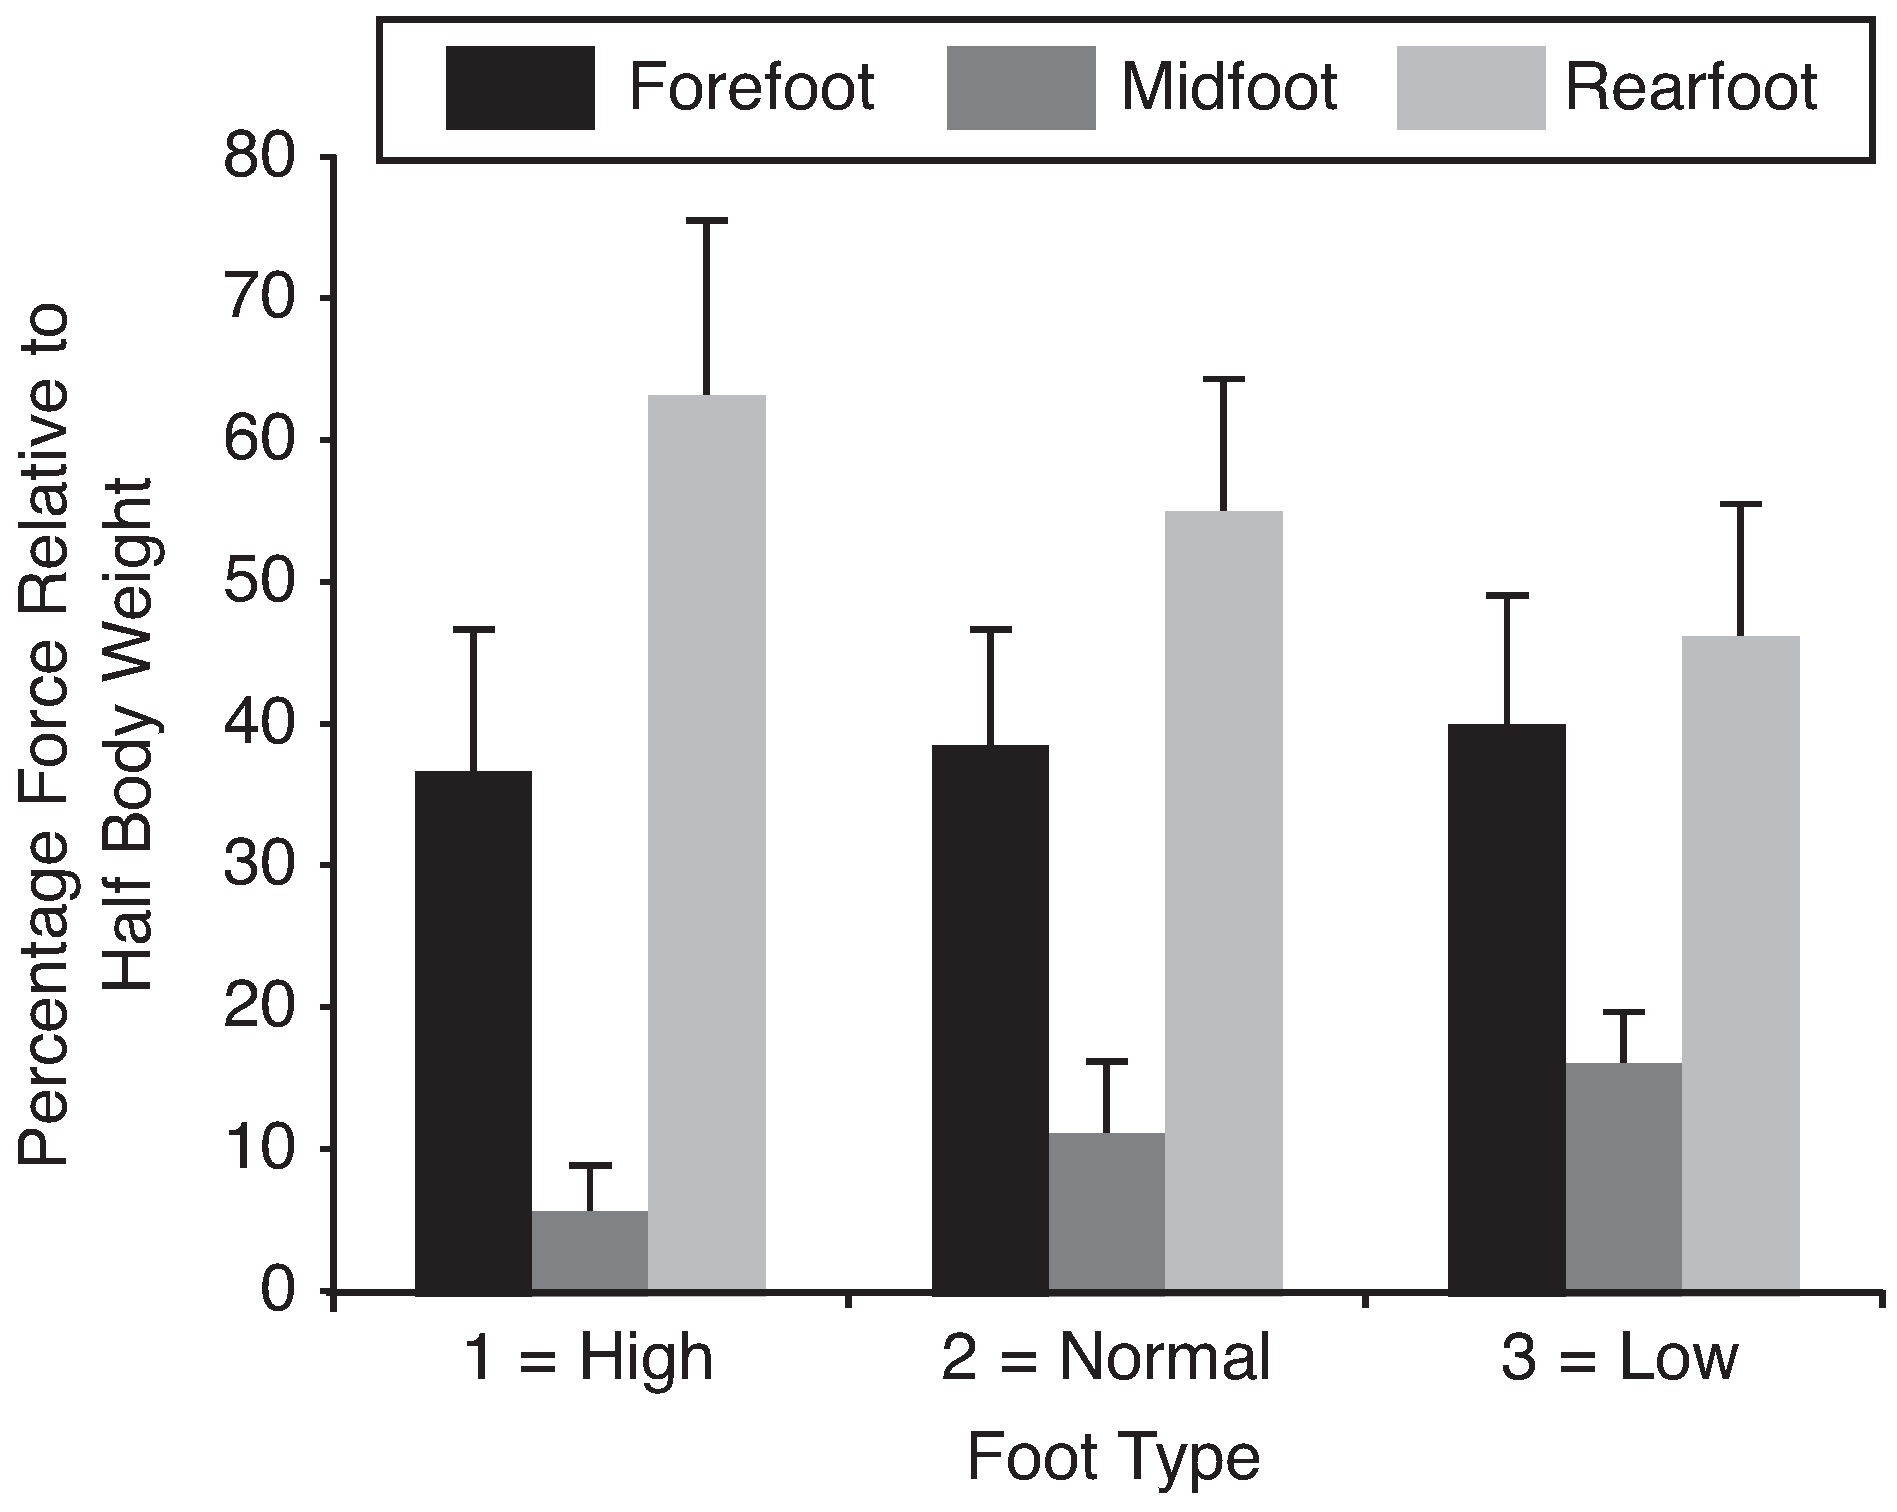
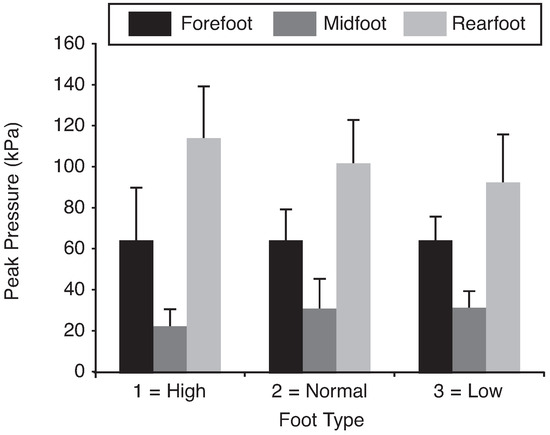
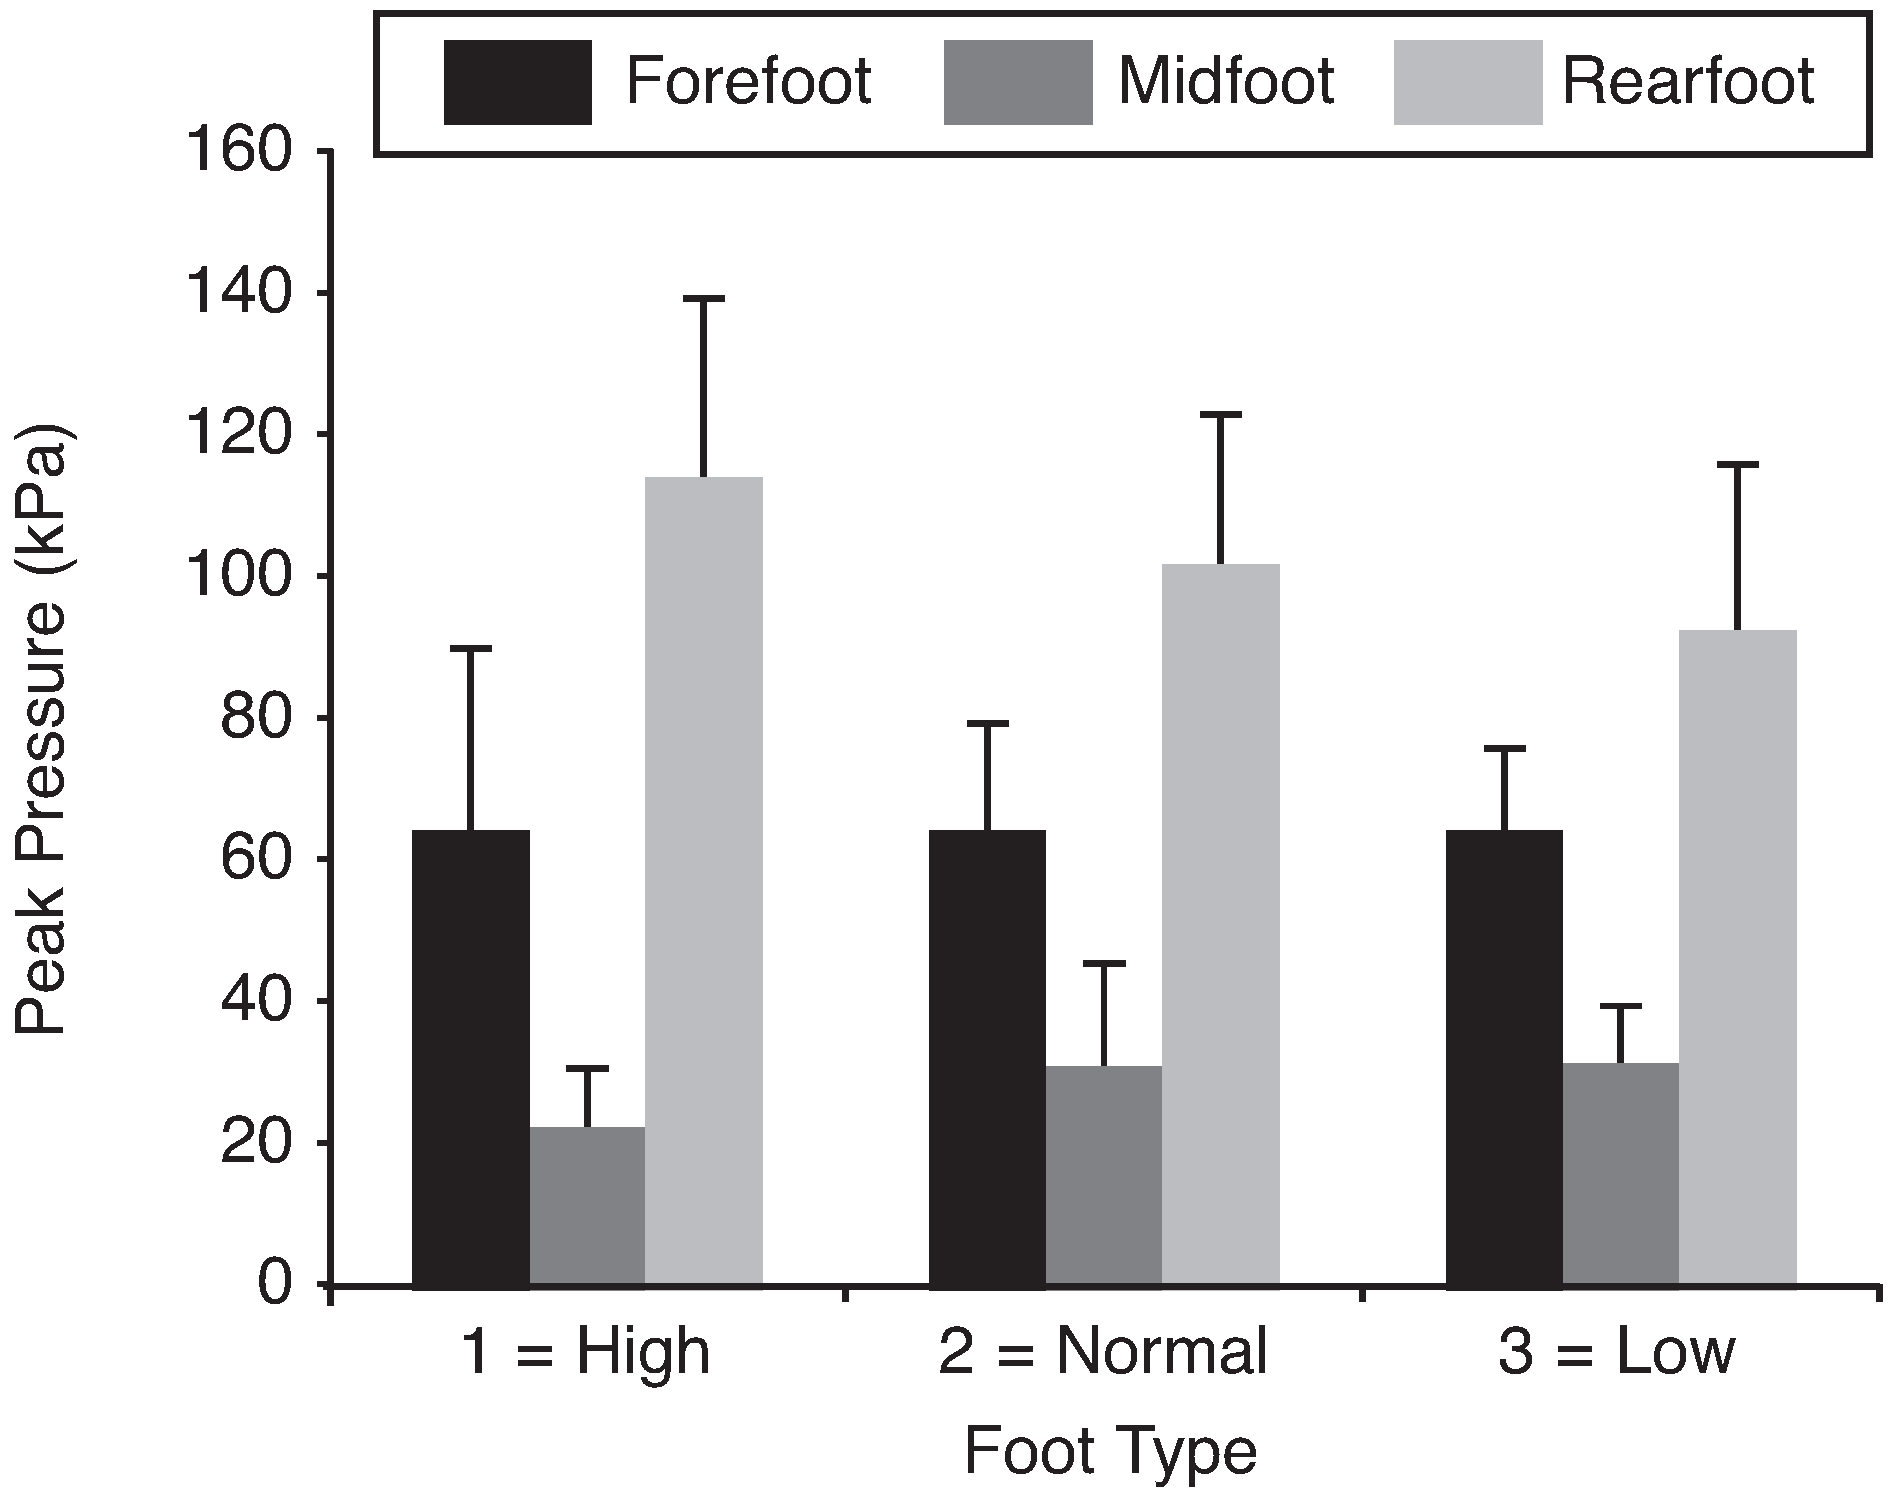
Figure 4 shows the distribution of loading on each of the three regions for the three foot-type groups. The high-arched group had 17% more loading (P < .05) in the rearfoot, 11% less in the midfoot, and about the same amount in the forefoot (P = .709) compared with the low-arched group. These findings indicate that the loading distribution differences are between the midfoot and the rearfoot. The load distributions cause differences in peak pressures as well. High-arched feet had significantly smaller peak pressures in the midfoot region but larger peak pressures in the rearfoot region (P < .05) (Figure 5). The mean (SD) peak pressures in the rearfoot region of the high-, normal-, and low-arched groups were 112.6 (27.51) kPa, 101.57 (22.47) kPa, and 91.14 (24.19) kPa, respectively.
Figure 4.
Distribution of mean force values relative to half the body weight in the three regions of each foot type. Error bars represent SD.
Figure 5.
Mean peak pressures in the different foot types. Error bars represent SD.
Discussion
In this study, nine parameters related to the arch of the human foot were calculated with six different methods, and it was found that there were significant (P < .05) correlations among all of the foot parameters except for the malleolar valgus index (Table 4). The inked footprint arch index had moderate to high correlations with the arch index from F-Scan, the footprint index, the modified arch index, the midfoot dorsal angle (α), the arch height index, normalized navicular height, and the subjective ranking. Hawes et al [22] and Shiang et al [6] also reported a significant correlation between the arch index from inked footprint and the footprint index, with correlation coefficients of −0.59 and −0.55, respectively. Herein, the correlation was higher, with r = −0.892. The differences could be attributable to the method used to acquire the footprint or possibly the population surveyed. The subjective ranking, which was based on visual observation, also showed a significant correlation of 0.713 with the arch index from inked footprint. The subjective ranking is popular in clinical settings, especially when quick evaluations need to be made and when the equipment necessary to determine the objective measures is not available. [39] However, researchers have argued that this approach is too subjective, that it can vary from person to person, and that it depends on the experimenter’s experience. [6] The reliability of all of the measures was higher than 0.9, except for the subjective ranking. The midfoot dorsal angle, α, which is related to the calcaneal–first metatarsal angle and the calcaneal inclination angle (Figure 1), seems to be related to factors 1 and 2 (Table 5), with a dominant effect from factor 2. This indicates that the midfoot dorsal angle may have a useful combination of pressure-related parameters as well as the navicular-related dimensions. The midfoot dorsal angle may, indeed, be appropriate for characterizing the foot arch because it accounts for the foot length dimension as well.
The arch height index has been shown to be a reliable metric for assessing the foot arch. [40] This study has shown that the midfoot dorsal angle, α, is comparable with the arch height index in terms of its relation to the arch height index and the reliability of the metric. The ICC of the midfoot dorsal angle, α, is 0.940, whereas the ICC of the arch height index is 0.963. Furthermore, the correlation analysis showed that of all of the parameters, midfoot dorsal angle (α) has the highest Pearson correlation (r = 0.814) with the arch height index (Table 4). Note that the midfoot dorsal angle is relatively easier to measure compared with the arch height index. A weak correlation between the malleolar valgus index and the other arch measures does not mean that the malleolar valgus index is not important in foot characterization (Table 4). The malleolar valgus index may be viewed as a measure that can characterize dynamic foot function. Hence, it is no surprise that the malleolar valgus index has a strong correlation with navicular drop. [47] Most measures are generally obtained with the participant in a balanced standing position. However, if all of the measures are obtained with a 30° knee flexion angle, as outlined by Billis et al, [47] it may be hypothesized that the correlations of the other measures with the malleolar valgus index may be higher.
Owing to the lack of any other available classification method, the arch index from inked footprint was used to separate the 48 participants into the three groups of high-, normal-, and low-arched feet. The values of 0.217 and 0.261 corresponded to the first and third quartiles, respectively, and these two values were comparable with the range of 0.21 to 0.26 suggested by Cavanagh and Rodgers, [4] indicating that these values are possibly population invariant. In the three groups, there were no significant differences in age, stature, weight, body mass index, estimated body fat content, foot length, foot width, and midfoot height (P > .05), indicating that there are no clear indicators that relate to the type of arch. This finding is consistent with findings from Rao and Joseph [56] and Twomey, [39] who also reported that body weight and body mass index are not related to the type of arch, although Wearing et al [45] reported that a high body mass index or high body fat content is associated with a person having low-arched feet.
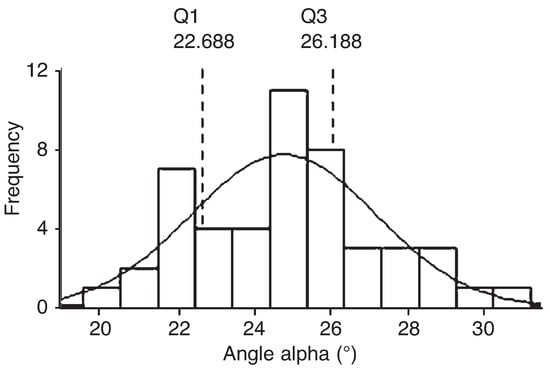
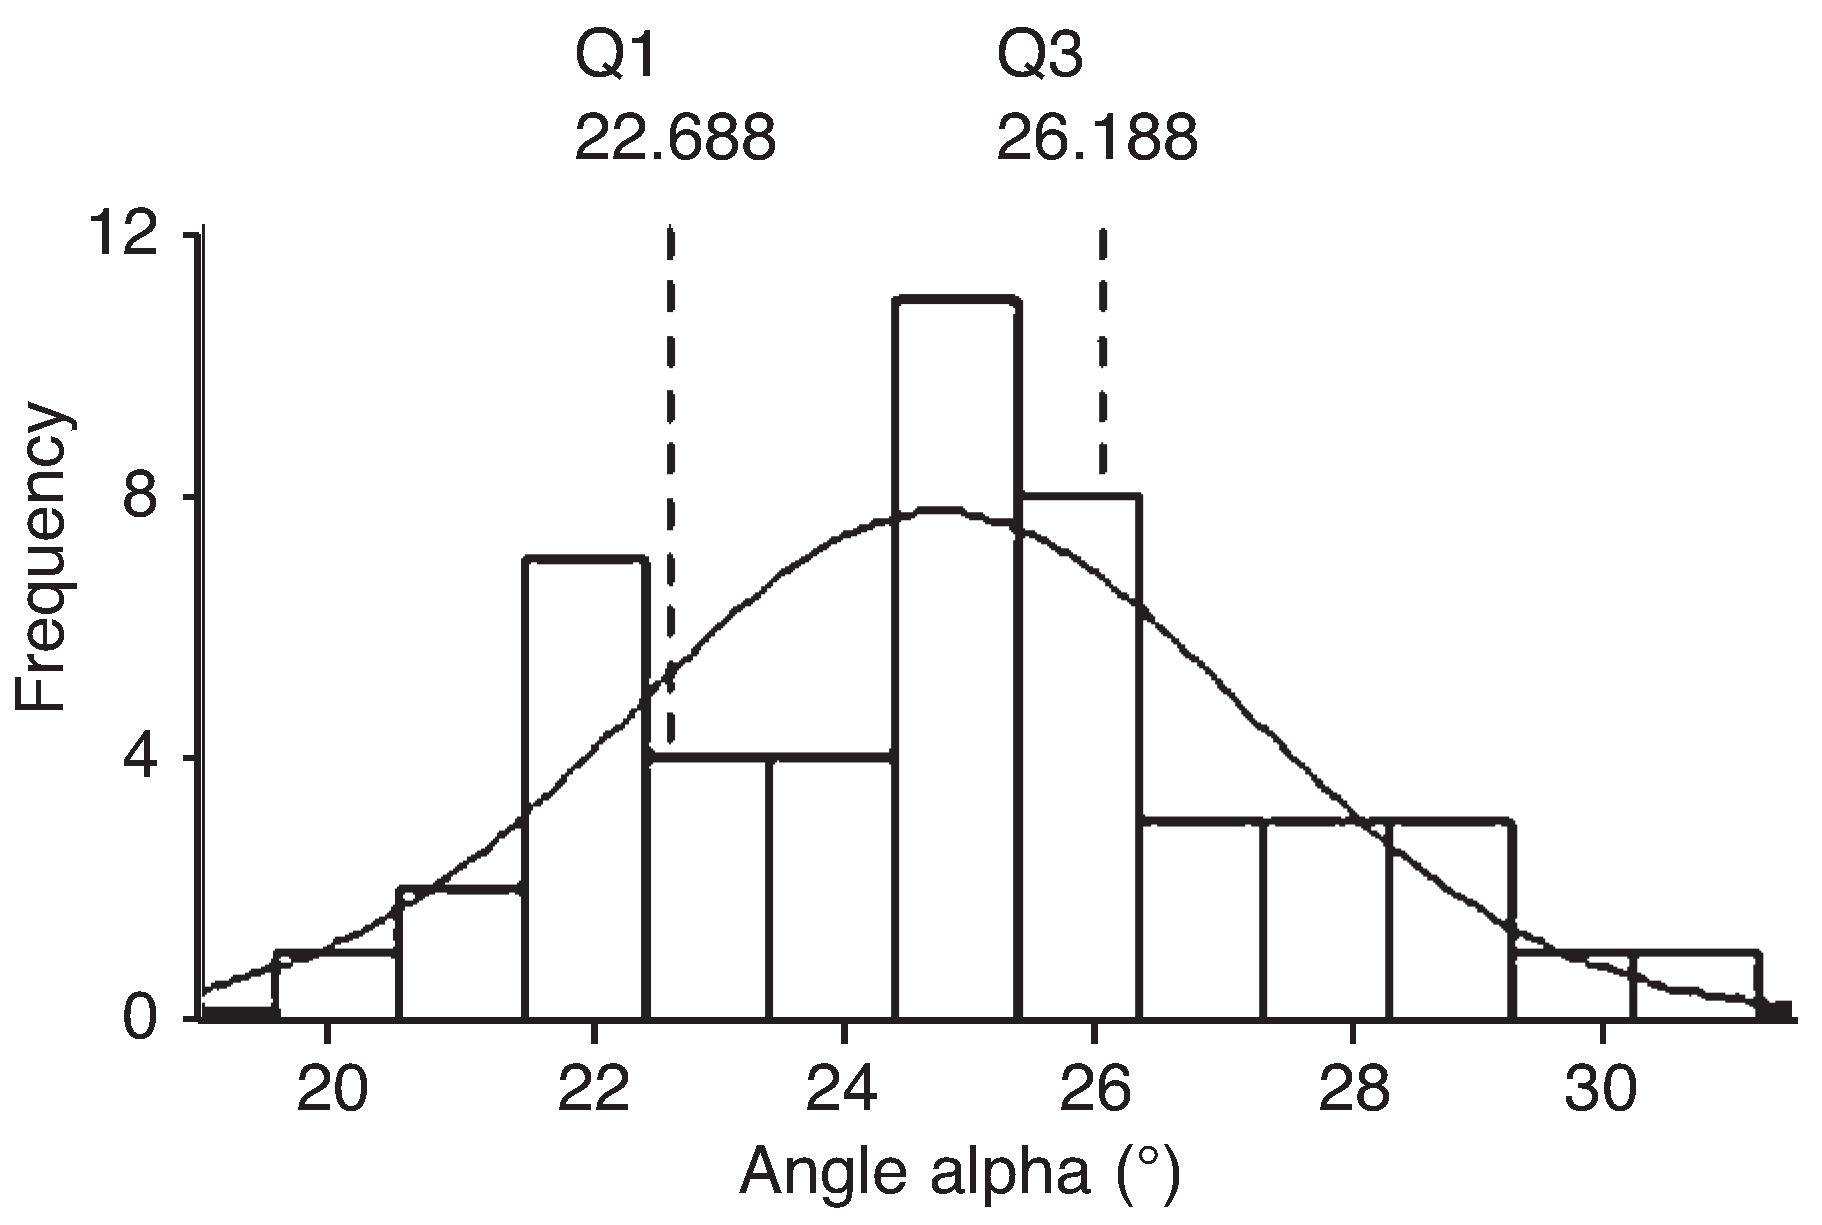
In terms of dimensions, there were significant differences in arch length, navicular height, and midfoot dorsal angle among the three foot-type groups. Compared with the high-arched group, the low-arched group had a significantly longer arch length (mean difference, 1.09 cm) but a smaller navicular height (mean difference, 0.94 cm) and a lower midfoot dorsal angle (mean difference, 4.58°). The mean midfoot dorsal angles for the low-, normal-, and high-arched feet were 22.5°, 24.95°, and 27.08°, respectively. Although these angles may be sufficient for classifying the arch type, the first and third quartiles were determined to compare with the well-known arch index. The first and third quartiles of α were 22.688° and 26.188°, respectively (Figure 6). When the first and third quartiles were used to classify the feet as low, normal, and high arched, 33 of the 48 participants had the same classification as with the arch index from the inked footprint. In other words, there is 69% similarity between the midfoot dorsal angle and the arch index. Given the limitations of the arch index, [45] it is unlikely that the proposed measure, α, will have perfect agreement with the arch index from inked foot-print. Six of the males who were classified differently had the highest body mass index and body fat content, which was calculated with the prediction formula for Hong Kong Chinese. [57] However, a similar pattern was not seen in females, possibly because the percentage of body fat was estimated rather than measured or owing to the differences in the Hong Kong Chinese population.
Figure 6.
Distribution of the mean midfoot dorsal angle (α) values with the fitted normal curve. The first (Q1) and third (Q3) quartile values correspond to 22.688° and 26.188°, respectively.
The force distribution (Figure 4) and peak pressures (Figure 5) were different among the different arch types. The differences were in the midfoot and rearfoot regions, whereas loading on the forefoot was not significantly different among the three groups. In the high-arched group, the rearfoot had 17% more loading and the midfoot had 11% less loading than in the low-arched foot group. These differences resulted in the high-arched group having a significantly lower peak pressure in the midfoot region but a higher peak pressure in the rearfoot region (Figure 5) compared with the low-arched group. The mean (SD) peak pressures in the rearfoot were 112.6 (27.51) kPa in high-arched feet, 101.57 (22.47) kPa in normal-arched feet, and 91.14 (24.19) kPa in low-arched feet. Witana et al [58] reported that a characteristic feature of a comfortable footbed is a peak pressure lower than 100 kPa. It is clear that some sort of additional support is needed for high-arched feet to reduce the high-peak pressures.
A limitation of this study is that all of the measures were evaluated with the patient in a standing posture. The parameters may be different during gait, [59] although it may not be easy to determine each of the measures under dynamic conditions. Overall, it seems that the midfoot dorsal angle is a quick and easy way to characterize the arch of a foot without using the tedious procedures associated with area calculations and dimension measurements.
Financial Disclosure
The Research Grants Council of Hong Kong funded this study under grant HKUST 613008; the support of NSFC 70971084 and the Open Fund of the Shanghai Key Lab of Advanced Manufacturing Environment is also appreciated.
Conflicts of Interest
None reported.
References
- AU EYL, GOONETILLEKE RS: A qualitative study on the comfort and fit of ladies’ dress shoes. Appl Ergon 2007, 38, 687. [CrossRef] [Scilit]
- LUXIMON A, GOONETILLEKE RS: Foot shape modeling. Hum Factors 2004, 46, 304. [CrossRef] [Scilit]
- REILEY, M.A. Guidelines for Prescribing Foot Orthotics; Slack Inc: Thorofare, NJ, 1995. [Google Scholar]
- CAVANAGH, P.R.; RODGERS, M.M. The arch index: a useful measure from footprint. J Biomech 1987, 20, 547. [Google Scholar] [CrossRef] [Scilit]
- CHU, W.C.; LEE, S.H.; CHU, W.; et al. The use of arch index to characterize arch height: a digital image processing approach. IEEE Trans Biomed Eng 1995, 42, 1088. [Google Scholar] [PubMed]
- SHIANG, T.Y.; LEE, S.H.; LEE, S.J.; et al. Evaluating different footprint parameters as a predictor of arch height. IEEE Eng Med Biol Mag 1998, 17, 62. [Google Scholar] [CrossRef] [Scilit] [PubMed]
- WILLIAMS, D.S.; MCCLAY, I.S. Measurements used to charac-terize the foot and the medial longitudinal arch. Phys Ther 2000, 80, 864. [Google Scholar] [CrossRef] [Scilit] [PubMed]
- BOWKER JH: Neurological aspects of prosthetic/orthotic practice. J Prosthet Orthot 1993, 5, 52.
- DONATELLI RA: “Abnormal Biomechanics,” in The Bio-mechanics of the Foot and Ankle,, 2nd Ed; Do-natelli, R.A., Ed.; FA Davis Co: Philadelphia, 1996. [Google Scholar]
- GULDEMOND, N.A.; LEFFERS, P.; SCHAPER, N.C.; et al. Comparison of foot orthoses made by podiatrists, pedorthists and orthotists regarding plantar pressure reduction in The Netherlands. BMC Musculoskelet Disord 2005, 6, 61. [Google Scholar] [CrossRef] [Scilit]
- HOWARD, J.S. BRIGGS D: The arch-height-index measure-ment system: a new method of foot classification. Athl Ther Today 2006, 11, 56. [Google Scholar]
- LIN, C.H.; CHEN, J.J.; WU, C.H.; et al. Image analysis system for acquiring three-dimensional contour of foot arch. Comput Methods Programs Biomed 2004, 75, 147. [Google Scholar] [CrossRef] [Scilit]
- MCCRORY, J.L.; YOUNG, M.J.; BOULTON, A.J.M.; et al. Arch index as a predictor of arch height. The Foot 1997, 7, 79. [Google Scholar] [CrossRef] [Scilit]
- NIGG, B.M.; NURSE, M.A.; STEFANYSHYN, D. Shoe inserts and orthotics for sport and physical activities. Med Sci Sports Exerc 1999, 31, S421. [Google Scholar] [CrossRef] [Scilit] [PubMed]
- SAMMARCO GJ: Rehabilitation of the Foot and Ankle; Mosby-Year Book Inc: St. Louis, 1995.
- WU, K.K. Foot Orthoses: Principles and Clinical Appli-cations; Williams & Wilkins: Baltimore, 1990. [Google Scholar]
- GROSS, M.L.; DAVLIN, L.B.; EVANSKI, P.M. Effectiveness of or-thotic shoe inserts in the long-distance runner. Am J Sports Med 1991, 19, 409. [Google Scholar] [CrossRef] [Scilit] [PubMed]
- JAMES, S.L.; JONES, D.C. Biomechanical Aspects of Distance Running Injuries. In Biomechanics of Distance Running; Cavanagh, P.R., Ed.; Human Kinetics: Champaign, IL, 1990; p. 249. [Google Scholar]
- SAXENA A, HADDAD J: The effect of foot orthoses on patellofemoral pain syndrome. The Lower Extremity 1998, 5, 95.
- KOGLER, G.F.; SOLOMONIDIS, S.E.; PAUL, J.P. Biomechanics of longitudinal arch support mechanisms in foot orthoses and their effect on plantar aponeurosis strain. Clin Bio-mech 1996, 11, 243. [Google Scholar] [CrossRef] [Scilit]
- URRY, S.R.; WEARING, S.C. A comparison of footprint in-dexes calculated from ink and electronic footprints. JAPMA 2001, 91, 203. [Google Scholar] [CrossRef] [Scilit]
- HAWES, M.R.; NACHBAUER, W.; SOVAK, D.; et al. Footprint parameters as a measure of arch height. Foot Ankle 1992, 13, 22. [Google Scholar] [CrossRef] [Scilit]
- STAHELI, L.T.; CHEW, D.E.; CORBETT, M. The longitudinal arch: a survey of eight hundred and eighty-two feet in nor-mal children and adults. J Bone Joint Surg Am 1987, 69, 426. [Google Scholar] [PubMed]
- FORRIOL F, PASCAUL J: Footprint analysis between three and seventeen years of age. Foot Ankle 1990, 11, 101. [CrossRef] [Scilit]
- Britten, L.; Thompson, R.H.; Schwartz, L.R. Studies in Physical Development and Posture; US Government Print-ing Office, Washington, DC, 1928; Volume US Public Health Bulletin No. 179. [Google Scholar]
- IRWIN LW: A study of the tendency of school children to develop flat-footness. Res Q 1937, 8, 46.
- JUNG K: Women in long distance running. Ann Sports Med 1982, 1, 17.
- SONG, J.; HILLSTROM, H.J.; SECORD, D.; et al. Foot type biomechanics: comparison of planus and rectus foot types. JAPMA 1996, 86, 16. [Google Scholar] [CrossRef] [Scilit]
- REDMOND, A.C.; CROSBIE, J.; OUVRIER, R.A. Development and validation of a novel rating system for scoring foot pos-ture: the Foot Posture Index. Clin Biomech 2001, 21, 89. [Google Scholar] [CrossRef] [Scilit] [PubMed]
- NIGG, B.M.; COLE, G.K.; NACHBAUER, W. Effects of arch height of the foot on angular motion of the lower extremities in running. J Biomech 1993, 26, 909. [Google Scholar] [CrossRef] [Scilit] [PubMed]
- BRODY DM: Techniques in the evaluation and treatment of the injured runner. Orthop Clin North Am 1982, 13, 541. [CrossRef] [Scilit]
- VINICOMBE A, RASPOVIC A, MENZ HB: Reliability of navic-ular displacement measurement as a clinical indicator of foot posture. JAPMA 2001, 91, 262. [CrossRef] [Scilit]
- MENZ HB: Alternative techniques for the clinical assess-ment of foot pronation. JAPMA 1998, 88, 119. [CrossRef] [Scilit]
- SIMKIN, A.; LEICHTER, I.; GILADI, M.; et al. Combined effect of foot arch structure and an orthotic device on stress fractures. Foot Ankle 1989, 10, 25. [Google Scholar] [CrossRef] [Scilit]
- NORKIN, C.C. LEVANGIE PK: Joint Structure and Function; FA Davis: Philadelphia, 1983. [Google Scholar]
- JONSON, S.R.; GROSS, M.T. Intraexaminer reliability, interex-aminer reliability and mean values for nine lower ex-tremity skeletal measures in healthy naval shipmen. J Orthop Sports Phys Ther 1997, 25, 253. [Google Scholar] [CrossRef] [Scilit]
- SMITH, L.S.; CLARKE, T.E.; HAMILL, C.L.; et al. The effects of soft and semi-rigid orthoses upon rearfoot movement in running. JAPMA 1986, 76, 227. [Google Scholar] [CrossRef] [Scilit] [PubMed]
- FREYCHAT, P.; BELLI, A.; CARRET, J.P.; et al. Relationship between rearfoot and forefoot orientation and ground re-action forces during running. Med Sci Sports Exer 1996, 28, 225. [Google Scholar] [CrossRef] [Scilit]
- TWOMEY D: Performance differences between normal and low arched feet in 9-12 year old children [PhD the-sis] School of Safety Science, University of New South Wales; Sydney, Australia, 2006.
- BUTLER, R.J.; HILLSTROM, H.; SONG, J.; et al. Arch height index measurement system: establishment of reliability and normative values. JAPMA 2008, 98, 102. [Google Scholar] [CrossRef] [Scilit]
- WEINER-OGILVIE, S. ROME K: The reliability of three tech-niques for measuring foot position. JAPMA 1998, 88, 381. [Google Scholar] [CrossRef] [Scilit]
- WILLIAM, J.F.; MORRISON, W.R. A Textbook in Physical Ed-ucation; WB Saunders Co: Philadelphia, 1931. [Google Scholar]
- PHELPS, W.M.; KIPHUTH, RJH. The Diagnosis and Treatment of Postural Defects; CC Thomas: Springfield, IL, 1932. [Google Scholar]
- COBEY, J.C.; SELLA, E. Standardizing methods of measure-ment of foot shape by including the effects of subtalar rotation. Foot Ankle 1981, 2, 30. [Google Scholar] [CrossRef] [Scilit] [PubMed]
- WEARING, S.C.; HILLS, A.P.; BYRNE, N.M.; et al. The arch index: a measure of flat or fat feet? Foot Ankle Int 2004, 25, 575. [Google Scholar] [CrossRef] [Scilit] [PubMed]
- RAZEGHI M, BATT ME: Foot type classification: a critical review of current methods. Gait Posture 2002, 15, 282. [CrossRef] [Scilit]
- BILLIS, E.; KATSAKIORI, E.; KAPODISTRIAS, C.; et al. Assessment of foot posture: correlation between different clin-ical techniques. The Foot 2007, 17, 65. [Google Scholar] [CrossRef] [Scilit]
- BUTLER, R.J.; DAVIS, I.S.; HAMILL, J. Interaction of arch type and footwear on running mechanics. Am J Sports Med 34, 1998, 2006. [CrossRef] [Scilit] [PubMed]
- XIONG, S.; GOONETILLEKE, R.S.; WITANA, C.P.; et al. Modeling foot height and foot shape related dimensions. Er-gonomics 2008, 51, 1272. [Google Scholar]
- PERRY J: Gait Analysis: Normal and Pathological Func-tion; Slack Inc: New York, 1994.
- TEKSCAN INC: F-Scan Pressure Assessment System: User’s Manual, Version 5.0. Tekscan Inc: South Boston, 2001.
- VORUM RESEARCH CORP: User Manual of Canfit-PlusTM YETITM Foot Scanner; Vorum Research Corp: Vancou-ver, British Columbia, Canada, 2000.
- Goonetilleke, C.P.; Weerasinghe, R.S.; Witana, T.W. Malleolar Valgus Index From 3D Scans; Hong Kong Univer-sity of Science and Technology: Hong Kong, 2008. [Google Scholar]
- SHROUT, P.E.; FLEISS, J.L. Intraclass correlations: use in as-sessing operator reliability. Psychol Bull 1979, 86, 420. [Google Scholar] [CrossRef]
- Anderson, J.F.; Tatham, R.E.; Hair, R.L. Multivariate Data Analysis; Prentice Hall: Upper Saddle River, NJ, 1998. [Google Scholar]
- RAO, U.B. JOSEPH B: The influence of footwear on the prevalence of flat foot: a survey of 2300 children. J Bone Joint Surg Br 1992, 74, 525. [Google Scholar] [CrossRef] [Scilit] [PubMed]
- HE, M.; TAN, K.C.; LI, E.T.; et al. Body fat determination by dual energy x-ray absorptiometry and its relation to body mass index and waist circumference in Hong Kong Chinese. Int J Obes Relat Metab Disord 2001, 25, 748. [Google Scholar] [CrossRef] [Scilit]
- WITANA, C.P.; GOONETILLEKE, R.S.; AU, E.Y.; et al. Footbed shapes for enhanced footwear comfort. Ergonomics 2009, 52, 617. [Google Scholar] [CrossRef] [Scilit] [PubMed]
- MATHIESON, I.; UPTON, D.; BIRCHENOUGH, A. Comparison of footprint parameters calculated from static and dynamic footprints. The Foot 1999, 9, 145. [Google Scholar] [CrossRef] [Scilit]

© 2010 American Podiatric Medical Association