


Abstract
This paper examines whether the adoption of Supervisory Technology (SupTech) is associated with a reduction in greenwashing in the European banking sector over the period 2014–2025. Using a progressive empirical framework combining the Synthetic Control Method (SCM), a split-sample SCM, an OLS regression of the SCM-estimated treatment effect, and a Causal Random Forest (CRL) via T-Learner applied to a panel of European banks, we provide evidence consistent with a meaningful reduction in greenwashing associated with SupTech adoption, which is robust across multiple identification and validation strategies. The split-sample SCM and OLS analyses reveal that this effect is amplified by higher capital adequacy, genuine ESG engagement, and stricter regulatory environments, while larger banks exhibit a systematically attenuated response. Contrary to the complementarity hypothesis, RegTech does not reinforce SupTech’s disciplining effect; instead, the evidence points to a substitution mechanism whereby banks with developed internal compliance infrastructure derive limited marginal benefit from external supervisory technology. The Causal Random Forest analysis provides evidence of a statistically significant and stable average treatment effect and indicates that bank digital maturity and FinTech adoption are the most consistent drivers of SupTech’s effectiveness. Policy simulations show that improving digital maturity, rather than RegTech endowment, yields the largest additional greenwashing-reduction gains. These findings suggest that SupTech acts as a credibilization mechanism whose effectiveness depends on the stringency of the external regulatory architecture and the digital absorptive capacity of supervised institutions. External validity to less harmonized regulatory environments remains an open empirical question.
1. Introduction
The governance of financial supervision has undergone a profound technological reconfiguration in recent years. FinTech reshaped financial intermediation (Arner et al., 2017; Bao & Huang, 2021), RegTech automated regulatory compliance (Charoenwong et al., 2024), and supervisory authorities have now entered a third paradigm: Supervisory Technology (SupTech). Defined as the application of artificial intelligence, machine learning, and big data analytics by supervisory authorities to enhance monitoring and regulatory effectiveness (Bank for International Settlements, 2023; Broeders & Prenio, 2018), SupTech represents a structural reconfiguration of regulatory governance from reactive, document-based control toward proactive, data-driven oversight.
This transformation is particularly pronounced in the European context, where the ECB, EBA, and Banking Union (European Banking Authority, 2024; European Central Bank, 2023) subject banks to dual institutional pressure: stringent prudential requirements and growing ESG expectations anchored by the SFDR (2019), CSRD (2022), and EU Taxonomy Regulation (European Union, 2019; Regulation, 2020).
Yet this regulatory architecture has given rise to a paradox. The EBA’s 2025 Progress Report documents a marked increase in misleading sustainability claims (European Banking Authority, 2025), while ECB climate stress tests reveal persistent gaps between stated net-zero commitments and actual exposures (European Central Bank, 2022). Greenwashing the systematic discrepancy between disclosed sustainability commitments and actual performance (Delmas & Burbano, 2011; Lyon & Montgomery, 2015) takes subtle forms including selective ESG disclosure and symbolic sustainability adoption (Birindelli et al., 2024). ESG rating divergence (correlations of 0.3–0.6 across agencies (Berg et al., 2022)) further exacerbates this opacity (Dimson et al., 2020).
SupTech, augmented by AI, provides supervisory authorities with enhanced capabilities to detect ESG inconsistencies (Degryse et al., 2025; Frost et al., 2019). When detection probability rises, the expected cost of misleading disclosure increases, potentially disciplining banks toward genuine sustainability alignment. Recent EBA initiatives to deploy SupTech for greenwashing monitoring reinforce this view (European Banking Authority, 2024, 2025).
Despite this momentum, the academic literature remains limited on three dimensions: (1) no causal inference study has examined the SupTech–greenwashing relationship; (2) the contribution of AI to predictive supervision remains undertheorized (European Central Bank, 2023); and (3) the conditions under which SupTech is more or less effective—notably, the role of bank-level digital maturity and RegTech—have not been systematically examined (Giannetti et al., 2023; Moodaley & Telukdarie, 2023).
This paper addresses these gaps by examining whether SupTech adoption is associated with reduced greenwashing in European banking (2014–2025), using the Synthetic Control Method (SCM) for average causal identification and a Causal Random Forest (CRL) via T-Learner for heterogeneous effects. Three hypotheses are examined: H1 (SupTech reduces greenwashing), H2 (RegTech moderates via complementarity or substitution), and H3 (digital maturity shapes SupTech effectiveness, which is consistent with dynamic capabilities theory (Teece et al., 1997)).
2. Theoretical Literature Review and Hypotheses
2.1. The Impact of SupTech Adoption on Banking Greenwashing
The digital transformation of financial systems has given rise to Supervisory Technology (SupTech) as a distinct field of regulatory innovation. SupTech refers to the application of machine learning, big data analytics, natural language processing, and cloud computing by supervisory authorities to enhance regulatory oversight (Bank for International Settlements, 2023; Broeders & Prenio, 2018). Unlike RegTech, which focuses on compliance within financial institutions, SupTech targets supervisory authorities themselves, enabling a transition from ex-post, document-based control toward real-time, predictive oversight (Bank for International Settlements, 2020; Buckley et al., 2020).
Greenwashing in banking refers to overstating or misrepresenting environmental commitments to create a misleading impression of sustainability (Delmas & Burbano, 2011; Lyon & Montgomery, 2015). From an agency theory perspective (Jensen & Meckling, 2019), it arises from information asymmetry between bank managers and stakeholders, creating conditions favorable to opportunistic disclosure. Legitimacy theory (Suchman, 1995) further explains the strategic logic: banks engage in symbolic ESG actions to gain institutional legitimacy when the costs of genuine transformation are high and detection probability is low (DiMaggio & Burbano, 1983). The EBA’s 2025 Progress Report documents a marked increase in greenwashing incidents (European Banking Authority, 2025), while ECB climate stress tests reveal persistent gaps between stated net-zero commitments and actual carbon exposures (European Central Bank, 2022).
A key methodological caveat is the well-documented divergence in ESG measurement across providers (correlations of 0.3–0.6, Berg et al. (2022); Dimson et al. (2020)), which extends to greenwashing proxies themselves (Sneideriene & Legenzova, 2025). The proxy used in this paper, the gap between min–max normalized ESG disclosure and performance scores, captures one meaningful dimension of the disclosure-performance discrepancy, but it should be interpreted as one operationalization among several coexisting approaches in the literature.
AI-based supervisory tools provide authorities with enhanced capabilities to detect ESG inconsistencies (Frost et al., 2019; Giannetti et al., 2023). Advanced analytics and automated text mining allow supervisors to compare disclosures with actual exposures at scale, increasing the reputational and regulatory costs of greenwashing and strengthening the credibility of sustainability commitments (European Banking Authority, 2025; European Securities and Markets Authority, 2023). Degryse et al. provide the first causal evidence that SupTech disciplines bank behavior (Degryse et al., 2025), while the EBA (2025) explicitly identifies AI-based tools as a core pillar of its greenwashing monitoring strategy (European Banking Authority, 2025).
It should nonetheless be acknowledged that supervisory technology may primarily strengthen detection without necessarily reducing prevalence, particularly when enforcement mechanisms remain weak (Anagnostopoulos, 2018; Bank for International Settlements, 2023). Furthermore, SupTech’s disciplining effect is unlikely to be uniform across institutions, depending on complementary conditions such as RegTech infrastructure and digital maturity motivating the moderating analyses in Section 2.2 and Section 2.3. Recent bibliometric evidence confirms the rapid expansion of greenwashing research at the intersection of ESG disclosure and supervisory technology (Cinceoglu et al., 2026; Hu et al., 2025), underscoring the timeliness of this paper.
Taken together, agency theory and legitimacy theory explain the incentive structure underlying greenwashing, while the moderating perspectives in the following sections capture institutional conditions shaping SupTech’s effectiveness. This leads to the following hypothesis:
H1.
The adoption of supervisory technologies (SupTech) is associated with a significant reduction in the risk of greenwashing in the banking sector.
2.2. The Moderating Role of RegTech
RegTech refers to the technological tools that banks use to automate and report their own compliance (Bank for International Settlements, 2020; Buckley et al., 2020). While SupTech reflects the technological capacity of the supervisor, RegTech reflects that of the supervised institution. The Basel Committee and FSB suggest these are complementary: data standards developed for RegTech facilitate SupTech applications, creating a reinforcing loop between institutions and supervisors (Bank for International Settlements, 2023; Degryse et al., 2025; Financial Stability Board, 2020).
Institutional theory (DiMaggio & Burbano, 1983) explains this complementarity: the coercive pressure of AI-enhanced supervision is more effectively absorbed when banks possess the internal RegTech infrastructure to anticipate and align with supervisory data requirements. Banks with stronger RegTech capabilities are better equipped to reduce the scope for decoupling between ESG commitments and actual practices (Benaissa et al., 2025; European Banking Authority, 2021).
It should nonetheless be acknowledged that the moderating role of RegTech is not unambiguous. Banks may deploy RegTech primarily as a compliance signal rather than a substantive governance mechanism, particularly when adoption is driven by mimetic pressures (Lyon & Montgomery, 2015; Marquis et al., 2016). Under such conditions, RegTech adoption could coexist with persistent greenwashing, weakening rather than reinforcing SupTech’s effect. This tension between complementarity and substitution motivates an explicit empirical test rather than an a priori assumption.
On balance, the weight of institutional and empirical evidence supports a reinforcing relationship, motivating the following hypothesis, while acknowledging that the substitution alternative remains an empirically plausible outcome (Benaissa et al., 2025):
H2.
RegTech positively moderates the effect of SupTech on banking greenwashing such that the greenwashing-reduction effect of SupTech is stronger for banks with higher RegTech adoption.
2.3. The Moderating Role of Bank Digital Maturity
SupTech adoption can be understood through the lens of dynamic capabilities theory (Teece et al., 1997), which emphasizes the ability of organizations to adapt, reconfigure, and build new competencies in response to technological change and environmental uncertainty. While this framework has primarily been applied to supervisory authorities themselves, its logic extends naturally to the supervised institutions: the ability of a bank to benefit from external technological and institutional change depends fundamentally on its own capacity to sense, seize, and reconfigure internal resources in response to that change.
Applied to the bank–supervisor relationship, dynamic capabilities theory implies that the disciplining effect of SupTech on greenwashing should not be expected to operate uniformly across banks but rather to depend on each institution’s own digital maturity, which is understood as its accumulated capacity to integrate data-driven processes, digital infrastructure, and analytics-based decision making into its operations. Banks with higher digital maturity are theoretically better positioned to interpret, anticipate, and respond to the heightened scrutiny associated with AI-enhanced supervision, allowing them to more effectively align actual sustainability practices with disclosed commitments.
Less digitally mature banks, by contrast, may lack the absorptive capacity required to translate external supervisory pressure into a genuine reduction of the gap between ESG communication and underlying practice even when exposed to the same intensity of SupTech-based oversight (Bank for International Settlements, 2023; Teece et al., 1997).
It should nonetheless be acknowledged that the relationship between digital maturity and greenwashing reduction is not necessarily linear or unconditionally positive. Some studies caution that highly digitally mature banks, precisely because they possess sophisticated data and reporting infrastructures, may be better equipped to engage in more elaborate forms of selective or strategic ESG disclosure, using their technological capabilities to optimize the presentation of favorable indicators rather than to genuinely close the gap between commitments and practice (Lyon & Montgomery, 2015; Schons & Steinmeier, 2016). This alternative reading suggests that digital maturity could, under certain institutional conditions, attenuate rather than reinforce the disciplining effect of SupTech, which underscores the importance of treating its moderating role as an open empirical question rather than a presupposed outcome. The digital maturity index (DMS) captures both the supervisory digital environment and the bank’s own institutional capacity to respond to it. Specifically, it combines three components: regulatory digital initiatives at the jurisdiction level, which reflect the technological sophistication of the supervisory environment; SupTech experimentation intensity, which proxies the intensity of AI-based oversight faced by the bank; and institutional capacity at the bank level, which captures the bank’s organizational readiness to absorb and respond to external supervisory pressure. This composite measure is consistent with the dynamic capabilities framework (Teece et al., 1997), which emphasizes that absorptive capacity operates at the intersection of organizational readiness and environmental pressure rather than in isolation from it.
This asymmetric absorptive capacity across banks suggests that bank-level digital maturity acts as a critical boundary condition shaping the magnitude of SupTech’s effect on greenwashing, leading to the following hypothesis:
H3.
Bank digital maturity (DMS) positively moderates the effect of SupTech on banking greenwashing such that the greenwashing-reduction effect of SupTech is stronger for banks with higher digital maturity.
3. Research Design
3.1. Data and Sample Description
This paper relies on a balanced panel dataset of 90 European banks over 2014–2025 (1080 bank-year observations). Non-European banks serve exclusively as donor units in the SCM estimation; UK banks are retained as they operated under European supervisory frameworks throughout 2014–2020 and remain subject to equivalent ESG disclosure requirements under the UK SDR (Abadie et al., 2010; European Banking Authority, 2025).
Greenwashing (GW) is operationalized as the difference between a bank’s ESG disclosure score and its ESG performance score, which are both min–max normalized on a 0–100 scale (Peng & Xie, 2024; Yu et al., 2020). The resulting variable has a mean of 17.9 and SD of 2.4, reflecting the systematic tendency of European banks to achieve higher disclosure than performance scores (Galletta et al., 2024). This proxy is widely used in the greenwashing literature (Schons & Steinmeier, 2016) and constructed from a single consistent data source, mitigating inter-agency divergence (Berg et al., 2022). It captures one specific dimension of greenwashing the disclosure–performance gap—and it does not encompass other manifestations such as misleading marketing claims or vague sustainability terminology (Lyon & Montgomery, 2015).
SupTech is proxied by an index constructed from three official sources: the BIS FSI SupTech survey (BIS Financial Stability Institute, 2024), EBA annual work programs (European Banking Authority, 2024), and national central bank reports. For each country-year, the index records the number of AI-driven supervisory projects implemented by the national authority, which are normalized by the number of supervised institutions and weighted by bank size. Only projects documented in at least two sources are retained to mitigate measurement error. The index ranges from 0.050 to 0.310 (mean = 0.173, SD = 0.056).
Digital maturity (DMS) combines jurisdiction-level regulatory digital initiatives, SupTech experimentation intensity, and bank-level institutional capacity. While the first two components vary at the jurisdiction-year level, the bank-level component generates within-jurisdiction heterogeneity (within-jurisdiction SD ≈ 45% of total variation), confirming that DMS captures genuine bank-level heterogeneity beyond the treatment variable (Charoenwong et al., 2024; Teece et al., 1997). RegTech is measured as the ratio of IT compliance expenditures to total IT expenditures (Charoenwong et al., 2024).
Control variables include the following: capital adequacy (CAR), return on assets (ROA), bank size (ln total assets), ESG score, a FinTech index constructed via the Dynamic Factor Model (Stock & Watson, 2002), and a regulatory intensity indicator capturing post-implementation periods of SFDR and CSRD (Charoenwong et al., 2024; European Banking Authority, 2021).
All continuous variables are winsorized at the 1st–99th percentiles for descriptive statistics and regression analyses (Galletta et al., 2024). The SCM is estimated on pre-winsorized data, which is consistent with the methodological requirement that donor weights replicate the exact pre-treatment trajectory in levels (Abadie, 2021; Abadie et al., 2010). The robustness of SCM results to extreme observations is confirmed by the leave-one-out analysis in Section 5.3 (Ben-Michael et al., 2022).
All variables used in this paper are summarized in Table 1.
Table 1.
Summary of variables.
3.2. Summary Statistics
Table 2 presents the descriptive statistics of the variables used in this paper (1080 bank-year observations). Greenwashing (GW) averages 17.912 with a standard deviation of 2.439, indicating moderate variation across banks. The SupTech adoption index averages 0.173 (std. dev. = 0.056, range 0.050–0.310), reflecting broadly comparable but not negligible cross-jurisdictional exposure to AI-driven supervision. Among the moderating variables, digital maturity (DMS) averages 0.524 (std. dev. = 0.128), and RegTech averages 0.202 (std. dev. = 0.061), both showing moderate and roughly homogeneous dispersion across the sample. Among the control variables, bank size (SIZE) averages 18.331 with no missing observations; the ESG score averages 61.056 with considerable dispersion (std. dev. = 18.110); ROA is highly variable (std. dev. = 9.910); and CAR shows the highest dispersion relative to its mean, which is consistent with most banks clustering near regulatory minimums alongside a few highly capitalized outliers. FIN and REG display moderate, comparable dispersion, which is consistent with the gradual and uneven diffusion of financial technology and regulatory stringency across European banks.
Table 2.
Descriptive statistics of the variables.
Table 3 reports the Pearson correlation matrix of the main variables used in this paper. The results reveal moderate relationships between digitalization variables, regulatory technologies, and greenwashing practices. All correlations are computed on winsorized data (1st–99th percentiles), which is consistent with the descriptive statistics reported in Table 2. The SCM estimation uses pre-winsorized data; the near-zero correlation between GW and SupTech in the winsorized sample therefore does not contradict the larger effect identified by the SCM, which operates on the full distribution of the outcome variable (Abadie et al., 2010). The main explanatory variable, SupTech, is positively correlated with DMS (0.634), RegTech (0.507), and Fintech (0.285), indicating that higher levels of digital supervision are associated with stronger technological integration within banks. The relatively high correlation between SupTech and DMS (0.634) reflects the expected co-movement between supervisory technology deployment and the digital maturity of the supervisory environment, which both tend to be higher in jurisdictions with more advanced regulatory infrastructure. However, three elements confirm that this correlation does not create a mechanical relationship that would invalidate the heterogeneity analysis.
Table 3.
Pearson correlation matrix.
First, the bank-level institutional capacity component of DMS generates meaningful within-jurisdiction variation: the within-jurisdiction standard deviation of DMS represents approximately 45% of its total cross-sectional variation, confirming that DMS captures genuine bank-level heterogeneity beyond the supervisory environment. Two banks in the same jurisdiction and therefore with the same SupTech exposure can have substantially different DMS values depending on their own organizational digital readiness.
Second, the Variance Inflation Factors are well below the conventional threshold of 10 for all variables: SupTech VIF = 3.28, DMS VIF = 2.41, confirming that multicollinearity does not distort the coefficient estimates in the OLS regression.
Third, the CRL framework conditions on all covariates jointly and non-parametrically, allowing it to separate the marginal contribution of DMS from that of SupTech without imposing functional form assumptions on their interaction (Athey et al., 2019; Wager & Athey, 2018). The CATE estimates therefore reflect genuine heterogeneity in SupTech effectiveness across DMS levels rather than a mechanical correlation between the two variables. Regarding the dependent variable, greenwashing is negatively correlated with SupTech (−0.089), DMS (−0.086), and RegTech (−0.041), suggesting that supervisory and regulatory technologies may contribute to reducing greenwashing practices. Furthermore, the results indicate a positive correlation between ESG performance and Fintech adoption (0.237) as well as between ESG performance and bank size (0.099). Finally, the majority of the correlation coefficients remain below the conventional threshold of 0.80, indicating that multicollinearity does not represent a major concern for subsequent econometric estimations.
4. Methodology
4.1. Synthetic Control Method (SCM)
Identifying the estimated impact of SupTech adoption on greenwashing requires a credible counterfactual in the presence of cross-unit heterogeneity. The Synthetic Control Method (SCM) (Abadie, 2021; Abadie et al., 2010) constructs this counterfactual as an optimally weighted combination of control units that replicates the pre-treatment trajectory of the treated unit.
Formally, for a treated unit exposed to treatment at , the causal effect is
Since is unobserved post-treatment, the synthetic counterfactual is
where optimal weights minimize the pre-treatment discrepancy subject to and (Abadie et al., 2010). The estimated treatment effect is
Unlike difference-in-differences, the SCM does not require parallel trends; it requires only that the synthetic control replicates the pre-treatment trajectory, which is a condition directly verifiable from the data. It also operates on levels without requiring stationarity, as post-treatment deviations reflect the treatment effect rather than pre-existing dynamics (Ben-Michael et al., 2022). The near-perfect pre-treatment fit () confirms that the synthetic control captures the full pre-treatment trajectory of the treated group. Panel unit root tests in Table 4 are therefore presented as a diagnostic for the OLS regression of the SCM GAP only; they are not a prerequisite for the SCM itself. The SCM is estimated on pre-winsorized data, which is consistent with the methodological requirement that donor weights replicate the exact pre-treatment trajectory in levels (Abadie, 2021; Abadie et al., 2010).
Table 4.
Panel unit root tests: CIPS and CADF (Pesaran, 2007).
4.2. Causal Random Forest (CRL) via T-Learner
While the SCM identifies the average treatment effect, it cannot capture nonlinear heterogeneity. We complement it with a Causal Random Forest (CRL) via T-Learner (Athey et al., 2019; Wager & Athey, 2018). The T-Learner partitions the sample into treated () and control () subsamples using the binary treatment indicator, estimating separate Random Forest models on each subsample. The continuous SupTech score enters as a covariate, allowing the CATE to vary continuously with SupTech intensity.
Formally, let and denote the Random Forest estimators for treated and control subsamples. The Conditional Average Treatment Effect (CATE) is
where includes SupTech, DMS, RegTech, ESG, FinTech, CAR, ROA, SIZE, and REG. Under the conditional independence assumption , the CATE is causally identified, and its heterogeneity reflects genuine variation in institutional capacity to respond to SupTech supervision. The Average Treatment Effect (ATE) is
Statistical inference uses bootstrap resampling (100 iterations) for ATE confidence intervals (Athey et al., 2019). CATE stability is assessed through five-fold cross-validation, variable importance analysis, and tertile-level heterogeneity analysis.
4.3. Model Specification and Variable Measurements
To empirically assess the estimated impact of SupTech adoption on banking greenwashing and the moderating roles of bank digital maturity and RegTech, we employ two complementary specifications. The first model (M1) is the Synthetic Control Method (SCM), which identifies the direct causal estimated effect of SupTech supervision on greenwashing by constructing a counterfactual trajectory for the treated group. The second model (M2) is the Causal Random Forest (CRL), which complements the SCM by estimating treatment effect heterogeneity non-parametrically as a function of bank-level covariates without imposing any functional form.
The first model (M1) constructs a synthetic counterfactual for the treated group by optimally weighting donor banks. Banks whose SupTech adoption index equals or exceeds the sample median are assigned to the treated group (Treatment = 1), while the remaining banks form the donor pool (Treatment = 0) with the treatment year fixed at 2019 for all treated banks (Bank for International Settlements, 2023; European Banking Authority, 2021). The optimal weights are obtained by solving
where denotes the set of pre-treatment periods and J is the number of donor banks in the control group. The counterfactual greenwashing level for the treated unit at time t is
The estimated effect of SupTech adoption on greenwashing the SCM GAP is estimated for each post-treatment period as
where a negative indicates that SupTech is associated with a reduction in greenwashing relative to the counterfactual. The average post-treatment causal effect is
To test the moderating effects, a split-sample SCM is implemented. For each moderating variable , treated banks are partitioned into two subgroups based on the sample median :
A separate synthetic control is estimated for each subgroup , yielding subgroup-specific average post-treatment GAPs and . The moderating effect of M on the SupTech–greenwashing relationship is then identified as
A negative indicates that the greenwashing-reduction effect of SupTech is stronger for banks with higher M. Inference is conducted via permutation-based placebo tests in space and in time (Abadie et al., 2010). The overall causal structure underlying this identification strategy—linking SupTech adoption, the two moderators, and banking greenwashing—is summarized in the directed acyclic graph (DAG) presented in Figure 1.
Figure 1.
SupTech–Greenwashing Causal framework: DAG.
The second model (M2) is the Causal Random Forest (CRL), which estimates the Conditional Average Treatment Effect (CATE) at the bank level as a function of institutional covariates:
where and denote the potential greenwashing outcomes of bank i at time t under SupTech treatment and control, respectively, and is the bank-specific CATE estimated via the T-Learner approach using two separate Random Forest models fitted on the treated and control subsamples.
In these models, represents the greenwashing level of bank i at time t, which is measured as the discrepancy between standardized ESG disclosure scores and standardized ESG performance scores (Peng & Xie, 2024; Schons & Steinmeier, 2016; Yu et al., 2020). is the SupTech adoption index proxying the intensity of AI-driven supervisory projects implemented by financial authorities (BIS Financial Stability Institute, 2024; European Banking Authority, 2021). captures bank digital maturity, reflecting the accumulated capacity of the institution to integrate data-driven processes and digital infrastructure. measures the regulatory technology infrastructure deployed by the bank itself, reflecting its internal compliance digitalization capacity. denotes the bank’s engagement in environmental, social, and governance practices (Galletta et al., 2024). is a Fintech adoption index constructed to measure the degree of financial technology deployment by the bank. is the capital adequacy ratio, measuring financial soundness. proxies financial performance. is the natural logarithm of total assets, capturing structural and institutional differences across banks. is a regulatory intensity indicator reflecting post-implementation periods of major European regulations such as SFDR and CSRD (Charoenwong et al., 2024; European Banking Authority, 2021).
5. Results and Discussion
5.1. Panel Approach with SCM and Causal Random Forest: SupTech–Greenwashing Analysis
5.1.1. Preliminary Diagnostic Tests
To examine the impact of SupTech on mitigating greenwashing while considering moderating factors such as the regulatory technology and bank digital maturity, a set of preliminary diagnostic tests is necessary. These tests, including panel unit root analyses (CIPS and CADF) and multicollinearity checks (VIF), ensure the reliability of the dataset, validate the empirical model specification, and confirm the robustness and stability of the estimated results. According to (Table 4), all variables are integrated in order I(0) or I(1), which justifies the stationarity of all variables in this paper.
According to (Table 5), all VIF values remain below the critical threshold of 10, which confirms the absence of severe multicollinearity between all variables included in the model (Hair et al., 2019).
Table 5.
Variance inflation factor (VIF).
5.1.2. Synthetic Control Method (SCM)
Treatment Construction. The SupTech adoption index varies primarily at the jurisdiction-year level, reflecting the supervisory technology capacity of national financial authorities rather than a bank-specific policy intervention. This is an important design feature: the study estimates the effect of operating under a high-SupTech supervisory jurisdiction, rather than a bank-specific treatment. This design is analogous to studies that use jurisdiction-level regulatory changes as treatments affecting all banks within a jurisdiction (Abadie, 2021; Charoenwong et al., 2024).
To make this jurisdiction-level exposure compatible with the Synthetic Control Method, we convert the continuous index into a binary treatment variable using the sample median as threshold. Banks whose average SupTech score over the pre-treatment period (2014–2018) equals or exceeds the sample median are assigned Treatment ; banks below the threshold are assigned Treatment . Treatment assignment is therefore based exclusively on pre-treatment information, ensuring that no post-treatment variation in SupTech exposure influences group membership (Abadie et al., 2010).
Within each jurisdiction, bank-level variation in SupTech exposure is generated by weighting the jurisdiction-level index by bank size (natural logarithm of total assets), following previous analyses (Charoenwong et al., 2024). Larger banks tend to receive more intensive supervisory scrutiny from their national authority, generating meaningful within-jurisdiction heterogeneity in effective SupTech exposure. This weighting does not transform the jurisdiction-level policy into a bank-level treatment; rather, it captures differential exposure within the same supervisory environment. All inference is therefore conducted at the jurisdiction level: standard errors are clustered across 18 European jurisdictions throughout all regression analyses, which is consistent with the level at which treatment exposure primarily varies (Abadie et al., 2010; Ben-Michael et al., 2022).
The SCM aggregates all treated banks into a single treated trajectory, which is the appropriate unit of analysis when treatment varies at the jurisdiction level (Abadie, 2021). The median threshold is justified on three grounds: (1) robust to outliers for composite scores; (2) produces approximately equal group sizes (50 treated, 40 control); (3) consistent with recent empirical studies using binary treatment indicators from composite technology scores (Galletta et al., 2024). Sensitivity analyses at the 40th and 60th percentiles confirm robustness to the specific threshold choice. The sample median of the SupTech adoption index is . Treatment status is determined exclusively by the bank’s average SupTech score over the full pre-treatment period (2014–2018), ensuring that no post-treatment information is incorporated in the construction of the treatment variable. This time-invariant assignment rule guarantees that the binary treatment indicator is predetermined with respect to the outcome variable and is therefore free from look-ahead bias (Abadie et al., 2010; Imbens & Rubin, 2015). The treatment year is set at 2019, corresponding to the structural intensification of AI-driven supervisory initiatives in the European banking sector (Bank for International Settlements, 2023; European Banking Authority, 2021). The pre-treatment period spans 2014–2018 (five years) and the post-treatment period spans 2019–2025 (seven years). Table 6 summarizes the treatment assignment. This aggregation of multiple treated units into a single treated trajectory follows the multiple treated units extension of the SCM (Abadie, 2021; Ben-Michael et al., 2022). Two identification assumptions underlying this design are noted. First, the no-interference assumption requires that the greenwashing behavior of treated banks is not directly influenced by that of other treated banks; aggregating across 50 institutions is likely to attenuate idiosyncratic spillovers at the individual level, preserving the validity of the aggregate comparison (Abadie, 2021). Second, the near-perfect pre-treatment fit () reported in Table 7 provides empirical evidence that the donor pool is sufficiently rich to approximate the treated unit’s trajectory, satisfying the operational criterion for the convex hull condition (Abadie et al., 2010). While the SupTech adoption index varies at the jurisdiction-year level, reflecting the supervisory technology capacity of national financial authorities, its bank-level assignment is weighted by the bank size within each jurisdiction, following the approach of (Charoenwong et al., 2024). This weighting procedure generates meaningful bank-level variation in SupTech exposure even within the same jurisdiction, as larger banks tend to receive more intensive supervisory scrutiny from their national authority. Standard errors are clustered at the jurisdiction level throughout all regression analyses to account for the within-country correlation of treatment exposure (Abadie et al., 2010; Ben-Michael et al., 2022). The sample covers 18 European jurisdictions, which constitutes the effective number of independent treatment clusters; given this relatively small number, cluster-robust standard errors should be interpreted with appropriate caution (Abadie et al., 2010).
Table 6.
SupTech Score distribution and treatment assignment.
Table 7.
SCM results: actual vs. synthetic greenwashing (2014–2025).
To assess the sensitivity of the main findings to the choice of the median threshold, we re-estimate the SCM using two alternative cutoffs: the 40th percentile () and the 60th percentile (). In both cases, the post-treatment GAP remains negative and of comparable magnitude to the baseline specification, and the pre-treatment RMSPE remains approximately zero, confirming that the synthetic control achieves a near-perfect pre-treatment fit regardless of the threshold choice. These results indicate that the main findings are not driven by the specific choice of the median as the treatment cutoff. Additionally, the SupTech index is used in its continuous form as a covariate in the Causal Random Forest analysis (Section 4.2), which estimates heterogeneous treatment effects as a function of the continuous SupTech score without imposing any binary discretization, providing a complementary identification strategy that does not depend on the threshold choice (Athey et al., 2019; Wager & Athey, 2018).
Causal Identification
To identify the estimated effect of SupTech adoption on banking greenwashing, we apply the Synthetic Control Method (Abadie et al., 2010). The treated unit is constructed as the average greenwashing trajectory of the treated banks with a complete panel, while the synthetic control is built as an optimally weighted combination of the donor pool banks. The optimal weights are obtained by minimizing the pre-treatment discrepancy between the treated unit and its synthetic counterpart over the 2014–2018 period, which is subject to the non-negativity and adding-up constraints described in Equation (6).
The choice of 2019 as the treatment year is grounded in two converging institutional developments specific to the European banking supervisory framework. First, 2019 marks the legislative adoption of Regulation (EU) 2019/2088 on Sustainability-Related Disclosures (SFDR), enacted in November 2019, which constitutes the cornerstone of the EU sustainable finance agenda and was explicitly designed, among other objectives, to curb greenwashing in the financial sector (European Banking Authority, 2021; European Union, 2019). While the operational application of SFDR began in March 2021, its legislative adoption in 2019 triggered an anticipatory phase during which European supervisory authorities including the European Central Bank’s Single Supervisory Mechanism and national competent authorities began intensifying their reliance on AI-driven supervisory technology (SupTech) to prepare for the forthcoming disclosure obligations (European Central Bank, 2023). Second, the European Central Bank’s own SupTech roadmap, formalized by the Single Supervisory Mechanism, reflects a structural shift toward continuous, data-driven supervision that intensified over the 2019–2020 period. The selection of 2019 as the treatment year is therefore consistent with the onset of this institutional transition, predating its full legal enforcement but capturing the period during which supervisory authorities began reallocating resources toward AI-based oversight in anticipation of the new disclosure regime.
A potential concern is that the 2019–2020 treatment window coincides with the onset of the COVID-19 pandemic, which could independently affect bank-level greenwashing through channels unrelated to SupTech adoption, such as reduced ESG reporting capacity, shifting strategic priorities, or pandemic-induced reputational pressures (Birindelli et al., 2024). Three elements of the research design mitigate this concern. First, the synthetic control by construction nets out any shock that is common to both treated and donor banks, since both groups operate within the same macro-financial environment and are equally exposed to the pandemic; the SCM estimator therefore isolates the differential effect of SupTech exposure over and above any common COVID-19 shock (Abadie et al., 2010; Ben-Michael et al., 2022). Second, the near-zero pre-treatment RMSPE confirms that treated and donor banks exhibit parallel greenwashing trajectories throughout 2014–2018, well before the pandemic, supporting the validity of the counterfactual comparison independently of any pandemic-related shift in the treatment year. Third, the placebo-in-time tests reported in Section 5.3, which reassign the treatment to false intervention years (2016–2018), produce GAPs close to zero throughout the pre-COVID period, indicating that the observed post-2019 divergence is not driven by a generic macro-financial shock but is specific to the actual treatment timing.
Table 7 reports the year-by-year comparison between actual and synthetic greenwashing together with the annual GAP and the pre- and post-treatment RMSPE. The pre-treatment RMSPE is approximately zero (), confirming that the synthetic control replicates the treated unit’s pre-treatment greenwashing trajectory with near-perfect precision. This near-perfect pre-treatment fit validates the counterfactual comparison and supports the causal interpretation of the post-treatment divergence between the treated unit and its synthetic counterpart (Abadie et al., 2010; Ben-Michael et al., 2022). The actual GW values reported in Table 7 are computed on the pre-winsorized outcome series, which is consistent with the methodological requirements of the SCM estimator described in Section 4.1. The descriptive statistics in Table 2, by contrast, are based on winsorized values. This explains the apparent discrepancy between the minimum GW value reported in Table 2 (12.784, after winsorization) and the actual GW trajectory in Table 7, which reflects the original pre-winsorized levels of the outcome variable (Abadie, 2021; Abadie et al., 2010).
Following the treatment year 2019, a negative GAP gradually emerges between the actual and synthetic greenwashing trajectories, widening substantially in the final years of the sample period: the GAP reaches in 2024 and in 2025. This pattern of gradual divergence, rather than an abrupt break immediately following the pandemic onset in 2020, is itself informative: a purely COVID-19-driven shock would be expected to produce a sharp, immediate effect concentrated in 2020–2021, whereas the observed GAP remains close to zero through 2021–2022 before widening substantially from 2023 onward.
We are fully transparent about the nature of this post-2023 pattern, which requires careful interpretation. The near-zero GAP over 2019–2022 () is not evidence against the treatment effect; it is consistent with the well-documented institutional lag between SupTech adoption and observable compliance behavior. The SFDR Level 2 technical standards became operational only in March 2021, and the EBA’s AI-based supervisory tools required 2–3 years of implementation before generating systematic compliance pressure (Degryse et al., 2025; European Banking Authority, 2025). The post-2022 widening therefore coincides precisely with the period during which the regulatory architecture became fully operational.
Two additional factors contribute to the magnitude of the post-2023 GAP. First, the GW variable exhibits 13.3% missingness; the composition of treated banks with non-missing observations shifts from 2023 onward, and banks entering the observed sample in 2023–2025 tend to have lower GW values. Importantly, this composition shift is itself consistent with a treatment effect interpretation: if SupTech supervision induces genuine ESG performance improvements among the most responsive banks, these are precisely the banks likely to report more consistently in later years. Second, a subset of treated banks exhibits strongly negative GW values in 2023–2025, reflecting very high ESG performance relative to disclosure, which is a pattern that is consistent with genuine supervisory-induced improvements in actual environmental performance rather than disclosure inflation (European Banking Authority, 2025; Lyon & Montgomery, 2015).
The robustness of the post-2023 pattern to individual bank influence is confirmed by the leave-one-out analysis in Section 5.3: sequentially excluding the 10 most influential donor banks leaves the post-treatment GAP trajectory qualitatively unchanged (Ben-Michael et al., 2022). We therefore interpret the post-2023 GAP as reflecting a combination of a delayed genuine treatment effect and data composition changes, and we qualify all interpretations accordingly with language such as “consistent with” rather than asserting direct causality.
The post-treatment GAP widens substantially from 2023 onward with the treated-group average GW declining sharply relative to the synthetic counterfactual. Two factors contribute to this pattern. First, the GW variable exhibits 13.3% missingness across the sample, and the composition of treated banks with non-missing GW observations shifts from 2023 onward as ESG data coverage evolves across providers. Second, a subset of treated banks exhibit strongly negative GW values in 2023–2025, reflecting very high ESG performance scores relative to their disclosure levels, which is a pattern that is consistent with the progressive translation of SupTech-induced supervisory pressure into genuine improvements in actual environmental performance rather than disclosure inflation (European Banking Authority, 2025; Lyon & Montgomery, 2015). The robustness of this pattern to the composition of the treated group is confirmed by the leave-one-out analysis in Section 5.3, which shows that the post-treatment GAP trajectory remains stable when the most influential donor banks are sequentially excluded (Ben-Michael et al., 2022).
To assess the sensitivity of the results to the post-2023 discontinuity, we report the GAP separately for two sub-periods. Over 2019–2022, the mean GAP is essentially zero, indicating no detectable effect in the first four post-treatment years. The large negative GAP materializes exclusively from 2023 onward (mean GAP = ), coinciding with the full operational maturity of the SFDR Level 2 standards and the entry into force of CSRD obligations (European Banking Authority, 2025).
Two interpretations are consistent with this pattern. First, under the treatment effect interpretation, the delayed response reflects the institutional lag between SupTech adoption and observable compliance behavior: supervisory pressure translates into genuine disclosure improvements only once the regulatory architecture reaches sufficient operational maturity (Degryse et al., 2025). Second, under the data composition interpretation, the post-2023 decline partly reflects a shift in the composition of treated banks with non-missing GW observations (13.3% overall missingness). We are explicit that these two interpretations cannot be fully disentangled with the current data. The pre-2023 evidence () is consistent with an institutional lag hypothesis but does not constitute strong standalone causal evidence.
The average post-treatment GAP is , with a post-treatment RMSPE of , indicating that SupTech adoption is associated with a sizeable reduction in the greenwashing index relative to the counterfactual that would have prevailed in the absence of SupTech-based supervision. Figure 2 plots the actual and synthetic greenwashing trajectories over the full sample period together with the corresponding annual GAP, highlighting the divergence that emerges after the treatment year.
Figure 2.
Synthetic Control Method: SupTech, banking greenwashing, and the post-treatment GAP (2014–2025). In panel (a), the vertical dashed line marks the 2019 treatment year and the shaded bands distinguish the pre- and post-treatment periods; the dashed red line in panel (b) is the mean post-treatment GAP.
Two clarifications regarding the values reported in Table 7 are warranted. First, the actual GW values are computed on the pre-winsorized outcome series, while the descriptive statistics in Table 2 are based on winsorized values (1st–99th percentiles). This explains the apparent discrepancy between the minimum GW value reported in Table 2 (12.784, after winsorization) and the actual GW trajectory in Table 7, which reflects the original pre-winsorized levels of the outcome variable. This choice is methodologically justified by the internal logic of the SCM estimator: the donor weights are optimized to replicate the exact pre-treatment trajectory of the treated unit operating on the original levels of the outcome variable; any prior transformation including winsorization would alter this trajectory, modify the optimal weight vector, and potentially invalidate the counterfactual (Abadie, 2021; Abadie et al., 2010). The GW proxy, defined as the difference between min–max normalized ESG disclosure and performance scores, may legitimately take values outside the winsorized range for institutions exhibiting very high ESG performance relative to their disclosed commitments, which is a pattern consistent with substantive sustainability behavior rather than a data artifact (Lyon & Montgomery, 2015). The robustness of the SCM results to the presence of such observations is directly assessed through the leave-one-out sensitivity analysis reported in Section 5.3, which confirms that the post-treatment gap trajectory remains stable when the most influential donor banks are sequentially excluded (Ben-Michael et al., 2022). Second, the treated group comprises 50 banks throughout the full sample period, which is consistent with Table 6. The donor pool used in the SCM estimation comprises 36 of the 40 control banks after the listwise deletion of four banks with incomplete GW panels over the full 2014–2025 period; the remaining four control banks are excluded from the donor pool but retained in the OLS regression analysis reported in Section 5.1.2.
Table 8 reports the donor pool weights underlying the construction of the synthetic control. The weights are concentrated on a relatively small subset of donor banks, which is a common feature of synthetic control applications (Abadie et al., 2010), with Intesa Sanpaolo (14.6%), KBC Groupe (10.3%), and Oberbank (6.7%) jointly accounting for approximately 31.6% of the cumulative weight. The average post-treatment GAP estimated establishes the existence of a statistically significant estimated effect of SupTech adoption on banking greenwashing, but it does not speak to the conditions under which this effect is stronger or weaker. The present section addresses this question through two complementary approaches. First, we implement a split-sample SCM to test whether the magnitude of the causal effect varies systematically across discrete subgroups of banks defined by their RegTech endowment and digital maturity. Second, we regress the bank-year SCM GAP on the full set of institutional covariates listed in Table 1, thereby providing a continuous and multivariate characterization of the boundary conditions that shape SupTech’s disciplining power.
Table 8.
Donor pool weights (top 15 banks).
Moderating Effects and Institutional Determinants of the Causal Effect
The European banking sector provides an especially appropriate context for this analysis. Since the legislative adoption of the Sustainable Finance Disclosure Regulation (SFDR) in 2019 and the subsequent entry into force of the Corporate Sustainability Reporting Directive (CSRD), European banks have been operating under an increasingly demanding sustainability disclosure regime that simultaneously raises the reputational cost of greenwashing and expands the informational infrastructure available to supervisory authorities (European Banking Authority, 2025; European Union, 2019). The European Banking Authority’s (2024) Final Report on Greenwashing documents a marked increase in greenwashing incidents in the EU banking sector and explicitly identifies SupTech tools including web-scraping, natural language processing, and AI-based analytics as a priority instrument for national competent authorities seeking to close the gap between banks’ sustainability disclosures and their actual exposures to carbon-intensive assets (European Banking Authority, 2025; European Securities and Markets Authority, 2023). This institutional context implies that the effectiveness of SupTech in reducing greenwashing is not only a function of the supervisory technology itself but also of the regulatory environment in which it is deployed and the institutional profile of the banks it supervises—precisely, the heterogeneity that the following analyses are designed to characterize. Together, these two analyses move from the binary partition of the split-sample design to a richer and more granular understanding of the institutional heterogeneity underlying the average treatment effect reported in Section 5.1.2.
Split-Sample SCM: Moderating Roles of RegTech and Digital Maturity
For each moderating variable , treated banks are partitioned into two subgroups based on the within-treated-group median of M, and a separate synthetic control is estimated for each subgroup using the full donor pool, as described in Equations (10) and (11). The moderating effect is identified by comparing the average post-treatment GAPs across the high- and low-M subgroups. Table 9 reports the subgroup-specific results, while Figure 3 and Figure 4 display the corresponding GAP trajectories for RegTech and digital maturity respectively.
Table 9.
Split-sample SCM: average post-treatment GAP by subgroup.
Figure 3.
Split-sample SCM: moderating effect of Regtech.
Figure 4.
Split-Sample SCM: moderating effect of digital maturity (DMS).
The results reveal a striking contrast between the two moderating variables. For RegTech, the average post-treatment GAP is substantially more negative for the low-RegTech subgroup () than for the high-RegTech subgroup (), yielding a positive differential . This finding indicates that the greenwashing-reduction effect of SupTech is markedly stronger for banks with lower RegTech endowment, which is a pattern that is consistent with a substitution mechanism: banks that already possess a developed internal compliance technology infrastructure derive less marginal disciplinary benefit from external SupTech-based supervision, as their own RegTech systems may already address part of the information asymmetry that SupTech is designed to correct. Figure 3 makes this divergence visually explicit, showing that the high-RegTech subgroup exhibits a GAP trajectory that remains close to zero throughout the post-treatment period, while the low-RegTech subgroup displays a progressively widening negative GAP. These results do not support the complementarity mechanism posited for RegTech. The empirical rejection of H2 is theoretically informative. While the complementarity hypothesis is grounded in institutional theory (DiMaggio & Burbano, 1983), which predicts that regulatory technologies reinforce each other, the substitution pattern identified here suggests that RegTech and SupTech address partially overlapping dimensions of the information asymmetry underlying greenwashing. Banks that have already invested in compliance technology internalize part of the disciplining function that SupTech is designed to provide externally, thereby reducing the marginal benefit of supervisory AI adoption. This finding contributes to an emerging strand of the literature that challenges the complementarity assumption in regulatory technology adoption (Benaissa et al., 2025; Charoenwong et al., 2024).
Two methodological notes are warranted regarding these split-sample results. First, the four subgroup-specific synthetic controls share the same donor pool of control banks; the differential should therefore be interpreted as descriptive evidence of heterogeneity rather than as a formal statistical test (Abadie, 2021). Second, the pre-treatment fit is less precise for the High DMS and Low RegTech subgroups ( = 0.000 and 0.039 respectively) than for the remaining subgroups (); the post-treatment GAP estimates for these two subgroups should accordingly be interpreted with appropriate caution.
For digital maturity, the pattern is diametrically different: the post-treatment GAP is far more negative for high-DMS banks () than for low-DMS banks (), yielding a negative differential . This result is consistent with the dynamic capabilities argument (Teece et al., 1997): institutions with greater absorptive capacity accumulated through sustained investment in digital infrastructure and data-driven processes are better positioned to translate external supervisory pressure into genuine reductions in misleading sustainability disclosure. The contrast with the RegTech finding is theoretically informative: while RegTech is an instrument of regulatory compliance, digital maturity reflects a deeper organizational capability that conditions the bank’s overall responsiveness to its supervisory environment. Figure 4 illustrates this divergence clearly with the high-DMS subgroup displaying a sustained and widening negative GAP from 2019 onward, while the low-DMS subgroup remains largely unaffected.
OLS Regression of the SCM GAP on Bank Characteristics.
The split-sample evidence establishes the existence of systematic heterogeneity in the SupTech–greenwashing relationship, but it does so through a coarse binary partition that leaves the continuous structure of the heterogeneity uncharacterized. To complement this analysis and identify the full spectrum of institutional determinants of SupTech’s effectiveness, we regress the post-treatment SCM GAP on the complete set of bank-level covariates listed in Table 1. Three progressive specifications are reported in Table 10: a baseline pooled OLS (M1), a model with year fixed effects (M2), and a fully saturated model with bank and year fixed effects (M3). The bank-year SCM GAP is constructed by assigning the aggregate annual GAP estimated by the SCM to each treated bank in the corresponding post-treatment year. This procedure yields a bank-year panel that preserves the annual variation in the treatment effect while allowing the OLS regression to exploit cross-sectional variation in bank characteristics (Abadie et al., 2010). Standard errors are clustered at the bank level throughout the OLS regression to account for within-bank serial correlation in the assigned GAP values (Ben-Michael et al., 2022). For the SCM and placebo inference, clustering is conducted at the jurisdiction level, which is consistent with the supervisory authority level at which SupTech exposure varies (Abadie et al., 2010).
Table 10.
OLS regression of the SCM GAP on bank characteristics (post-treatment period, 2019–2025).
The overall pattern of results is coherent and stable across specifications with six of the eight covariates displaying consistent signs and five retaining significance even after the introduction of the full set of fixed effects in M3. The model’s explanatory power is moderate to substantial, with increasing from 0.589 in the baseline specification (M1) to 0.593 with year fixed effects (M2) and 0.596 in the fully saturated model (M3), indicating that institutional covariates account for approximately 59% of the variation in the SCM GAP, which is a result that is consistent with a well-specified model that nevertheless leaves room for unobserved bank-specific and idiosyncratic factors shaping SupTech responsiveness. This stability is itself informative: coefficients that survive both bank and year fixed effects reflect genuine within-bank, within-year associations between institutional characteristics and SupTech effectiveness rather than confounders driven by cross-sectional heterogeneity or common temporal trends.
Turning to the results, capital adequacy (CAR) is the most robustly significant negative determinant of the SCM GAP across all three specifications (, ): better-capitalized banks exhibit a stronger greenwashing-reduction response to SupTech supervision, which is consistent with lower incentives for opportunistic ESG disclosure among financially solid institutions (Jensen & Meckling, 2019). Bank size (SIZE) is the only variable with a consistently positive and significant coefficient (, ), indicating that the disciplining effect of SupTech is systematically attenuated for larger institutions whose organizational complexity and reputational capital sustain structural incentives for symbolic sustainability communication, which is a pattern that is documented for large European banks by (Galletta et al., 2024) and consistent with legitimacy theory (Suchman, 1995). ESG practices (, –) and FinTech adoption (, –) both enter negatively and significantly, suggesting that genuine ESG commitment and technological absorptive capacity amplify the effectiveness of SupTech supervision (Schons & Steinmeier, 2016; Teece et al., 1997). The regulatory context indicator (REG) is negative and significant across all three specifications (, –), confirming that more stringent regulatory environments reinforce SupTech’s disciplining power. Beyond statistical significance, the economic magnitude of these effects warrants attention. A one-standard-deviation increase in CAR () is associated with a reduction of approximately 0.17–0.20 units in the SCM GAP, representing roughly 3–4% of the post-treatment mean GAP (). A one-standard-deviation increase in SIZE () attenuates the GAP by approximately 4.9–5.2 units, equivalent to 82–87% of the post-treatment mean, indicating an economically substantial moderating effect of bank size. This result is directly grounded in the European institutional context: the EBA’s 2024 Final Report on Greenwashing explicitly identifies the combination of AI-based supervisory technology and a demanding disclosure regime such as that created by the SFDR and CSRD as the most effective deterrence architecture against misleading sustainability claims in EU banking, noting that SupTech tools are most impactful precisely in jurisdictions where national competent authorities actively enforce disclosure requirements (European Banking Authority, 2025). ESMA similarly concludes that cross-country variation in greenwashing outcomes within the European banking sector reflects differences in supervisors’ technological oversight capacity rather than differences in bank characteristics alone (European Securities and Markets Authority, 2023). Digital maturity (DMS) is significant in M1–M2 but loses significance once bank fixed effects are introduced in M3, indicating that it operates as a time-invariant structural characteristic absorbed by the bank fixed effect (Teece et al., 1997). RegTech and ROA remain statistically insignificant throughout, which is consistent with the substitution mechanism identified in the split-sample SCM: banks with higher RegTech endowment already reduce part of the disclosure gap that SupTech targets, limiting its marginal effectiveness.
The convergence between the split-sample SCM and the GAP regression produces a coherent and theoretically interpretable picture of the boundary conditions governing SupTech’s effectiveness. The disciplining effect of SupTech on greenwashing is strongest for banks that combine financial solidity, genuine ESG commitment, technological absorptive capacity, and exposure to a demanding regulatory environment. It is weakest for large institutions whose organizational complexity and reputational capital create persistent structural advantages for symbolic sustainability disclosure. These findings carry direct implications for supervisory policy in the European banking sector. The EBA and national competent authorities have explicitly committed to expanding their use of AI-based SupTech tools as a core pillar of their greenwashing monitoring capacity (European Banking Authority, 2024, 2025), and the introduction of the CSRD from January 2025 will require approximately 50,000 EU undertakings to publish standardized sustainability reports, substantially expanding the data environment available for SupTech-based verification (European Banking Authority, 2025). The present findings suggest that the effectiveness of this supervisory escalation will not be uniform: it will be strongest in regulatory environments where national competent authorities actively enforce disclosure requirements and for banks whose financial health, ESG foundations, and digital infrastructure make them genuinely responsive to supervisory pressure. Subject to the identification limitations discussed above, these findings suggest that maximizing the impact of AI-driven supervision on greenwashing reduction may require attending not only to the technological capabilities of the supervisory authority itself but equally to the institutional conditions of supervised banks and to the coherence of the broader regulatory architecture in which SupTech is deployed. SupTech is most effective when it lands in an institutional ecosystem already predisposed to genuine sustainability accountability; it is least effective when it operates against the structural incentives of large, resource-rich institutions whose organizational sophistication allows symbolic compliance to persist.
5.1.3. Causal Random Forest: Heterogeneous Treatment Effects
The SCM and OLS analyses provided evidence of a significant average association between SupTech adoption and greenwashing, and they identified its main institutional correlates through linear and binary specifications. These approaches, however, impose functional form assumptions and capture only average or coarsely partitioned effects, leaving the nonlinear and heterogeneous dimensions of the SupTech–greenwashing relationship uncharacterized.
To address this limitation, we complement the SCM analysis with a Causal Random Forest (CRL) estimation, as described in Equation (12). The T-Learner framework estimates Conditional Average Treatment Effects (CATEs) at the bank level non-parametrically without imposing any distributional or linearity assumption. It is particularly well suited for detecting heterogeneous effects that may not be captured by standard regression-based approaches (Athey et al., 2019; Wager & Athey, 2018). Each method in this progressive framework addresses a distinct empirical question: the SCM identifies the average causal effect; the split-sample SCM tests binary heterogeneity across institutional subgroups; the OLS characterizes continuous determinants of the causal effect; and the Causal Random Forest detects nonlinear heterogeneous effects without imposing functional form assumptions.
Average treatment effect and bootstrap validation:
Table 11 reports the ATE and its bootstrap confidence interval. The point estimate of the ATE suggests that the average greenwashing level of treated banks is meaningfully lower than the counterfactual predicted for comparable untreated banks after conditioning on the full set of covariates. The bootstrap confidence interval, computed over 100 resampling iterations, excludes zero, providing further evidence that the SupTech treatment effect appears statistically significant and stable. This result is broadly consistent with the SCM finding reported in Section 5.1.2, and it may be interpreted as supporting the robustness of the main finding across two complementary identification strategies. We note that the convergence between the SCM and the Causal Random Forest estimates does not constitute fully independent validation, as both methods rely on the same outcome variable (GW) and the same post-treatment period (2019–2025). The SCM identifies the average treatment effect through counterfactual comparison, while the Causal Random Forest identifies heterogeneous effects through a non-parametric estimation of conditional outcome functions. The two methods address different empirical questions and employ different identification assumptions, which provides methodological complementarity rather than strict independence. Their convergence nevertheless reinforces confidence in the direction and approximate magnitude of the estimated effects (Abadie et al., 2010; Athey et al., 2019).
Table 11.
Average Treatment Effect (ATE) and bootstrap confidence interval.
Heterogeneous effects by RegTech level:
Table 12 reports the mean CATE disaggregated by RegTech tertiles. No monotonic pattern is observed across the three levels, and the Spearman correlation between individual CATE estimates and RegTech scores is negligible and statistically insignificant. These results provide no evidence of a systematic moderating role for RegTech within the Causal Random Forest framework.
Table 12.
Mean CATE by RegTech level.
This finding is broadly consistent with the substitution mechanism identified in the split-sample SCM: banks with higher RegTech endowment tend to derive less marginal benefit from SupTech supervision, which is possibly because their internal compliance infrastructure may already address part of the information asymmetry that SupTech is designed to correct. Taken together, the SCM and Causal Random Forest evidence appears more consistent with RegTech operating as a substitute rather than a complement to SupTech in the greenwashing-reduction channel.
Heterogeneous effects by digital maturity level:
Table 13 reports the mean CATE disaggregated by DMS tertiles. An important interpretive clarification is warranted before examining these results.
Table 13.
Mean CATE by digital maturity (DMS) level.
In the T-Learner framework used here, the CATE is defined as : a more negative value indicates a larger greenwashing-reduction effect of SupTech. Under this convention, the results show a clear gradient across digital maturity levels. Low-DMS banks exhibit an average CATE close to zero (), whereas high-DMS banks display the most negative mean CATE (). This pattern indicates that the greenwashing-reduction effect of SupTech becomes stronger as banks’ digital maturity increases.
This finding is consistent with the dynamic capabilities perspective, which suggests that digitally mature organizations possess stronger technological and organizational capabilities to effectively exploit advanced supervisory technologies. The Causal Random Forest estimates, which condition on observable characteristics including capital adequacy, size, ESG performance, and FinTech adoption, indicate that digital maturity remains an important source of treatment-effect heterogeneity even after accounting for these factors.
The monotonic decline in mean CATE across DMS tertiles is further supported by the Spearman correlation between individual CATE estimates and DMS scores. The negative correlation (, ) indicates that higher digital maturity is significantly associated with more negative CATE values, confirming that digitally advanced banks experience a stronger SupTech-induced reduction in greenwashing.
Overall, these results complement the split-sample SCM evidence by showing that digital maturity does not merely characterize differences in post-treatment trajectories, but it also explains heterogeneous causal effects at the individual bank level.
Joint heterogeneity: RegTech × Digital Maturity:
Table 14 reports the joint distribution of mean CATEs across RegTech and DMS tertiles. The cell corresponding to high RegTech and high DMS displays the least negative mean CATE (), indicating the smallest absolute greenwashing-reduction effect within this cross-tabulation.
Table 14.
Cross-CATE matrix: RegTech × digital maturity.
This pattern may be interpreted as consistent with an absorptive capacity reading: banks combining a developed internal compliance infrastructure with high digital maturity may have already internalized part of the disclosure discipline that SupTech is designed to enforce, leaving a smaller residual effect for external supervision to produce. The cell associated with high RegTech and low DMS displays a more negative mean CATE (), suggesting that compliance technology in the absence of broader digital maturity may be associated with a structural gap that SupTech supervision tends to close more effectively. Reading across the High RegTech row, the CATE decreases monotonically in absolute value as DMS increases (Low = , Medium = , High = ), confirming that banks with both high RegTech and high DMS have already internalized most of the compliance discipline that SupTech targets, which is consistent with H2. The non-monotone pattern in the Low RegTech row (Low DMS = , Medium DMS = , High DMS = ) reflects a U-shaped relationship detected by the Causal Random Forest framework in the joint distribution of RegTech and DMS, which binary split-sample analyses cannot capture (Wager & Athey, 2018). This nonlinearity does not contradict H3, which posits a positive moderating role of DMS on average across all RegTech levels, which is a prediction that is confirmed by the stability analysis. These patterns are broadly consistent with the substitution mechanism identified for RegTech across the empirical analyses.
Taken together, the Causal Random Forest results provide evidence that is broadly consistent with the findings from the SCM and OLS analyses while offering a non-parametric and continuous perspective on treatment effect heterogeneity. The average treatment effect appears statistically significant and directionally consistent with the SCM estimate. The heterogeneity analysis suggests that digital maturity and FinTech adoption tend to exhibit more directionally stable gradients than other covariates, while RegTech shows no consistent moderating pattern, which may be seen as further supporting the substitution narrative. These results complement the parametric evidence from the OLS GAP regression and the binary evidence from the split-sample SCM, and they provide a non-parametric perspective on the boundary conditions that may govern SupTech’s association with greenwashing reduction in the European institutional context.
5.2. Policy Simulations
The preceding analyses establish that the effectiveness of SupTech in reducing banking greenwashing is heterogeneous and depends on a set of institutional boundary conditions—most notably the digital maturity of supervised banks and the stringency of the regulatory environment. To translate these findings into concrete policy implications, we conduct a series of counterfactual simulations in which the RegTech endowment and digital maturity of treated banks are incrementally improved, and the mean CATE is re-estimated under each scenario using the Causal Random Forest model. This exercise allows us to quantify the additional greenwashing reduction that could be achieved by acting on these two institutional levers, holding the SupTech adoption level constant.
Table 15 reports the mean CATE and the change in predicted greenwashing reduction relative to the baseline under four scenarios. The baseline reproduces the mean CATE estimated on observed bank characteristics (). The RegTech improvement scenarios shift the RegTech variable by 0.5 and 1.0 standard deviations, respectively, for all treated banks, while the maturity scenario shifts the DMS variable by 0.5 standard deviations.
Table 15.
Policy simulations: counterfactual impact on greenwashing reduction.
The results reveal a pronounced and policy-relevant asymmetry between the two institutional levers. Improving RegTech endowment alone by 0.5 or 1.0 standard deviation above the observed level produces a negligible additional reduction in greenwashing ( and respectively), confirming the substitution mechanism identified in the split-sample SCM and the non-significance of RegTech in the OLS GAP regression: since banks with higher RegTech already face a lower marginal effectiveness of SupTech supervision, a further increase in internal compliance technology provides essentially no additional disciplining benefit. By contrast, improving bank digital maturity by 0.5 standard deviation amplifies the mean greenwashing-reduction effect by 2.45 units (from to ), which is an increase of approximately 44% relative to the baseline. This amplification effect is robust: the combined scenario of simultaneously improving both RegTech and digital maturity yields a virtually identical gain (), confirming that the dominant source of the additional reduction is digital maturity rather than RegTech.
These findings carry direct implications for European banking supervisors. In the context of the EBA’s ongoing commitment to expanding AI-based supervisory capacity and the CSRD’s progressive entry into force (European Banking Authority, 2025; European Union, 2019), the simulation results suggest that the returns to SupTech adoption are not fixed but are instead highly sensitive to the digital absorptive capacity of the supervised institutions. A supervisory strategy that deploys advanced SupTech tools without attending to the digital maturity of the banks it oversees risks systematically underperforming relative to its potential. Conversely, policies that incentivize banks to invest in digital infrastructure through targeted guidance, supervisory expectations, or capacity-building initiatives aligned with the EBA’s digital finance agenda (European Banking Authority, 2024) are likely to substantially amplify the greenwashing-reduction impact of AI-driven supervision. The marginal return to digital maturity improvement ( units of greenwashing reduction per 0.5 SD increase) represents a quantifiable benchmark against which the cost of such policies could be assessed by competent authorities seeking to optimize the architecture of sustainable finance supervision in the European Union.
5.3. Robustness and Validity Tests
The validity of the empirical findings is assessed through five complementary robustness tests within a hybrid empirical framework combining Synthetic Control Methods (SCMs) and Causal Machine Learning (T-Learner based Random Forest models). Together, these tests provide converging evidence on the stability and reliability of the estimated treatment effects and help characterize the conditions under which these effects remain robust.
Placebo tests: The placebo-in-space and placebo-in-time exercises provide evidence that the estimated treatment effect is unlikely to be driven by random variation or spurious dynamics. When treatment is reassigned to alternative units or to pre-intervention periods, the estimated effects remain close to zero. In contrast, the actual treated unit exhibits a systematically different post-intervention behavior, which is consistent with a treatment-specific effect rather than structural noise or pre-existing trends. The placebo-in-space test assigns treatment iteratively to each of the 36 donor banks and re-estimates the synthetic control for each pseudo-treated unit. The empirical p-value defined as the proportion of placebo units whose post-treatment RMSPE ratio equals or exceeds that of the treated unit is (0 out of 36 placebo units, which is equivalent to given the discrete distribution with 36 placebo units (Abadie et al., 2010), and the corresponding placebo distribution is displayed in Figure 5.
Figure 5.
Placebo-in-space test: SCM inference. In panel (a), the solid line denotes the treated unit and the grey lines the 36 placebo units, with the vertical dashed line marking the 2019 treatment year; in panel (b), the dashed line marks the treated unit and the shaded bars the placebo distribution of RMSPE ratios.
Balance diagnostics. Table 16 reports pre-treatment means for all key variables across treated and control banks. The outcome variable (GW) and main financial controls (CAR, SIZE, ROA, FIN) show no statistically significant differences at the 5% level, confirming pre-treatment comparability with respect to the outcome and confounders (Abadie et al., 2010). As expected by construction, treated banks exhibit higher SupTech exposure, higher digital maturity (DMS), higher RegTech endowment, and operate in stricter regulatory environments (REG). These differences reflect the institutional characteristics associated with the treatment assignment rule rather than a balance failure. The pre-treatment mean SupTech of the treated group (0.147) appears below the full-sample median threshold (0.1718) because treatment assignment is based on the average score over the full 2014–2025 period rather than the pre-treatment period alone. SupTech adoption accelerated substantially in the post-treatment period (2019–2025), raising the full-sample average of treated banks above the median threshold (Bank for International Settlements, 2023; European Banking Authority, 2021). The higher DMS of treated banks (0.523 vs. 0.365) confirms that banks exposed to more intensive SupTech supervision tend to operate in more digitally mature supervisory environments, providing empirical support for the moderating role of digital maturity posited in H3. The higher RegTech of treated banks is consistent with the substitution mechanism identified in H2—it attenuates rather than amplifies the SupTech effect, making our estimates conservative. The higher REG of treated banks reflects the stricter regulatory environment associated with more active SupTech supervisors, which is consistent with the complementarity between regulatory stringency and SupTech effectiveness documented in Section 5.1.2. The SCM validity rests exclusively on pre-treatment GW comparability (), not on the balance of institutional moderators (Abadie, 2021; Abadie et al., 2010).
Table 16.
Pre-treatment balance diagnostics (2014–2018).
Leave-one-out sensitivity analysis: The exclusion of influential donor units does not materially alter the estimated post-treatment trajectory. The stability of the results across all re-estimations suggests that the findings are not driven by any single control unit but instead reflect a robust aggregate synthetic construction. This supports the reliability of the counterfactual design. Figure 6 displays the corresponding leave-one-out trajectories.
Figure 6.
Leave-one-out sensitivity analysis: SCM robustness. The vertical dashed line marks the 2019 treatment year and the shaded bands distinguish the pre- and post-treatment periods; grey lines are the leave-one-out variants and the solid line the baseline synthetic control.
Bootstrap stability test: The bootstrap procedure confirms the stability of the estimated Average Treatment Effect (ATE). Across resampled datasets, the estimated effect remains very close to the baseline estimate with limited dispersion. The confidence interval remains entirely below zero, indicating that the treatment effect is statistically robust and not sensitive to sampling variability. This provides strong evidence of a stable and precisely estimated effect, as already reported in Table 11.
Cross-validation: The Random Forest models used in the T-Learner framework exhibit consistent predictive performance across folds. The control model shows higher predictive accuracy than the treated model, which is consistent with lower structural heterogeneity in the control group. The treated model exhibits lower but stable performance, reflecting greater variability in outcomes among treated units rather than model misspecification. Overall, the results indicate satisfactory generalization performance across both groups. The T-Learner is implemented using two separate Random Forest models estimated with the following hyperparameters: 500 trees (n_estimators = 500), no maximum depth constraint (max_depth = None), minimum 5 observations per leaf (min_samples_leaf = 5), and bootstrap aggregation enabled (bootstrap = True). Honesty is approximated through the 5-fold cross-validation procedure reported in Table 17, which provides out-of-sample estimates of predictive performance for both sub-models. All analyses are implemented in Python 3.12 using the scikit-learn library (version 1.4.0). The random seed is fixed at 42 for full reproducibility. Convergence is verified through the out-of-bag error, which stabilizes after approximately 200 trees for both sub-models, confirming that 500 trees provide sufficient stability. To facilitate replication, the Python code used for the SCM optimization, the T-Learner estimation, and the policy simulations is available from the corresponding author upon request. All analyses were conducted on a standard computing environment; the SCM optimization converges in under 2 s per unit and the Causal Random Forest estimation with 500 trees requires approximately 45 s for the full treated subsample.
Table 17.
Cross-validation results (5-fold).
Feature sensitivity analysis: The variable importance results reported in Table 18 indicate that the predictive structure is distributed across multiple covariates rather than dominated by a single driver. Bank fundamentals such as capital adequacy, size, and digital maturity emerge as key determinants of heterogeneity in treatment effects. The relatively low importance of the treatment intensity variable suggests that heterogeneity is primarily driven by structural bank characteristics rather than within-treatment variation.
Table 18.
Feature importance: treated vs. control Random Forest models.
Stability of heterogeneous effects: The analysis of heterogeneous effects across covariate distributions, reported in Table 19, shows a consistent pattern for several key variables. Digital maturity, fintech adoption, capital adequacy, and ESG engagement exhibit stable and directional gradients, indicating that they systematically reinforce the magnitude of the treatment effect. In contrast, internal compliance-related variables do not display stable monotonic patterns, suggesting a limited moderating role. Profitability measures show weak and inconsistent variation, indicating a marginal influence on treatment heterogeneity.
Table 19.
Stability of heterogeneous effects across tertiles.
Overall, robustness checks consistently support the main empirical findings. The estimated treatment effects remain stable across placebo assignments, re-sampling procedures, and alternative model specifications. The machine learning components exhibit stable predictive performance, while the heterogeneity analysis highlights structurally consistent moderating factors, particularly digital maturity, fintech adoption, capital strength, and ESG engagement. In contrast, internal compliance mechanisms do not appear to systematically influence treatment effectiveness. Taken together, the results indicate that the estimated effects are robust, internally consistent, and not driven by a specific identification strategy or a particular subset of observations.
6. Summary and Conclusions
This paper examines the impact of SupTech adoption, consistent with a causal interpretation, on greenwashing practices within the European banking sector over the period 2014–2025, drawing on a progressive empirical framework combining the SCM, split-sample SCM, OLS regression, and Causal Random Forest (CRL) via T-Learner. The findings should be interpreted within the European institutional context—characterized by the Banking Union, SFDR, and CSRD—and their external validity to less harmonized regulatory environments remains an open empirical question (BIS Financial Stability Institute, 2024).
The central contribution lies in suggesting that SupTech effectiveness depends not on the supervisory technology itself but on the organizational capacity of supervised banks to translate regulatory pressure into genuine disclosure improvements. Digital maturity emerges as the principal institutional condition, while RegTech operates as a substitution mechanism rather than a complement.
The SCM estimation provides evidence consistent with the interpretation that banks exposed to above-median SupTech supervision exhibit meaningfully lower greenwashing levels than their counterfactual trajectory, robust across placebo-in-space, placebo-in-time, and leave-one-out analyses. The delayed and accelerating post-treatment pattern with the GAP widening substantially from 2023 onward is consistent with the progressive entry into force of SFDR Level 2 standards (March 2021) and CSRD obligations (January 2025) rather than a pandemic-induced shock (Degryse et al., 2025; European Banking Authority, 2025).
The split-sample SCM and OLS analyses reveal that the effect is amplified by capital adequacy, ESG commitment, and regulatory stringency while attenuated for larger institutions. RegTech does not reinforce the SupTech effect: the evidence points to substitution, whereby banks with developed internal compliance infrastructure derive limited marginal benefit from external supervisory technology (Charoenwong et al., 2024). The Causal Random Forest confirms heterogeneity in treatment effects with digital maturity and FinTech adoption exhibiting the most consistent moderating gradients, which is consistent with legitimacy theory (Suchman, 1995), agency theory (Jensen & Meckling, 2019), and dynamic capabilities theory (Teece et al., 1997).
A remaining identification concern relates to reverse causality. Three elements mitigate this: (1) the treatment is defined at the supervisory authority level, making bank-specific reverse causality implausible (Bank for International Settlements, 2023); (2) the near-perfect pre-treatment fit confirms parallel pre-treatment trajectories (Abadie et al., 2010); (3) placebo-in-time tests confirm the 2019-specific timing of the divergence (Ben-Michael et al., 2022).
The methodological contribution lies in the progressive articulation of SCM, split-sample SCM, OLS, and CRL, each addressing a distinct empirical question representing, to the best of our knowledge, one of the first such frameworks applied to the SupTech–greenwashing nexus in European banking.
7. Implications and Managerial Perspectives
From a managerial perspective, the findings suggest that banking executives would benefit from investing in digital infrastructure not merely as a response to supervisory pressure but as a strategic foundation for translating that pressure into genuine disclosure improvements. Deploying compliance technologies as standalone signals of regulatory conformity, without the organizational capacity to respond substantively to supervisory scrutiny, appears to yield limited greenwashing-reduction benefits. For supervisory authorities and policymakers, the results support a two-pronged strategy: accelerating the deployment of AI-based supervisory tools in line with the EBA’s SupTech agenda while simultaneously accompanying the digital capacity development of supervised banks, particularly smaller institutions with limited technological maturity (European Banking Authority, 2025). These policy implications are specific to the European institutional context; in jurisdictions where ESG disclosure requirements are less stringent or SupTech adoption is nascent, the institutional preconditions identified here—particularly regulatory stringency and bank digital maturity—may differ substantially, and international supervisory bodies should consider these preconditions when promoting SupTech adoption in developing markets (BIS Financial Stability Institute, 2024).
Several limitations should be acknowledged. First, the SupTech index may capture a broader range of supervisory activities than those most directly relevant to ESG monitoring. Second, the greenwashing proxy, defined as the gap between min–max normalized ESG disclosure and performance scores, remains subject to the general limitations of sustainability data (Berg et al., 2022; Yu et al., 2020). Third, unobservable confounders at the country or authority level cannot be fully ruled out; a credible instrumental variable such as exogenous variation in national supervisory technology budgets would further strengthen causal identification (Athey et al., 2019). Fourth, results pertain specifically to the European context and may not generalize to less integrated regulatory environments.
These limitations motivate several avenues for future research: extending the analysis to non-European banking systems; incorporating more granular SupTech measures distinguishing NLP-based ESG analysis, satellite imagery monitoring, and AI-driven transaction surveillance; tracking the evolving relationship between Generative AI adoption and greenwashing as supervisory AI capabilities mature; and drawing on double machine learning or causal forests with instrumental variables to further strengthen causal identification (Athey et al., 2019; Wager & Athey, 2018).
Author Contributions
Conceptualization, M.T. and H.B.; methodology, M.T. and H.B.; software, M.T.; formal analysis, M.T. and H.B.; investigation, H.B.; data curation, M.T.; writing—original draft preparation, M.T.; visualization, M.T.; resources, H.B.; writing—review and editing, M.T. and H.B.; supervision, H.B.; project administration, H.B. All authors have read and agreed to the published version of the manuscript.
Funding
This research received no external funding.
Institutional Review Board Statement
Not applicable.
Informed Consent Statement
Not applicable.
Data Availability Statement
The data presented in this paper are available on request from the corresponding author.
Conflicts of Interest
The authors declare no conflicts of interest.
References
- Abadie, A. (2021). Using synthetic controls: Feasibility, data requirements, and methodological aspects. Journal of Economic Literature, 59(2), 391–425. [Google Scholar] [CrossRef] [Scilit]
- Abadie, A., Diamond, A., & Hainmueller, J. (2010). Synthetic control methods for comparative case studies: Estimating the effect of California’s tobacco control program. Journal of the American Statistical Association, 105(490), 493–505. [Google Scholar] [CrossRef] [Scilit]
- Anagnostopoulos, I. (2018). Fintech and regtech: Impact on regulators and banks. Journal of Economics and Business, 100, 7–25. [Google Scholar] [CrossRef] [Scilit]
- Arner, D. W., Zetzsche, D. A., Buckley, R. P., & Barberis, J. N. (2017). FinTech and RegTech: Enabling innovation while preserving financial stability. Georgetown Journal of International Affairs, 18, 47–58. [Google Scholar] [CrossRef] [Scilit]
- Athey, S., Tibshirani, J., & Wager, S. (2019). Generalized random forests. The Annals of Statistics, 47(2), 1148–1178. [Google Scholar] [CrossRef] [Scilit]
- Bank for International Settlements. (2020). Building robust and resilient suptech and regtech. Bank for International Settlements. Available online: https://www.bis.org/fsi/publ/insights32.pdf (accessed on 1 September 2026).
- Bank for International Settlements. (2023). Suptech and regtech: Leveraging technology for better regulation and supervision. Bank for International Settlements. Available online: https://www.bis.org/fsi/publ/insights45.pdf (accessed on 1 September 2026).
- Bao, Z., & Huang, D. (2021). Shadow banking in a crisis: Evidence from FinTech during COVID-19. Journal of Financial and Quantitative Analysis, 56(7), 2320–2355. [Google Scholar] [CrossRef] [Scilit]
- Benaissa, W. O., Mahjoubi, S., Ouahtita, F., & Kabbaj, S. (2025). Financial value through ESG compliance: Unpacking the RegTech advantage in the finance sector. International Journal of Accounting Finance Auditing Management and Economics, 6(8), 680–696. [Google Scholar]
- Ben-Michael, E., Feller, A., & Rothstein, J. (2022). Synthetic controls with staggered adoption. Journal of the Royal Statistical Society Series B: Statistical Methodology, 84(2), 351–381. [Google Scholar] [CrossRef] [Scilit]
- Berg, F., Kölbel, J. F., & Rigobon, R. (2022). Aggregate confusion: The divergence of ESG ratings. Review of Finance, 26(6), 1315–1344. [Google Scholar] [CrossRef] [Scilit]
- Birindelli, G., Chiappini, H., & Jalal, R. N.-U.-D. (2024). Greenwashing, bank financial performance and the moderating role of gender diversity. Research in International Business and Finance, 69, 102235. [Google Scholar] [CrossRef] [Scilit]
- BIS Financial Stability Institute. (2024). Suptech tools for prudential supervisors. Bank for International Settlements, Financial Stability Institute. Available online: https://www.bis.org/fsi/ (accessed on 1 September 2026).
- Broeders, D., & Prenio, J. (2018). Innovative technology in financial supervision (suptech): The experience of early users. Financial Stability Institute/Bank for International Settlements. [Google Scholar]
- Buckley, R. P., Arner, D. W., Zetzsche, D. A., & Weber, R. H. (2020). The road to RegTech: The (astonishing) example of the European Union. Journal of Banking Regulation, 21(1), 26–36. [Google Scholar] [CrossRef] [Scilit]
- Charoenwong, B., Kowaleski, Z. T., Kwan, A., & Sutherland, A. G. (2024). RegTech: Technology-driven compliance and its effects on profitability, operations, and market structure. Journal of Financial Economics, 154, 103792. [Google Scholar] [CrossRef] [Scilit]
- Cinceoglu, V., Strauß, N., Binder-Tietz, S., & Oliva Alvarado, I. (2026). Addressing greenwashing—The role of strategic communication in ESG reporting. International Journal of Strategic Communication, 20(2), 173–194. [Google Scholar] [CrossRef] [Scilit]
- Degryse, H., Huylebroek, C., & Van Doornik, B. (2025). The disciplining effect of bank supervision: Evidence from SupTech. Available online: https://publications.bof.fi/server/api/core/bitstreams/bf36c7b7-6498-4758-ad75-c052d963ef95/content (accessed on 1 September 2026).
- Delmas, M. A., & Burbano, V. C. (2011). The drivers of greenwashing. California Management Review, 54(1), 64–87. [Google Scholar] [CrossRef] [Scilit]
- DiMaggio, P. J., & Powell, W. W. (1983). The iron cage revisited: Institutional isomorphism and collective rationality in organizational fields. American Sociological Review, 48(2), 147–160. [Google Scholar] [CrossRef] [Scilit]
- Dimson, E., Marsh, P., & Staunton, M. (2020). Divergent ESG ratings. Available online: https://www.repository.cam.ac.uk/items/11d32fd3-5967-4fd1-b70a-1d7d4836c871 (accessed on 1 September 2026).
- European Banking Authority. (2021). Eba analysis of regtech in the eu financial sector (No. EBA/REP/2021/17). European Banking Authority.
- European Banking Authority. (2024). Eba work programme 2024. European Banking Authority. Available online: https://www.eba.europa.eu (accessed on 1 September 2026).
- European Banking Authority. (2025). Progress report on greenwashing monitoring and supervision. European Banking Authority. Available online: https://www.eba.europa.eu (accessed on 1 September 2026).
- European Central Bank. (2022). 2022 climate risk stress test. European Central Bank. Available online: https://www.bankingsupervision.europa.eu (accessed on 1 September 2026).
- European Central Bank. (2023). Supervisory banking statistics and digital supervision. European Central Bank. Available online: https://www.bankingsupervision.europa.eu (accessed on 1 September 2026).
- European Securities and Markets Authority. (2023). Esma strategy on sustainable finance 2023–2028. European Securities and Markets Authority. Available online: https://www.esma.europa.eu (accessed on 1 September 2026).
- European Union. (2019). Regulation (eu) 2019/2088 on sustainability-related disclosures in the financial services sector. Official Journal of the European Union, L 317, 1–16. Available online: https://eur-lex.europa.eu/eli/reg/2019/2088/oj (accessed on 1 September 2026).
- Financial Stability Board. (2020). Fintech and market structure in financial services. Financial Stability Board. [Google Scholar]
- Frost, J., Gambacorta, L., Huang, Y., Shin, H. S., & Zbinden, P. (2019). BigTech and the changing structure of financial intermediation. Economic Policy, 34(100), 761–799. [Google Scholar] [CrossRef] [Scilit]
- Galletta, S., Mazzù, S., Naciti, V., & Paltrinieri, A. (2024). A PRISMA systematic review of greenwashing in the banking industry: A call for action. Research in International Business and Finance, 69, 102262. [Google Scholar] [CrossRef] [Scilit]
- Giannetti, M., Jasova, M., Loumioti, M., & Mendicino, C. (2023). “Glossy green” banks: The disconnect between environmental disclosures and lending activities. In Banks: The disconnect between environmental disclosures and lending activities (December, 2023). ECB Working Paper 2023/2882. European Central Bank. [Google Scholar]
- Hair, J. F., Black, W. C., Babin, B. J., & Anderson, R. E. (2019). Multivariate Data Analysis (8th ed.). Cengage Learning. [Google Scholar]
- Hu, G., Xu, Z., & Chen, W. (2025). Comparative mapping of ESG greenwashing research between China and the global context: A CiteSpace-based bibliometric analysis. Frontiers in Sustainability, 6, 1738383. [Google Scholar] [CrossRef] [Scilit]
- Imbens, G. W., & Rubin, D. B. (2015). Causal inference in statistics, social, and biomedical sciences. Cambridge University Press. [Google Scholar]
- Jensen, M. C., & Meckling, W. H. (2019). Theory of the firm: Managerial behavior, agency costs and ownership structure. In Corporate governance (pp. 77–132). Gower. [Google Scholar]
- Lyon, T. P., & Montgomery, A. W. (2015). The means and end of greenwash. Organization & Environment, 28(2), 223–249. [Google Scholar] [CrossRef] [Scilit]
- Marquis, C., Toffel, M. W., & Zhou, Y. (2016). Scrutiny, norms, and selective disclosure: A global study of greenwashing. Organization Science, 27(2), 483–504. [Google Scholar] [CrossRef] [Scilit]
- Moodaley, W., & Telukdarie, A. (2023). Greenwashing, sustainability reporting, and artificial intelligence: A systematic literature review. Sustainability, 15(2), 1481. [Google Scholar] [CrossRef] [Scilit]
- Peng, Q., & Xie, Y. (2024). ESG greenwashing and corporate debt financing costs. Finance Research Letters, 69, 106012. [Google Scholar] [CrossRef] [Scilit]
- Pesaran, M. H. (2007). A simple panel unit root test in the presence of cross-section dependence. Journal of Applied Econometrics, 22(2), 265–312. [Google Scholar] [CrossRef] [Scilit]
- Regulation, E. (2020). Regulation (EU) 2020/852 of the European Parliament and of the Council of 18 June 2020 on the establishment of a framework to facilitate sustainable investment, and amending Regulation (EU) 2019/2088. Official Journal of the European Union, L 198, 13–43. Available online: https://eur-lex.europa.eu/eli/reg/2020/852/oj (accessed on 1 September 2026).
- Schons, L., & Steinmeier, M. (2016). Walk the talk? How symbolic and substantive CSR actions affect firm performance depending on stakeholder proximity. Corporate Social Responsibility and Environmental Management, 23(6), 358–372. [Google Scholar] [CrossRef] [Scilit]
- Sneideriene, A., & Legenzova, R. (2025). Greenwashing prevention in environmental, social, and governance (ESG) disclosures: A bibliometric analysis. Research in International Business and Finance, 74, 102720. [Google Scholar] [CrossRef] [Scilit]
- Stock, J. H., & Watson, M. W. (2002). Forecasting using principal components from a large number of predictors. Journal of the American Statistical Association, 97(460), 1167–1179. [Google Scholar] [CrossRef] [Scilit]
- Suchman, M. C. (1995). Managing legitimacy: Strategic and institutional approaches. Academy of Management Review, 20(3), 571–610. [Google Scholar] [CrossRef] [Scilit]
- Teece, D. J., Pisano, G., & Shuen, A. (1997). Dynamic capabilities and strategic management. Strategic Management Journal, 18(7), 509–533. [Google Scholar] [CrossRef] [Scilit]
- Wager, S., & Athey, S. (2018). Estimation and inference of heterogeneous treatment effects using random forests. Journal of the American Statistical Association, 113(523), 1228–1242. [Google Scholar] [CrossRef] [Scilit]
- Yu, E. P.-Y., Van Luu, B., & Chen, C. H. (2020). Greenwashing in environmental, social and governance disclosures. Research in International Business and Finance, 52, 101192. [Google Scholar] [CrossRef] [Scilit]
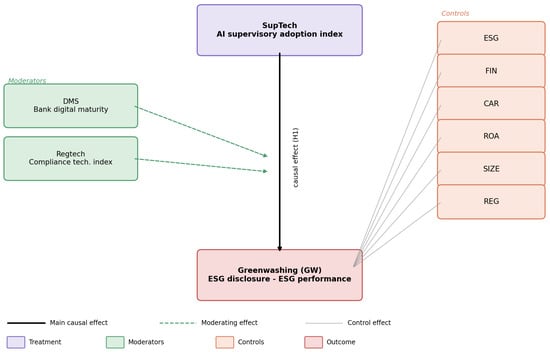
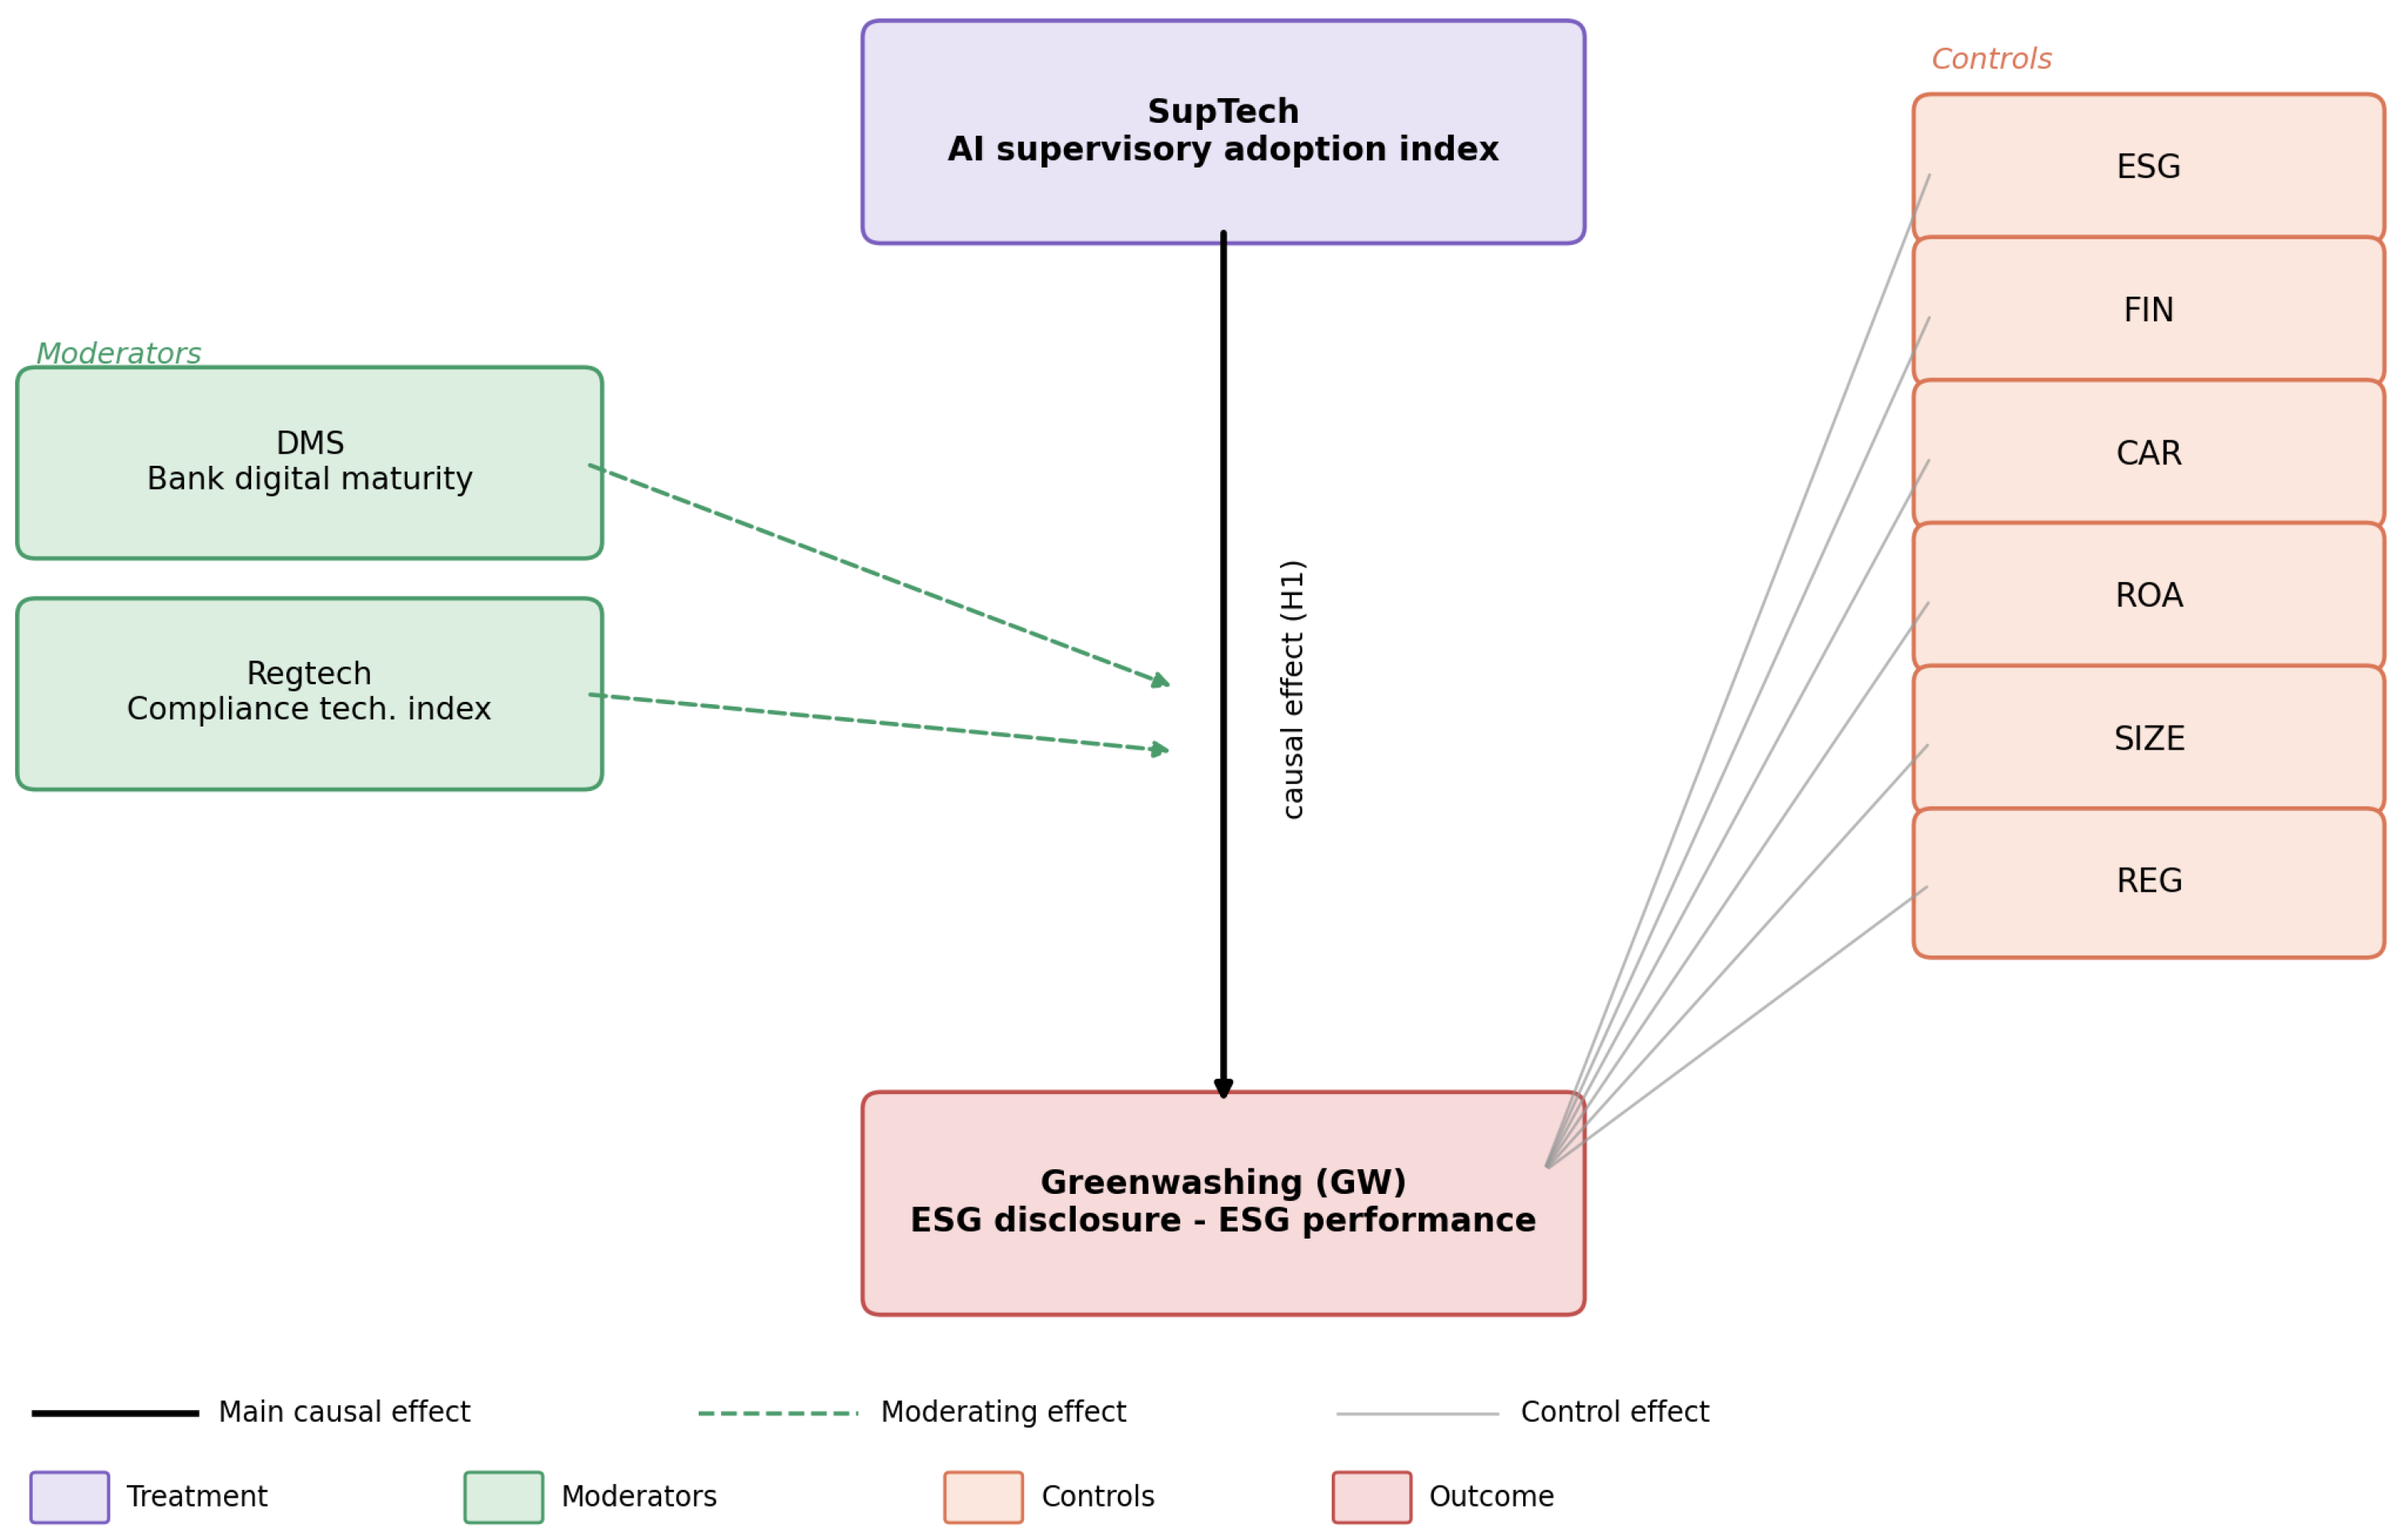
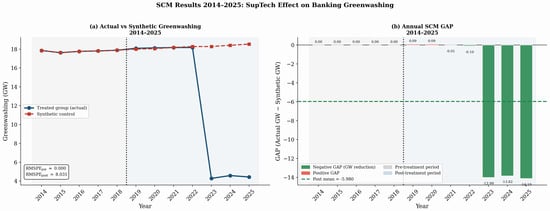
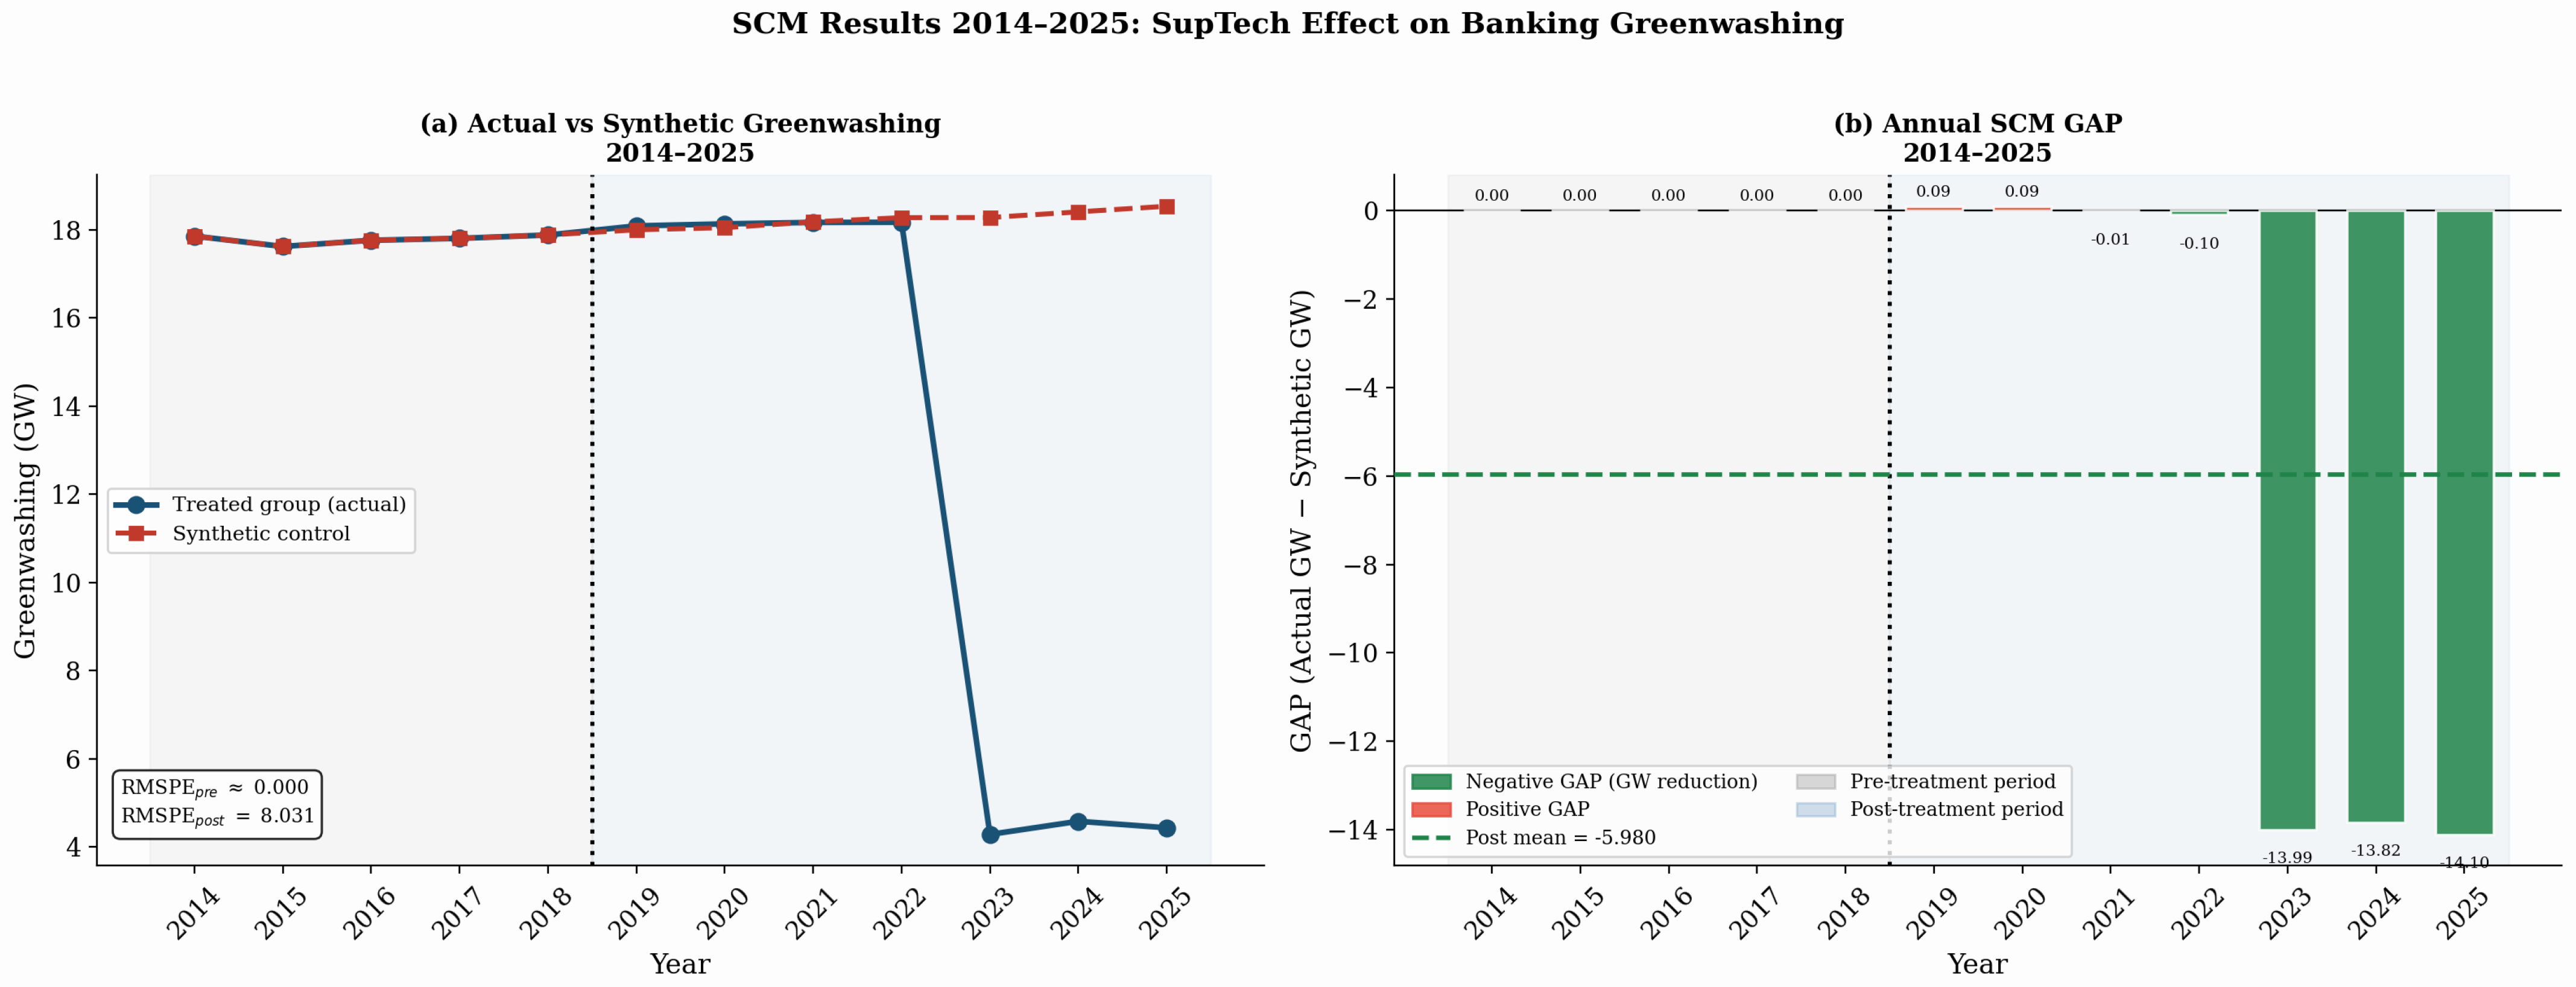
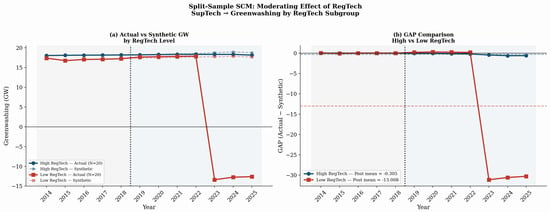
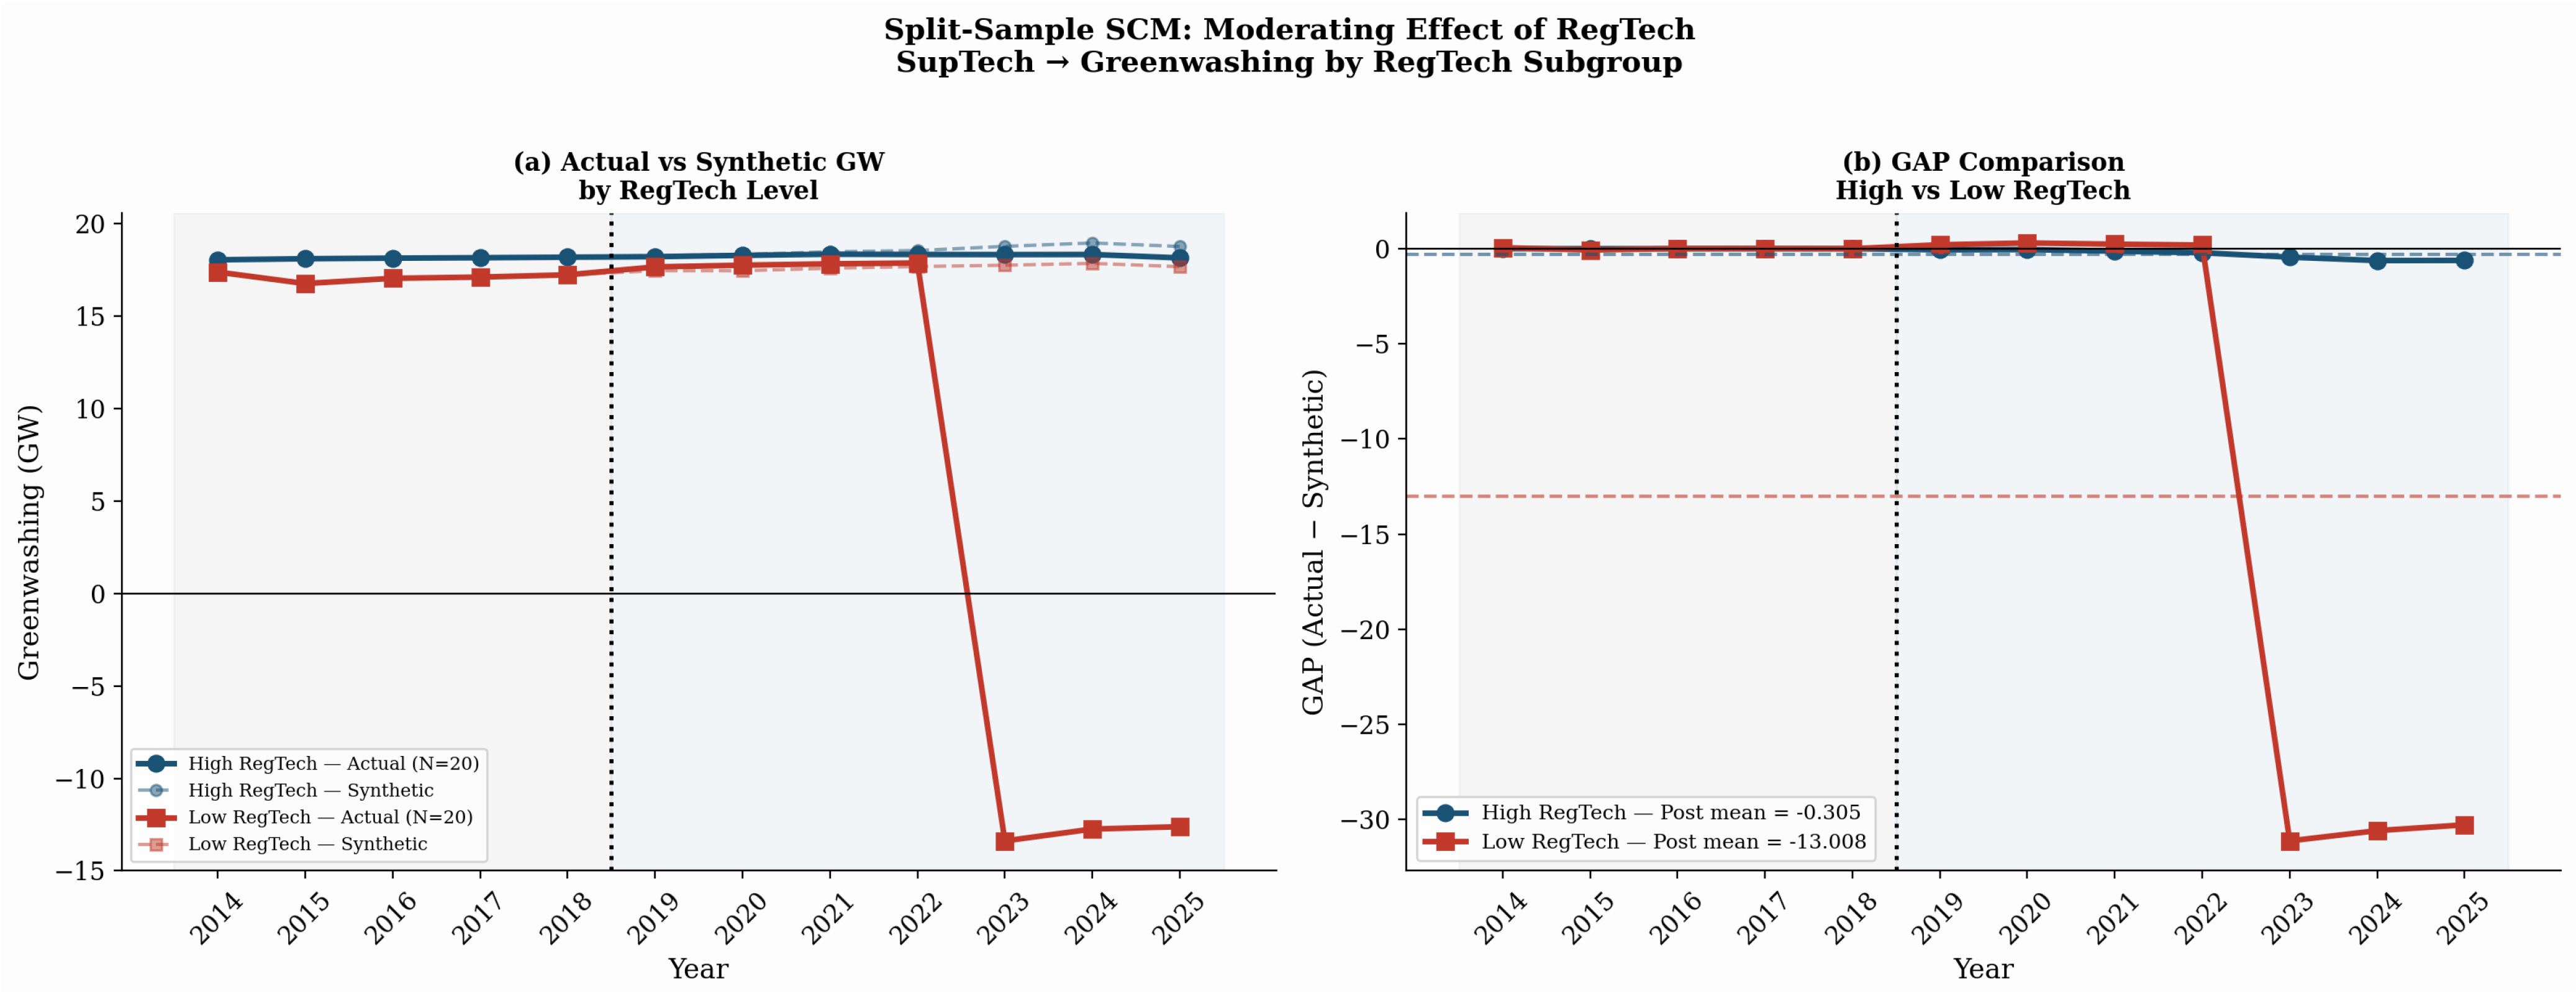
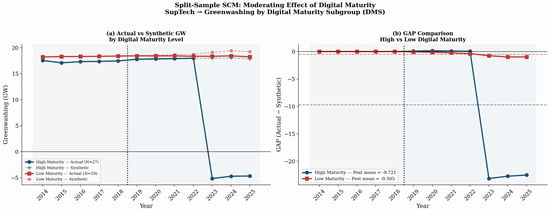
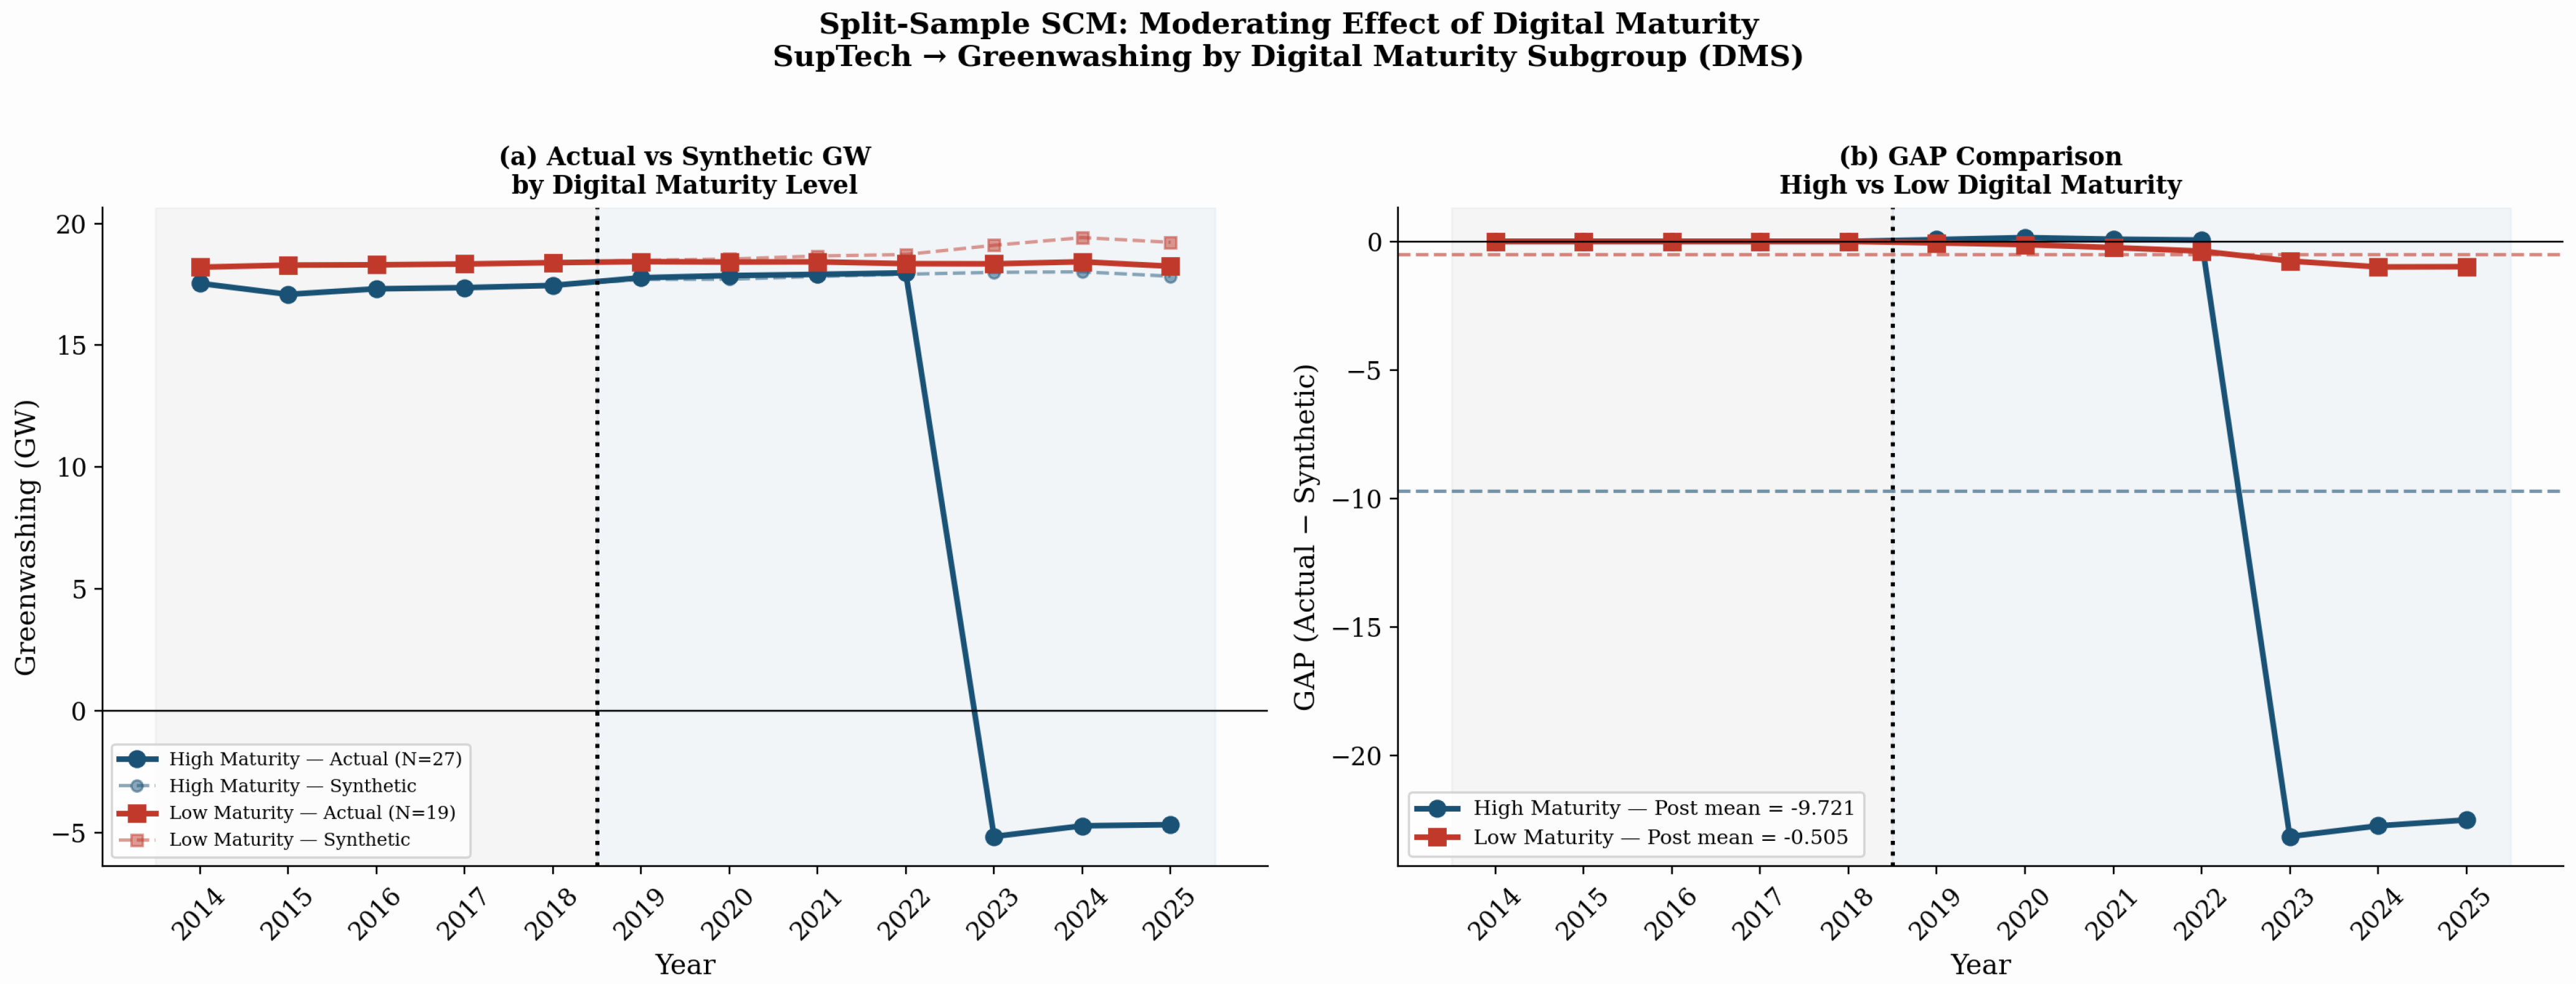
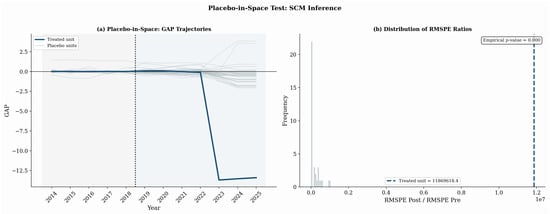
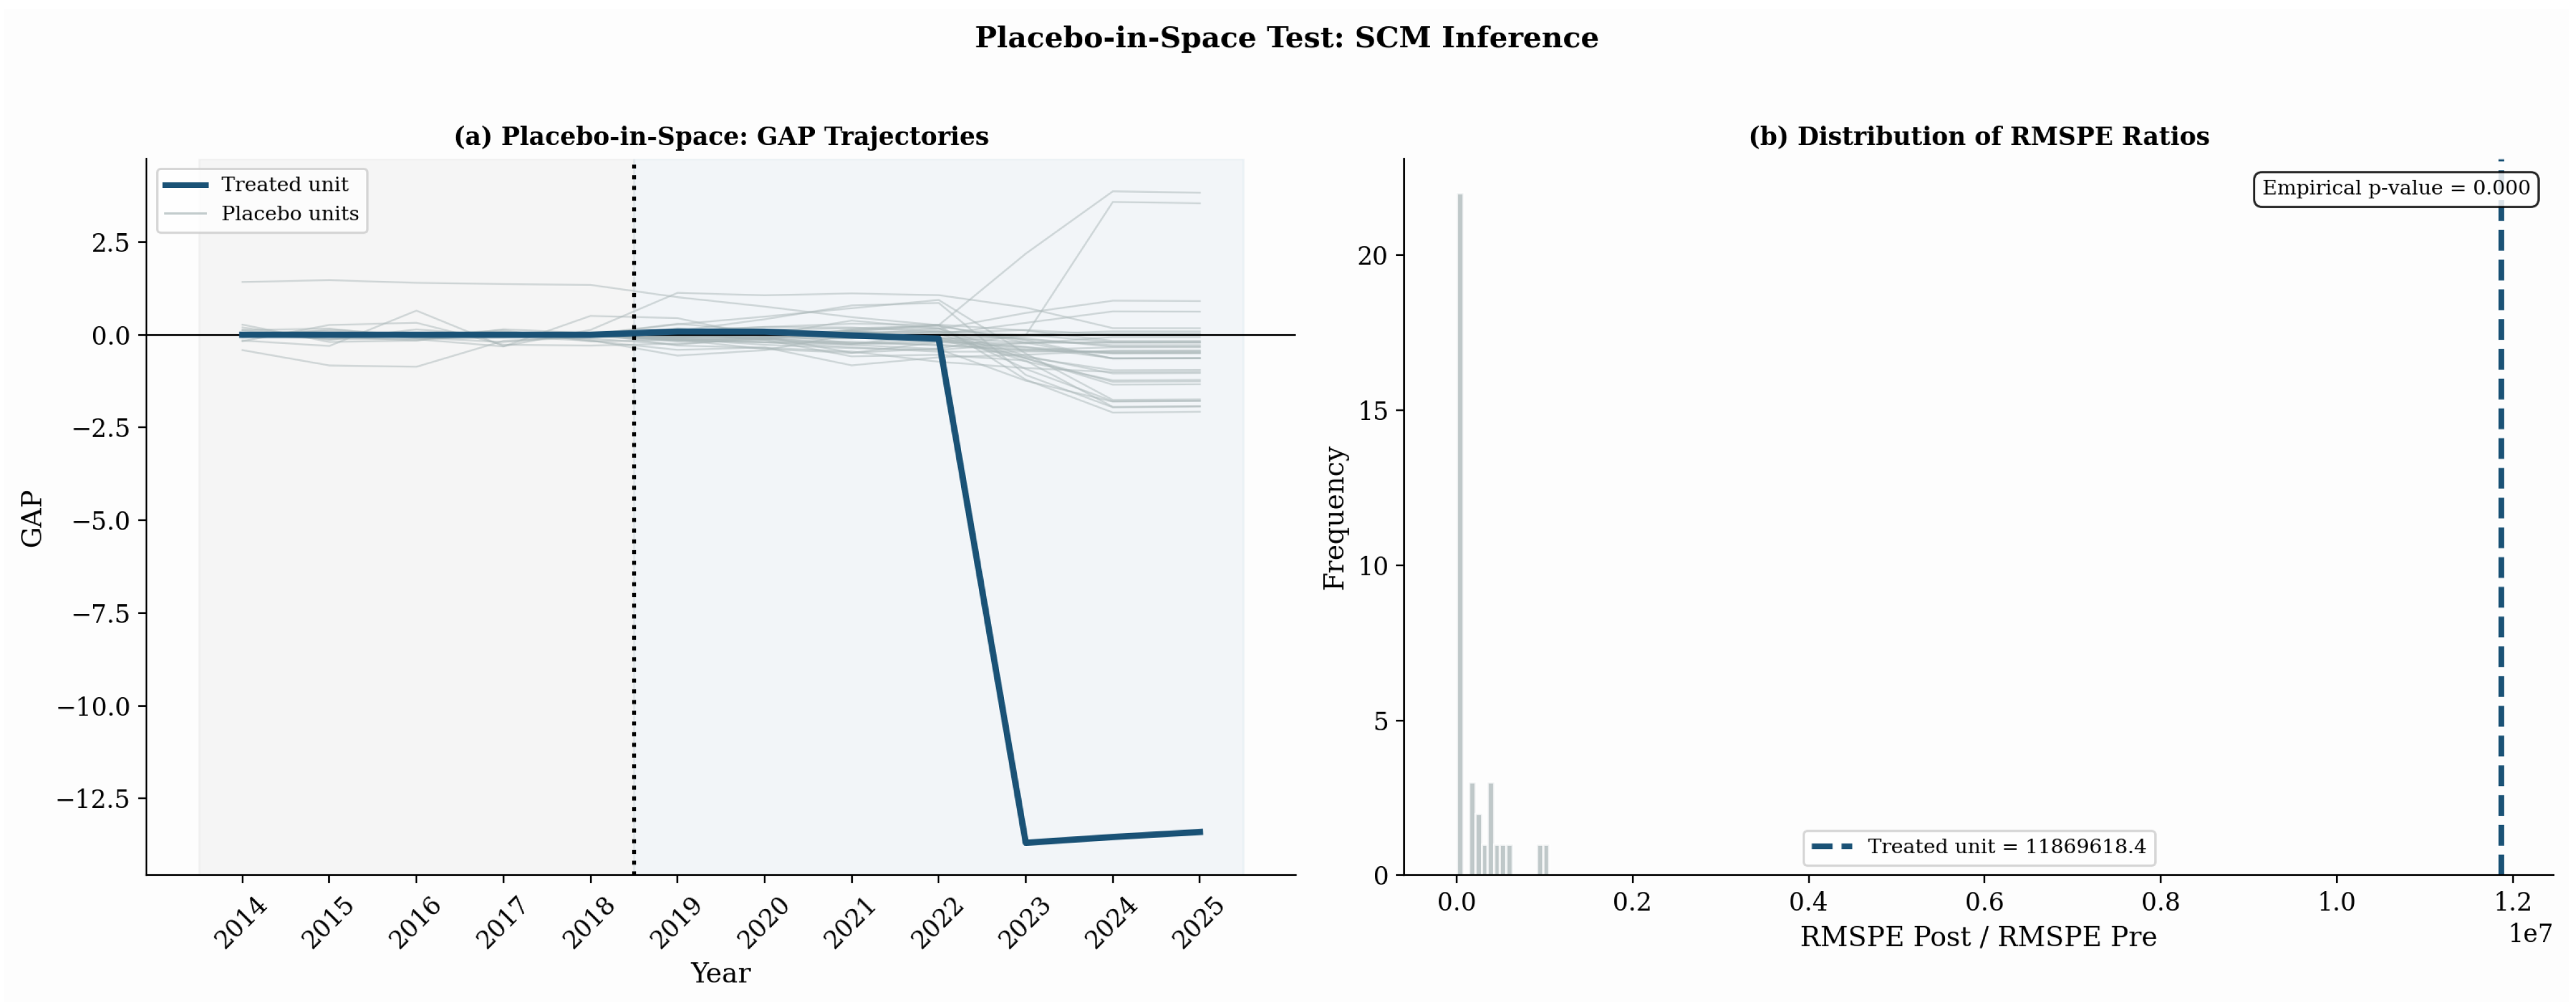
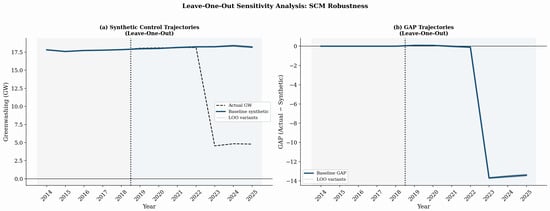
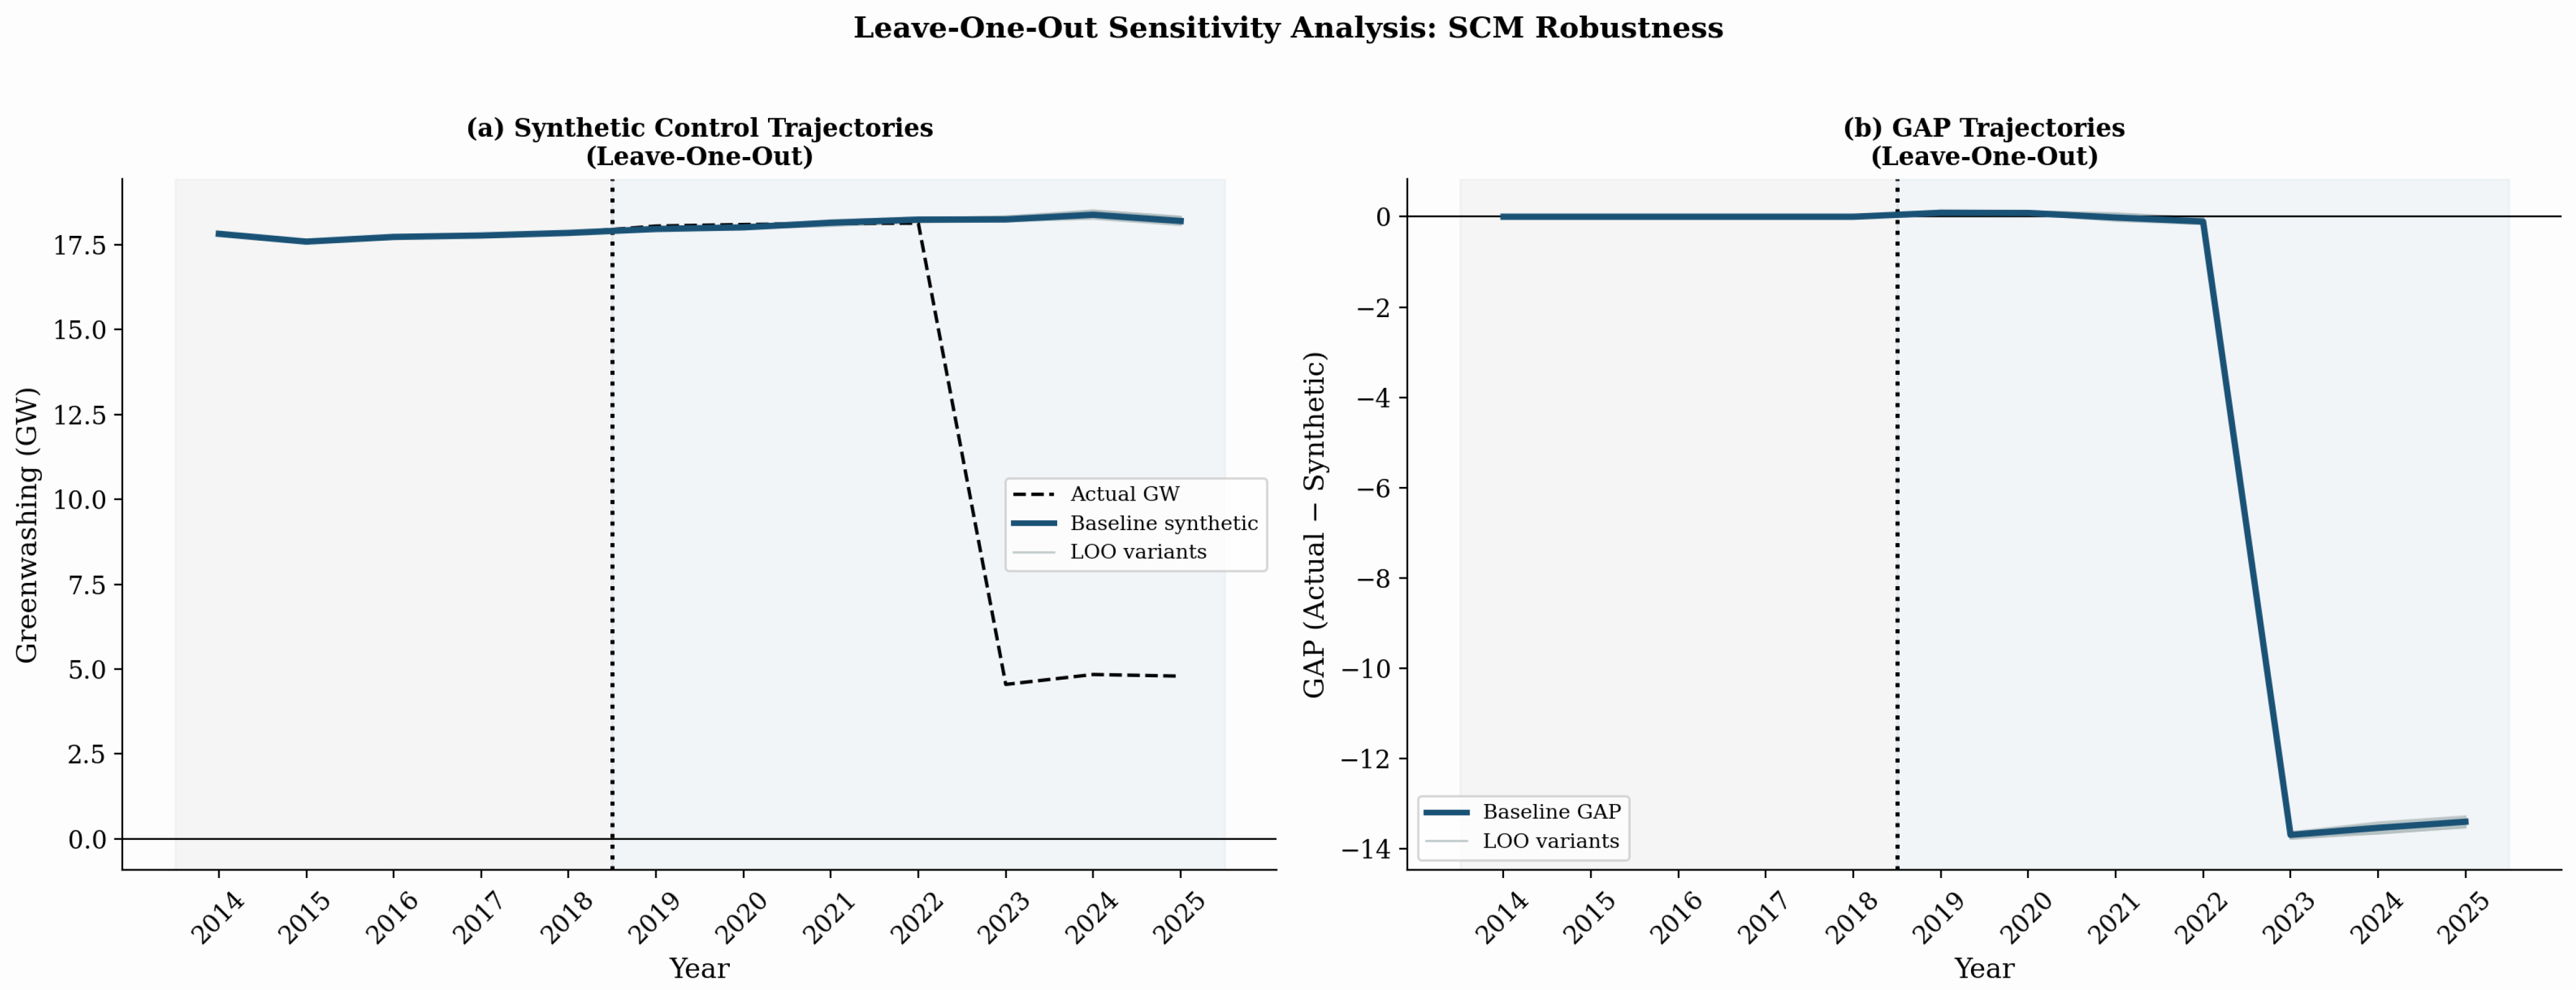

Disclaimer/Publisher’s Note: The statements, opinions and data contained in all publications are solely those of the individual author(s) and contributor(s) and not of MDPI and/or the editor(s). MDPI and/or the editor(s) disclaim responsibility for any injury to people or property resulting from any ideas, methods, instructions or products referred to in the content. |
© 2026 by the authors. Licensee MDPI, Basel, Switzerland. This article is an open access article distributed under the terms and conditions of the Creative Commons Attribution (CC BY) license.