


Abstract
The debate around corporate sustainability has become increasingly heated, with opinions ranging from denial of climate change to fatalistic acceptance of an impending collapse of civilization. This study examines how multinational enterprises, which contribute to nearly half of global GDP, internalize knowledge of planetary boundaries and take action within the organization or externally with investors, industry bodies, and policymakers. The research is grounded in empirical analysis of longitudinal data on two large samples of multinationals. It is found that, despite warnings from scientists about breaching planetary boundaries, multinationals, at best, follow an incremental approach to sustainability initiatives that collectively fail to drive positive global change. This well-entrenched practice remains unquestioned by external stakeholders, such as regulators, investors, and lenders. The research explains this behavior through (a) our inability to link global scientific findings to non-financial performance imperatives for individual businesses, and (b) our reliance on traditional enterprise risk management models that are less effective in a non-ergodic world.
1. Introduction
Business activities of multinational enterprises (MNEs) and their affiliates across countries dominate a large part of the global economy. These include targeting markets across different jurisdictions, moving capital across nations, and orchestrating global value chains (GVCs). An MNE’s GVC involves sourcing inputs and carrying out value-adding activities across geographies through its own entities and partners in the ecosystem. Consequently, considering the variable elements in an MNE’s business landscape, spanning multiple jurisdictions, a resilient MNE requires managing risks arising from macro factors (e.g., political sentiment, regulatory interventions), industry factors (e.g., competitor moves, changing customer needs), and company-level factors (e.g., operational disruptions, human failures).
Industry research indicates that as of 2026, business interruption (including supply chain disruption), regulatory changes (e.g., tariffs, new directives, sustainability requirements), natural catastrophes (e.g., storm, flood, earthquake, wildfire), and climate change (e.g., physical, operational, and financial risks as a result of extreme weather) are among the top 10 risks global businesses face (Allianz Commercial, 2026). Enterprise risk management (ERM) practices are expected to enable an MNE to take a company-wide perspective to identify and evaluate risks, establish appropriate responses through an integrated framework, and thus reduce surprises and related costs or losses while benefiting from favorable developments (Gates, 2006; Committee of Sponsoring Organizations (COSO), 2017).
However, recent literature indicates that adopting ERM and enhancing organizational resilience are not closely linked, primarily because ERM’s over-emphasis on reporting, its lack of influence on strategic decision-making, adherence to static processes, treating risks as discrete items, and over-reliance on models (Fraser et al., 2024). For example, in a model-based, static approach, risks are often treated as discrete items: generated or extracted from a risk universe, evaluated separately using a set of criteria, and ranked. Subsequently, response mechanisms are developed in a risk assessment workshop. However, risks in any business organization, especially in the context of an MNE, are interconnected and can cascade, potentially leading to impacts not captured by typical risk management models.
One category of risks that strongly demonstrates this interconnectedness stems from changing environmental factors. In recent times, businesses have identified specific, discrete risks associated with the scarcity of natural resources, stricter compliance requirements on energy and water consumption, waste and effluent management, the carbon footprint of products and services, and the adoption of circular economy practices (Shad et al., 2019; Gündoğdu et al., 2023). However, an integrated perspective on how to address the combinatorial effect of financial and impact material topics, encompassing both the own business and the extended value chain, is largely absent. While the consequences of breaching multiple planetary boundaries have drawn attention from environmental scientists over the years, businesses, including large multinationals, appear oblivious to these perma-crises or poly-crises. In fact, scholars observe a paradox: while corporations invest in eco-efficiency, ecological data indicate worsening conditions that could lead to crucial business disruptions, suggesting a disconnect in effectively addressing environmental issues (Whiteman et al., 2013).
The growing sustainability-related risks arising from planetary boundary transgressions underscore the vital role that Enterprise Risk Management (ERM) may play. Business executives in charge of implementing ERM, while competent at managing traditional business risks, are largely unfamiliar with sustainability-related risks, and organizations lack the processes or tools to manage them methodically (Schulte & Hallstedt, 2018). An enhanced ERM can gradually help a company build the capacity to manage the risks and uncertainties associated with multidimensional sustainability challenges, including climate-related risks, according to a study of a Swedish mining company that underwent a strategic transformation towards full decarbonization (Monazzam & Crawford, 2024). An extended ERM to cover climate change-related risks would require risk identification, measurement, and aggregation, as well as an integrated evaluation of all such material risks (Patnaik & Fabrizio, 2023).
This paper uses the lens of planetary boundaries to study corporate sustainability behaviors and actions of large MNEs. Large MNEs, especially Fortune 500 companies, face considerable risks from integrated consequences of environmental changes due to their distributed, global presence. On the other hand, they have access to resources and capabilities to adapt and transition their business models, and can also influence positive changes in the broader business ecosystems, shaping industry practices and regulatory frameworks. Thus, studying these MNEs would provide insights into emerging best practices that other businesses can adopt. As a comparative study, the researcher also examines the corporate sustainability behaviors of smaller organizations to determine whether these smaller firms demonstrate greater agility than their larger counterparts and can serve as agents of the sustainability transition.
The results show that, despite warnings from scientists about breaching planetary boundaries, MNEs, at best, follow an incremental approach to sustainability initiatives that collectively do not contribute to positive global change. This well-entrenched behavior is also supported by external stakeholders, such as regulators, investors, and lenders. This behavior is explained through the dominant narrative of wellbeing, the uneven policy paradigm across jurisdictions, and the lack of a systems-thinking approach to environmental issues. Subsequently, the author advocates that MNEs may blend environmental science and business imperatives by adopting biosphere stewardship, collectively monitoring measures such as economic intensity boundaries, and evolving traditional ERMs to address emergent business risks arising from the environment.
2. Literature Review and Hypotheses Development
2.1. Planetary Boundaries and Business Organizations
The concept of Planetary Boundaries (PBs) was introduced in 2009 by a group of internationally renowned scientists. They identified and quantified a set of nine PBs—Climate Change, Biosphere Integrity, Land-System Change, Freshwater Use, Biogeochemical Flows, Novel Entities, Ocean Acidification, Atmospheric Aerosol Loading, and Stratospheric Ozone Depletion—within which humanity could continue to evolve so that Earth’s resilience is protected. The rationale is explained by the exponential increase in human activities, such as population growth, real GDP, and energy consumption, and the resulting effects on Earth system indicators like carbon dioxide levels, surface temperature, and ocean acidification. Crossing these boundaries could lead to abrupt or irreversible environmental changes with serious consequences for humankind. Recent data indicate that as of 2025, we have breached seven of the nine PBs, exposing human civilization to a critical tipping point (Sakschewski et al., 2025).
Despite more than a decade since their introduction, research on PBs and their societal impacts has largely been confined to scientific journals and policy papers. Scholars observe that business research is disconnected from macro-ecological processes and fails to measure the aggregate impact of collective corporate activities on many threshold points, such as biosphere integrity or land system change (Whiteman et al., 2013; Williams et al., 2025). Consequently, the business risks (and potential business opportunities) that could emerge from breaching these thresholds are under-researched as well. The biggest challenge in theorizing and measuring the impact of the apparent boundary conditions set by PBs is the lack of a systems perspective for integrating insights from these macro indicators from natural sciences into business activities. The siloed approach to assessing one’s own sustainability performance (positive and negative impacts) fails to guide business organizations in developing resilience towards global and regional environmental changes. Thus, it is also essential to have multilateral entities and industry bodies to coordinate the implementation of safe operating space, transforming economic activities across value chains in different industries (Clift et al., 2017).
In pursuit of a safe operating space for economic activities, Butz et al. (2018) propose the concept of Economic Intensity Boundaries (EIBs) to bridge the gap between biophysical science and the financial economy. An EIB-centric approach can guide investors to navigate future resource constraints and benefit from stricter regulations by identifying companies whose business models are compatible with Earth’s non-negotiable biophysical constraints.
The required transformation of economic activities involves a shift towards a strongly sustainable, post-growth economy that recognizes the embeddedness of economies within nature and the need to consider ethical implications (Nesterova, 2021). In the following sub-section, relevant literature on business strategy in a post-growth economy is explored.
2.2. Dealing with the Growth and Transition Paradox
While global economic growth has led to wealth creation, employment generation, and advancement in quality of life, the question of sustaining perpetual economic growth on a finite planet has been debated for decades due to unprecedented negative impacts on vital planetary systems. While businesses recognize the importance of transitions, including energy transitions, these initiatives may saddle them with stranded assets (Linnenluecke et al., 2015; Doh et al., 2021).
Paradoxically, for business organizations and other economic entities, economic growth remains a core strategic goal (Edwards, 2021). Strategies in business organizations explore organic and inorganic means to pursue growth, measured through traditional performance metrics such as revenue/profit/assets/workforce and market capitalization, as well as efficiency ratios (e.g., ROS, ROA, ROIC).
Alternatives proposed in a post-growth economy include (a) a-growth, which argues for ignoring GDP information and focusing on balanced environmental, social, and economic policies independent of their effects on economic growth, and (b) degrowth, which recommends a downscaling of the economy to make it consistent with biophysical boundaries (Van den Bergh & Kallis, 2012). These alternative proposals shift an organization’s business strategy to an embedded approach, reconceptualizing growth as qualitative maturation and social–ecological–economic well-being (Edwards, 2021). Such an embedded approach calls for strategic multidexterity, resilience thinking, business models for social-ecological–economic balance, and local embedding that factor in the needs of internal and external human and ecological stakeholders.
In essence, post-growth approaches are nuanced and require non-binary thinking to transition from prevailing business models to regenerative business models. These futuristic business models are expected to operate with lower throughput of matter and energy, less waste and pollution, and more clean energy forms, valuing biodiversity and life, and nature-based economic activities (Buch-Hansen & Nesterova, 2023). The following sub-section reviews the literature on MNE sustainability initiatives and how they address the grand challenges of transgressing PBs, exogenous business risks arising from these transgressions, and whether these initiatives support the transition to a regenerative economy.
2.3. Sustainability Initiatives at MNEs
MNEs, especially transnational enterprises, can be considered as global keystone actors due to their disproportionate influence on the Earth system. For example, research shows that about 70% of greenhouse gas emissions are attributable to 100 MNEs and state-owned monopolies that produce coal, oil, and gas (Folke et al., 2019). On the other hand, due to their dispersed business landscapes, MNEs are forced to navigate high levels of global and regional uncertainties with varying degrees of embeddedness in different institutional settings (Ivanaj et al., 2017). Therefore, whether they are manufacturers, suppliers, or financial players, as global keystone actors, MNEs’ sustainability initiatives must be considered if human civilization has to operate within the PBs. Interestingly, a large, longitudinal study on MNEs’ sustainability practices indicates that, while they might promote desirable practices such as renewable energy transition, many MNEs also take advantage of lax regulations in certain host countries to establish environmentally polluting activities (Liu et al., 2025).
Sustainability initiatives in business organizations, including MNEs with global presence, are broadly guided by the concepts of materiality assessment and the ESG framework. Materiality assessment, especially the double materiality assessment with the Impact, Risks and Opportunities (I-R-O) framework, required by the European Sustainability Reporting Standards (ESRS), demands that a firm identify and report the potential and actual impacts from its activities, and potential and realized risks and opportunities for its business (Bux et al., 2025).
On the other hand, independent sustainability rating agencies assess a company’s performance on the three pillars, E (Environmental), S (Social), and G (Governance), and develop an objective rating of the company on sustainability performance (Antolín-López & Ortiz-De-Mandojana, 2023). Rating agencies primarily rely on publicly available information about the company’s business operations on a large number of non-financial measures, and use analytical tools to arrive at a rating for a company. They may consider additional inputs from the company to refine their ratings. The rating agencies also factor in the criticality of different sustainability topics in the company’s business and how other firms in the industry are performing on those parameters. The ESG ratings, in turn, serve as inputs for investors to assess the company’s IRO and to guide investment decisions. As a result, these ratings and their breakdowns on different ESG parameters become important drivers in shaping the company’s sustainability initiatives. Empirical studies also indicate that firms with poorer ESG performance relative to their peers may experience negative long-term economic performance, and the negative relationship between ESG risk and corporate sustainable growth is particularly apparent for firms in environmentally sensitive industries (Busch et al., 2016; Teng et al., 2021).
In other words, while MNEs are driven to engage with the grand challenges of long-term uncertainty due to internal self-interest and external regulatory and reputational pressures, responses can be proactive or reactive, leading to internal resilience or external societal impact (Averchenkova et al., 2016). Analysis of Carbon Disclosure Project data of a large sample of MNEs shows that these organizations can relate physical changes in the business environment or natural resources to business continuity risks, regulatory changes to operational costs, and reputational pressures to market capitalization (Gasbarro et al., 2017).
Studies on energy transition at MNEs indicate that regulatory and normative pressures in an MNE’s home country can push the company towards the adoption of renewable energy sources, and that environmental stewardship, recombination of firm-specific advantages within the firm, can facilitate such transitions in both home and host countries (Erin Bass & Grøgaard, 2021; Hartmann et al., 2021). In addition, while focusing on sustainability targets and monitoring them internally may improve a business’s energy intensity, empirical studies show that many site-specific abatement initiatives are impeded by credit constraints (De Haas et al., 2025).
2.4. Exploring Underexplored Research Areas
MNEs today not only face an increasingly complex and volatile geopolitical environment but also need to address emergent business risks arising from climate change and other forms of environmental degradation. This calls for global collaboration in a world marked by institutional pluralism and regional/national disparities in requirements and expectations (George & Schillebeeckx, 2022).
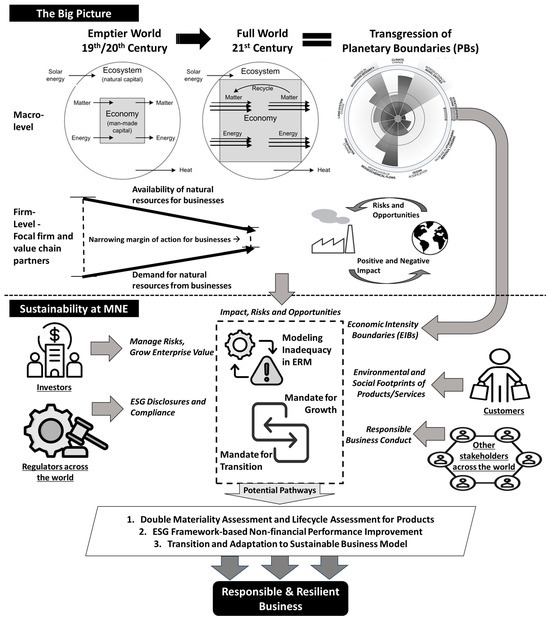
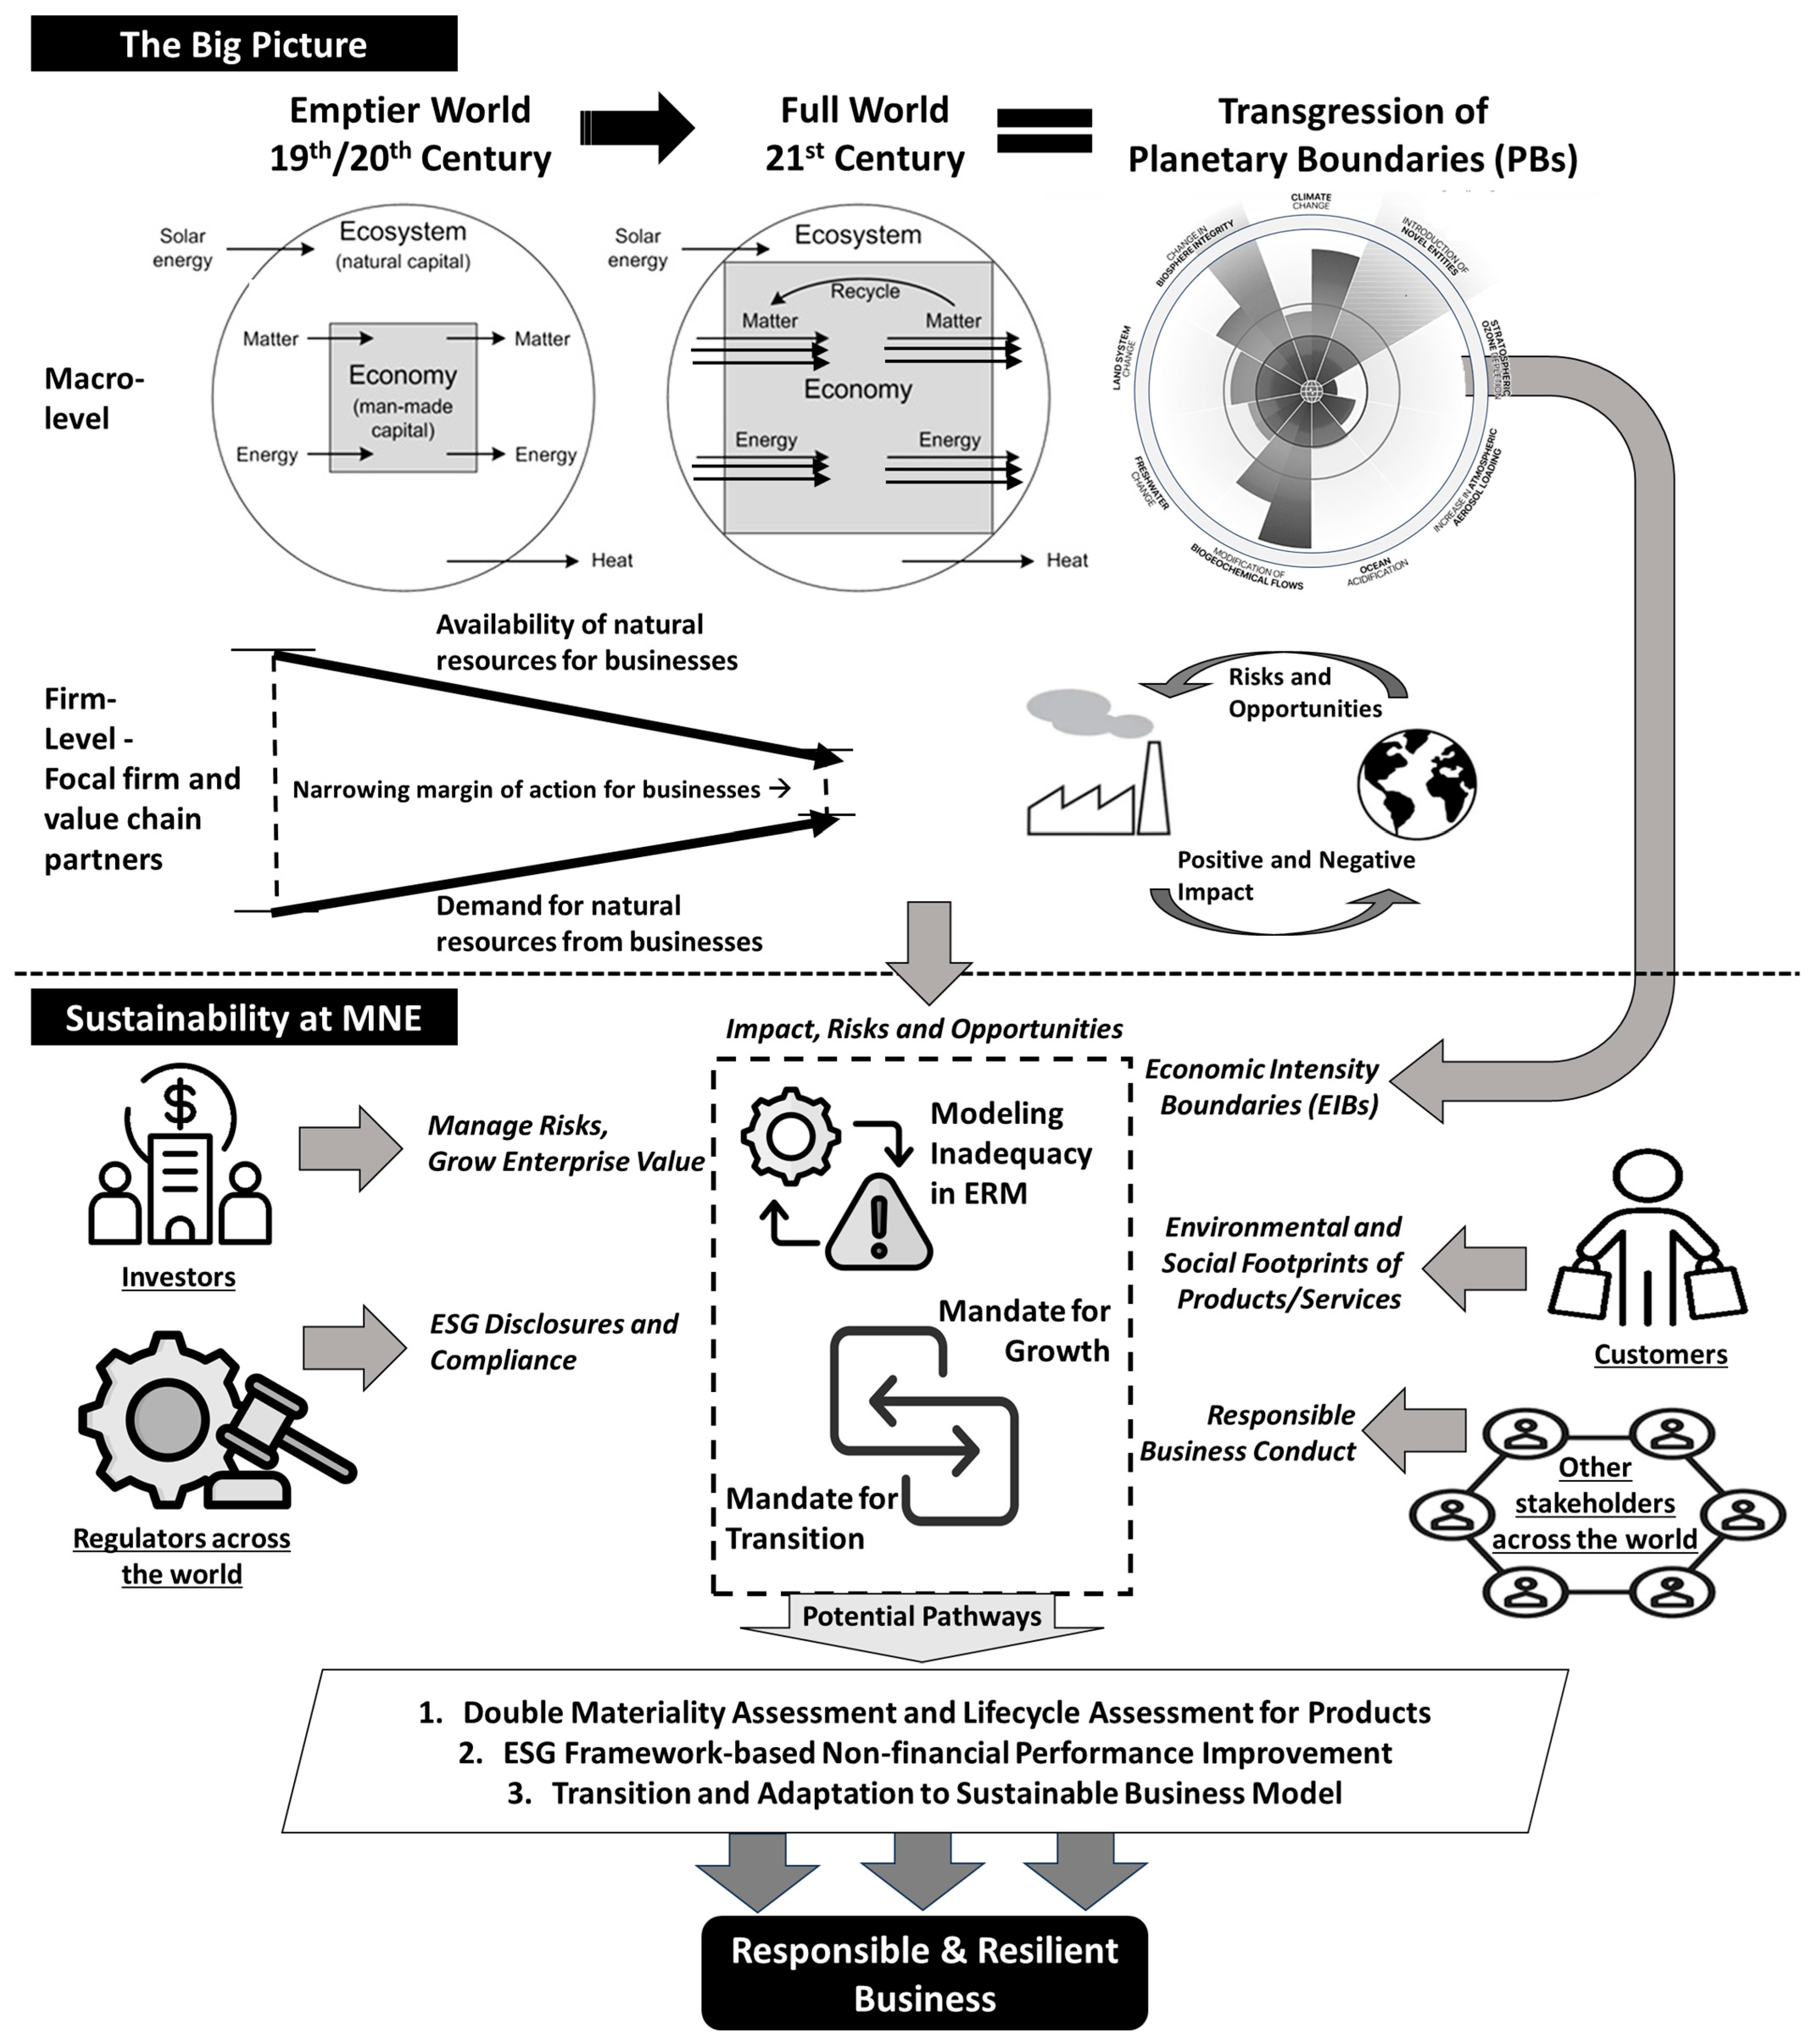
Synthesizing the extant literature to date yields a contextual framework that summarizes the challenges facing business organizations today. This is presented in Figure 1. The top part of the schematic provides a big-picture view of 21st-century society, business, and the ecosystem. As economic activities continued to grow over the centuries on a finite planet, the planetary boundaries were compromised, transforming the planet into a Full World (Daly, 2015). At the firm level, businesses started recognizing the shortage of natural resources. The bottom part of the schematic illustrates the diverse expectations of different stakeholders, constraints imposed by the natural environment, the paradox of growth and transition mandates, and the limitations of present-day ERMs. It also shows tentative, potential pathways to evolve into responsible and resilient business organizations.
Figure 1.
Contextual reference framework for this study. Source: Author’s conceptualization based on synthesis of literature.
At the prescriptive level, sustainable business models (SBMs) that MNEs may need to transition into must be nested within PBs, which can be seen as a safe operating space for businesses. Realizing such SBMs requires the co-creation of value by economic actors who engage in boundary-spanning activities, shifting rigid organizational barriers to flexible, fluid ones (Bjartmarz & Bocken, 2024). However, normative practices, as evidenced in the literature, are less impressive. While regulators and other economic actors acknowledge the seriousness of the deteriorating environmental factors, political desire and ability to act and implement stringent regulatory measures vary across countries. This variation makes it difficult for an MNE to operationalize a unified, transformative approach that could help transition to a resilient, responsible business model for the whole organization. As a result, MNEs tend to adopt a piecemeal, incremental, and instrumental approach, focusing on ESG-centric initiatives and disclosures. Consequently, while financial market players are increasingly incorporating ESG factors into their investment decisions, organizational realities do not appear to be changing in ways that promote more sustainable business practices (Busch et al., 2016). In fact, the extant literature does not establish whether large MNEs have been able to set benchmarks or establish industry best practices for transitioning to SBMs.
Therefore, this research examines how business organizations pursue their respective transformative agendas that are aligned with PBs (or their translated measures, EIBs). Towards this, it is recognized that a business organization’s performance in energy consumption, water consumption, emissions, and waste management contributes to EIBs associated with several of the nine PBs. Thus, the scope of this study is restricted to MNEs’ performance on these four dimensions. A comparative study of the sustainability practices of large MNEs and much smaller firms in similar industries is proposed to identify the underlying antecedents of SBM transition. The rationale for assuming the presence of such a performance difference is as follows. As large MNEs have greater resource availability and deeper know-how, they are better positioned to demonstrate superior practices through greater agility and innovation capacity. In addition, a large MNE with a diverse shareholder base and other stakeholders may find it more compelling to adopt a sustainability or transition agenda. And that can also facilitate its compliance with sustainability-related regulatory reporting requirements. On the other hand, smaller firms might not have the necessary resources to pursue a well-developed sustainability agenda to start with, but they can be nimble and adaptive fast followers to improve their sustainability performance.
The research finds some indirect support from the literature for this initial position. Small firms are often more embedded in communities (Nesterova, 2021) and thus may face lower cognitive barriers to receiving inputs from society and the environment. Van der Waal et al. (2021) find that smaller MNEs have higher levels of innovation-related patents and patents addressing unmet sustainable development needs than their larger counterparts. Similarly, Hug et al. (2022) find that transformative enterprises are primarily smaller companies that act as industry-wide change agents, pursue alternative goals (beyond profit), and adopt a sufficiency orientation and independence in setting their strategic directions. However, following Nesterova (2021), it should be noted that it is not necessarily the size of the firm that determines its potential for change, but rather its practices and values.
We can also draw insights from the CSR literature on behavioral differences between larger and smaller firms. Organizational cost theory suggests that, compared to larger firms, smaller firms often have organizational characteristics, such as flatter hierarchies, informal communication, and stronger identity. In the context of CSR, this facilitates the more effective internal implementation of CSR-related practices across core business functions in smaller firms, even though larger firms have more organizational resources for external communication and reporting on CSR (Baumann-Pauly et al., 2013). The less responsible actions on the ground (implementation gap) in larger firms are due to higher control and coordination costs associated with implementing CSR across decentralized divisions, functions, and value chains, which contrast with the relatively lower costs of external communication of CSR (Wickert et al., 2016). In an empirical study of disclosure and credibility of CSR information published by firms, Fernandez-Feijoo et al. (2014) find that large firms primarily belong to the Chattering type, characterized by high disclosure and low credibility. In a similar manner, Aras-Beger and Taşkın (2021) suggest that larger firms may focus on the base of Carroll’s CSR pyramid (i.e., economic and legal responsibilities), while their smaller counterparts may focus on the peak of Carroll’s CSR pyramid (i.e., ethical and philanthropic responsibilities).
The research question and insights from the extant literature yield a set of hypotheses regarding the performance of these two groups of companies. While the focus is on non-financial performance (specifically, environmental sustainability), this study examines a single financial measure in its hypotheses.
H1.
Large multinationals can leverage their superior market power and access to resources to achieve better financial returns compared to their smaller counterparts.
The key non-financial performance measures of a business organization that relate to the PBs or EIBs can be categorized under energy, water, emission, and waste management. For a business entity, energy transition towards renewable sources is a critical initiative. It is also critical to assess whether the business has an energy policy, whether it is improving energy consumption per capita, and if it has defined targets for energy efficiency. A study conducted by the International Energy Agency (IEA) finds that implementing energy efficiency measures reduces maintenance and operational expenses, increases productivity, strengthens resilience to energy price fluctuations, and boosts brand reputation (International Energy Agency (IEA), 2026). This is more pronounced in sectors where energy makes up a larger share of total costs. Apart from reducing negative externalities, these energy efficiency initiatives have a significant impact on market access (domestic and international) and financing. However, this study suggests that large companies typically adopt long-term, comprehensive strategies, with well-defined policies, backed by greater investment, in-house expertise, and formalized energy management systems. Meanwhile, smaller companies, with limited resources, tend to implement individual measures incrementally. We argue that, despite the grand first-mover approach, larger firms may lose momentum due to the complexity of organizational control and coordination. Therefore,
H2a.
Larger multinationals tend to lead in developing policies on energy consumption, setting targets on energy efficiency, and consequently demonstrate superior performance over their smaller counterparts on energy consumption.
H2b.
Smaller multinationals can emerge as fast followers over time to close their performance gap with their larger counterparts on energy-related metrics.
The researcher proposes the third hypothesis on water policy, consumption, and the setting of efficiency targets, similar to energy policy, consumption, and efficiency. A focus on policy and targeting water consumption and recycling not only reduces operational expenses but also helps comply with evolving standards, avoiding potential fines or restrictions, and enhances reputation, which in turn can attract ecologically conscious customers and responsible investors. MNEs may also face a paradoxical business risk: their growing water needs across markets are closely linked to dwindling water availability in these geographies. A case in point is Coca-Cola, which was forced to shut down many of its bottling plants in Asia due to excessive groundwater withdrawals (Karnani, 2014). However, changes in ecological resources due to climate change necessitate not only preventative measures and short-term adaptation, but also investments in technological innovation (Gasbarro et al., 2017). Such investments are actively supported at larger MNEs, even though they may face implementation challenges. Thus,
H3a.
Larger multinationals tend to lead in developing policies on water consumption, setting targets on water use efficiency, and consequently demonstrate superior performance over their smaller counterparts in water use.
H3b.
Smaller multinationals can emerge as fast followers over time to close their performance gap with their larger counterparts on water-related metrics.
On similar lines, the fourth hypothesis concerns emission. Large MNEs have access to capital and R&D budgets to deploy technologies for emission reduction (e.g., carbon capture, storage, and sequestration, and large-scale renewable energy projects). They can invest in high-end green product design and manufacturing technologies. On the contrary, smaller firms deploy resource-light environmental management practices that can deliver environmental and cost-reduction benefits (Wong et al., 2020). We posit,
H4a.
Larger multinationals tend to lead in developing policies on emissions, setting targets on emissions, and consequently demonstrate superior performance over their smaller counterparts in emission reduction.
H4b.
Smaller multinationals can emerge as fast followers over time to close their performance gap with their larger counterparts on emission-related metrics.
The last hypothesis is on waste management at large multinationals and their smaller peers. While large MNEs may have the wherewithal to deploy proactive, integrated waste management processes and introduce circular-economy concepts into their global value chains, smaller firms lag in early adoption of industry-leading practices. However, we argue that the flatter hierarchies, informal communication channels, and stronger alignment to ethical responsibilities (Aras-Beger & Taşkın, 2021) of smaller firms enable them to springboard into faster transition. Thus,
H5a.
Larger multinationals tend to lead in developing waste management mechanisms, and consequently demonstrate superior performance over their smaller counterparts in waste recycling.
H5b.
Smaller multinationals can emerge as fast followers over time to close their performance gap with their larger counterparts on waste-related metrics.
These hypotheses are tested using secondary data. Establishing support, or lack of it, for these hypotheses would help gain insights into patterns of sustainability transitions across industries and thus contribute to the body of knowledge by addressing some of the research gaps identified by scholars. Specifically, these insights can help practitioners maneuver the tragedy of the horizon, where short-term investment cycles conflict with long-term climate risks (Averchenkova et al., 2016). In addition, the findings can help develop integrative and transdisciplinary approaches to understand the strategic organizational responses to climate change (Ivanaj et al., 2017).
3. Sample Data and Analysis Methodology
To empirically test the hypotheses, two groups of multinationals are created. For this research, the researcher considers business organizations that own or control production, services, or assets in at least one country other than their home country to be multinationals. The Fortune Global 500 list, a well-known industry reference, serves as the source for identifying sample companies. This list, published every year since 1995, ranks the top 500 multinationals by total revenue. These MNEs originate from more than 30 developed and developing nations, and generate revenue, own assets, and employ workers in several host countries. The first group is formed from the list of multinationals on the 2025 Fortune Global 500 (https://fortune.com/ranking/global500/ (accessed on 21 February 2026)). In 2024, these 500 companies collectively achieved a total revenue of USD 41.7 trillion, which was more than one-third of global GDP, employed 70.1 million people, and generated USD 2.98 trillion in profits. The top 301 companies from this list are selected, and this sample is labeled as the Fortune 500 group. The companies in the second group are also multinationals, but are much smaller in terms of revenue or asset base. Using information available in business databases on peer and competitor companies, the researcher identifies peer companies that have global presence (in production/sales/sourcing of inputs) and, in 2024, grossed less than one-third the revenue of the smallest multinationals in the first group. In this way, the second group consisted of comparable multinationals, but of significantly smaller sizes. Subsequently, the second list is pruned further to select companies that operated before 2013, ensuring stable historical performance data. This provides a list of 304 companies that are significantly smaller than the first group but comparable to it in terms of industry sector and headquarters origin. This sample is labeled as the Non-Fortune 500 group. Reliable firm-level data for these two sets of companies are collected for the period 2015–2024 from the LSEG Refinitiv database for analysis.
3.1. Data and Measures
Given the purpose of assessing the sustainability performance of the two sample groups related to PB and EIB, the researcher collects published data on four dimensions: energy, water, emissions, and waste. Table 1 lists the non-financial performance measures published by companies and captured by LSEG Refinitiv, along with their definitions. The researcher ensures that multiple measures are captured for each hypothesis. Data pertaining to some of the companies’ sustainability-related operational performance (i.e., energy use intensity, water use intensity, carbon emission intensity, and waste generation intensity), which are continuous in nature, are winsorized at the 95th percentile to address extreme outliers.
Table 1.
Firm-level sustainability measures used in this study.
The firm-level sustainability performance variables extracted from the database correspond to seven of the nine PBs. The final dataset consists of 3010 rows from the Fortune 500 group and 3040 rows from the Non-Fortune 500 group. It is observed that all companies (301 in the Fortune 500 group and 304 in the non-Fortune 500 group) did not report all the variables we intend to study for all 10 years. For example, the data on renewable energy ratio has been reported for 1112 Fortune 500 company-year cases (out of 3010 company-year cases) and 658 non-Fortune 500 company-year cases (out of 3040 company-year cases. In other words, certain companies did not publish certain data for certain years. As operational data on some of these measures are not always captured, especially in smaller companies, this is considered a minor limitation of this study. However, as the method does not involve establishing relationships among variables, this absence of data for some variables does not pose a challenge for statistical testing.
3.2. Estimation Method
The researcher proposes to use nonparametric tests (the Mann–Whitney U test and the Wilcoxon rank-sum test). This statistical method serves as a robust alternative to the independent-samples t-test and is particularly appropriate when the data do not meet the assumption of normality. The test evaluates the null hypothesis that the two samples come from the same population, i.e., that they have identical distributions, by ranking all observations in the pooled data and comparing the sums of ranks within each group. The U statistic and its corresponding z-score are reported to determine whether the observations in one group are significantly larger than those in the other group. Furthermore, to determine the practical relevance of any observed differences beyond the p-value, the researcher calculates and reports an effect size estimate, the standardized effect size r, which is computed as z/√N, where z is the standardized test statistic from the Mann–Whitney test, and N is the total sample size (n1 + n2). This estimate provides a scale-free measure of the magnitude of the performance difference between the two groups (Fritz et al., 2012; Cohen, 2013).
To evaluate whether firms in the samples are improving over time in their sustainability performance, the researcher examines the monotonicity of the variables. Here, the researcher employs Kendall’s rank correlation coefficient (τ), a nonparametric statistic that measures ordinal association without requiring normality or linearity assumptions. This test, also known as the Mann–Kendall test, assesses the strength and direction of a monotonic dependence by comparing all possible pairs of observations to determine if they are concordant (ordered similarly) or discordant (ordered differently). In other words, the τ statistic identifies statistically significant upward or downward trends over time (Newson, 2002). Statistical significance will be determined by calculating a standardized test statistic and a p-value, which evaluates the null hypothesis of randomness against the alternative of a consistent monotonic trend.
4. Empirical Results
Table 2A,B present the descriptive statistics generated from the dataset. The statistics are segregated into two groups: Fortune 500 companies, represented by a sample of 301 companies with 3010 records over 10 years, and Non-Fortune 500 companies, represented by a sample of 304 companies with 3040 records over 10 years. While the difference in firm size (total assets and total revenue) between the two groups was due to the study’s design, other financial performance measures of the two sets are comparable.
Table 2.
(A). Descriptive statistics of financial and non-financial performance—301 Fortune 500 Companies. (B). Descriptive statistics of financial and non-financial performance—304 Non-Fortune 500 Companies.
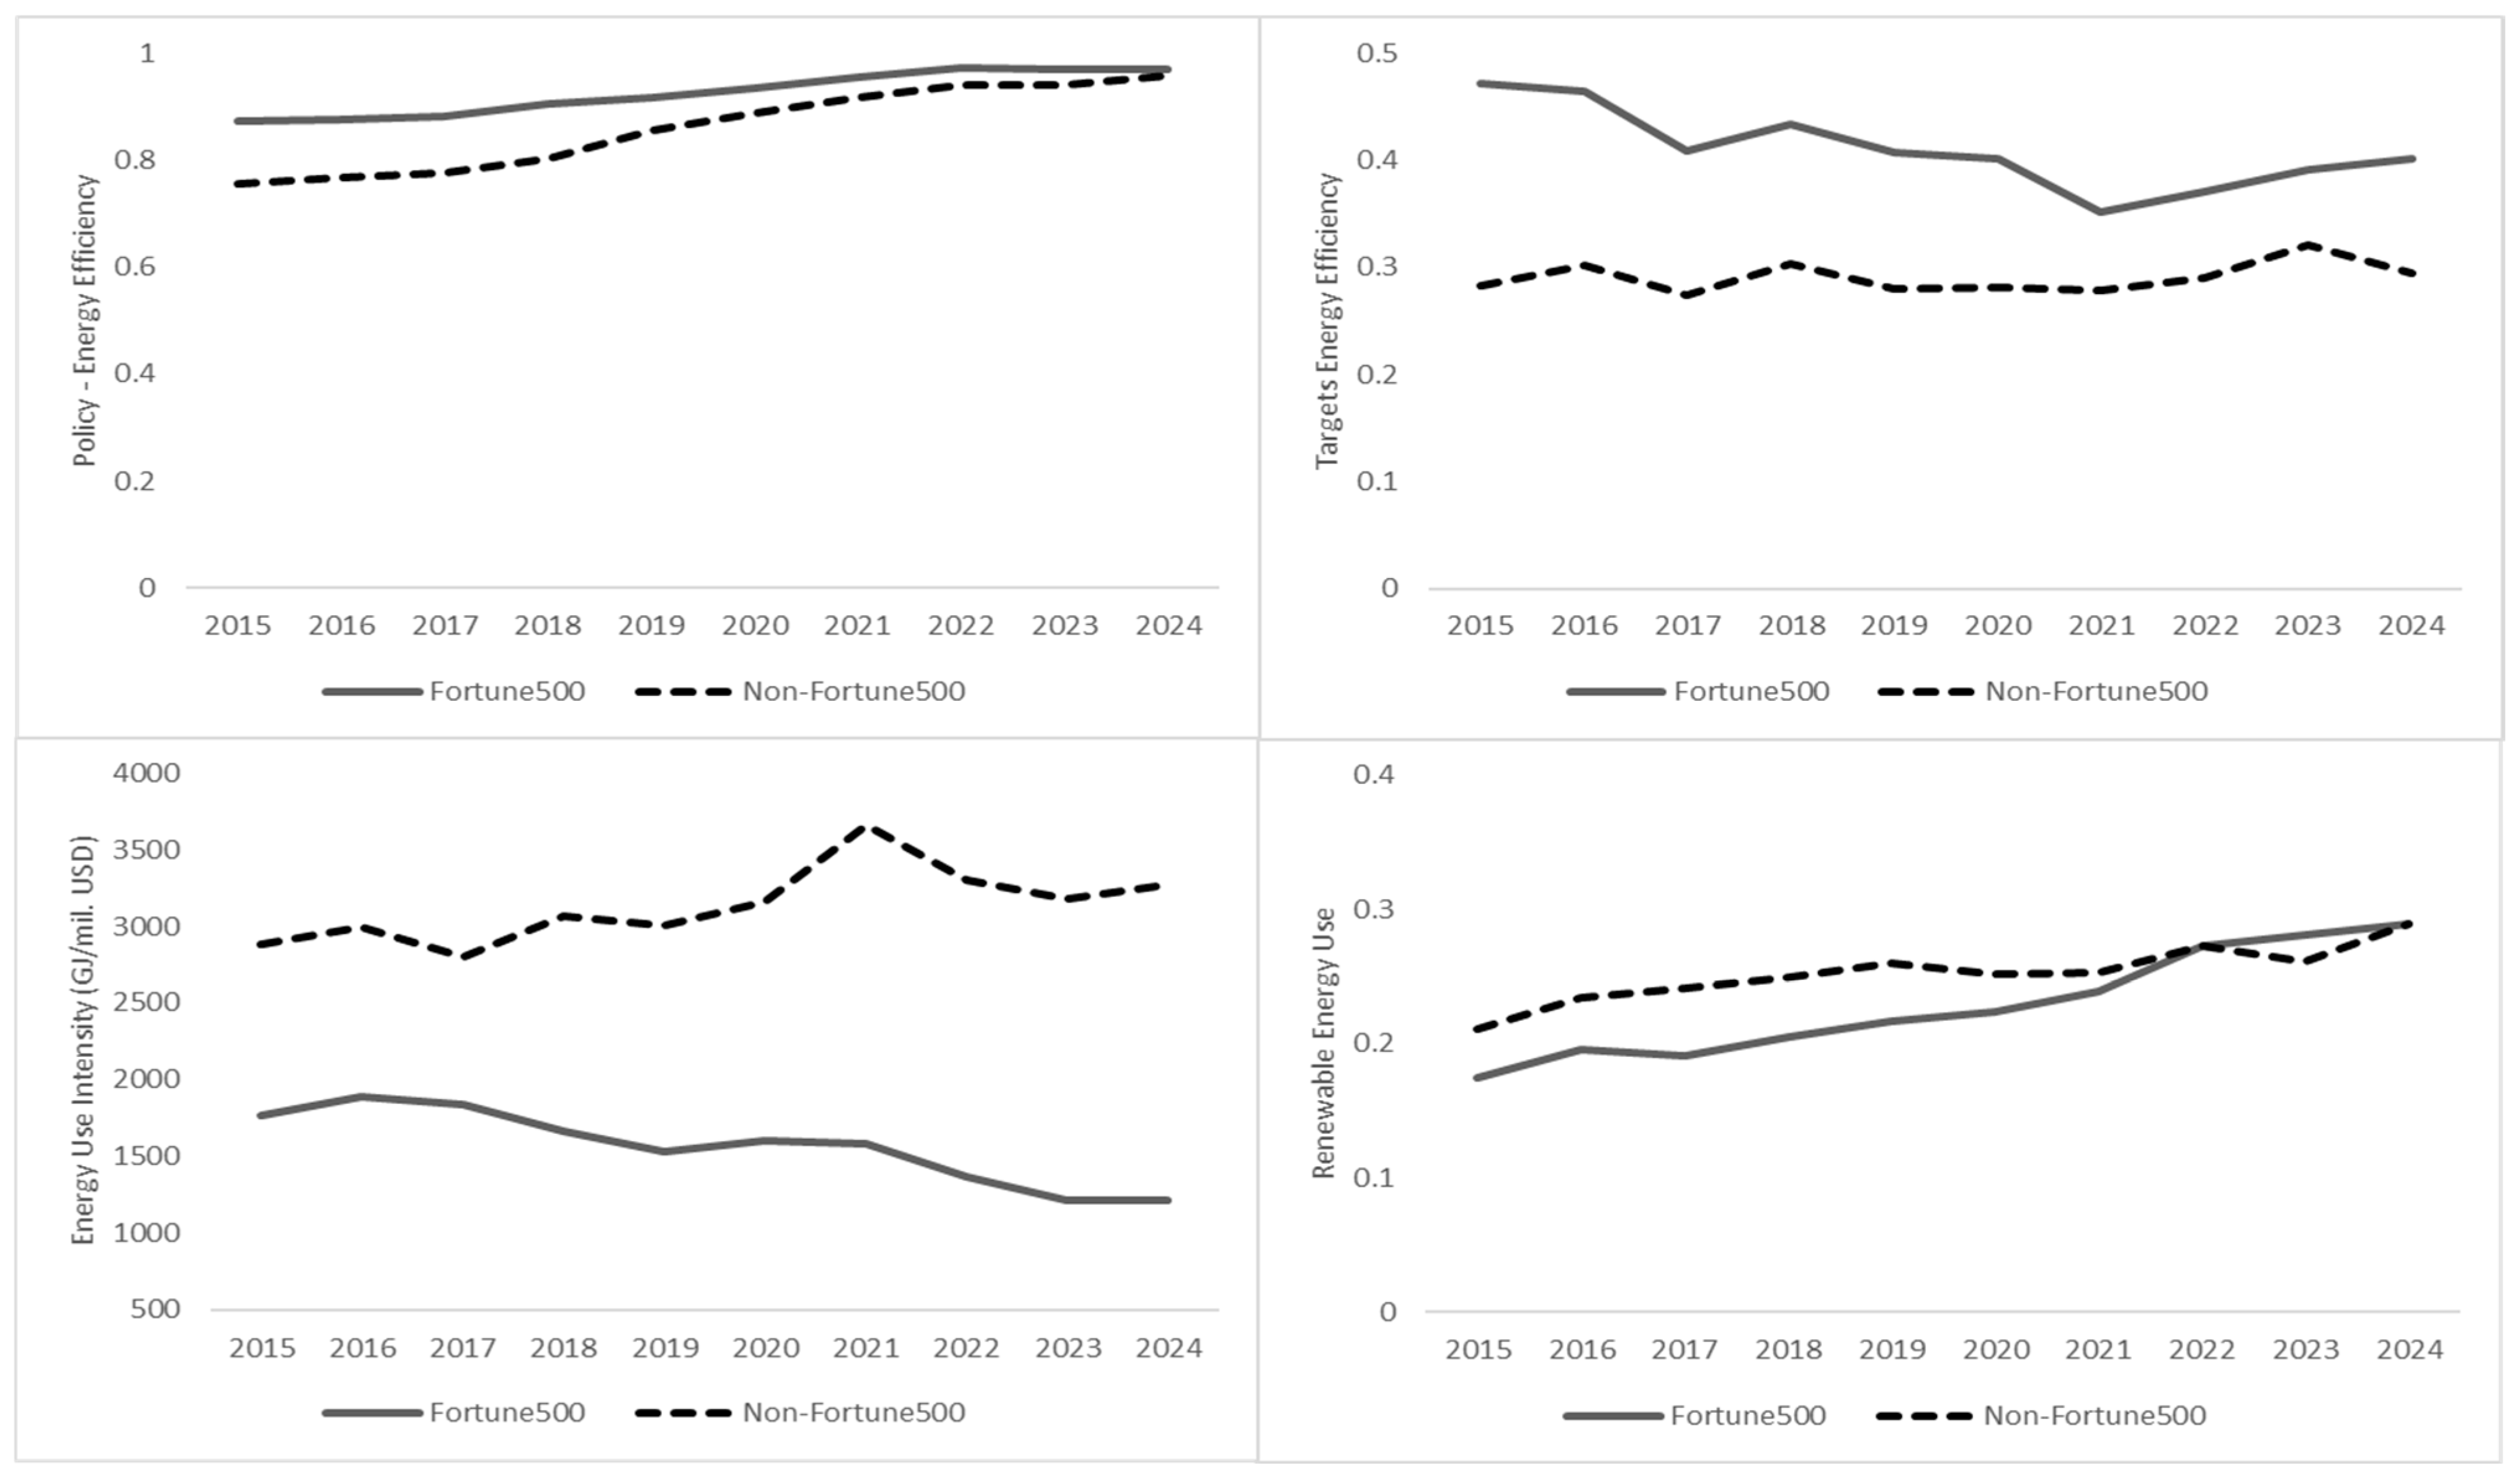
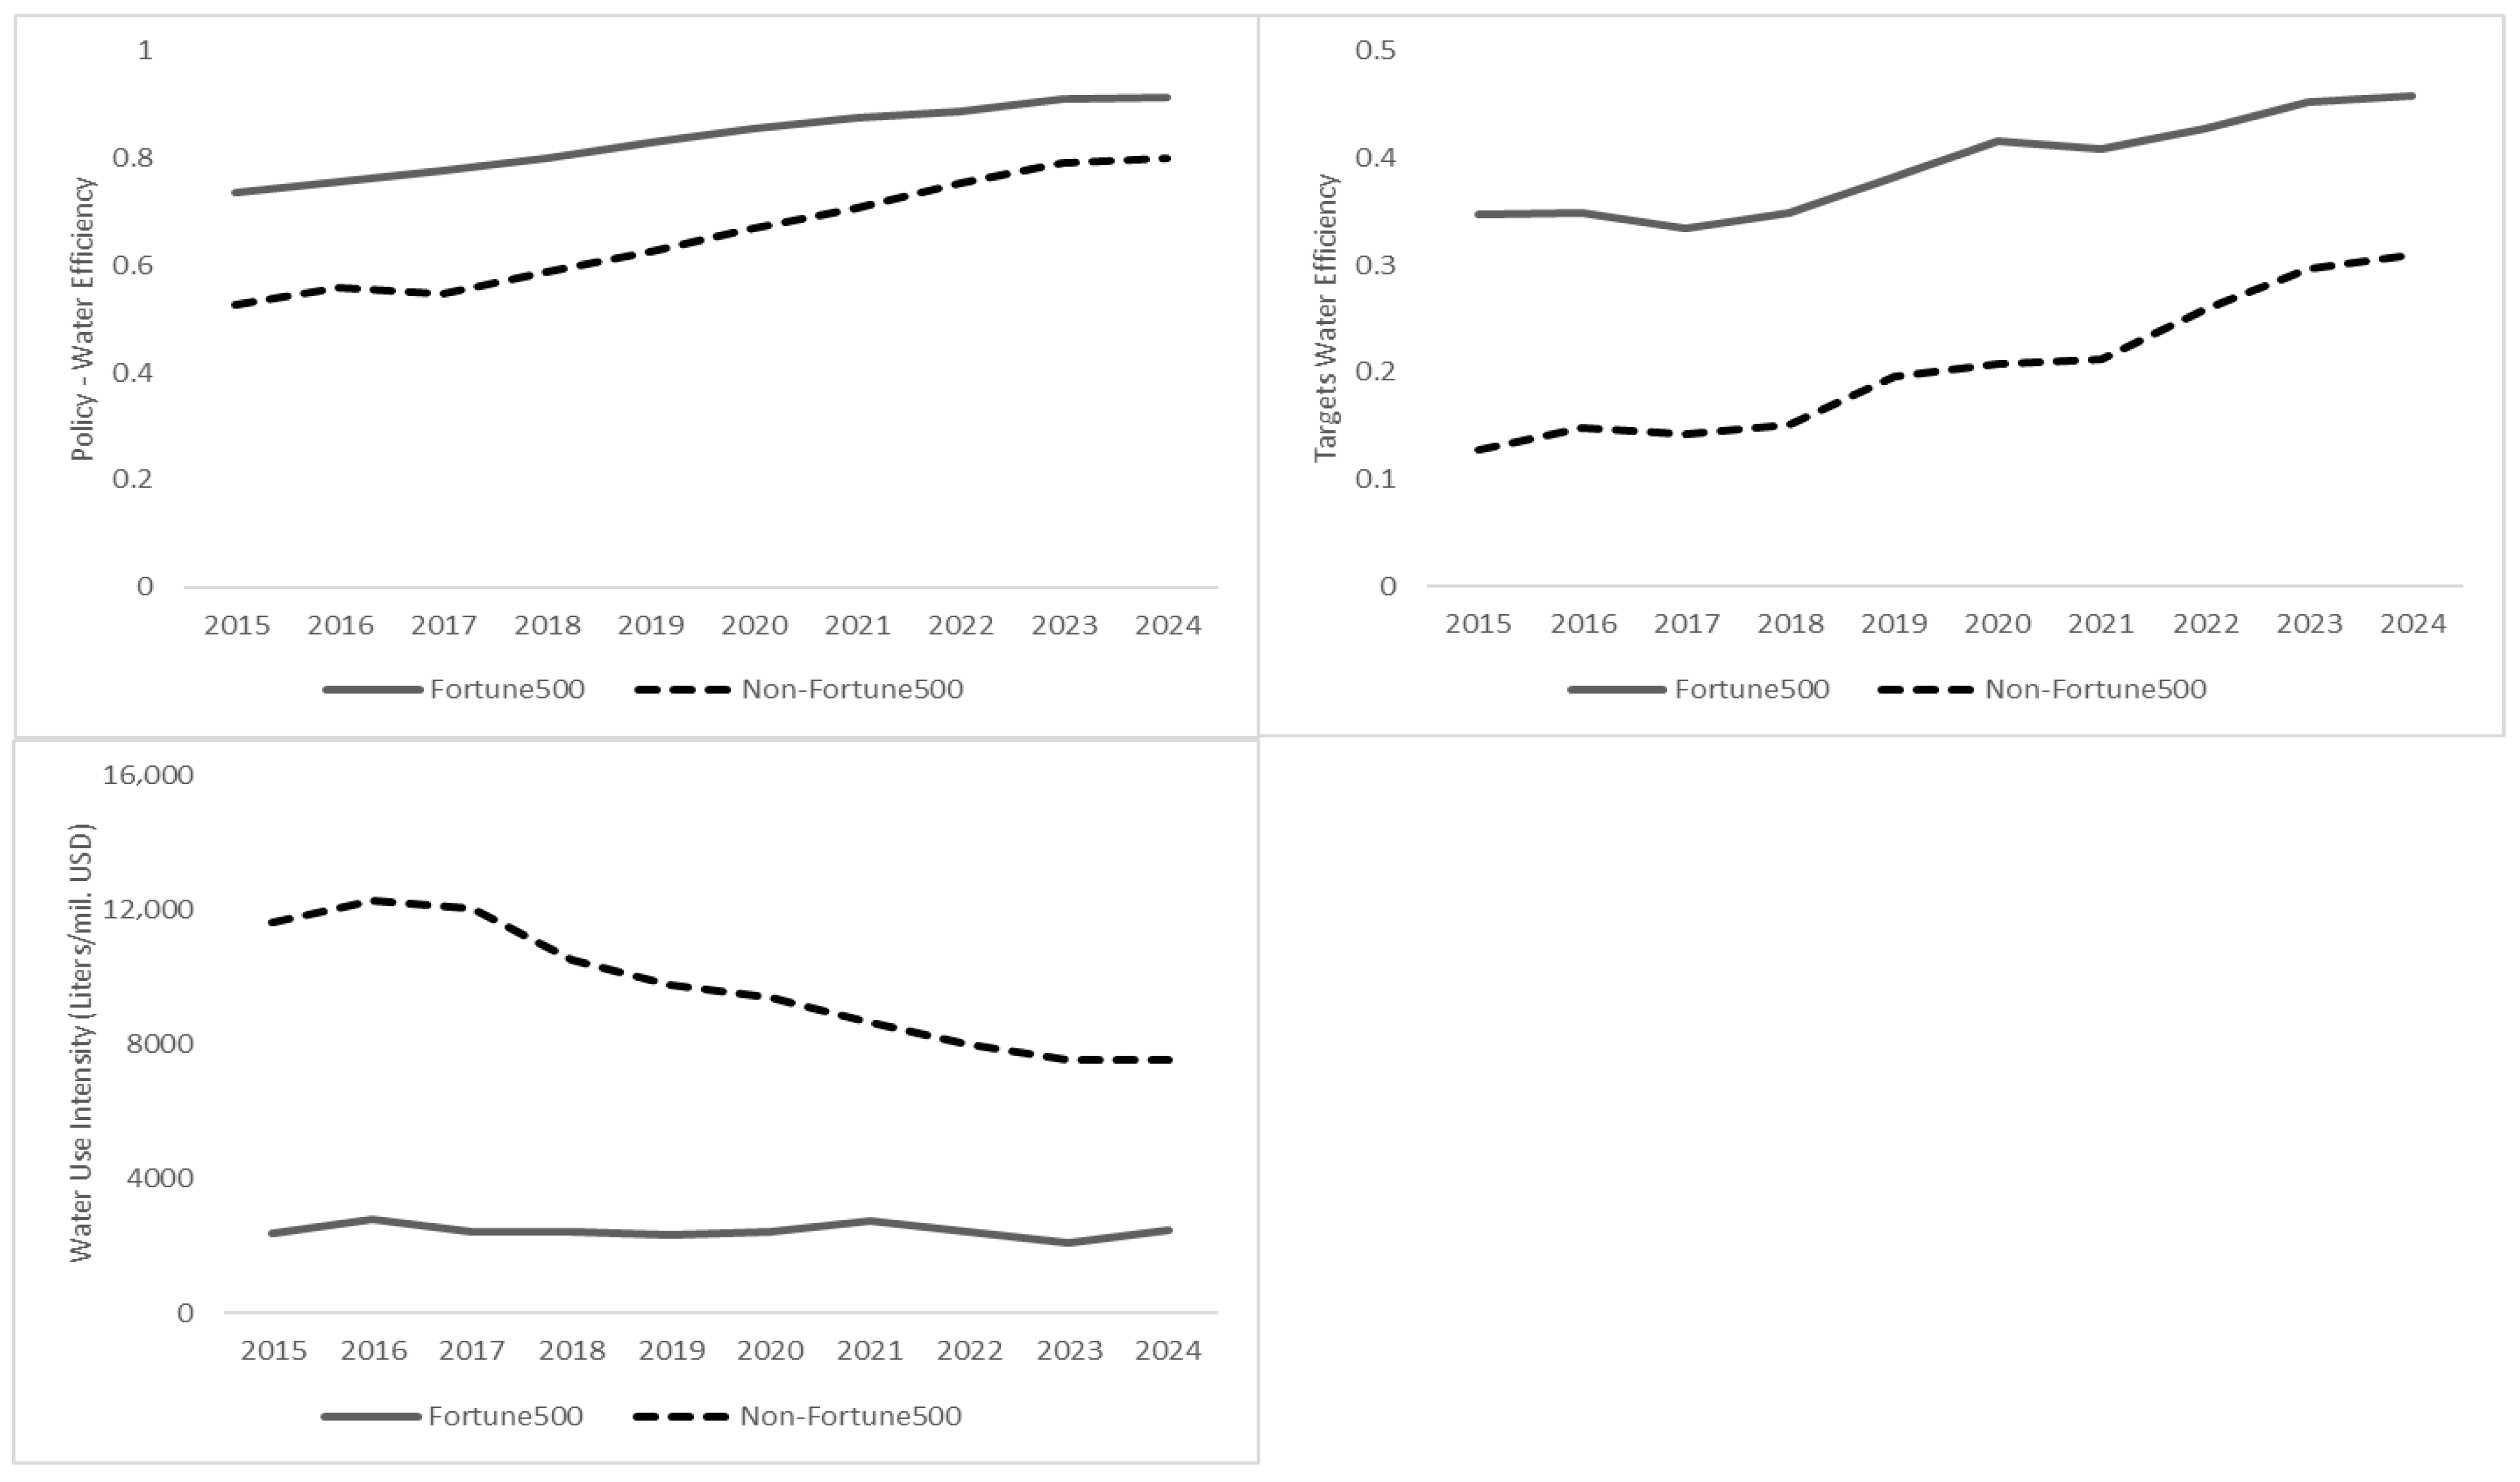
However, significant differences are observed between these two sets of firms in many non-financial sustainability performance measures. Specifically, for energy-related metrics, the results show that, over the years, nearly 41% of Fortune 500 firms have targeted energy efficiency, while the same statistic for Non-Fortune 500 firms is about 29% on average. Energy use intensity is also much higher for Non-Fortune 500 firms, averaging 3182.3 Gigajoules/mil. USD of revenue, while the same statistic for Fortune 500 firms averaged at 1540 Gigajoules/mil. USD of revenue. Similarly, for water-related metrics, Fortune 500 firms show a higher prevalence of policies and specific targets for water efficiency, and their water use intensity is lower than that of their counterparts in the Non-Fortune 500 group.
On the emissions front, similar patterns are observed. Fortune 500 firms demonstrate a higher prevalence of policies and targets on emission intensity; they participate more in emission trading, and their average emission intensity is 128.9 tCO2e/mil. USD of revenue, compared to 322 tCO2e/mil. USD of revenue in non-Fortune 500 firms. Regarding waste generation and recycling, data show that Fortune 500 firms have lower waste generation intensity than non-Fortune 500 firms.
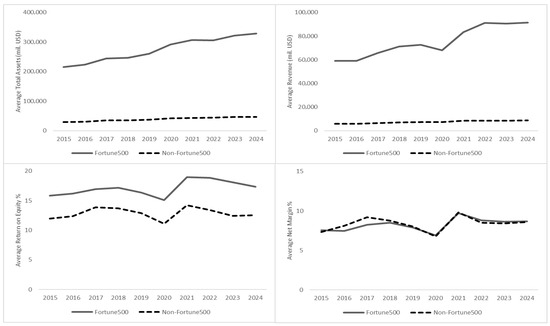
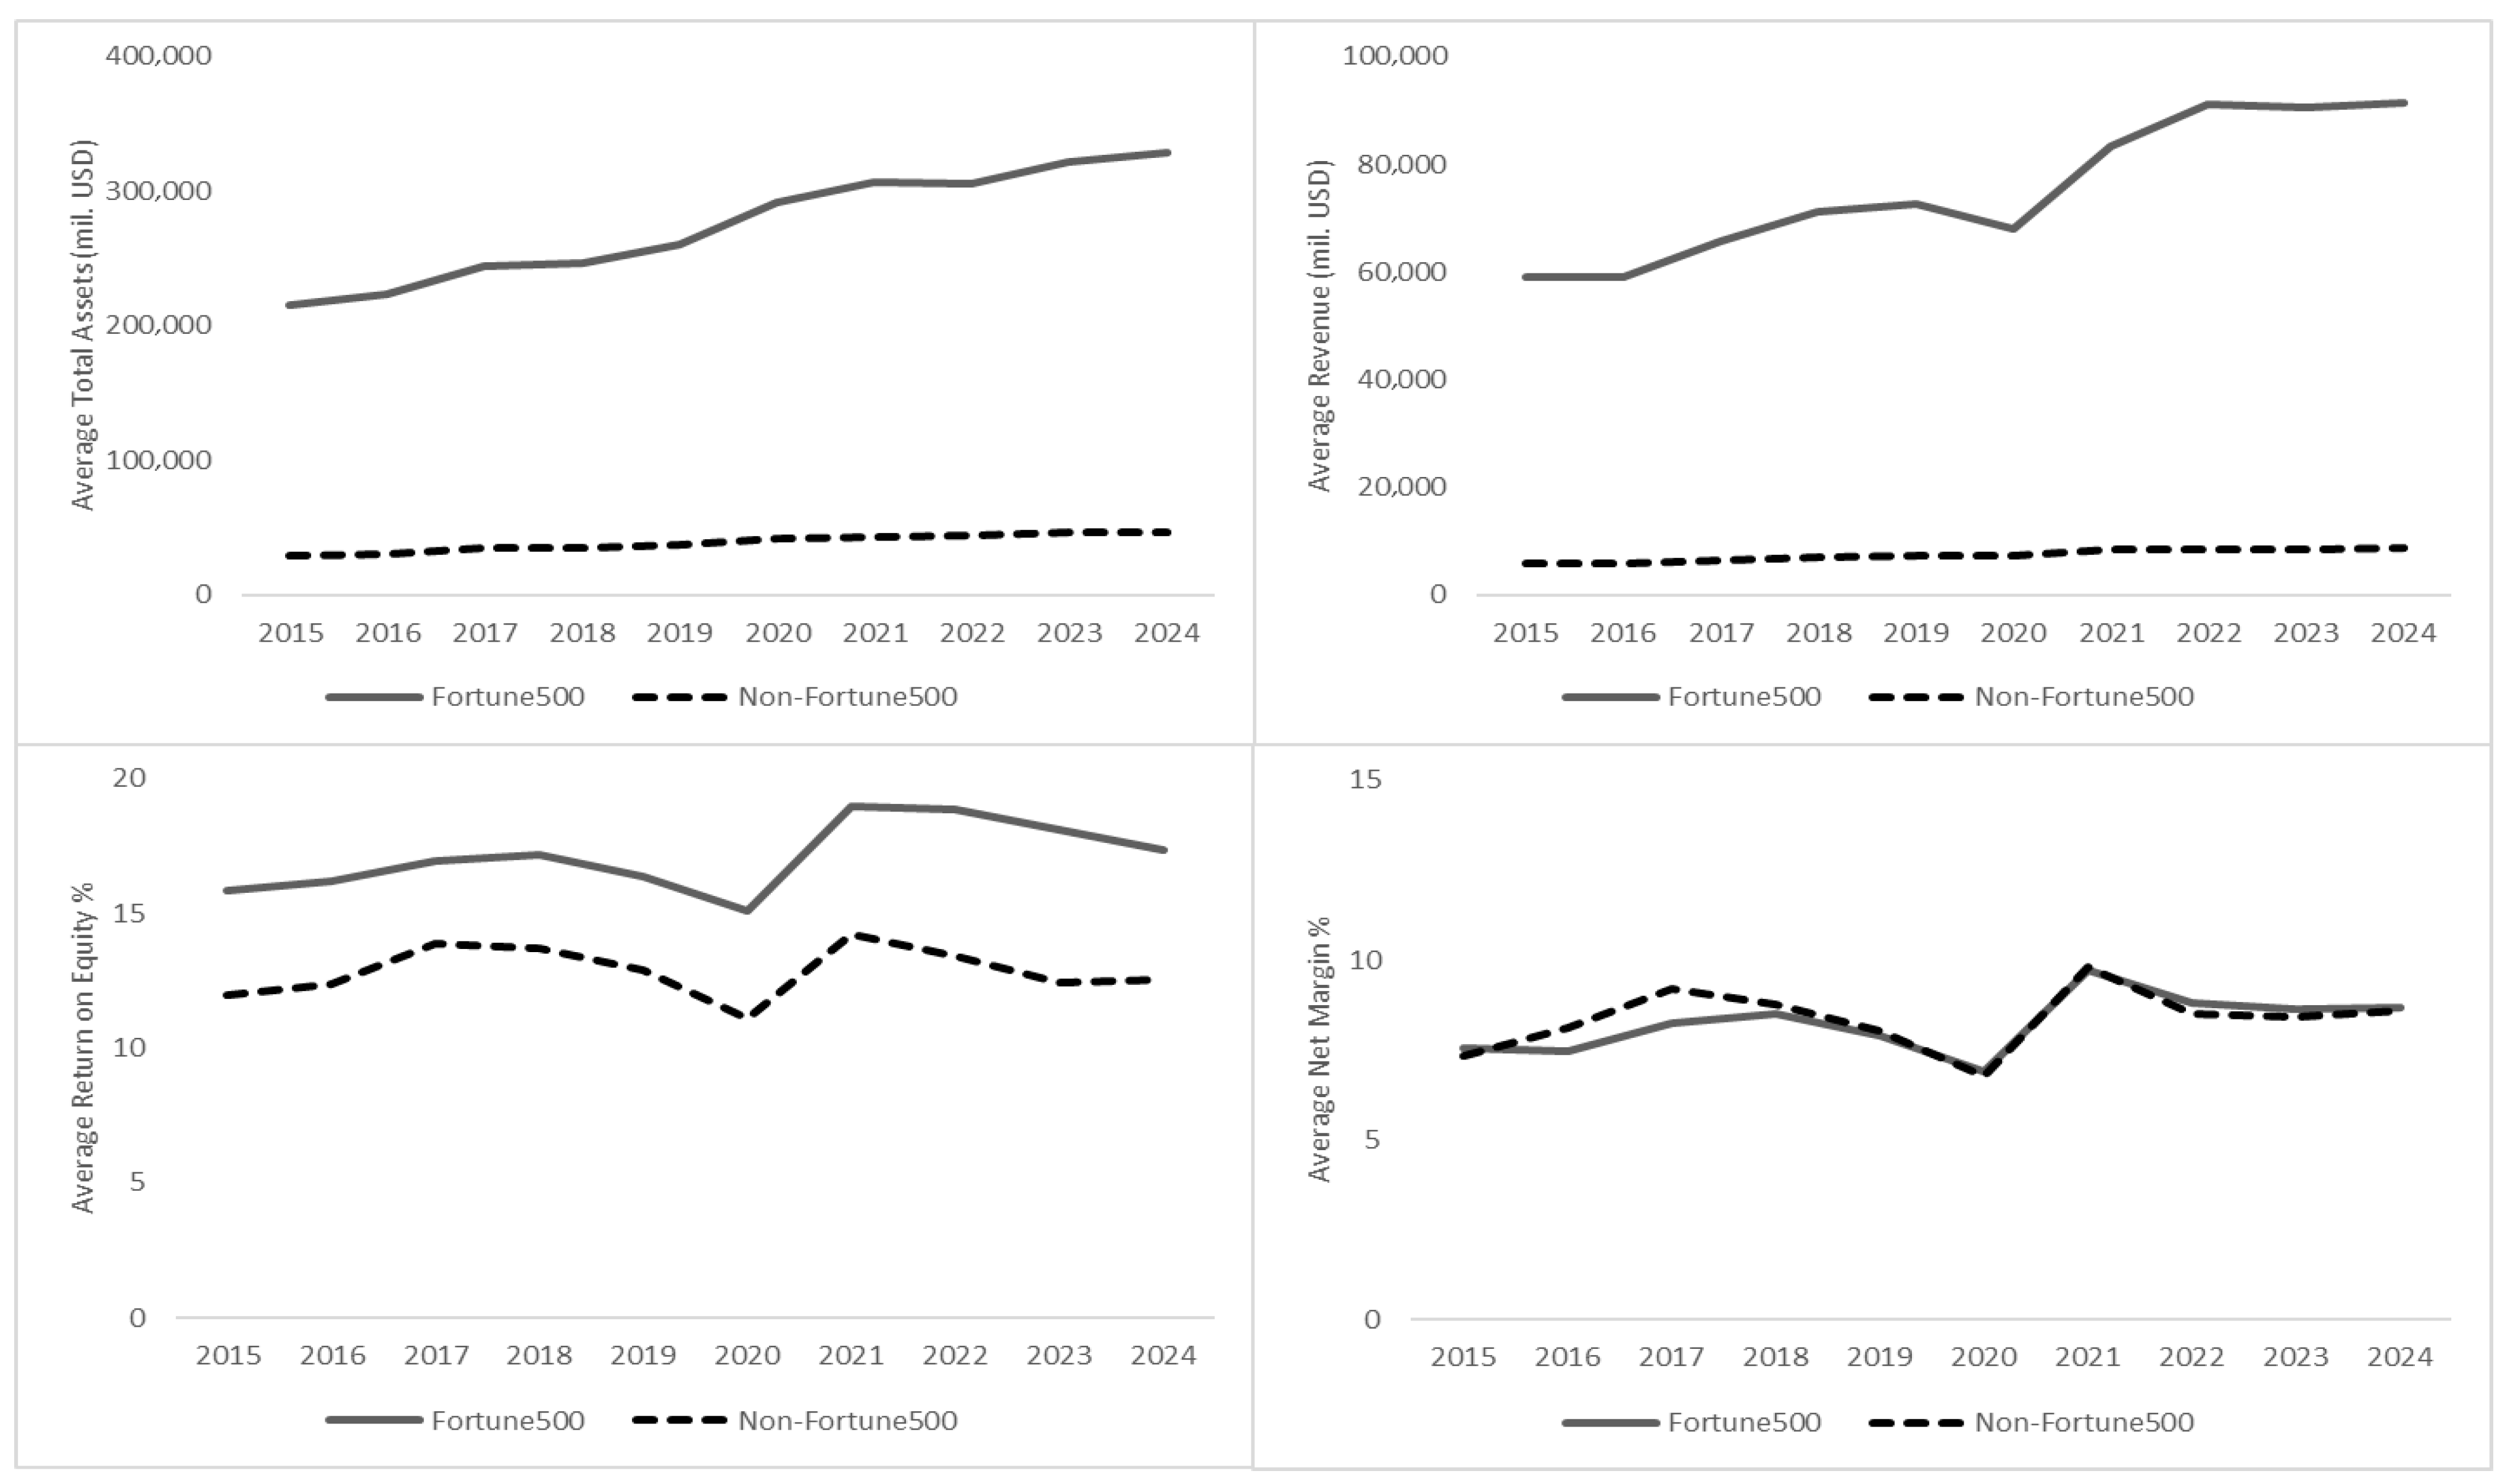
The trend charts on financial metrics are plotted in Figure 2. While, as per sampling criteria, the total assets and revenue of the Fortune 500 group are significantly higher than those of the non-Fortune 500 group, the net margins of the two groups remain similar over the 10-year study period. However, a wide gap in return on equity is observed, suggesting that Fortune 500 firms are relatively more efficient in utilizing shareholders’ investments.
Figure 2.
10-year trend of financial performance—Fortune 500 and Non-Fortune 500 Groups. Source: Author’s analysis of data from LSEG Refinitiv.
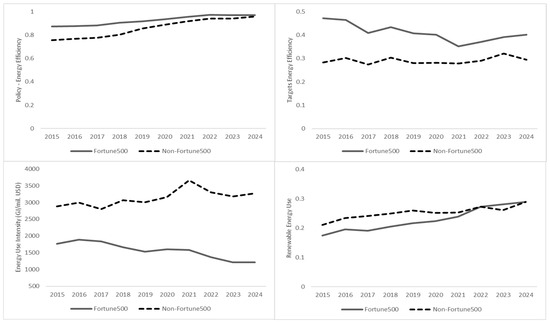
The trends in non-financial sustainability metrics are plotted in Figure 3, Figure 4, Figure 5 and Figure 6. The energy-related metrics for these two groups are plotted in Figure 3. The trend data show that non-Fortune 500 firms have closed the gap in policy on energy efficiency and in setting energy efficiency targets. However, Fortune 500 firms have significantly improved their energy use intensity. The trend in renewable energy use does distinguish the two groups.
Figure 3.
10-year trend of energy metrics—Fortune 500 and Non-Fortune 500 Groups. Source: Author’s analysis of data from LSEG Refinitiv.
Figure 4.
10-Year Trend of Water Metrics—Fortune 500 and Non-Fortune 500 Groups. Source: Author’s analysis of data from LSEG Refinitiv.
Figure 5.
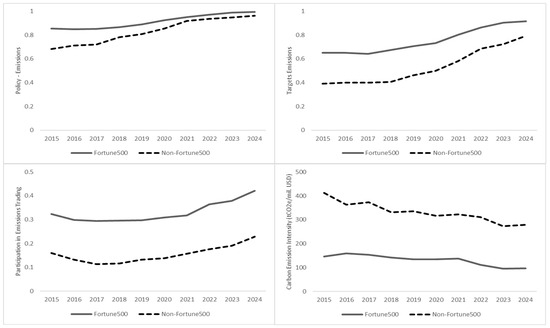
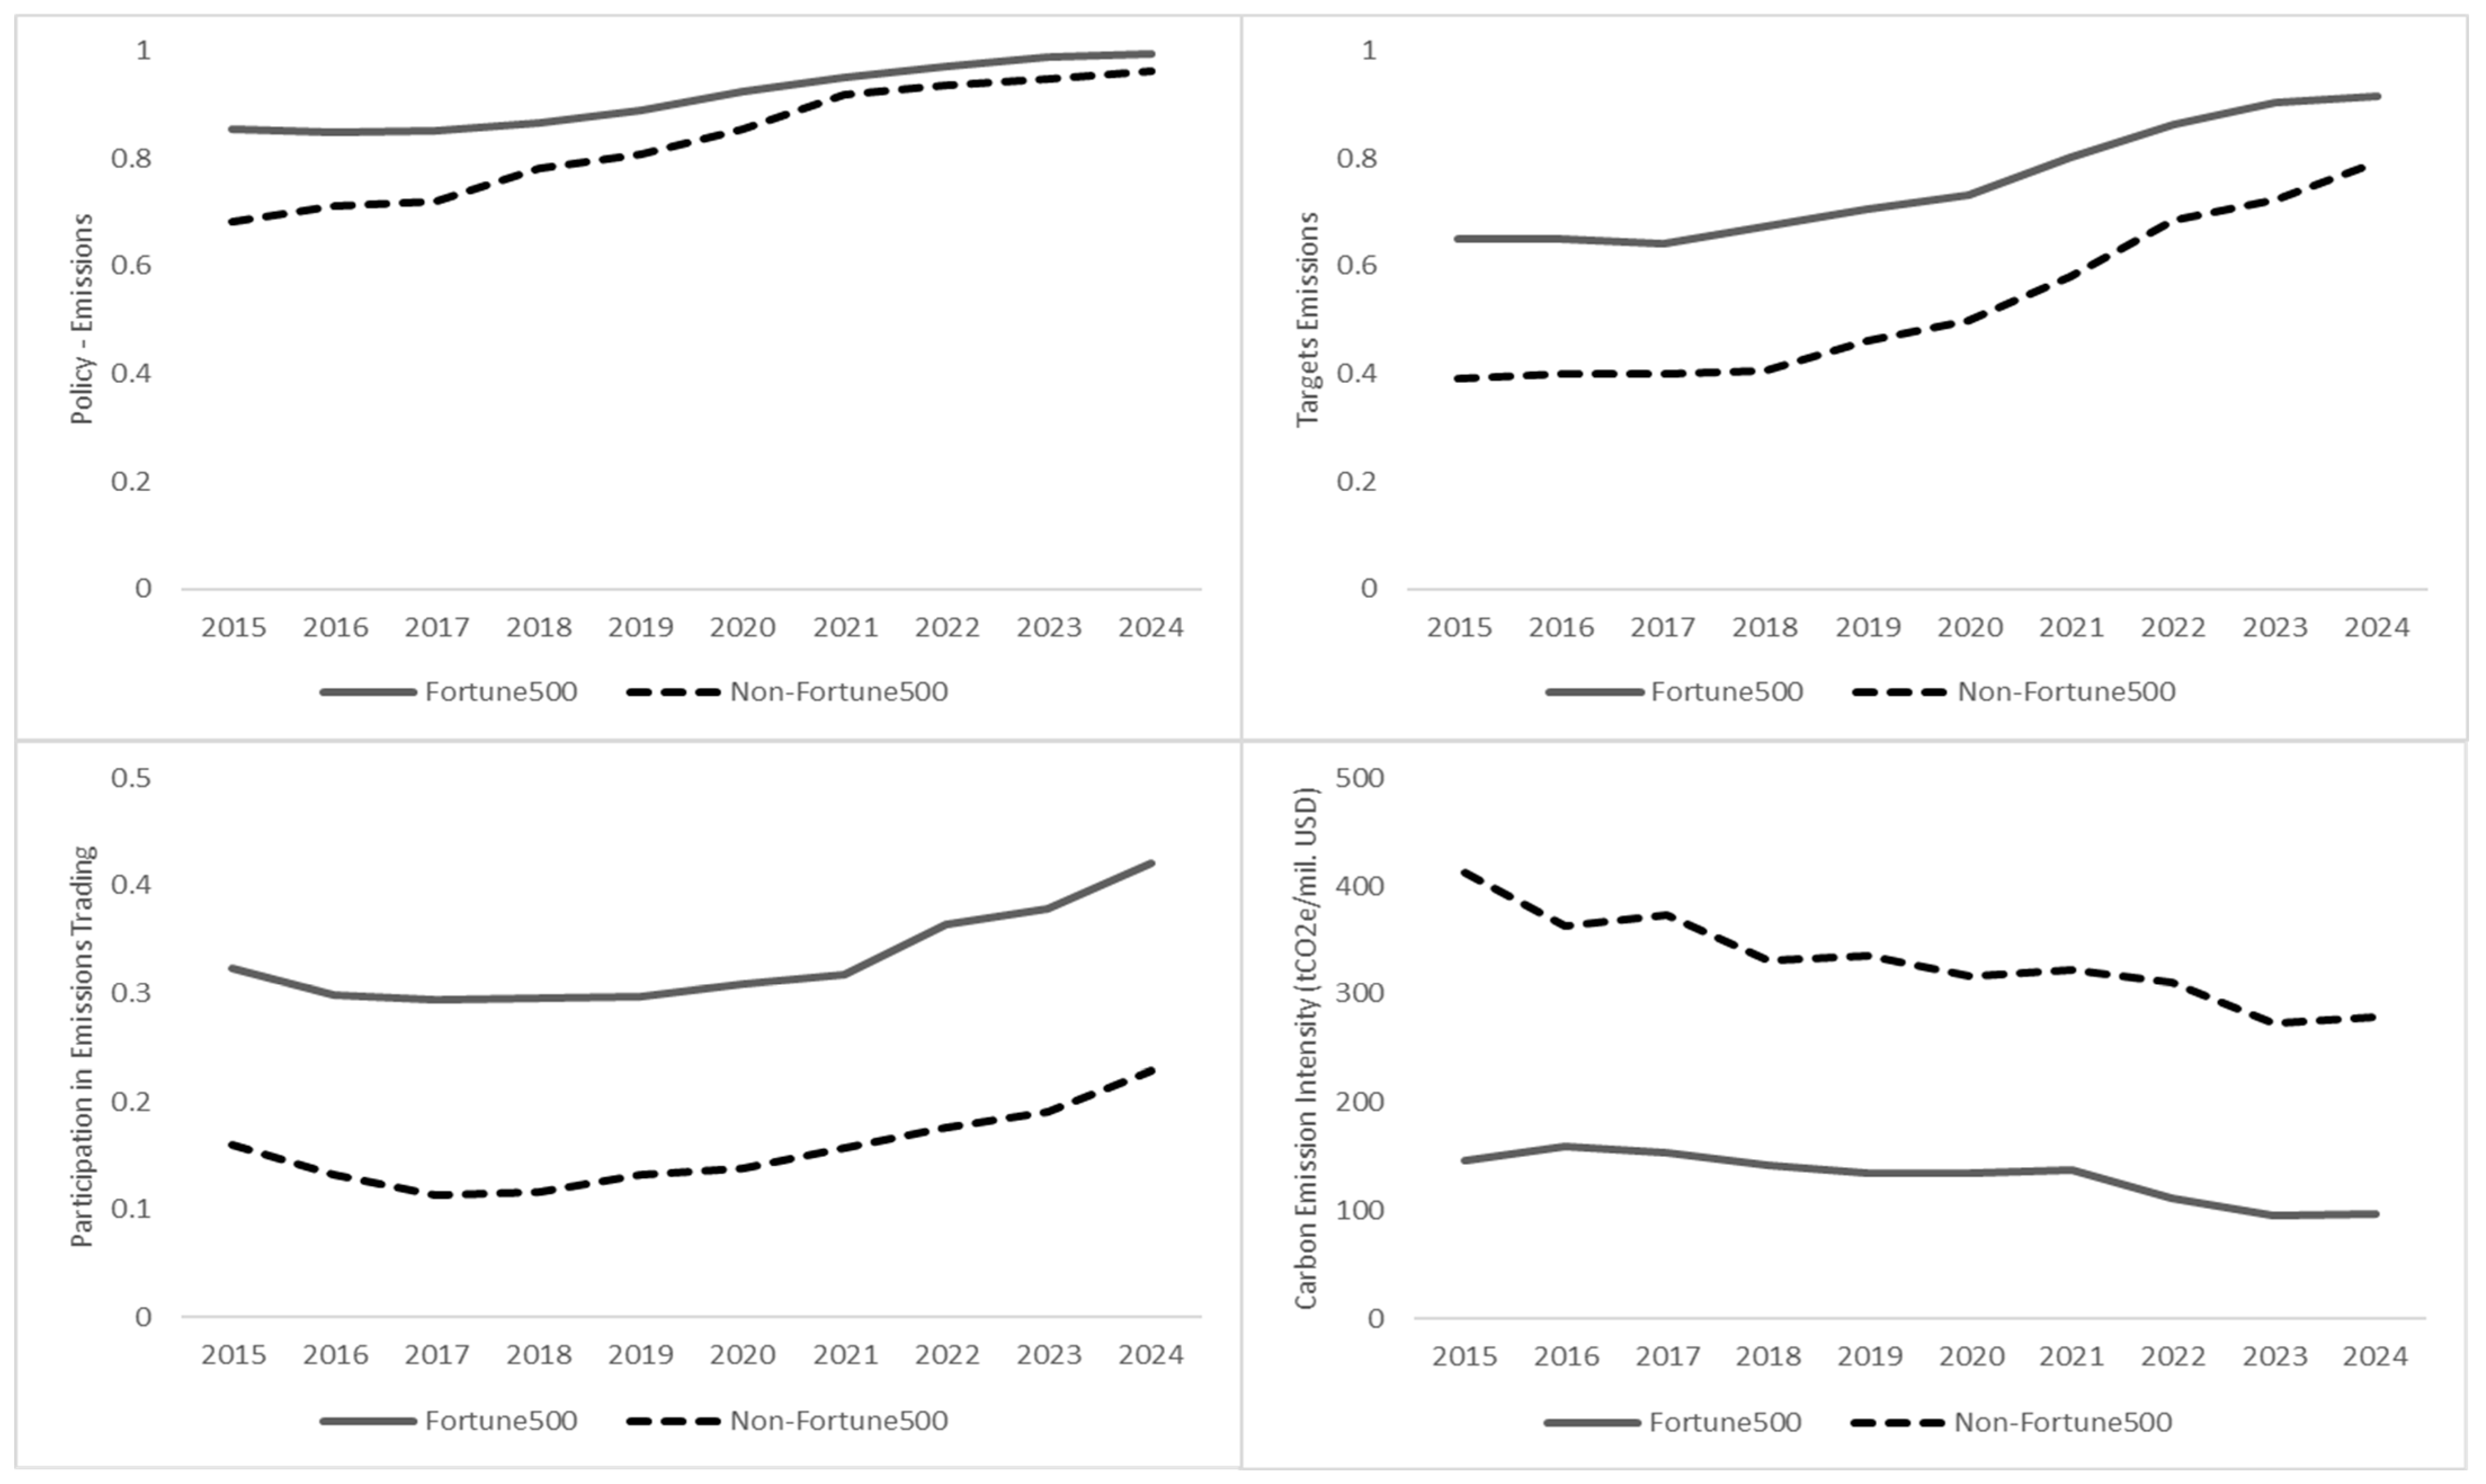
10-year trend of emissions metrics—Fortune 500 and Non-Fortune 500 Groups. Source: Author’s analysis of data from LSEG Refinitiv.
Figure 6.
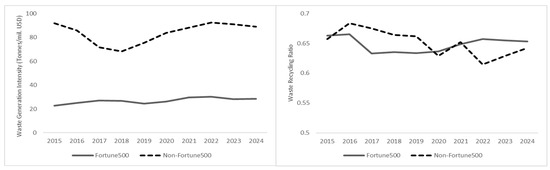
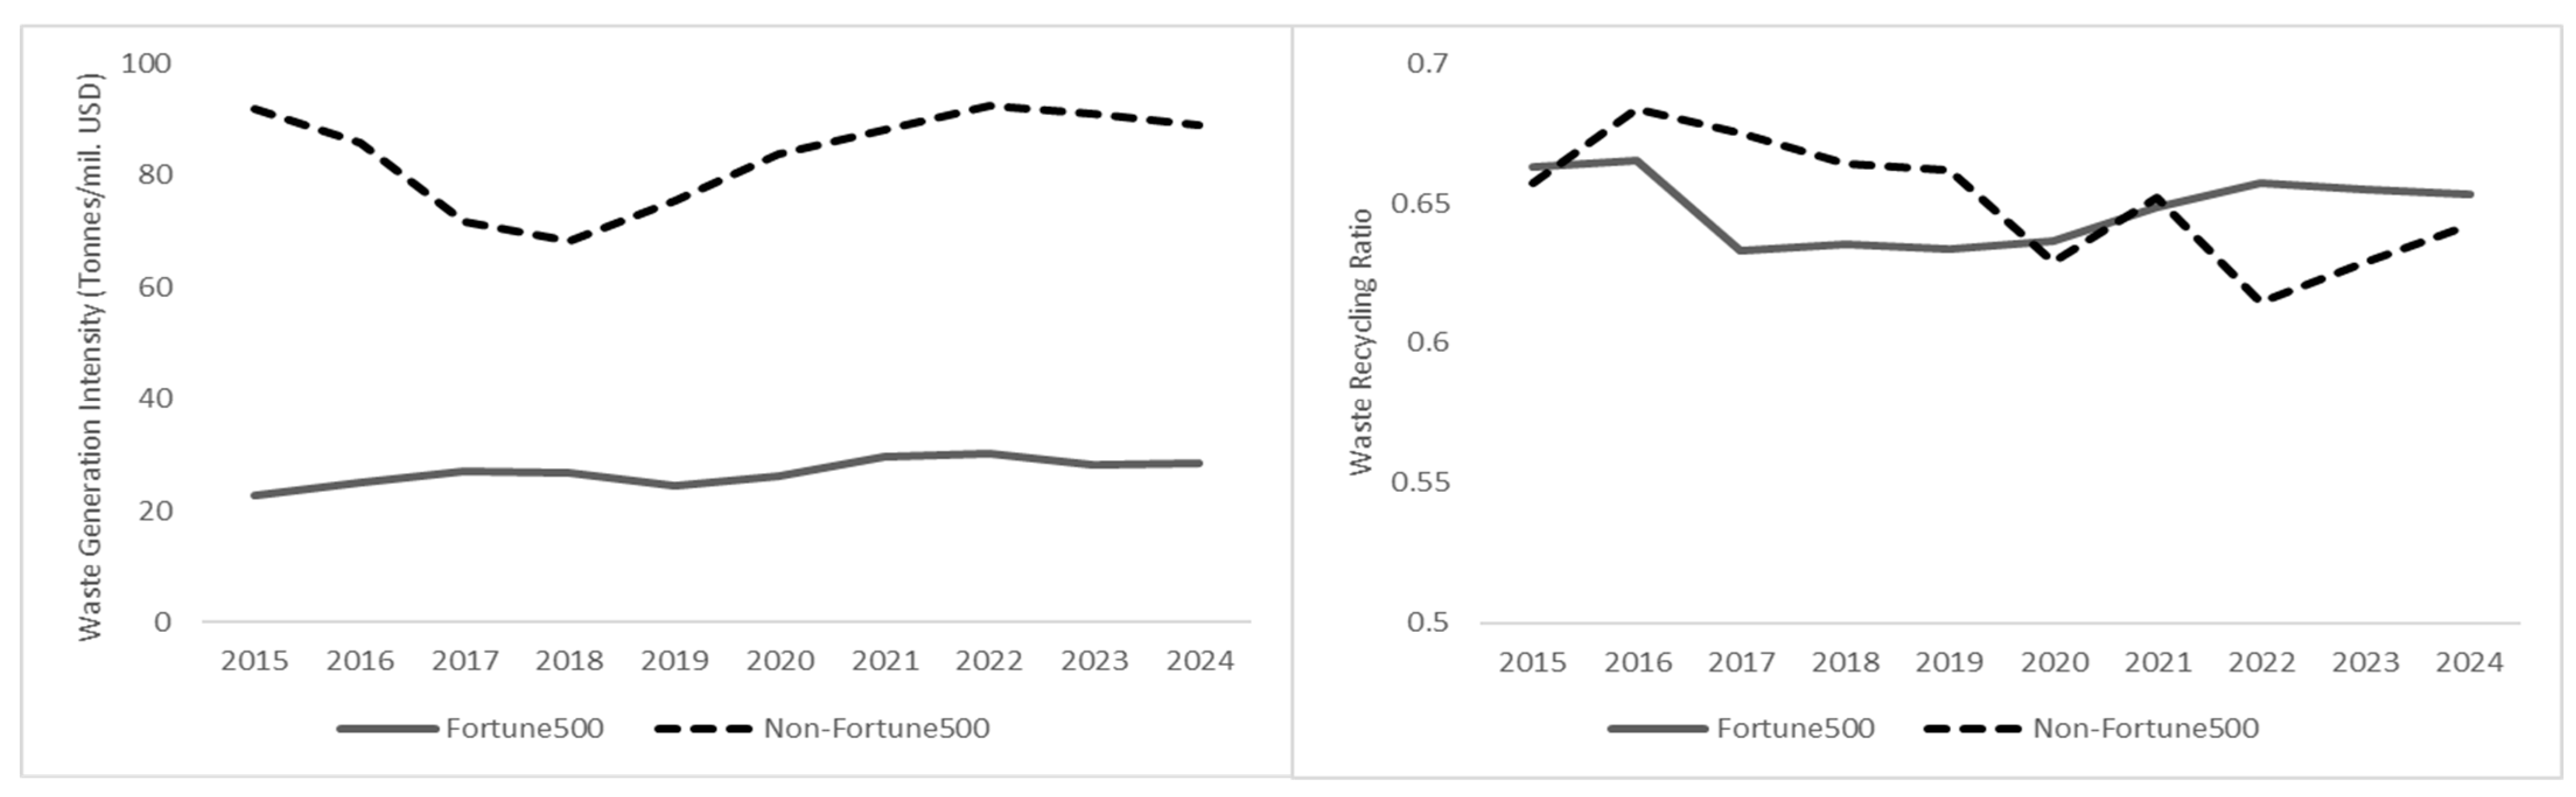
10-year trend of waste metrics—Fortune 500 and Non-Fortune 500 Groups. Source: Author’s analysis of data from LSEG Refinitiv.
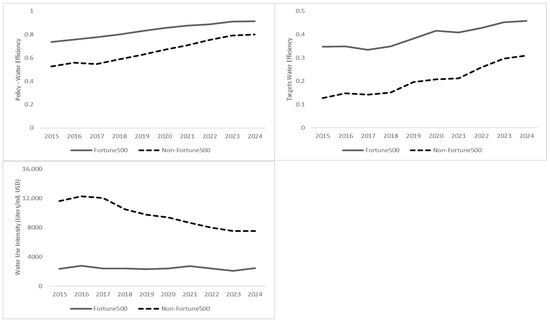
Figure 4 plots the trends in water-related metrics. Here, on metrics such as setting policies and targets, non-Fortune 500 firms have improved over time, and the gap between their performance and that of Fortune 500 firms has narrowed. In addition, although average water use intensity is higher at non-Fortune 500 firms, this metric shows a downward trend.
Emission-related metrics are plotted in Figure 5. Again, here, on metrics such as setting policies and targets, non-Fortune 500 firms have improved over time, and the gap between their performance and that of Fortune 500 firms has narrowed. While non-Fortune 500 firms participated less in emissions trading in earlier years, this metric has improved for both Fortune 500 and non-Fortune 500 firms over time. While per capita emissions for non-Fortune 500 firms were high in the initial years, they have since shown a downward trend, though their average levels remain higher than those of their counterparts.
Figure 6 plots the waste-related metrics of these two groups of firms. Non-Fortune 500 firms do not demonstrate a positive trend in waste generation intensity. Also, the trend in the waste recycling ratio does not suggest any improvement for either group.
Before testing the hypotheses, the researcher conducts heterogeneity analyses of the samples to understand how they differ across broad characteristics. Notable differences are observed across most parameters based on factors such as MNEs’ headquarters (HQ) locations, industry sectors, etc. Table 3A presents the heterogeneity analysis by headquarters location of the MNE. Here, the UN-adopted classification of economies into two categories: developed and developing/Transition economies is used.
Table 3.
(A): Heterogeneity analyses for MNE HQ. (B): Heterogeneity analyses for the intensity of natural resources of the firm.
A critical observation emerges from this analysis. The average energy efficiency and water use efficiency are very low for the Non-Fortune 500 companies from developing nations. In addition, their carbon and waste generation intensities are higher on average over the 10-year period. These are despite the fact that these companies are not far behind their larger counterparts from developed economies in terms of adopting policies or setting targets on energy efficiency, water efficiency, emissions, and waste generation. Thus, it may be surmised that emerging market MNEs, while aspiring to adopt sustainable business models, may need to focus on operational efficiencies related to key sustainability performance.
Similarly, the researcher conducts another relevant heterogeneity analysis based on whether the MNE’s primary business, as indicated by its SIC code, is heavily dependent on natural resources. Table 3B presents the key findings of this analysis. The average performance on energy efficiency, water efficiency, carbon emissions and waste generation is poorer for the Non-Fortune-500 group, who are more dependent on natural resources. However, when it comes to establishing policies or setting targets, consistent better performance is absent from the group of companies that are more dependent on natural resources.
To test the hypotheses, the researcher first conducts nonparametric Wilcoxon tests on the sample sets. Key results from the Wilcoxon and the Mann–Whitney tests are mentioned in Table 4. The test statistics indicate that the average return on equity of Fortune 500 companies is significantly higher than that of non-Fortune 500 companies, but the same is not true for net margin. Thus, only partial support for H1 is found. Also, partial support for H2a is found, where Fortune 500 MNEs, on average, demonstrate a significantly higher share of policies on energy efficiency, set more energy efficiency targets, and have lower per capita energy consumption. However, on the adoption of renewable energy, there is no significant difference between these two groups.
Table 4.
Non-parametric comparison between Fortune 500 and Non-Fortune 500 Groups.
Interestingly, the results show full support for H3a and H4a. As shown in Table 4, Fortune 500 MNEs significantly outperform their smaller counterparts on all three water-related performance measures and all four emission-related performance measures. However, for H5a, the results provide only partial support, showing that Fortune 500 MNEs, on average, perform significantly better in waste generation intensity but do not demonstrate any significant difference in waste recycling compared to their smaller counterparts. The effect size estimates (r) per Cohen’s guidelines (Fritz et al., 2012) range from small to medium across all measures studied.
Nonparametric tests, such as the Mann–Whitney U test, are generally robust to outliers. However, to reduce sensitivity to outliers, the continuous variables in our sample were winsorized during data preparation. As the Mann–Whitney U test focuses on medians rather than means (as in the parametric t-test), it is more robust to outliers and distributions with heavy tails. The nonparametric nature means it does not assume a specific data distribution, making it ideal for ordinal data that is not normally distributed. Nonetheless, to assess the robustness of the findings, the researcher checks whether an alternative, nonparametric test yields the same conclusions. To this end, the Kolmogorov–Smirnov (K-S) 2-sample test is used. The K-S test, conducted on the same samples, provides similar results: it shows statistically significant differences between the two samples for all variables except these two: Renewable Energy Ratio and Waste Recycling Ratio.
The remaining hypotheses are tested using nonparametric tests with time correlation. Table 5 presents the results of these tests using Kendall’s Tau, a statistic for measuring monotonic trends in time series data.
Table 5.
Test for monotonic trends and their strength in time series data.
The metric on energy policy adoption shows a positive, monotonic trend for both groups, with a stronger trend in the Non-Fortune 500 group. Similarly, energy use intensity shows a negative, monotonic trend for both groups, with a stronger trend in the Non-Fortune 500 group. This evidence supports H2b. However, Kendell’s Tau and p-values for the other two metrics, targeting energy efficiency and the renewable energy ratio, do not support H2b.
Results on water-related measures demonstrate full support for H3b, with stronger and positive monotonic trends for the Non-Fortune 500 group in policy on water efficiency and in setting water efficiency targets. On water use intensity, the Non-Fortune 500 group demonstrates a statistically significant negative monotonic trend, supporting H3b.
The results also demonstrate strong support for H4b, which tests for monotonic trends in emission-related metrics. On emission policies, targeting emission intensity and participating in emission trading, it is observed that both groups demonstrate positive monotonic trends that are statistically significant, and the Non-Fortune 500 group demonstrates stronger trends. Regarding carbon emission intensity, both groups exhibit statistically significant negative monotonic trends, and the trend strength is the same for both groups. Regarding waste-related measures, there is no support for H5b, as neither measure shows a significant monotonic trend.
5. Discussion
The empirical findings over a 10-year horizon indicate that large multinationals, as industry leaders, had the first-mover advantage in adopting sustainability initiatives to address environmental changes. The impetus was driven by stakeholders’ demands, investors’ pressures, regulatory requirements, industry initiatives, and technological advancements to track and monitor operational data at a granular level. The emergence of the ESG framework as a common approach adopted by investors and regulators led to the standardization of initiatives, data tracking, and reporting. The large multinationals improved on many of these standardized metrics over time to demonstrate their ability to (a) reduce the material impact of their business activities, and (b) address emergent environmental risks and opportunities for their businesses. The smaller multinationals, interestingly, became fast followers and demonstrated faster adoption of sustainability initiatives, leading to faster improvement across many measures. This observation supports some of the earlier findings that small firms face lower cognitive barriers (Nesterova, 2021), do better in innovation related to improving operational conditions (Van der Waal et al., 2021), and many of them adopt a sufficiency orientation that aligns better with sustainability performance (Hug et al., 2022). While the sustainability performance of smaller businesses, as evidenced by the findings, is encouraging, further analysis of the practices of select small companies does not indicate whether smaller businesses are transitioning to SBMs or are able to factor in PBs effectively.
These findings from the two samples, along with a review of the sustainability reports of several companies in the two groups, yield a few key observations. First, it is noticed that while PBs are discussed at the level of policymakers and scientists, translating them into specific firm-level targets for individual businesses is difficult. Butz et al. (2018) have sought to bridge the gap between scientific findings and global economic activities by operationalizing the PB framework into economic intensity boundaries (EIBs). The EIBs translate global biophysical limits into resource-use and emission limits per unit of revenue at a business organization. However, it is observed that only a handful of organizations adopt EIBs or variants of these, e.g., Overall Business Impact Assessment (OBIA), a methodology adopted by Unilever that evaluates a business area’s environmental impact (such as greenhouse gas emissions) per unit of economic value (Clift et al., 2017). Almost all organizations continue to focus on relative eco-efficiency (i.e., benchmarking against their own past performance or industry average) rather than on absolute sustainability (i.e., benchmarking against EIBs).
This focus on relative sustainability rather than absolute sustainability lacks mechanisms to ensure that the aggregate business impact remains within the planet’s safe operating space (Clift et al., 2017). In addition, business research remains largely disconnected from Earth system science, focusing on social or institutional implications while ignoring quantitative indicators of actual ecosystem functioning (Whiteman et al., 2013).
Thus, a common system of sustainability-related measures that can go beyond what ESG rating agencies and regulators track, with stronger linkages to PBs and their interconnected second-order effects, is essential. These measures should not only be applicable at any scale (large, global businesses or SMEs), but, as suggested by Klooster and Prodani (2025), we also need supervision and guidance on alignment with these metrics by entities beyond investors or national regulators.
Second, businesses, as evidenced by published data, primarily adopt an instrumental, framework-centric approach to address sustainability issues. While a multinational recognizes the importance and relevance of double materiality (i.e., outside-in material risks and opportunities for business, and inside-out material impact on environment and society), the responses from the organization are less idiosyncratic and fail to recognize the unique context of the I-R-O pertaining to its business at the global level, as well as I-R-O pertaining to its businesses across geographies at regional/local levels. Thus, a multinational’s responses to material risks and opportunities tend to be more generic and may not contribute to building resilience. Extending the concept from Magnani et al. (2024), the author defines resilience as a meta-capability that, rather than simply bouncing back, enables businesses to bounce beyond adversity by transforming when an environmental or geopolitical risk materializes. The process entails rethinking the firm’s focus, modus, and locus to address environmental and geopolitical disruptions. It is important to understand that building resilience for the future may not be driven by focusing on today’s operational efficiency, and framing business risks from nature (e.g., asset impairment risks) requires less insight from the past and more foresight about the future. The prevailing enterprise risk management models appear inadequate in that respect.
The following subsection synthesizes some recent insights to highlight specific issues in traditional ERMs in addressing risks from environmental change.
5.1. Limitations of Traditional Enterprise Risk Management (ERM) Models
Traditional enterprise risk management is a systemic, multi-disciplinary process used by organizations to identify, assess, and respond to risks that threaten business continuity and financial performance (Averchenkova et al., 2016; De Haas et al., 2025). These models typically view the business environment through a lens of linear predictability, focusing on risks quantified from historical data and short-term horizons (Averchenkova et al., 2016; Magnani et al., 2024). The model categorizes risks into credit, market, liquidity, operational, and reputational risks. The model is built on the assumption of ergodicity, i.e., the economic and social systems in which a firm operates are static and stable. An ergodic system operates on the premise of: (a) equilibrium focus, i.e., the system is expected to naturally gravitate toward a relatively stable state, (b) predictable uncertainty, i.e., uncertainty is treated as stochastic randomness, where future events follow predictable patterns that can be mapped using past data, and (c) bouncing back, where the system is resilient enough to absorb an exogenous shock and return to its previously stable state (Magnani et al., 2024).
However, traditional ERMs used in large multinationals fail to account for environmental and societal changes because ERMs are primarily backward-looking, relying on historical data to predict future probabilities. This reliance assumes an ergodic environment, i.e., a stable system in which conditions naturally return to equilibrium. The reliance on the assumption of ergodicity is no longer applicable in an era of radical, nonlinear environmental shifts into perma-crises and poly-crises (Magnani et al., 2024; Klooster & Prodani, 2025). The specific failures of these traditional models can be categorized into the following:
5.1.1. The Tragedy of the Horizon
Traditional financial planning and risk management operate on timescales that are fundamentally misaligned with planetary changes. Investment decision cycles in the private sector typically focus on horizons much shorter than the long-term, cumulative impacts of climate change and biodiversity loss (Averchenkova et al., 2016). In addition, parameters in standard risk models are often calibrated using limited historical data, which fails to capture emerging external dynamics, long-term systemic risks, and intergenerational consequences (Butz et al., 2018; Klooster & Prodani, 2025). Also, many models rely on outdated heuristics that are based on simplistic assumptions that do not reflect current scientific understanding of planetary boundaries (Linnenluecke et al., 2015).
5.1.2. Failure to Capture Non-Linear Dynamics
Traditional models are designed for linear, anticipated, and quantifiable changes, making them ineffective for modern ecological crises. Environmental systems are complex adaptive systems subject to tipping points, the abrupt, irreversible shifts that historical data fail to predict (Klooster & Prodani, 2025). Standard models tend to address environmental issues in silos (e.g., only carbon emissions), failing to account for the complex interconnections and unintended consequences, i.e., where solving one problem may inadvertently trigger a breach in another boundary, such as the nitrogen cycle or freshwater use (Williams et al., 2025). Moreover, climate change acts as a risk multiplier, intensifying existing traditional risk categories (e.g., credit or operational risk) in ways that standard management practices have yet to fully understand (Averchenkova et al., 2016; Klooster & Prodani, 2025). Magnani et al. (2024) argue that we have entered a non-ergodic era characterized by radical uncertainty and discontinuous change, in which the old capacity to bounce back to a previously stable state is no longer possible.
5.1.3. Institutional Blind Spots
The prevailing social and legal norms governing corporations create structural barriers to effective risk identification. For example, traditional management models have treated environmental and social issues as peripheral (e.g., CSR initiatives) rather than core financial risks, leading business leaders to ignore the material financial risks posed by violating biophysical limits. In addition, the normative practice of supporting shareholder primacy drives managers to maximize short-term returns while externalizing environmental and social costs. Shifting the purpose of a business from creating value for shareholders and other stakeholders to creating sustainable value within the planetary boundaries would require a regulatory ecology lens at the board (Sjåfjell & Taylor, 2015). Such a shift not only requires changes in legislation but also in social norms, economic thinking, organizational culture, and business model design.
6. Conclusions
Transitioning to sustainable business models (SBMs) to make MNEs resilient and responsible requires stakeholder collaboration across geographies and the value networks. This involves embedding I-R-O and double materiality assessment into core strategies so that business operations across different jurisdictions not only meet regulatory requirements but also align with environmental and social constraints. In essence, it is a nonlinear journey, requiring an MNE to go through learning loops and strategic pivots, leading to new capabilities and a new value-creation logic.
By studying the sustainability practices and reported performance of top Fortune Global 500 firms and their smaller counterparts in the same industry sectors, it is found that, individually, these MNEs are improving on a set of standard sustainability performance parameters across key dimensions: energy, water, emissions, and waste. However, collectively, the larger firms’ ability to limit their negative externalities to create a safe operating space from planetary boundaries (PBs) is nonexistent. Several measures, advocated by ESG rating agencies, study improvement per unit of revenue and thus, for example, even if an MNE improves efficiency of water consumption per unit of revenue, the total water consumption will go up when the firm grows in size, and the collective impact of all MNEs can be disastrous in the long run, in the absence of transformation initiatives. This is critical, as MNEs collectively have the largest environmental footprint on this earth and can thus also enable the shift we are expecting.
This research also compares the approach of smaller firms, which are less than one-third the size of these Fortune Global 500 MNEs. It is found that smaller firms are fast followers in adopting standard sustainability measures and demonstrate positive, monotonic progress on most of these measures. However, despite being known for their innovation in operational processes and their closer connection to local stakeholders than larger MNEs, there is no evidence that smaller firms are pursuing sustainable business transformation with PBs in mind.
Thus, the prevailing approach across the business landscape is inadequate to address the emerging risks posed by natural changes. A significant reason behind this inadequacy is our inability to link scientific data on PBs to the negative externalities of business activities and the consumption of natural resources. While firms individually conduct double materiality assessments and act on them, these actions have little positive impact on global outcomes. Building on earlier research (Clift et al., 2017; Butz et al., 2018), this paper proposes adopting measures such as Economic Intensity Boundaries (EIBs), which can be monitored and tracked by industry bodies. This also ensures that each business organization can identify its fair share of sustainability performance targets.
The second reason, as elaborated in the previous section, is the limitations of traditional enterprise risk management (ERM) models. Predicated on the assumption of ergodicity, i.e., that the economic and social systems in which a corporation operates are static and stable, these models fail to account for environmental and societal changes since they are backward-looking and anticipate future probability using previous data.
To address emergent business risks from PBs, MNEs may consider effectively blending environmental science and business imperatives through (a) adopting concepts such as biosphere stewardship (Österblom et al., 2022), (b) collective monitoring of measures like EIBs, and (c) evolving traditional ERMs to deal with a non-ergodic environment. These can enable them to transition to SBMs and evolve into responsible, resilient organizations. Biosphere stewardship, which calls for an adaptive, collaborative, and knowledge-based process rooted in responsibility and ethics to safeguard the biosphere’s resilience, can recognize the intertwined relationships among business, people, and the planet and, in the process, enable MNEs to emerge as resilient and responsible business organizations.
Overall, this research provides practitioners with insights into the role of PBs in ERM and suggests high-level approaches to addressing this challenge. ERM professionals and business strategists may want to consider scientifically calculated EIBs as constraints while developing growth and transition decisions. While riskification of nature and the integration of planetary boundaries into ERM are expected from MNEs, investors and lenders may want to focus on planetary risk exposure over a longer horizon through appropriate due diligence. At the policy level, regulators may consider revising reporting scope and standards, such as those of IFRS, to capture insights from such riskification. In addition, considering that an MNE is subject to multiple regulators across jurisdictions, coordination among regulators in implementing PBs/EIBs is also essential. The research also contributes to the body of knowledge in corporate sustainability research by identifying the need for effective and advanced risk management frameworks that integrate inputs from planetary science.
However, this research has a few limitations. While the dataset used for empirical analysis is large, it also limits the ability to investigate individual firms and any transformative practices within them. Also, although the sample was drawn from firms headquartered in different jurisdictions, this study could not account for differences in the regulatory dimensions applicable to the firms. In addition, primary data on leading practices and implementation challenges would provide more nuanced insights into the topic.
This study can be taken forward in many ways. First, one may want to explore how MNEs leverage their innovation capabilities towards developing resilience and responsibility. While there is a significant body of literature on innovation at MNEs that leads to superior financial value creation, we have a limited understanding of how these innovation capabilities can be redirected to become resilient and responsible. Second, one can also develop mechanisms to improve traditional ERMs and explore how to incorporate concepts of long-horizon and nonlinear dynamics while addressing embedded institutional blind spots.
Funding
This research received no external funding.
Institutional Review Board Statement
Not applicable.
Informed Consent Statement
Not applicable.
Data Availability Statement
The raw data supporting the conclusions of this article will be made available by the authors on request.
Conflicts of Interest
The author declares no conflict of interest.
References
- Allianz Commercial. (2026). Allianz risk barometer: Identifying the major business risks for 2026. Available online: https://commercial.allianz.com/news-and-insights/news/allianz-risk-barometer-2026.html (accessed on 14 February 2026).
- Antolín-López, R., & Ortiz-De-Mandojana, N. (2023). Measuring and disclosing Environmental, Social and Governance (ESG) information and performance. Publications Office of the European Union. [Google Scholar]
- Aras-Beger, G., & Taşkın, F. D. (2021). Corporate social responsibility (CSR) in multinational companies (MNCs), small-to-medium enterprises (SMEs), and small businesses. In The Palgrave handbook of corporate social responsibility (pp. 791–815). Springer International Publishing. [Google Scholar]
- Averchenkova, A., Crick, F., Kocornik-Mina, A., Leck, H., & Surminski, S. (2016). Multinational and large national corporations and climate adaptation: Are we asking the right questions? A review of current knowledge and a new research perspective. Wiley Interdisciplinary Reviews: Climate Change, 7(4), 517–536. [Google Scholar] [CrossRef] [Scilit]
- Baumann-Pauly, D., Wickert, C., Spence, L. J., & Scherer, A. G. (2013). Organizing corporate social responsibility in small and large firms: Size matters. Journal of Business Ethics, 115(4), 693–705. [Google Scholar] [CrossRef] [Scilit]
- Bjartmarz, T. K., & Bocken, N. M. (2024). Sustainable business models and organizational boundaries—A literature review. Business Strategy and the Environment, 33(7), 6716–6736. [Google Scholar] [CrossRef] [Scilit]
- Buch-Hansen, H., & Nesterova, I. (2023). Less and more: Conceptualising degrowth transformations. Ecological Economics, 205, 107731. [Google Scholar] [CrossRef] [Scilit]
- Busch, T., Bauer, R., & Orlitzky, M. (2016). Sustainable development and financial markets: Old paths and new avenues. Business & Society, 55(3), 303–329. [Google Scholar]
- Butz, C., Liechti, J., Bodin, J., & Cornell, S. E. (2018). Towards defining an environmental investment universe within planetary boundaries. Sustainability Science, 13(4), 1031–1044. [Google Scholar] [CrossRef] [Scilit]
- Bux, C., Geatti, P., Sebastiani, S., Del Chicca, A., Giungato, P., Tarabella, A., & Tricase, C. (2025). Toward an experimental common framework for measuring double materiality in companies. Sustainability, 17(14), 6518. [Google Scholar] [CrossRef] [Scilit]
- Clift, R., Sim, S., King, H., Chenoweth, J. L., Christie, I., Clavreul, J., Mueller, C., Posthuma, L., Boulay, A.-M., Chaplin-Kramer, R., Chatterton, J., DeClerck, F., Druckman, A., France, C., Franco, A., Gerten, D., Goedkoop, M., Hauschild, M. Z., Huijbregts, M. A. J., … Murphy, R. (2017). The challenges of applying planetary boundaries as a basis for strategic decision-making in companies with global supply chains. Sustainability, 9(2), 279. [Google Scholar] [CrossRef] [Scilit]
- Cohen, J. (2013). Statistical power analysis for the behavioral sciences. Routledge. [Google Scholar]
- Committee of Sponsoring Organizations (COSO). (2017). Enterprise risk management: Integrating with strategy and performance. Available online: https://www.coso.org/guidance-erm (accessed on 14 February 2026).
- Daly, H. (2015). Economics for a full world, great transition initiative (June 2015). Available online: http://www.greattransition.org/publication/economics-for-a-full-world (accessed on 10 April 2026).
- De Haas, R., Martin, R., Muûls, M., & Schweiger, H. (2025). Managerial and financial barriers to the green transition. Management Science, 71(4), 2890–2921. [Google Scholar] [CrossRef] [Scilit]
- Doh, J., Budhwar, P., & Wood, G. (2021). Long-term energy transitions and international business: Concepts, theory, methods, and a research agenda. Journal of International Business Studies, 52(5), 951–970. [Google Scholar] [CrossRef] [Scilit]
- Edwards, M. G. (2021). The growth paradox, sustainable development, and business strategy. Business Strategy and the Environment, 30(7), 3079–3094. [Google Scholar] [CrossRef] [Scilit]
- Erin Bass, A., & Grøgaard, B. (2021). The long-term energy transition: Drivers, outcomes, and the role of the multinational enterprise. Journal of International Business Studies, 52(5), 807–823. [Google Scholar] [CrossRef] [Scilit]
- Fernandez-Feijoo, B., Romero, S., & Ruiz, S. (2014). Commitment to corporate social responsibility measured through global reporting initiative reporting: Factors affecting the behavior of companies. Journal of Cleaner Production, 81, 244–254. [Google Scholar] [CrossRef] [Scilit]
- Folke, C., Österblom, H., Jouffray, J. B., Lambin, E. F., Adger, W. N., Scheffer, M., Crona, B. I., Nyström, M., Levin, S. A., Carpenter, S. R., Anderies, J. M., Chapin, S., III, Crépin, A.-S., Dauriach, A., Galaz, V., Gordon, L. J., Kautsky, N., Walker, B. H., Watson, J. R., … de Zeeuw, A. (2019). Transnational corporations and the challenge of biosphere stewardship. Nature Ecology & Evolution, 3(10), 1396–1403. [Google Scholar] [CrossRef] [Scilit]
- Fraser, J., Quail, R., & Simkins, B. (2024). What’s wrong with enterprise risk management? Journal of Risk and Financial Management, 17(7), 274. [Google Scholar] [CrossRef] [Scilit]
- Fritz, C. O., Morris, P. E., & Richler, J. J. (2012). Effect size estimates: Current use, calculations, and interpretation. Journal of Experimental Psychology: General, 141(1), 2–18. [Google Scholar] [CrossRef] [Scilit]
- Gasbarro, F., Iraldo, F., & Daddi, T. (2017). The drivers of multinational enterprises’ climate change strategies: A quantitative study on climate-related risks and opportunities. Journal of Cleaner Production, 160, 8–26. [Google Scholar] [CrossRef] [Scilit]
- Gates, S. (2006). Incorporating strategic risk into enterprise risk management: A survey of current corporate practice. Journal of Applied Corporate Finance, 18(4), 81–90. [Google Scholar] [CrossRef] [Scilit]
- George, G., & Schillebeeckx, S. J. (2022). Digital transformation, sustainability, and purpose in the multinational enterprise. Journal of World Business, 57(3), 101326. [Google Scholar] [CrossRef] [Scilit]
- Gündoğdu, H. G., Aytekin, A., Toptancı, Ş., Korucuk, S., & Karamaşa, Ç. (2023). Environmental, social, and governance risks and environmentally sensitive competitive strategies: A case study of a multinational logistics company. Business Strategy and the Environment, 32(7), 4874–4906. [Google Scholar] [CrossRef] [Scilit]
- Hartmann, J., Inkpen, A. C., & Ramaswamy, K. (2021). Different shades of green: Global oil and gas companies and renewable energy. Journal of International Business Studies, 52(5), 879–903. [Google Scholar] [CrossRef] [Scilit]
- Hug, M., Mayer, H., & Seidl, I. (2022). Transformative enterprises: Characteristics and a definition. Geography Compass, 16(12), e12667. [Google Scholar] [CrossRef] [Scilit]
- International Energy Agency (IEA). (2026). Businesses see competitive value of energy efficiency, but smaller firms struggle to access solutions. Available online: https://www.iea.org/commentaries/businesses-see-competitive-value-of-energy-efficiency-but-smaller-firms-struggle-to-access-solutions (accessed on 10 April 2026).
- Ivanaj, S., Ivanaj, V., McIntyre, J. R., & da Costa, N. G. (2017). MNEs and climate change: Implications for future research. Journal of Cleaner Production, 160, 1–7. [Google Scholar] [CrossRef] [Scilit]
- Karnani, A. (2014). Corporate social responsibility does not avert the tragedy of the commons. Case study: Coca-Cola India. Economics, Management, and Financial Markets, 9(3), 11–23. [Google Scholar]
- Klooster, J., & Prodani, K. (2025). Planetary financial policy and the riskification of nature. Review of International Political Economy, 32(3), 643–667. [Google Scholar] [CrossRef] [Scilit]
- Linnenluecke, M. K., Birt, J., Lyon, J., & Sidhu, B. K. (2015). Planetary boundaries: Implications for asset impairment. Accounting & Finance, 55(4), 911–929. [Google Scholar] [CrossRef] [Scilit]
- Liu, Y., Chen, H., Wang, H., Cui, X., Yang, X., & Li, Z. (2025). Business behavior, energy transition, and sustainability: A case from transnational corporations. International Journal of Energy Research, 2025(1), 2021992. [Google Scholar] [CrossRef] [Scilit]
- Magnani, G., Sanguineti, F., Cavusgil, S. T., & Raskovic, M. M. (2024). Developing resilience: Multinational enterprise business model transformation to mitigate major disruptions. Journal of Business Research, 175, 114549. [Google Scholar] [CrossRef] [Scilit]
- Monazzam, A., & Crawford, J. (2024). The role of enterprise risk management in enabling organisational resilience: A case study of the Swedish mining industry. Journal of Management Control, 35(1), 59–108. [Google Scholar] [CrossRef] [Scilit]
- Nesterova, I. (2021). Small firms as agents of sustainable change. Futures, 127, 102705. [Google Scholar] [CrossRef] [Scilit]
- Newson, R. (2002). Parameters behind “nonparametric” statistics: Kendall’s tau, Somers’ D and median differences. The Stata Journal, 2(1), 45–64. [Google Scholar] [CrossRef] [Scilit]
- Österblom, H., Bebbington, J., Blasiak, R., Sobkowiak, M., & Folke, C. (2022). Transnational corporations, biosphere stewardship, and sustainable futures. Annual Review of Environment and Resources, 47(1), 609–635. [Google Scholar] [CrossRef] [Scilit]
- Patnaik, S., & Fabrizio, K. (2023). A new framework for how firms can manage climate risks. Business Strategy and the Environment, 32, 2228–2242. [Google Scholar]
- Sakschewski, B., Caesar, L., Andersen, L. S., Bechthold, M., Bergfeld, L., Beusen, A., Billing, M., Bodirsky, B. L., Botsyun, S., Dennis, D. P., Donges, J. F., Dou, X., Eriksson, A., Fetzer, I., Gerten, D., Häyhä, T., Hebden, S., Heckmann, T., Heilemann, A., … Rockström, J. (2025). Planetary health check 2025: A scientific assessment of the state of the planet. Available online: https://publications.pik-potsdam.de/rest/items/item_32589_5/component/file_33151/content (accessed on 14 February 2026).
- Schulte, J., & Hallstedt, S. I. (2018). Company risk management in light of the sustainability transition. Sustainability, 10(11), 4137. [Google Scholar] [CrossRef] [Scilit]
- Shad, M. K., Lai, F. W., Fatt, C. L., Klemeš, J. J., & Bokhari, A. (2019). Integrating sustainability reporting into enterprise risk management and its relationship with business performance: A conceptual framework. Journal of Cleaner Production, 208, 415–425. [Google Scholar] [CrossRef] [Scilit]
- Sjåfjell, B., & Taylor, M. B. (2015). Planetary boundaries and company law: Towards a regulatory ecology of corporate sustainability (University of Oslo Faculty of Law Research paper no. 2015-11). University of Oslo. [Google Scholar]
- Teng, X., Wang, Y., Wang, A., Chang, B. G., & Wu, K. S. (2021). Environmental, social, governance risk and corporate sustainable growth nexus: Quantile regression approach. International Journal of Environmental Research and Public Health, 18(20), 10865. [Google Scholar] [CrossRef] [Scilit]
- Van den Bergh, J. C., & Kallis, G. (2012). Growth, a-growth or degrowth to stay within planetary boundaries? Journal of Economic Issues, 46(4), 909–920. [Google Scholar] [CrossRef] [Scilit]
- Van der Waal, J. W., Thijssens, T., & Maas, K. (2021). The innovative contribution of multinational enterprises to the sustainable development goals. Journal of Cleaner Production, 285, 125319. [Google Scholar] [CrossRef] [Scilit]
- Whiteman, G., Walker, B., & Perego, P. (2013). Planetary boundaries: Ecological foundations for corporate sustainability. Journal of Management Studies, 50(2), 307–336. [Google Scholar] [CrossRef] [Scilit]
- Wickert, C., Scherer, A. G., & Spence, L. J. (2016). Walking and talking corporate social responsibility: Implications of firm size and organizational cost. Journal of Management Studies, 53(7), 1169–1196. [Google Scholar] [CrossRef] [Scilit]
- Williams, A., Perego, P., & Whiteman, G. (2025). Boundary conditions for organizations in the Anthropocene: A review of the planetary boundaries framework 10 years on. Journal of Management Studies, 62(4), 1811–1846. [Google Scholar] [CrossRef] [Scilit]
- Wong, C. W., Wong, C. Y., & Boon-itt, S. (2020). Environmental management systems, practices and outcomes: Differences in resource allocation between small and large firms. International Journal of Production Economics, 228, 107734. [Google Scholar] [CrossRef] [Scilit]

Disclaimer/Publisher’s Note: The statements, opinions and data contained in all publications are solely those of the individual author(s) and contributor(s) and not of MDPI and/or the editor(s). MDPI and/or the editor(s) disclaim responsibility for any injury to people or property resulting from any ideas, methods, instructions or products referred to in the content. |
© 2026 by the author. Licensee MDPI, Basel, Switzerland. This article is an open access article distributed under the terms and conditions of the Creative Commons Attribution (CC BY) license.