


Abstract
Understanding how information flows across financial segments during global crises is crucial for analyzing complex and highly interconnected markets. This study investigated the dynamic information flow between cryptocurrencies, commodities, stock market indices of G10 countries, five-year sovereign CDS spreads, ten-year government bond yields, foreign exchange market variables, and technology company stocks using daily return data spanning from 1 January 2018 to 24 March 2026. Transfer Entropy is estimated using two alternative approaches: directly from the original variables and from independent components obtained via Independent Component Analysis (ICA), which reduces noise and uncovers latent relationships. A sliding-window framework is employed to capture time-varying directional information flow and to assess changes across major global events, including the COVID-19 pandemic, the Russia–Ukraine conflict, and the Middle East tensions. The results indicate that the magnitude and direction of information flow change significantly during crisis periods, revealing an event-sensitive and dynamically evolving connectivity structure between financial segments. Overall, the integration of ICA and Transfer Entropy provides a clearer and more reliable representation of directional interactions in multidimensional financial systems under the conditions of heightened uncertainty.
1. Introduction
Numerous studies have explored causal links between pairs of financial time series; however, understanding these connections within complex systems remains a challenge. Various methods have been developed to uncover these relationships, especially under external shocks such as global conflicts, political tensions, inflation, or pandemics. Events such as the COVID-19 pandemic (Goodell, 2020) and geopolitical tensions continue to disrupt financial stability and asset prices, highlighting the crucial role of crises in shaping global return dynamics. Since many assets in the global market are interconnected, identifying the impacts of crises and interpreting them can be challenging. Moreover, the direction of information flow between assets tends to shift during periods of crises (Assaf et al., 2023; Maiti & Kayal, 2023), further complicating the analysis of these relationships. Many assets, such as stock markets, the cryptocurrency market, commodity prices, inflation, and CDS, exhibit nonlinear relationships and influence each other either directly or indirectly (Bouri et al., 2021). For example, climate shocks amplify the interconnectedness of cryptocurrencies, increasing systematic risk spillovers between them (Guo et al., 2024).
Since the introduction of Bitcoin in 2009, financial markets have become increasingly complex, and the number of influencing factors has grown significantly. Traditional stock and commodity markets always had challenges due to the noise problem caused by ever-changing global circumstances. The introduction of crypto markets has further intensified this noise, increasing transitivity between cryptocurrencies and traditional markets (Rehman & Apergis, 2019). Consequently, cryptocurrency markets have become more integrated with traditional markets, leading to increased uncertainty and noise. Since the COVID-19 pandemic, the cryptocurrency market has experienced a notable transformation, gradually evolving into a highly interconnected component of the global financial system. This shift highlights the growing integration of cryptocurrencies with traditional financial markets, making them an important factor in global financial dynamics (Wątorek et al., 2023).
To reduce noise and uncertainty, researchers can apply Independent Component Analysis (ICA) to time-series data. ICA identifies hidden signals by decomposing the data into independent components. In this way, researchers can determine the influence of underlying factors on the time series. By uncovering these driving forces, ICA provides valuable insights into time-series dynamics (Civan et al., 2023) and has proven effective in identifying the hidden factors, enhancing the understanding of complex systems, and reducing noise in the data (Hyvarinen et al., 2001). Traditional methods such as Granger causality (Granger, 1969) and lagged cross-correlation (Ramchand & Susmel, 1998) have limitations. Although widely used to analyze dependencies between financial variables, they rely on restrictive assumptions that may limit their ability to capture complex interactions. Granger causality captures only one-way flow and ignores possible feedback loops in complex systems. Similarly, lagged cross-correlation cannot distinguish directionality or mutual interactions. Entropy-based methods address these issues by evaluating uncertainty from full probability distributions (Shannon, 1948). Unlike Granger, Transfer Entropy captures bidirectional and nonlinear dependencies through probabilistic state transitions, without assuming any distribution (Schreiber, 2000). In this context, traditional methods are generally based on linear assumptions and may fail to capture the complex and nonlinear interactions observed in global financial systems, whereas Transfer Entropy provides a model-free framework that enables a more comprehensive analysis of directional dependencies without imposing restrictive assumptions on the underlying data-generating process.
ICA is employed in this study as a statistical decomposition tool to address the complex dependency structure observed in financial time series. Financial markets are typically characterized by strong co-movements, common market factors, and cross-asset linkages, which result in highly correlated and noisy data structures. In such environments, direct analysis of observed series may lead to misleading or diluted interpretations of directional relationships, as shared information across variables can mask the true direction of information flow. To address this issue, ICA is applied to transform the original correlated series into statistically independent components by separating mixed signals into latent structures. Rather than assuming that the extracted components correspond directly to observable economic factors, ICA is used to approximate underlying dynamics and to reduce the effect of correlated noise. This transformation enables the analysis of information transfer on a less noisy and more structured representation of the data, thereby facilitating a clearer identification of directional interactions. In this context, ICA is not interpreted as identifying explicit economic drivers, but rather as a methodological step that supports the isolation of hidden interaction patterns and underlying dynamics that may otherwise remain obscured in the original financial series.
This study explored the information flow between cryptocurrency markets, five-year sovereign CDS spreads, ten-year government bond yields of G10 countries, foreign exchange market variables, stock prices of the top 10 technology companies, commodities, and stock market indices of G10 countries using Transfer Entropy. Our methodology focuses on measuring information flow between time series through Transfer Entropy estimation, observing changes over time or during and after a crisis to understand how information moves between systems and how strong that connection is. In this context, the study adopts a time-varying perspective, allowing the strength and direction of information flow to evolve across different periods, particularly during crisis episodes, while capturing nonlinear and directional dependencies through a non-parametric Transfer Entropy framework. In addition, market-based approaches, such as time-varying beta models, have been widely used to capture the dynamic sensitivity of financial assets relative to benchmark indices (Ustaoğlu, 2022). Within this framework, this study focuses on directional information flow across segments, providing a complementary perspective on the interaction structure of global financial markets. This study aims to address the following research questions: (i) What is the connectivity between cryptocurrencies and traditional investment types regarding their performance? (ii) What is the role of cryptocurrencies, CDS, stock prices, and commodities in the global financial system—are they influencing actors, or are they primarily influenced within this structure? (iii) What are the most influential and affected drivers in the global financial system? (iv) In which markets do global crises create the biggest change in the direction of information flow? (v) What change is observed in the quantity of information flow when noise is eliminated from time series using ICA?
Despite the growing use of Transfer Entropy in financial studies, existing research has often focused on pairwise relationships within a single market or asset class. While these approaches provide valuable insights, they may offer a limited view of how information is transmitted across different segments of the global financial system. In addition, the potential influence of hidden structures and noise in high-dimensional financial data is not always fully addressed, which may affect the accurate identification of dependency patterns. To address these challenges, this study adopts a multi-segment framework that examines information flow across diverse financial markets simultaneously, with a particular focus on the interconnections between cryptocurrencies and traditional investment instruments and their roles within the global financial system. Furthermore, by integrating ICA with Transfer Entropy, the analysis aims to uncover latent relationships, reduce noise, and provide a clearer representation of underlying information dynamics. Moreover, the use of a sliding-window framework allows the study to capture the time-varying nature of information flow and track the evolution of relationships across different market conditions and crisis periods, and to assess how global shocks influence the direction and intensity of information transmission. Unlike traditional pairwise analyses, this approach enables the identification of key influencing and influenced segments within the financial system, offering a broader perspective on how shocks propagate across global markets. Most existing studies focus on pairwise or intra-asset-class relationships, whereas this study examines inter-segment information flow within a large-scale financial system using an ICA-based Transfer Entropy framework.
This study makes several notable contributions. First, unlike prior research focusing mainly on Bitcoin or specific commodities such as gold, or relying on pairwise analyses between individual assets, we adopt a broader, multi-segment perspective encompassing ten major cryptocurrencies, the largest ten stock market indices of G10 countries, top ten commodities, ten leading global technology stocks, five-year sovereign CDS spreads from ten countries, ten-year government bond yields of G10 countries, and foreign exchange market variables, comprising a total of 70 financial time series across seven asset classes. Second, we calculate Transfer Entropy using ICA-derived components to reduce noise and uncover hidden relationships, thereby providing a more reliable and informative analysis. While Transfer Entropy is robust for detecting dependencies, it requires large datasets (Kim et al., 2020). Third, the analysis focuses on periods of heightened political and economic volatility to capture changes in information flow dynamics (e.g., COVID-19, Russia–Ukraine conflict, Israel–Iran tension, post-pandemic inflation, and election periods) to explore how crises alter market interdependencies. Overall, this comprehensive and multi-dimensional approach enhances the understanding of financial dynamics during turbulent times. Lastly, the study applies a sliding-window approach to evaluate how ICA influences dynamic connectivity, aiming to reveal clearer, less noisy interactions in volatile times. This approach helps us understand the impact of extraordinary events on two-way interactions between variables. The sliding-window approach is based on the assumption that relationships between financial variables are not static but evolve over time, particularly during periods of market stress, and captures the time-varying structure of information flow by estimating Transfer Entropy over successive sub-samples of the data.
2. Literature Review
2.1. Information Theoretic Causality in Financial Markets
Over the past few decades, the relationships in various financial time series have been a major focus of research. Since the development of Granger causality, numerous studies have examined connectivity across financial variables. For example, the relationship between Hong Kong’s stock prices and interest rates has been analyzed using autoregressive integrated moving average models combined with Granger causality tests (Mok, 1993). The findings revealed a one-way causality from stock prices to interest rates, while bidirectional causality between stock prices and exchange rates remained weak. However, Granger causality may fail to capture nonlinear dependencies due to its linear structure (Bastos & Schoffelen, 2016).
As an alternative, Transfer Entropy has been introduced as a nonparametric measure to capture nonlinear and directional information flow. It applies the principle of causality using conditional probabilities within the framework of information theory and is robust to missing observations and noise (Edinburgh et al., 2021). Nevertheless, it has been shown that Transfer Entropy and Granger causality are equivalent under Gaussian assumptions (Barnett et al., 2009). A methodological framework has also been proposed to quantify information transfer in continuous-time processes, offering important insights for financial and biological systems (Kaiser & Schreiber, 2002).
There is also an ongoing debate regarding the distinction between information transfer and causal effect. It was emphasized in (Lizier & Prokopenko, 2010) that these concepts should not be treated as identical, highlighting that Transfer Entropy reflects information flow rather than direct causality.
Recent studies have further strengthened the role of Transfer Entropy in financial applications, particularly in capturing nonlinear and directional information flows across markets. Early empirical evidence provided by (Marschinski & Kantz, 2002) demonstrated that Transfer Entropy can effectively identify information flow between financial time series, revealing dependencies that are not detectable using traditional linear approaches. This study represents one of the foundational contributions showing that financial interactions are inherently nonlinear and require more flexible frameworks for proper characterization. Building on this perspective, (Kwon & Yang, 2008) investigated information flow between international stock indices and provided evidence of asymmetric and directional transmission mechanisms across global markets. Their findings indicate that developed markets tend to act as dominant sources of information, influencing other markets in a non-uniform and time-varying manner.
Furthermore, (Dimpfl & Peter, 2013) applied Transfer Entropy to measure information flows across financial markets and confirmed that it serves as a robust tool for identifying dynamic and nonlinear interdependencies. Their results emphasize that financial markets exhibit complex interaction structures that evolve over time, and that Transfer Entropy provides a suitable framework for capturing these dynamics beyond conventional econometric techniques. Taken together, these studies establish Transfer Entropy as a powerful and flexible methodology for analyzing information transmission in financial systems, highlighting that financial markets are characterized by nonlinear, asymmetric, and time-varying dependencies.
2.2. Financial Networks and Spillover Effects
Financial markets are inherently interconnected systems, and these interdependencies become more pronounced during periods of financial stress. Examining the directional flow of information provides valuable insights into contagion dynamics and systemic risk. In this context, Transfer Entropy has been widely used to capture information flow, interconnectedness, and network structures in financial systems (Sandoval, 2014).
Empirical evidence shows that interdependencies between stock markets intensify during crisis periods, suggesting that financial systems behave as tightly connected complex networks under heightened uncertainty (Rocchi et al., 2017). Moreover, the direction of information flow may change across different market regimes. For instance, it has been observed that the direction of information flow between gold and oil reversed between pre- and post-COVID-19 periods (Maiti & Kayal, 2023).
Time-varying approaches further highlight the dynamic nature of financial interconnectedness. A sliding-window Transfer Entropy framework applied to the BIST100 index and exchange rates shows that the magnitude and direction of information flow evolve over time, particularly during structural breaks such as financial crises (Unal & Eroglu, 2022).
Transfer Entropy has also been widely applied in cryptocurrency markets, where complex network structures and nonlinear interactions are prevalent. It has been used for feature selection in predictive models (Garcia-Medina & Gonzalez, 2020), early warning signals of financial turbulence (Garcia-Medina & Hernandez, 2020), and the analysis of integration and contagion dynamics during crisis periods (Almeida et al., 2023). Additionally, combining Transfer Entropy with explainable AI has been shown to improve predictive performance in cryptocurrency markets (Barak & Parvini, 2023).
The role of information flow has also been explored in cross-market interactions. Studies examining the relationship between cryptocurrencies, energy markets, and electricity consumption reveal strong directional dependencies, indicating significant interconnectedness across asset classes (Almeida et al., 2024; Huynh et al., 2022).
The literature on financial connectedness and spillover effects has been significantly advanced by studies that model financial systems as interconnected networks. In this context, (Diebold & Yilmaz, 2014) developed a framework based on variance decompositions derived from vector autoregressive models to quantify the degree of connectedness between financial institutions. Their approach enables the identification of directional spillovers and allows for the characterization of financial systems regarding network topology, distinguishing between net transmitters and receivers of shocks. Similarly, (Billio et al., 2012) investigated systemic risk and interconnectedness within the financial and insurance sectors using a range of econometric methods, including Granger causality and principal component analysis. Their findings demonstrate that financial institutions are highly interconnected, and that shocks originating in one part of the system can rapidly spread to others, amplifying systemic risk.
Taken together, these studies establish the importance of network-based approaches in analyzing financial systems, emphasizing that interconnectedness and spillover effects are fundamental characteristics of modern financial markets. In this context, financial systems can be interpreted as complex networks in which shocks are transmitted across markets, reinforcing the relevance of frameworks that capture directional and dynamic information flows.
2.3. Dimensionality Reduction and Signal Extraction in Financial Time Series
ICA was first introduced in 1986 (Herault & Jutten, 1986), although early approaches lacked theoretical clarity and broad applicability (Tharwat, 2021). The method gained recognition after the formal introduction of the term by (Comon, 1994) and has since become a widely used technique for signal separation and feature extraction.
Originally developed for signal processing, ICA has been successfully applied in various domains, including finance, neuroscience, and biomedical data analysis (Dogan & Akinci, 2013). The first empirical application in finance dates back to (Back & Weigend, 1997), where ICA was used to analyze stock returns and compared with Principal Component Analysis (PCA).
Financial markets are characterized by high levels of noise and latent structures. ICA has been shown to be effective in filtering noise and extracting underlying factors driving financial systems (Civan et al., 2023; James & Hesse, 2005). As a result, it is widely regarded as a powerful tool for uncovering hidden dynamics in complex financial datasets.
Financial time series are typically characterized by strong co-movements and high levels of correlation across assets, largely driven by common market factors and shared information structures. Empirical evidence suggests that underlying factors play an important role in shaping financial dynamics, and decomposition-based approaches can be used to identify such structures. For instance, Xian et al. (2020) applied an EEMD-ICA framework and show that financial time series can be decomposed into statistically independent components that reflect underlying factors such as cycles, demand–supply conditions, and broader economic influences. These findings support the view that observed financial series may contain mixtures of hidden components that contribute to the overall dependence structure. In such settings, direct analysis of observed series may be affected by shared variation across variables, making it difficult to isolate underlying information.
ICA provides a statistical framework in which observed data are modeled as mixtures of underlying components and transformed into signals that are as independent as possible (Comon, 1994). Even when full independence cannot be achieved, ICA produces component signals with reduced dependence, allowing a clearer representation of the underlying data structure. In financial applications, this property is particularly relevant as it enables the separation of highly correlated structures and the identification of hidden components without imposing strong economic assumptions (Back & Weigend, 1997; Cha & Chan, 2000). In addition, ICA-based approaches have been shown to reduce noise in financial time series. For example, Liu and Wang (2011) demonstrated that combining ICA with other methods helps to filter correlated noise and improve the quality of extracted signals.
In the context of financial factor modeling, Garcia-Ferrer et al. (2012) proposed a conditionally heteroskedasticity independent factor model (GICA-GARCH) in which ICA is combined with multivariate GARCH structures to extract independent components and capture common factors together with volatility dynamics. This framework highlights that in the presence of high correlation and structural dependence, ICA-based approaches can help separate latent components and better represent common variation in financial returns. Overall, ICA can be interpreted as a statistical transformation that disentangles dependent structures and reduces the effect of correlated noise, rather than directly identifying specific economic factors. From this perspective, ICA is not used to identify specific economic drivers, but rather to provide a statistical representation that facilitates the detection of hidden interactions and structural dependencies within financial time series.
The independent components extracted via ICA do not necessarily correspond one-to-one with observable macroeconomic variables such as interest rate shocks or inflation surprises. Instead, as shown by (Back & Weigend, 1997), these components can be interpreted as statistically independent latent sources contributing to the observed co-movements and price dynamics in financial markets. In this study, the ICA components are therefore treated as latent representations that help disentangle common market influences and correlated noise, rather than as direct representations of specific economic factors.
2.4. Integration of ICA and Transfer Entropy
The recent literature highlights a growing interest in combining ICA and Transfer Entropy to analyze complex systems. This integrated approach first extracts independent components from noisy data and then examines directional information flow between these components.
Applications of this framework have been widely observed in neuroscience. For example, ICA and Transfer Entropy have been jointly used to analyze brain activity through EEG signals, revealing time-varying information flow and functional connectivity patterns (Diez et al., 2015; Vakorin et al., 2010). Similarly, this combination has been applied to classify stress states by identifying changes in neural activity patterns (Dong et al., 2024).
More recently, this integrated framework has also been applied to financial markets. The relationship between investor attention and cryptocurrency markets has been analyzed using ICA and Transfer Entropy, demonstrating that investor sentiment plays a significant role in shaping price dynamics and volatility (Neto, 2022). Overall, the ICA–Transfer Entropy framework provides an effective methodology for analyzing directional dependencies in noisy and complex financial systems.
The existing literature, while extensive, generally examines these strands in isolation. Information-theoretic approaches focus on directional dependencies, financial network studies emphasize interconnectedness, and dimensionality-reduction techniques aim to extract latent structures. However, the joint application of these approaches remains limited, particularly in multi-asset and inter-segment financial systems. This study addresses this gap by integrating ICA with Transfer Entropy to provide a unified framework for analyzing directional information flow across financial markets.
3. Methodology
3.1. Transfer Entropy
Transfer Entropy, introduced by (Schreiber, 2000), quantifies directional information transfer between stochastic processes. The measure is non-parametric and can capture dependencies that are not limited to linear relationships. For this reason, it has been applied in many disciplines, including neuroscience, social network research, and financial market analysis, where interactions between variables are often complex and asymmetric (Kim et al., 2020).
In systems where two variables interact, historical observations of one time series, denoted as Y, can contribute information about the future behavior of another time series, X. If X is assumed to follow a Markov process of order k, its future state depends exclusively on the previous k observations of X. This relation can be formulated as follows:
Consider a situation in which the future value of process X is influenced not only by its own past observations but also by the previous l observations of another process Y. In this case, the directional influence from Y to X can be evaluated using Transfer Entropy. Transfer Entropy quantifies how much additional predictive information the past values of Y contribute to estimating the next state of X, beyond that contained in the past values of X.
Transfer Entropy is based on Shannon’s information theory framework (Shannon, 1948). If the future value of process X is influenced by the past k observations of X and the past l observations of another process Y, the Transfer Entropy from Y to X can be expressed as follows:
Here, . The notation denotes the vector of the previous k observations of X, given by , while represents the vector containing the previous l observations of Y, defined as .
Overall, quantifies the additional information about the future value of that is obtained when the past values of are used together with the past values of . If only the past values of are used, this additional contribution cannot be captured. A positive value of means that Y helps to explain the future behavior of X. Larger Transfer Entropy values indicate stronger information transfer between the variables. Since Transfer Entropy is asymmetric, the effect from Y to X is measured by , while the effect from X to Y is measured separately by .
3.2. Independent Component Analysis
ICA is a method that separates a complex signal into statistically independent components that follow non-Gaussian distributions. It was originally developed in signal processing to identify underlying independent sources from observed data without requiring prior knowledge of how the signals were combined (Cha & Chan, 2000). For instance, an observed sound signal at time t is usually a mixture of signals originating from several different sources. A well known illustration of this idea is the cocktail party problem, where the objective is to isolate a single person’s speech in a crowded environment with many simultaneous conversations. In this sense, ICA can be considered a particular case of blind source separation (Hyvarinen, 2013). In blind source separation problems, only the observed mixed signals are available, and the structure of the mixing process is unknown. Therefore, the main task is to estimate the mixing matrix using the available information. Once the mixing matrix is obtained, assumptions about the underlying independent signals can be made (Hyvarinen & Oja, 2000).
ICA is often compared with PCA because both methods transform linearly observed signals into separate components. However, the objectives of the two techniques are different. ICA relies on higher-order statistical information, such as kurtosis, to detect statistically independent signals, whereas PCA assumes normally distributed data, while ICA explicitly exploits non-Gaussianity. Moreover, PCA orders components according to the amount of explained variance, whereas ICA focuses on recovering independent source signals (Back & Weigend, 1997).
Instead of observing the source signals directly, ICA starts from the mixed observations and assumes that these mixtures are produced by an unknown linear mixing of latent sources . Here, t is the time index and denotes the observed series. Since only is observed, the source signals are inferred from the data. The model is summarized by the following linear equation (Hyvarinen & Oja, 2000).
ICA separates an observed signal vector x into statistically independent components, denoted by y. The observed data are interpreted as mixtures produced by several latent source signals. In this setting, the vector X can be represented through a mixing model involving n independent source components .
Let denote the vector of independent source signals, and let represent the observed mixtures. In the ICA setting, neither the sources nor the mixing matrix A are directly observable, while only the data matrix X is available. The goal of ICA is therefore to recover the underlying sources by estimating the mixing structure from the observed data. This is typically achieved by determining a matrix W that separates the mixed signals into statistically independent components (Back & Weigend, 1997).
Consider the case where the number of observed variables is the same as the number of source signals. In this situation, the mixing matrix A is a square matrix of size . If the separating matrix is defined as , the transformation leads to , meaning that the original source signals are recovered from the observed mixtures. To estimate the separating matrix W, several assumptions about the data are usually adopted (Back & Weigend, 1997; Civan et al., 2023; Tharwat, 2021).
- The source signals are assumed to be statistically independent.
- The independent components are required to follow non-Gaussian distributions, with at most one component allowed to be Gaussian. In practice, non-Gaussianity in ICA is commonly evaluated using kurtosis.
- The signals are assumed to be stationary, and the observed variables and the independent components are centered to obtain zero mean.
To recover the source signals S from the observed data X, it is necessary to estimate the mixing matrix A such that the resulting components are as statistically independent as possible. The FastICA algorithm estimates independent components by identifying projections of the data whose distributions differ from a Gaussian distribution. The algorithm is carried out by maximizing an approximation of negentropy through a fixed-point iteration procedure (Hyvarinen, 1999). One advantage of FastICA is that it does not require a learning rate or other tuning parameters. The method can also operate in a one-unit mode, where a single independent component is extracted by identifying the weight vector associated with that component. In this procedure, the weight vector is iteratively updated in the direction that maximizes non-Gaussianity (Tharwat, 2021). As a preprocessing step, the data are first centered and then whitened (Fabozzi et al., 2015). Through this transformation, the observed signals are converted into a new set of variables with uncorrelated components, each having zero mean and unit variance (Kumiega et al., 2011).
3.3. Data
We analyze the daily return series of major global financial assets over the period from 1 January 2018 to 24 March 2026, including the top ten cryptocurrencies, commodities, the ten largest stock market indices of G10 countries, five-year sovereign CDS spreads of ten major economies, stock prices of the world’s largest technology firms, ten-year government bond yields of G10 countries, and the top ten most actively traded foreign exchange pairs. Table 1 summarizes the time series and their corresponding segments used in this analysis.
Table 1.
Dataset and segments.
The selection of asset classes in this study is designed to capture the main transmission channels of the global financial system from a multi-segment perspective and to better understand how global markets are affected during periods of crisis. Cryptocurrencies represent alternative and speculative investment instruments, and the selected assets correspond to the top ten cryptocurrencies by market capitalization. Commodity markets reflect global supply-and-demand dynamics. In addition, the analysis includes the ten largest stock market indices from G10 countries to reflect major equity market movements in the global financial system. Sovereign CDS spreads reflect country-level credit risk and market perceptions of default risk, and are based on five-year CDS contracts selected from G20 countries with well-established and reliable historical data availability. Technology sector stocks represent high-growth and innovation-driven segments of equity markets. Government bond yields capture the interest rate channel and macroeconomic expectations, and the analysis focuses on ten-year government bond yields of G10 countries as standard benchmarks in global fixed income markets. Foreign exchange variables represent global financial linkages and cross-border capital flows, and are selected based on the top ten most actively traded currency pairs in terms of market volume. While alternative asset allocation strategies such as value, growth, or low-volatility portfolios may also offer additional perspectives, the focus of this study is primarily on examining information transmission across major financial segments.
3.4. Crisis Periods
The sample period, spanning from 1 January 2018 to 24 March 2026, covers a sequence of major global events that significantly reshaped financial markets and intensified cross-market interactions. It includes the COVID-19 pandemic in 2020, followed by global supply chain disruptions in 2021, which created production bottlenecks, logistical constraints, and rising costs across economies. These developments were accompanied by expansionary monetary policies during the pandemic, which later contributed to persistent inflationary pressures and were followed by aggressive interest rate hikes by major central banks. In addition, economic stress factors such as the global energy crisis, instability in China’s property market, and concerns over a potential slowdown in the U.S. economy further increased market fragility.
Geopolitical and political developments further amplified global uncertainty during the sample period. These include the Russia–Ukraine conflict, growing strategic rivalry between China and the United States, tensions surrounding China–Taiwan relations, and regional risks involving India–Pakistan. In the Middle East, tensions expanded beyond Israel–Iran dynamics into a broader Israel–Iran–United States–Gulf states security environment, where risks of disruption in the Strait of Hormuz became a major concern for global markets. Given the critical role of the Strait of Hormuz in global energy transportation, such risks triggered chain effects in oil, gold, and broader commodity markets, while also increasing volatility and uncertainty across financial assets. In addition, global trade tensions and tariff-based policy measures, as well as major election cycles including the 2024 elections across several G10 countries, influenced investor expectations, capital flows, and policy outlooks. Taken together, these overlapping economic, geopolitical, and political shocks highlight the highly dynamic and volatile structure of global financial markets during the study period.
In this study, crisis windows are defined based on major global events that significantly affected financial markets. Although the World Health Organization officially ended the Public Health Emergency of International Concern related to COVID-19 on 5 May 2023, financial markets began to normalize earlier, particularly during 2021–2022, following widespread vaccination and the gradual easing of containment measures. Consistent with prior financial studies that define the COVID-19 period as spanning from 30 January 2020 to 31 December 2021 (Cheema et al., 2022; Darjana et al., 2025; Karadag & Golbasi Simsek, 2023), the sample is divided into three sub-periods: pre-COVID-19 (1 January 2018–29 January 2020), COVID-19 period (30 January 2020–31 December 2021), and post-COVID-19 (1 January 2022–5 May 2023), with the end date aligned with the World Health Organization’s declaration marking the end of the global health emergency. In addition, major geopolitical events are incorporated into the analysis through defined crisis windows. The Russia–Ukraine conflict is defined as starting on 24 February 2022 (Izzeldin et al., 2023), with pre-conflict (1 January 2018–23 February 2022) and post-conflict (24 February 2022–ongoing) periods. Similarly, the Iran–Israel–U.S. conflict is considered from 28 February 2026 onward (Reuters, 2026), with pre-conflict (1 January 2018–27 February 2026) and post-conflict (28 February 2026–ongoing) periods.
Despite the presence of multiple overlapping economic and geopolitical developments during the sample period, this study focuses specifically on the COVID-19 pandemic, the Russia–Ukraine conflict, and the Iran–Israel–U.S. conflict as representative crisis episodes. These events are selected because they constitute major global shocks with widespread and immediate effects across multiple financial segments, including equity, commodity, fixed income, and foreign exchange markets. Unlike more localized or gradually evolving developments, these crises are characterized by clearly identifiable starting points, high global relevance, and strong transmission mechanisms across markets, making them particularly suitable for analyzing time-varying information flow dynamics. Therefore, the selection of these crisis periods is guided by their systemic impact, global scope, and their ability to generate significant shifts in cross-market interactions within the financial system.
3.5. Analysis Design
At the beginning of the study, the augmented Dickey–Fuller (ADF) unit root test was applied to assess the stationarity properties of the original series at the 95% confidence level. The results indicated that the series were non-stationary. Therefore, the original series were transformed to daily return data (percentage change). Following this transformation, the ADF test was applied again to the return series, and the results showed that all series are stationary at the 95% confidence level. Based on these findings, no further data transformations were required.
Transfer Entropy was calculated for each series permutation in the TEOV (Transfer Entropies based on original variables) approach, while in the TEIC (Transfer Entropies based on independent components) approach, it was computed using the ICA-derived independent components based on each component permutation.
Using ICA, we removed noise and false positives, refining our analysis to focus on stronger connections. We compared two methods: the first used raw daily returns for 70 time series to calculate Transfer Entropy, filtering for statistically significant links (95% confidence interval). The second applied ICA by category (e.g., cryptocurrencies, commodities, stocks) to produce noise-free data before recalculating Transfer Entropy. This comparison allowed us to eliminate weak or misleading connections and emphasize the most reliable relationships in global finance. Figure 1 presents the methodological summary diagram of the study, illustrating the step-by-step procedures applied in the TEOV and TEIC approaches.
Figure 1.
Methodological framework of the study.
Figure 1 summarizes the methodological framework of the study. After data preparation, we applied two approaches: Transfer Entropy was first computed directly on the original dataset and then on ICA-derived components to reduce noise and uncover hidden relationships in complex financial systems. Furthermore, turbulent global periods were examined using a sliding-window approach to evaluate how crises influence dynamic and bidirectional information flow between financial segments.
Based on the daily return series of a broad set of global financial indicators, the TEOV approach was used to estimate dynamic connectivity through Transfer Entropy retaining only statistically significant connections at the 95% confidence level. Entropy estimation was conducted under a first-order Markov structure, where the current value of X depends on one lagged observation, and the same lag specification was applied to Y. The lag order was set to one. This is a commonly used specification to capture short-term information transfer while limiting dimensionality. The Renyi Entropy weighting parameter was set to 0.1. Lower q values are known to produce higher entropy estimates, allowing information flow and risk transmission to appear more clearly (Maiti & Kayal, 2023). As q increases, Renyi Entropy converges to Shannon Entropy.
The estimation was implemented within a nonparametric framework. Probability distributions were inferred from the empirical distribution of the observed return series within the estimation procedure. Transfer Entropy estimation can be sensitive to discretizations, embedding, and sample size. To address this, a first-order embedding structure was used, which is consistent with the default estimation setting. In the estimation procedure, the empirical distribution is partitioned using quantile thresholds (5 percent and 95 percent), allowing the computation of empirical probabilities. Statistical significance was evaluated using 300 bootstrap replications. In addition, 100 shuffled realizations were used to compute effective Transfer Entropy. The shuffled series are used to estimate and correct for small-sample bias. The bootstrap procedure allows empirical distributions of the estimates to be constructed. These steps help reduce finite-sample bias and improve the robustness of the reported information flows.
The ICA method was applied to maximize the statistical independence through negentropy optimization. The “logcosh” nonlinearity parameter was selected due to its effective balance between sensitivity and robustness. This choice is commonly preferred due to its stable performance in capturing non-Gaussian structures while maintaining robustness to noise. The alpha parameter, which controls the sharpness of this function, was set to 1. The maximum number of iterations was limited to 200, and the convergence tolerance was set to 0.0001. These settings ensure stable convergence and consistent extraction of independent components.
The resulting components are centered, whitened, and statistically independent, which helps reduce noise in the data. Weak or irrelevant connections are filtered out, while stronger and more meaningful relationships remain. Transfer Entropy was then computed on these components in the TEIC approach. This allows the information flow structure to be evaluated after noise reduction and signal separation.
In the TEIC approach, each series was grouped into segments based on asset class; for example, Ripple (XRP) was included in the cryptocurrency segment, while silver was categorized under commodities. Each segment contained 10 different time series. After segmentation, ICA was applied within each segment using the FastICA algorithm, with the number of components set to 10 to extract statistically independent latent sources from the observed multivariate signals.
Before applying FastICA in the TEIC analytical approach, we checked multivariate normality in the dataset with Mardia’s Test. This test evaluates two critical dimensions of multivariate normality—skewness and kurtosis—under the null hypothesis that the data follows a multivariate normal distribution. The results of the test are presented in the Table 2 below.
Table 2.
Results of Mardia’s multivariate normality test.
Table 2 reports the results of Mardia’s test for multivariate normality. The test statistics for skewness and kurtosis are statistically significant (p < 0.01), indicating that the null hypothesis of multivariate normality is rejected at the 95% confidence level. This result is methodologically valuable because ICA is particularly effective when applied to non-Gaussian data, as it aims to extract statistically independent sources by maximizing negentropy, a measure of non-Gaussianity (Hyvarinen & Oja, 2000). Therefore, based on the rejection of normality, the application of the FastICA algorithm is statistically justified in this study.
4. Results and Discussion
4.1. Comparison of TEOV and TEIC Approaches
The number of statistically significant information flow connections is summarized for the TEOV and TEIC approaches according to their directional structure (two-way and one-way) in Table 3.
Table 3.
Detected information flow connections by direction: TEOV vs. TEIC.
As seen from Table 3, in the TEOV approach, a total of 1457 significant connections were identified at the 95% confidence level. In contrast, the TEIC approach, which used noise-reduced signals via ICA, revealed 1047 significant connections, representing a 28.1% reduction in overall connectivity. More specifically, the TEOV approach detected 562 two-way and 895 one-way information flows, whereas the TEIC approach resulted in 308 two-way and 739 one-way connections. This corresponds to a 45.1% decrease in two-way information flow, suggesting that many of these connections may have been noise-driven, weak, or spurious. In contrast, the one-way connections declined by only 17.4%, indicating that most of the genuine directional relationships were preserved after noise reduction through ICA. Overall, the results of this study indicate that the number of connections decreases significantly following the ICA procedure, suggesting that irrelevant and weak connections were removed, allowing for a clearer and more meaningful view of system connectivity. These findings align with previous research showing ICA reduces noise and isolates true relationships, supporting established theory and evidence.
Table 4 presents the number of statistically significant directional information flow links identified between the seven financial segments under the TEOV approach.
Table 4.
Source–target information flow counts between financial segments—TEOV.
Table 4 shows the total number of connections between seven segments: cryptocurrencies, commodities, G10 stock indices, CDS, technology companies, bond yields, and exchange markets. G10 stock indices exhibit the highest number of outgoing connections (298 connections), particularly toward exchange markets (73), technology companies (68), and CDS (62), indicating their dominant role as primary transmitters of information within the network.
Bond yields represent another key transmitting segment, with a high number of outgoing connections (254), reflecting their central role in capturing macroeconomic expectations such as interest rate movements and inflation dynamics. In contrast, cryptocurrencies exhibit relatively fewer outgoing connections (153), indicating a more limited but still relevant role within the overall system. Despite this, cryptocurrencies influence and are influenced by other segments, suggesting a bidirectional interaction with traditional financial markets.
Exchange markets emerge as the main recipients of information, with the highest number of incoming connections (365), suggesting that they aggregate information from multiple financial segments. In particular, strong inflows from technology companies (76), G10 stock indices (73), and commodities (64) highlight their sensitivity to developments across financial and real sectors.
Similarly, CDS and technology companies also receive a substantial amount of information, with total incoming connections of 225 and 221, respectively, highlighting their sensitivity to global financial conditions and risk dynamics. For instance, CDS receives strong connections from G10 stock indices (62) and commodities (20), while technology companies are notably influenced by G10 stock indices (68) and commodities (21), indicating their close integration with broader market movements.
Overall, the findings reveal a complex and highly interconnected structure in which traditional financial segments—particularly G10 stock market indices, bond yields, and CDS—play a leading role in driving information flow, while exchange markets act as major information absorbers within the global financial system. Table 5 reports the count of significant directional information flow relationships between the seven financial segments under the TEIC framework.
Table 5.
Source–target information flow counts between financial segments—TEIC.
Table 5 presents the total number of connections between seven financial segments after applying ICA. The G10 stock market indices remain one of the most influential sources of information, with a high number of outgoing connections (182 connections), particularly toward technology companies (39), CDS (29), and exchange markets (37). In addition, notable connections are also observed toward commodities (20) and bond yields (11), indicating a broad transmission role across segments.
Bond yields also emerge as a major transmitter, with a substantial number of outgoing connections (213), reflecting their strong influence across multiple financial segments. Their connections are especially pronounced toward exchange markets (39), G10 stock indices (35), and CDS (29), suggesting their close association with macro-financial dynamics.
CDS continues to play a central role within the network, as a transmitter and a receiver, with substantial connections to exchange markets (48) and G10 stock indices (30). In addition, CDS also maintains notable interactions with commodities (23) and technology companies (21), indicating its strong integration within the overall structure of information flow.
Exchange markets remain a key recipient of information, receiving notable connections from CDS (48), bond yields (39), and G10 stock indices (37), indicating their sensitivity to developments across multiple financial segments. Technology companies also exhibit strong connectivity within the system, influencing and being influenced by other segments. In contrast, cryptocurrencies exhibit a relatively lower level of outgoing influence (106 total connections), despite showing strong within-segment connectivity. This suggests that cryptocurrencies continue to play a more limited role compared with traditional financial segments, while still maintaining bidirectional interactions with the broader system. Overall, the TEIC approach preserves the main structure observed in the TEOV results, but reveals a more concentrated and refined network of information flows.
Interactions among cryptocurrencies are primarily concentrated within the segment itself (50 connections), while cross-segment linkages remain more limited. Among external connections, cryptocurrencies show modest interactions with exchange markets (18), commodities (8), and CDS (8), whereas connections toward G10 stock indices (6) and technology companies (8) are comparatively weaker. This pattern suggests that within the TEIC framework, cryptocurrencies maintain a more contained role in the overall network, with stronger intra-segment dynamics and relatively fewer outward information transmissions to other financial segments.
Compared with the TEOV approach, the TEIC approach produces a more selective network structure with a reduced number of connections across financial segments. Several notable changes can be observed after applying ICA. For example, the number of connections from G10 stock indices to CDS decreases from 62 to 29, while connections from technology companies to CDS decline from 40 to 23. Similarly, the influence of G10 stock indices on technology companies decreases from 68 to 39, indicating a contraction in cross-segment linkages.
Regarding the total outgoing connections, G10 stock indices remain one of the main sources of information, although their total connections decrease from 298 to 182. Technology companies also exhibit a noticeable reduction from 279 to 150, while bond yields decrease from 254 to 213 but continue to play an important role within the network. CDS show a moderate decline from 233 to 184, maintaining their position as transmitters and receivers of information. Cryptocurrencies, in contrast, decrease from 153 to 106 total outgoing connections, indicating a relatively weaker role compared with traditional financial segments.
Table 6 presents the comparison between the TEOV and TEIC approaches for source–target pairs where the absolute change in the number of connections exceeds the threshold value of 10.
Table 6.
Source–target TEOV and TEIC comparison in terms of number of connections.
The results in Table 6 indicate that ICA application leads to a substantial reduction in the number of detected connections across several segments. For instance, the information flow from technology companies to exchange markets decreases from 76 under the TEOV approach to 29 under the TEIC approach, corresponding to a reduction of 47 connections. Similarly, notable declines are observed in relationships such as technology companies to G10 stock indices (from 77 to 35), and G10 stock indices to exchange markets (from 73 to 37).
Figure 2 presents the network representation of changes in inter-segment connections between the TEOV and TEIC approaches. The network structure provides a comprehensive overview of how the number of connections varies across different financial segments. In this figure, red edges indicate an increase in connections under the TEIC approach, while blue edges represent a decrease relative to the TEOV framework. The thickness of the edges reflects the magnitude of change, with thicker edges corresponding to larger absolute differences in the number of connections. The numerical values displayed on the edges denote the change in the number of connections between the same source–target pairs under the TEOV and TEIC approaches.
Figure 2.
Network representation of changes in inter-segment connections: TEOV vs. TEIC. Red edges: increased connections under TEIC; blue edges: decreased connections relative to TEOV.
More broadly, the findings suggest that many of the connections identified under the TEOV framework are significantly reduced when ICA is applied prior to the Transfer Entropy estimation. This pattern indicates that a considerable portion of the original connections may be driven by noise, common shocks, or indirect relationships. In contrast, the TEIC approach appears to retain a smaller but more refined set of connections, reflecting stronger and more direct information transmission mechanisms between segments. Table 7 summarizes the distribution of statistically significant directional connections across segments, classified by flow type and significance thresholds under the TEOV approach.
Table 7.
Directional information flow connections by significance level—TEOV.
Table 7 presents the number of connections observed in the TEOV approach, categorized by information flow type (one-way vs. two-way) and significance level ( vs. ), which refers to the statistical significance of directional information flow measured by Transfer Entropy. The results suggest that connections tend to be more concentrated at the stricter significance level (), indicating that a considerable portion of the detected relationships may be statistically strong. In particular, one-way connections appear to dominate under the threshold, whereas two-way connections become relatively more visible at the level, suggesting that bidirectional interactions may become more pronounced under stricter statistical criteria.
This pattern suggests that while a broader set of directional interactions is observed at lower significance levels, relationships identified under stricter thresholds may reflect more stable and consistent interactions across segments. Overall, the findings indicate a complex and interconnected structure, where highly significant connections may be associated with relatively stronger dependencies within the financial system. Table 8 outlines the count of significant directional information flow connections across segments, grouped by connection type and significance levels within the TEIC approach.
Table 8.
Directional information flow connections by significance level—TEIC.
Table 8 presents the number of statistically significant connections in the ICA-based approach. The results indicate that one-way connections remain more prevalent, particularly at the 0.05 significance level, while two-way relationships appear less frequent but relatively more pronounced under the stricter 0.01 threshold. Compared with the TEOV approach, the overall number of connections is reduced, suggesting a more selective structure of information flow.
Compared with the TEOV approach, the TEIC approach changes the distribution of statistically significant connections across significance levels and flow directions. At the 0.05 significance level, one-way connections increase from 348 to 401, whereas two-way connections decrease from 209 to 131. In contrast, under the stricter 0.01 significance level, one-way and two-way connections decline substantially, from 547 to 338 and from 353 to 177, respectively. These results suggest that the application of ICA does not uniformly reduce all connections, but rather reshapes the network structure. In particular, highly significant and bidirectional connections tend to decline, while a relatively larger number of moderate one-way interactions remain at the 0.05 level. This pattern may indicate that ICA filters out overlapping or noisy co-movements, leading to a more selective set of directional relationships. Overall, the TEIC approach produces a restructured and more selective representation of information flow across financial segments, offering a complementary perspective to the TEOV results.
4.2. Net Information Flow Dynamics Across Crisis Periods
This study covers periods characterized by significant political tensions and regional conflicts, enabling an examination of how major global events shape the dynamics of financial markets over time. These include the COVID-19 pandemic (pre-, during, and post-crisis periods), the ongoing Russia–Ukraine war, and escalating geopolitical tensions involving Israel–Iran–U.S. dynamics. Rather than producing immediate and static effects, these events tend to influence financial markets in a gradual and evolving manner, altering the structure and direction of information flow across segments over time. For instance, the Russia–Ukraine conflict has been associated with persistent changes in European commodity markets, particularly in energy and agricultural products, reflecting ongoing supply disruptions and adjustments in trade flows. In this context, the relationships between financial segments are not constant but exhibit a time-varying character, where the intensity and direction of information transmission may shift across different phases of crisis periods. To capture these evolving dynamics, a sliding-window approach is employed, using a window size of 60 and a step size of 3 on the Transfer Entropy values derived from ICA-processed data. This framework allows for the analysis of how information flow structures adapt and transform as global conditions change.
This method allows us to capture time-varying interactions and observe how two-way information flows evolve over time. It provides insight into how extraordinary events influence the strength and direction of relationships between variables. Using this approach, we can trace changes in information flow patterns before, during, and after major disruptions. For this dynamic analysis, we focused on 308 unique two-way connections (154 pairs) that were found to be statistically significant. To evaluate the net directional change over time, we aggregated the bidirectional net Transfer Entropy values. This allows us to calculate 154 distinct, meaningful, and noise-reduced net connections, which served as the basis for analyzing the evolving structure of global financial interdependencies. Each component pair was derived from different financial segments: components 1–10 represent G10 stock market indices, 11–20 commodities, 21–30 CDS, 31–40 cryptocurrencies, 41–50 technology companies, 51–60 foreign exchange markets, and 61–70 government bond yields, all of which are based on ICA-transformed return data.
To investigate how global events affect the structure of the financial system, we analyze the direction and evolution of information flow across these segments. In addition to examining pairwise relationships, net Transfer Entropy values are aggregated at the segment level across different global crisis periods. This approach enables the identification of broader patterns of bidirectional information flow between major financial segments, such as cryptocurrencies and G10 stock indices, and CDS and technology companies. By comparing these aggregated measures over time and aligning them with key global events, the analysis aims to capture how information dynamics within the financial system evolve during periods of crisis and heightened uncertainty.
To provide a segment-level summary of these dynamic patterns, the averaged net Transfer Entropy values across major global event periods are reported in Table 9.
Table 9.
Average net Transfer Entropy across global event period.
Table 9 presents the averaged net Transfer Entropy values aggregated at the segment level across different global crisis periods. These values are calculated by averaging the net information flows obtained from the sliding-window estimations and then grouping them by financial segments. This structure allows a clearer comparison of the direction and intensity of information transmission between major market segments under different global shocks. The results indicate that periods such as COVID-19, the Russia–Ukraine conflict, and Middle East tensions are associated with noticeable changes in the direction and magnitude of information flow, reflecting the dynamic and time-varying interconnectedness of global financial markets.
In particular, the information flow from G10 stock indices to CDS was positive prior to the pandemic, with an average net Transfer Entropy value of 0.0097. However, this relationship weakened during the COVID-19 period, turning slightly negative (−0.0047), and then shifted again to a positive direction in the post-pandemic period (0.0181). A more pronounced reversal is observed in the post-Iran–Israel–U.S. Middle East conflict period, where the value drops sharply to (compared with a positive value of 0.0145 before the conflict; see Table 9). This shift indicates a change in the direction of information flow, suggesting that CDS may become a more influential source of information for stock market movements under heightened geopolitical uncertainty.
This change in direction may be associated with shifts in global risk perception and macro-financial conditions. In the pre-pandemic period, equity markets largely reflected forward-looking expectations, which were then transmitted to sovereign risk indicators. During the COVID-19 period, elevated uncertainty, economic contraction, and increased volatility may have strengthened the role of credit risk signals. CDS spreads may adjust more rapidly to changes in perceived default risk (Apergis et al., 2022). This shift may help explain the observed change in the direction of information flow between equity and credit markets during the COVID-19 period (Almeida et al., 2025). A stronger reversal is observed during the geopolitical tension period, particularly during the Middle East conflict, where increased risk aversion, tighter financial conditions, and higher sensitivity to sovereign risk indicators may lead CDS markets to act as leading indicators of financial stress (Gunay et al., 2023). In this context, the interaction between credit and equity markets may reflect heightened systemic risk conditions, where interdependencies across markets become more pronounced.
Figure 3 illustrates the net Transfer Entropy dynamics between G10 stock indices and CDS. The shaded areas denote the pre-COVID-19 (light blue), during-COVID-19 (light green), and post-COVID-19 (light orange) periods. All net Transfer Entropy values shown in the following figures are computed using a rolling sliding-window approach.
Figure 3.
Net Transfer Entropy between G10 stock market indices and CDS. Light blue: pre-COVID-19; light green: during-COVID-19; light orange: post-COVID-19; red line: zero baseline.
During the COVID-19 period, the relationship between commodities and exchange markets becomes more pronounced, with the net Transfer Entropy increasing to 0.0782 from its pre-pandemic level of 0.0583 (see Table 9), suggesting that commodities may act as a relatively stronger source of information for exchange markets during the crisis period. However, this relationship reverses in the post-pandemic period, where the value declines to , implying that exchange markets may become the dominant source of information.
These dynamics may be associated with changes in global demand conditions, supply disruptions, and shifts in financial market uncertainty during the COVID-19 period. Commodity markets, particularly those linked to energy and raw materials, may have responded more directly to global supply constraints and demand shocks, which in turn, could have influenced exchange rate movements (Malik & Umar, 2019). At the same time, heightened uncertainty and fluctuations in global trade conditions may have strengthened the interaction between commodity prices and currency markets (Atems et al., 2015). In the post-pandemic period, changes in macro-financial conditions, including monetary policy developments related to inflation and global economic conditions, may have been associated with the observed reversal in the direction of information flow (Rathnayaka et al., 2024). In this context, the evolving relationship between commodities and exchange markets may also reflect changing systemic risk conditions, where the strength and direction of cross-market linkages vary across different economic regimes.
Figure 4 illustrates the net Transfer Entropy between commodities and exchange markets. The shaded areas denote the pre-COVID-19 (light blue), during-COVID-19 (light green), and post-COVID-19 (light orange) periods.
Figure 4.
Net Transfer Entropy between commodities and exchange markets. Light blue: pre-COVID-19; light green: during-COVID-19; light orange: post-COVID-19; red line: zero baseline.
The relationship between G10 stock indices and bond yields exhibits variation across the Russia–Ukraine conflict period. Prior to the conflict, the net Transfer Entropy is positive (0.0498), indicating that G10 stock indices act as a source of information for bond yields. However, in the post-conflict period, the value turns negative (), implying a reversal in the direction of information flow from bond yields to G10 stock indices (see Table 9). This shift suggests that the Russia–Ukraine conflict may have altered the interaction between equity and fixed-income markets, with bond yields potentially becoming more informative for stock market movements in the post-conflict period.
This change in direction may be associated with macro-financial developments triggered by the conflict. The Russia–Ukraine conflict led to significant commodity price shocks, inflationary pressures, and changes in monetary policy expectations across G10 economies (Merkinykas, 2025). In such an environment, bond yields, which embed information about inflation expectations, interest rate paths, and liquidity conditions, may react more directly to these macroeconomic developments. As a result, equity markets may become more sensitive to signals originating from fixed-income markets. This shift may reflect a change in the transmission mechanism of information, where interest rate expectations and inflation dynamics play a more prominent role in shaping cross-market linkages (Chernov & Dahlquist, 2023). From a systemic risk perspective, the conflict period may also be characterized by heightened uncertainty and increased interdependence across financial markets (Almeida et al., 2023). Under such conditions, the direction and strength of information flow between asset classes may vary across regimes, reflecting changing risk conditions and market sensitivities. Nevertheless, when considering the broader pattern across periods, the relationship appears to gradually move toward a positive direction, suggesting a potential adjustment toward its pre-conflict structure over time.
Figure 5 further supports this interpretation by illustrating the evolution of net Transfer Entropy between G10 stock indices and bond yields. The net Transfer Entropy, which is positive before the conflict, becomes negative during the post-conflict phase, reflecting a shift in the direction of information flow. The shaded region represents the Russia–Ukraine conflict period and enables a direct comparison of pre-conflict (light blue) and post-conflict (light orange) dynamics.
Figure 5.
Net Transfer Entropy between G10 stock market indices and bond yields. Light blue: pre-conflict; light orange: post-conflict (Russia–Ukraine conflict); red line: zero baseline.
The post-Iran–Israel–U.S.–Middle East conflict period reflects a relatively recent phase, and therefore the full impact of these geopolitical tensions on global financial markets may not yet be fully observable. Nevertheless, the results indicate several changes in the direction and magnitude of information flow across financial segments. One of the most notable changes is observed in the relationship between tech companies and exchange markets, where the net Transfer Entropy increases from a negligible level of in the pre-conflict period to 0.1825 in the post-conflict period. This suggests that the direction of information flow changes from exchange markets to tech companies before the conflict to tech companies to exchange markets after the conflict.
Similarly, the interaction between CDS and exchange markets rises from to 0.0792, suggesting that the direction of information flow changes from exchange markets to CDS to CDS to exchange markets. In contrast, the relationship between G10 stock indices and CDS declines from 0.0145 to , indicating that the direction of information flow changes from G10 stock indices to CDS to CDS to G10 stock indices in the post-conflict period. Another change appears in the relationship between cryptocurrencies and bond yields, where the value decreases from to , suggesting that the direction of information flow changes from cryptocurrencies to bond yields to bond yields to cryptocurrencies.
In addition, the relationship between commodities and exchange markets shifts from a positive structure to a negative one, declining from 0.0381 in the pre-conflict period to afterward (Table 9). This suggests that the direction of information flow shifts from commodities to exchange markets in the pre-conflict period to exchange markets to commodities in the post-conflict period. This change may be related to developments in global commodity supply and energy price volatility under heightened geopolitical uncertainty.
More broadly, these changes may reflect shifts in macro-financial conditions during the Middle East conflict, particularly in relation to commodity markets, exchange rate dynamics, and global risk conditions. The observed changes in the direction of information flow across segments suggest that different markets may respond to common shocks in different ways during periods of heightened geopolitical uncertainty (Almeida et al., 2025). The responses of different market segments to such common shocks are often heterogeneous, which may lead to shifts in spillover structures and changes in the direction of information flow (Coskun et al., 2023; Eissa & Al Refai, 2024). In this context, the simultaneous changes observed across commodities, exchange markets, and bond-related segments may be associated with disruptions in global energy markets and evolving macro-financial conditions. From a systemic risk perspective, these patterns may suggest that cross-market linkages become more pronounced during periods of geopolitical stress, although the direction of information flow may vary across segments and over time (Zhu et al., 2026).
The relationship between G10 stock indices and commodities remains negative across all periods, including the post-Iran–Israel–U.S. Middle East conflict phase, where the net Transfer Entropy increases slightly from to . This suggests that the direction of information flow is consistently from commodities to G10 stock indices, although the magnitude appears to weaken in the post-conflict period.
Figure 6 illustrates this pattern. The shaded region represents the Iran–Israel–U.S. Middle East conflict period and enables a comparison of pre-conflict (light blue) and post-conflict (light orange) dynamics.
Figure 6.
Net Transfer Entropy between G10 stock market indices and commodity markets. Light blue: pre-conflict; light orange: post-conflict (Iran–Israel–U.S. conflict); red line: zero baseline.
4.3. Robustness Checks
In the baseline analysis, the results are obtained using daily data with a first-order lag structure (), a Renyi–Shannon entropy parameter of , and a sliding-window approach with a window size of 60 observations and a step size of 3 days, capturing relatively short-term dynamics. In contrast, the robustness analysis is conducted using higher-order lags (), an alternative entropy specification (), and a wider sliding-window design (window size of 150 observations and step size of 15 days), allowing for the examination of longer-term and more persistent interactions. When negligible values close to zero are disregarded, several relationships exhibit notable changes in magnitude and direction across crisis periods. For instance, the CDS–exchange markets relationship, which is weak and mixed in the baseline specification (e.g., in the pre-COVID-19 period and during the COVID-19 period), becomes consistently positive and substantially stronger in the robustness analysis (e.g., in the pre-COVID-19 period and during the COVID-19 period), indicating a clearer directional influence over longer horizons. Similarly, the cryptocurrencies–bond yields relationship, which remains relatively weak in the baseline case (e.g., in the pre-COVID-19 period and during the COVID-19 period), becomes significantly stronger under the robustness configuration (e.g., during the COVID-19 period and in the post-COVID-19 period), suggesting that interactions involving cryptocurrencies may emerge with delay. In contrast, some relationships preserve their directional structure across specifications; for example, the exchange markets–bond yields relationship remains negative in the baseline and robustness analyses (e.g., vs. in the pre-COVID-19 period), although with larger magnitudes under the alternative setup. In addition, connections involving G10 stock indices display notable sensitivity across crisis periods; for instance, G10 stock indices–bond yields relationship shifts from positive in the baseline pre-COVID-19 period () to negative during the COVID-19 period () in the robustness analysis, and becomes strongly positive in the post-Iran–Israel–U.S. period (), indicating substantial variation depending on the temporal horizon. Overall, these findings suggest that the strength and, in some cases, the direction of information flows vary across crisis periods and depend on the selected parameterization, with longer-horizon configurations revealing more pronounced and persistent interaction patterns across financial segments. The robustness check reveals that the inferred information flow structure is sensitive to the choice of model parameters and temporal configuration.
5. Conclusions
In this study, ICA and Transfer Entropy methods were used together to evaluate the direction of information flow in financial time series. Using a dataset consisting of 70 different time series, divided into seven segments with ten series each, the study examined the information flow patterns between financial segments and the interconnections between the series in detail. These segments included cryptocurrencies, commodities, G10 stock indices, technology stocks, CDS, bond yields, and exchange markets. This study aims to separate factors such as common shocks, high correlations, and implicit structures present in raw time series to make Transfer Entropy calculations more meaningful, statistically enhance the reliability of information flows, and determine how crises affect the global market.
In the study, when the original series used directly for Transfer Entropy calculations were compared with the Transfer Entropy values obtained after applying the ICA method, a general decrease in the number of connections was observed following the ICA approach. However, this decrease should not be interpreted as a loss of information, but rather as the elimination of weak, random, spurious, or common effect-based connections within the system. Notably, the larger reduction in connections under the ICA-based approach suggests that many of the removed links were likely weak or noise-driven, whereas the relatively smaller decline at stricter significance levels indicates that the remaining connections reflect more robust and statistically reliable information flow structures (Wollstadt et al., 2014). In this sense, the application of ICA helped extract underlying driving factors, reduce noise, and filter out spurious or weak connections, thereby providing a clearer representation of the underlying information dynamics. These results are in line with prior findings in the literature (Civan et al., 2023; Hyvarinen et al., 2001; James & Hesse, 2005). This methodological perspective is particularly valuable for revealing directional dependencies in complex, high-dimensional systems.
One of the main contributions of this study is the examination of information flow dynamics across multiple financial segments using a large-scale multi-segment dataset and an ICA-based net Transfer Entropy framework, particularly during crisis periods. In the existing literature, Transfer Entropy and information flow analyses are predominantly conducted within the same market segment rather than across segments. For example, many studies focus on information flow between assets within a single market segment, such as crude oil, gold, or exchange rates (Abdullah et al., 2022; Y. Chen et al., 2022; Maiti & Kayal, 2023; Ming et al., 2022; Yıldırım et al., 2020; Zhang & Qin, 2022). In contrast, this study adopts a multi-segment perspective and investigates net information flow between different financial segments using ICA-based net Transfer Entropy, thereby providing a more comprehensive understanding of cross-segment dependency structures.
The empirical findings indicate that the inferred network structure varies notably depending on the Transfer Entropy specification. Under the TEOV framework, the network appears relatively dense and highly interconnected, with equity markets playing a prominent role as key transmitters of information. In contrast, the TEIC-based network displays a more selective and structured configuration. One of the main findings of the study is the emergence of a macro-financial transmission mechanism under the TEIC specification. In this setting, equity markets, bond yields, and CDS emerge as primary drivers of information flows, highlighting the role of interest rate dynamics and credit risk in shaping cross-asset interactions. Meanwhile, equity indices function as central intermediaries, supporting bidirectional transmission across segments, while foreign exchange markets consistently act as net receivers of information, absorbing shocks from multiple sources. Overall, the results emphasize the importance of macro-financial variables, particularly bond yields and CDS, in understanding systemic risk transmission and global financial interconnectedness.
Before the COVID-19 period, the information flow is predominantly observed from G10 stock market indices to CDS, whereas in the post-COVID-19 period, this pattern shows signs of change. Figure 3 shows that while the magnitude of information flow varies over time, the average net Transfer Entropy becomes negative, which indicates a gradual shift in the direction of information flow (Ballester et al., 2021). This change in direction may suggest that during crisis periods, market dynamics become more closely associated with macro risk indicators. These findings align with the existing literature (Apergis et al., 2022; Gunay et al., 2023). Table 9 shows that during the COVID-19 period, the relationship between cryptocurrencies and G10 stock market indices becomes slightly more apparent, with the net Transfer Entropy remaining slightly negative () compared with its near-zero level before the pandemic (0.0003). This indicates that information flow occurs from cryptocurrencies to G10 stock indices during the crisis period, whereas this relationship remains weak or negligible prior to the pandemic. This shift may suggest that crisis periods can reshape the structure of information flow across financial segments. This evidence is in line with previous studies (Almeida et al., 2023; Assaf et al., 2023; Barak & Parvini, 2023), which document that global events can influence the direction and intensity of information flows across financial markets.
In addition, a similar restructuring is observed following the Russia–Ukraine conflict. The information flow from G10 stock market indices to bond yields before the war reverses after the conflict, shifting from bond yields to G10 stock market indices. This change reflects a shift in the direction of information flow under heightened geopolitical uncertainty. This evidence is in line with previous studies (Chernov & Dahlquist, 2023; Merkinykas, 2025). More broadly, crisis periods are associated with changes in the structure of information flow across financial segments. Although this pattern varies across segments, fixed-income instruments, particularly bond yields, together with CDS and G10 stock market indices, tend to act as dominant sources of information transmission, while cryptocurrencies display a relatively weaker and less consistent transmitting role. As crises gradually normalize and systemic risk declines, the structure of information flow also evolves. These results are consistent with prior studies (Almeida et al., 2025; Fereydooni et al., 2024).
Regional conflicts, including the Russia–Ukraine war and the Iran–Israel–U.S. tensions, also appear to be associated with changes in the information flow between commodities and exchange markets. In the case of the Russia–Ukraine conflict, while the direction of information flow does not appear to reverse, the strength of information transmission from exchange markets seems to increase. However, during the Iran–Israel–U.S. conflict, a shift in the direction of information flow is observed between these segments. These patterns may suggest that regional geopolitical tensions are accompanied by changes in the intensity and direction of cross-market information transmission. In particular, developments in key commodity markets, such as oil and gold, may play a role in shaping these dynamics, as they are closely linked to global economic uncertainty and financial market conditions. These patterns have been documented in earlier research (H. Chen et al., 2016; Mo et al., 2024).
The Iran–Israel–U.S. tensions represent a significant geopolitical shock that has altered the structure of information flow across financial markets. In particular, several relationships exhibit clear reversals in the direction of information flow, including commodities–exchange markets, G10 stock indices–CDS, G10 stock indices–cryptocurrencies, and technology companies–bond yields. These shifts suggest that the regional crisis has introduced systemic disruptions, reshaping the transmission of information between financial segments (Bossman et al., 2023). Overall, these findings indicate that the conflict has led to noticeable changes across multiple segments; however, given the relatively short time span since the onset of the tensions, it remains premature to draw definitive conclusions about the persistence of these patterns, and the structure of information flow may continue to evolve as the effects of the shock unfold over time. Such structural changes in direction suggest that causal relationships within the financial system are dynamic rather than fixed and may reconfigure during crisis periods. This interpretation is consistent with the existing literature, which indicates that regional events and crises can substantially alter the patterns and direction of information flow in financial networks (Sandoval, 2014).
As a result, the Transfer Entropy method supported by ICA provides a flexible methodological framework for analyzing directional information flows in financial time series. By combining these approaches, the study enables a clearer identification of underlying information structures while reducing the impact of noise in high-dimensional data. This integrated framework offers a systematic way to capture complex dependencies across financial segments and may provide useful insights for market evaluation and financial analysis.
This study contributes to the literature by providing a comprehensive analysis of information flow dynamics across major financial market segments rather than focusing solely on pairwise asset-level relationships. By grouping a large set of financial variables into economically meaningful segments, the study offers a more structured and interpretable view of how information is transmitted across global markets. In this context, the use of Transfer Entropy allows for the identification of directional and potentially nonlinear dependencies, while the incorporation of ICA helps reduce noise and capture underlying latent structures. Furthermore, the findings highlight that information flow is not static but varies across different crisis periods, with the direction and intensity of transmission changing in response to global shocks. These results extend the existing literature by demonstrating that segment-level interactions provide additional insights into cross-market linkages and systemic dynamics, particularly during periods of heightened uncertainty, thereby offering a more holistic understanding of global financial interconnectedness.
In addition, by employing a rolling window framework, this study captures the time-varying nature of information flow across financial segments, allowing for a dynamic assessment of how these relationships evolve before, during, and after major crisis periods. This approach provides further insight into the temporal structure of cross-market interactions and highlights that the strength and direction of information transmission are not constant but shift across different regimes. As such, the study contributes to the literature by integrating a segment-based perspective with a time-varying analytical framework, offering a more nuanced understanding of how financial interconnectedness evolves under changing macro-financial conditions.
Such structures, in which the accumulation of information between financial segments evolves over time, with some connections strengthening while others weaken or are replaced, clearly reflect the dynamic and fragile nature of financial systems. This flexible approach enables the capture of short-term representations of structural changes in the system, allowing for a more reliable separation of long-term and meaningful causalities. Therefore, this study has not only revealed existing information but also provided a new perspective for monitoring how the networks of information accumulation provided by crises are rebuilt.
For these reasons, the ICA–Transfer Entropy-based analytical approach provides a solid framework for analyzing dynamic information flow and evolving interdependencies across financial segments, particularly during periods of global uncertainty. The integration of ICA with Transfer Entropy improves statistical reliability while reducing the impact of noise, particularly in multidimensional and highly interconnected datasets. Future research may further extend this framework through applications across different geographical regions, alternative data frequencies, or longer sliding-window specifications, which could help capture information flows during the initial shock phase of global crises and offer additional insights for strategy-oriented market evaluations. In addition, future studies may incorporate market-based benchmark measures, such as time-varying beta coefficients, together with alternative sector and asset selection frameworks, to jointly evaluate systematic risk and information flow dynamics. In this context, beta can be interpreted as a benchmark-based measure that captures how each segment behaves relative to overall market movements. Integrating such benchmark-oriented measures would allow researchers to examine whether segments that exhibit strong information flow patterns also display similar or divergent sensitivities to broader market trends. This approach may provide a more comprehensive understanding of how segment-level dynamics relate to benchmark-driven market behavior, thereby offering additional insights into the interaction between systematic risk exposure and the evolving structure of information flow across financial markets.
Moreover, the ICA–Transfer Entropy framework is not limited to financial systems and may also be applicable across a range of real-world contexts. For example, in retail analytics, it can be used to analyze directional relationships between product categories, identifying how demand shifts across categories before and after promotional campaigns, price changes, or seasonal demand patterns; in e-commerce platforms, it may help reveal substitution or complementarity effects between products by identifying which categories drive changes in others; and in industrial systems, it can be applied to fault detection and diagnosis by analyzing directional relationships between sensor signals, allowing the identification of how anomalies in one component propagate to others within the system. These examples illustrate that the combined use of ICA and Transfer Entropy provides a practical approach for understanding how information propagates across complex and interconnected systems. In this respect, the proposed approach can be considered a flexible methodological framework for examining evolving information flow structures under conditions of uncertainty.
This study is subject to several limitations associated with the selected methodological setup. The analysis relies on daily data, and the Transfer Entropy framework is implemented using first-order lag specifications (i.e., ). Moreover, the Renyi–Shannon entropy parameter is fixed at during the estimation process. The empirical design is further based on a sliding-window approach with a window size of 60 observations and a step size of 3 days, and is confined to the financial segments and asset classes included in this study. While this setup is appropriate for capturing short-term interactions, alternative parameter selections may enable the investigation of different temporal dynamics. For example, extending the lag structure may help identify delayed transmission effects between segments, where the impact of certain shocks may unfold over longer horizons. Likewise, adjustments in the window length or entropy specification may provide additional insights into the underlying system dynamics. Accordingly, the chosen parameterization reflects the scope of the present analysis, and alternative configurations may be explored in future research.
Author Contributions
Conceptualization, U.K.Ç. and G.G.Ş.; methodology, U.K.Ç. and G.G.Ş.; software, U.K.Ç.; validation, U.K.Ç. and G.G.Ş.; formal analysis, U.K.Ç.; investigation, U.K.Ç. and G.G.Ş.; resources, U.K.Ç.; data curation, U.K.Ç.; writing—original draft preparation, U.K.Ç.; writing—review and editing, U.K.Ç. and G.G.Ş.; visualization, U.K.Ç.; supervision, G.G.Ş. All authors have read and agreed to the published version of the manuscript.
Funding
This research received no external funding.
Institutional Review Board Statement
Not applicable.
Informed Consent Statement
Not applicable.
Data Availability Statement
The data used in this study are publicly available from Yahoo Finance (https://finance.yahoo.com/, accessed on 24 March 2026) and (https://www.investing.com/, accessed on 24 March 2026).
Conflicts of Interest
The authors declare no conflicts of interest.
References
- Abdullah, A., Abdullah, M., & Jaafar, R. (2022). The dynamic volatilities and correlations between German stock market indices and commodities: Evidence from wavelet and MGARCH-DCC approaches. Asian Economic and Financial Review, 12(8), 731–750. [Google Scholar] [CrossRef] [Scilit]
- Almeida, D., Dionisio, A., & Ferreira, P. (2024). Information flow dynamics between cryptocurrency returns and electricity consumption: A comparative analysis of Bitcoin and Ethereum. Finance Research Letters, 68, 105997. [Google Scholar] [CrossRef] [Scilit]
- Almeida, D., Dionisio, A., Ferreira, P., Aslam, F., & Quintino, D. (2025). Information flow between asset classes during extreme events. Physica A: Statistical Mechanics and its Applications, 671, 130687. [Google Scholar] [CrossRef] [Scilit]
- Almeida, D., Dionisio, A., Vieira, I., & Ferreira, P. (2023). COVID-19 effects on the relationship between cryptocurrencies: Can it be contagion? Insights from econophysics approaches. Entropy, 25(1), 98. [Google Scholar] [CrossRef] [Scilit] [PubMed]
- Apergis, N., Danuletiu, D., & Xu, B. (2022). CDS spreads and COVID-19 pandemic. Journal of International Financial Markets, Institutions and Money, 76, 101433. [Google Scholar] [CrossRef] [Scilit]
- Assaf, A., Mokni, K., & Youssef, M. (2023). COVID-19 and information flow between cryptocurrencies, and conventional financial assets. The Quarterly Review of Economics and Finance, 89, 73–81. [Google Scholar] [CrossRef] [Scilit]
- Atems, B., Kapper, D., & Lam, E. (2015). Do exchange rates respond asymmetrically to shocks in the crude oil market? Energy Economics, 49, 227–238. [Google Scholar] [CrossRef] [Scilit]
- Back, A. D., & Weigend, A. S. (1997). A first application of independent component analysis to extracting structure from stock returns. International Journal of Neural Systems, 8(4), 473–484. [Google Scholar] [CrossRef] [Scilit] [PubMed]
- Ballester, L., Escriva, A. M., & Gonzalez-Urteaga, A. (2021). The nexus between sovereign CDS and stock market volatility: New evidence. Mathematics, 9(11), 1201. [Google Scholar] [CrossRef] [Scilit]
- Barak, S., & Parvini, N. (2023). Transfer-entropy-based dynamic feature selection for evaluating Bitcoin price drivers. Journal of Futures Markets, 43(12), 1695–1726. [Google Scholar] [CrossRef] [Scilit]
- Barnett, L., Barrett, A. B., & Seth, A. K. (2009). Granger causality and transfer entropy are equivalent for Gaussian variables. Physical Review Letters, 103(23), 238701. [Google Scholar] [CrossRef] [Scilit]
- Bastos, A. M., & Schoffelen, J. M. (2016). A tutorial review of functional connectivity analysis methods and their interpretational pitfalls. Frontiers in Systems Neuroscience, 9, 175. [Google Scholar] [CrossRef] [Scilit]
- Billio, M., Getmansky, M., Lo, A. W., & Pelizzon, L. (2012). Econometric measures of connectedness and systemic risk in the finance and insurance sectors. Journal of Financial Economics, 104(3), 535–559. [Google Scholar] [CrossRef] [Scilit]
- Bossman, A., Gubareva, M., & Teplova, T. (2023). Economic policy uncertainty, geopolitical risk, market sentiment, and regional stocks: Asymmetric analyses of the EU sectors. Eurasian Economic Review, 13, 321–372. [Google Scholar] [CrossRef] [Scilit]
- Bouri, E., Cepni, O., Gabauer, D., & Gupta, R. (2021). Return connectedness across asset classes around the COVID-19 outbreak. International Review of Financial Analysis, 73, 101646. [Google Scholar] [CrossRef] [Scilit]
- Cha, S. M., & Chan, L. W. (2000). Applying independent component analysis to factor model in finance. In K. S. Leung, L. W. Chan, & H. Meng (Eds.), Intelligent data engineering and automated learning—IDEAL 2000. Data mining, financial engineering, and intelligent agents (Vol. 1983, pp. 538–544). IDEAL 2000. Lecture Notes in Computer Science. Springer. [Google Scholar] [CrossRef] [Scilit]
- Cheema, M. A., Faff, R., & Szulczyk, K. R. (2022). The 2008 global financial crisis and COVID-19 pandemic: How safe are the safe haven assets? International Review of Financial Analysis, 83, 102316. [Google Scholar] [CrossRef] [Scilit] [PubMed]
- Chen, H., Liu, L., Wang, Y., & Zhu, Y. (2016). Oil price shocks and U.S. dollar exchange rates. Energy, 112, 1036–1048. [Google Scholar] [CrossRef] [Scilit]
- Chen, Y., Xu, J., & Hu, M. (2022). Asymmetric volatility spillovers and dynamic correlations between crude oil price, exchange rate and gold price in BRICS. Resources Policy, 78, 102857. [Google Scholar] [CrossRef] [Scilit]
- Chernov, M., & Dahlquist, M. (2023). Currency risk premiums: A multi-horizon perspective. Foundations and Trends in Finance, 14(1), 1–60. [Google Scholar] [CrossRef] [Scilit]
- Civan, Z., Simsek, G. G., & Çinar, U. K. (2023). What are the macroeconomic drivers of the asset returns of Turkish banks? Technological and Economic Development of Economy, 29(1), 91–113. [Google Scholar] [CrossRef] [Scilit]
- Comon, P. (1994). Independent component analysis, a new concept? Signal Processing, 36(3), 287–314. [Google Scholar] [CrossRef] [Scilit]
- Coskun, M., Khan, N., Saleem, A., & Hammoudeh, S. (2023). Spillover connectedness nexus between geopolitical oil price risk, clean energy stocks, global stock, and commodity markets. Journal of Cleaner Production, 429, 139583. [Google Scholar] [CrossRef] [Scilit]
- Darjana, D., Wiyono, S. K., & Koesrindartoto, D. P. (2025). Research on the impact of COVID-19 on the financial system: Evidence from Indonesia. PLoS ONE, 20(2), e0301123. [Google Scholar] [CrossRef] [Scilit]
- Diebold, F. X., & Yilmaz, K. (2014). On the network topology of variance decompositions: Measuring the connectedness of financial firms. Journal of Econometrics, 182(1), 119–134. [Google Scholar] [CrossRef] [Scilit]
- Diez, I., Erramuzpe, A., Escudero, I., Mateos, B., Cabrera, A., Marinazzo, D., Sanz-Arigita, E. J., Stramaglia, S., & Cortes Diaz, J. M. (2015). Information flow between resting-state networks. Brain Connectivity, 5(9), 554–564. [Google Scholar] [CrossRef] [Scilit] [PubMed]
- Dimpfl, T., & Peter, F. J. (2013). Using transfer entropy to measure information flows between financial markets. Studies in Nonlinear Dynamics & Econometrics, 17(1), 85–102. [Google Scholar] [CrossRef] [Scilit]
- Dogan, S., & Akinci, H. (2013). Extraction of the intrinsic images from video frames by using independent component analysis (ICA). Electronic Journal of Map Technologies, 5(1), 13–25. [Google Scholar]
- Dong, Y., Xu, L., Zheng, J., Wu, D., Li, H., Shao, Y., Shi, G., & Fu, W. (2024). A hybrid EEG-based stress state classification model using multi-domain transfer entropy and PCANet. Brain Sciences, 14(6), 595. [Google Scholar] [CrossRef] [Scilit]
- Edinburgh, T., Eglen, S. J., & Ercole, A. (2021). Causality indices for bivariate time series data: A comparative review of performance. Chaos: An Interdisciplinary Journal of Nonlinear Science, 31(8), 083111. [Google Scholar] [CrossRef] [Scilit]
- Eissa, A. M., & Al Refai, H. (2024). Context-dependent responses to geopolitical risk in Middle Eastern and African stock markets: An asymmetric volatility spillover study. International Review of Economics & Finance, 94, 103402. [Google Scholar] [CrossRef] [Scilit]
- Fabozzi, F. J., Giacometti, R., & Tsuchida, N. (2015). The ICA-based factor decomposition of the Eurozone sovereign CDS spreads. IMES Discussion Paper Series 15-E-04. Institute for Monetary and Economic Studies, Bank of Japan. Available online: https://ideas.repec.org/p/ime/imedps/15-e-04.html (accessed on 10 February 2026).
- Fereydooni, A., Barak, S., & Asaad Sajadi, S. M. (2024). A novel online portfolio selection approach based on pattern matching and ESG factors. Omega, 123, 102975. [Google Scholar] [CrossRef] [Scilit]
- Garcia-Ferrer, A., Gonzalez-Prieto, E., & Pena, D. (2012). A conditionally heteroskedastic independent factor model with an application to financial stock returns. International Journal of Forecasting, 28(1), 70–93. [Google Scholar] [CrossRef] [Scilit]
- Garcia-Medina, A., & Gonzalez, F. G. (2020). Transfer entropy as a variable selection methodology of cryptocurrencies in the framework of a high dimensional predictive model. PLoS ONE, 15(1), e0227269. [Google Scholar] [CrossRef] [Scilit] [PubMed]
- Garcia-Medina, A., & Hernandez, J. B. (2020). Network analysis of multivariate transfer entropy of cryptocurrencies in times of turbulence. Entropy, 22(7), 760. [Google Scholar] [CrossRef] [Scilit] [PubMed]
- Goodell, J. W. (2020). COVID-19 and finance: Agendas for future research. Finance Research Letters, 35, 101512. [Google Scholar] [CrossRef] [Scilit]
- Granger, C. W. J. (1969). Investigating causal relations by econometric models and cross-spectral methods. Econometrica, 37(3), 424–438. [Google Scholar] [CrossRef] [Scilit]
- Gunay, S., Cevik, E., & Dibooglu, S. (2023). Volatility spillover networks of credit risk: Evidence from ASW and CDS spreads in Turkey and Brazil. Panoeconomicus, 71, 571–604. [Google Scholar] [CrossRef] [Scilit]
- Guo, K., Kang, Y., Ji, Q., & Zhang, D. (2024). Cryptocurrencies under climate shocks: A dynamic network analysis of extreme risk spillovers. Financial Innovation, 10(1), 54. [Google Scholar] [CrossRef] [Scilit]
- Herault, J., & Jutten, C. (1986). Space or time adaptive signal processing by neural network models. AIP Conference Proceedings, 151(1), 206–211. [Google Scholar] [CrossRef] [Scilit]
- Huynh, T., Shahbaz, M., Nasir, M. A., & Ullah, S. (2022). Financial modelling, risk management of energy instruments and the role of cryptocurrencies. Annals of Operations Research, 313, 47–75. [Google Scholar] [CrossRef] [Scilit]
- Hyvärinen, A. (1999). Fast and robust fixed-point algorithms for independent component analysis. IEEE Transactions on Neural Networks, 10(3), 626–634. [Google Scholar] [CrossRef] [Scilit]
- Hyvärinen, A. (2013). Independent component analysis: Recent advances. Philosophical Transactions of the Royal Society A: Mathematical, Physical and Engineering Sciences, 371(1984), 20110534. [Google Scholar] [CrossRef] [Scilit]
- Hyvärinen, A., Karhunen, J., & Oja, E. (2001). Independent component analysis. John Wiley & Sons. [Google Scholar] [CrossRef] [Scilit]
- Hyvärinen, A., & Oja, E. (2000). Independent component analysis: Algorithms and applications. Neural Networks, 13(4), 411–430. [Google Scholar] [CrossRef] [Scilit]
- Izzeldin, M., Muradoğlu, Y. G., Pappas, V., Petropoulou, A., & Sivaprasad, S. (2023). The impact of the Russian-Ukrainian war on global financial markets. International Review of Financial Analysis, 87, 102598. [Google Scholar] [CrossRef] [Scilit]
- James, C. J., & Hesse, C. W. (2005). Independent component analysis for biomedical signals. Physiological Measurement, 26(1), R15–R39. [Google Scholar] [CrossRef] [Scilit]
- Kaiser, A., & Schreiber, T. (2002). Information transfer in continuous processes. Physica D: Nonlinear Phenomena, 166(1), 43–62. [Google Scholar] [CrossRef] [Scilit]
- Karadag, T., & Golbasi Simsek, G. (2023). A time-varying copula approach to investigate the dependence structures of BRICS stock markets before and after COVID-19. Emerging Markets Finance and Trade, 59(5), 1475–1486. [Google Scholar] [CrossRef] [Scilit]
- Kim, S., Ku, S., Chang, W., & Song, J. W. (2020). Predicting the direction of US stock prices using effective transfer entropy and machine learning techniques. IEEE Access, 8, 111660–111682. [Google Scholar] [CrossRef] [Scilit]
- Kumiega, A., Neururer, T., & Van Vliet, B. (2011). Independent component analysis for realized volatility: Analysis of the stock market crash of 2008. The Quarterly Review of Economics and Finance, 51(3), 292–302. [Google Scholar] [CrossRef] [Scilit]
- Kwon, O., & Yang, J. S. (2008). Information flow between stock indices. Europhysics Letters, 82, 68003. [Google Scholar] [CrossRef] [Scilit]
- Liu, H., & Wang, J. (2011). Integrating independent component analysis and principal component analysis with neural network to predict Chinese stock market. Mathematical Problems in Engineering, 2011, 382659. [Google Scholar] [CrossRef] [Scilit]
- Lizier, J., & Prokopenko, M. (2010). Differentiating information transfer and causal effect. The European Physical Journal B, 73, 605–615. [Google Scholar] [CrossRef] [Scilit]
- Maiti, M., & Kayal, P. (2023). Asymmetric information flow between exchange rate, oil, and gold: New evidence from transfer entropy approach. Journal of Risk and Financial Management, 16(1), 2. [Google Scholar] [CrossRef] [Scilit]
- Malik, F., & Umar, Z. (2019). Dynamic connectedness of oil price shocks and exchange rates. Energy Economics, 84, 104501. [Google Scholar] [CrossRef] [Scilit]
- Marschinski, R., & Kantz, H. (2002). Analysing the information flow between financial time series. The European Physical Journal B, 30, 275–281. [Google Scholar] [CrossRef] [Scilit]
- Merkinykas, V. (2025). Assessment of factors influencing the bond market [Master’s thesis, Vilnius University]. [Google Scholar]
- Ming, L., Shen, Y., Yang, S., & Dong, M. (2022). Contagion or flight-to-quality? The linkage between oil price and the US dollar based on the local Gaussian approach. Journal of Futures Markets, 42(4), 722–750. [Google Scholar] [CrossRef] [Scilit]
- Mo, B., Zeng, H., Meng, J., & Ding, S. (2024). The connectedness between uncertainty and exchange rates of oil import countries: New evidence from time and frequency perspective. Resources Policy, 88, 104398. [Google Scholar] [CrossRef] [Scilit]
- Mok, H. M. (1993). Causality of interest rate, exchange rate and stock prices at stock market open and close in Hong Kong. Asia Pacific Journal of Management, 10, 123–143. [Google Scholar] [CrossRef] [Scilit]
- Neto, D. (2022). Revisiting spillovers between investor attention and cryptocurrency markets using noisy independent component analysis and transfer entropy. The Journal of Economic Asymmetries, 26, e00269. [Google Scholar] [CrossRef] [Scilit]
- Ramchand, L., & Susmel, R. (1998). Volatility and cross correlation across major stock markets. Journal of Empirical Finance, 5(4), 397–416. [Google Scholar] [CrossRef] [Scilit]
- Rathnayaka, I. W., Khanam, R., & Rahman, M. M. (2024). Examining monetary policy measures and their impacts during and after the COVID era: OECD perspectives. Economies, 12(6), 154. [Google Scholar] [CrossRef] [Scilit]
- Rehman, M. U., & Apergis, N. (2019). Determining the predictive power between cryptocurrencies and real time commodity futures: Evidence from quantile causality tests. Resources Policy, 61, 603–616. [Google Scholar] [CrossRef] [Scilit]
- Reuters. (2026). Global reaction to U.S. and Israeli attacks on Iran. Available online: https://www.reuters.com/business/aerospace-defense/global-reaction-israeli-us-attacks-iran-2026-02-28/ (accessed on 28 March 2026).
- Rocchi, J., Tsui, E. Y. L., & Saad, D. (2017). Emerging interdependence between stock values during financial crashes. PLoS ONE, 12(5), e0176764. [Google Scholar] [CrossRef] [Scilit]
- Sandoval, L. (2014). Structure of a global network of financial companies based on transfer entropy. Entropy, 16(8), 4443–4482. [Google Scholar] [CrossRef] [Scilit]
- Schreiber, T. (2000). Measuring information transfer. Physical Review Letters, 85(2), 461–464. [Google Scholar] [CrossRef] [Scilit]
- Shannon, C. E. (1948). A mathematical theory of communication. The Bell System Technical Journal, 27(3), 379–423. [Google Scholar] [CrossRef] [Scilit]
- Tharwat, A. (2021). Independent component analysis: An introduction. Applied Computing and Informatics, 17(2), 222–249. [Google Scholar] [CrossRef] [Scilit]
- Unal, B., & Eroglu, Y. (2022). Analysis of the relationship between the BIST 100 index and the exchange rate using transfer entropy. Gumushane University Journal of Social Sciences, 13(2), 539–549. [Google Scholar]
- Ustaoğlu, E. (2022). BIST sektör endekslerinin zamanla değişen beta katsayıları. Muhasebe ve Finansman Dergisi, 96, 135–150. [Google Scholar] [CrossRef] [Scilit]
- Vakorin, V. A., Kovacevic, N., & McIntosh, A. R. (2010). Exploring transient transfer entropy based on a group-wise ICA decomposition of EEG data. NeuroImage, 49(2), 1593–1600. [Google Scholar] [CrossRef] [Scilit] [PubMed]
- Wątorek, M., Kwapień, J., & Drożdż, S. (2023). Cryptocurrencies are becoming part of the world global financial market. Entropy, 25(2), 377. [Google Scholar] [CrossRef] [Scilit]
- Wollstadt, P., Martínez-Zarzuela, M., Vicente, R., Díaz-Pernas, F. J., & Wibral, M. (2014). Efficient transfer entropy analysis of non-stationary neural time series. PLoS ONE, 9(7), e102833. [Google Scholar] [CrossRef] [Scilit] [PubMed]
- Xian, L., He, K., Wang, C., & Lai, K. K. (2020). Factor analysis of financial time series using EEMD-ICA based approach. Sustainable Futures, 2, 100003. [Google Scholar] [CrossRef] [Scilit]
- Yıldırım, D. Ç., Cevik, E. I., & Esen, Ö. (2020). Time-varying volatility spillovers between oil prices and precious metal prices. Resources Policy, 68, 101783. [Google Scholar] [CrossRef] [Scilit]
- Zhang, Z., & Qin, Y. (2022). Study on the nonlinear interactions among the international oil price, the RMB exchange rate and China’s gold price. Resources Policy, 77, 102683. [Google Scholar] [CrossRef] [Scilit]
- Zhu, Q., Ma, D., & Pan, Y. (2026). Dynamic spillover between geopolitical risk and energy markets: Portfolio hedging implication. Energy Economics, 157, 109254. [Google Scholar] [CrossRef] [Scilit]
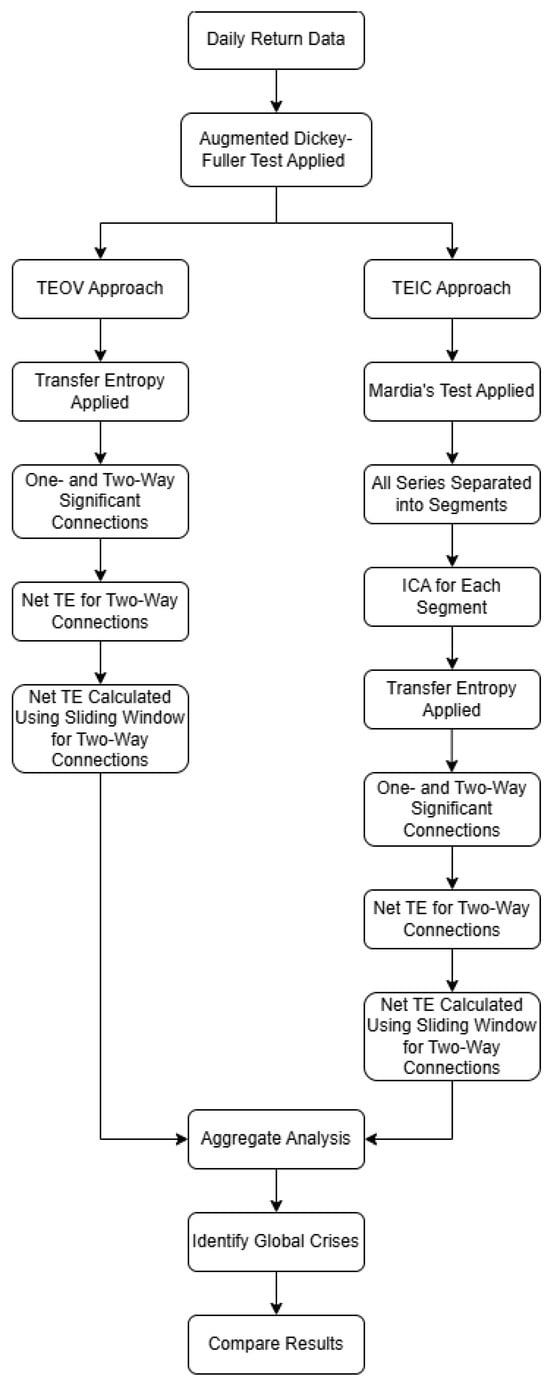
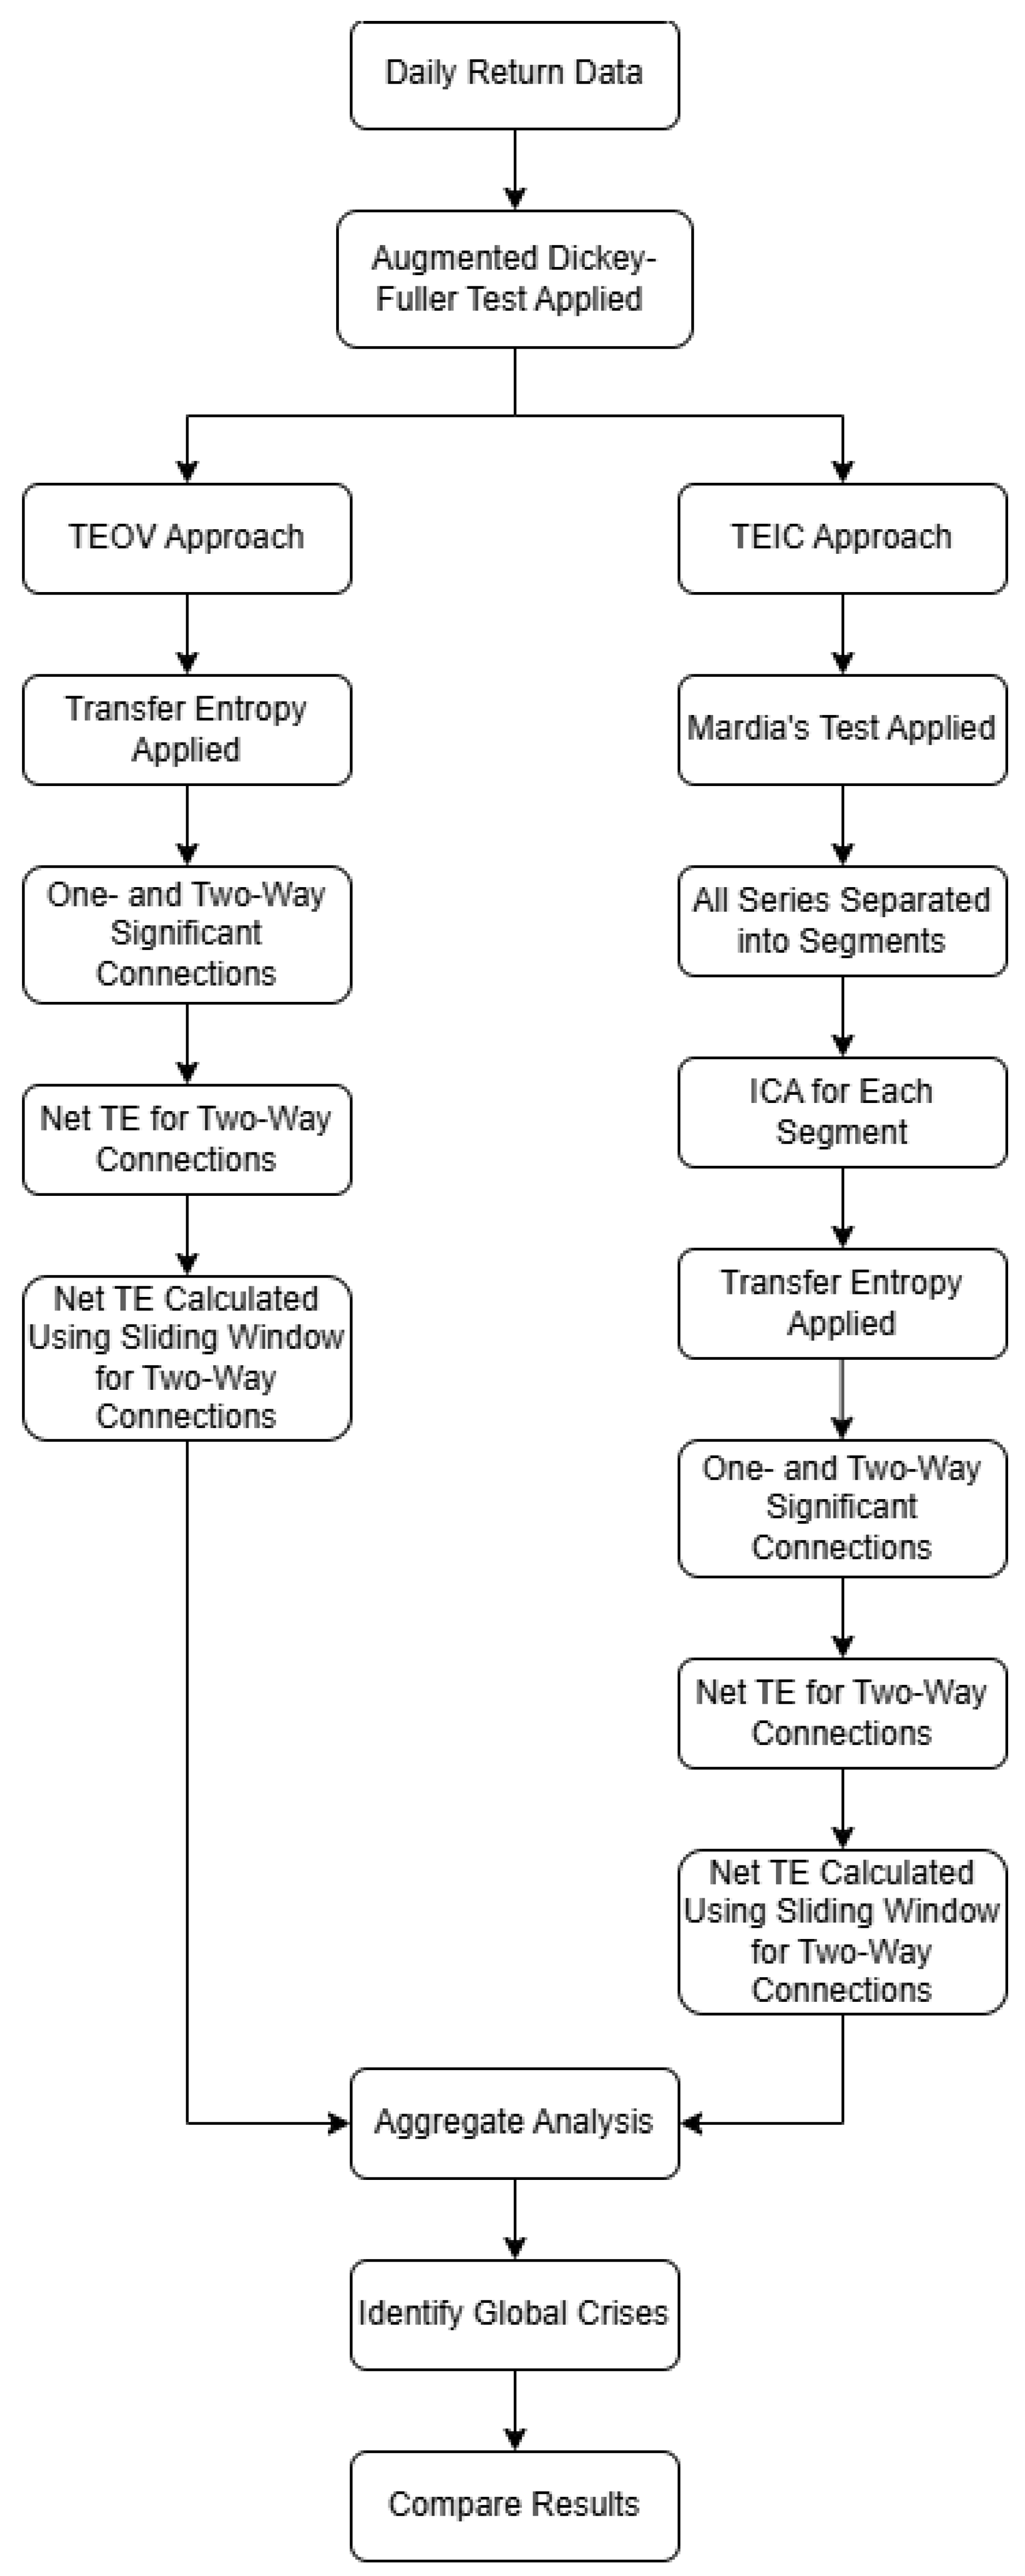
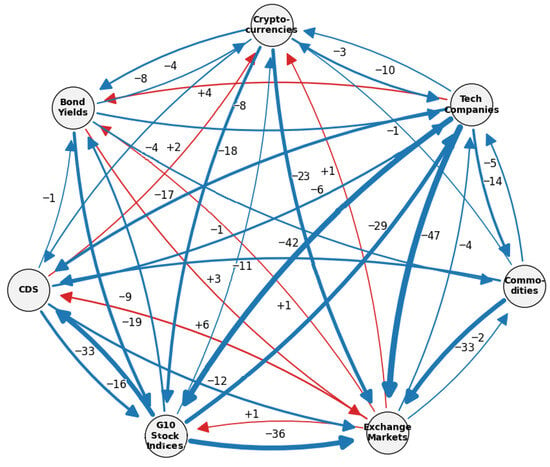
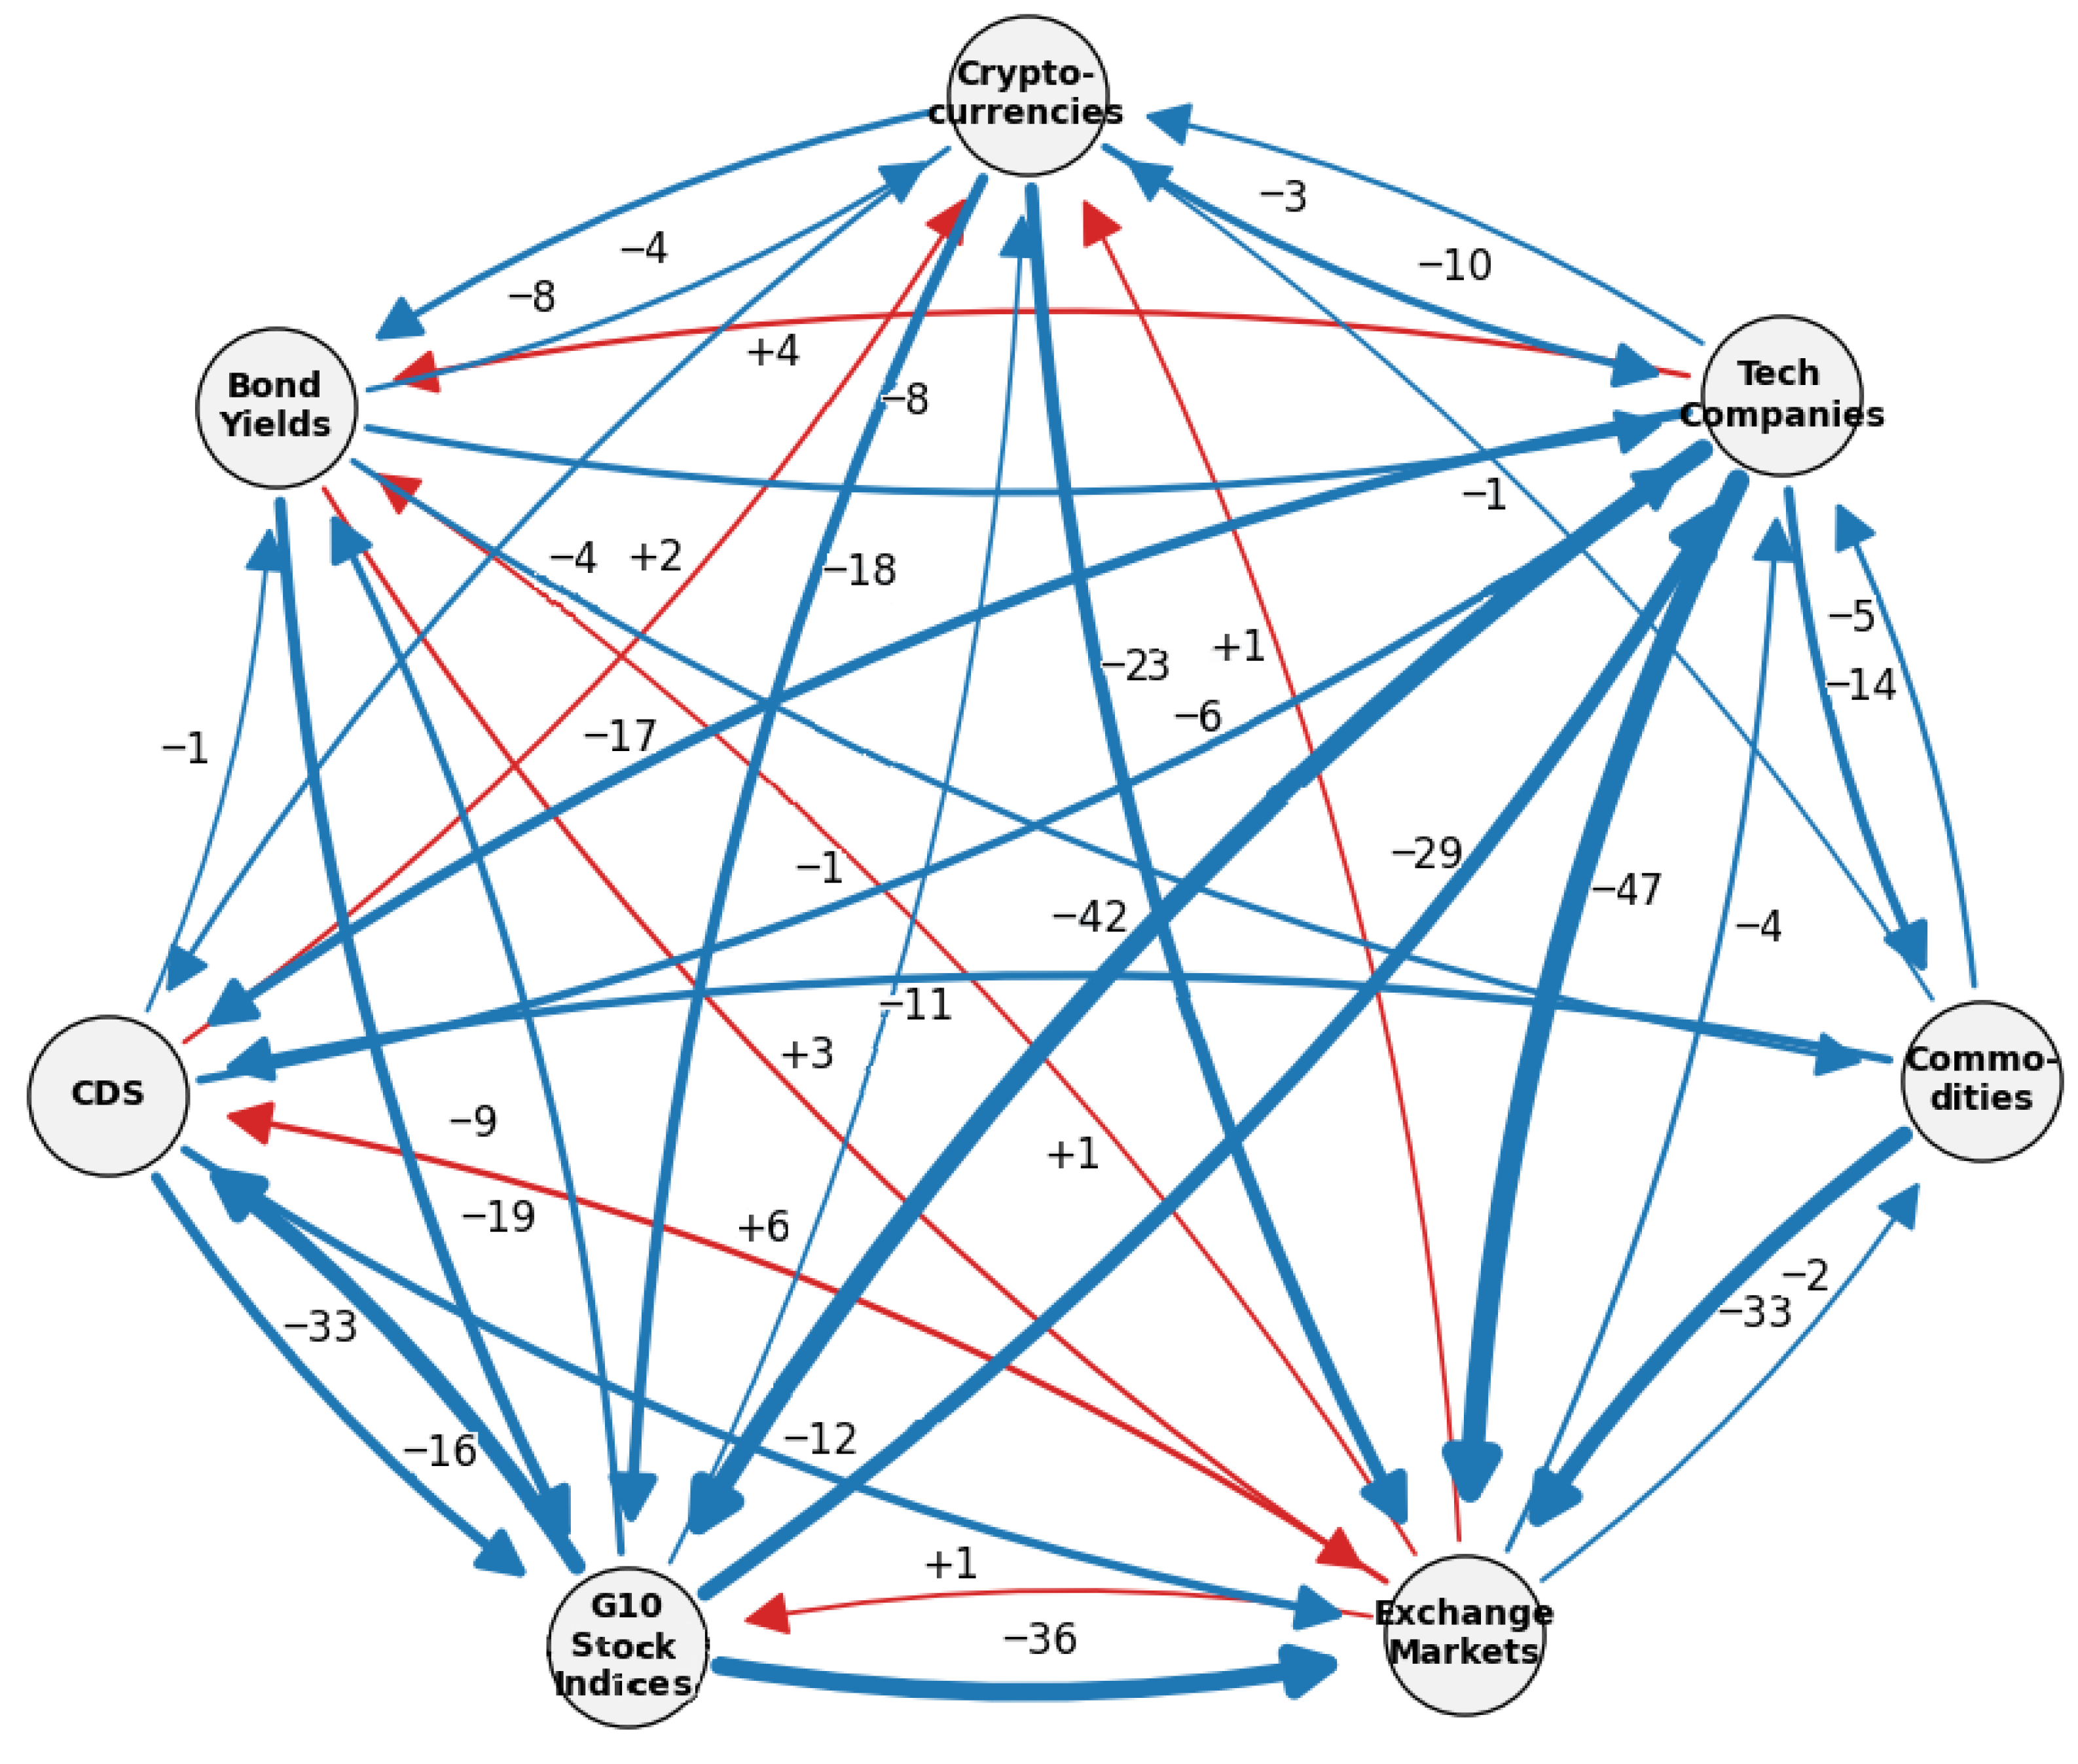
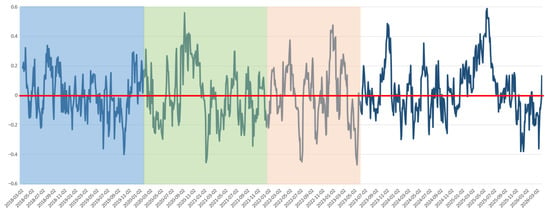
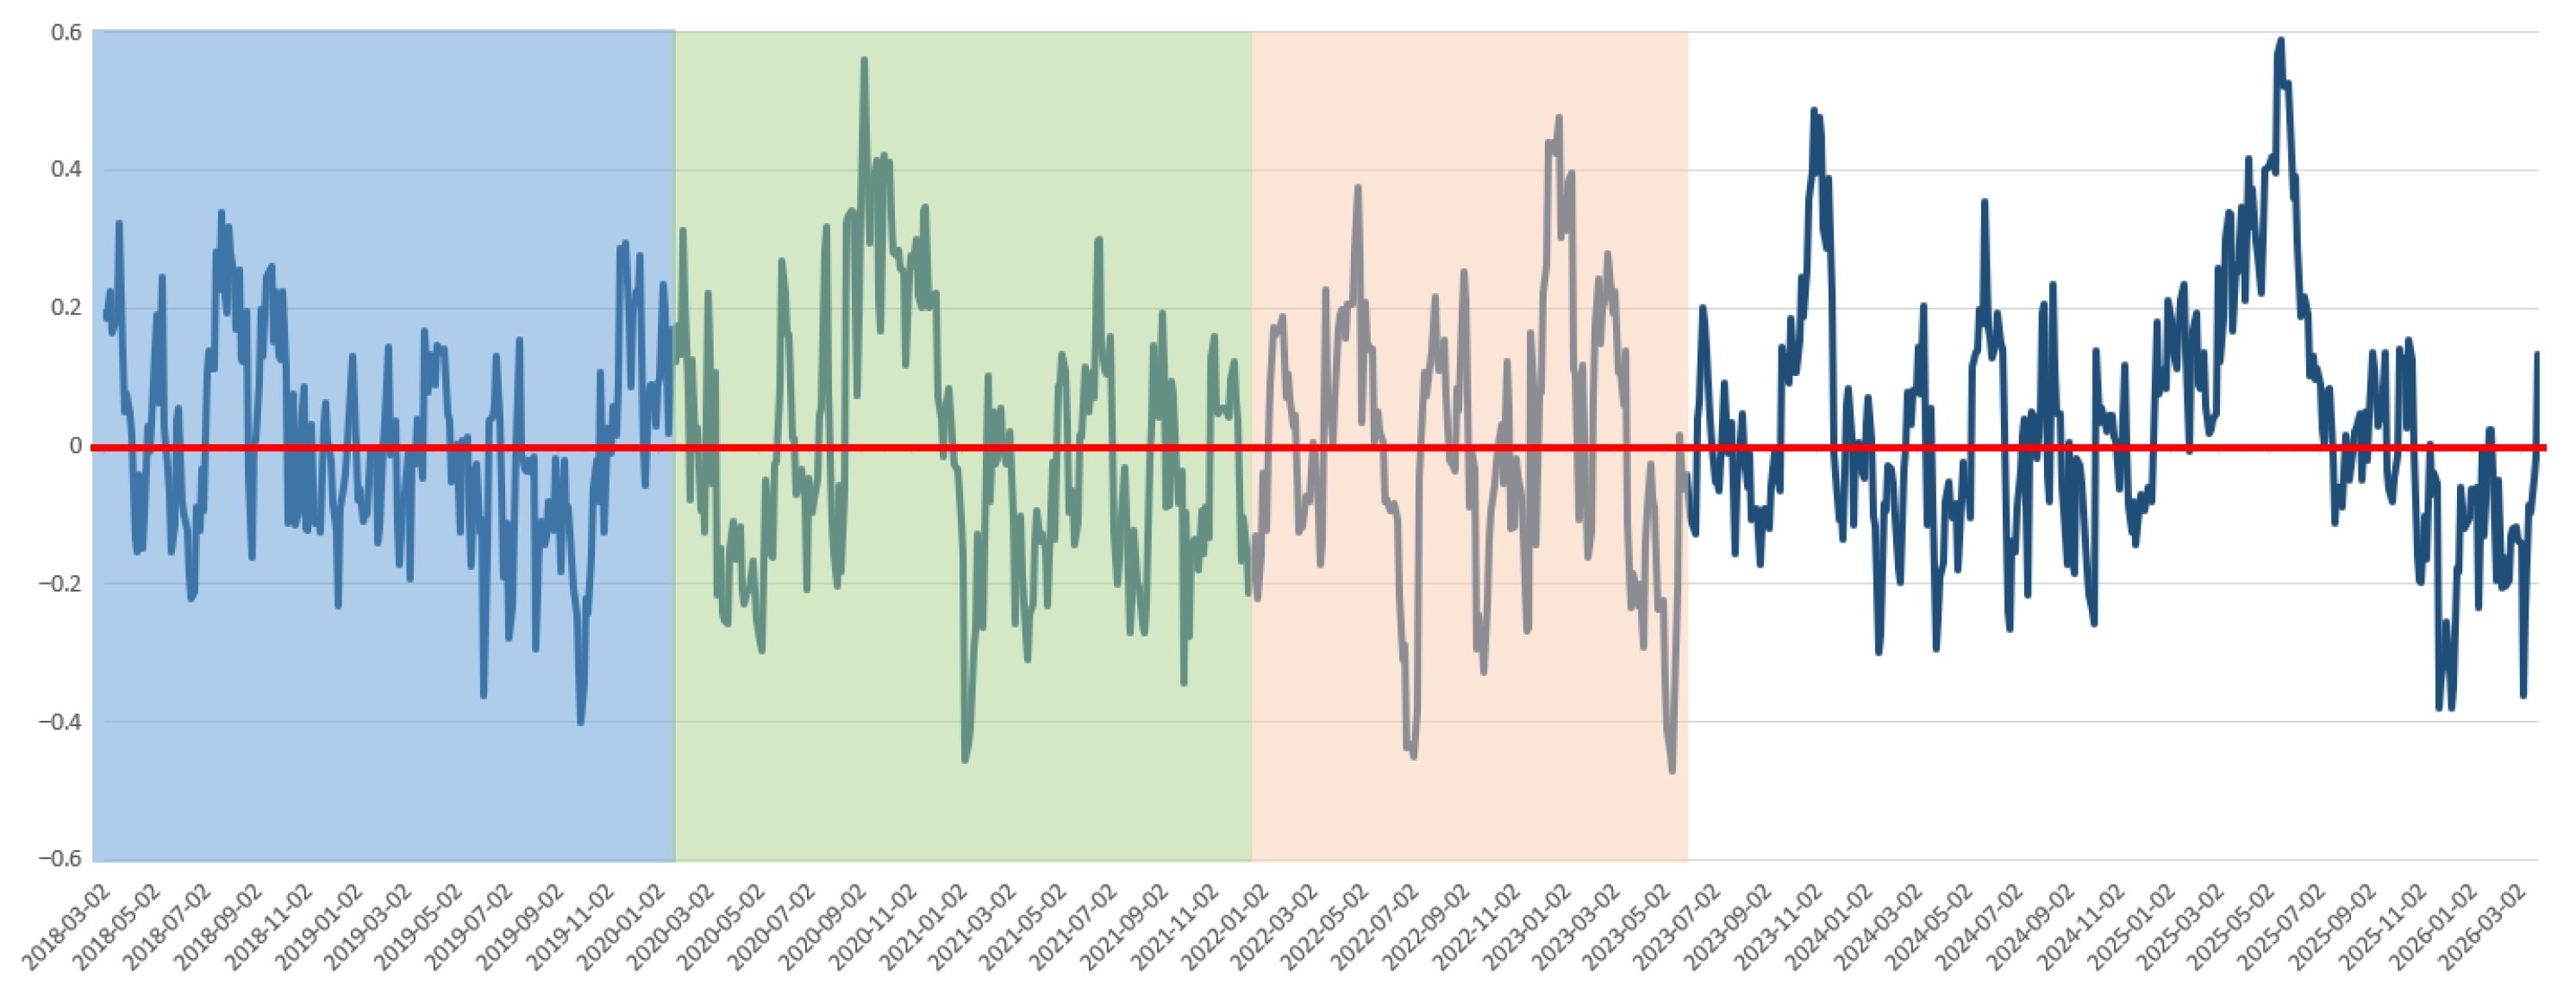
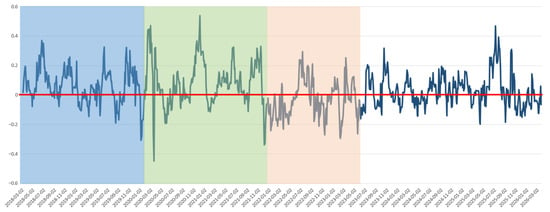
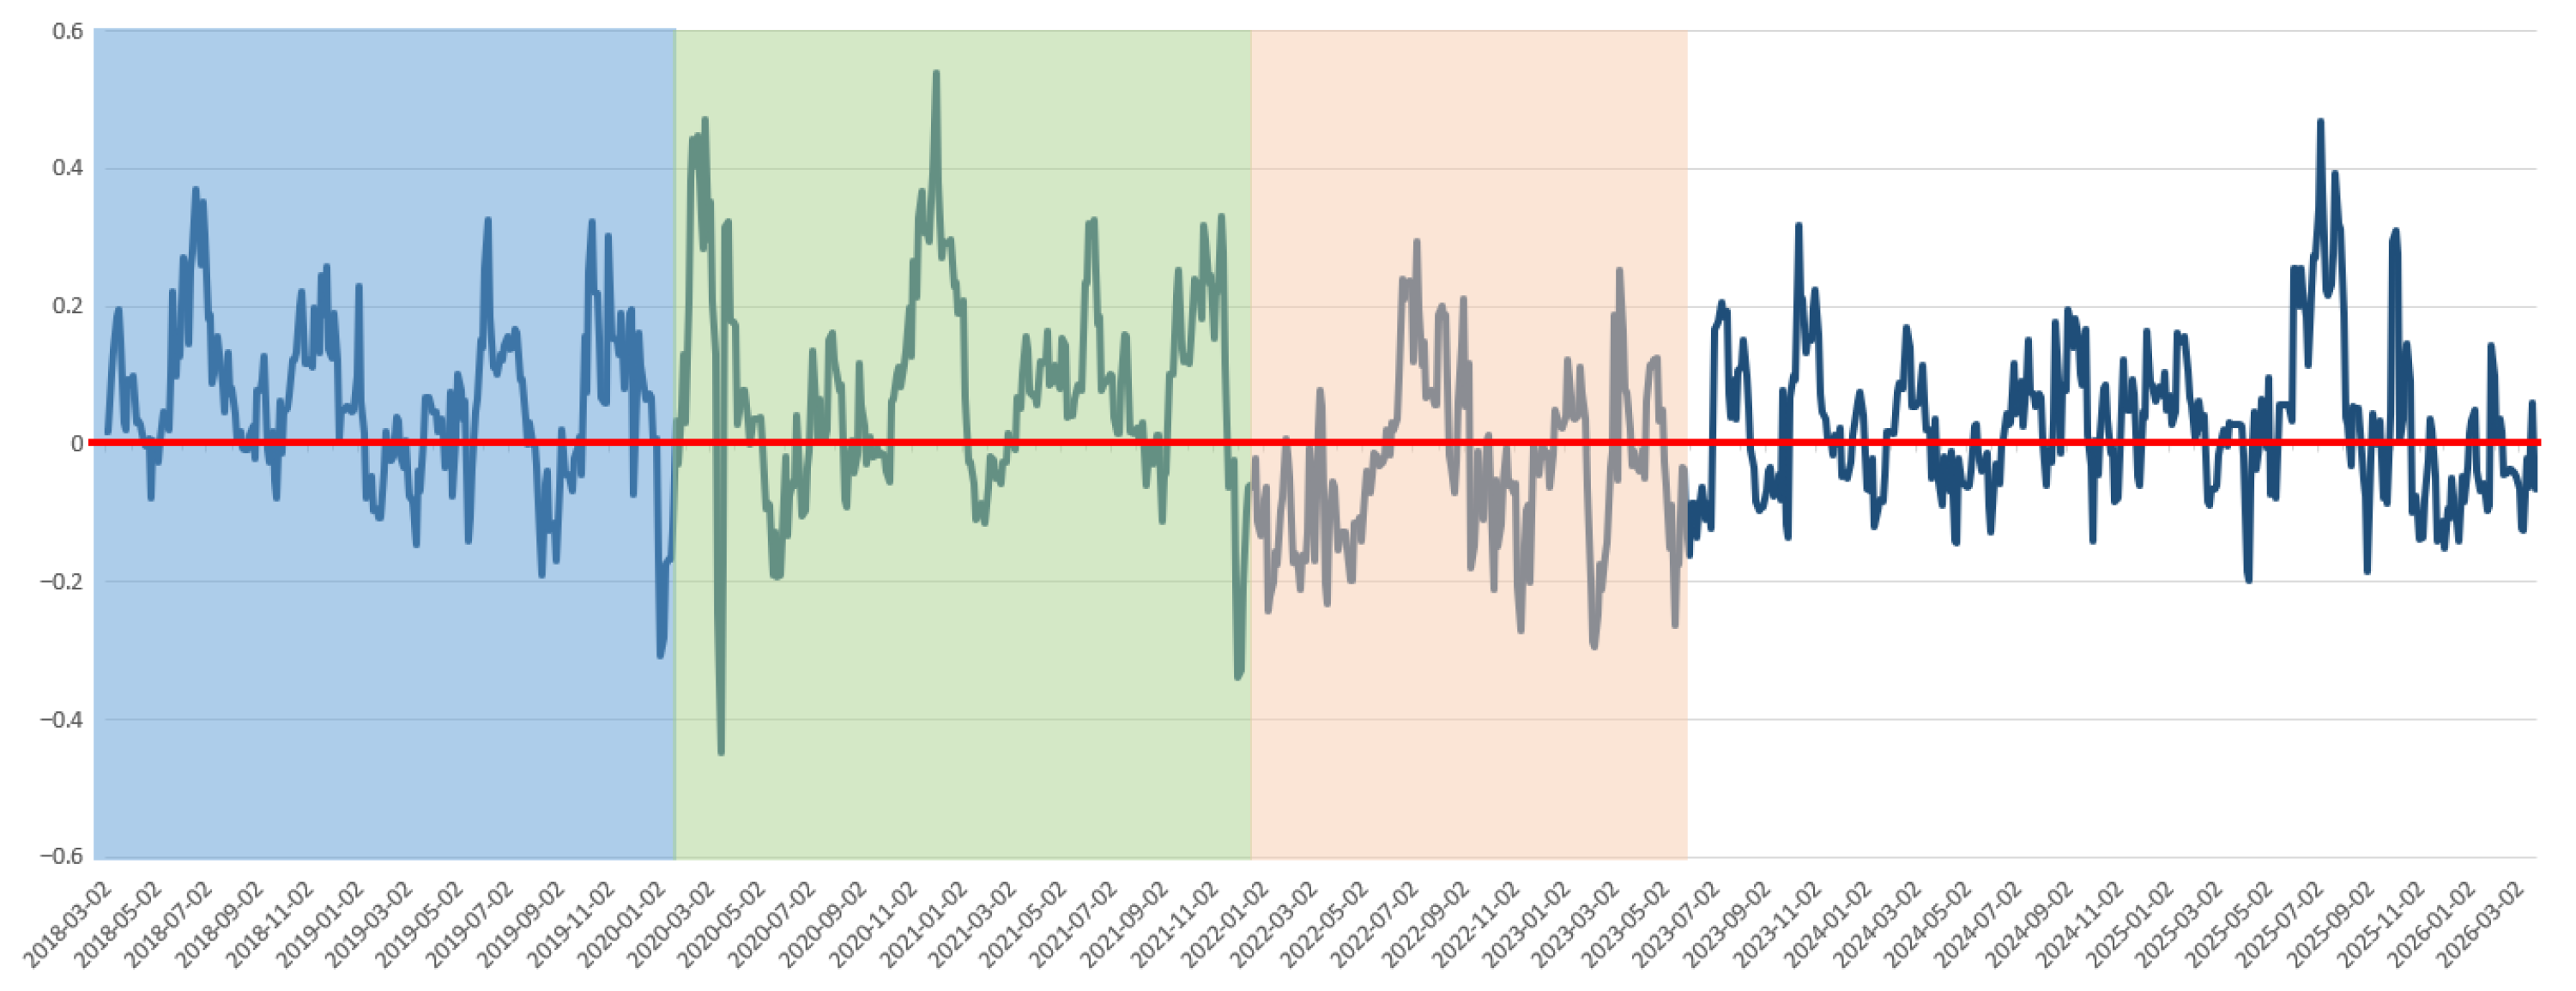
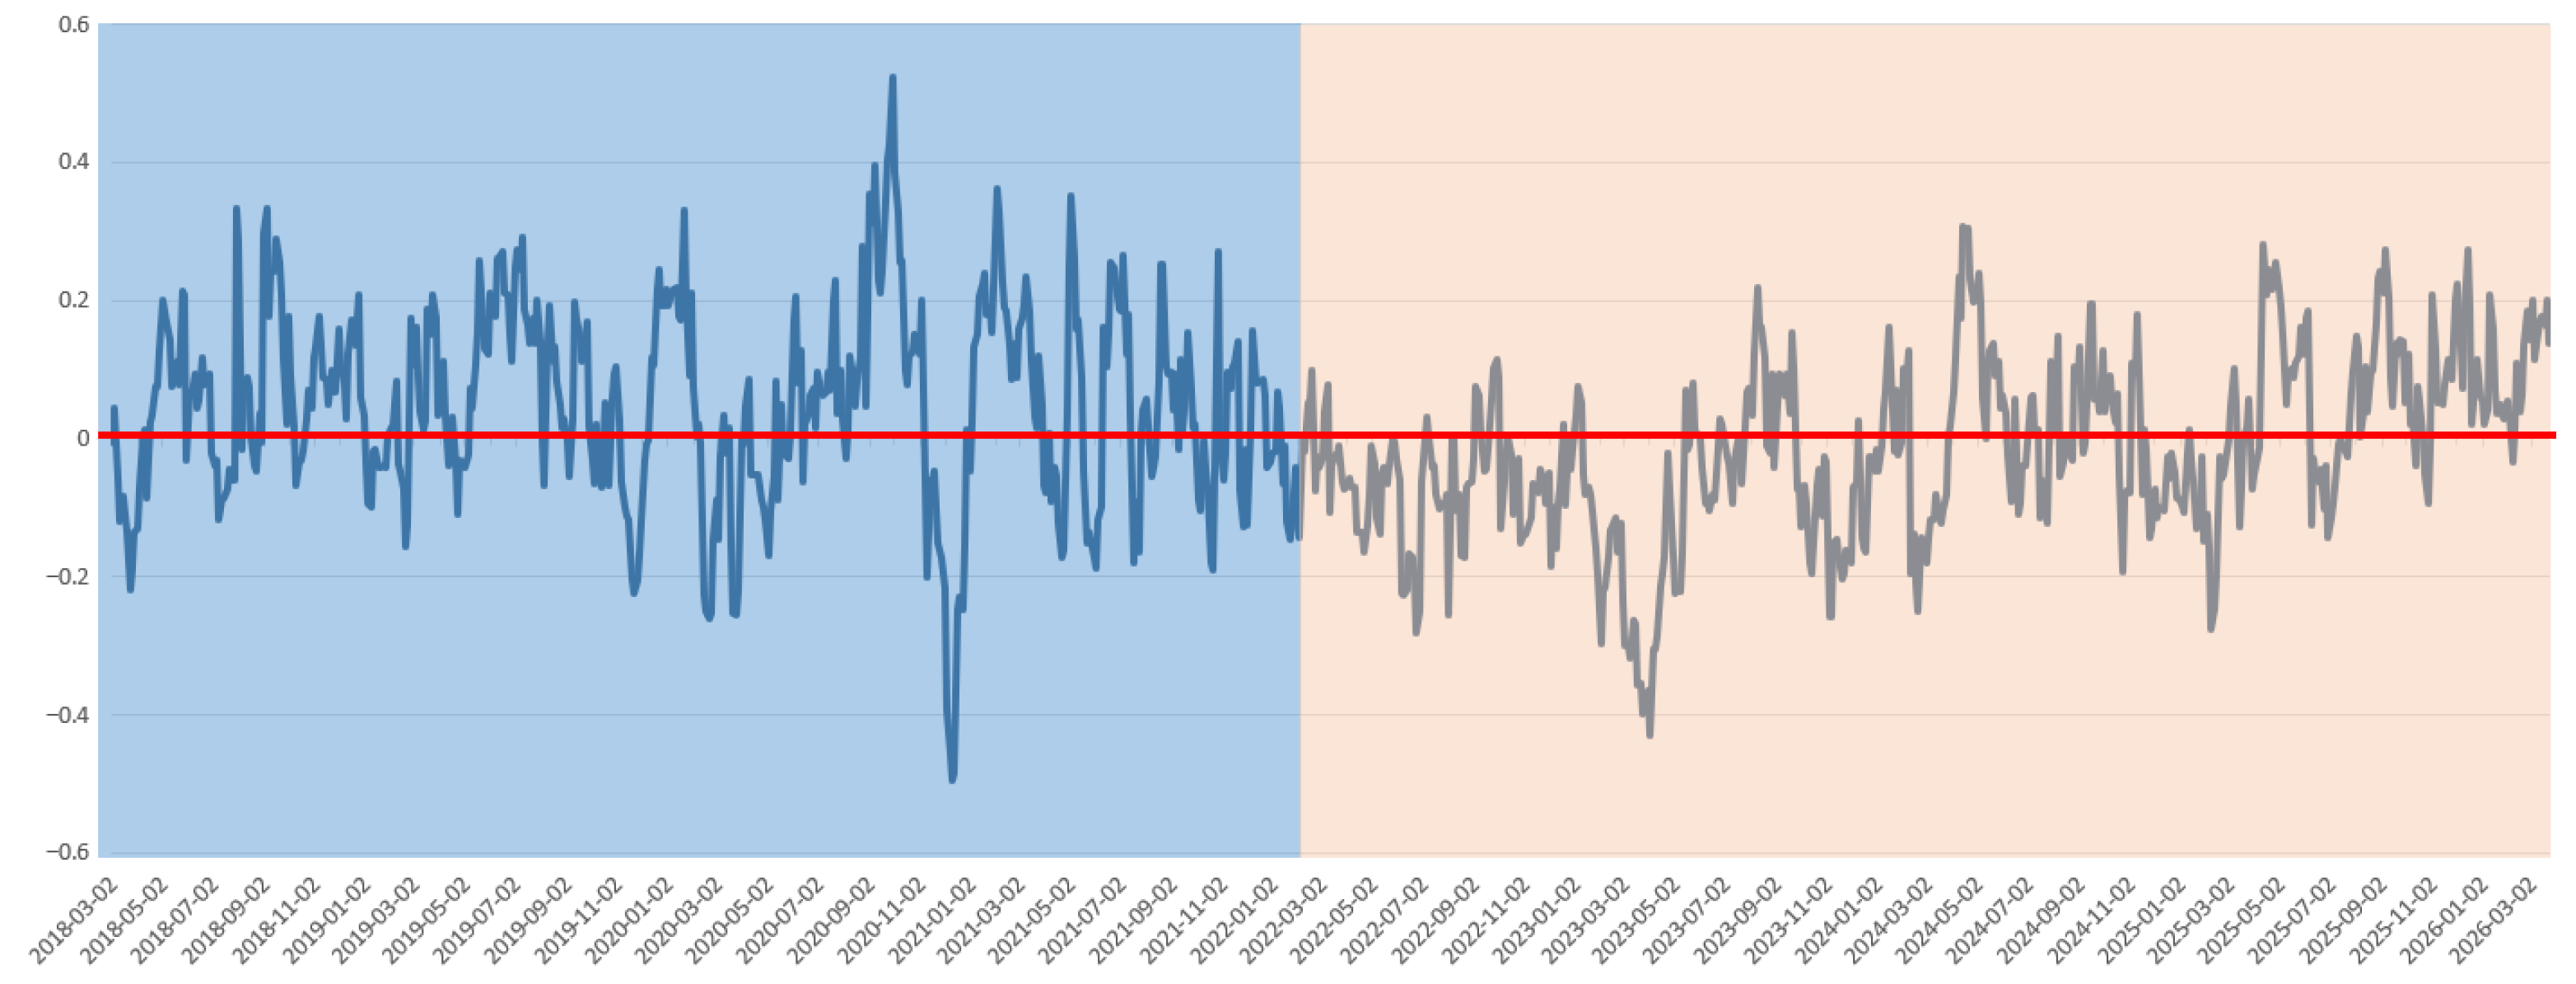
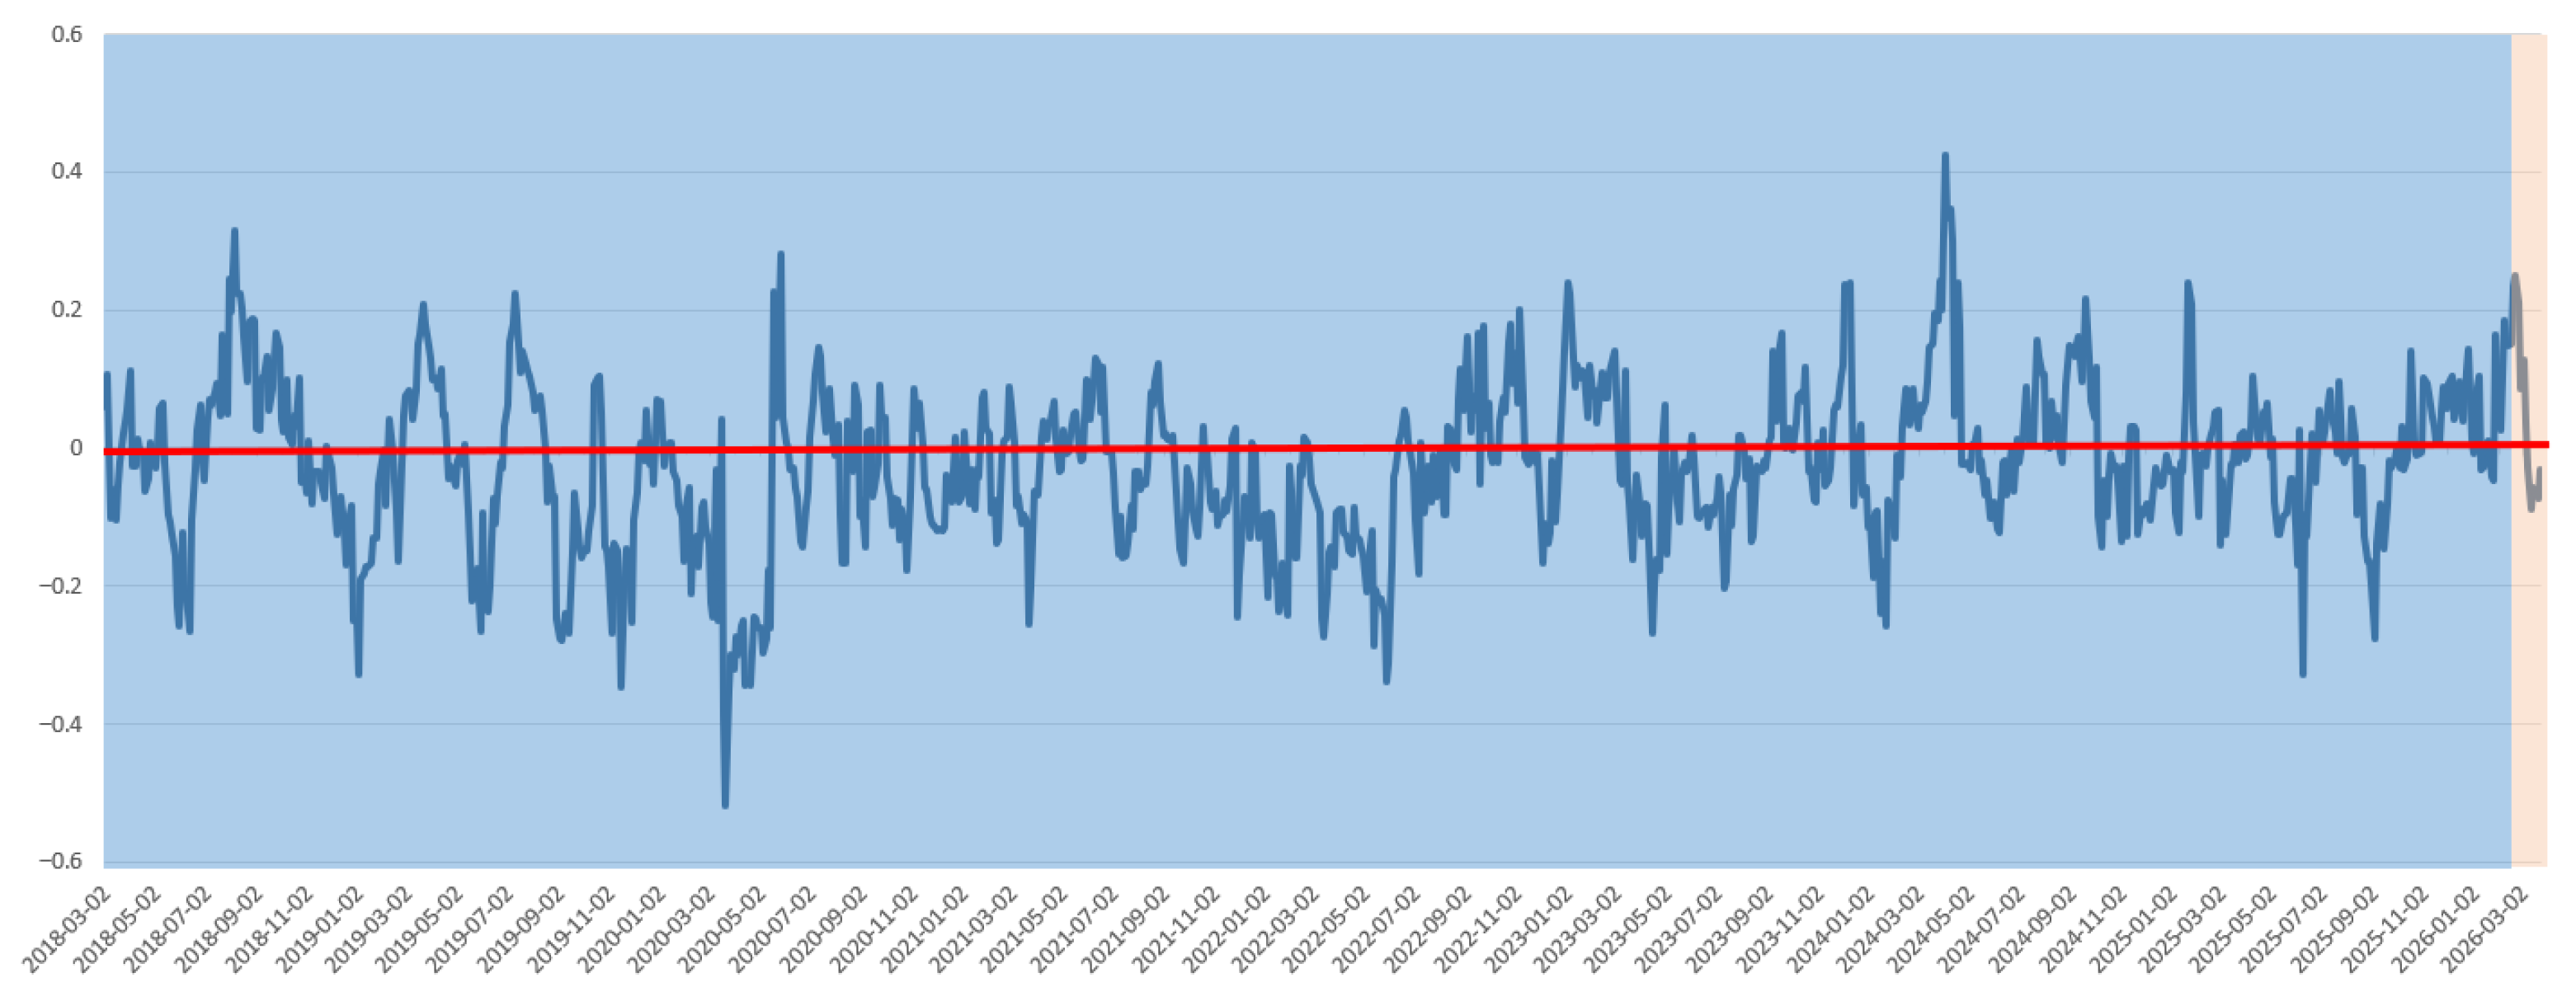

Disclaimer/Publisher’s Note: The statements, opinions and data contained in all publications are solely those of the individual author(s) and contributor(s) and not of MDPI and/or the editor(s). MDPI and/or the editor(s) disclaim responsibility for any injury to people or property resulting from any ideas, methods, instructions or products referred to in the content. |
© 2026 by the authors. Licensee MDPI, Basel, Switzerland. This article is an open access article distributed under the terms and conditions of the Creative Commons Attribution (CC BY) license.