


Abstract
This study examines the relationship between house prices and the factors driving their growth during the transition from a long-standing currency board regime to Eurozone membership. The main objective is to identify and quantify the key factors explaining the variation in house price growth in Bulgaria under conditions of prolonged currency convergence. The study applies a set of econometric techniques, including stationarity tests (ADF and KPSS), diagnostic checks for normality, serial correlation and heteroscedasticity, and robustness checks. The study is based on 40 quarterly observations covering the period 2015Q4–2025Q3 and 48 selected predictors of the General house price index. The final ARIMAX(0,2,1) model is estimated using second-differenced data. The model includes a first-order moving average component and three exogenous regressors: the owner-occupiers’ housing expenditures, the actual rentals for housing in Bulgaria and the homeowners’ utility expenses. The model explains 87% of the variation in house price acceleration, with a comparatively low mean squared error. The diagnostic analysis confirms model adequacy. The three exogenous regressors are statistically significant at the 1% level with strong and stable effects on house price dynamics. No statistically significant relationship is found for the set of traditional macroeconomic, demographic, financial, and sectoral factors. The results show that during Bulgaria’s transition from a currency board to the Eurozone, the sustained house price growth was driven by country-specific factors. The three statistically significant determinants of the house price acceleration in Bulgaria reflect, respectively, the active investment behaviour of homeowners in improving existing properties, the rational assessment by housing market participants of the balance between mortgage and rental payments, and the burden of utility and maintenance costs borne by owners and tenants, depending on property size and energy efficiency. The first factor is most influential for homeowners, the second for tenants, and the third has a similarly significant impact on both groups.
1. Introduction
Bulgaria’s accession to the Eurozone on 1 January 2026 completes a long process of currency convergence that began with the introduction of the currency board in 1997. This historical moment puts the country in a unique position to study the effects of currency integration on the housing market—a position that combines the characteristics of a small open economy with almost three decades of fixed exchange rates to the Deutsche Mark and the euro. While the literature presents numerous analyses of housing markets (Pagourtzi et al., 2003) in established Eurozone members and separate studies of the post-communist transformation of real estate in Eastern Europe, there is a significant gap in understanding how house prices are determined during a transition from a long-term currency board regime to Eurozone membership.
Existing research on real estate prices in Central and Eastern European countries (Marinković et al., 2024; Idirizov, 2025) typically focuses either on the period of post-communist privatization and liberalization (Egert & Mihaljek, 2007), or on the effects of EU accession (Ciarlone, 2015), or—for the few countries that adopted the euro—on the consequences of monetary integration (Dandashly & Verdun, 2021). What is lacking is a systematic analysis of a wide range of determinants of house prices in the context of prolonged monetary convergence that preceded formal membership. Bulgaria presents a unique case for such an analysis. Unlike countries such as Slovakia, Estonia, or Lithuania, which adopted the euro after relatively short periods of preparation, Bulgaria maintained a fixed exchange rate to the euro, initially through a peg to the Deutsche Mark in 1997, for nearly thirty years before entering the Eurozone. This long transitional state creates a specific institutional environment in which expectations of currency stability are already incorporated ex ante, while the institutional mechanisms of the monetary union are not yet operational. The question arises whether, in such a configuration, house prices move according to determinants characteristic of economies in transition, of countries in the process of convergence, or already reflect dynamics typical of Eurozone members. Secondly, the question arises whether accession expectations generate an anticipatory increase in the house price index (Liu et al., 2024), with fundamental factors such as GDP and wages lagging behind price growth. Thirdly, the possibility of an independent trajectory of house price dynamics, based on the convergence of household wealth across EU member states as a whole and the Eurozone in particular, is considered. The search for answers to these questions defines the research problem addressed in this study.
The study focuses on identifying the key factors that drive the house price growth in Bulgaria during the period 2015–2025, which covers both the phase of intensive preparation for Eurozone membership and the pandemic shock, that had a strong negative effect on the Bulgarian population, followed by approval for admission to the Eurozone through the publication of the convergence report on 4 June 2025 (European Commission, 2025). From a theoretical point of view, this period represents a natural experiment for studying the stability of determinants under changing institutional regimes. From a practical perspective, understanding these factors (Yordanova & Hristozov, 2025) has direct implications for macroprudential policy implementation and for monitoring financial stability under a new exchange rate regime following the introduction of a new currency (Atanassov et al., 2017).
The central research gap addressed in this study is the lack of empirical models that systematically test which of the many potential determinants of house prices retain explanatory power under conditions of prolonged currency convergence. While studies of housing markets in individual Eastern European countries exist, they rarely use a stepwise approach to selecting factors from a wide range of variables and even less often cover the period immediately before and during Eurozone accession. This methodological gap is particularly important because it limits the ability of policymakers and central bankers to identify the benchmark indicators needed to monitor the housing market under changing institutional conditions. Eurozone accession may act as a psychological factor with a strong influence on buyers and sellers in the housing market (Visković & Čipčić, 2025). Comparisons of house prices before and after Eurozone accession support the existence of an accession effect, which in turn supports the convergence process, including household wealth accumulation. The methodological challenge is to explain how, under conditions of macroeconomic stability and a declining HICP in line with the Maastricht convergence criteria, a sustained increase in the ad valorem indicator of house prices is observed. In search of an explanation for this process, the authors build on classical models that assess a limited number of macroeconomic variables and extend them through an econometric assessment of the widest possible range of housing-related determinants monitored by statistical institutions and banks, for which continuous data are available for the relevant period.
The aim of the study is to identify and quantify the key factors that explain the acceleration of house price growth in Bulgaria during the period 2015–2025 under conditions of prolonged currency convergence, using a methodological approach for selecting from a wide range of macroeconomic, financial, demographic and sectoral variables.
To achieve this aim, the following research tasks are defined: (1) to identify, on the basis of a review of the academic literature, a broad set of determinants of house price dynamics and to examine the direction of their influence; (2) to identify, through the application of statistical and econometric methods, the factors most relevant to the Bulgarian housing market and to assess their impact on house price dynamics; (3) to interpret the results in the context of Bulgaria’s accession to the Eurozone and to assess the potential impact of this process on house price dynamics.
This study has several inherent limitations. First, the analysis uses quarterly data over a ten-year period (2015–2025), yielding 40 observations—sufficient for a statistically valid assessment, but conservative in terms of capturing high-frequency dynamics in factors for which market price data are generated daily, weekly, or monthly. Second, the focus is on nationally aggregated data, which conceal regional differences in housing markets, where capital cities usually exert a leading influence on national trends. Third, the econometric procedure requires the exclusion of certain predictors from the final model due to methodological constraints such as multicollinearity and non-stationarity. These variables are discussed separately in the interpretive section to provide a more complete picture of the factors driving the General house price index (GHPI)—the total House price index published quarterly by the National Statistical Institute of Bulgaria, covering transactions in both new and existing dwellings. Fourth, the observation period includes only a short interval following the publication of the convergence report recommending Bulgaria’s accession to the Eurozone on 1 January 2026, which limits the possibility of assessing the long-term effects of currency integration.
On this basis, the study is structured as follows. Following this introduction, which sets out the study’s relevance, research gap, aim, objectives and limitations, Section 2 presents an analytical overview of contemporary research on the determinants of house prices and the rationale for their possible grouping. Section 3 focuses on international trends in the EU housing sector, the collection and grouping of national data on the predictors, the development of the methodological approach, and the model specification. Section 4 presents the results of the analysis, including the statistical characteristics of the final model and the estimates of the individual factors. Section 5 discusses the findings in light of theoretical expectations, the institutional context, and empirical evidence from other national residential real estate markets. Section 6 summarises the main conclusions, outlines the implications of the results for institutional policymaking, and suggests directions for future research. In this way, the study seeks to position the Bulgarian housing market on a spectrum between moderate, EU-conforming growth and distinct national price dynamics that anticipate the effects of Eurozone accession.
2. Literature Review and Hypotheses
The literature on house price dynamics provides extensive evidence on the determinants of house price growth at regional, national, supranational and global levels. A characteristic feature of these studies is their emphasis on macroeconomic factors as the basis for models assessing house price dynamics. Within this group, GDP and/or its components (Algieri, 2013) are repeatedly confirmed as influential determinants of house prices. These studies provide evidence of the role of GDP as a universal fundamental factor (Li & Zeng, 2010), both in national analyses (Cohen & Karpavičiūtė, 2017; Ubarevičienė & Aidukaitė, 2026; Mazáček & Panoš, 2025), and in studies of leading urban agglomerations (Sivitanides, 2018; Reichle et al., 2023), where the focus is on the problem of housing affordability in capital cities (Haandrikman et al., 2023), regional differences (Prodanov & Naydenov, 2020; Sabitova et al., 2020) and the growth of prices driven by supply deficits (Stroebel & Vavra, 2019). At the macroeconomic level, inflation has also been studied (Anari & Kolari, 2002) as a fundamental factor influencing house prices (Kuang & Liu, 2015; Cohen & Karpavičiūtė, 2017).
The second group of factors includes services related to acquisition, maintenance (Gurmu et al., 2021) and repair (Taggart et al., 2014; Park & Seo, 2024), which also influence house prices. In Bulgaria, newly constructed dwellings are often delivered at the “internal linings and plastering” stage, after which additional expenditure is required to bring them to a habitable standard, including furnishing. A similar situation arises when an existing property is purchased (Passek & Nübel, 2025), as the new owner often undertakes major interior renovations, effectively bringing the property back to a comparable unfinished stage (Aydinli, 2024).
Third, the factors related to energy provision and utility services for housing used by households should be assessed, as they exhibit a sustained trend of increasing volatility under conditions of multiple crises (Ushenko et al., 2023). Homeowners face the burden of increasing energy costs (Shen et al., 2022; Cermáková & Hromada, 2022), utilities (Mazáček & Panoš, 2025), housing rental costs (Doling & Ronald, 2010) and taxes (Iliopoulou et al., 2025). Among these costs, investments to improve the energy efficiency (Zhelyazkova, 2018) of owner-occupied homes should also be considered (Ciot, 2022). A fourth group concerns the impact of the number of new buildings and dwellings constructed, together with the corresponding number of rooms. Design costs and construction materials (Herrera et al., 2020; Zhang et al., 2024), together with the subsequent supply of newly built dwellings (Araya et al., 2024; Pazdzior et al., 2021; Caldera Sánchez & Johansson, 2011) are determinants of house price (Mayer & Somerville, 2000), including when the effects of the COVID-19 pandemic (Yotzov et al., 2020) and the safety measures in the working conditions of construction workers (Ebekozien & Aigbedion, 2021) are taken into account.
The fifth group of factors focuses on households seeking housing, particularly their incomes (Ünalan et al., 2025) and employment. Income (McQuinn & O’Reilly, 2008) and labour market (Hadad et al., 2022), together with employment and unemployment indicators (Irandoust, 2019), constitute an important group of indicators influencing housing demand and have been examined in a number of studies (Girouard et al., 2006). A sixth group concerns credit conditions for the acquisition of residential property. Housing finance conditions and mortgage interest rates are widely recognised as key determinants of housing demand (McQuinn & O’Reilly, 2008; Lin et al., 2022), forming a well-established strand of the empirical literature (Girouard et al., 2006). Finally, a seventh group concerns foreign investment in residential property and the role of stock market securities as an alternative vehicle for household wealth accumulation. Home ownership constitutes a significant component of household wealth, and its optimal allocation should take into account investment alternatives, including stock market securities (Zaharieva et al., 2022) and foreign currency-denominated assets, all of which may influence housing prices (Ouhinou et al., 2025).
The grouping of factors influencing housing prices in Bulgaria follows several logical considerations. First, the grouping reflects the nomenclature of indicators published by the NSI, Eurostat and BNB, including residential buildings, housing stock, housing price statistics (NSI, 2026), and interest rates on loans to households (BNB, 2026). Second, it is aligned with the classical four-quadrant model of the real estate market (DiPasquale & Wheaton, 1992), which distinguishes between the market’s spatial dimensions—demand and supply—and its financial dimensions—investment, prices, and financing. Third, it takes into account non-systematic local factors specific to the Bulgarian context: (a) the currency board arrangement, which functions as an effective monetary stabilisation mechanism, has contributed to the long-term accumulation of substantial gold and foreign exchange reserves and has enabled commercial banks to offer low mortgage interest rates, generating a clear substitution effect whereby households weigh monthly mortgage payments against monthly rental costs; (b) the significant share of prefabricated panel buildings in Bulgaria’s housing stock, in which approximately one quarter of the population resides—properties characterised by a low price base at the beginning of the study period that have subsequently become subject to public and private investment aimed at improving their habitability and investment attractiveness. Fourth, the model accounts for the effects of global crises during the second half of the study period (2020–2024): (a) the COVID-19 pandemic, which directly stimulated demand for larger dwellings and suburban housing meeting home-office standards (Schwartz & Wachter, 2023); (b) the energy crisis of 2021–2022 and the EU decarbonisation agenda, both of which affected residential property markets and utility costs (Brolinson et al., 2026); and (c) the large-scale displacement of Ukrainian refugees to Europe after 2022 (Perry et al., 2026), with a particular impact on countries historically linked to Ukraine, including Poland (Kochaniak et al., 2024) and Bulgaria, where refugee inflows directly affected housing demand. These considerations support the authors’ approach of constructing a broad initial set of potential determinants of house prices, which, through econometric testing, analysis, and stepwise selection, yields a final parsimonious model with optimal explanatory power.
Based on the theoretical framework resented above and the identification of groups of factors influencing house prices, the main research hypothesis posits that, regardless of institutional changes and external shocks, the variation in house price growth in Bulgaria is explained by a limited number of predictors. This effect is sustained by the long-term pegging of Bulgaria’s national currency to the euro through the currency board and by the household demand for housing, which drives prices to incorporate an ex ante appreciation premium due to the prospect of Eurozone accession.
Drawing on the literature review and the discussion of the research gap, we test the following specific research hypotheses regarding the determinants of house prices in Bulgaria:
H1:
Household expenditure constitutes a statistically significant driver of house price dynamics in Bulgaria, with demand-side cost pressures—including costs associated with dwelling maintenance and related services—representing a primary transmission mechanism for residential price appreciation.
H2:
Changes in the rental housing market exert a statistically significant positive effect on growth in the General house price index in Bulgaria, as rising rental costs incentivise ownership demand and capitalise expected returns into residential property valuations.
H3:
House prices in Bulgaria exhibit significant short-term inertia in price formation, whereby price acceleration persists across consecutive quarters, amplified by the credibility of the currency board arrangement and the ex ante appreciation premium associated with the prospect of Eurozone accession.
3. Materials and Methods
3.1. European Housing Market Overview
The EU27 Member States are an example of the uniqueness of national characteristics relative to the EU average in terms of household home ownership. On average across the EU27 in 2024, 31.6% of the population lived in rented homes, while 68.4% of the population lived in owner-occupied homes (Eurostat, 2025b). Across the EU27, the gap between the country with the lowest and the country with the highest level of rental housing amounts to 47.1% (See Figure 1).
Figure 1.
Share of the population living in owner-occupied or rented housing in the EU27 aggregate and individual Member States, 2024, with highlighted data for Bulgaria and EU27. Source: (Eurostat, 2026a), authors’ calculations and graphical illustration.
Romania ranks first in terms of home ownership with 94.3%, followed by Slovakia, Hungary, Croatia, Lithuania, Poland, and Bulgaria. In contrast, Germany is the only country where the share of households living in owner-occupied homes is below 50%, compared with 52.8% of households living in rented housing. The data point to the importance of national-level research in the field of housing investment, which may reveal country-specific factors and predictors of HPI growth that are unlikely to be universally applicable across all EU27 countries. The balance between renting and owning a home depends on the relative affordability of the two options, as measured by the price of the home and the cost of renting it. In both cases, the choice may be supported by appropriate financial analysis tools (Nenkov & Hristozov, 2022). According to the latest estimates of the European Parliament, a sustained trend of increasing house prices and rents is observed in the European Union, reaching what is described as a “crisis situation” (European Parliament, 2025). The data indicate an average increase in house prices in the EU27 of 53.44% over the period 2015–2024, with Hungary recording the highest increase in house prices, as measured by the HPI, at 209.86%, followed in the first quartile by Lithuania, Portugal, Czechia, Bulgaria, Estonia, and Poland, which also belong to the group of countries with the highest house price growth rates. At the other end of the scale is Finland, with a HPI increase of only 1.35% over the 10-year period (Eurostat, 2026b). With regard to the residential rents in the EU, average rent growth lags behind house price growth. Using 2010 as the base year, housing rents in the EU had increased by 25% by 2024. The largest increase in housing rents is reported in Estonia (+208%), followed by Lithuania (+177%), Ireland (+108%), and Hungary (+107%), while Greece recorded a 16% decrease in rents (Eurostat, 2025b). The data and graphical evidence suggest substantial cross-country heterogeneity among EU member states in terms of house price dynamics, as measured by the HPI. Among these countries, Bulgaria stands out, particularly in the context of its accession to the Schengen area in early 2025 and to the Eurozone on 1 January 2026 (See Figure 2), as the increase in the house price index in Bulgaria for the period 2015–2024 is 2.2 times higher than the EU average, while its average annual growth rate is 1.82 times higher than that of the EU27 over the same period.
Figure 2.
EU countries HPI index change (2015 = 100) with highlighted data for Bulgaria and EU27: (a) Average annual rate of HPI change per countries and EU27; (b) Annual data of HPI per member states and EU27 for 2016, 2020 and 2024. Source: (Eurostat, 2025b), authors’ calculations and graphical illustration.
On this basis, it is scientifically relevant to identify the factors driving the GHPI in Bulgaria with a focus on the period 2015–2024 with 2015 as a base year (2015 = 100). The choice of 2015 (resp. 2015Q4) as the base year of the study is determined by the methodology used by the main statistical sources. For Eurostat and the NSI, 2015 is defined as the base year for time series with index indicators related to house prices, which meets the requirements of the European System of Accounts (ESA, 2010) and is consistent with European statistical harmonization (Eurostat, 2014). Accordingly, the data from the BNB registers are consistent with the methodology of these statistical institutions. From an economic perspective, 2015 is also a relatively neutral year, following the prolonged recovery from the 2008–2009 crisis, the collapse of the mortgage bond markets, and the bankruptcy of Lehman Brothers.
The data shown in both figures also correspond to the increase in Bulgaria’s GDP per capita which was 2.48 times higher in 2024 than in 2015 (Eurostat, 2025a), and to the increase in GDP at current prices, measured in billion euros, which was 2.37 times higher over the same period. These results were achieved under conditions of macroeconomic equilibrium and sustained compliance with the Maastricht criteria for membership in the Eurozone, with an HICP of 2.6% for 2024.
3.2. Research Data Collection, Grouping and Preselection
For this study, data were collected for 48 candidate variables (See Appendix A.1) selected on the basis of the theoretical literature on housing price determinants in Bulgaria, and covering the construction, renovation, maintenance and utility cost dimensions of the residential property market. From a supply-side perspective, the dataset includes indicators of new dwelling construction, disaggregated by property size, from one-room to six-or-more-room dwellings. On the demand side, the analysis examines financial and economic factors affecting purchasing capacity, including wages, dwelling credits, and mortgage interest rates, as well as the stock market index as an alternative vehicle for household wealth accumulation (Gönül & Omay, 2025). An evaluation of the historical data shows a net increase for 43 of the studied predictors over the period 2015Q4–2025Q3, while 5 predictors show a decrease.
The dependent variable is the General house price index (GHPI), which increased by 2.56 times over the ten-year period, compared with GDP, which increased by 2.75 times, and wages, which increased by 2.86 times. The sub-indices, HPI for existing dwellings (HPIED) and HPI for new dwellings (HPIND), report growth of 2.75 and 2.32 times, respectively. For the studied period, the working-age population of Bulgaria decreased by 7.89%. Among the financial indicators, the most significant change is the decrease in the predictor “Bad and restructured housing loans” by 86.7%, followed by decreases of 58.08% in the BNB interest rate and of 57.92% in the mortgage interest rate. The unemployment rate also decreased by 56.96% and reached 3.3%, the second-lowest level in the EU (Eurostat, 2026c), as of the date of the country’s accession to the Eurozone on 1 January 2026.
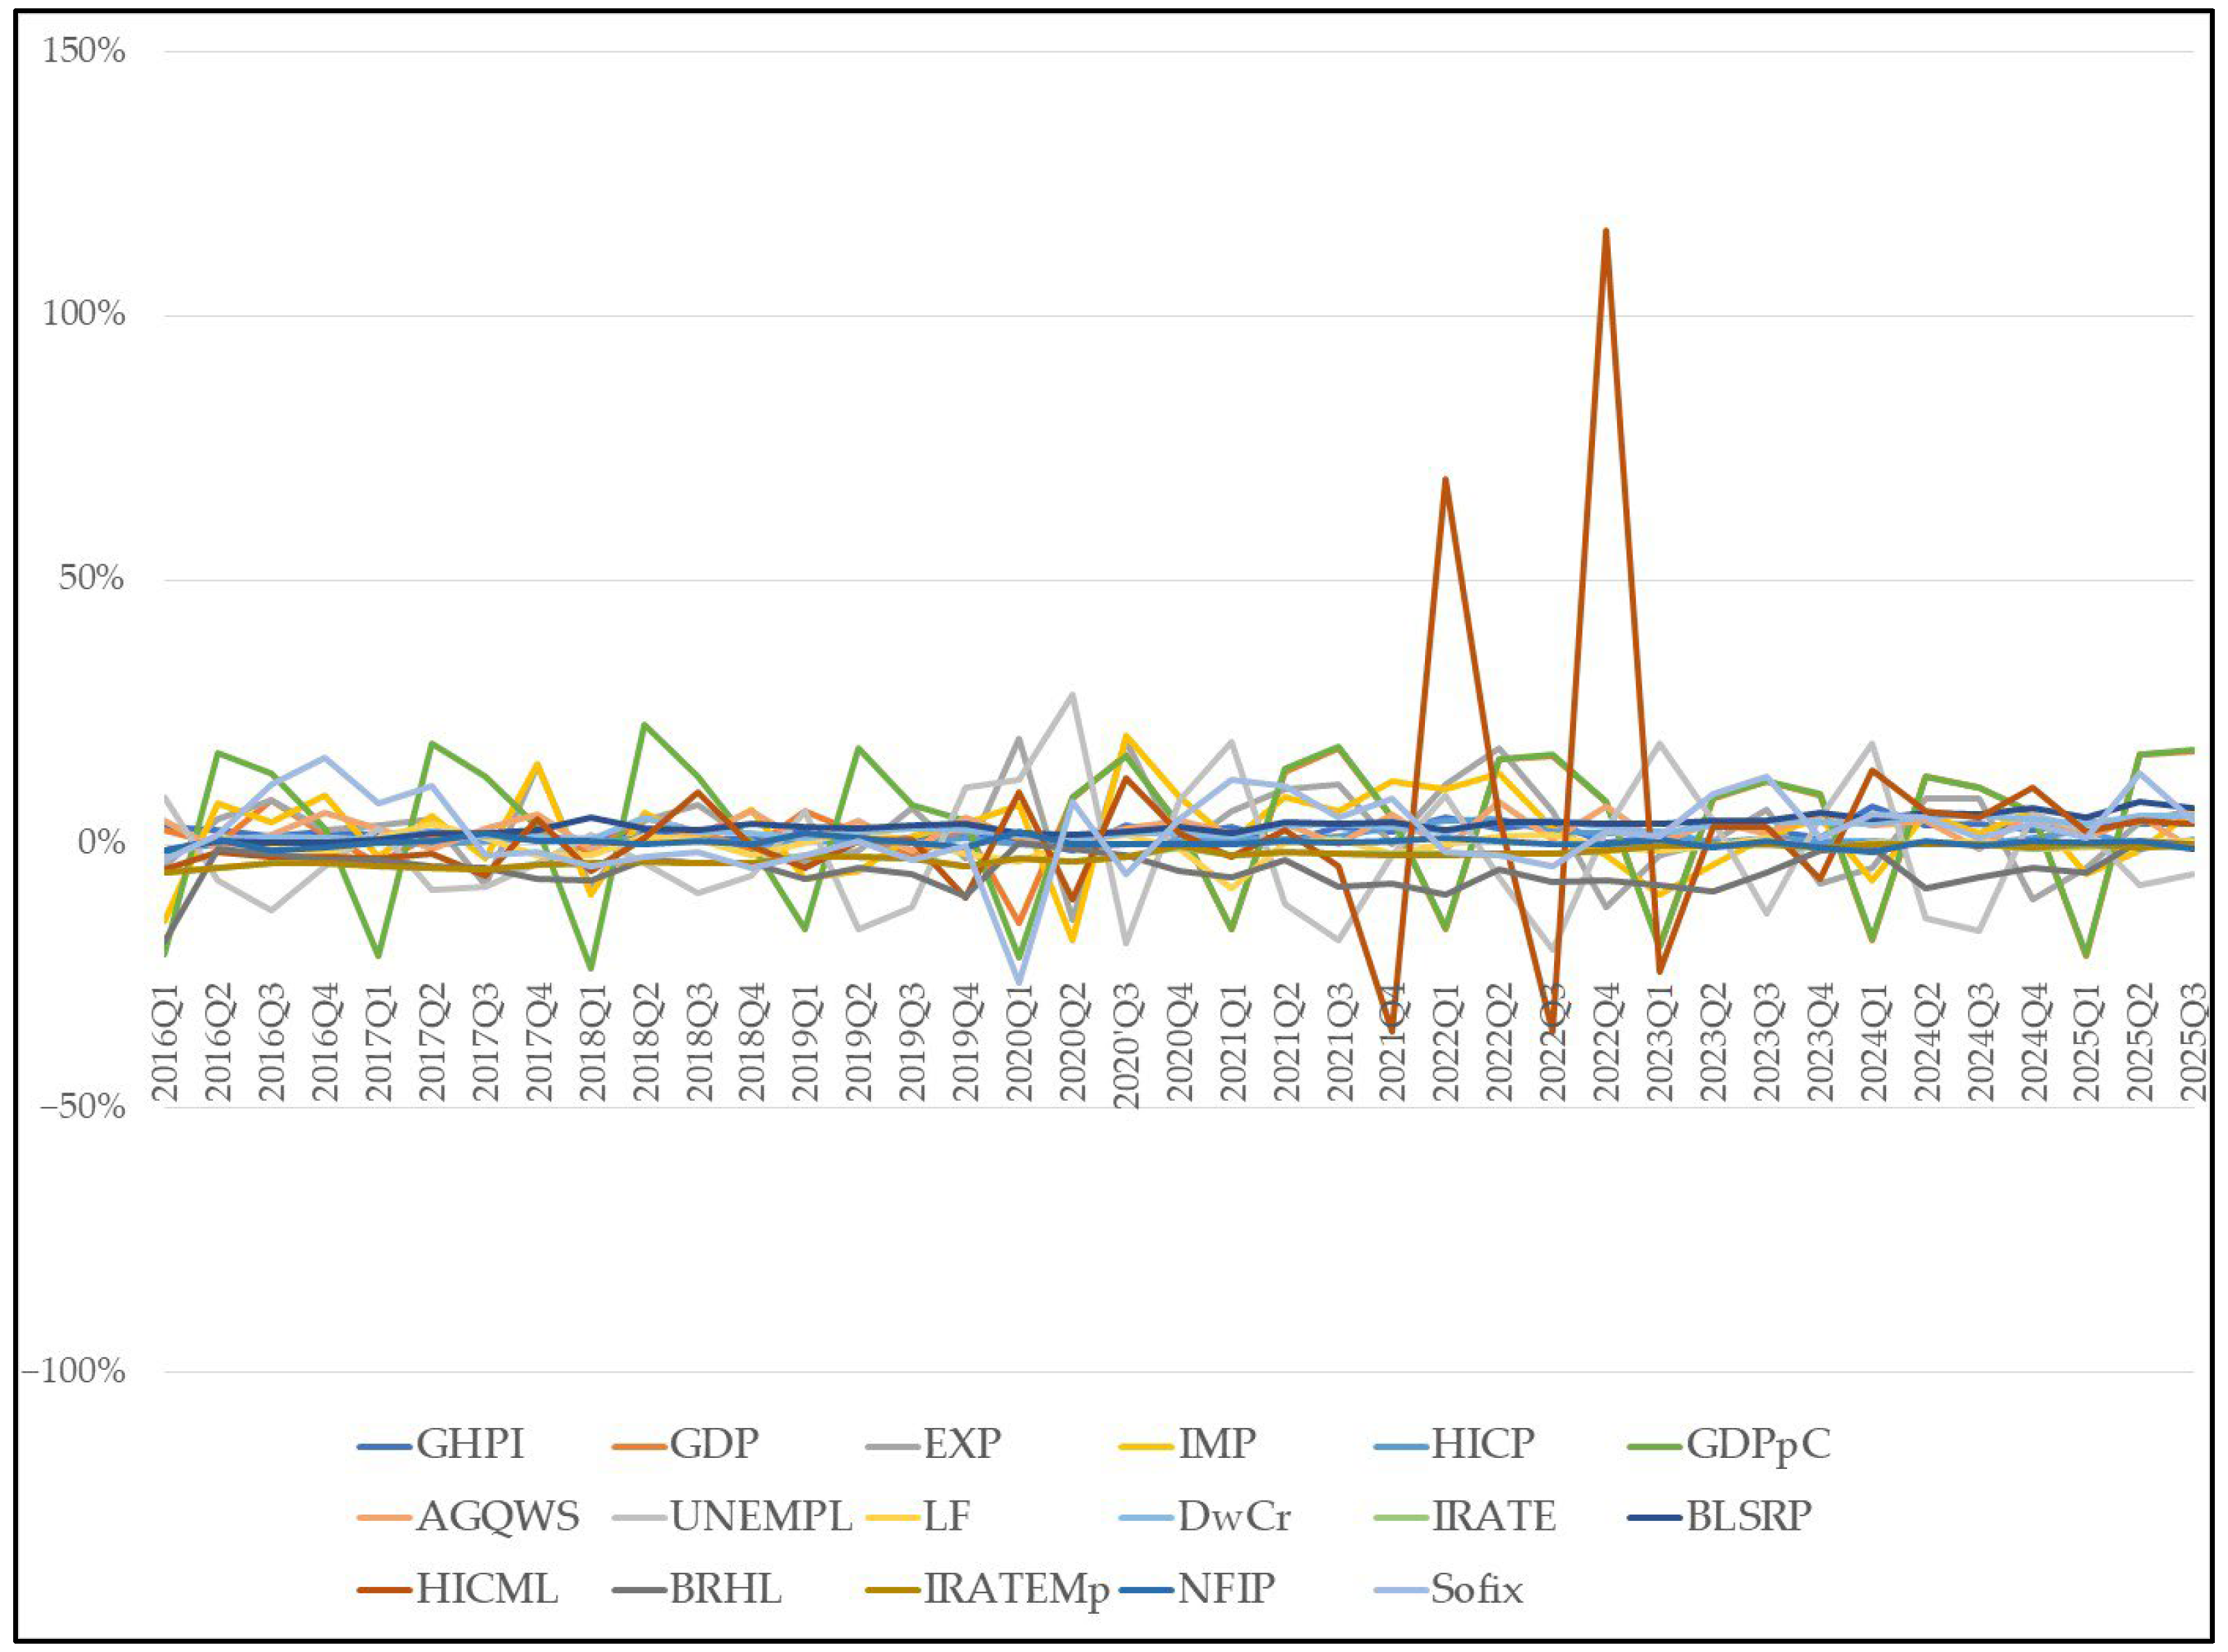
Econometric modelling of the dataset revealed the following distribution of coefficients of variation across all 48 predictors: 15 predictors with a variation of up to 20% relative to the period average, 16 predictors with variation between 20% and 30%, 12 predictors with variation between 30% and 40%, and the remaining 8 predictors with variation above 40%. The highest coefficient of variation was recorded for the construction of new homes with six or more rooms, reaching 59.13%. The results for selected descriptive statistics indicators and the quarterly dynamics of the factors relative to the GHPI are presented in Appendix A.2. Graphical evidence on the dynamics of the first-differenced data for traditional macroeconomic, financial, demographic and sectoral factors is presented in Appendix A.3.
3.3. Empirical Methodology and Model Specification
3.3.1. Methodology
In the literature, house price modelling represents a methodologically challenging domain, with evidence supporting a wide variety of analytical methods. These methods can be broadly classified into traditional and advanced categories. Traditional methods encompass regression models (Yan, 2024), comparison-based approaches, production cost models, income capitalisation models, and housing investment return models. Advanced methods include artificial neural networks (Mimis et al., 2013), spatial analysis techniques, hedonic pricing models, fuzzy logic methods, and ARIMA-based models (Pagourtzi et al., 2003). The latter group addresses a number of methodological challenges by enabling the joint modelling of historical price dynamics, autocorrelation structure and trend components, yielding models with statistically robust predictive power.
Although many studies employ Vector Error Correction Models and VAR models, in our case the ARIMAX model was methodologically preferred because of the small number of quarterly observations, the focus on a single country, and the research objective of analysing the short-term dynamics of price acceleration. Given the sample of 40 observations, determined by the quarterly frequency of data generated by statistical institutions, the use of a VAR model carries the risk of exhausting the degrees of freedom in constructing the lag structure (Wu, 2025). Similarly, in the case of the VECM, the lack of sufficient observations constitutes an obstacle to the reliable estimation of cointegration vectors (Johansen, 1995). In addition, the VECM models variables in levels and incorporates an error correction mechanism to capture long-run equilibrium relationships, which corresponds to a different research objective than the one pursued in this study. By contrast, through ARIMAX, we focus on price acceleration by transforming the data through second differencing, which directly addresses non-stationarity. Panel models are not applicable in a single-country framework, as they require a comparative cross-country basis.
Drawing on this methodological background, the study employs an ARIMAX model (Kotu & Deshpande, 2019) to examine the dynamics of the General house price index (GHPI) in Bulgaria, using a stepwise variable selection procedure to identify the key determinants and quantify their relative contributions to house price changes. Following that, the methodology consists of five stages, outlined below.
First, the data are tested for stationarity using the Augmented Dickey–Fuller test (Dickey & Fuller, 1981). This test is based on two hypotheses. The null hypothesis (H0) states that the time series has a unit root, i.e., the series is non-stationary, while the alternative hypothesis (H1) states that there is no unit root and the series is stationary. To confirm stationarity, the p-value obtained from the ADF test must be below 0.05. To enhance the reliability of the conclusions, the results of the ADF test are further validated using the KPSS test (Kwiatkowski et al., 1992). Unlike the ADF test, the KPSS test evaluates the null hypothesis of stationarity against the alternative hypothesis of a unit root. In this case, to confirm stationarity, the test statistic must be below the critical value at the 5% significance level. The joint application of the two tests, which have opposing null hypotheses provides a more reliable identification of the order of integration, particularly given the limited sample size (n = 40) (Kwiatkowski et al., 1992). The variables are differenced sequentially until the series becomes stationary (Distaso, 2008).
Second, to ensure the correct specification of the model, the dependent variable is tested for seasonality by applying the Kruskal–Wallis test (Kruskal & Wallis, 1952) to compare distributions across quarterly groups. The rationale for employing this test lies in its non-parametric nature—unlike parametric alternatives such as one-way ANOVA, it does not assume a normal distribution of observations, making it particularly appropriate for the small sample size (n = 40) used in this study. The null hypothesis (H0) states that there are no statistically significant differences between the quarterly groups, indicating the absence of seasonality. The alternative hypothesis (H1) states that at least one quarterly group differs statistically significantly from the others, indicating the presence of seasonality. The null hypothesis is rejected if the p-value < 0.05, in which case seasonal adjustment or the inclusion of seasonal dummy variables in the model specification is considered.
Third, the final model specification was determined through stepwise elimination of variables based on their statistical significance and the diagnostic tests conducted at each stage of the selection procedure.
Fourth, the model fit is assessed, the parameters are estimated, and the model is subjected to financial and economic analysis.
Fifth, diagnostic tests are conducted for autocorrelation in the residuals, normal distribution of residuals, the ARCH effect and robustness.
The primary data processing is performed using IBM SPSS Statistics 27. The ADF test is conducted using the adf.test() function from the tseries package in R 4.4.3, and the KPSS test is performed using the kpss.test() function from the same tseries package in R.
3.3.2. Stationarity and Seasonality Tests
The Augmented Dickey–Fuller test applied to the original dependent variable does not confirm stationarity (Sen, 2008), since the p-value > 0.05 (p = 0.99), and, therefore, the null hypothesis cannot be rejected. As the first difference also proved non-stationarity (p-value = 0.598), second differencing is applied to of the dependent and independent variables. Non-stationarity is also confirmed by the results from the KPSS test (See Appendix A.4). Both tests indicate that the majority of the independent variables become stationary after second differencing. Only 4 of the independent variables are stationary after first differencing (G, NBDC2Rs, HICML, and NFIP), while eight out of 48 variables remain non-stationary after second differencing (HICP, MRM, MRD, MMRD, SMRD, OSRD, FHERHM, and BLSRP) and are therefore excluded from further analysis.
Once stationarity has been achieved, the data are tested for seasonality, using the non-parametric Kruskal–Wallis test. The results (H = 0.353; p = 0.950) do not indicate statistically significant differences between quarters. As the p-value substantially exceeds the 0.05 significance threshold, the null hypothesis is not rejected, suggesting the absence of seasonality in the dependent variable. Therefore, it is not necessary to include a seasonal specification in the ARIMAX model (See Table 1).
Table 1.
Test statistics.
3.3.3. Model Specification
The final model specification is obtained by sequentially excluding the variables initially included in the model and comparing two variants: with and without a constant. The results show that including a constant in the model worsens its characteristics, while the constant coefficient is not statistically significant at a 5% significance level (β = 0.031, p-value = 0.653). Removing the constant improves the model (RMSE, MAPE, BIC and Ljung–Box Q). Finally, an ARIMAX(0,2,1) model is obtained without a constant and with three exogenous variables (OOHE, ARH, and WSMSRD; see Appendix B.1). Formally, the model can be represented as follows (see Formula (1)):
where
- denotes the second difference of the dependent variable at time t;
- is the second difference of the ith independent variable at time t;
- is the regression coefficient for the corresponding independent variable;
- is the first-order MA coefficient;
- is the stochastic error at time t;
- is the stochastic error from the previous period.
The model specification (see Formula (2)) is as follows:
where
- denotes the second difference;
- GHPI is the General house price index;
- OOHE is the Owner-occupiers’ housing expenditures;
- ARH is the Actual rentals for housing;
- WSMSRD is the Water supply and miscellaneous services relating to the dwelling;
- is the coefficient of the MA(1) component;
- , , are the coefficients of exogenous variables;
- is the stochastic error;
- is the stochastic error from the previous period.
4. Results
4.1. Model Fit
The model is estimated using second-differenced data, where the ARIMAX(0,2,1) specification includes the following variables: GHPI_D2 as the dependent variable, and OOHE_D2, ARH_D2, and WSMSRD_D2 as independent predictors. Stationary R-squared, RMSE, MAE, and the Ljung–Box Q test are used to assess model fit. The plot of the distribution of the second-differenced values of GHPI over time illustrates that the values vary within a relatively narrow range (approximately from −6.53 to +11.34), with a significant proportion of the observations concentrated around zero (See Figure 3).
Figure 3.
Scatter Plot of GHPI_D2.
At such values, even minimal absolute errors lead to extremely high percentage deviations, which makes MAPE a mathematically inappropriate metric for model evaluation (Hyndman & Koehler, 2006). The stationary R-squared is 0.873, indicating that the model explains 87.3% of the variation in the second differences of the GHPI. In interpretive terms, this means that 87.3% of the variation in the acceleration/deceleration of house price growth is explained by changes in the differenced values of the independent variables (OOHE, ARH and WSMSRD). The remaining 12.7% is attributable to other factors not included in the model.
The mean absolute error (MAE) is 0.902 units, and the root mean square error (RMSE) is 1.252. The ratio MAE/SD = 0.268 indicates that the mean absolute error represents 26.8% of the standard deviation of the stationary series, which may be interpreted as very good relative forecast accuracy. The ratio RMSE/MAE = 1.39 indicates that the errors are relatively evenly distributed, without extreme deviations. The Ljung–Box Q test (See Table 2) confirms the absence of autocorrelation in the residuals (Q(18) = 11.785, p = 0.813).
Table 2.
Model Statistics.
4.2. Parameter Estimation
The results reported in the ARIMAX model parameter table show that the coefficients of the exogenous variables and the MA component are positive and statistically significant at the 1% significance level (See Table 3).
Table 3.
ARIMAX(0,2,1) Model Parameters.
The coefficient β1 = 0.624 (p < 0.001) indicates that a one-unit increase in the acceleration of Owner-occupiers’ housing expenditures is associated with an increase of approximately 0.624 units in the acceleration of GHPI, and conversely, that a one-unit deceleration is associated with a corresponding deceleration of approximately 0.624 units in GHPI, ceteris paribus. Similarly, β2 = 0.421 (p < 0.01) and β3 = 0.171 (p < 0.01) indicate positive and symmetric effects of ARH and WSMSRD respectively on GHPI acceleration, ceteris paribus. The relatively lower unstandardized coefficient of WSMSRD reflects the larger standard error of this variable in the second-differenced data.
The statistically significant first-order Moving Average component (θ1 = 0.693, p < 0.001) confirms the presence of inertia in house price formation, whereby an unexpected price shock in one quarter transmits approximately 69.3% of its effect into the following quarter. Since |θ1| < 1 the model is reversible and allows for reliable forecasts. To determine the individual contribution of each variable, standardized coefficients were calculated: β_std = 0.79 for OOHE, β_std = 0.26 for ARH, and β_std = 0.26 for WSMSRD. This means that, for an equal change of one standard deviation, OOHE has the strongest effect on house price changes, while the other two factors make similar contributions. Expressed as relative shares of the total standardised effect, OOHE accounts for approximately 60% of the combined influence of the three factors. The descriptive statistics for the dependent and independent variables confirm the robustness of the estimated parameters (See Appendix B.2).
4.3. Financial and Economic Evaluation of the ARIMAX(0,2,1) Results
The financial and economic interpretation of the three factors should reflect the specific characteristics of the Bulgarian housing market, where the net change in the sub-index of existing dwellings is 2.715, while the net change in the sub-index of newly built dwellings is only 2.322 over the ten-year period. This initial observation clearly shows the importance of the costs associated with existing dwellings, given their specific and complex role as pricing factors affecting the general index (GHPI).
The first factor in the ARIMAX(0,2,1) model, Owner-occupiers’ housing expenditures, is a synthetic index (2015Q4 = 100) that aggregates various homeowner expenses, including acquisition-related costs such as notary, agency and administrative fees, current expenses such as taxes, and costs related to major repairs and maintenance, together with all other unclassified property-related costs. The key to understanding the significance of this factor lies in the substantial difference in completion standards between newly built and existing homes in Bulgaria. While buyers of existing homes can move in immediately, newly built homes often require additional expenditure to reach an occupancy-ready standard, with such costs amounting to up to 50% of the purchase price. These costs include substantial finishing works and furnishing, which vary depending on the quality of the furniture and electrical equipment. The economic mechanism is demand-pull: OOHE covers the full life cycle of homeowner expenditure—from acquisition to ongoing maintenance. The acceleration in these costs directly reflects an increasing willingness to pay in the market and is immediately transmitted to the General house price index. In addition to the acquisition-related costs, including agent fees, notary fees, and local property taxes, this factor also captures all maintenance and ownership costs, which add a cost-push dimension: an increase in the cost of repairs and finishing works raises the full cost of residential use and is capitalised in the market value of residential properties. These costs encompass not only construction materials but also the labour costs associated with bringing residential properties to a habitable and occupancy-ready standard. The contribution of this factor can be expressed as follows: ContributionOOHE,GHPI = 0.624 × Δ2OOHEt.
The second factor in the model, Actual rentals for housing, has a lower β-coefficient. Average rent functions as an arbitrage mechanism between the rental and sale segments of the housing market. The relationship follows the logic of the capitalization model (See Formula (3)).
where
Pt = ARHt/(rt − gt),
- rt is the discount rate;
- gt—the expected growth in rents.
The acceleration of rents Δ2ARHt > 0 operates simultaneously through two channels: first, rational tenants switch to buying (substitution effect), thereby increasing demand; second, investors revise the profitability of housing assets upwards, which increases prices in the sales market. ARH serves simultaneously as an indicator of housing supply constraints and as a measure of the investment attractiveness of residential property. The contribution of this factor can be expressed as follows: ContributionARH,GHPI = 0.421 × Δ2ARH.
The third factor, Water supply and miscellaneous services relating to the dwelling is a synthetic index (based on 2015Q4 = 100), aggregating four components of mandatory infrastructure costs: water supply, refuse collection (Roleders et al., 2024), sewage collection, and other services relating to the dwelling n.e.c. The mechanism of influence is cost-push capitalization: utility tariffs are administratively regulated and increase more smoothly than market prices, which explains the lower coefficient of 0.171. However, their sustained increase is transmitted into residential property prices through two channels: directly, by raising the total cost of occupancy; and indirectly, by generating differentiated price pressures, as households shift demand toward newer, more energy- and infrastructure-efficient dwellings with lower utility costs, thereby driving up their relative prices. In assessing the influence of this factor, consideration is given to the compositional specifics of the underlying sub-indices, notably that waste collection and disposal charges in Bulgaria do not yet reflect the polluter-pays principle, but are instead levied on the basis of the assessed tax value of the property. Since waste collection charges are typically calculated on a base that exceeds the annual property tax by a factor of two or more, a systematic disparity emerges between the charges levied on existing—and often partially depreciated—properties and those levied on newly acquired dwellings. The latter, owing to the mandatory disclosure of mortgage loan values to local tax authorities, are assessed at the full transaction price, resulting in a higher tax and service-charge burden on new dwellings relative to existing housing stock. Administrative regulation delays the price signal, but does not eliminate it. The contribution of this factor can be expressed as follows: ContributionWSMSRD,GHPI = 0.171 × Δ2WSMSRDt.
The structural logic of the three-factor model can be interpreted from three analytically distinct perspectives, which together provide a comprehensive account of house price formation in Bulgaria in the context of Eurozone accession (See Formula (4)).
The OOHE predictor captures the total financial effort of homeowner households—from acquisition to maintenance—and is the dominant factor, with the highest coefficient. ARH provides the equilibrium arbitrage signal between the two main segments of the housing market. WSMSRD captures the mandatory infrastructure component of expenditure, which is capitalized into prices with a longer lag due to its regulatory nature. The MA(1) term = 0.693 captures the inertia of price shocks—unexpected impulses from the previous quarter continue to influence current price acceleration, which is characteristic of housing markets with inherent information lags, transaction costs, and limited liquidity.
Among the three predictors, the OOHE factor captures the tendency of Bulgarian homeowners to invest actively in improving the characteristics of their existing properties. This interpretation is further supported by the observed price differential between new and existing homes, which has shifted in favour of the latter. The inclusion of Actual rentals for housing (ARH) in the model is consistent with the presence of rational economic agents among housing investors, who weigh—at the household budget level—monthly mortgage repayments associated with future homeownership against monthly rental payments for equivalent accommodation. The third factor, WSMSRD, reflects the significance of household utility and maintenance costs, which are incurred by both owners and tenants and depend on both property size and energy efficiency. While the acceleration of house price growth is most strongly transmitted through the OOHE factor for homeowners and through the ARH factor for renters, the third factor WSMSRD exerts a broadly similar effect on both groups of housing market participants in the Bulgarian context.
4.4. Diagnostic Tests
To assess model adequacy, diagnostic tests were conducted for autocorrelation of residuals, normality of distribution, and ARCH effects.
4.4.1. Autocorrelation of Residuals
The Ljung–Box Q test (Q(18) = 11.785, p = 0.813) shows no statistically significant autocorrelation, confirming the independence of the residuals, while the graphical analysis using ACF and PACF of the residuals (See Figure 4) further support the result. Both graphs show that all autocorrelation coefficients for lags 1 to 24 fall within the 95% confidence interval. The absence of significant peaks outside the confidence bounds confirms that the residuals represent white noise, which supports the validity of the statistical conclusions and the reliability of the predictions.
Figure 4.
Residual ACF and PACF distribution.
4.4.2. Test for Normal Distribution of Residuals
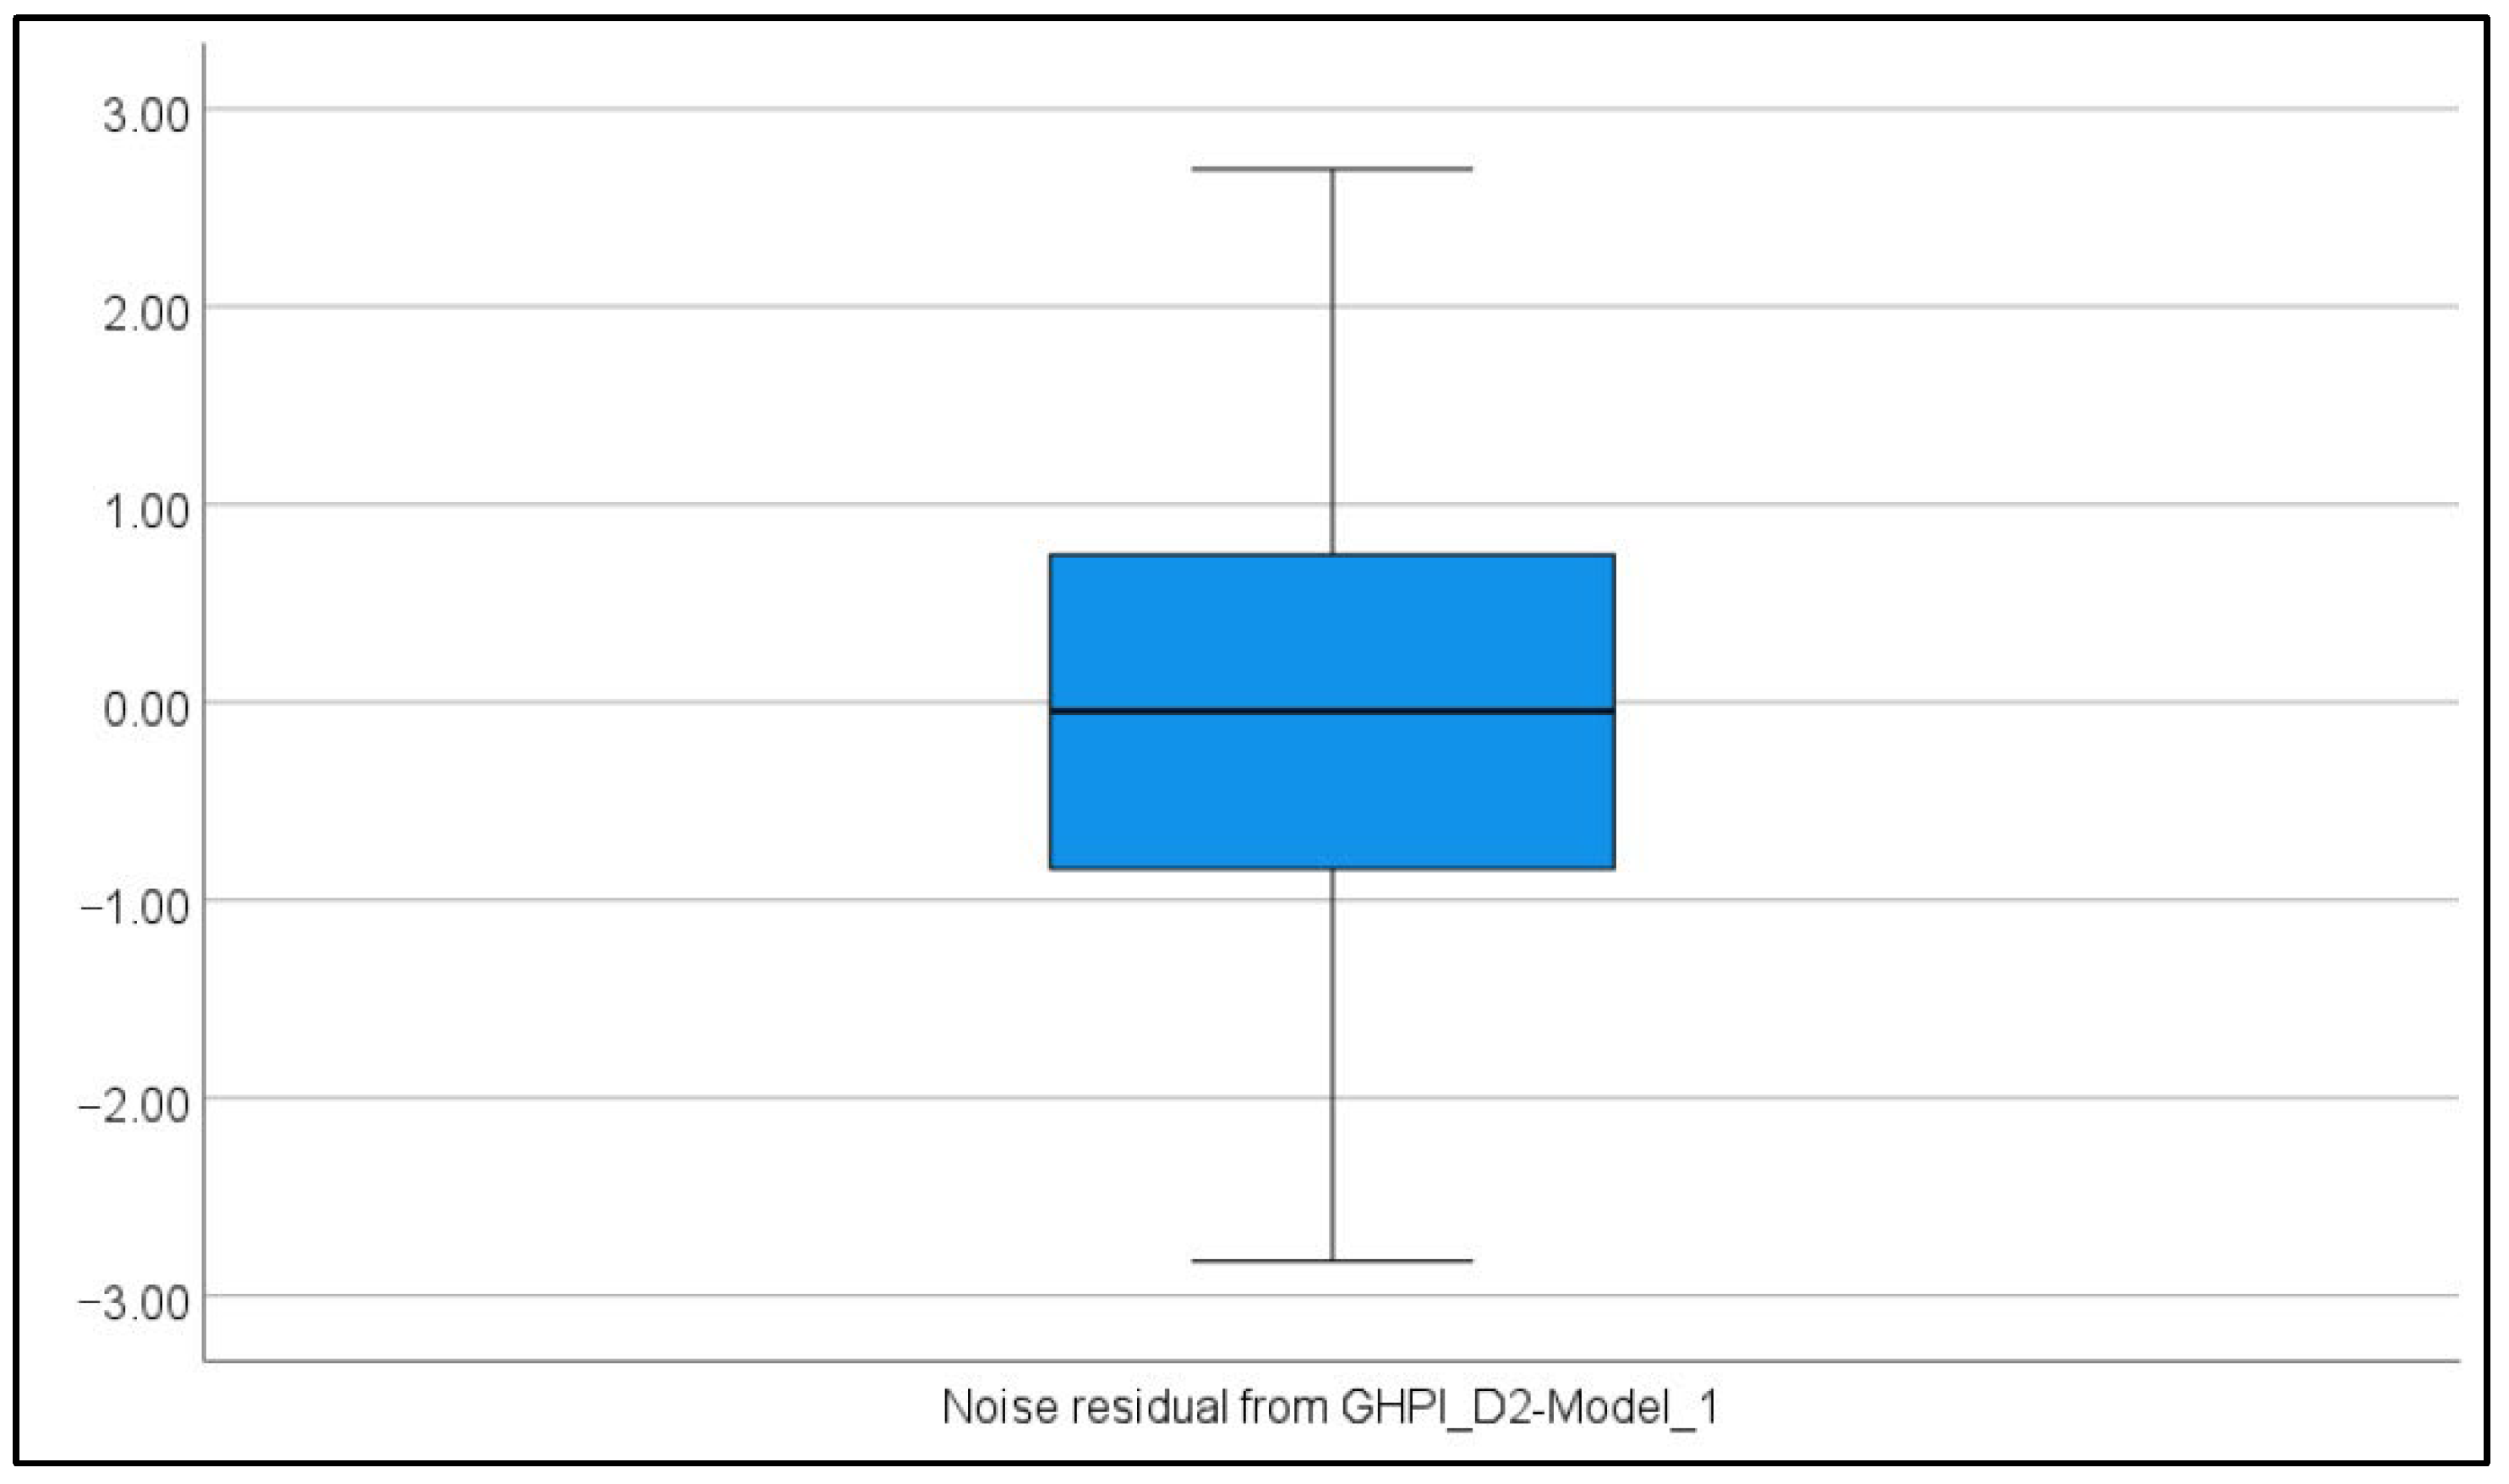
To assess the normality of the residuals, Shapiro–Wilk and Kolmogorov–Smirnov tests were performed (See Table 4). Both tests showed no statistically significant deviation from the normal distribution. The Shapiro–Wilk test, which is more suitable for samples with n < 50, yielded W = 0.983 (p = 0.805), which is well above the critical value of 0.05. A high W value (close to 1) indicates a close correspondence to the normal distribution. The Kolmogorov–Smirnov test also confirms these results (K-S = 0.090, p ≥ 0.200). The graphical distribution of the residuals further supports the validity of the above conclusions (See Appendix B.3), including the bell-shaped distribution of the residuals.
Table 4.
Shapiro–Wilk and Kolmogorov–Smirnov test results.
4.4.3. ARCH Effect Test
To test for conditional heteroscedasticity (ARCH effects), an ARCH LM test with 12 lags (See Table 5) was conducted, using a linear regression of the squared residuals on their lagged values.
Table 5.
ARCH effect test results.
The regression of the squares of the residuals on their lagged values revealed no statistically significant ARCH effects (F(12, 13) = 0.514, p = 0.871), further confirming that the variance of the residuals is stable over time.
4.5. Robustness Check
To assess the robustness of the estimates, alternative model specifications were used, as presented in Table 6 and Table 7. The data in Table 6 show that all five specifications exhibit very similar characteristics. The stationary R-squared varies only slightly (0.873–0.877), and the RMSE is virtually identical across models (in the range 1.248–1.269), with a difference of only 0.021 between the best and worst-performing models. The Ljung–Box test confirms adequate specification for all models (all p-values > 0.25), with the selected ARIMAX(0,2,1) model showing the highest p-value (0.813). By comparison, the ARIMAX(1,2,0) model shows a substantially lower Ljung–Box p-value (0.271), although it has the lowest BIC (0.826). The difference in BIC values between the two models is minimal (ΔBIC = 0.007) and well below the conventional threshold of 2 (Kass & Raftery, 1995). This suggests that the two models receive essentially equivalent support according to the information criterion. The ARIMAX(1,2,2) model has the highest BIC (1.051) and also includes a number of statistically insignificant parameters (see Table 6).
Table 6.
Comparative characteristics of alternative ARIMAX specifications.
Table 7.
Estimated coefficients of exogenous variables in alternative ARIMAX specifications.
Table 7 presents the estimated coefficients for all specifications. The main result is that the exogenous variables exhibit a very high degree of stability. The coefficient of OOHE remains within a narrow range from 0.620 to 0.636 and is consistently highly statistically significant (p < 0.001) across all tested specifications. The coefficient of ARH ranges from 0.357 to 0.421 and retains its statistical significance (p < 0.05) across all specifications. The coefficient of WSMSRD also shows stability, ranging from 0.169 to 0.186, and remains significant at the p < 0.01 level in all models.
In contrast to the stability of the exogenous variables, the ARIMA components show varying levels of statistical significance. The results indicate that the ARIMAX models (1,2,1), (0,2,2) and (1,2,2) include statistically insignificant parameters, which confirms that ARIMAX(0,2,1) is the simplest specification in which all parameters are statistically significant. Therefore, even when the autoregressive and moving average components vary across specifications, the coefficients of the exogenous variables remain stable both in terms of statistical significance, sign, and magnitude. This confirms the robustness of the main conclusions of the study.
When the robustness check was performed by adding GDP (also at the second difference), the main exogenous factors retained their statistical significance and direction of effect. The lack of statistical significance for GDP confirms that the model successfully isolates sector-specific dependencies from general macroeconomic fluctuations in growth acceleration.
5. Discussion
The ARIMAX model identified the main factors accounting for house price growth in Bulgaria in the decade preceding and immediately following the announcement of Eurozone accession. Following the application of the outlined methodology, the initial set of 48 potential predictors yielded a final ARIMAX(0,2,1) model with the highest explanatory power, comprising three variables significant at p < 0.01.
This substantial reduction from 48 to 3 variables suggests that house price dynamics in Bulgaria are driven by a focused set of factors, rather than by a multidimensional set of influences.
The empirical results of this study provide full support for the main research hypothesis and all three specific research hypotheses. Variation in General house price index growth in Bulgaria is indeed explained by a limited number of predictors, confirming that, despite institutional changes and external shocks, the underlying drivers of house price dynamics remain structurally stable and limited in number. Household expenditure and housing maintenance and service costs emerge as the dominant demand-side transmission mechanism, while the rental market reinforces price appreciation through the substitution channel. Critically, the persistence of price formation inertia—combined with the credibility of the currency board arrangement and the ex ante appreciation premium embedded in anticipation of Eurozone accession—confirms that house prices in Bulgaria are shaped not only by current economic conditions but also by deeply anchored institutional expectations. Taken together, these findings underscore the explanatory power of a parsimonious, theory-driven model in capturing the determinants of house prices in Bulgaria.
This finding has important implications for both theory and policy.
First, the simplified three-factor model challenges the notion that housing markets in transition countries require complex multidimensional frameworks for adequate explanation. Instead, our results show that even during a period of profound institutional change—including the maintenance of a currency board, the consolidation of EU membership, and eventual Eurozone accession—house price growth responds systematically to a limited number of key variables.
Second, the statistical significance of the final ARIMAX model over the entire sample period 2015–2025 is particularly striking. The dataset covers three distinct phases: pre-convergence (2015–2019), pandemic disruptions (2020–2021) and the period of preparation for Eurozone accession (2022–2025). The fact that the same three factors remain statistically significant across these regime changes suggests structural stability in the determinants of house prices in Bulgaria. This stability may reflect the effect of the currency board mechanism, which pegged the Bulgarian lev to the Deutsche Mark in 1997 and then automatically to the euro. In this way, Bulgaria adapted ex ante to the business cycle of the Eurozone countries through the effect of nominal convergence, particularly in the monetary sphere, well before formal membership, in a manner that reflects clear national specificity and differs from the experience of Croatia (Visković & Čipčić, 2025), which joined the Eurozone on 1 January 2023.
Third, the euro adoption in January 2026 provides a natural quasi-experiment to assess whether the identified factors retain their explanatory power under a new currency regime (Marinov, 2017). The last quarters of our sample (Q4 2024–Q3 2025) capture the period immediately before accession, during which expectations of euro adoption strongly influenced both housing demand and credit conditions. Preliminary data from 2025 do not suggest a structural break in the relationship between the three key factors and house price growth, suggesting that the currency change itself may have had a limited independent impact—possibly because markets have already priced in convergence under the currency board arrangement. However, several caveats are worth noting. First, although the stepwise selection procedure is effective in identifying significant predictors, it requires economic justification for the causal relationships identified, beyond the purely mathematical logic of the results. The observed associations between the three predictors and house prices do not exclude the influence of other factors for which no complete data are available for the entire period under study or for which access is partial, highly restricted, or is impossible to obtain them publicly. Second, the quarterly frequency of observations—although standard in macroeconomic housing research—may conceal higher-frequency dynamics, especially during periods of rapid institutional change (Mihaylova-Borisova & Nenkova, 2020). Third, the performance of the model during the Eurozone accession period should be monitored carefully, since structural changes in the available bank lending resources, cross-border capital flows or mortgage market integration may alter the weights of the existing factors or introduce new predictors. This issue is particularly relevant in view of the release by the Bulgarian National Bank of substantial credit resources to commercial banks through the mechanism of the minimum reserve requirement ratio. Specific to the ECB and the BNB is the gap of over 10% in favour of Bulgaria, which releases a significant new credit resource to support housing demand in Bulgaria, ceteris paribus.
Looking ahead, the three-factor ARIMAX model offers a practical tool for policymakers and central bankers monitoring housing market stability in Bulgaria’s post-accession phase. If the three-factor structure is maintained, it will provide a focused set of indicators for monitoring and designing macroprudential policy. Furthermore, Bulgaria’s experience as the 21st and newest member of the Eurozone offers valuable insights for subsequent candidate countries, including those with low exchange rate volatility between their national currencies and the euro. This once again highlights the importance of establishing the consequences and effects of currency integration for the housing market (Visković & Čipčić, 2025), a perspective directly relevant to Bulgaria’s post-accession trajectory.
Although the ARIMAX(0,2,1) model effectively captures the short-term dynamics of the Bulgarian housing market and provides reliable one-step-ahead forecasts, its inherent limitation lies in the inability to generate long-term forecasts beyond the assessment horizon. The interpretation of the model results requires careful consideration of the specific properties of the ARIMAX framework, the unique macroeconomic context of Bulgaria as a country operating under a currency board regime for nearly three decades, and the possibility that the significant price appreciation observed in the pre-accession period may be followed by a consolidation phase.
Future research should extend the analysis beyond 2025 to assess the stability of the model in the context of full euro adoption in Bulgaria, including the cessation of price announcements in the former national currency as a regulatory requirement by 8 August 2026. It should also disaggregate national trends across regional markets, and examine potential nonlinear or threshold effects that the ARIMAX model may not capture. Future research could further explore sustainable solutions for housing stock management and civil construction activity (Gabriela et al., 2023) in the context of post-war reconstruction in Ukraine (Sukhomud & Shnaider, 2023). In this regard, international experience in the physical restoration of housing and the recovery of its market value following structural disruptions or catastrophic risk (Ishiwatari et al., 2021) offers valuable insights for informed policy decisions in the pre-reconstruction phase of the ongoing conflict (Ishiwatari et al., 2025).
6. Conclusions
This study provides new evidence on the factors that determine house price dynamics in Bulgaria in the specific context of the transition from a prolonged currency board regime to Eurozone membership. By applying an ARIMAX(0,2,1) model to 40 quarterly observations for the period 2015Q4–2025Q3, the study identifies the key determinants of house price acceleration. The results show that the house price dynamics in Bulgaria is explained by three specific factors: the owner-occupiers’ housing expenditures, the actual rentals for housing in Bulgaria and the homeowners’ utility expenses. The three predictors are statistically significant at the 1% level, indicating strong and persistent effects. The model explains the variation in house price acceleration with a low mean squared error and high explanatory power. Particularly important is the conclusion that traditional macroeconomic, demographic, financial and sectoral factors do not show a statistically significant relationship with house price dynamics over the ten-year period under study. This result calls for a reconsideration of conventional theoretical approaches to house price formation in the context of transition economies. While the classical literature emphasises the role of interest rates, economic growth, income levels and demographic change, the present study demonstrates that under the specific institutional conditions of Bulgaria, these factors give way to country-specific determinants. The established relationship between house prices and the costs of homeownership, rental payments and utility services reveals an important pricing mechanism, whereby current operating costs exert a stronger influence on house price dynamics than traditional macroeconomic variables. This can be explained by the specifics of the Bulgarian real estate market, where the long-standing currency board has ensured a stable convergent environment, and the process of approval of Bulgaria’s membership in the Eurozone has been reflected in the expectations of price convergence with European levels ahead of schedule. The diagnostic analysis confirms model adequacy, indicating the absence of autocorrelation in the residuals and the successful capture of systematic information in the data. The non-parametric correlation analysis further validates the statistically significant monotonic relationships between the regressors and the dependent variable, strengthening confidence in the obtained results. From a methodological point of view, the use of second differencing in the ARIMAX model proves to be an adequate approach to modelling house price acceleration, successfully overcoming the problems of non-stationarity in historical data, influenced by three specific sub-periods: pre-convergence (2015–2019), pandemic disruptions (2020–2021) and the period of preparation for Eurozone accession (2022–2025). The results of the study have important practical applications for the development of policies in the housing sector. The focus on specific national factors shows that measures to regulate the real estate market should account for local specificities, rather than follow general macroeconomic recipes. Regulators should consider policies governing property-related and utility costs, as these directly influence house price dynamics and household affordability. In conclusion, this study contributes to a deeper understanding of house price formation mechanisms in the specific context of a small open economy undergoing currency convergence. It demonstrates the importance of developing empirically grounded models that account for national institutional specificities, rather than uncritically transposing theoretical frameworks developed for advanced economies with fundamentally different institutional characteristics.
Author Contributions
Conceptualization, A.Z., G.Z. and L.S.; methodology, A.Z., G.Z., L.S. and M.O.; software, G.Z.; validation, A.Z., G.Z., L.S. and M.O.; formal analysis, A.Z. and G.Z.; investigation, A.Z., G.Z., L.S. and M.O.; resources, A.Z., G.Z., L.S. and M.O.; data curation, A.Z. and G.Z.; writing—original draft preparation, A.Z. and G.Z.; writing—review and editing, A.Z., G.Z. and L.S.; visualization, A.Z., G.Z. and M.O.; supervision, A.Z., G.Z. and L.S.; project administration, A.Z. and G.Z.; funding acquisition, A.Z. All authors have read and agreed to the published version of the manuscript.
Funding
This research received no external funding.
Institutional Review Board Statement
Not applicable.
Informed Consent Statement
Not applicable.
Data Availability Statement
The data presented in this study are available in Eurostat, NSI, BNB and BSE. These data were derived from the following resources available in the public domains: https://bit.ly/3PFXykR; https://bit.ly/4s7U1cv; https://bit.ly/4m5x748; https://bit.ly/412ATSe (accessed on 31 January 2026).
Conflicts of Interest
The authors declare no conflicts of interest.
Abbreviations
The following abbreviations are used in this manuscript:
| ADF | Augmented Dickey–Fuller test |
| ARCH | Autoregressive Conditional Heteroskedasticity |
| ARCH LM | Autoregressive Conditional Heteroskedasticity Lagrange Multiplier (test) |
| ARH | Actual rentals for housing |
| ARIMA | AutoRegressive Integrated Moving Average |
| ARIMAX | Autoregressive Integrated Moving Average with Exogenous Variables |
| BG | Bulgaria |
| BNB | Bulgarian National Bank |
| BSE | Bulgarian Stock Exchange |
| ESA | European System of Accounts |
| EU27 | European Union (27 member states) |
| Eurostat | Statistical office of the European Union |
| GDP | Gross Domestic Product |
| HICP | Harmonised Index of Consumer Prices |
| GHPI | General house price index |
| HPIED | House price index for existing dwellings |
| HPIND | House price index for new dwellings |
| NSI | National Statistical Institute of Bulgaria |
| OOHE | Owner-occupiers’ housing expenditures |
| VAR | Vector Autoregression |
| VECM | Vector Error Correction Model |
| WSMSRD | Water supply and miscellaneous services relating to the dwelling |
Appendix A
Appendix A.1. Independent and Dependent Variables
The initial stage of the study is the selection and grouping of influencing factors for the development of a model analysing the dynamics of the GHPI of Bulgaria (comprising the analytical indices HPIND and HPIED) over the period 2015Q4–2025Q3. Based on 4 main sources—BNB, NSI, Eurostat and BSE—an econometric assessment was carried out, 48 factors were selected, including aggregated and disaggregated, distributed into seven main groups (See Table A1).
Table A1.
Selection and grouping of independent and dependent variables.
Appendix A.2. Descriptive Statistics
Selected indicators with results from descriptive statistics for the historical data of the 48 descriptors and the three independent variables HPI, HPIND, HPIED in Bulgaria for the period 2015Q4–2025Q3 are presented in the following table (See Table A2).
Table A2.
Descriptive statistics of historical data of dependent variables and independent variables from groups A–G.
Appendix A.3. Historical Dynamics of First-Order Differential Data
After establishing non-stationarity of the historical data, a first-differential data estimate is made for both the dependent and independent variables. Figure A1 presents the relative changes in the values of the indicators for the period 2015Q4–2025Q3 calculated on a chain-wise basis with a number of observations N = 39: (t2 − t1)/t1 (See Figure A1).
Figure A1.
Dynamics of the first differential of the variables of groups A, F, G & E.
Appendix A.4. Stationarity Test Results
DF statistics, p value and stationarity status for the original data, first difference data, and second difference data of the 48 descriptors and the three independent variables HPI, HPIND, HPIED in Bulgaria for the period 2015Q4–2025Q3 are presented in Table A3.
Table A3.
Stationarity test results for the original data, first difference data, and second difference data for all dependent and independent variables (ADF & KPSS).
Appendix B
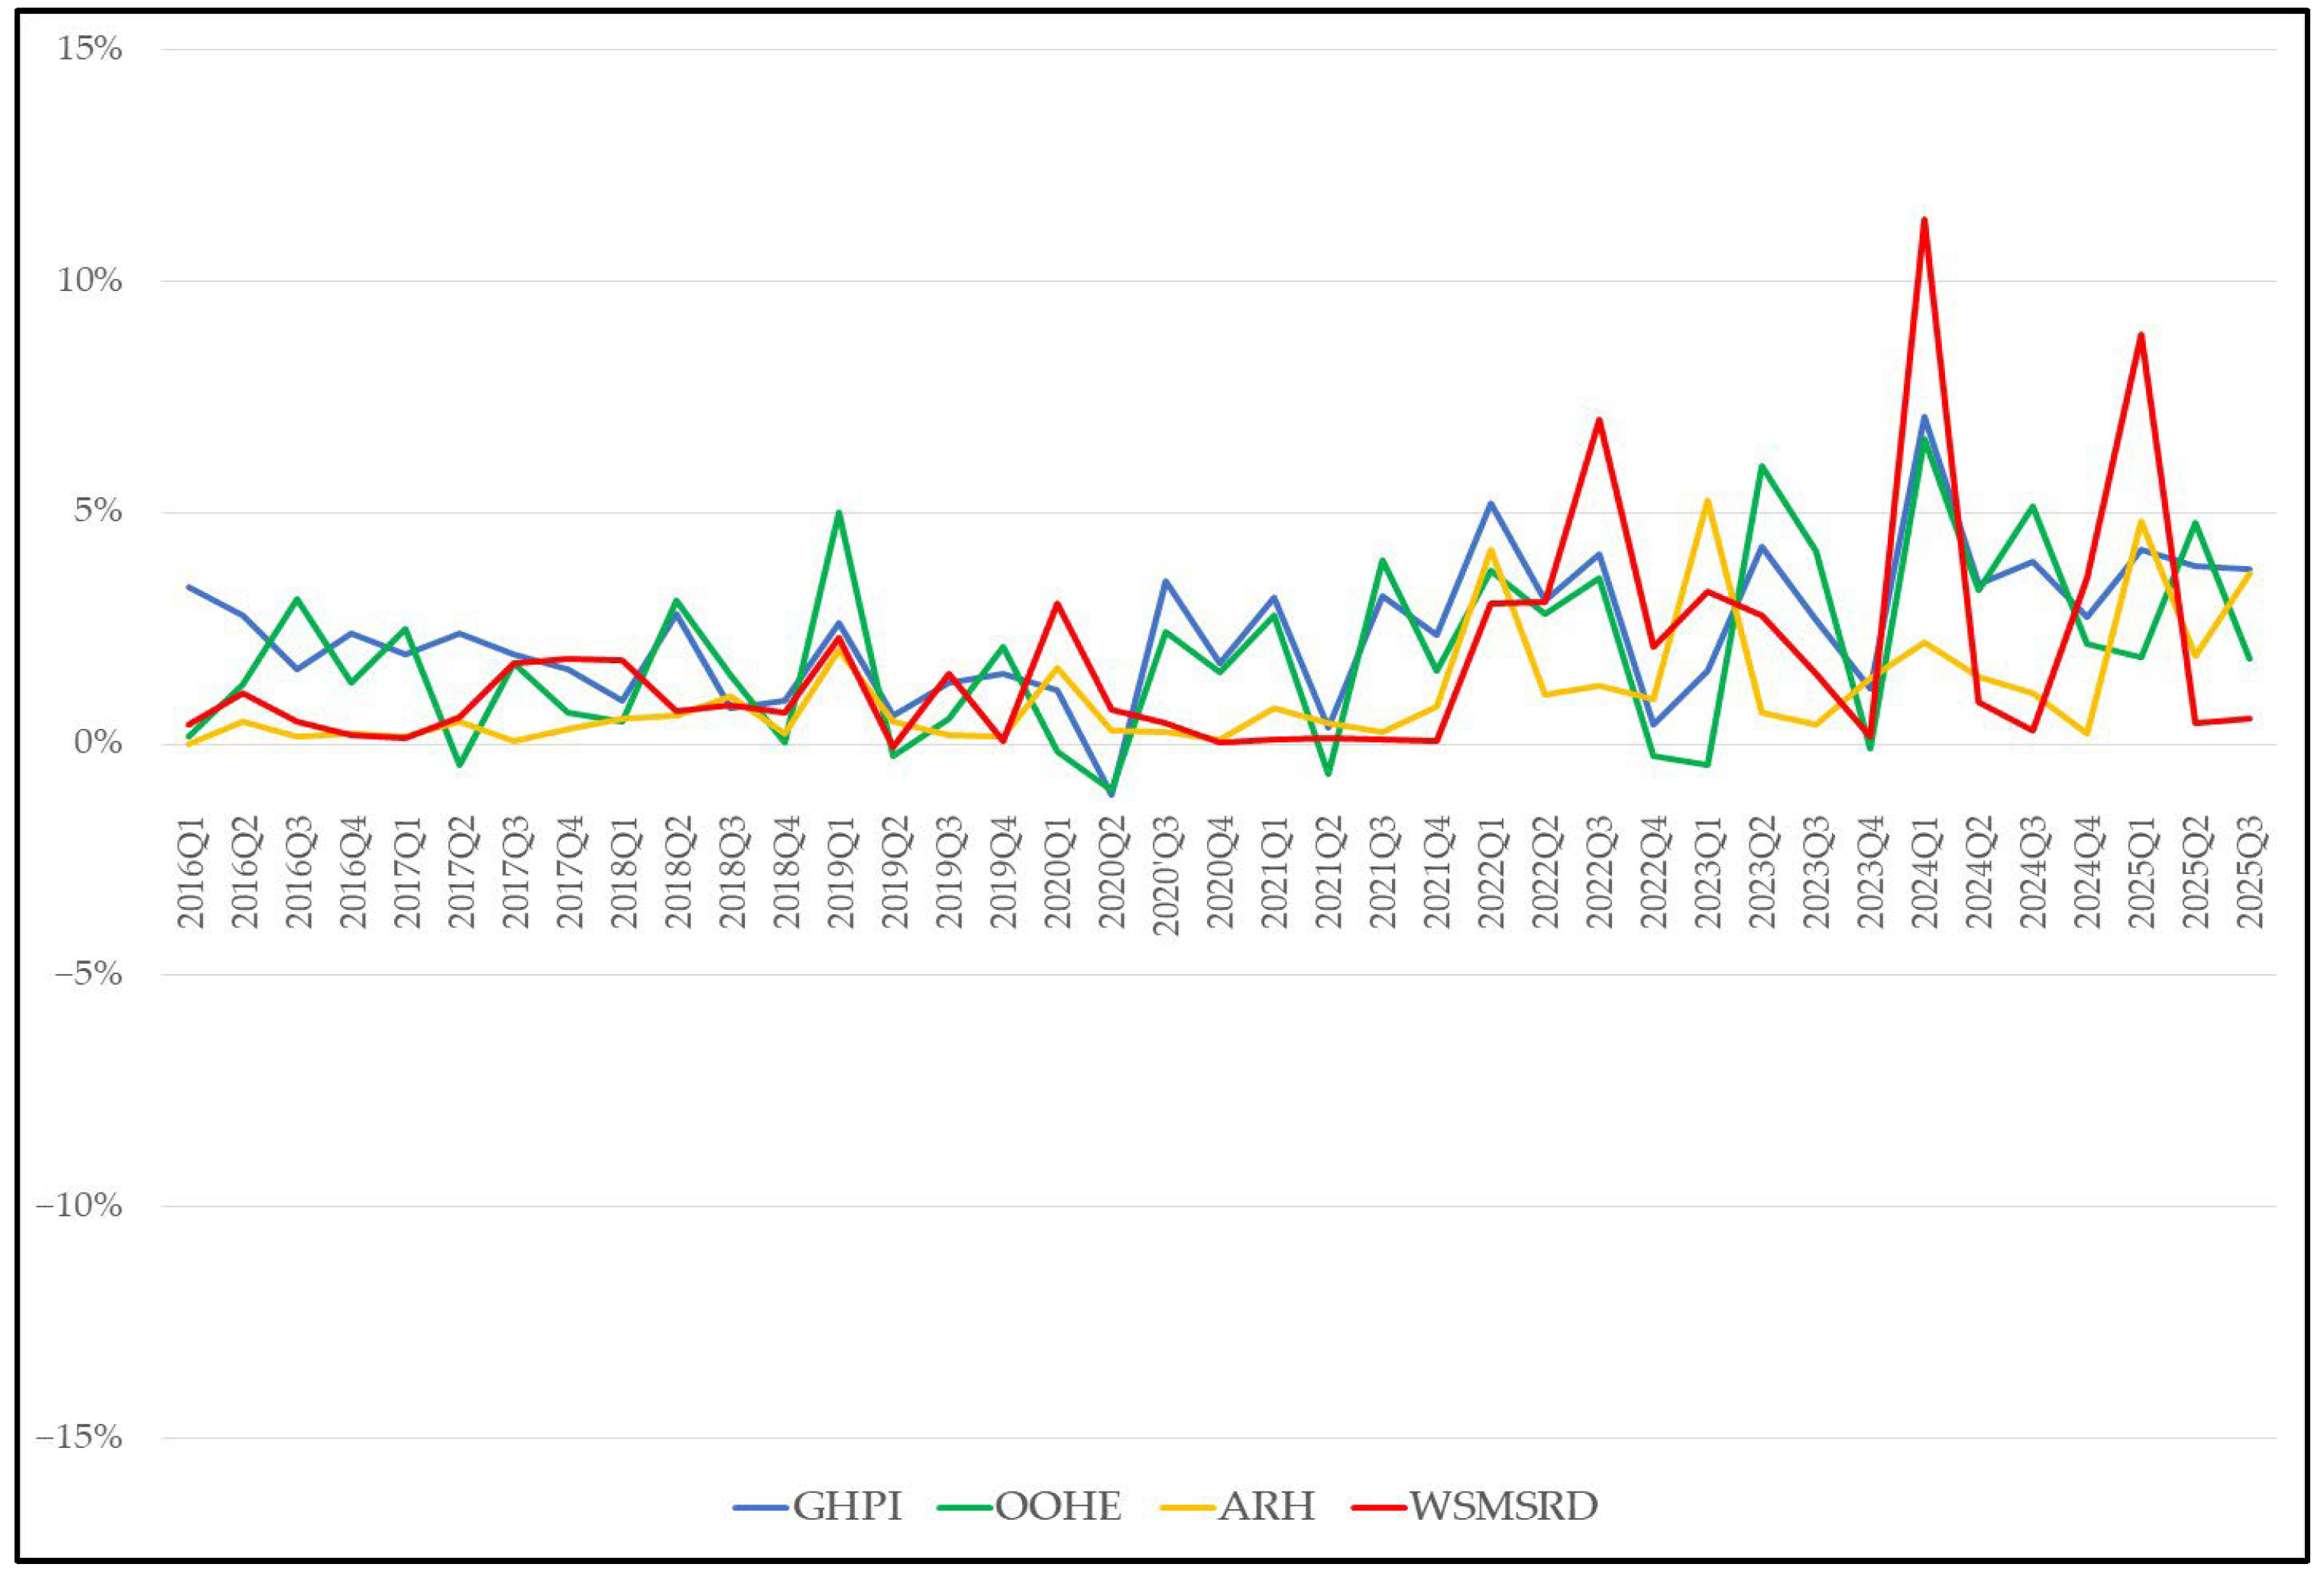
Appendix B.1. First Differencing of Variables with a Statistically Significant Impact on GHPI, Selected in the ARIMAX(0,2,1) Model
Figure A2.
Dynamics of the first differentiated factors in the ARIMAX model (0,2,1): OOHE, AHE & WSMSRD with a statistically significant impact on GHPI.
Appendix B.2. Descriptive Statistics of Second Deference of the Dependent Variable GHPI_D2 and Independent Variables
Table A4.
Descriptive Statistics of GHPI_D2, OOHE_D2, WSMSRD_D2 and ARH_D2.
Appendix B.3. Graphical Evidence from the Test for Normal Distribution of Residuals
Figure A3.
Histogram results.
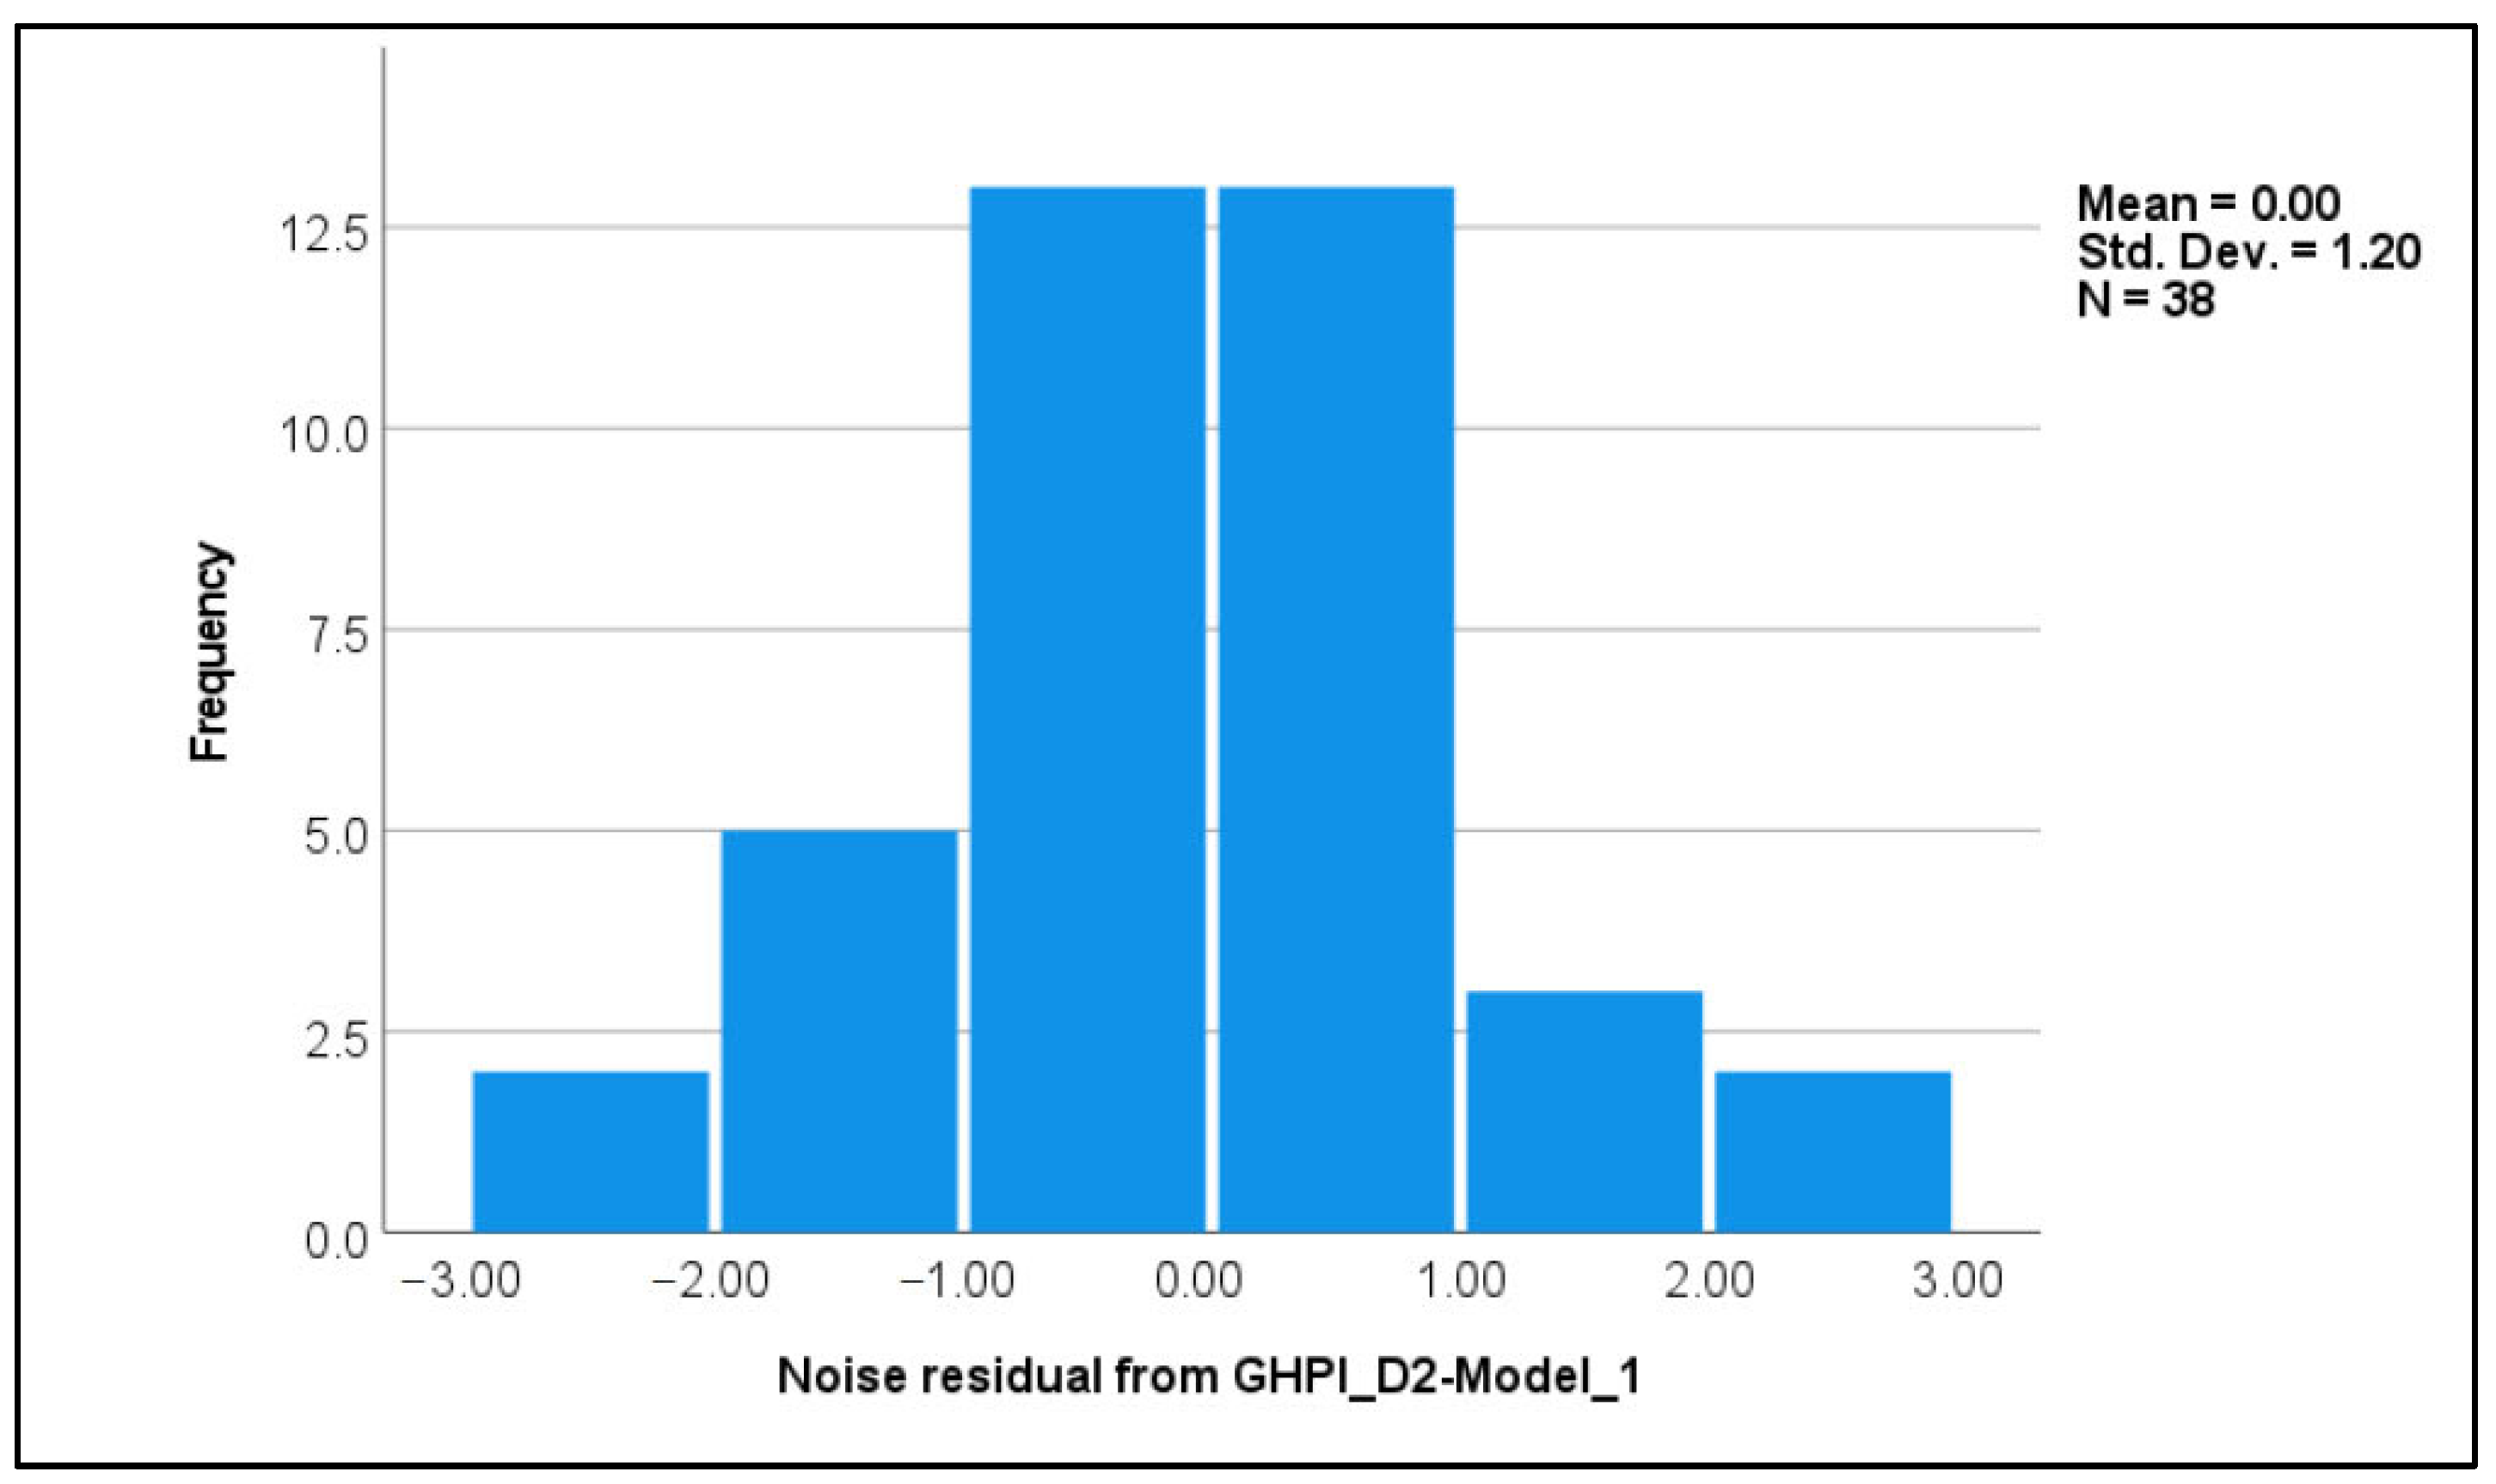
Figure A4.
Normal Q-Q Plot of Noise residual from GHPI_D2-Model_1.
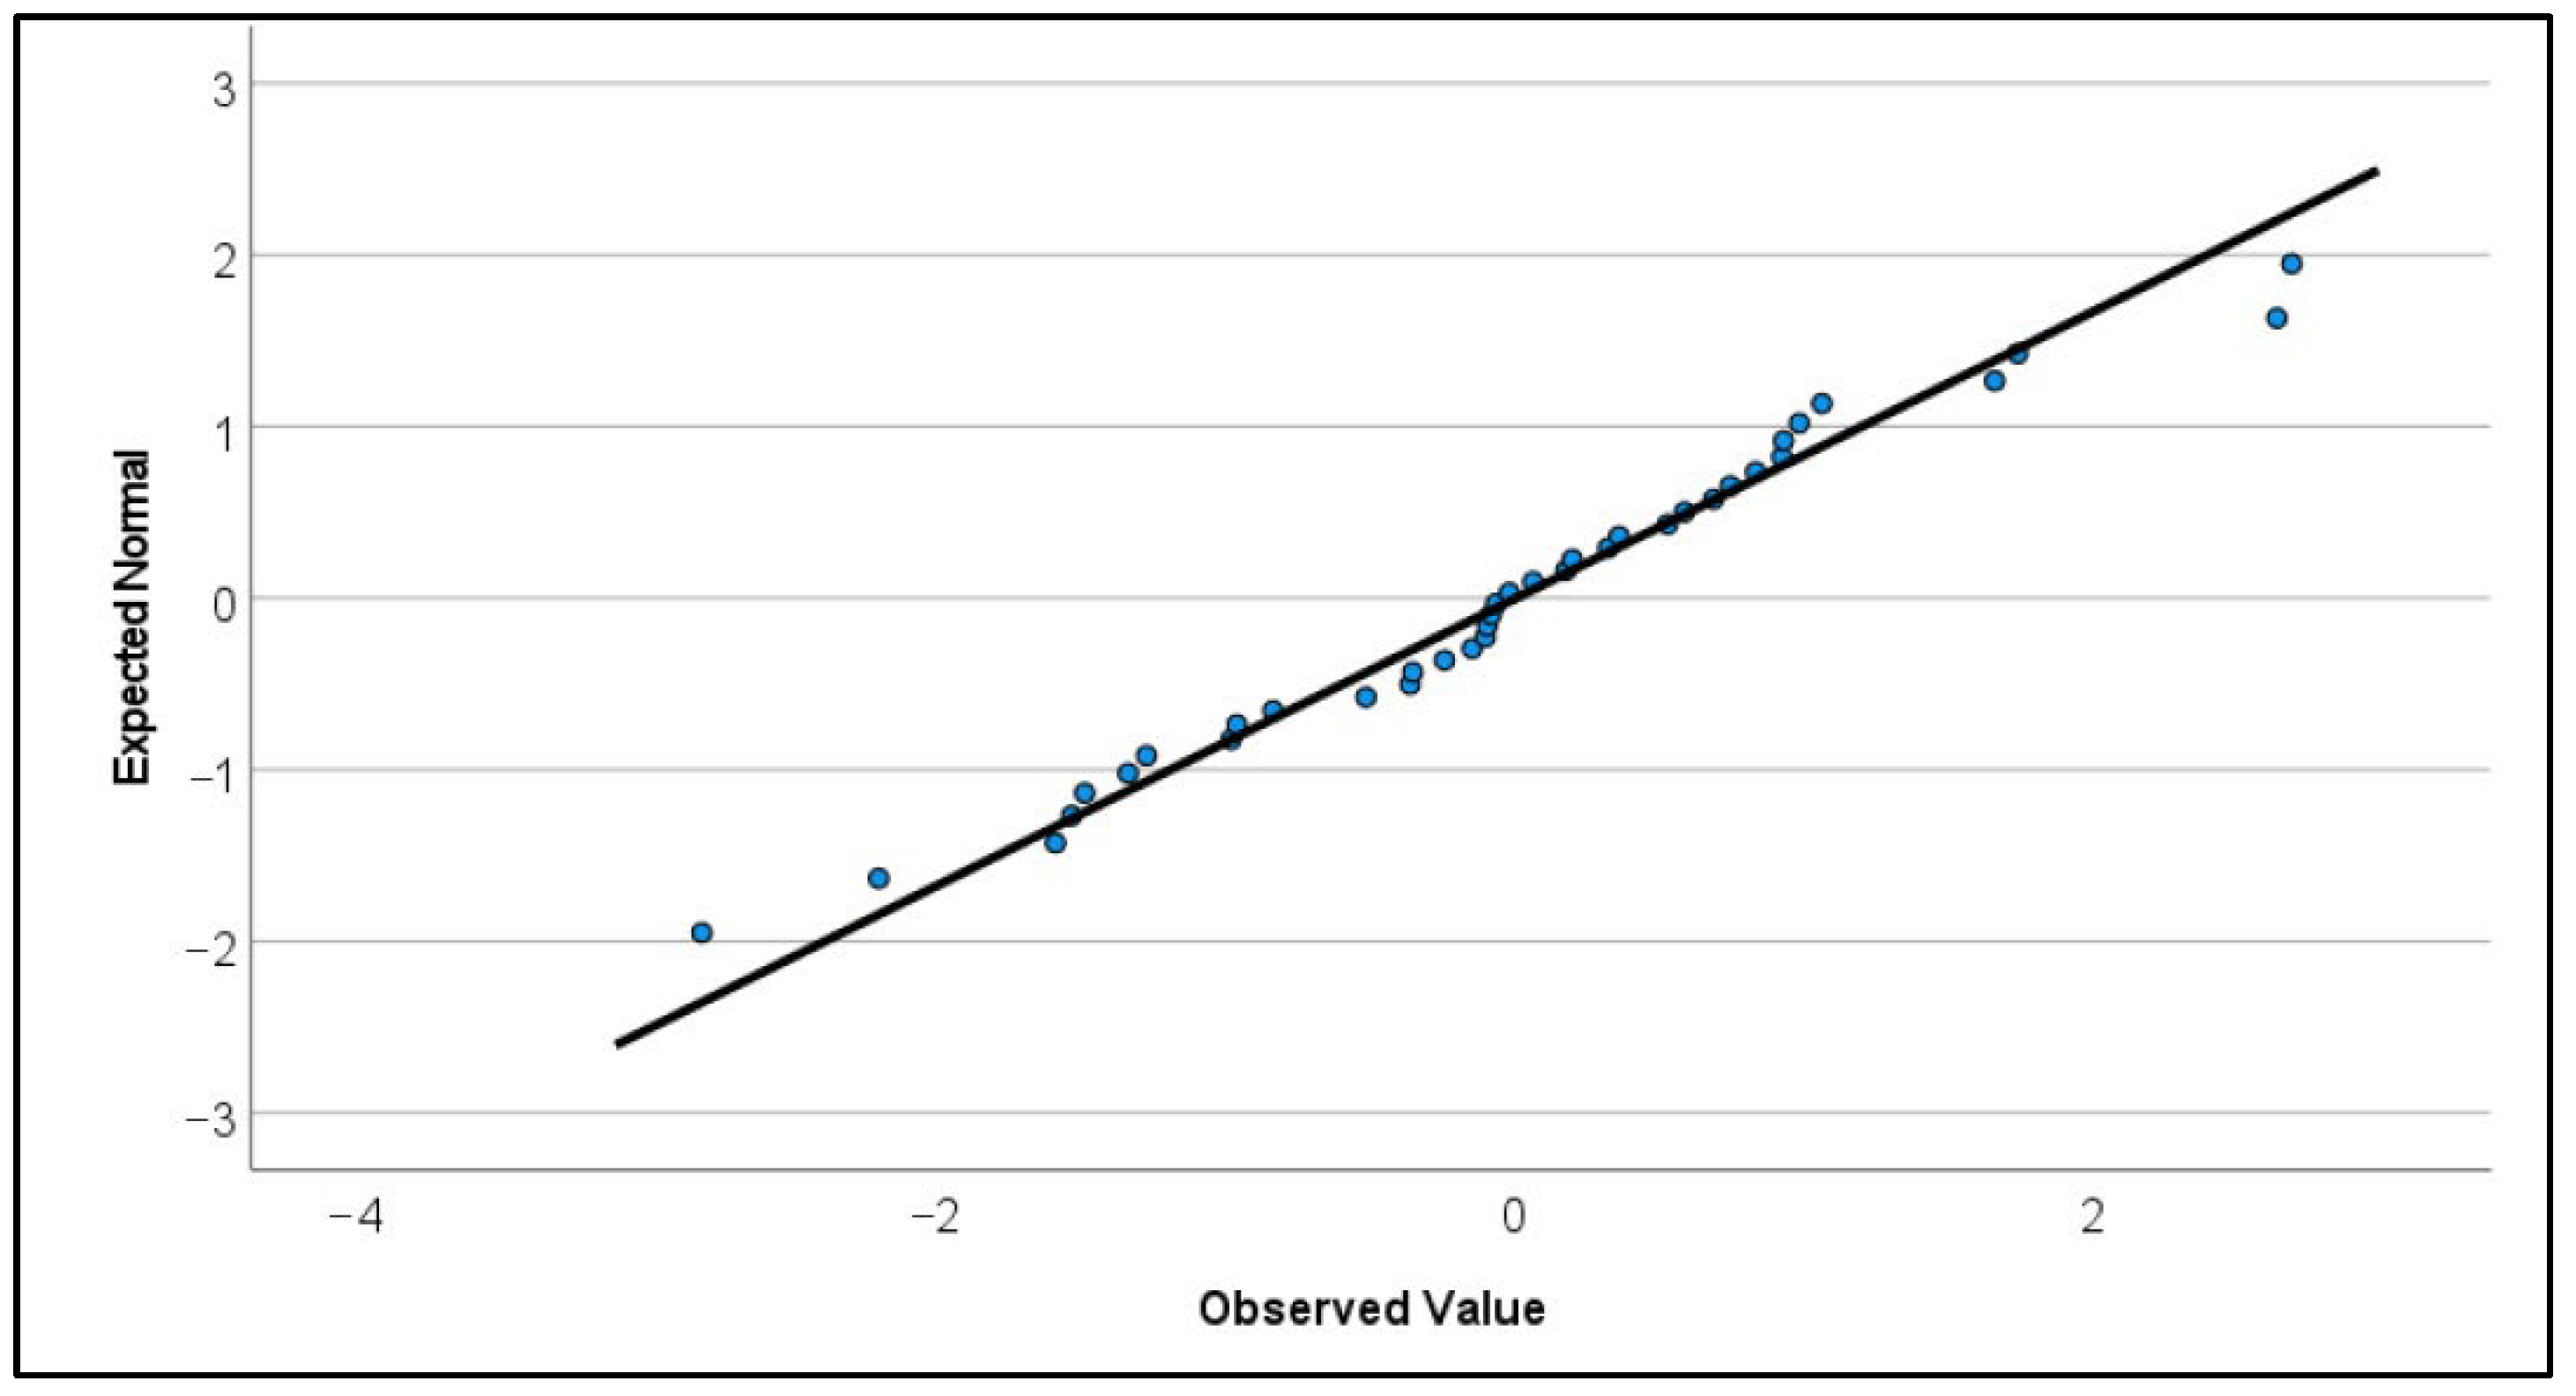
Figure A5.
Detrended Normal Q-Q Plot of Noise residual from GHPI_D2-Model_1.
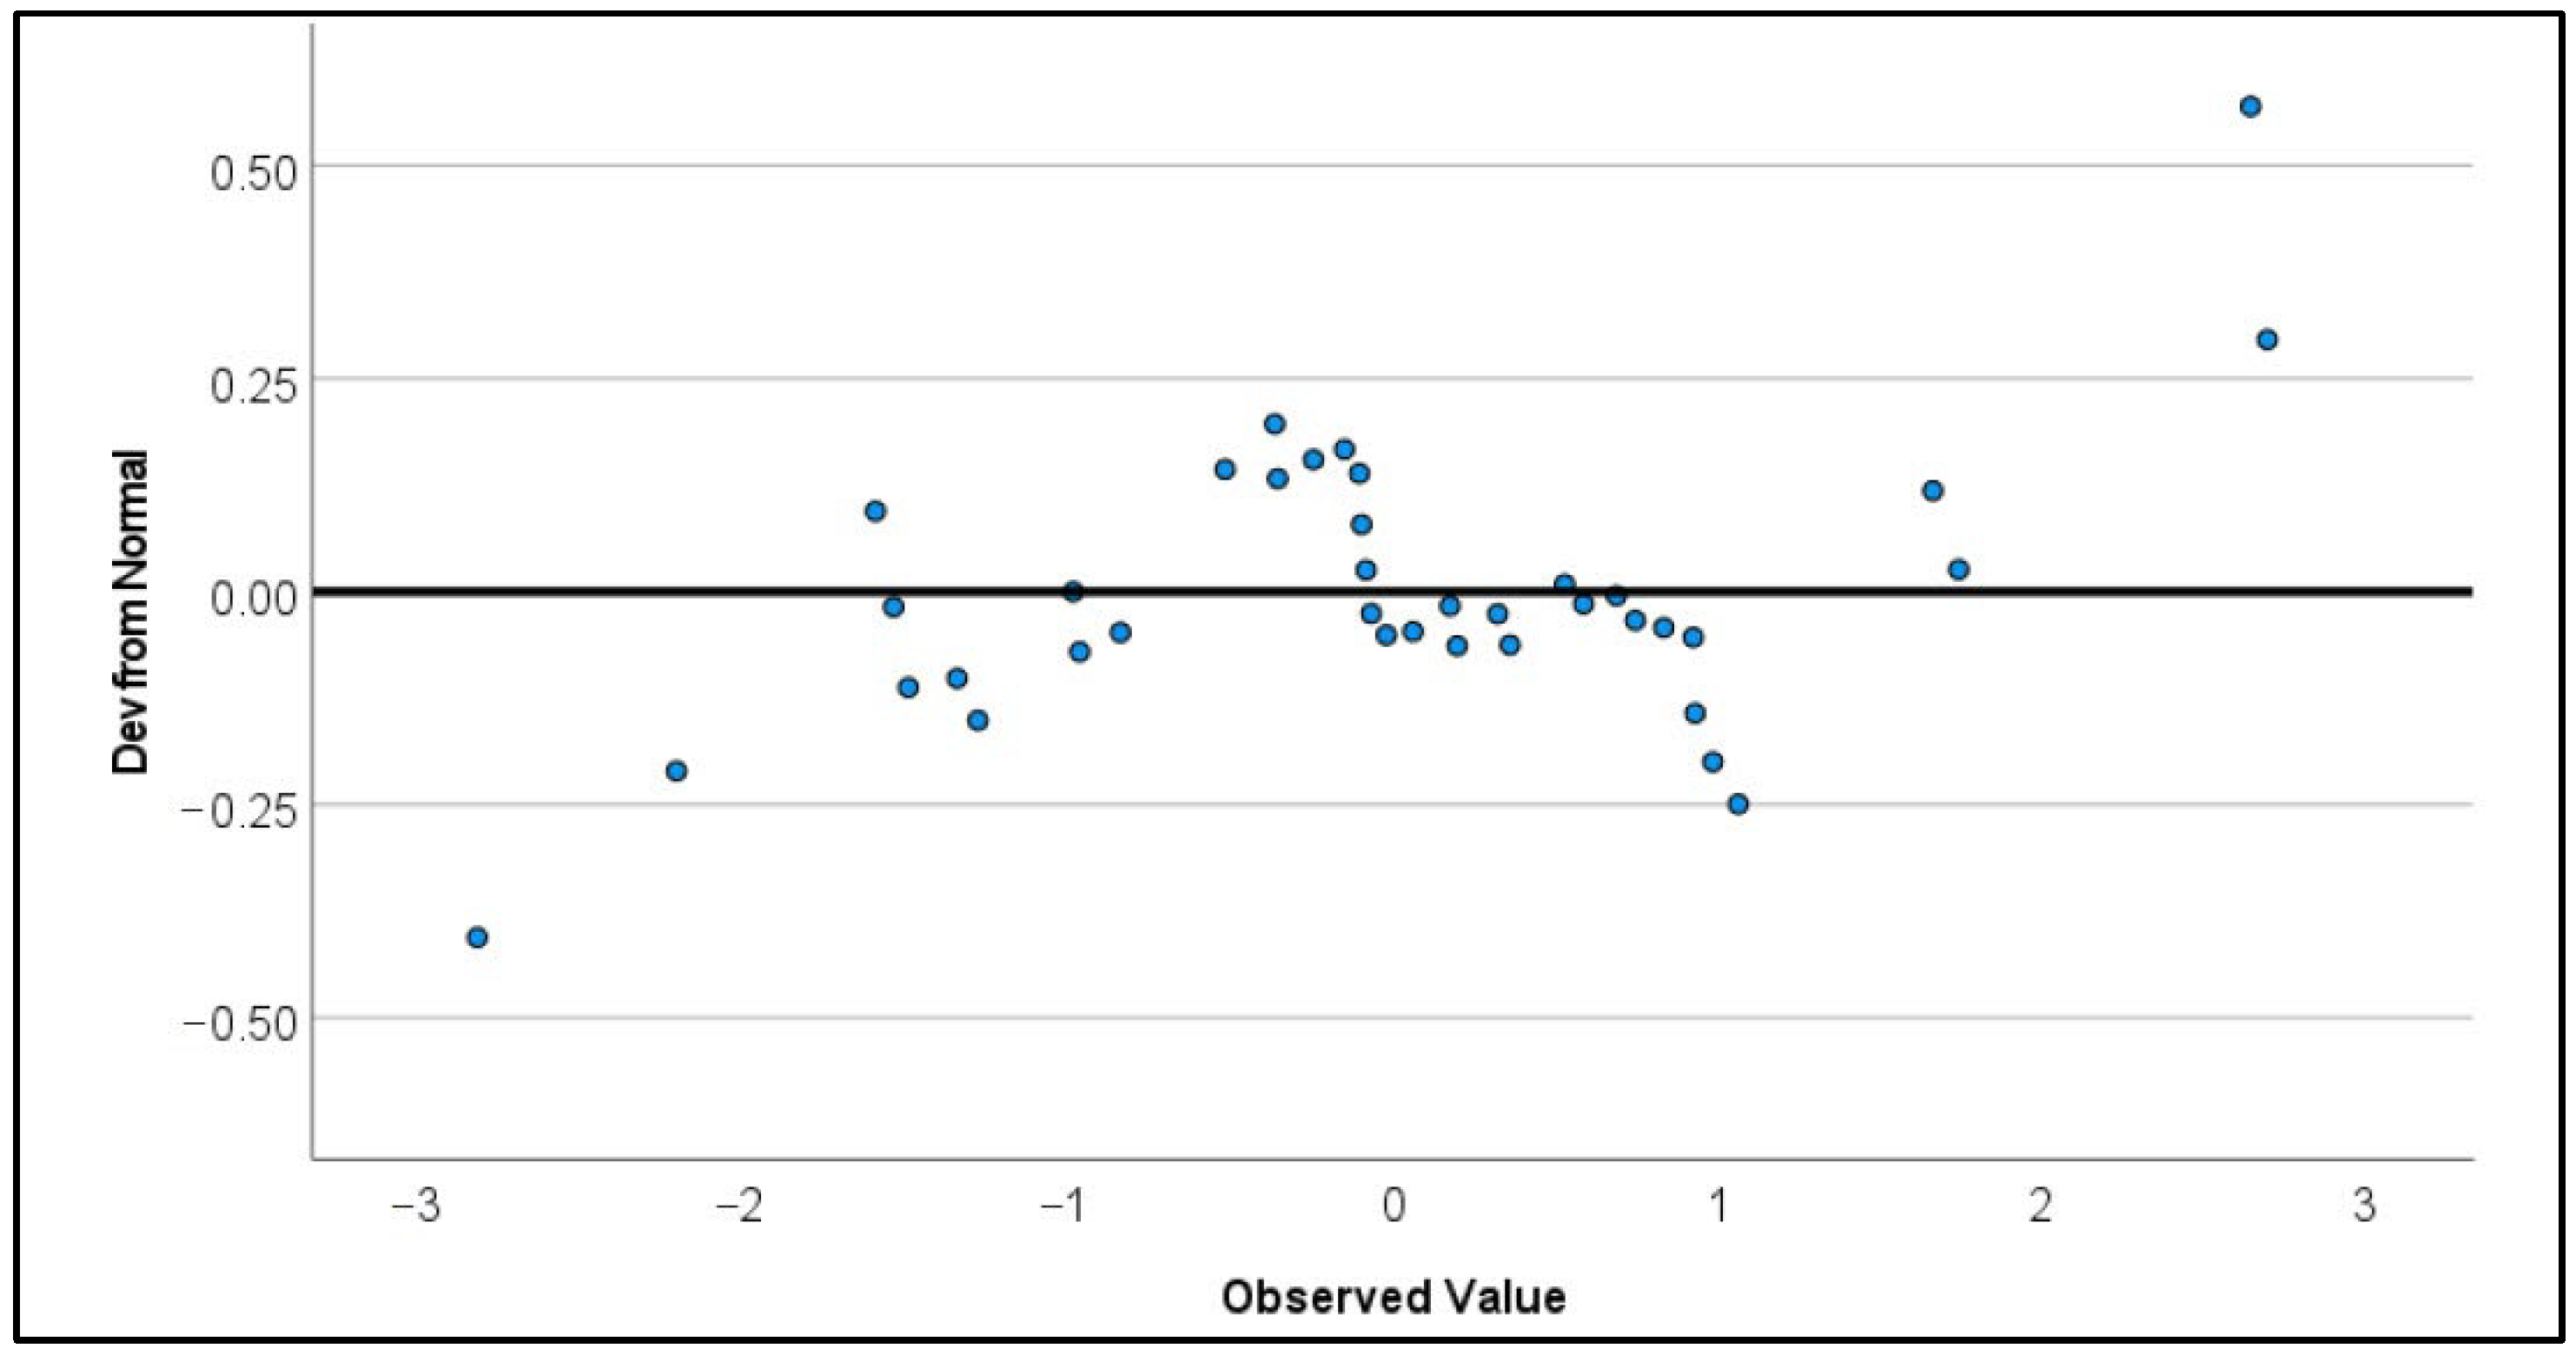
Figure A6.
Distribution of Noise residual from GHPI_D2-Model_1.
References
- Algieri, B. (2013). House price determinants: Fundamentals and underlying factors. Comparative Economic Studies, 55, 315–341. [Google Scholar] [CrossRef] [Scilit]
- Anari, A., & Kolari, J. (2002). House prices and inflation. Real Estate Economics, 30(1), 67–84. [Google Scholar] [CrossRef] [Scilit]
- Araya, F., Poblete, P., Salazar, L. A., Sánchez, O., Sierra-Varela, L., & Filun, Á. (2024). Exploring the Influence of construction companies characteristics on their response to the COVID-19 pandemic in the Chilean context. Sustainability, 16(8), 3417. [Google Scholar] [CrossRef] [Scilit]
- Atanassov, A., Trifonova, S., Saraivanova, J., & Pramatarov, A. (2017). Assessment of the Administrative burdens for businesses in Bulgaria according to the national legislation related to the European Union internal market. Management: Journal of Contemporary Management Issues, 22, 21–49. [Google Scholar]
- Aydinli, S. (2024). Impact of unexpected conditions on construction cost forecasting performance: Evidence from Europe. Construction Management and Economics, 42(9), 787–801. [Google Scholar] [CrossRef] [Scilit]
- BNB. (2026). Interest rates on loans—Households and NPISHs. Bulgarian National Bank. Available online: https://www.bnb.bg/Statistics/StMonetaryInterestRate/StInterestRate/StIRIROnLoans/StIRIROnLoansHouseholdsAndNPISHs/index.htm (accessed on 31 January 2026).
- Brolinson, B., Doerner, W. M., Pollestad, A. J., & Seiler, M. J. (2026). European energy crisis: Did electricity prices shock real estate markets? Journal of Environmental Economics and Management, 137, 103283. [Google Scholar] [CrossRef] [Scilit]
- Caldera Sánchez, A., & Johansson, Å. (2011). The price responsiveness of housing supply in OECD countries. OECD Economics Department Working Papers, 837, 1–35. [Google Scholar] [CrossRef]
- Cermáková, K., & Hromada, E. (2022). Change in the affordability of owner-occupied housing in the context of rising energy prices. Energies, 15(4), 1281. [Google Scholar] [CrossRef] [Scilit]
- Ciarlone, A. (2015). House price cycles in emerging economies. Studies in Economics and Finance, 32(1), 17–52. [Google Scholar] [CrossRef] [Scilit]
- Ciot, M.-G. (2022). Implementation perspectives for the European green deal in central and Eastern Europe. Sustainability, 14(7), 3947. [Google Scholar] [CrossRef] [Scilit]
- Cohen, V., & Karpavičiūtė, L. (2017). The analysis of the determinants of housing prices. Independent Journal of Management & Production, 8(1), 49–63. [Google Scholar] [CrossRef] [Scilit]
- Dandashly, A., & Verdun, A. (2021). Euro adoption policies in the second decade—The remarkable cases of the Baltic States. In Economic and Monetary Union at Twenty (pp. 93–109). Routledge. Available online: https://bit.ly/4cxxl17 (accessed on 31 January 2026).
- Dickey, D. A., & Fuller, W. A. (1981). Likelihood ratio statistics for autoregressive time series with a unit root. Econometrica, 49(4), 1057–1072. [Google Scholar] [CrossRef] [Scilit]
- DiPasquale, D., & Wheaton, W. C. (1992). The markets for real estate assets and space: A conceptual framework. Real Estate Economics, 20(2), 181–198. [Google Scholar] [CrossRef] [Scilit]
- Distaso, W. (2008). Testing for unit root processes in random coefficient autoregressive models. Journal of Econometrics, 142, 581–609. [Google Scholar] [CrossRef] [Scilit]
- Doling, J., & Ronald, R. (2010). Home ownership and asset-based welfare. Journal of Housing and the Built Environment, 25, 165–173. [Google Scholar] [CrossRef] [Scilit]
- Ebekozien, A. A., & Aigbedion, M. (2021). Construction industry post-COVID-19 recovery: Stakeholders perspective on achieving sustainable development goals. International Journal of Construction Management, 23(8), 1376–1386. [Google Scholar] [CrossRef] [Scilit]
- Egert, B., & Mihaljek, D. (2007). Determinants of house prices in central and Eastern Europe. Comparative Economic Studies, 49(3), 337–489. [Google Scholar] [CrossRef] [Scilit]
- European Commission. (2025). Convergence report 2025 on Bulgaria (D.-G. f. Affairs). Publications Office of the European Union. [Google Scholar] [CrossRef]
- European Parliament. (2025). Topics European parliament. In The housing crisis in Europe: Key facts and EU action (infographics). European Parliament. Available online: https://www.housingcoop.eu/resources/knowledge/the-housing-crisis-in-europe-key-facts-and-eu-action (accessed on 1 February 2026).
- Eurostat. (2014). Manual on the changes between ESA 95 and ESA 2010. 2014 edition. Publications Office of the European Union. [Google Scholar] [CrossRef]
- Eurostat. (2025a). Gross domestic product at market prices. In National accounts indicator (ESA 2010): Gross domestic product at market prices. Publications Office of the European Union. [Google Scholar] [CrossRef]
- Eurostat. (2025b). Housing in Europe—2025 edition. Interactive Publication. [Google Scholar] [CrossRef]
- Eurostat. (2026a). Distribution of population by tenure status, type of household and income group. Publications Office of the European Union. [Google Scholar] [CrossRef]
- Eurostat. (2026b). House price and sales index. In House price index (2015 = 100)—Annual data. Publications Office of the European Union. Available online: https://ec.europa.eu/eurostat/databrowser/view/prc_hpi_a/default/table?lang=en (accessed on 31 January 2026).
- Eurostat. (2026c). Unemployment statistics. Statistics Explained. Available online: https://bit.ly/4avgdXe (accessed on 31 January 2026).
- Gabriela, C. P., Nijkamp, P., & Kourtit, K. (2023). Regional science knowledge needs for the recovery of the Ukrainian spatial economy: A Q-analysis. Regional Science Policy & Practice, 15(1), 75–95. [Google Scholar] [CrossRef] [Scilit]
- Girouard, N., Kennedy, M., Noord, P. v., & André, C. (2006). Recent house price developments: The role of fundamentals. OECD Economics Department Working Papers, 475, 1–61. [Google Scholar] [CrossRef]
- Gönül, İ. Ö., & Omay, T. (2025). Dynamic market efficiency assessment in sustainability indices: Rolling fractional integration analysis with multiple estimators. Borsa Istanbul Review, 25(6), 1645–1662. [Google Scholar] [CrossRef] [Scilit]
- Gurmu, A. T., Krezel, A., & Ongkowijoyo, C. (2021). Fuzzy-stochastic model to assess defects in low-rise residential buildings. Journal of Building Engineering, 40, 102318. [Google Scholar] [CrossRef] [Scilit]
- Haandrikman, K., Costa, R., Malmberg, B., Rogne, A. F., & Sleutjes, B. (2023). Socio-economic segregation in European cities. A comparative study of Brussels, Copenhagen, Amsterdam, Oslo and Stockholm. Urban Geography, 44(1), 1–36. [Google Scholar] [CrossRef] [Scilit]
- Hadad, E., Dimitrov, S., & Stoilova-Nikolova, J. (2022). Development of capital pension funds in the Czech Republic and Bulgaria and readiness to implement PEPP. European Journal of Social Security, 24(4), 342–360. [Google Scholar] [CrossRef] [Scilit]
- Herrera, R. F., Sánchez, O., Castañeda, K., & Porras, H. (2020). Cost overrun causative factors in road infrastructure Projects: A frequency and importance analysis. Applied Sciences, 10(16), 5506. [Google Scholar] [CrossRef] [Scilit]
- Hyndman, R. J., & Koehler, A. B. (2006). Another look at measures of forecast accuracy. International Journal of Forecasting, 22(4), 679–688. [Google Scholar] [CrossRef] [Scilit]
- Idirizov, B. (2025). Analysis of the Bulgarian housing price index: Risks, market dynamics, and economic implications. Economic Studies (Ikonomicheski Izsledvania), 34(8), 175–195. [Google Scholar]
- Iliopoulou, P., Krassanakis, V., & Kappelos, K. (2025). Modeling the spatial impact of short-term rentals on house prices: The case of Athens, Greece. Urban Science, 9(12), 539. [Google Scholar] [CrossRef] [Scilit]
- Irandoust, M. (2019). House prices and unemployment: An empirical analysis of causality. International Journal of Housing Markets and Analysis, 12(1), 148–164. [Google Scholar] [CrossRef] [Scilit]
- Ishiwatari, M., Ranghieri, F., Taniguchi, K., & Mimura, S. (2021). Learning from Megadisasters in Japan: Sharing lessons with the world. Journal of Disaster Research, 16(6), 942–946. [Google Scholar] [CrossRef] [Scilit]
- Ishiwatari, M., Sakamoto, A., & Nakayama, M. (2025). Expediting recovery: Lessons and challenges from the great East Japan earthquake to war-torn Ukraine. Sustainability, 17(3), 1210. [Google Scholar] [CrossRef] [Scilit]
- Johansen, S. (1995). Likelihood-based inference in cointegrated vector autoregressive models. Oxford University Press. [Google Scholar] [CrossRef] [Scilit]
- Kass, R. E., & Raftery, A. E. (1995). Bayes factors. Journal of the American Statistical Association, 90(430), 773–795. [Google Scholar] [CrossRef]
- Kochaniak, K., Korzeniowska, A., & Pietrzak, M. (2024). Own or public? Later livelihoods of Ukrainian war migrant households in Poland. International Migration, 62(5), 53–70. [Google Scholar] [CrossRef] [Scilit]
- Kotu, V., & Deshpande, B. (2019). Chapter 12—Time series forecasting. In O. V. Kotu, & B. Deshpande (Eds.), Data science (2nd ed., pp. 395–445). Morgan Kaufmann. [Google Scholar] [CrossRef] [Scilit]
- Kruskal, W. H., & Wallis, W. A. (1952). Use of ranks in one-criterion variance analysis. Journal of the American statistical Association, 47(260), 583–621. [Google Scholar] [CrossRef]
- Kuang, W., & Liu, P. (2015). Inflation and house prices: Theory and evidence from 35 major cities in China. International Real Estate Review, 18(2), 217–240. [Google Scholar] [CrossRef] [Scilit]
- Kwiatkowski, D., Phillips, P. C., Schmidt, P., & Shin, Y. (1992). Testing the null hypothesis of stationarity against the alternative of a unit root: How sure are we that economic time series have a unit root? Journal of Econometrics, 54(1–3), 159–178. [Google Scholar] [CrossRef] [Scilit]
- Li, B., & Zeng, Z. (2010). Fundamentals behind house prices. Economics Letters, 108(2), 205–207. [Google Scholar] [CrossRef] [Scilit]
- Lin, Y.-C., Lee, C. L., & Newell, G. (2022). Varying interest rate sensitivity of different property sectors: Cross-country evidence from REITs. Journal of Property Investment & Finance, 40(1), 68–98. [Google Scholar] [CrossRef] [Scilit]
- Liu, J., Farahani, H., & Serota, R. A. (2024). Exploring distributions of house prices and house price indices. Economies, 12(2), 47. [Google Scholar] [CrossRef] [Scilit]
- Marinković, S., Džunić, M., & Marjanović, I. (2024). Determinants of housing prices: Serbian cities’ perspective. Journal of Housing and the Built Environment, 39, 1601–1626. [Google Scholar] [CrossRef] [Scilit]
- Marinov, E. (2017). The link between official development assistance and international trade flows—Insights from Economic Theory. Journal of Financial and Monetary Economics, 4, 239–247. [Google Scholar]
- Mayer, C. J., & Somerville, C. T. (2000). Residential construction: Using the urban growth model to estimate housing supply. Journal of Urban Economics, 48, 85–109. [Google Scholar] [CrossRef] [Scilit]
- Mazáček, D., & Panoš, J. (2025). Key determinants of sales price in the residential developments in Prague. Journal of European Real Estate Research, 18(3), 371–400. [Google Scholar] [CrossRef] [Scilit]
- McQuinn, K., & O’Reilly, G. (2008). Assessing the role of income and interest rates in determining house prices. Economic Modelling, 25(3), 377–390. [Google Scholar] [CrossRef] [Scilit]
- Mihaylova-Borisova, G., & Nenkova, P. (2020). Expenditure efficiency and macroeconomic performance of balkan countries: DEA approach. In Conomic and social development, 63rd international scientific conference on economic and social development—Building resilient society (pp. 439–448). Varazdin Development and Entewpreneurship Agency and University North. [Google Scholar]
- Mimis, A., Rovolis, A., & Stamou, M. (2013). Property valuation with artificial neural network: The case of Athens. Journal of Property Research, 30(2), 128–143. [Google Scholar] [CrossRef] [Scilit]
- Nenkov, D., & Hristozov, Y. (2022). DCF valuation of companies: Exploring the interrelation between revenue and operating expenditures. Economic Alternatives, 28(4), 626–646. [Google Scholar] [CrossRef] [Scilit]
- NSI. (2026). Housing price statistics. National Statistical Institute. Available online: https://www.nsi.bg/en/statistical-data/90 (accessed on 31 January 2026).
- Ouhinou, M. A., Saoualih, A., Lyaqini, S., Kartobi, S. E., Prodanov, S., & Safaa, L. (2025). Unraveling differences and similarities in sustainable investment through case studies in China, Germany, and the United States: A Multi-algorithm clustering network approach. In Proceedings of the third ICMDS’24: Machine learning, inverse problems and related fields. ICMDS 2024 (Vol. 1466, pp. 193–202). Springer Nature. [Google Scholar] [CrossRef] [Scilit]
- Pagourtzi, E., Assimakopoulos, V., Hatzichristos, T., & French, N. (2003). Real estate appraisal: A review of valuation methods. Journal of Property Investment & Finance, 21(4), 383–401. [Google Scholar] [CrossRef] [Scilit]
- Park, J., & Seo, D. (2024). Comparative study on housing defect repair cost through linear regression model. Eng, 5(3), 2328–2344. [Google Scholar] [CrossRef] [Scilit]
- Passek, M., & Nübel, K. (2025). Forecasting office construction price indices for cost planning in Germany using regularized VARX models. Buildings, 16(1), 103. [Google Scholar] [CrossRef] [Scilit]
- Pazdzior, A., Sokol, M., & Styk, A. (2021). The impact of the COVID-19 pandemic on the economic and financial situation of the micro and small enterprises from the construction and development industry in Poland. European Research Studies Journal, XXIV, 751–762. [Google Scholar] [CrossRef] [Scilit]
- Perry, A., Markovska, A., & Smith, C. (2026). Behind the scheme: Challenges faced by professionals addressing safeguarding issues in housing for Ukrainian refugees in the United Kingdom. Social Sciences, 15(2), 89. [Google Scholar] [CrossRef] [Scilit]
- Prodanov, S., & Naydenov, L. (2020). Theoretical, qualitative and quantitative aspects of municipal fiscal autonomy in Bulgaria. Ikonomicheski Izsledvania, 29(2), 126–150. [Google Scholar]
- Reichle, P., Fidrmuc, J., & Reck, F. (2023). The sharing economy and housing markets in selected European cities. Journal of Housing Economics, 60, 101914. [Google Scholar] [CrossRef] [Scilit]
- Roleders, V., Oriekhova, T., Zaharieva, G., Sysoieva, I., Dobizha, V., Pidhaiets, S., & Kucher, L. (2024). Economic justification of recycling in the processing industry. Cleaner and Responsible Consumption, 13, 100195. [Google Scholar] [CrossRef] [Scilit]
- Sabitova, N. M., Shavaleyeva, C. M., Lizunova, E. N., Khairullova, A. I., & Zahariev, A. (2020). Tax Capacity of the Russian Federation Constituent Entities: Problems of Assessment and Unequal Distribution. In L. N. Safiullin, & N. Gabdrakhmanov (Eds.), Regional economic developments in Russia (pp. 79–86). Springer. [Google Scholar] [CrossRef] [Scilit]
- Schwartz, A. E., & Wachter, S. M. (2023). COVID-19’s impacts on housing markets: Introduction. Journal of Housing Economics, 59, 101911. [Google Scholar] [CrossRef] [Scilit] [PubMed]
- Sen, A. (2008). Behaviour of Dickey–Fuller tests when there is a break under the unit root null hypothesis. Statistics and Probability Letters, 78, 622–628. [Google Scholar] [CrossRef] [Scilit]
- Shen, H., Li, L., Zhu, H., Liu, Y., & Luo, Z. (2022). Exploring a pricing model for urban rental houses from a geographical perspective. Land, 11(4), 4. [Google Scholar] [CrossRef] [Scilit]
- Sivitanides, P. S. (2018). Macroeconomic drivers of London house prices. Journal of Property Investment & Finance, 36(6), 539–551. [Google Scholar] [CrossRef] [Scilit]
- Stroebel, J., & Vavra, J. (2019). House prices, local demand, and retail prices. Journal of Political Economy, 127(3), 1391–1436. [Google Scholar] [CrossRef] [Scilit]
- Sukhomud, G., & Shnaider, V. (2023). Continuity and change: Wartime housing politics in Ukraine. International Journal of Housing Policy, 23(3), 629–652. [Google Scholar] [CrossRef] [Scilit]
- Taggart, M., Koskela, L., & Rooke, J. (2014). The role of the supply chain in the elimination and reduction of construction rework and defects: An action research approach. Construction Management and Economics, 32(7–8), 829–842. [Google Scholar] [CrossRef] [Scilit]
- Ubarevičienė, R., & Aidukaitė, J. (2026). Housing provision: A comparative study of housing availability, accessibility, and adequacy in EU member states. Journal of International and Comparative Social Policy, 1–20. [Google Scholar] [CrossRef] [Scilit]
- Ushenko, N., Likhonosova, G., Zahariev, A., Shaulska, L., Kęsy, M., & Hurochkina, V. (2023). Strategies for strengthening business economic security with account to global financial challenges. Financial and Credit Activity: Problems of Theory and Practice, 6(53), 300–317. [Google Scholar] [CrossRef] [Scilit]
- Ünalan, G., Çamalan, Ö., & Yılmaz, H. H. (2025). The impact of increases in housing prices on income inequality: A perspective on sustainable urban development. Sustainability, 17(9), 4024. [Google Scholar] [CrossRef] [Scilit]
- Visković, J., & Čipčić, D. (2025). Effects of eurozone and schengen area accession on real estate prices. Financial Internet Quarterly, 21(4), 84–93. [Google Scholar] [CrossRef] [Scilit]
- Wu, Z. (2025). Time series forecasting of texas housing prices: A comparison between the ARIMA and VAR models. Theoretical and Natural Science, 80, 20–27. [Google Scholar] [CrossRef] [Scilit]
- Yan, L. (2024). Predicting house prices with a linear regression model. Applied and Computational Engineering, 114, 107–115. [Google Scholar] [CrossRef] [Scilit]
- Yordanova, Z., & Hristozov, Y. (2025). The evolution of financial analysis: From manual methods to AI and AI agents. Economics—Innovative and Economics Research Journal, 13(3), 2019–2239. [Google Scholar] [CrossRef] [Scilit]
- Yotzov, V., Bobeva, D., Loukanova, P., & Nestorov, N. (2020). Macroeconomic implications of the fight against COVID-19: First estimates, forecasts, and conclusions. Ikonomicheski Izsledvania, 29(3), 3–28. [Google Scholar]
- Zaharieva, G., Tarakchiyan, O., & Zahariev, A. (2022). Market capitalization factors of the Bulgarian pharmaceutical sector in pandemic environment. Business Management, XXXII(4), 35–51. [Google Scholar]
- Zhang, X., Wang, Y., Xu, S., Yang, E., & Meng, L. (2024). Forecasting total and type-specific non-residential building construction spending: The case study of the United States and lessons learned. Buildings, 14(5), 1317. [Google Scholar] [CrossRef] [Scilit]
- Zhelyazkova, V. (2018). The road to circular economy: What can Europe learn from the experience of Germany and Japan? Economic Studies Journal, 6, 167–177. [Google Scholar]
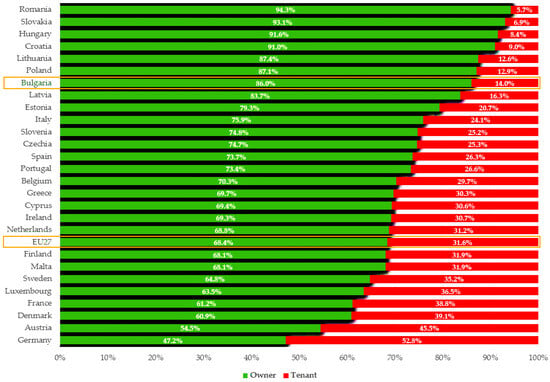
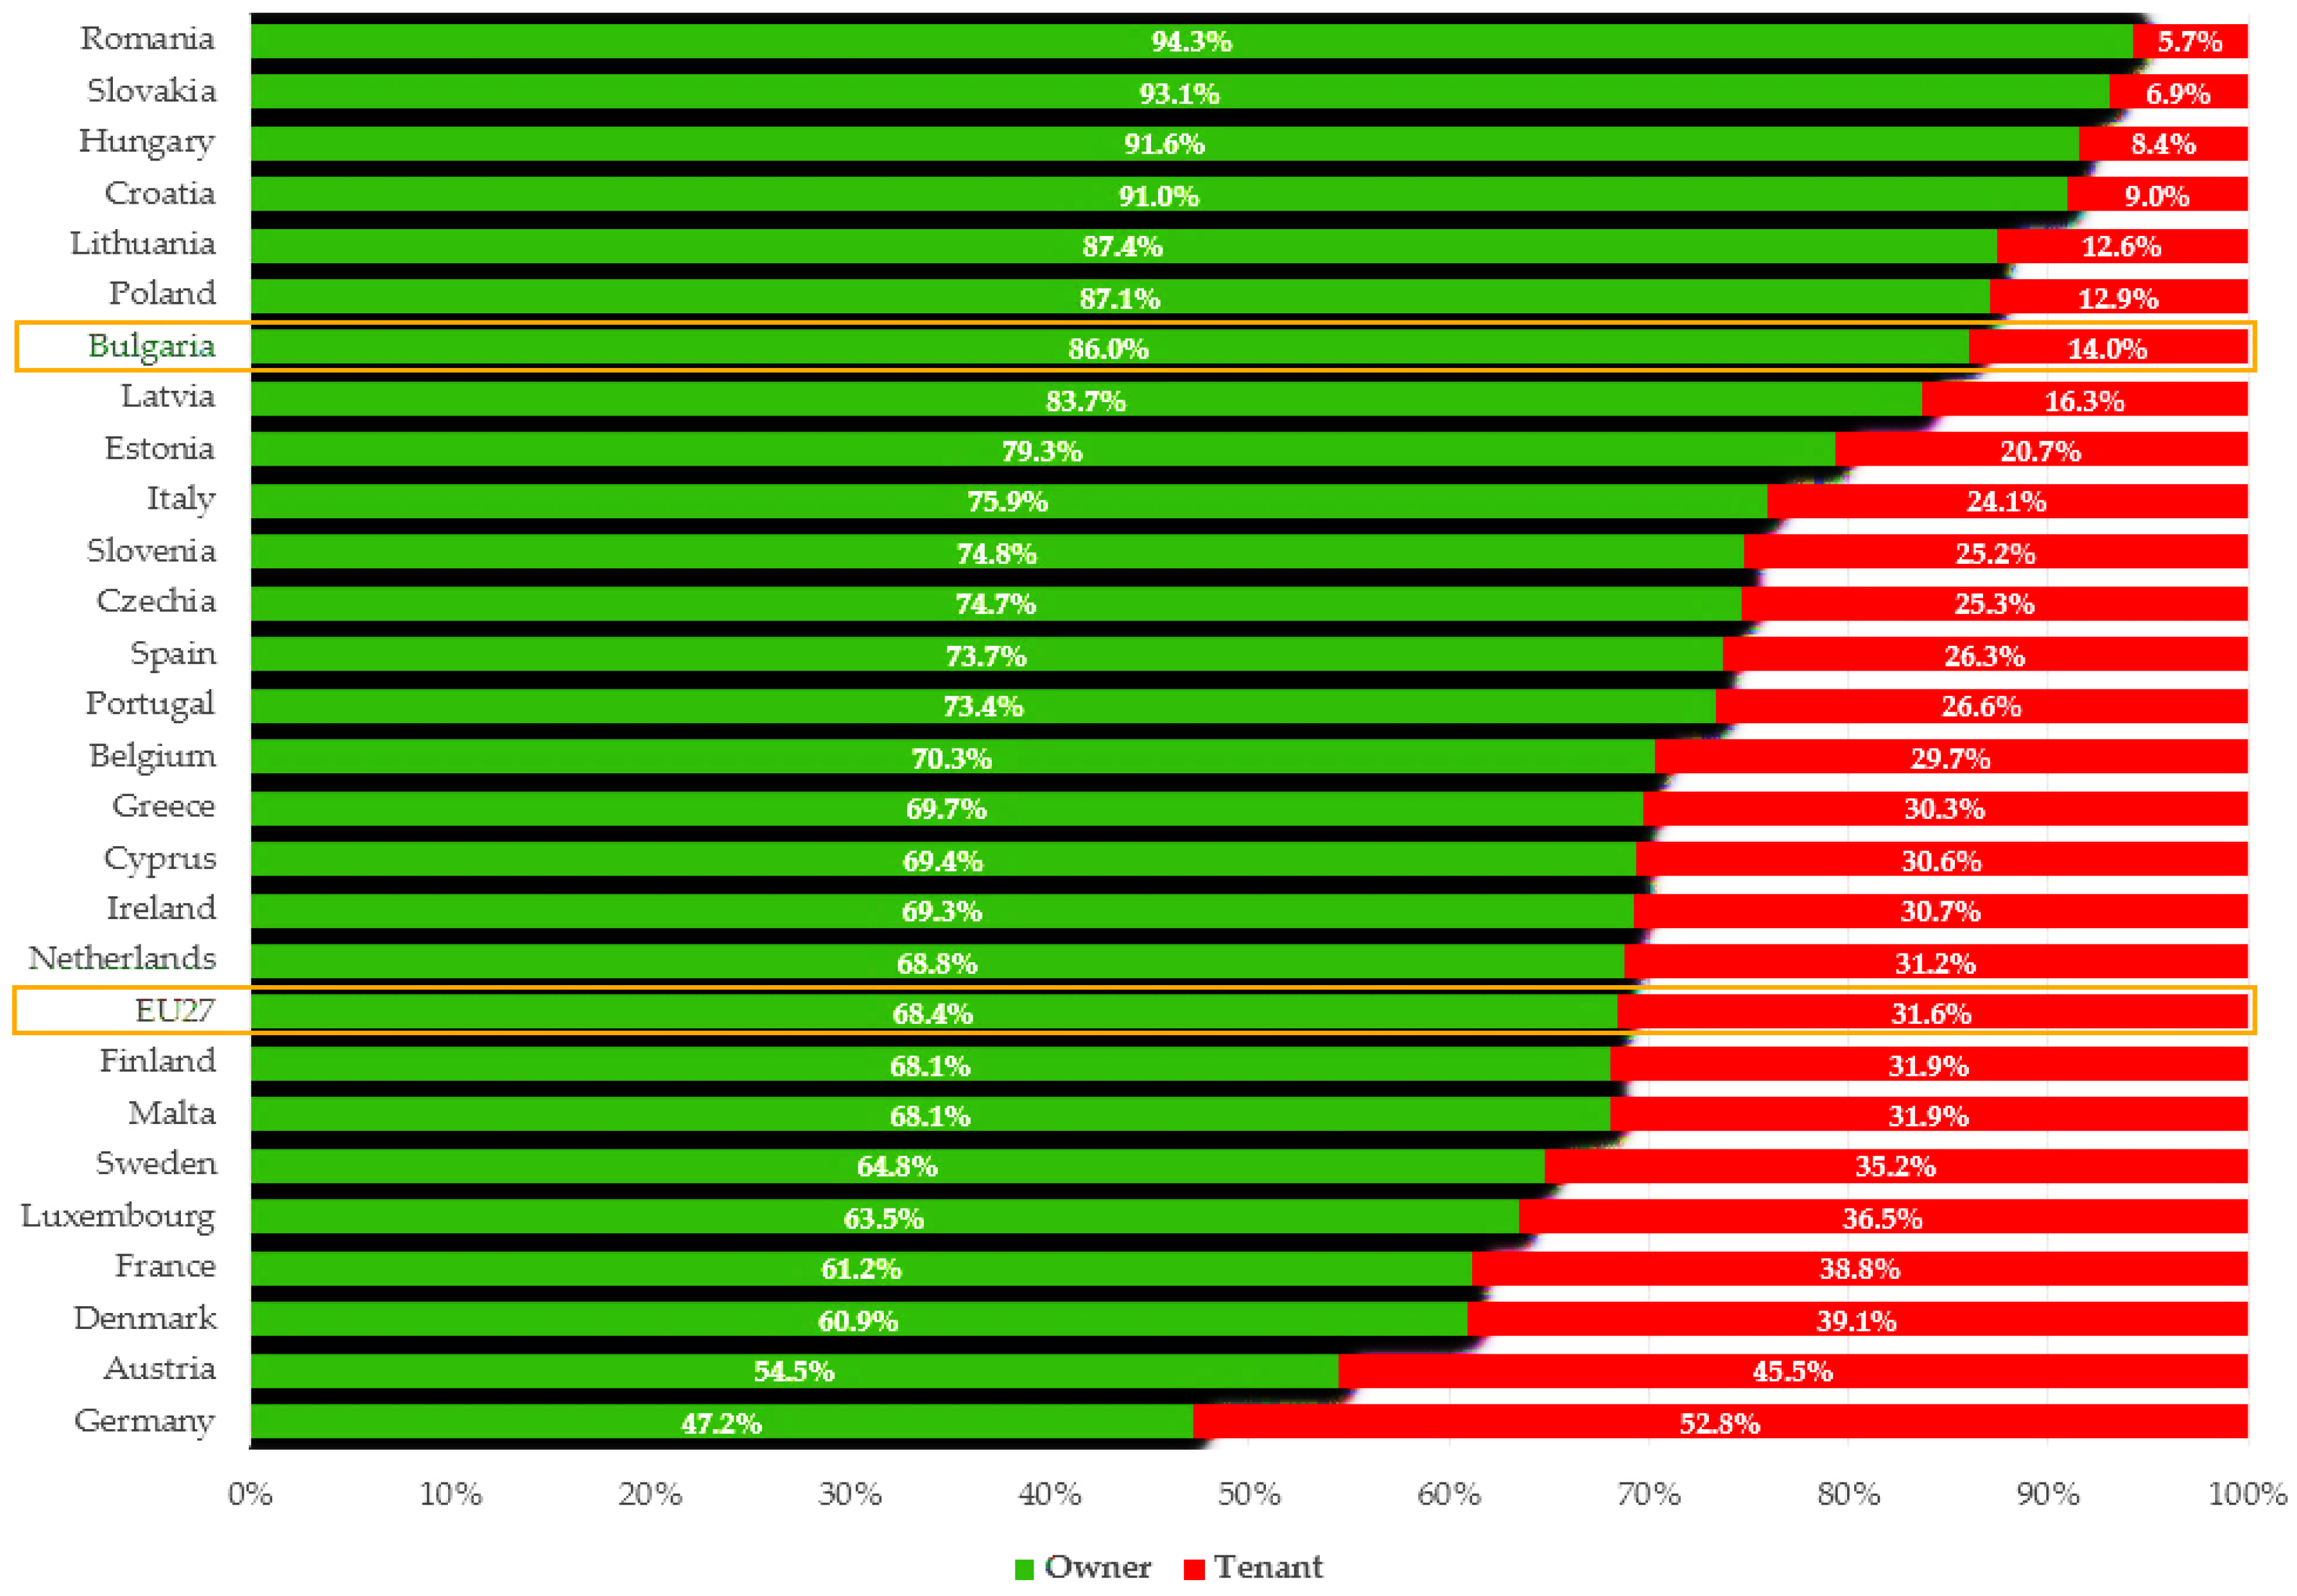
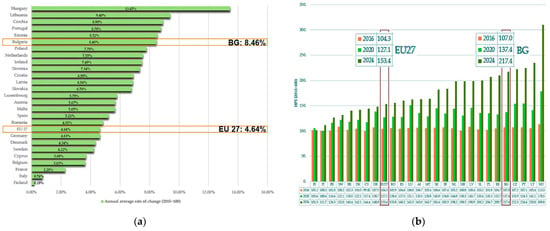
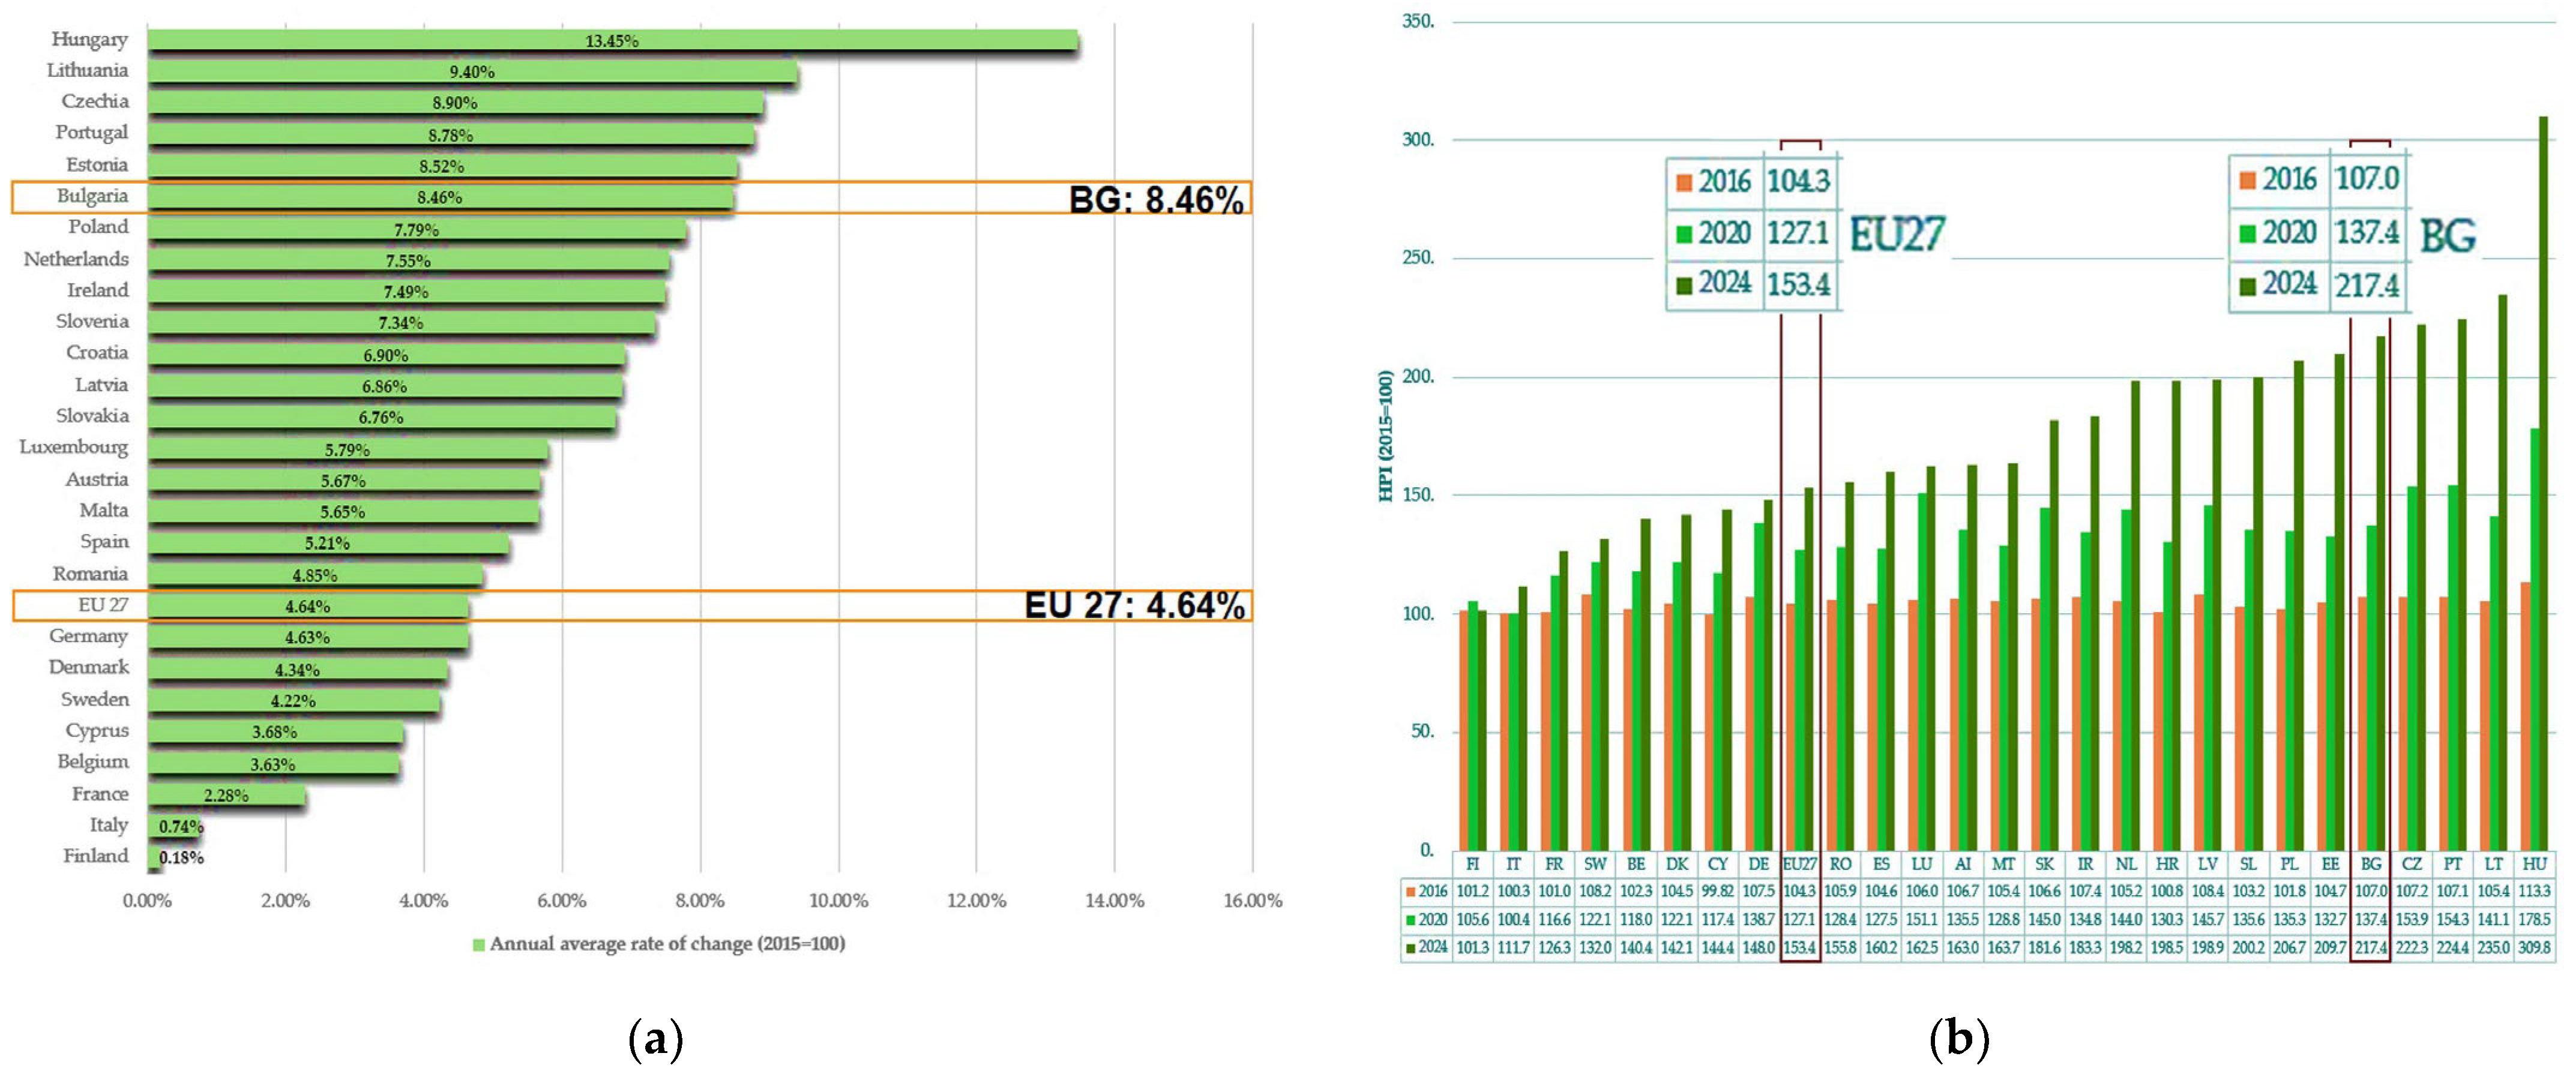
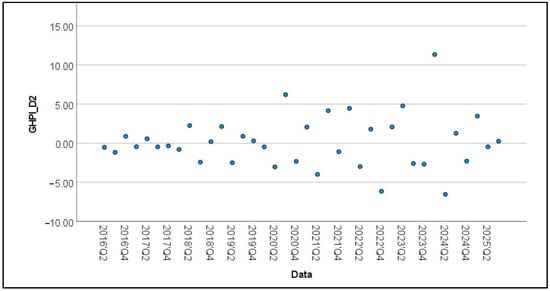
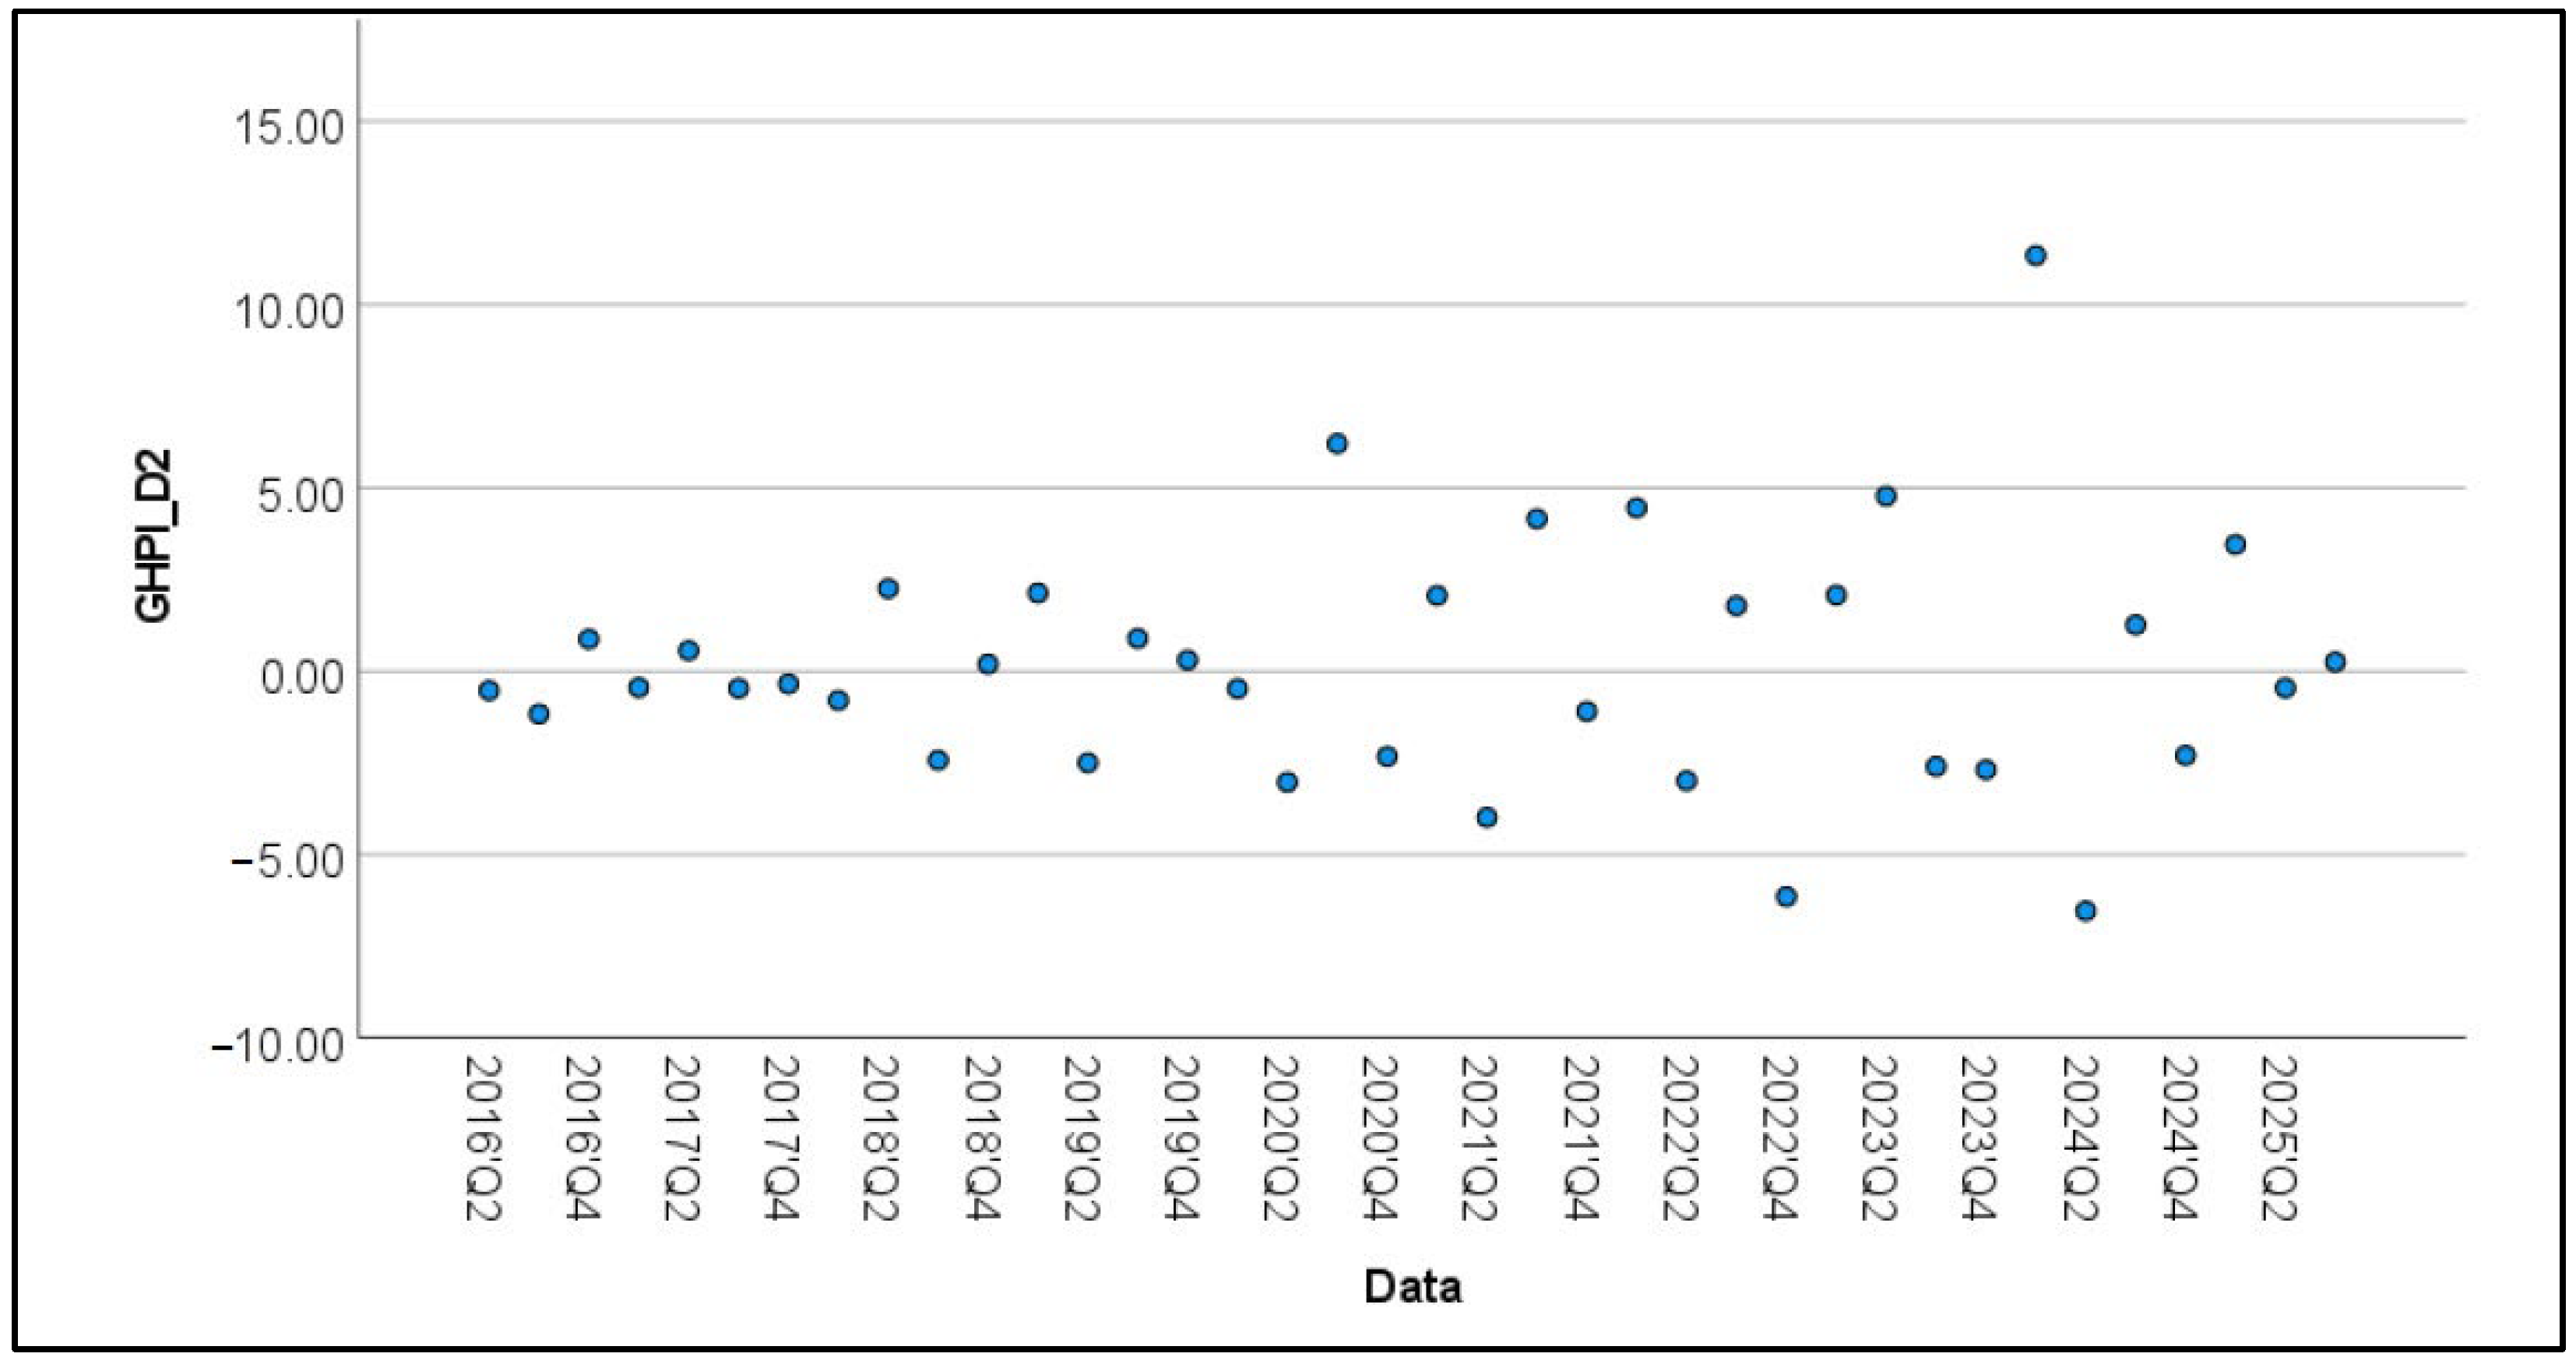
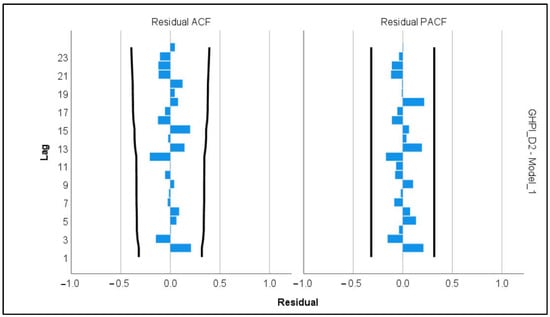
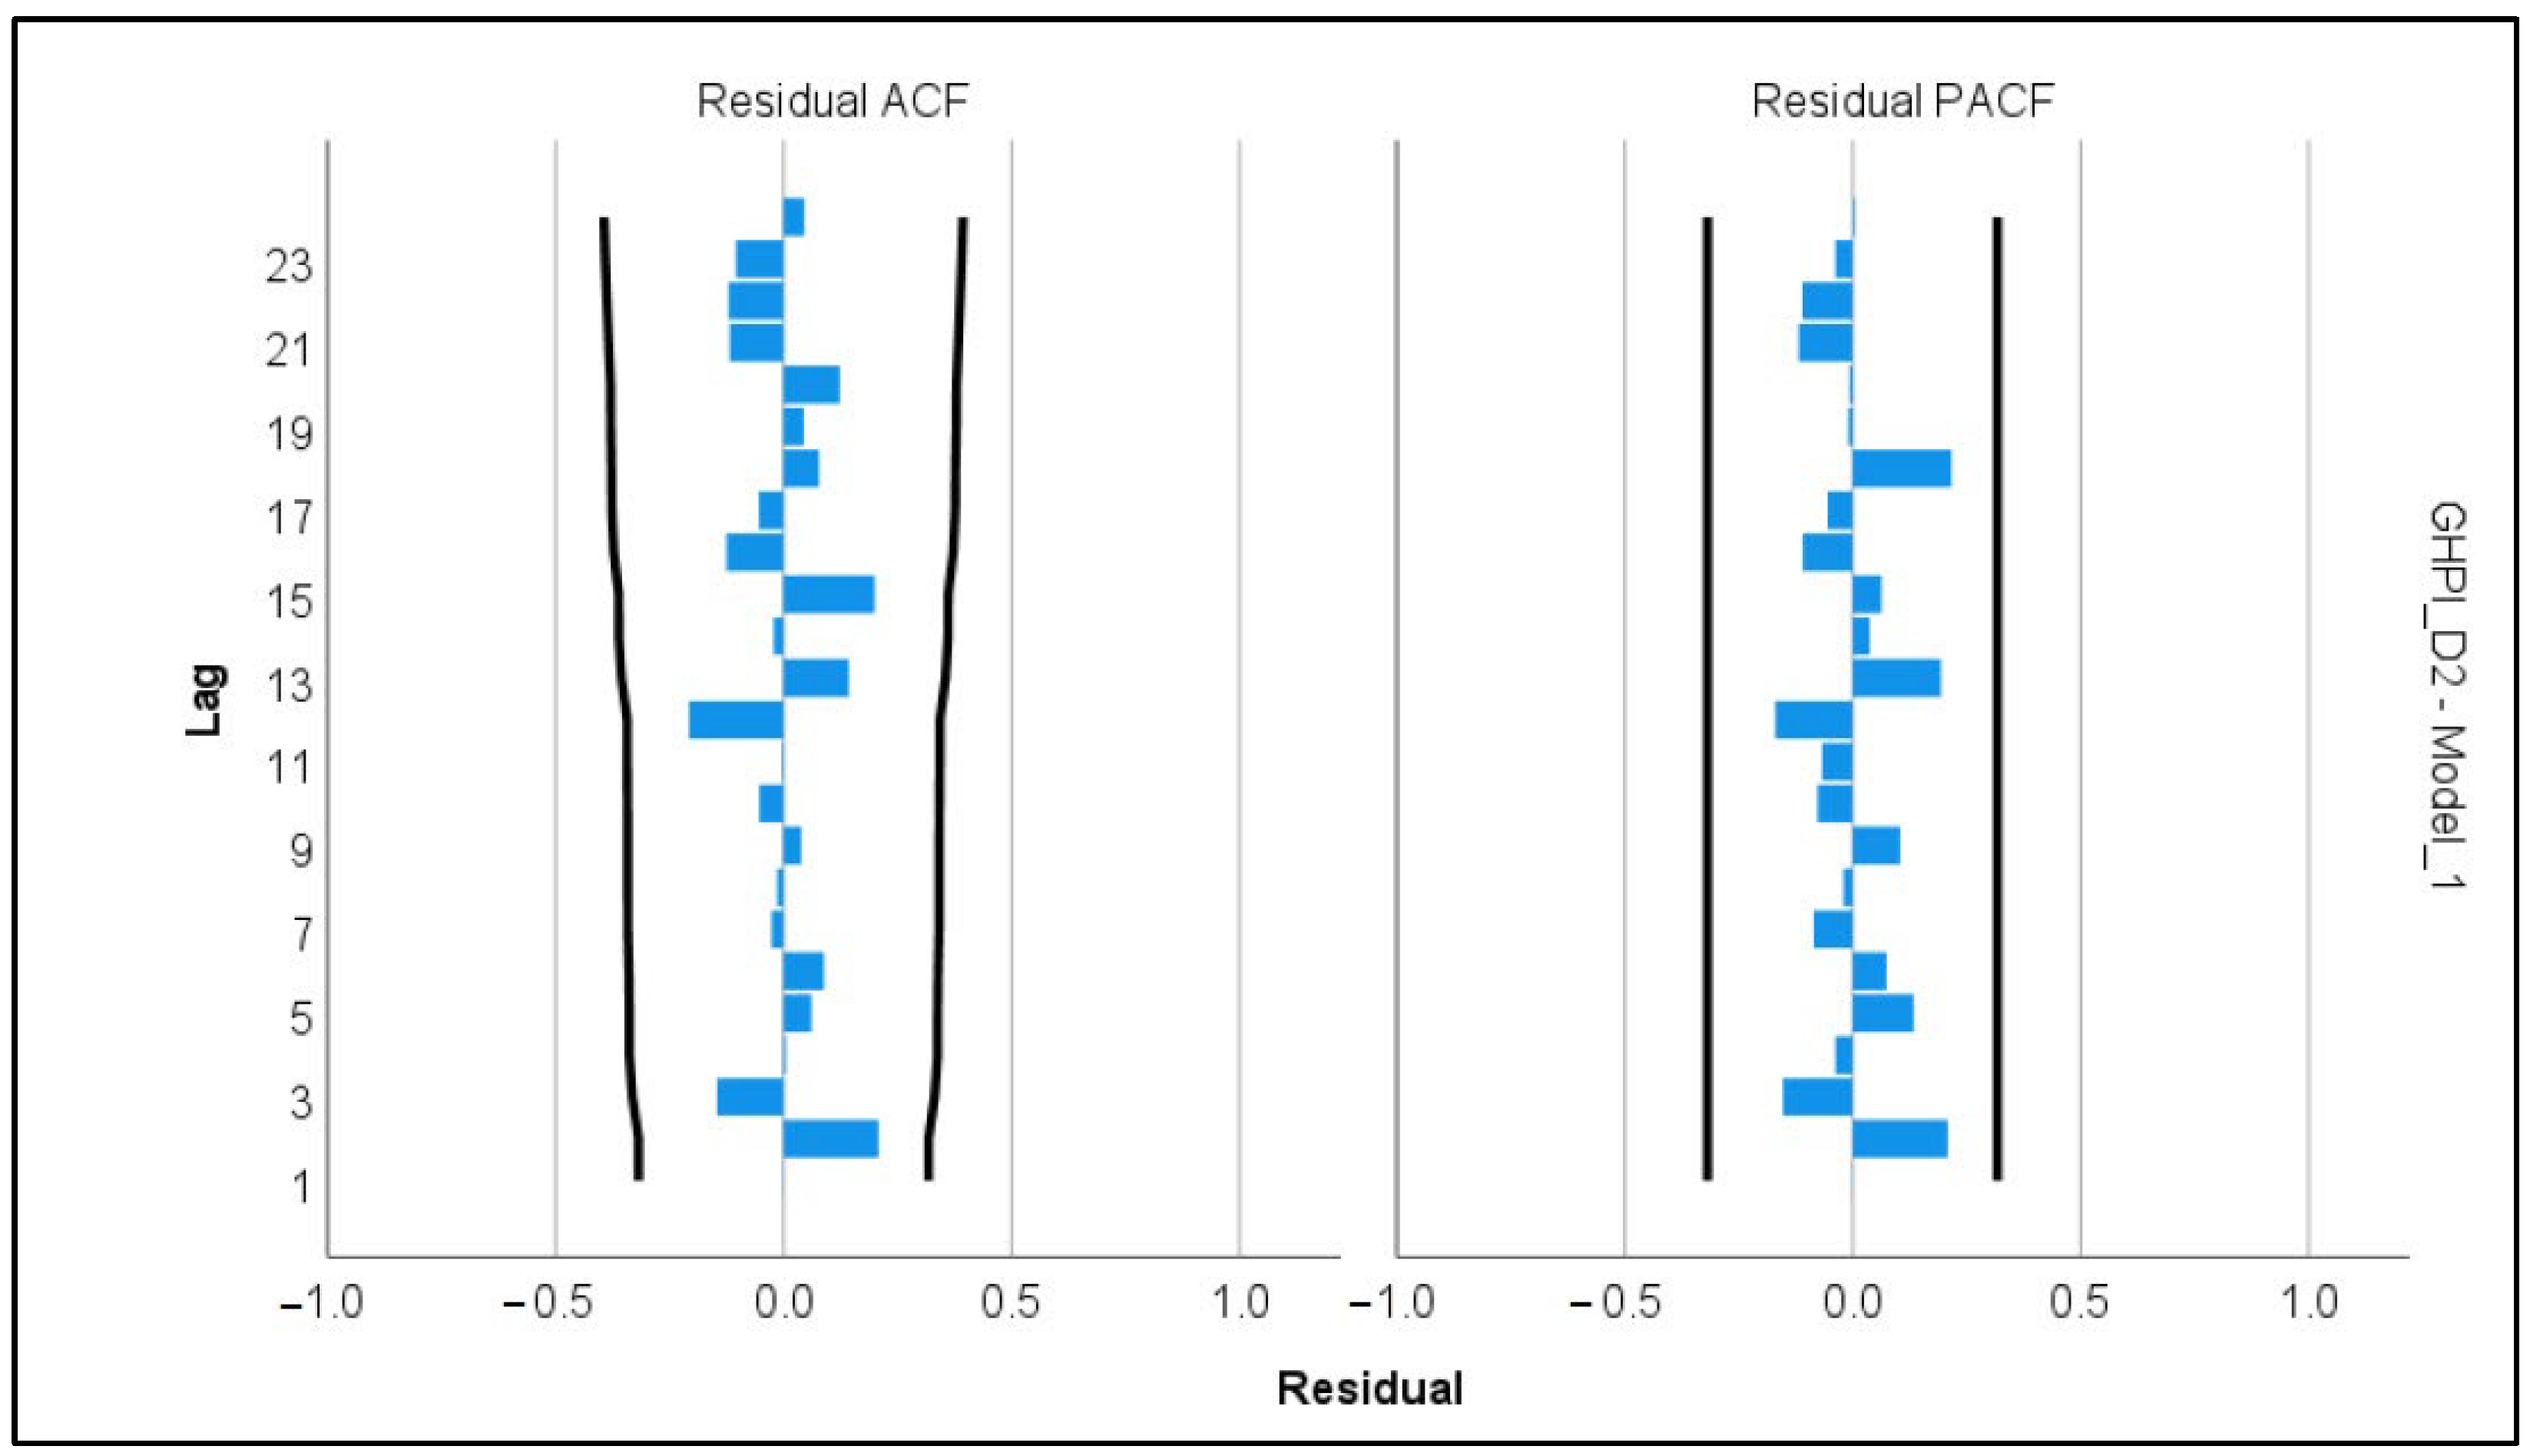

Disclaimer/Publisher’s Note: The statements, opinions and data contained in all publications are solely those of the individual author(s) and contributor(s) and not of MDPI and/or the editor(s). MDPI and/or the editor(s) disclaim responsibility for any injury to people or property resulting from any ideas, methods, instructions or products referred to in the content. |
© 2026 by the authors. Licensee MDPI, Basel, Switzerland. This article is an open access article distributed under the terms and conditions of the Creative Commons Attribution (CC BY) license.