Evaluating Simple Strategies with Mutual Funds and ETFs to Outperform the China’s Shanghai Composite Index (SCI)

Abstract
1. Introduction
- 1.
- Passive investments in the China Composite index (benchmar).
- 2.
- Passive investments in a large-cap domestic mutual fund.
- 3.
- Replicating the mutual fund manager’s portfolio with Exchange-Traded Funds (ETFs. by examining mutual fund annual reports.
- 4.
- Switching between mutual funds based on last year’s performance.
- 5.
- Simple sector rotation strategies with ETFs by investing in top-tier, middle-tier and bottom-tier (by performance) sector ETFs.
2. Literature Review
3. Methodology and Data Sources
- 1.
- Financials (Fin.);
- 2.
- Consumer Staples (Staples);
- 3.
- Energy;
- 4.
- Healthcare (Health);
- 5.
- Industrials (Ind.);
- 6.
- Information Technology (Info);
- 7.
- Materials (Mat.);
- 8.
- Telecommunications (Tele);
- 9.
- Utilities (Util).
- 1.
- Shanghai Composite Index buy-and-hold;
- 2.
- Mutual funds Buy-and-Hold strategy from the largest (by assets) 10 large-cap mutual funds from 2012 to 2024;
- 3.
- Sector ETF replication strategy: replicating last year’s reported mutual fund sector allocations with sector ETFs (ex post; not implementable in real-time);
- 4.
- Top-N strategies: switching between funds based on the previous year’s performance rankings;
- 5.
- Simple sector rotation strategies.
4. Mutual Funds Buy-And-Hold vs. Sector ETF Replication Strategies
4.1. Shanghai Composite Index Buy-And-Hold
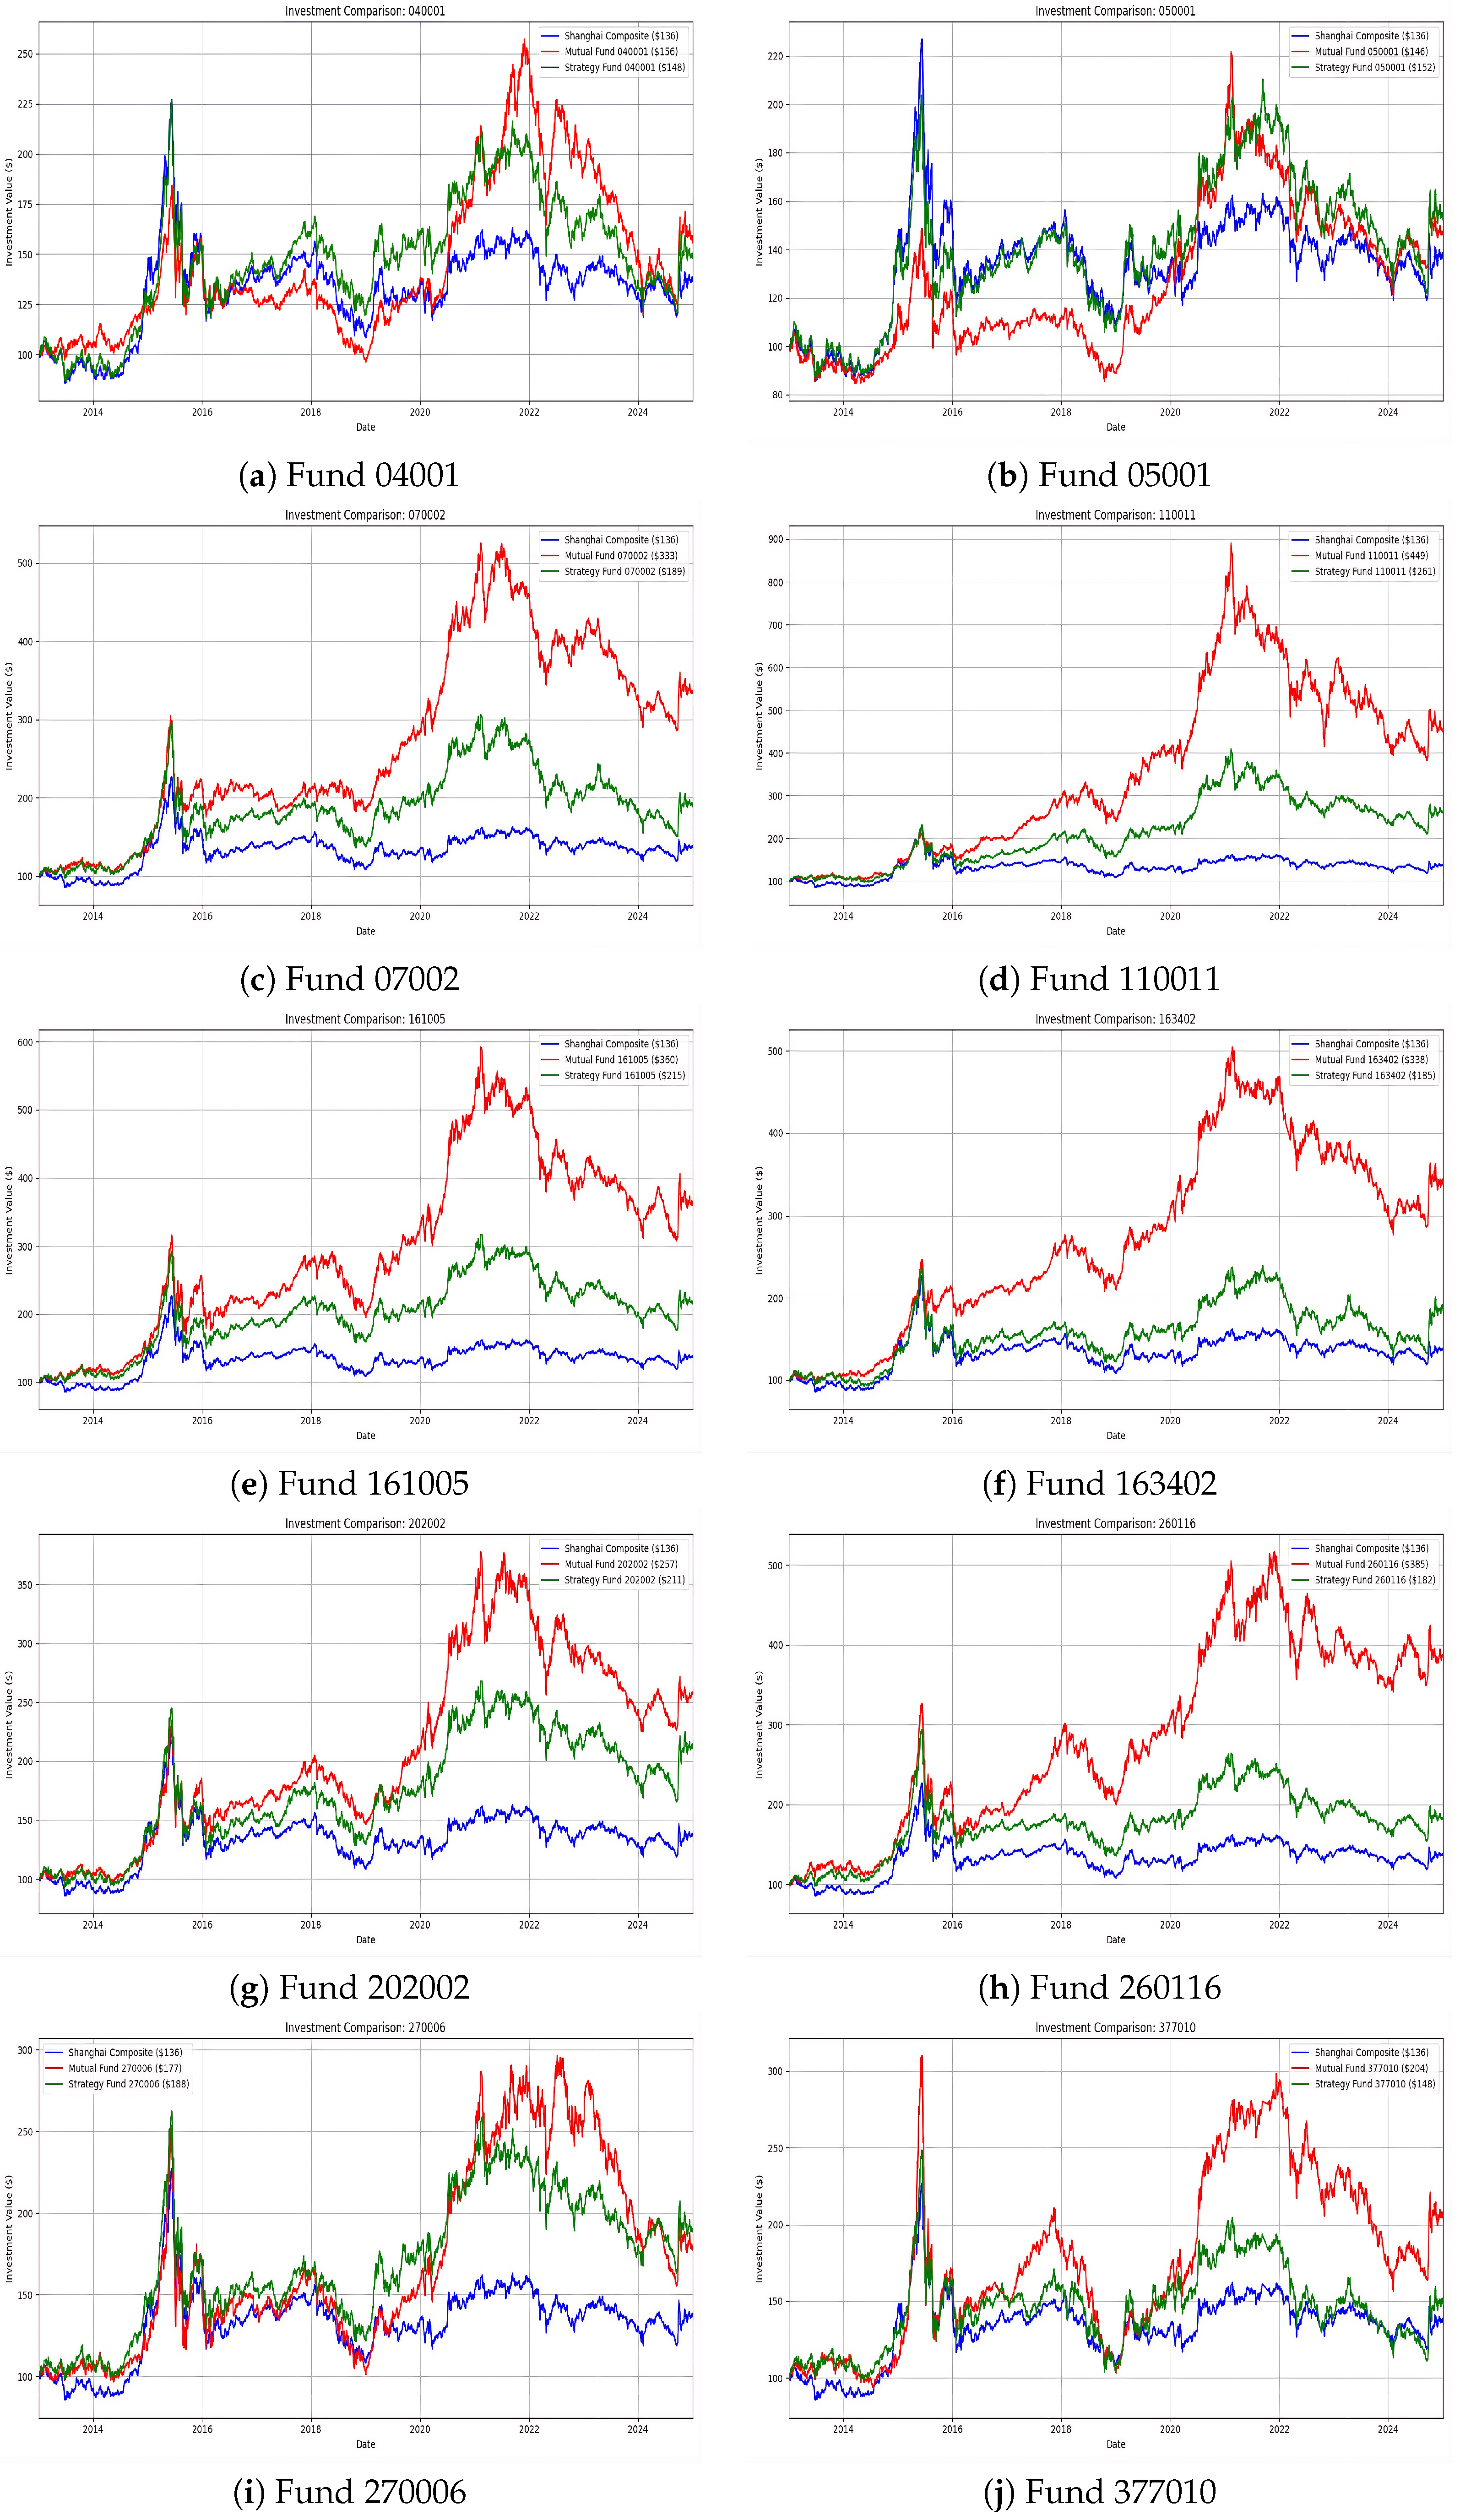
4.2. Mutual Funds Buy-And-Hold Strategy
4.3. Holdings-Based Sector Replication Strategy
| Fin. | Staples | Energy | Health | Ind. | Info | Mat. | Tele | Util | Total |
| 2.74 | 30.84 | 1.59 | 8.77 | 4.46 | 10.30 | 5.75 | 0.19 | 0.06 | 64.7 |
| Fin. | Staples | Energy | Health | Ind. | Info | Mat. | Tele | Util | Total |
| 4.25 | 47.8 | 2.46 | 13.16 | 6.91 | 15.97 | 8.91 | 0.29 | 0.09 | 100.0 |
4.4. Example: Replication Strategy Comparison for the Ten Largest Funds
- 1.
- Buy-and-Hold in the Shanghai’s Composite Index;
- 2.
- Buy-and-Hold in a mutual fund;
- 3.
- use previous year annual reports and construct portfolio for next year using sector ETFs.
5. Top-N Strategies Based on Mutual Fund Performance Rankings
5.1. Performance Persistence Tests in China Equity Funds
5.2. Ranking Signal
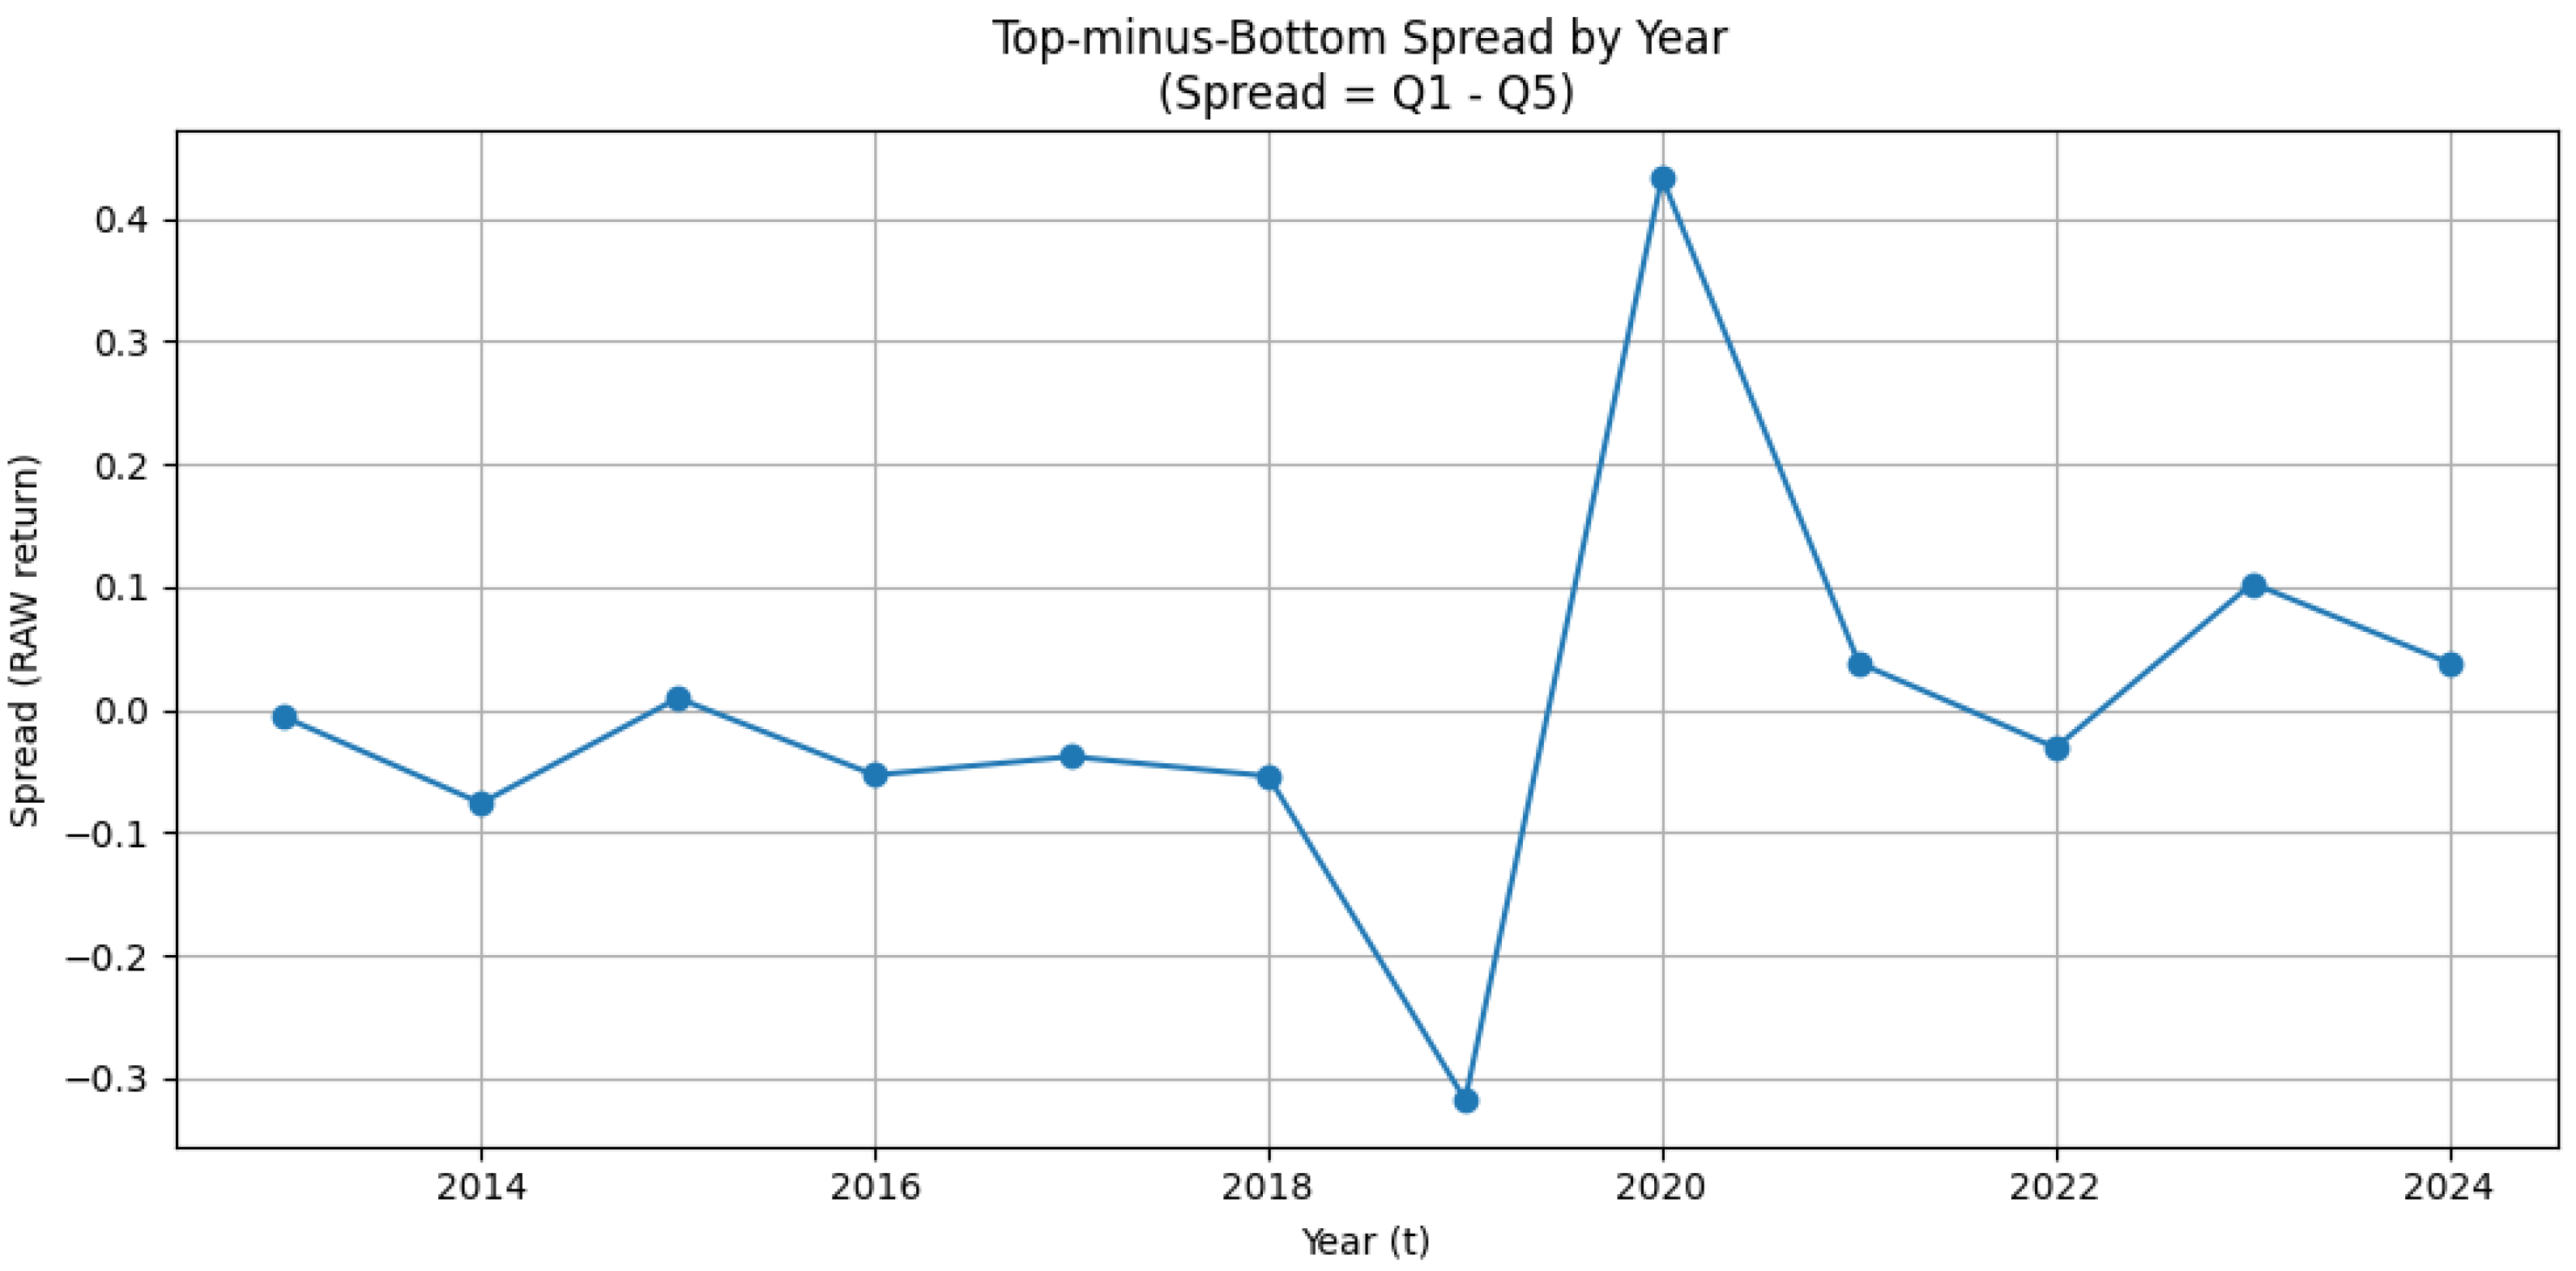
5.2.1. Quintile Portfolios and the Winner-Loser Spread
- 1.
- is the top 20% by .
- 2.
- is the 20–40% by .
- 3.
- is the 40–60% by .
- 4.
- is the 60–80% by .
- 5.
- is the bottom 20% by .
5.2.2. Statistical Inference and Robustness for the Mean Spread
- Null hypothesis: ;
- Alternative: .
- 1.
- Newey–West t-statistic for the mean spread (Newey & West, 1987). This adjusts the error for potential serial correlation and heteroscedasticity in the spread series. We use lag 1 for annual results, and we use lag 3 for monthly results.
- 2.
- Bootstrap p-value (10,000 resamples) (Efron, 1979). The spread observations (years for the annual analysis and months for the monthly analysis) are sampled with replacement from the observed spread series. The mean spread is recomputed for each bootstrap sample. This gives a bootstrap p-value for whether the mean spread is ≤0.
- 3.
- Sign-flip p-value (10,000 randomization) (Sprent & Smeeten, 2007). Each spread observation (year for the annual analysis and month for the monthly analysis) is randomly multiplied by or to construct a null distribution that removes systematic direction while keeping the magnitudes. The sign-flip p-value is the fraction of randomization in which the mean spread is ≤0.
5.2.3. Persistence in Ranks: Transition Matrix and Pooled Chi-Square Test
5.2.4. Defensiveness: Survival Rate from to t
5.2.5. Summary of Analysis Results
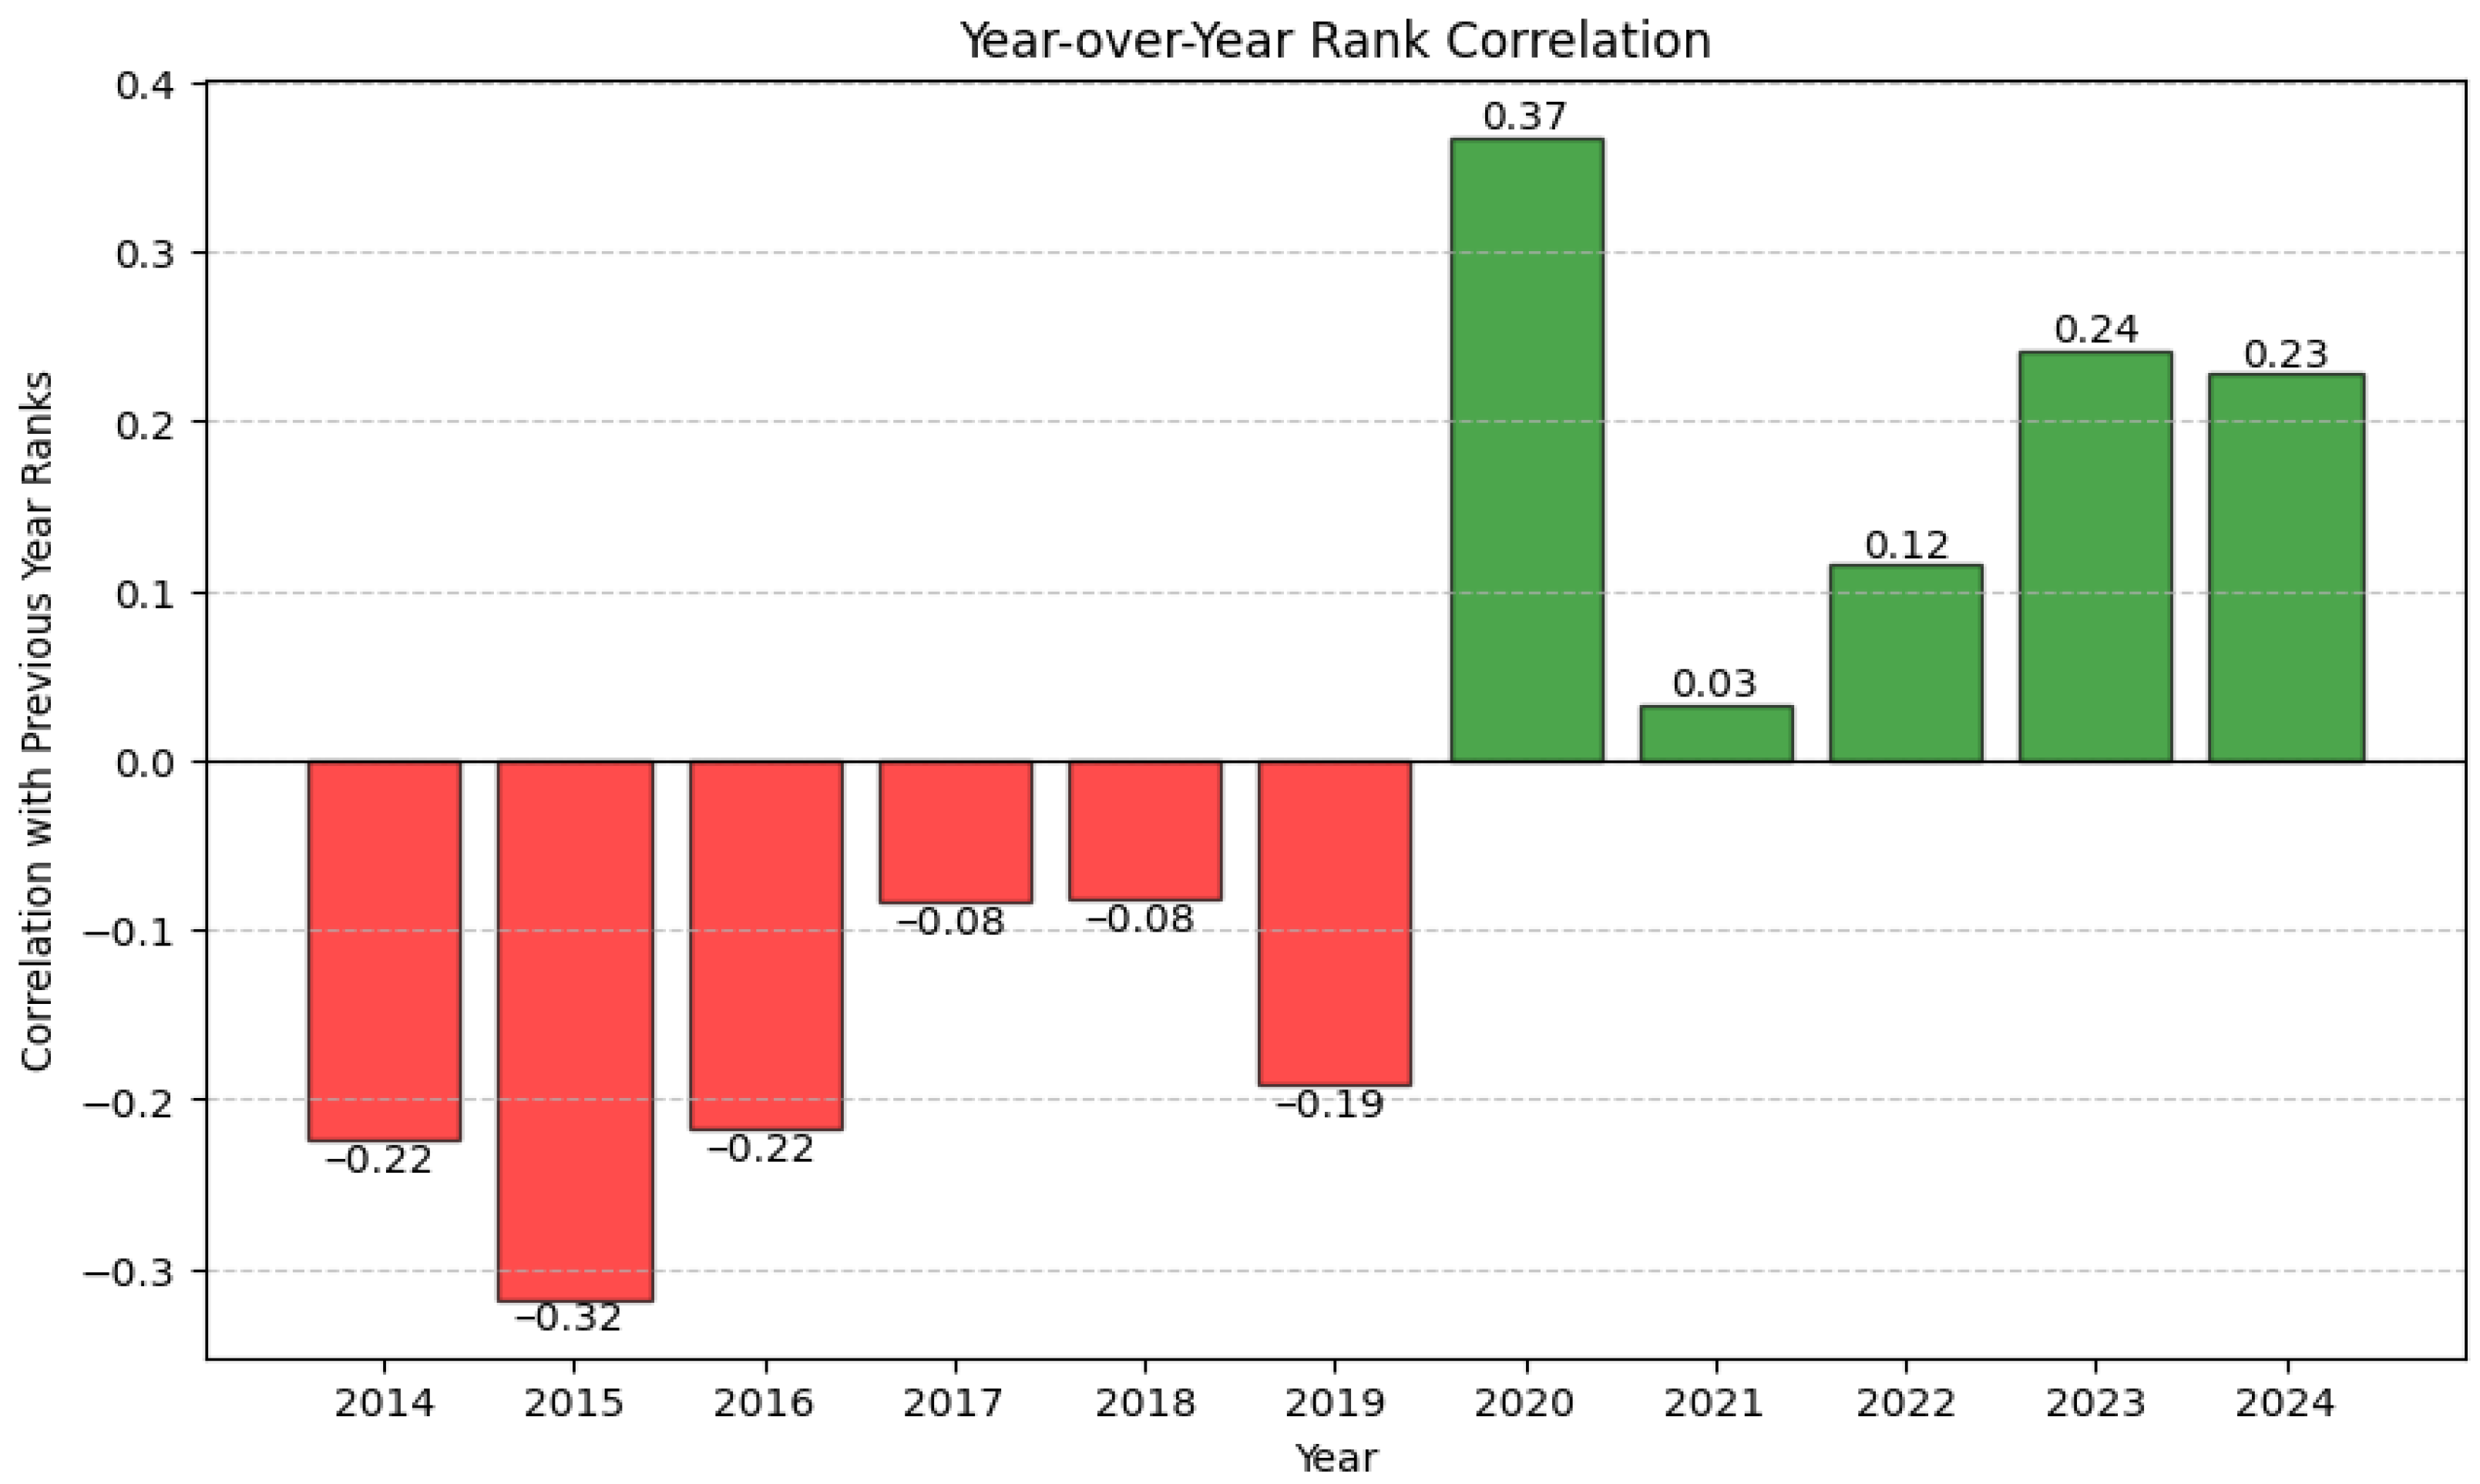
5.2.6. Correlations
6. “Winners”, “Median” and “Losers” Sector Rotation Strategies
- 1.
- “Winners” (W) strategy: always invest in the top (by return) three ETFs;
- 2.
- “Median” (M) strategy: always invest in the middle-performing (by return) three ETFs;
- 3.
- “Losers” (L) strategy: always invest in the worst (by return) three ETFs.
6.1. Growth Comparison
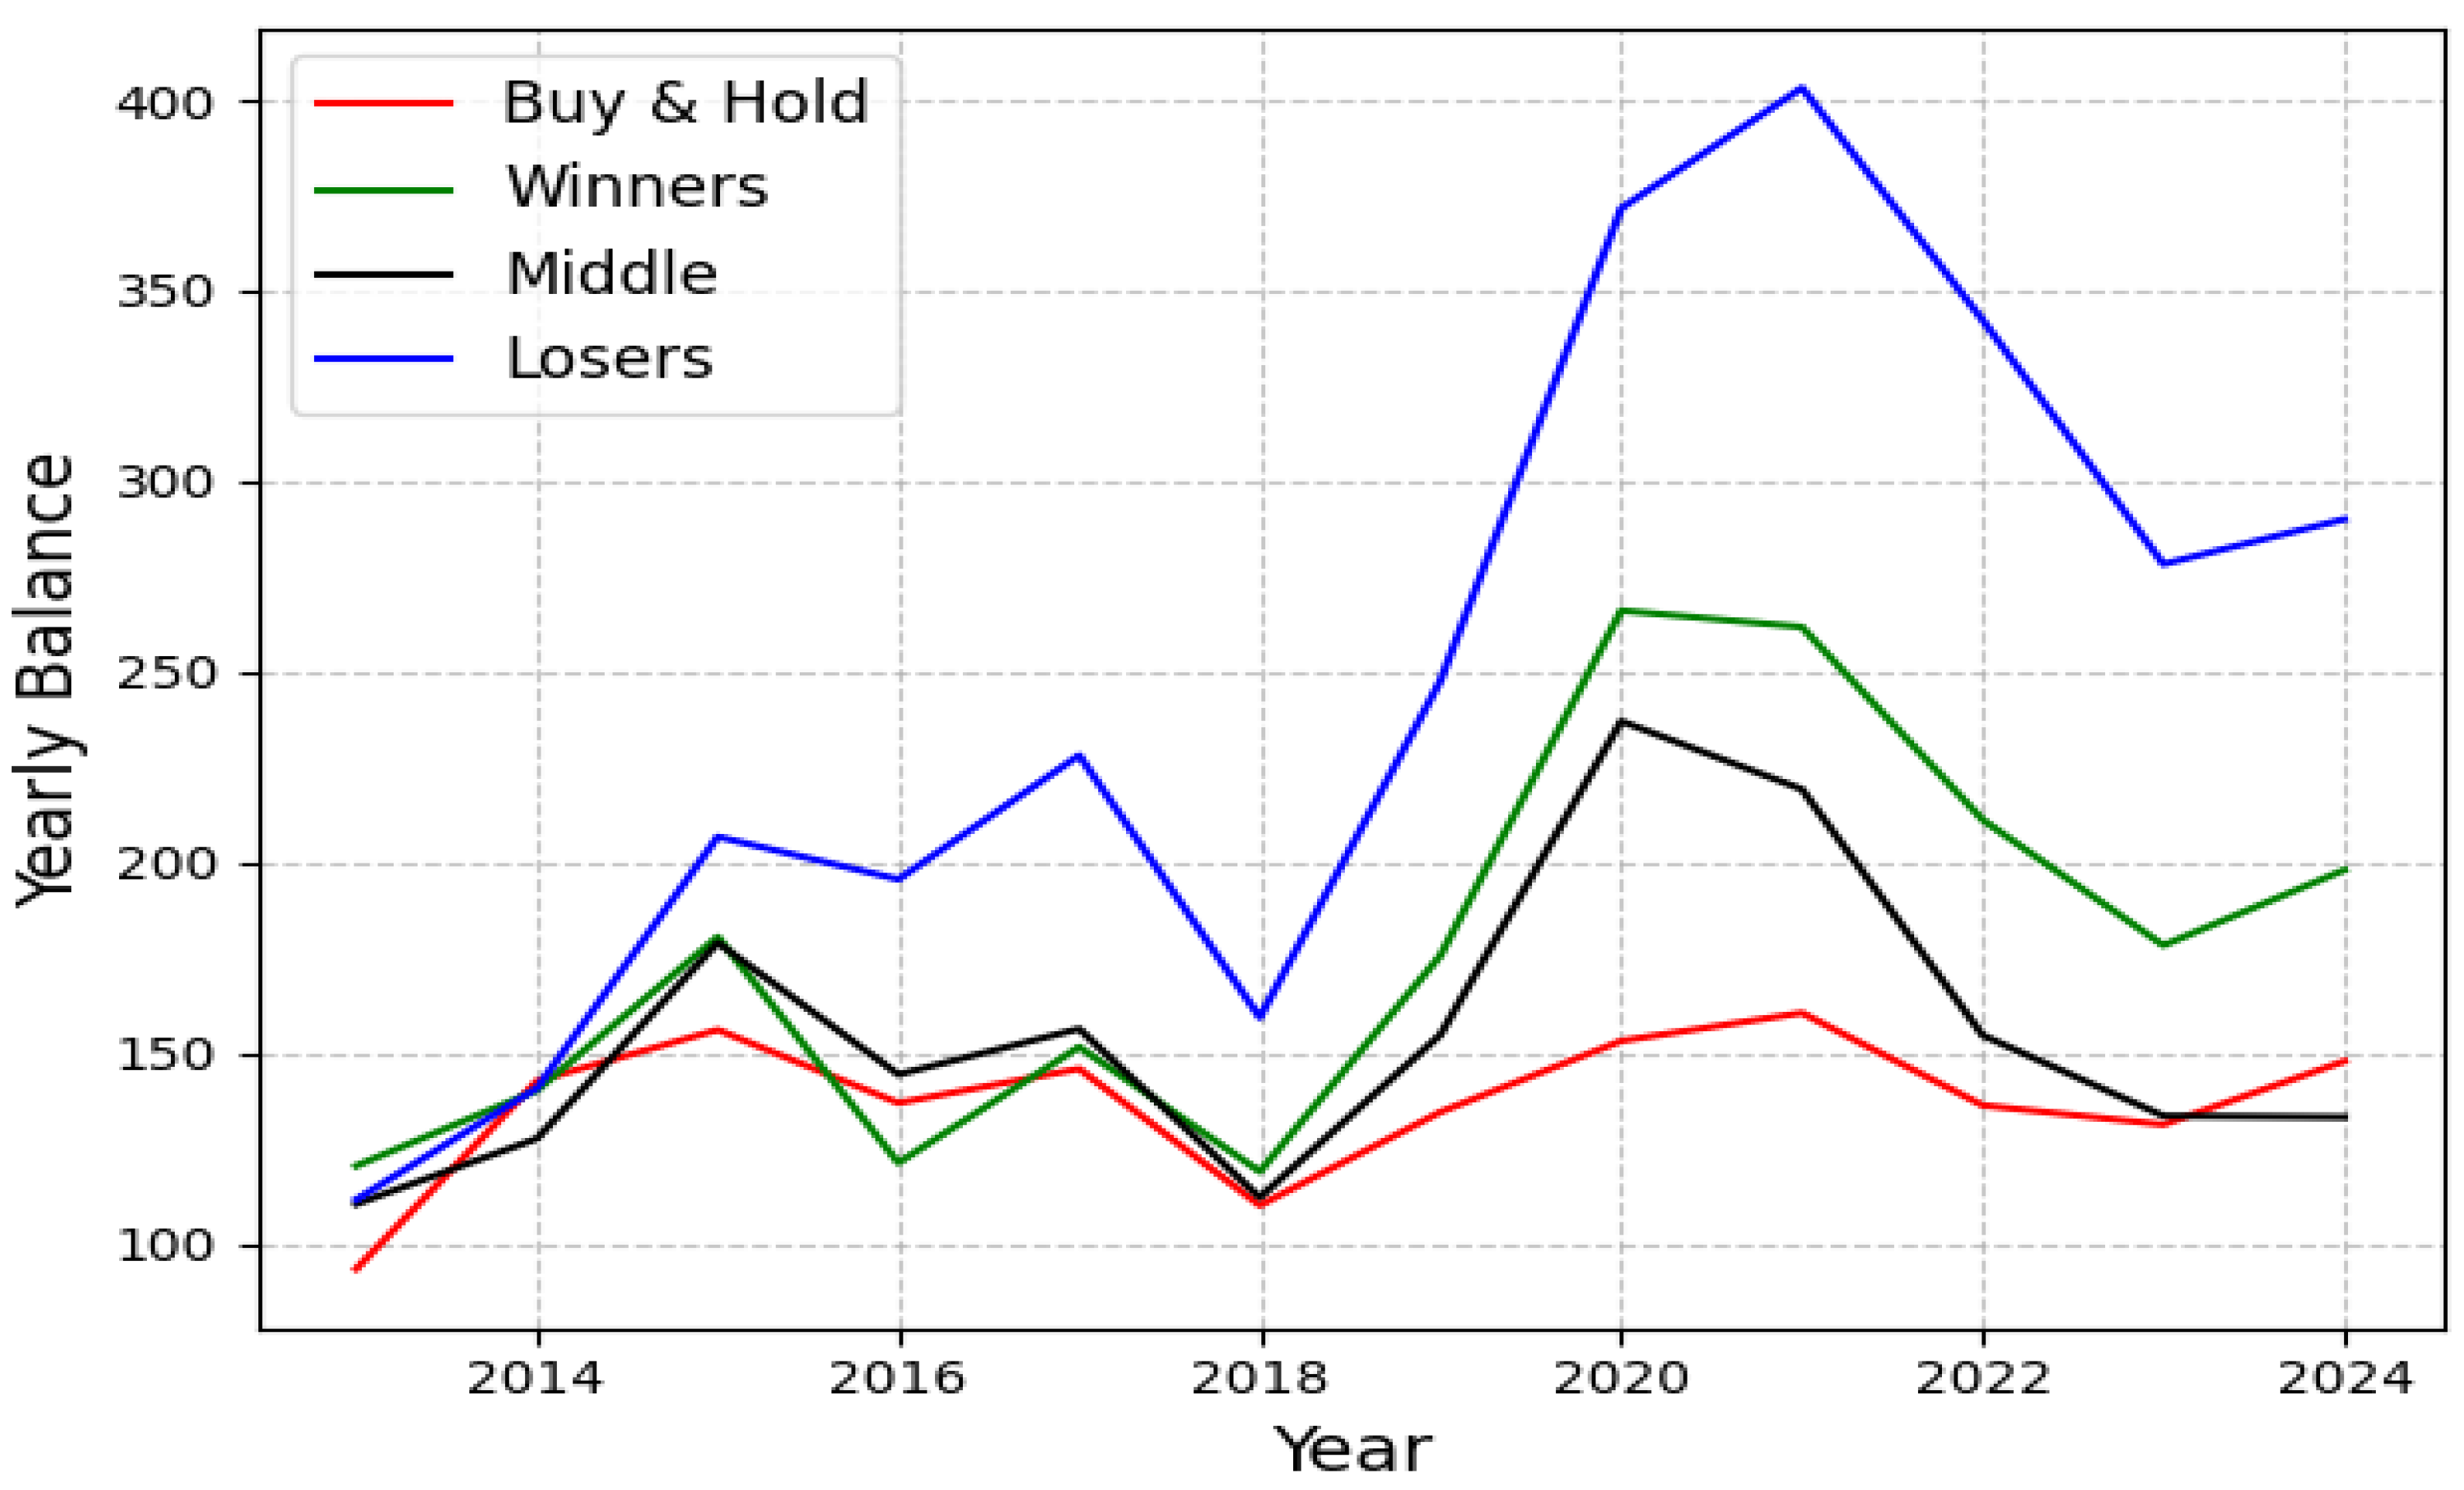
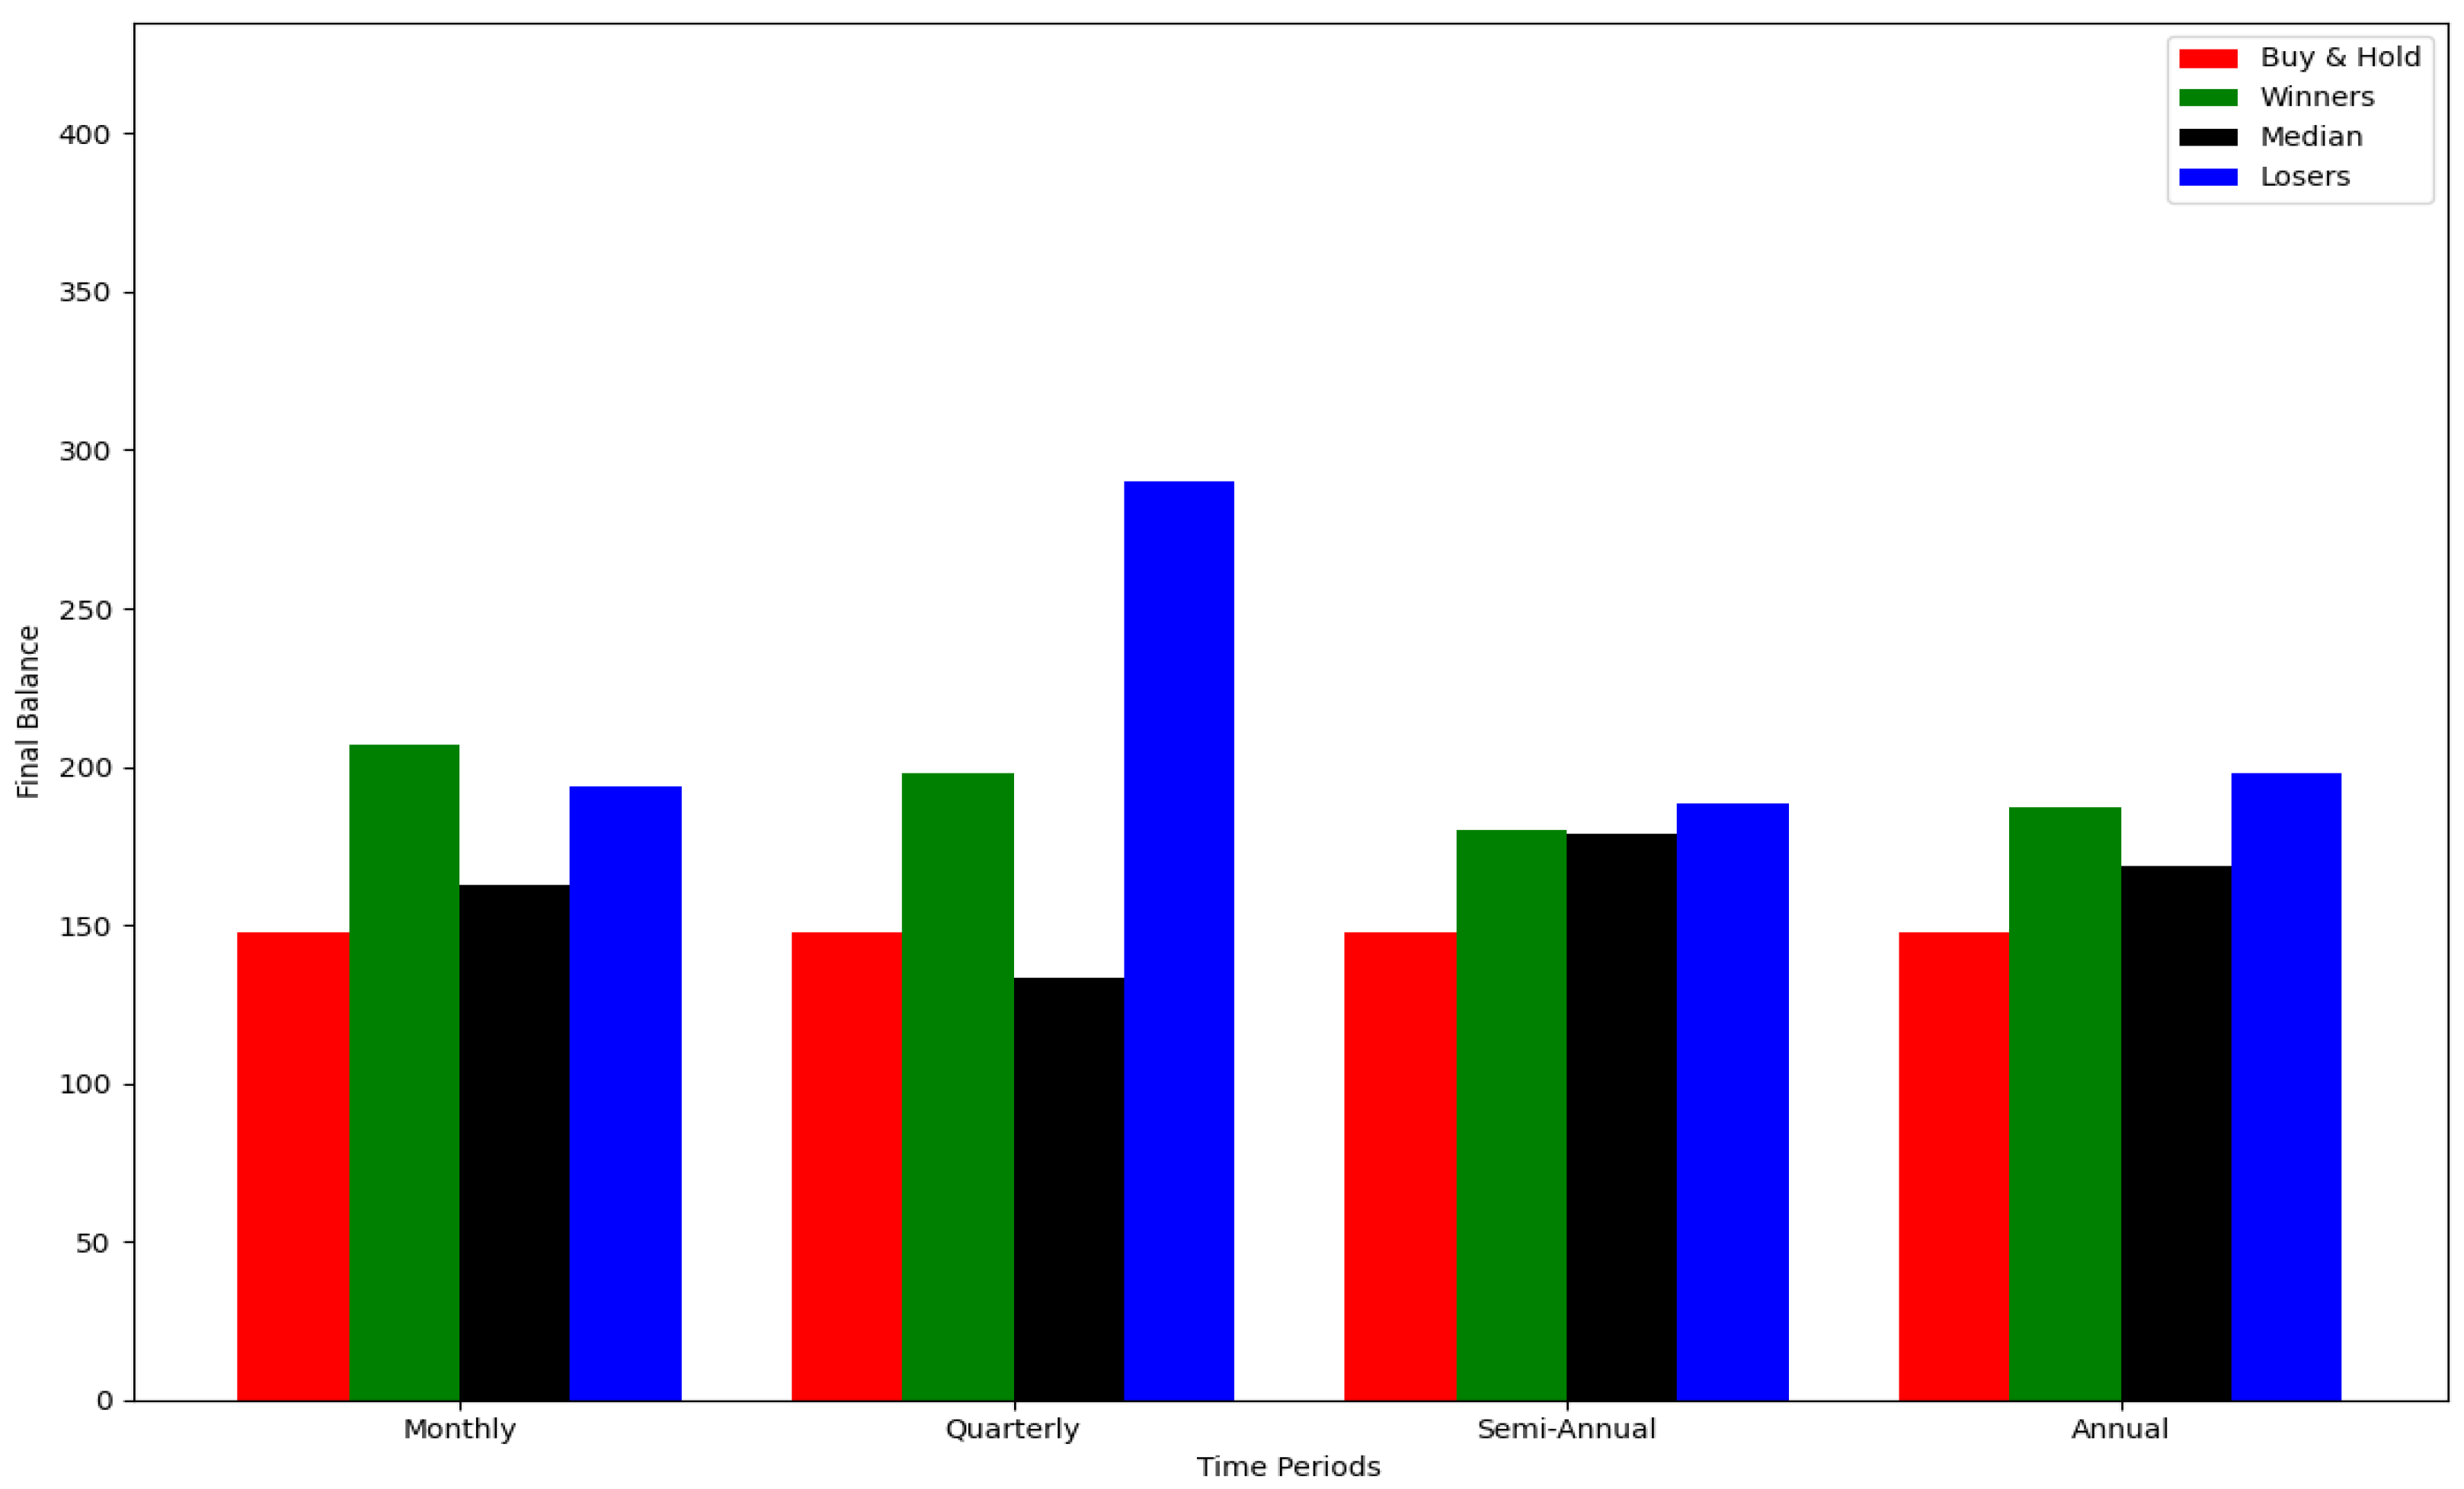
- Annual and Semi-Annual: The gap between groups narrows. “Winners”, “Median”, and “Losers” all cluster in a tighter band. With annual rebalancing, the “Winners” strategy delivers $187, and the “Losers” strategy delivers $198. With semi-annual rebalancing, the “Winners” and “Losers” strategies deliver $180 and $189, respectively.
- Quarterly: The “Losers” strategy notably outperforms ($290) compared to the “Winners” ($198) and “Median” ($133), highlighting the episodic nature of momentum reversals.
- Monthly: The “Winners” yield the highest cash value ($207), outperforming “Losers” ($194) and “Median” ($163) results, respectively.
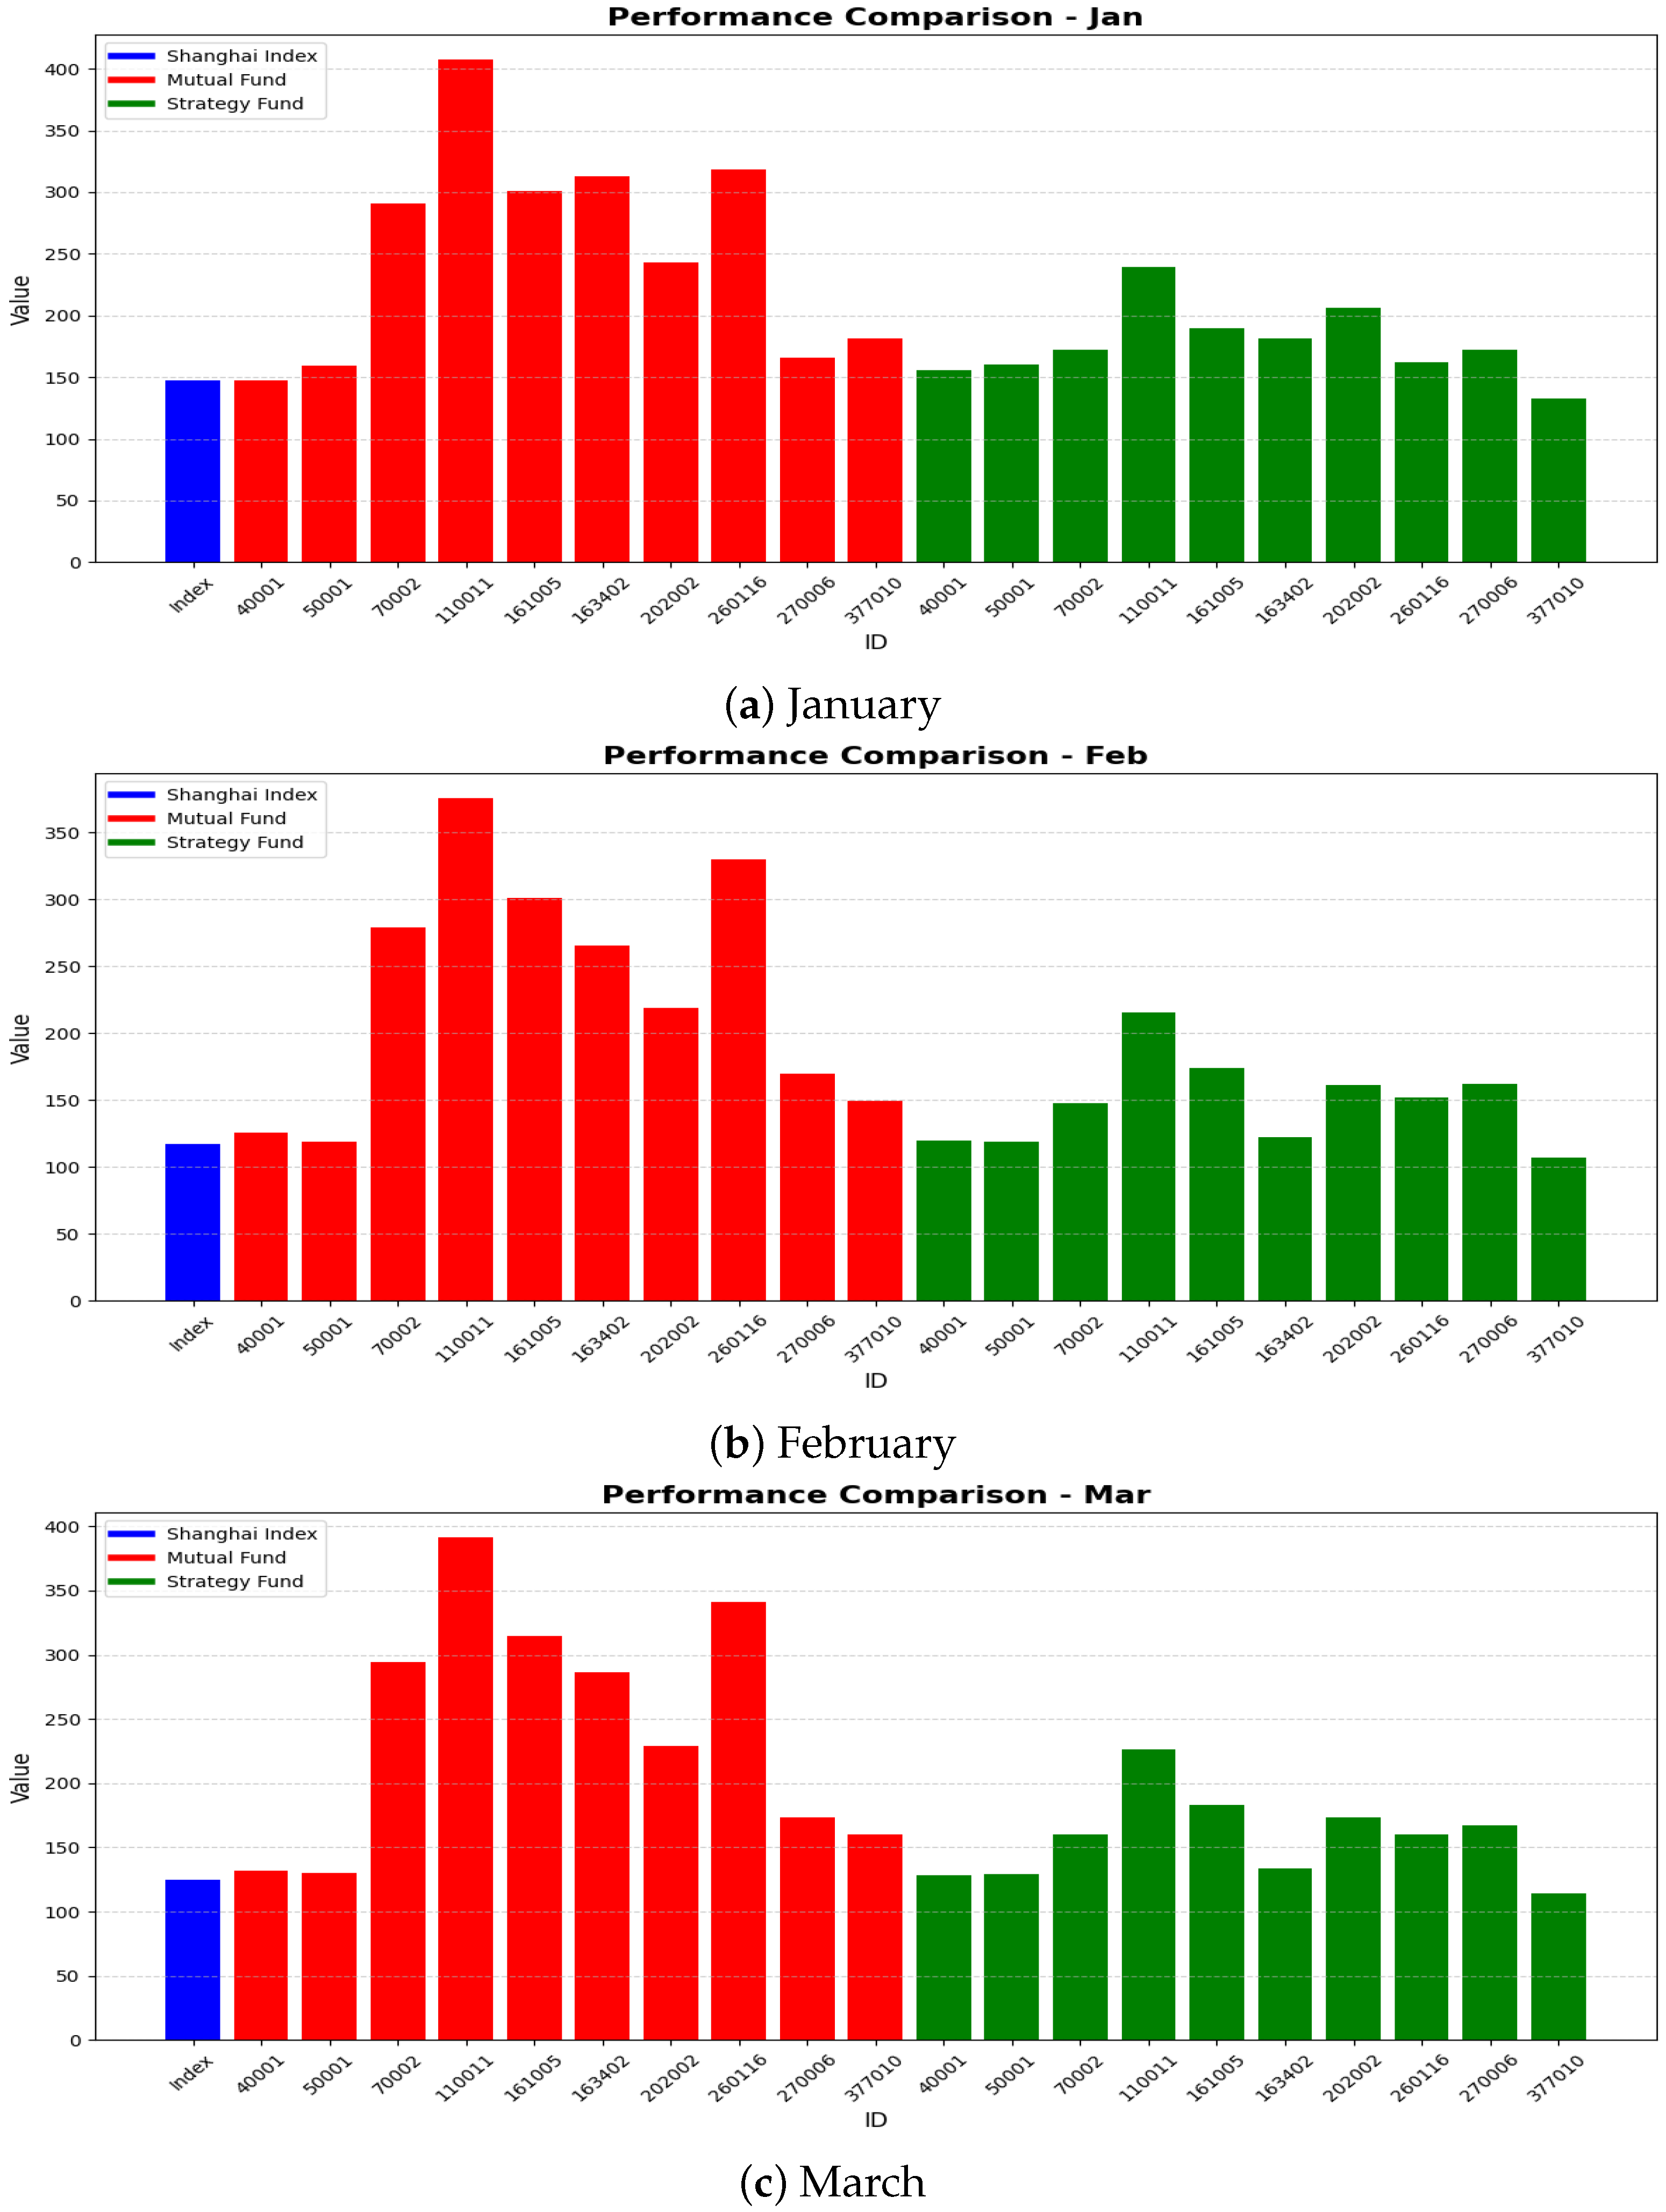
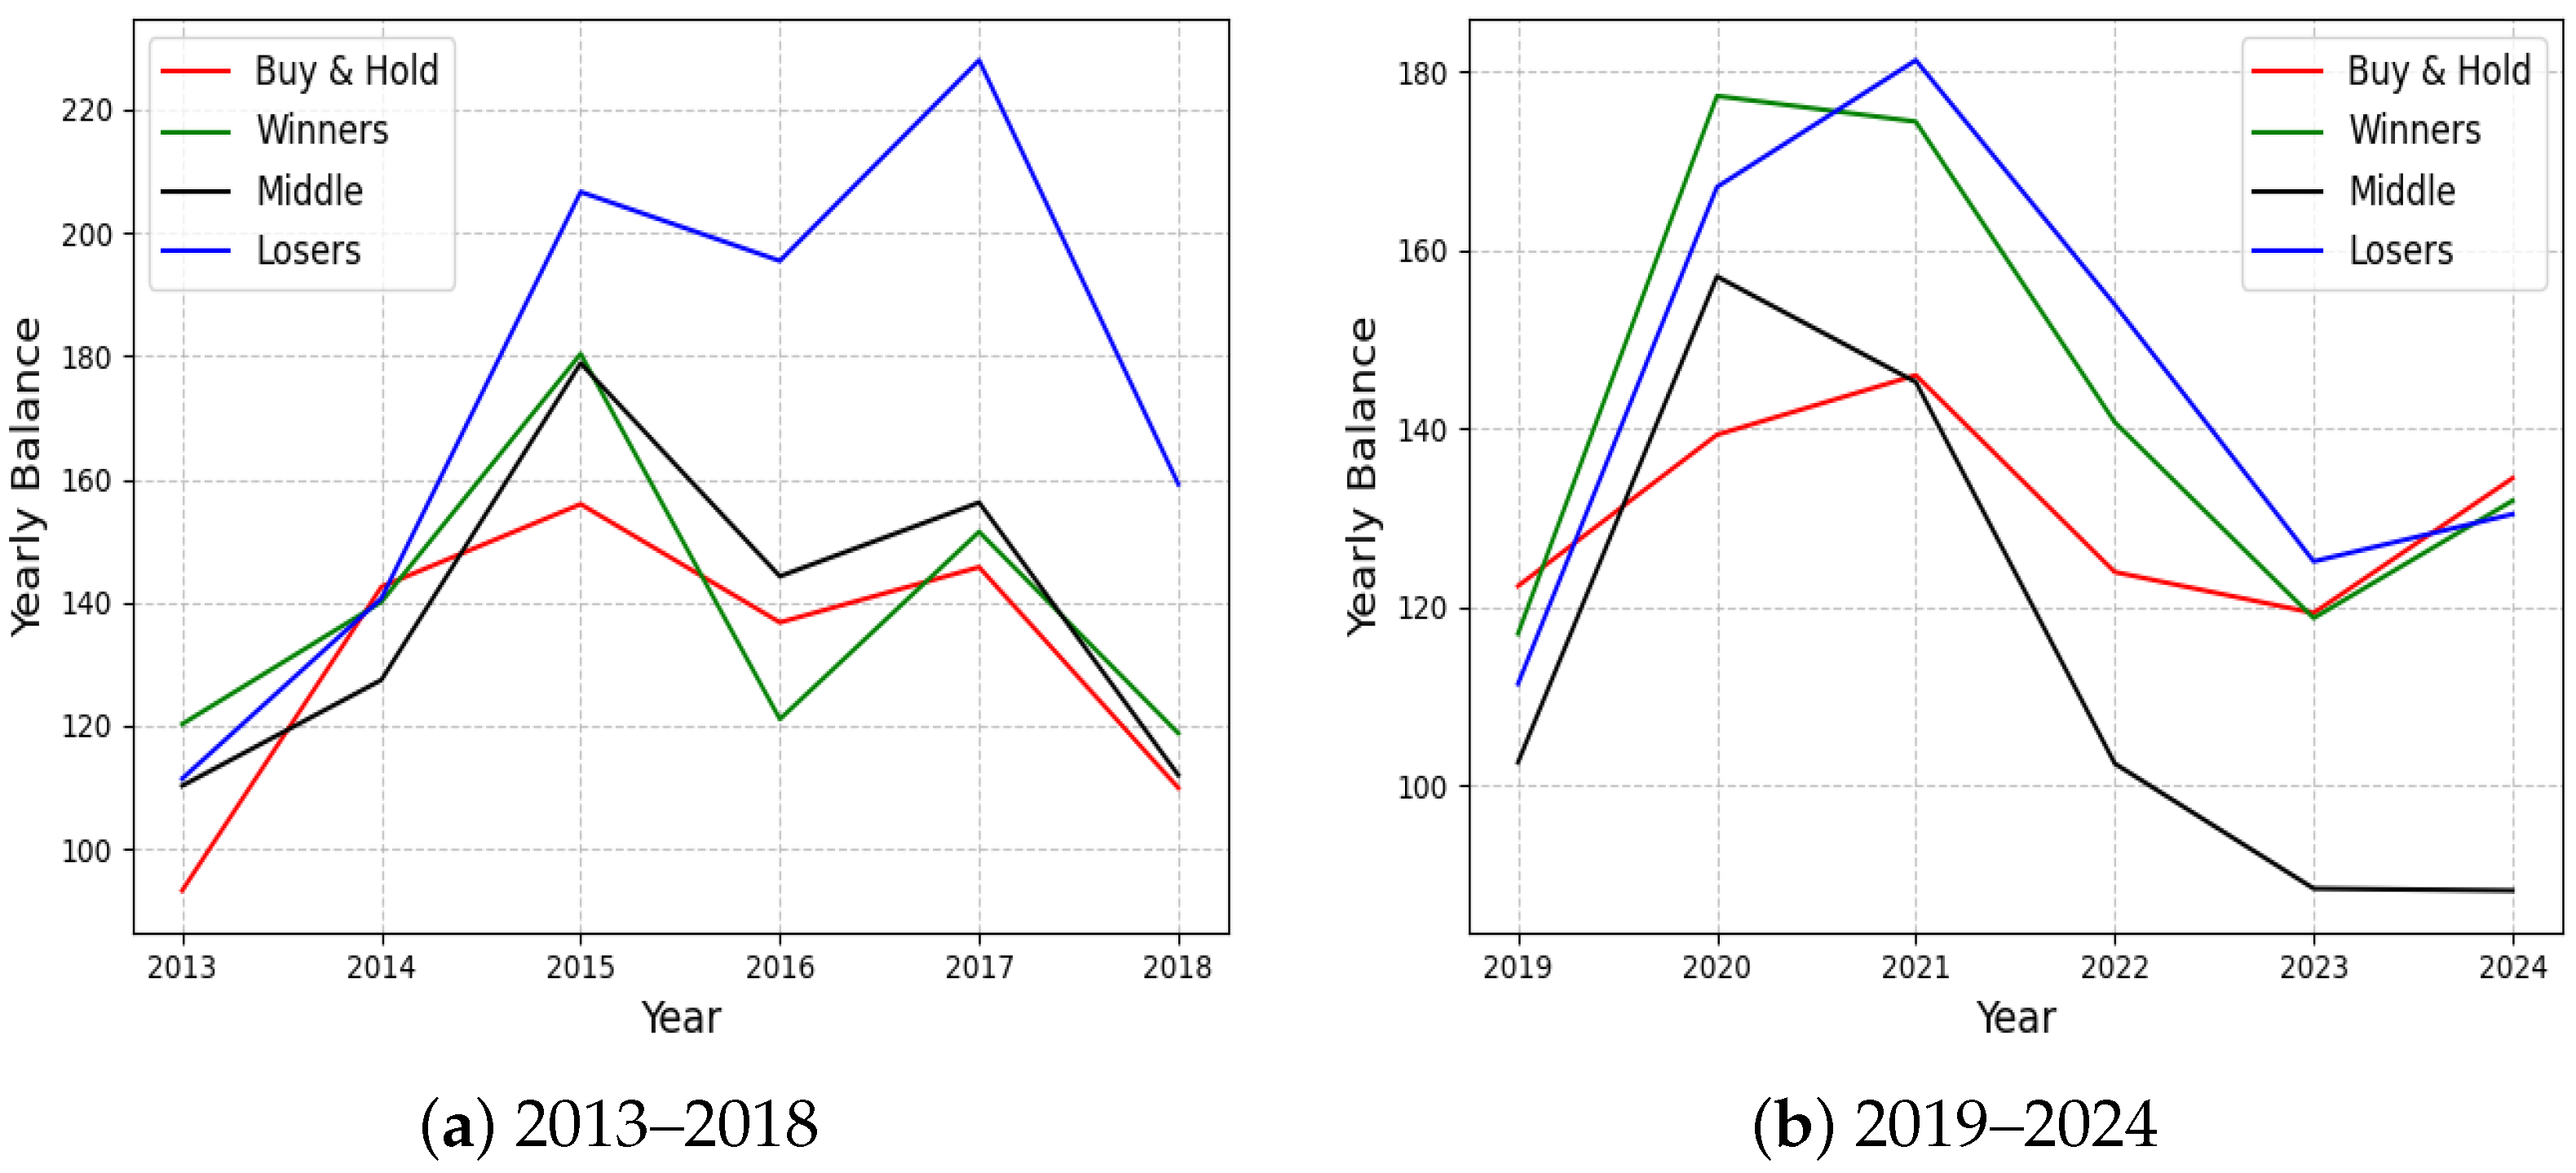
6.2. Subperiods Investment for Quarterly Rebalancing
6.3. Maximum Drawdown (MDD)
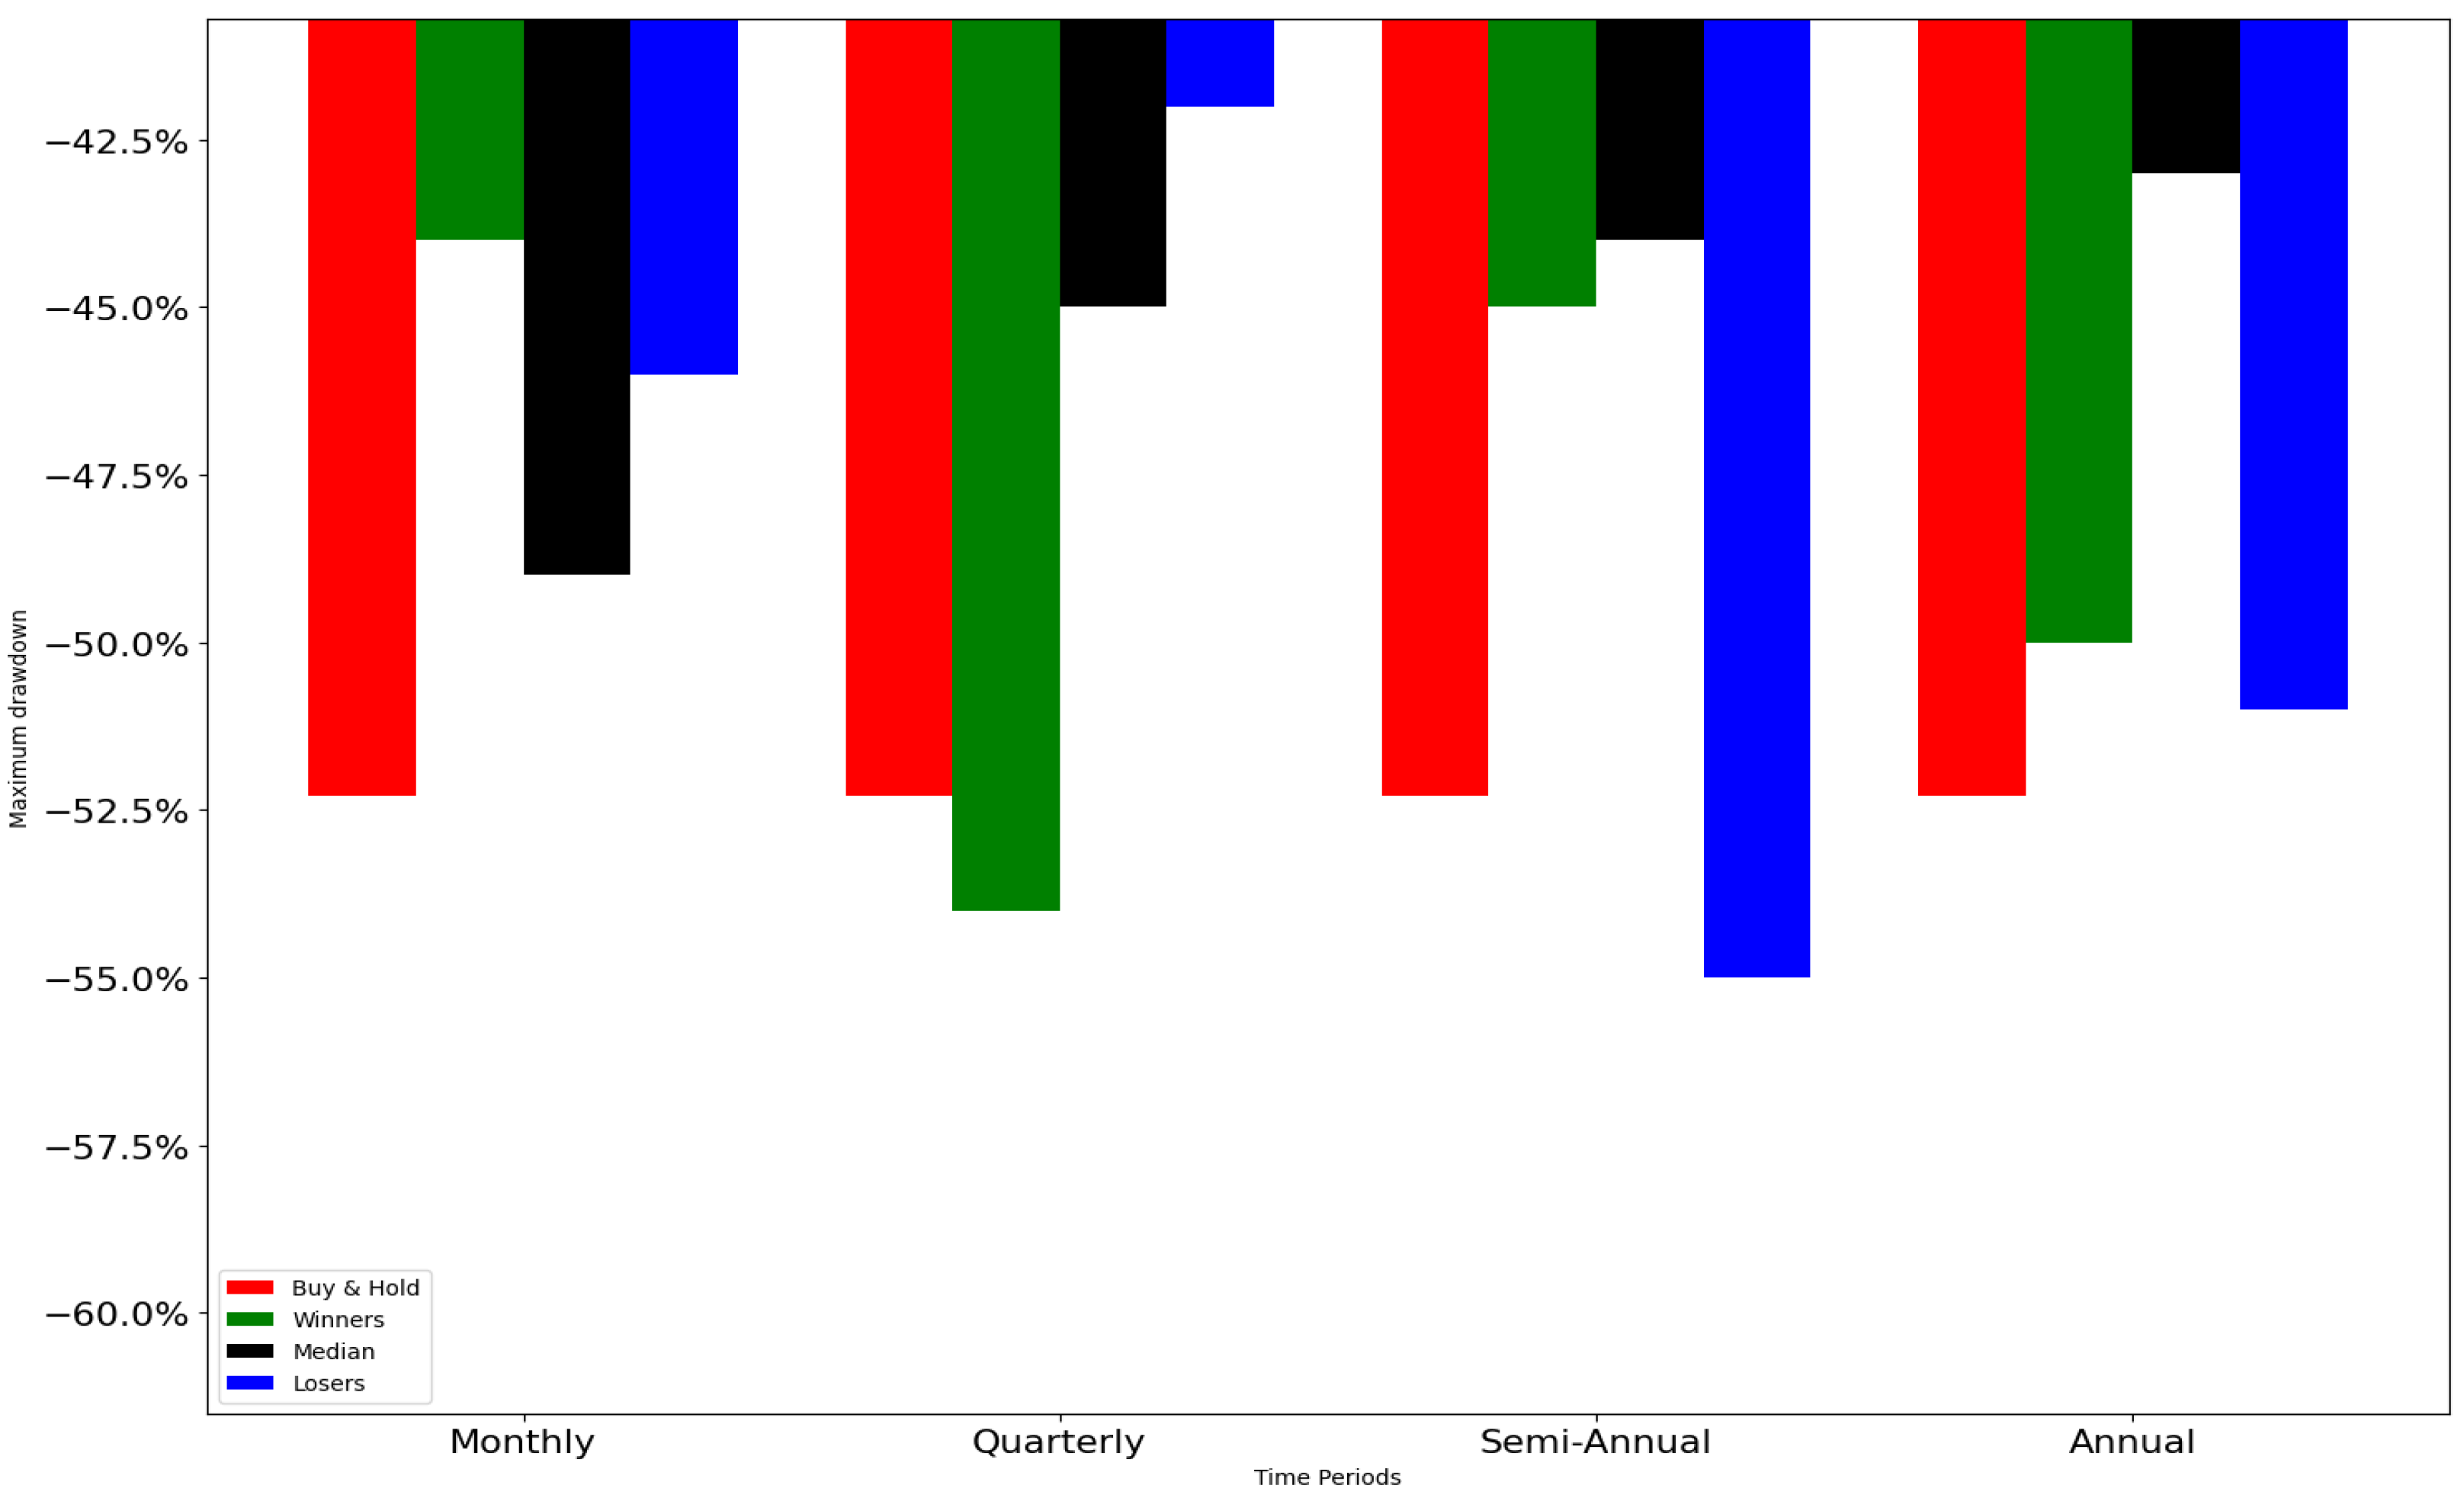
- Annual and Semi-Annual: MDD becomes more uniform: annual Winners report %; Median %; Losers %. For semi-annual, values are %, %, and %, respectively.
- Quarterly: Quarterly intervals see wider variation, with Winners experiencing more severe drawdowns, at %, as compared to % (Median) and % (Losers).
- Monthly: Maximum drawdowns are similar across groups, with Winners at %, Median at %, and Losers at %.
6.4. Return, Volatility and Sharpe Ratio
6.5. Statistical Significance of Performance
7. Results and Discussion
8. Limitations and Concluding Remarks
Author Contributions
Funding
Institutional Review Board Statement
Informed Consent Statement
Data Availability Statement
Conflicts of Interest
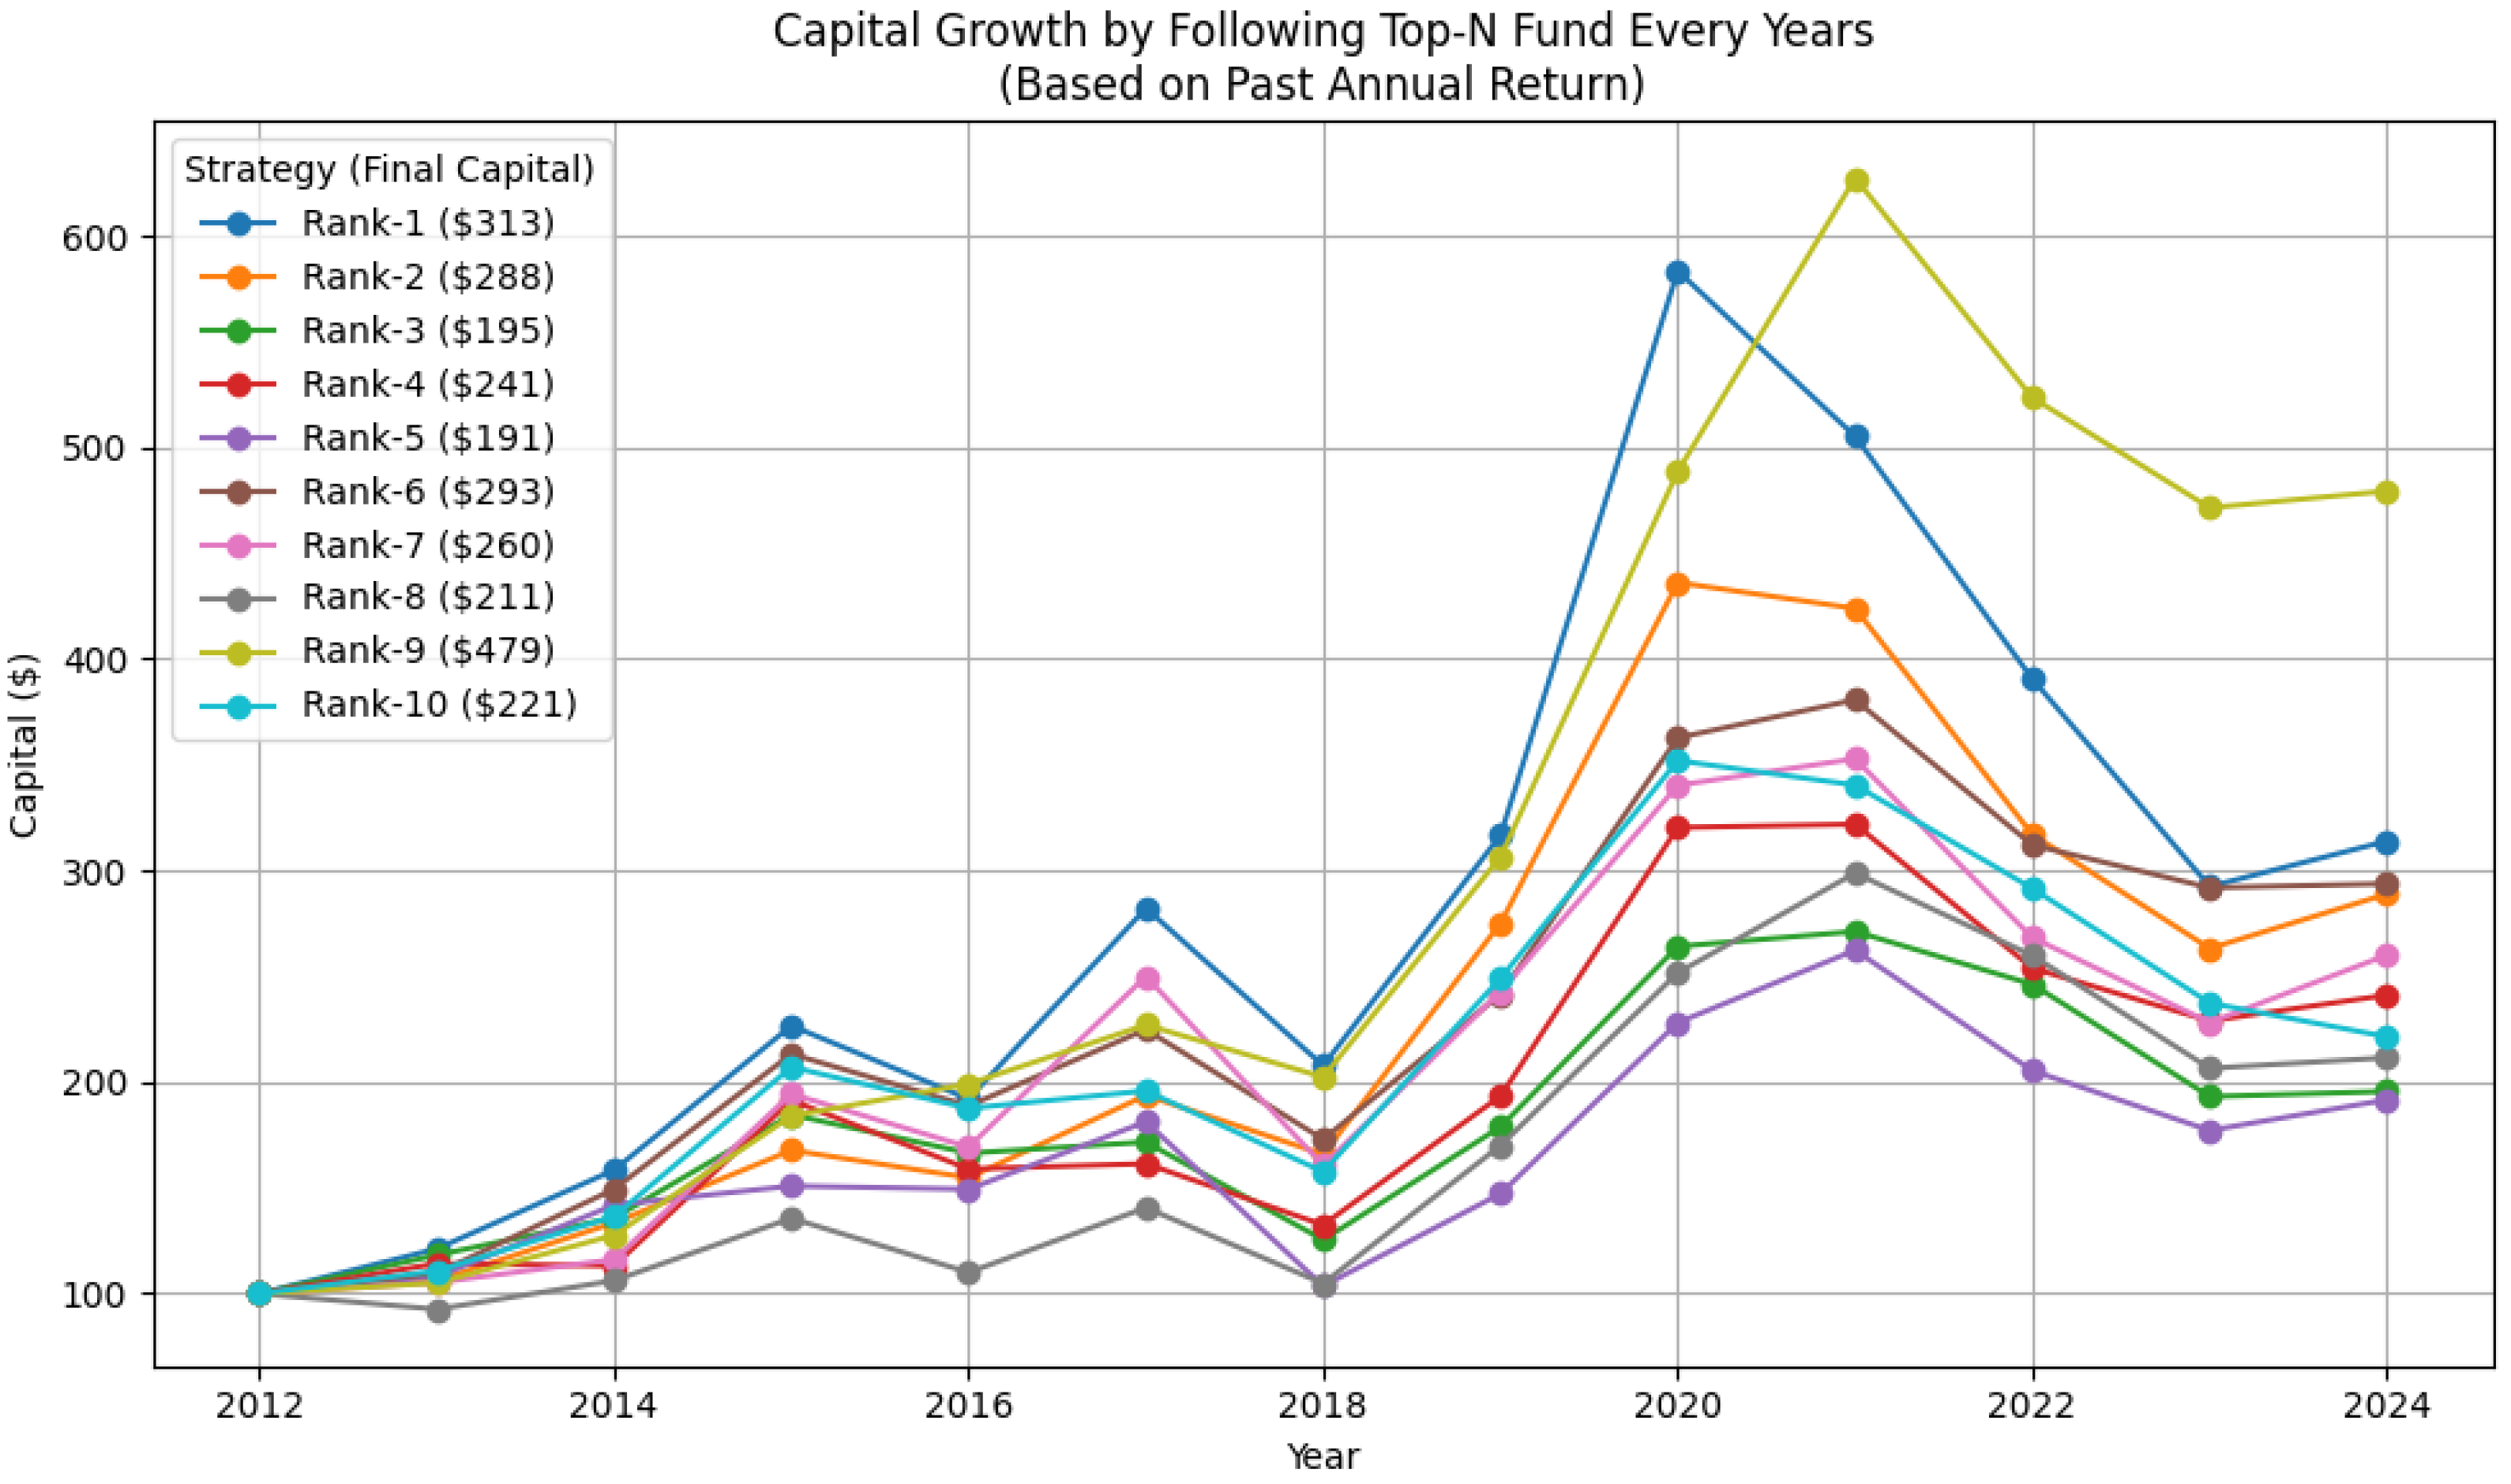
Appendix A. Illustration of Top-N with Concentrated Portfolios (Top 1–10)

| Fund | 2012 | 2013 | 2014 | 2015 | 2016 | 2017 | 2018 | 2019 | 2020 | 2021 | 2022 | 2023 | 2024 |
|---|---|---|---|---|---|---|---|---|---|---|---|---|---|
| 040001 | 7 | 8 | 8 | 8 | 10 | 8 | 6 | 10 | 9 | 1 | 8 | 8 | 6 |
| 050001 | 8 | 10 | 5 | 10 | 4 | 10 | 4 | 7 | 10 | 9 | 4 | 2 | 2 |
| 070002 | 4 | 3 | 7 | 2 | 3 | 9 | 1 | 4 | 2 | 8 | 2 | 6 | 9 |
| 110011 | 6 | 5 | 2 | 9 | 1 | 2 | 2 | 1 | 1 | 10 | 3 | 9 | 7 |
| 161005 | 3 | 2 | 4 | 1 | 8 | 3 | 8 | 2 | 4 | 7 | 9 | 3 | 8 |
| 163402 | 5 | 6 | 1 | 5 | 2 | 4 | 3 | 8 | 7 | 5 | 7 | 5 | 3 |
| 202002 | 9 | 9 | 6 | 6 | 6 | 6 | 5 | 9 | 3 | 6 | 5 | 4 | 5 |
| 270006 | 2 | 7 | 9 | 4 | 9 | 7 | 9 | 5 | 5 | 3 | 1 | 10 | 10 |
| 377010 | 10 | 4 | 10 | 3 | 5 | 5 | 10 | 3 | 8 | 2 | 10 | 7 | 1 |
| 260116 | 1 | 1 | 3 | 7 | 7 | 1 | 7 | 6 | 6 | 4 | 6 | 1 | 4 |
| Funds for Investing in Annual Top-3 Strategy | |||||||||||
| 2013 | 2014 | 2015 | 2016 | 2017 | 2018 | 2019 | 2020 | 2021 | 2022 | 2023 | 2024 |
| 161005 | 070002 | 260116 | 377010 | 070002 | 161005 | 163402 | 377010 | 202002 | 270006 | 110011 | 161005 |

| Metrics | Rank N |
|---|---|
| Mean Return | 9, 1, 7 |
| Return Std | 3, 9, 6 |
| Volatility | 8, 6, 5 |
| Sharpe Ratio | 1, 9, 6 |
| MDD | 2, 6, 9 |
Some Statistics on Ranking Dynamics
| Fund | 2012 | 2013 | 2014 | 2015 | 2016 | 2017 | 2018 | 2019 | 2020 | 2021 | 2022 | 2023 | 2024 |
|---|---|---|---|---|---|---|---|---|---|---|---|---|---|
| 040001 | 7 | 8 | 9 | 8 | 11 | 9 | 7 | 10 | 9 | 1 | 9 | 9 | 7 |
| 050001 | 9 | 11 | 6 | 11 | 4 | 11 | 4 | 7 | 10 | 10 | 5 | 3 | 2 |
| 070002 | 4 | 3 | 8 | 2 | 3 | 10 | 1 | 4 | 2 | 9 | 2 | 7 | 10 |
| 110011 | 6 | 5 | 3 | 9 | 1 | 2 | 2 | 1 | 1 | 11 | 3 | 10 | 8 |
| 161005 | 3 | 2 | 5 | 1 | 9 | 3 | 9 | 2 | 4 | 8 | 10 | 4 | 9 |
| 163402 | 5 | 6 | 2 | 5 | 2 | 4 | 3 | 8 | 7 | 6 | 8 | 6 | 3 |
| 202002 | 10 | 9 | 7 | 6 | 6 | 6 | 5 | 9 | 3 | 7 | 6 | 5 | 5 |
| 260116 | 1 | 1 | 4 | 7 | 8 | 1 | 8 | 6 | 6 | 4 | 7 | 2 | 4 |
| 270006 | 2 | 7 | 10 | 4 | 10 | 7 | 10 | 5 | 5 | 3 | 1 | 11 | 11 |
| 377010 | 11 | 4 | 11 | 3 | 5 | 5 | 11 | 3 | 8 | 2 | 11 | 8 | 1 |
| SCI | 8 | 10 | 1 | 10 | 7 | 8 | 6 | 11 | 11 | 5 | 4 | 1 | 6 |
Appendix B. Appendix: List of Fund Tickers, Types, and Sample Dates
| Ticker | Fund Family | Fund Name | Fund Type | Sample Period |
|---|---|---|---|---|
| 040001 | HuaAn Fund Management | Innovation Equity Fund | Active | 2012–2024 |
| 050001 | Bosera Asset Management | Bosera Value Growth Fund | Active | 2012–2024 |
| 070002 | Harvest Growth Capital | Harvest Growth Fund | Active | 2012–2024 |
| 110011 | E Fund Management | E Fund Mid/Small-Cap Mixed Fund | Active | 2012–2024 |
| 161005 | Fullgoal Fund Management | FuGuo Tianhui Growth Mixed Fund | Active | 2012–2024 |
| 163402 | AEGON–Industrial Fund Management | Xingquan Trend Investment Fund | Active | 2012–2024 |
| 202002 | Southern Asset Management | Steady Growth II Mixed Fund | Active | 2012–2024 |
| 260116 | Invesco Great Wall Fund Management | Invesco Great Wall Core Competence Mixed Securities Fund | Active | 2012–2024 |
| 270006 | GF Fund Management | Strategy Preferred Mixed Fund | Active | 2012–2024 |
| 377010 | J.P. Morgan Asset Management | CIFM/J.P. Morgan Alpha Fund | Active | 2012–2024 |
References
- Allen, F., Qian, J., Shan, C., & Zhu, J. L. (2024). Dissecting the long-term performance of the Chinese stock market. Journal of Finance, 79(2), 993–1054. [Google Scholar] [CrossRef] [Scilit]
- Baker, M., Wurgler, J., & Yuan, Y. (2012). Global, local, and contagious investor sentiment. Journal of Financial Economics, 104(2), 272–287. [Google Scholar] [CrossRef] [Scilit]
- Barras, L., Scaillet, O., & Wermers, R. (2010). False discoveries in mutual fund performance: Measuring luck in estimated alphas. The Journal of Finance, 65(1), 179–216. [Google Scholar] [CrossRef] [Scilit]
- Berk, J. B., & Green, R. C. (2004). Mutual fund flows and performance in rational markets. Journal of Political Economy, 112(6), 1269–1295. [Google Scholar] [CrossRef] [Scilit]
- Bessembinder, H., Cooper, A., & Zhang, Z. (2022). Mutual fund performance at long horizons. The Review of Financial Studies, 35(3), 884–932. [Google Scholar] [CrossRef] [Scilit]
- Bollen, N. P. B. (2005). Short-term persistence in mutual fund performance. The Review of Financial Studies, 18(2), 569–597. [Google Scholar] [CrossRef] [Scilit]
- Brown, K. C., & Harlow, W. V. (2002). Staying the course: The impact of investment style consistency on mutual fund performance. SSRN working paper. Available online: https://papers.ssrn.com/sol3/papers.cfm?abstract_id=306999 (accessed on 18 October 2025).
- Brown, K. C., Harlow, W. V., & Starks, L. T. (1996). Of tournaments and temptations: An analysis of managerial incentives in the mutual fund industry. The Journal of Finance, 51(1), 85–110. [Google Scholar] [CrossRef]
- Brown, S. J., & Goetzmann, W. N. (1995). Performance persistence. The Journal of Finance, 50(2), 679–698. [Google Scholar] [CrossRef]
- Busse, J. A., Goyal, A., & Wahal, S. (2010). Performance and persistence in institutional investment management. The Journal of Finance, 65(2), 765–790. [Google Scholar] [CrossRef] [Scilit]
- Carhart, M. M. (1997). On persistence in mutual fund performance. The Journal of Finance, 52(1), 57–82. [Google Scholar] [CrossRef]
- Chen, J., Hong, H., Huang, M., & Kubik, J. D. (2004). Does fund size erode mutual fund performance? The role of liquidity and organization. American Economic Review, 94(5), 1276–1302. [Google Scholar] [CrossRef] [Scilit]
- Chen, Y., & Wei, H. (2025). Fund style drift and fund performance: Evidence from China. PLoS ONE, 20(2), e0316932. [Google Scholar] [CrossRef] [Scilit]
- Chi, Y., & Qiao, X. (2022). Mutual fund investing in the Chinese A-share market. In M. H. Bilgin, H. Danis, & E. Demir (Eds.), Handbook of banking and finance in emerging markets (pp. 32–50). Edward Elgar Publishing. [Google Scholar] [CrossRef] [Scilit]
- China Securities Index Co., Ltd. (2024). China securities index (csi) industry classification standard. Available online: https://www.csindex.com.cn (accessed on 11 January 2026).
- Chu, N., Dao, B., Pham, N., Nguyen, H., & Tran, H. (2022). Predicting mutual funds’ performance using deep learning and ensemble techniques. arXiv. [Google Scholar] [CrossRef] [Scilit]
- Chua, K. P. A., Tam, O. K., & Tan, M. (2018). The presence of style drift in active mutual funds: Evidence from china. SSRN working paper, 22 pages. Available online: https://ssrn.com/abstract=3168407 (accessed on 1 February 2026).
- Cremers, K. J. M., & Petajisto, A. (2009). How active is your fund manager? A new measure that predicts performance. The Review of Financial Studies, 22(9), 3329–3365. [Google Scholar] [CrossRef] [Scilit]
- Cremers, M., Ferreira, M. A., Matos, P., & Starks, L. (2019). Mutual fund performance: A review of the literature. Journal of Financial and Quantitative Analysis, 54(6), 2363–2396. [Google Scholar] [CrossRef] [Scilit]
- Cuthbertson, K., Nitzsche, D., & O’Sullivan, N. (2010). Mutual fund performance: Measurement and Evidence. Financial Markets, Institutions and Instruments, 16(5), 609–628. [Google Scholar] [CrossRef] [Scilit]
- DeMiguel, V., Gil-Bazo, J., Nogales, F. J., & Santos, A. A. P. (2023). Machine learning and fund characteristics help to select mutual funds with positive alpha. Journal of Financial Economics, 150(3), 656–678. [Google Scholar] [CrossRef] [Scilit]
- Eastmoney. (2024a). China ETF database. Available online: https://fund.eastmoney.com/etf.html (accessed on 11 January 2026).
- Eastmoney. (2024b). Fuguo tianhui growth mixed fund (161005)–Annual reports and holdings. Available online: https://fund.eastmoney.com/161005.html (accessed on 11 January 2026).
- Efron, B. (1979). Bootstrap methods: Another look at the jackknife. The Annals of Statistics, 7(1), 1–26. [Google Scholar] [CrossRef] [Scilit]
- Elton, E. J., Gruber, M. J., & Blake, C. R. (1996). The persistence of risk-adjusted mutual fund performance. The Journal of Business, 69(2), 133–157. [Google Scholar] [CrossRef] [Scilit]
- Fama, E. F., & French, K. R. (2010). Luck versus skill in the cross-section of mutual fund returns. The Journal of Finance, 65(5), 1915–1947. [Google Scholar] [CrossRef] [Scilit]
- Ferreira, M. A., Ferreira, A. C., & Matos, P. (2019). Do large pension funds outperform? Evidence from international data. Journal of Financial Economics, 132(2), 337–362. [Google Scholar] [CrossRef] [Scilit]
- Fitch Ratings. (2024, September 30). Chinese MMF inflows drove growth in global money fund sector in 1H24. Fitch ratings research report. Available online: https://www.fitchratings.com/research/fund-asset-managers/chinese-mmf-inflows-drove-growth-in-global-money-fund-sector-in-1h24-30-09-2024 (accessed on 6 January 2026).
- Forsberg, L., Schmidt, P. S., & von Thadden, E.-L. (2021). Hedge fund performance persistence. Journal of Financial and Quantitative Analysis, 56(6), 2107–2141. [Google Scholar] [CrossRef] [Scilit]
- Forsberg, L., Schmidt, P. S., & von Thadden, E.-L. (2022). Ranking-based strategies and performance persistence. Journal of Financial and Quantitative Analysis, 57(5), 1945–1979. [Google Scholar] [CrossRef] [Scilit]
- Gao, J., O’Sullivan, N., & Sherman, M. (2021). Chinese securities investment funds: The role of luck in performance. Review of Accounting and Finance, 20(5), 271–297. [Google Scholar] [CrossRef] [Scilit]
- Grinblatt, M., & Titman, S. (1992). The persistence of mutual fund performance. The Journal of Finance, 47(5), 1977–1984. [Google Scholar] [CrossRef]
- Hendricks, D., Patel, J., & Zeckhauser, R. (1993). Short-run persistence of relative performance, 1974–1988. The Journal of Finance, 48(1), 93–130. [Google Scholar] [CrossRef] [Scilit]
- Hu, G. X., Pan, J., & Wang, J. (2018). Chinese capital market: An empirical overview. (Working Paper No. 24346). National Bureau of Economic Research. Available online: https://www.nber.org/system/files/working_papers/w24346/w24346.pdf (accessed on 6 January 2026). [CrossRef] [Scilit]
- Huij, J., & Verbeek, M. (2007). Cross-sectional learning and short-run persistence in mutual fund performance. Journal of Banking & Finance, 31(3), 973–997. [Google Scholar] [CrossRef] [Scilit]
- Jones, C. S., & Mo, H. (2021). Out-of-sample performance of mutual fund predictors. The Review of Financial Studies, 34(1), 149–193. [Google Scholar] [CrossRef] [Scilit]
- Kacperczyk, M., Sialm, C., & Zheng, L. (2005). On the industry concentration of actively managed equity mutual funds. The Journal of Finance, 60(4), 1983–2011. [Google Scholar] [CrossRef] [Scilit]
- Kacperczyk, M., Sialm, C., & Zheng, L. (2008). Unobserved actions of mutual funds. The Review of Financial Studies, 21(6), 2379–2416. [Google Scholar] [CrossRef] [Scilit]
- Kaniel, R., Lin, Z., Pelger, M., & Nieuwerburgh, S. V. (2023). Machine-learning the skill of mutual fund managers. Journal of Financial Economics, 150(1), 94–138. [Google Scholar] [CrossRef] [Scilit]
- Keju, W., Si, M., & Yu, C. (2024, March 5). Govt report: China pushes for 5% gdp growth, more jobs. China Daily HK. Available online: https://www.chinadailyhk.com/hk/article/379485 (accessed on 6 January 2026).
- Khorana, A. (2001). Performance changes following top management turnover: Evidence from open-end mutual funds. Journal of Financial and Quantitative Analysis, 36(3), 371–393. [Google Scholar] [CrossRef] [Scilit]
- Kosowski, R., Timmermann, A., Wermers, R., & White, H. (2006). Can mutual fund “stars” really pick stocks? New evidence from a bootstrap analysis. The Journal of Finance, 61(6), 2551–2595. [Google Scholar] [CrossRef] [Scilit]
- Lemmon, M., & Portniaguina, E. (2006). Consumer confidence and asset prices: Some empirical evidence. The Review of Financial Studies, 19(4), 1499–1529. [Google Scholar] [CrossRef] [Scilit]
- Liang, Z., & Yin, C. (2025). High portfolio turnover, managerial skills, and fund performance of chinese mutual funds. SSRN Working Paper. Available online: https://ssrn.com/abstract=5048159 (accessed on 1 February 2026).
- Mateus, C., Mateus, I. B., & Todorovic, N. (2025). Mutual fund performance: The model for selecting persistent winners. European Journal of Finance, 31(5), 647–669. [Google Scholar] [CrossRef] [Scilit]
- Measures for the Administration of the Operation of Publicly Offered Securities Investment Funds. (2014). CSRC decree No. 104. Available online: https://www.csrc.gov.cn (accessed on 9 February 2026).
- Newey, W. K., & West, K. D. (1987). A simple, positive semi-definite, heteroskedasticity and autocorrelation consistent covariance matrix. Econometrica, 55(3), 703–708. Available online: http://www.jstor.org/stable/1913610 (accessed on 9 February 2026). [CrossRef] [Scilit]
- Nickelsen, J., & Stotz, O. (2023). Do fund managers in the Chinese mutual fund market deliver positive risk-adjusted returns? Yes, but it is mainly observed for local fund managers. Quantitative Finance and Economics, 7(4), 595–621. [Google Scholar] [CrossRef] [Scilit]
- Pastor, L., Stambaugh, R. F., & Taylor, L. A. (2017). Do funds make more when they trade more? The Journal of Finance, 72(4), 1483–1528. [Google Scholar] [CrossRef] [Scilit]
- Pollet, J. M., & Wilson, M. I. (2008). How does size affect mutual fund behavior? The Journal of Finance, 63(6), 2941–2969. [Google Scholar] [CrossRef] [Scilit]
- Publicly Disclosed Fund Documents. (2024). Chinese mutual fund prospectuses and benchmark information. Tiantian Jijin (Eastmoney Fund Information Platform). Available online: https://fund.eastmoney.com (accessed on 8 January 2026).
- Puckett, A., & Yan, X. S. (2011). The interim trading skills of institutional investors. The Journal of Finance, 66(2), 601–633. [Google Scholar] [CrossRef] [Scilit]
- Securities Investment Fund Law of the People’s Republic of China. (2013). Amended 2015. Available online: https://www.gov.cn/flfg/2012-12/28/content_2305569.htm (accessed on 1 February 2026).
- Sha, Y. (2020). The devil in the style: Mutual fund style drift, performance and common risk factors. Economic Modelling, 86, 264–273. [Google Scholar] [CrossRef] [Scilit]
- Sirri, E. R., & Tufano, P. (1998). Costly search and mutual fund flows. The Journal of Finance, 53(5), 1589–1622. [Google Scholar] [CrossRef] [Scilit]
- Sprent, P., & Smeeten, N. (2007). Applied nonparametric statistical methods. Chapman and Hall/CRC. [Google Scholar]
- Stambaugh, R. F., Yu, J., & Yuan, Y. (2012). The short of it: Investor sentiment and anomalies. Journal of Financial Economics, 104(2), 288–302. [Google Scholar] [CrossRef] [Scilit]
- Valath, S. K., & Pinsky, E. (2023). Sell the losers? Keep the winners? None of the above–Focus on the median! Algorithmic Finance, 10(3–4), 115–135. [Google Scholar] [CrossRef] [Scilit]
- Vidal-García, J. (2016). The short-term persistence of international mutual fund performance. Journal of International Financial Markets, Institutions and Money, 42, 133–149. [Google Scholar] [CrossRef] [Scilit]
- Wang, A., & Ko, B. (2017). Mutual fund manager tenure and performance in emerging markets. Journal of Finance Studies, 12(3), 45–68. [Google Scholar]
- Wermers, R. (2000). Mutual fund performance: An empirical decomposition into stock-picking talent, style, transactions costs, and expenses. The Journal of Finance, 55(4), 1655–1703. [Google Scholar] [CrossRef] [Scilit]
- Wermers, R. (2003). Is money really ‘smart’? New evidence on the relation between mutual fund flows, manager behavior, and performance persistence. SSRN working paper. Available online: https://papers.ssrn.com/sol3/papers.cfm?abstract_id=414420 (accessed on 6 January 2026).


| Code | Family | Fund Name | Year | Benchmark | |
|---|---|---|---|---|---|
| 040001 | HuaAn Fund Management | Innovation Equity Fund | 2001 | 75% 25% | CSI 300 Index China Bond Government Bond Total Wealth Index |
| 050001 | Bosera Asset Management | Bosera Value Growth Fund | 2003 | 70% 30% | CSI 300 Index China Bond Composite Index |
| 070002 | Harvest Growth Capital | Harvest Growth Fund | 2003 | 60% 40% | CNI 500 (Small Cap) Index China Bond Composite Index |
| 110011 | E Fund Management | E Fund Mid/Small-Cap Mixed Fund | 2008 | 50% 30% 20% | CSI 300 Index CSI Hong Kong 300 Index China Bond Composite Index |
| 161005 | Fullgoal Fund Management | FuGuo Tianhui Growth Mixed Fund | 2005 | 70% 25% 5% | CSI 300 Index China Bond Comprehensive Full Price Index Interbank Deposit Rate |
| 163402 | AEGON–Industrial Fund Management | Xingquan Trend Investment Fund | 2005 | 50% 45% 5% | CSI 300 Index CSI Government Bond Index Interbank Deposit Rate |
| 202002 | Southern Asset Management | Steady Growth II Mixed Fund | 2006 | 80% 20% | SSE Composite Index SSE Government Bond Index |
| 260116 | Invesco Great Wall Fund Management | Invesco Great Wall Core Competence Mixed Securities Fund | 2011 | 80% 20% | CSI 300 Index CSI Aggregate Bond Index |
| 270006 | GF Fund Management | Strategy Preferred Mixed Fund | 2006 | 75% 25% | CSI 300 Index CSI Aggregate Bond Index |
| 377010 | J.P. Morgan Asset Management | CIFM/J.P. Morgan Alpha Fund | 2005 | 80% 20% | CSI 300 Index China Bond Composite Index |
| Year | Fin. | Staples | Energy | Health | Ind. | Info | Mat. | Tele | Util |
|---|---|---|---|---|---|---|---|---|---|
| 2012 | 2.74 | 30.84 | 1.59 | 8.77 | 4.46 | 10.30 | 5.75 | 0.19 | 0.06 |
| 2013 | 2.94 | 18.48 | 0.30 | 12.77 | 8.91 | 18.21 | 5.43 | 2.13 | 0.29 |
| 2014 | 2.79 | 12.95 | 0.09 | 8.24 | 10.82 | 20.01 | 12.01 | 2.59 | 2.62 |
| 2015 | 8.68 | 19.59 | 0.52 | 6.13 | 9.65 | 10.92 | 18.79 | 1.56 | 0.14 |
| 2016 | 2.03 | 20.74 | 0.94 | 15.61 | 11.42 | 13.12 | 17.04 | 1.12 | 1.30 |
| 2017 | 3.48 | 15.79 | 2.33 | 11.18 | 11.97 | 10.55 | 15.85 | 10.92 | 0.89 |
| 2018 | 8.33 | 10.75 | 0.09 | 14.81 | 12.91 | 12.28 | 22.13 | 2.79 | 1.52 |
| 2019 | 10.42 | 18.28 | 0.00 | 8.74 | 14.40 | 12.73 | 17.21 | 1.80 | 0.23 |
| 2020 | 8.39 | 18.78 | 0.07 | 13.38 | 17.11 | 12.33 | 15.44 | 2.61 | 0.30 |
| 2021 | 7.62 | 22.34 | 0.20 | 9.40 | 16.23 | 16.44 | 13.36 | 1.15 | 0.46 |
| 2022 | 5.99 | 18.23 | 2.37 | 17.66 | 14.01 | 13.06 | 16.68 | 0.56 | 0.83 |
| 2023 | 2.71 | 14.71 | 0.51 | 18.46 | 15.47 | 10.46 | 18.92 | 0.04 | 1.77 |
| 2024 | 2.69 | 5.02 | 0.52 | 3.65 | 11.34 | 4.71 | 6.27 | 0.53 | 0.00 |
| Sector | Ticker | Sector ETF |
|---|---|---|
| Financials | 510230 | Guotai SSE 180 Financial Index ETF |
| Consumer Staples | 510150 | SSE Consumption 80 ETF |
| Energy | 561260 | Central-Soes Modern Energy ETF |
| Healthcare | 512170 | Hwabao CSI Medical ETF |
| Industrials | 512660 | Guotai CSI National Defense Fund |
| Information Technology | 515000 | HB CSI Technical Lead Enterprise ETF |
| Materials | 516360 | Hwabao WP CSI New Materials ETF |
| Telecommunications | 515880 | Guotai CSI A-Share Comm ETF |
| Utilities | 512200 | China Southern China Securities Real Estate ETF |
| Fund | Mutual Fund B&H | Annual Report Allocation Strategy | ||||||
|---|---|---|---|---|---|---|---|---|
| Growth | Volatility (%) | MDD (%) | Sharpe | Growth | Volatility (%) | MDD (%) | Sharpe | |
| 040001 | 164 | 19.1 | −18.2 | 0.27 | 155 | 21.3 | −21.1 | 0.30 |
| 050001 | 151 | 17.1 | −15.5 | 0.48 | 156 | 21.0 | −20.7 | 0.30 |
| 070002 | 359 | 18.5 | −16.4 | 0.72 | 199 | 23.0 | −22.4 | 0.36 |
| 110011 | 482 | 22.6 | −18.8 | 0.60 | 268 | 21.8 | −20.5 | 0.51 |
| 161005 | 388 | 21.8 | −19.4 | 0.71 | 222 | 21.4 | −21.1 | 0.41 |
| 163402 | 363 | 17.2 | −14.6 | 0.72 | 205 | 22.1 | −21.0 | 0.40 |
| 202002 | 259 | 18.0 | −17.2 | 0.51 | 217 | 21.0 | −19.9 | 0.41 |
| 260116 | 507 | 21.7 | −18.9 | 1.01 | 182 | 21.1 | −20.6 | 0.31 |
| 270006 | 195 | 22.7 | −20.9 | 0.34 | 202 | 21.5 | −20.1 | 0.35 |
| 377010 | 191 | 22.4 | −21.9 | 0.45 | 157 | 23.0 | −22.4 | 0.25 |
| max | 507 | 22.6 | −14.6 | 1.01 | 268 | 23.0 | −19.9 | 0.51 |
| min | 151 | 17.1 | −21.9 | 0.27 | 155 | 21.0 | −22.4 | 0.25 |
| median | 309 | 19.2 | −18.5 | 0.56 | 201 | 21.5 | −20.9 | 0.36 |
| average | 306 | 19.8 | −18.2 | 0.58 | 196 | 21.7 | −21.0 | 0.36 |
| st. dev. | 132 | 2.2 | 2.3 | 0.22 | 36 | 0.8 | 0.8 | 0.08 |
| SCI B&H | Growth: 143 Volatility: 18.4% MDD: −17.1% Sharpe: 0.40 | |||||||
| Fund Code | Correlation | Tracking Error |
|---|---|---|
| 040001 | 0.86 | 0.11 |
| 050001 | 0.90 | 0.10 |
| 070002 | 0.88 | 0.11 |
| 110011 | 0.86 | 0.12 |
| 161005 | 0.93 | 0.09 |
| 163402 | 0.90 | 0.11 |
| 202002 | 0.87 | 0.11 |
| 260116 | 0.89 | 0.11 |
| 270006 | 0.86 | 0.13 |
| 377010 | 0.85 | 0.14 |
| Year (t) | – | |||||
|---|---|---|---|---|---|---|
| 2013 | 9.83 | 10.79 | 10.85 | 7.50 | 10.42 | −0.59 |
| 2014 | 21.59 | 22.44 | 17.45 | 13.59 | 29.21 | −7.62 |
| 2015 | 29.45 | 39.80 | 34.95 | 29.66 | 28.51 | 0.94 |
| 2016 | −12.23 | −12.69 | −10.92 | −8.16 | −6.91 | −5.32 |
| 2017 | 9.34 | 11.05 | 10.92 | 10.48 | 13.16 | −3.82 |
| 2018 | −23.62 | −22.76 | −23.56 | −23.59 | −24.14 | 0.52 |
| 2019 | 22.76 | 23.49 | 24.20 | 24.09 | 25.42 | −2.66 |
| 2020 | 45.85 | 49.05 | 46.76 | 43.44 | 41.77 | 4.08 |
| 2021 | 7.08 | 9.68 | 9.09 | 4.46 | 3.27 | 3.81 |
| 2022 | −19.03 | −13.59 | −14.06 | −13.17 | −15.94 | −3.09 |
| 2023 | −2.88 | −7.06 | −7.63 | −11.49 | −13.17 | 10.29 |
| 2024 | 2.62 | 2.74 | 3.60 | 3.94 | −1.20 | 3.82 |
| Mean | 8.08 | 9.39 | 9.19 | 7.38 | 7.70 | 0.38 |
| Metric | Value |
|---|---|
| Panel A: Spread (–) inference | |
| Mean spread (%) | 0.38 |
| Newey–West t-stat (lag 1) | 0.10 |
| Bootstrap p-value (10,000; ) | 0.499 |
| Sign-flip p-value (10,000; ) | 0.458 |
| 95% confidence interval (%) | [−9.22, 9.98] |
| 95% bootstrap confidence interval (%) | [−8.41, 10.09] |
| N (test years) | 12 |
| Panel B: Persistence via transition matrix | |
| Baseline (no persistence; 1/5) (%) | 20.00 |
| Stay-top probability (%) | 23.68 |
| Stay-bottom probability (%) | 26.38 |
| Total transitions used | 3750 |
| Pooled chi-square statistic (df = 16) | 128.74 |
| Pooled chi-square p-value | |
| Panel C: Defensiveness (sample stability) | |
| Average survival rate from to t (%) | 99.97 |
| Minimum survival rate from to t (%) | 99.68 |
| Average survivor fund count in test year t | 312.5 |
| From\To | To_ | To_ | To_ | To_ | To_ |
|---|---|---|---|---|---|
| From_ | 23.68 | 17.99 | 16.27 | 14.68 | 27.38 |
| From_ | 19.31 | 22.62 | 22.09 | 19.84 | 16.14 |
| From_ | 18.64 | 23.83 | 21.17 | 22.24 | 14.11 |
| From_ | 16.53 | 20.30 | 23.25 | 24.73 | 15.19 |
| From_ | 22.61 | 16.02 | 17.36 | 17.63 | 26.38 |
| Metric | Value |
|---|---|
| Panel A: Spread – inference | |
| Mean spread (%) | 0.44 |
| Newey–West t-stat (lag 3) | 1.47 |
| Bootstrap p-value (10,000; ) | 0.084 |
| Sign-flip p-value (10,000; ) | 0.087 |
| 95% confidence interval (%) | [−0.18, 1.06] |
| 95% bootstrap confidence interval (%) | [−0.19, 1.06] |
| N (test months) | 154 |
| Panel B: Persistence via transition matrix | |
| Baseline (no persistence; 1/5) (%) | 20.00 |
| Stay-top probability (%) | 25.17 |
| Stay-bottom probability (%) | 25.28 |
| Total transitions used | 48,145 |
| Pooled chi-square statistic (df = 16) | 842.62 |
| Pooled chi-square p-value | |
| Panel C: Defensiveness (sample stability) | |
| Average survival rate from to t (%) | 99.996 |
| Minimum survival rate from to t (%) | 99.68 |
| Average survivor fund count in test month t | 312.63 |
| Strategy | Rotation Frequency | |||
|---|---|---|---|---|
| Annual | Semi-Annual | Quarterly | Monthly | |
| “Winners” | 187 | 180 | 198 | 207 |
| “Median” | 169 | 179 | 133 | 163 |
| “Losers” | 198 | 189 | 290 | 194 |
| SCI Buy & Hold | 148 | |||
| Strategy | Rotation Frequency | |||
|---|---|---|---|---|
| Annual | Semi-Annual | Quarterly | Monthly | |
| Winners | % | % | % | % |
| Median | % | % | % | % |
| Losers | % | % | % | % |
| Buy & Hold | % | |||
| Freq | Stat | Annual Return | Volatility | Sharpe Ratio | |||||||||
|---|---|---|---|---|---|---|---|---|---|---|---|---|---|
| B&H | W | M | L | B&H | W | M | L | B&H | W | M | L | ||
| 12 Mo. | Med. | 5.7 | 8.5 | 8.1 | 3.0 | 18.2 | 19.7 | 18.8 | 18.5 | 0.3 | 0.5 | 0.5 | 0.2 |
| Mean | 5.0 | 8.4 | 8.2 | 8.3 | 19.0 | 20.0 | 19.2 | 19.5 | 0.3 | 0.4 | 0.4 | 0.4 | |
| 6 Mo. | Med. | 5.7 | 10.8 | 4.1 | 4.5 | 18.2 | 19.1 | 18.8 | 19.7 | 0.3 | 0.6 | 0.2 | 0.3 |
| Mean | 5.0 | 8.5 | 7.8 | 9.1 | 19.0 | 20.1 | 19.4 | 19.3 | 0.3 | 0.5 | 0.4 | 0.4 | |
| 3 Mo. | Med. | 5.7 | 13.8 | 4.0 | 10.0 | 18.2 | 19.9 | 19.9 | 18.7 | 0.3 | 0.7 | 0.3 | 0.6 |
| Mean | 5.0 | 9.2 | 5.6 | 12.5 | 19.0 | 20.5 | 19.4 | 19.2 | 0.3 | 0.5 | 0.2 | 0.6 | |
| 1 Mo. | Med. | 5.7 | 2.4 | 7.1 | 8.2 | 18.2 | 20.0 | 19.1 | 18.9 | 0.3 | 0.1 | 0.4 | 0.6 |
| Mean | 5.0 | 9.6 | 7.6 | 8.2 | 19.0 | 20.2 | 19.2 | 20.2 | 0.3 | 0.4 | 0.4 | 0.4 | |
| Comparison | t-Statistic | p-Value | Significance |
|---|---|---|---|
| Losers vs. Winners | 5.1189 | 0.0003 | 0.05 |
| Losers vs. Median | 4.8109 | 0.0005 | 0.05 |
| Comparison | t-Statistic | p-Value | Significance |
|---|---|---|---|
| Losers vs. Winners | 2.0658 | 0.0632 | 0.05 |
| Losers vs. Median | 5.5969 | 0.0002 | 0.05 |
| Comparison | t-Statistic | p-Value | Significance |
|---|---|---|---|
| Losers vs. Winners | 6.2925 | 0.0001 | 0.05 |
| Losers vs. Median | 6.6585 | 0.0000 | 0.05 |
| Panel A: Benchmark and Portfolio Strategies | ||||
| Strategy | Growth | Volatility (%) | MDD (%) | Sharpe |
| SCI Buy and Hold | 36.50 | 18.40 | −17.10 | 0.40 |
| Mutual Fund Buy and Hold (average) | 206.00 | 19.80 | −18.20 | 0.58 |
| Holdings-Based Replication (ex post) | 87.31 | 21.70 | −21.00 | 0.36 |
| Top-N Strategy (Best Rank) | 379.00 | 21.53 | −18.42 | 0.67 |
| Rotation Strategy: Annual Rebalancing | ||||
| Winner | 187.18 | 19.98 | −19.53 | 0.45 |
| Median | 169.00 | 19.25 | −19.03 | 0.41 |
| Loser | 198.00 | 19.47 | −19.20 | 0.39 |
| Panel B: Performance-Persistence Statistics | ||||
| Metric | Annual | Monthly | ||
| Mean spread (Q1–Q5) (%) | 0.38 | 0.44 | ||
| Newey–West t-stat | 0.10 | 1.47 | ||
| Bootstrap p-value | 0.499 | 0.084 | ||
| Sign-flip p-value | 0.458 | 0.087 | ||
| 95% confidence interval (%) | [−9.22, 9.98] | [−0.18, 1.06] | ||
| Baseline persistence (1/5) (%) | 20.00 | 20.00 | ||
| Stay-top probability (%) | 23.68 | 25.17 | ||
| Stay-bottom probability (%) | 26.38 | 25.28 | ||
| Chi-square statistic (df = 16) | 128.74 | 842.62 | ||
| Chi-square p-value | ||||
| Average survival rate (%) | 99.97 | 99.996 | ||
| Minimum survival rate (%) | 99.68 | 99.68 | ||
Disclaimer/Publisher’s Note: The statements, opinions and data contained in all publications are solely those of the individual author(s) and contributor(s) and not of MDPI and/or the editor(s). MDPI and/or the editor(s) disclaim responsibility for any injury to people or property resulting from any ideas, methods, instructions or products referred to in the content. |
© 2026 by the authors. Licensee MDPI, Basel, Switzerland. This article is an open access article distributed under the terms and conditions of the Creative Commons Attribution (CC BY) license.
Share and Cite
Liang, M.; Tang, Y.; Puppala, S.; Pinsky, E. Evaluating Simple Strategies with Mutual Funds and ETFs to Outperform the China’s Shanghai Composite Index (SCI). J. Risk Financ. Manag. 2026, 19, 246. https://doi.org/10.3390/jrfm19040246
Liang M, Tang Y, Puppala S, Pinsky E. Evaluating Simple Strategies with Mutual Funds and ETFs to Outperform the China’s Shanghai Composite Index (SCI). Journal of Risk and Financial Management. 2026; 19(4):246. https://doi.org/10.3390/jrfm19040246
Chicago/Turabian StyleLiang, Minfei, Yuanyuan Tang, Saiteja Puppala, and Eugene Pinsky. 2026. "Evaluating Simple Strategies with Mutual Funds and ETFs to Outperform the China’s Shanghai Composite Index (SCI)" Journal of Risk and Financial Management 19, no. 4: 246. https://doi.org/10.3390/jrfm19040246
APA StyleLiang, M., Tang, Y., Puppala, S., & Pinsky, E. (2026). Evaluating Simple Strategies with Mutual Funds and ETFs to Outperform the China’s Shanghai Composite Index (SCI). Journal of Risk and Financial Management, 19(4), 246. https://doi.org/10.3390/jrfm19040246