


Abstract
This study advances our understanding of the relationship between financial literacy and problematic cryptocurrency trading by examining financial knowledge alongside behavioral and social-information pathways. We analyze cross-sectional data from 428 respondents recruited through a U.S.-targeted cryptocurrency panel. Financial literacy (FL) is measured by the number of correct answers to five knowledge questions. Using SmartPLS 4 and 10,000 bootstrap samples, we estimate a model incorporating fear of missing out (FOMO), herding, loss aversion, overconfidence, and social media influence. Higher FL is associated with lower Problematic Crypto Trading Symptoms (PCTS) directly (β = −0.082, 95% confidence interval (CI) [−0.137, −0.030]) and indirectly (combined β = −0.326). The total association is −0.408, and the model explains 76.9% of PCTS variance in the sample. In the primary model, FOMO, herding, loss aversion, overconfidence, and social media influence were each positively associated with PCTS after accounting for FL and the other pathways. Independent sensitivity analyses retain the inverse direct association across alternative FL measures, PCTS domains, demographic and trading controls, and exclusions of flagged response patterns; however, exclusions reduce overall association magnitudes. Discriminant validity was not established for several construct pairs under the specified criterion. The study identifies a consistent inverse association between financial literacy and PCTS across the examined specifications. These findings strengthen the empirical basis for evaluating financial education and decision-support measures in cryptocurrency investor protection.
1. Introduction
The motivation of this study is to understand how financial literacy relates to problematic crypto trading symptoms among retail cryptocurrency traders. Retail crypto markets combine continuous access with rapid price changes, visible peer activity, automated alerts, and promotional claims. Traders can respond within seconds, and leveraged products can turn small adverse moves into forced liquidations. Behavioral finance predicts that attention, loss sensitivity, social cues, and confidence can move decisions away from fully informed risk assessment (Kahneman & Tversky, 1979; Thaler, 1980). This setting allows us to examine whether demonstrated financial knowledge is associated with greater control over trading behavior.
The Problematic Crypto Trading Symptoms (PCTS) measure is the outcome in this study. The validated 15-item scale records the frequency of experiences in two domains: withdrawal and tolerance, and money-seeking behavior and denial (Menteş et al., 2021). It does not measure ordinary participation or establish a clinical diagnosis. The items instead capture difficulty disengaging, concealment, emotional reactions to interruption or non-trading, loss-chasing, borrowing, and the use of another person’s money. Prior studies associate problematic crypto involvement with gambling-related behavior, anxiety, depressive symptoms, social isolation, and loss of control (Delfabbro et al., 2021; Grubbs & Kraus, 2024; Jain et al., 2025; Johnson et al., 2023; Meshi et al., 2026; Oksanen et al., 2022; Özbek & Topal, 2026).
Financial literacy (FL) is demonstrated knowledge, not a trader’s confidence in personal skill. The five knowledge items cover compound interest, inflation, diversification, bond-price sensitivity, and mortgage term and total interest. These domains support judgments about purchasing power, concentration risk, and opportunity cost (Lusardi & Mitchell, 2014, 2023; van Rooij et al., 2011). Ryu (2024) linked financial literacy with problematic Bitcoin investment behavior. Recent JRFM studies also show that financial knowledge often operates with intermediate attitudes, trust, or applied financial practices rather than in isolation (Eche-Querevalú et al., 2026; Pérez-Campdesuñer et al., 2026). We extend this mechanism-oriented view to a validated PCTS outcome.
Four behavioral tendencies may weaken the consistent use of financial knowledge. Overconfidence leads traders to place more weight on their information or timing than the evidence warrants (Barber & Odean, 2000; Gervais & Odean, 2001; Odean, 1998b). Herding shifts attention from independent assessment to the visible choices of others (Banerjee, 1992; Bikhchandani et al., 1992; De Long et al., 1990). Loss aversion and the disposition effect can encourage traders to realize gains early and retain losing positions (Kahneman & Tversky, 1979; Odean, 1998a; Shefrin & Statman, 1985). FOMO heightens urgency when traders believe that others are receiving rewards they may miss (Kaur et al., 2024; Przybylski et al., 2013).
Social media influence represents a distinct part of the decision environment. The construct records whether traders use social media for crypto information, allow posts to affect their decisions, and become more willing to trade after seeing reported profits. Online visibility can direct attention toward selected assets, while selective profit displays can make weak signals appear persuasive (Ante, 2023; Barber & Odean, 2008; Merkley et al., 2024). We therefore model social media influence as an external information pathway rather than a behavioral bias.
Prior research connects financial literacy with problematic Bitcoin investment, behavioral tendencies with crypto decisions, and PCTS with gambling-related and mental-health outcomes (Almeida & Gonçalves, 2023; Kaur et al., 2024; Menteş et al., 2021; Ryu, 2024). Our question concerns the relationship between demonstrated knowledge and a symptom-frequency outcome after several related decision tendencies enter the same model. We distinguish judgments about opportunities, losses, peers, and personal skill from the external information setting measured by social media influence. This distinction allows us to assess the conditional FL–PCTS association and describe the five specific indirect associations without treating them as independent causal mechanisms.
We ask the following question: how is FL associated with PCTS directly and through FOMO, herding, loss aversion, overconfidence, and social media influence? We examine these relationships in 428 panel-recruited cryptocurrency respondents. The model retains the direct FL–PCTS path while estimating the five indirect associations together. The arrows express theoretical expectations; the cross-sectional survey does not establish their temporal order.
The study makes three contributions. First, it examines demonstrated financial knowledge in relation to trading-control difficulties, extending the focus beyond cryptocurrency participation and investment intention. Second, it estimates the direct FL–PCTS association alongside five related behavioral and social-information pathways. Third, it examines the sensitivity of this association to alternative measures and sample restrictions. Together, these contributions provide an empirical basis for further research on financial literacy and cryptocurrency investor protection.
2. Theoretical Framework and Hypothesis Development
2.1. PCTS as an Investor-Welfare Outcome
The PCTS measure is a continuous symptom-frequency measure. Its 15 items cover two related domains: withdrawal and tolerance, and money-seeking behavior and denial (Menteş et al., 2021). A later study proposed a screening cutoff (Menteş & Bulut, 2023), but the present analysis does not classify respondents. Higher scores indicate more frequent difficulties with disengagement, concealment, emotional control, loss-chasing, borrowing, or the use of another person’s money. This outcome captures financial-management and investor-welfare problems that participation or turnover measures cannot identify.
Digital trading can compress the time between judgment and financial consequence. Crypto markets remain open continuously, social information changes quickly, and orders can be placed with little delay. Leveraged products add margin and liquidation risk because adverse price movements can close positions automatically (Chen et al., 2024; Cheng et al., 2021). The sample includes users of several crypto products, so leverage and liquidation provide relevant context rather than focal variables.
2.2. Integrated Behavioral Finance Framework
Human-capital theory treats financial knowledge as a resource that improves the evaluation of intertemporal costs, diversification, and risk (Lusardi & Mitchell, 2014, 2023). Under this logic, investors with greater knowledge should be better able to recognize concentration, opportunity cost, and the limits of short-term return claims. A direct negative FL–PCTS association would be consistent with this capability-based view.
Behavioral finance explains why knowledge may be insufficient. Traders do not apply facts in a neutral environment. FOMO, herding, loss aversion, and overconfidence can alter how they interpret opportunities, other traders’ actions, losses, and their own ability (Kahneman & Tversky, 1979; Thaler, 1980). These constructs represent distinct vulnerabilities rather than interchangeable indicators of one general bias.
Social media influence adds an external information setting. Platforms and online communities make market claims, peer profits, and promotional messages highly visible, thereby increasing attention and social comparison (Barber & Odean, 2008; Merkley et al., 2024). A trader may know basic financial principles and still act on low-quality or selectively presented information.
The proposed links follow a knowledge-evaluation account. Understanding financial trade-offs may help traders evaluate missed gains, assess peers’ actions independently, reconsider losing positions, recognize the limits of personal skill, and check online claims. These are different uses of knowledge, not equivalent measures of it. The model tests whether the corresponding reported tendencies are negatively associated with FL and positively associated with PCTS. Because neither learning nor decisions were observed over time, these explanations remain hypotheses about the associations rather than established mechanisms.
2.3. Financial Literacy and PCTS
FL measures what respondents know rather than what they believe they know. The distinction is central to this model because overconfidence can coexist with limited knowledge. The five knowledge items assess compound interest, inflation and purchasing power, diversification, bond-price sensitivity, and mortgage term and interest. They measure general financial knowledge rather than crypto-specific expertise, but each domain supports judgments about risk, concentration, and opportunity cost (FINRA Investor Education Foundation, 2021; Lusardi & Mitchell, 2014, 2023; Organization for Economic Co-operation and Development, 2023; van Rooij et al., 2011).
Traders who understand these relationships may be less likely to rely exclusively on recent returns, peer claims, or apparent certainty. Knowledge does not ensure disciplined behavior, but it provides a basis for evaluating risk and recognizing uncertainty. We therefore expect FL to be negatively associated with PCTS.
H1.
Financial literacy is negatively associated with PCTS.
2.4. Fear of Missing Out
FOMO refers to the concern that others may obtain rewarding experiences or opportunities that one will miss (Przybylski et al., 2013). Rapid price increases, constant news, and visible peer profits can turn that concern into trading urgency. Kaur et al. (2024) connect FOMO with herding, loss aversion, overconfidence, and cryptocurrency investment intention.
FOMO concerns missed rewards, whereas FL provides criteria for evaluating their financial cost and risk (Przybylski et al., 2013; Lusardi & Mitchell, 2014). We expect traders with more financial knowledge to give less weight to a missed gain when the available opportunity has weak evidence or uncertain downside. This is an evaluation argument, not a claim that knowledge removes emotion. FOMO may accompany repeated checking and difficulty disengaging, which overlap with the trading-control experiences recorded by PCTS. We therefore expect negative FL–FOMO and positive FOMO–PCTS associations.
H2a.
Financial literacy is negatively associated with FOMO.
H3a.
FOMO is positively associated with PCTS.
H4a.
Financial literacy has a negative statistical indirect association with PCTS through FOMO.
2.5. Herding
Herding occurs when investors give the actions of other people more weight than their own information. Informational cascade models explain why this response may appear rational under uncertainty, even when collective behavior deviates from the underlying value (Banerjee, 1992; Bikhchandani et al., 1992). Crypto platforms and online communities increase the visibility of trades, opinions, and momentum.
Cascade theory distinguishes a trader’s own information from the information inferred from others’ actions (Banerjee, 1992; Bikhchandani et al., 1992). Financial knowledge may provide criteria for judging those signals rather than accepting popularity as evidence. This is the basis for the expected negative FL–herding association; it does not imply that following others is always irrational. Herding may also accompany reactive entry, repeated monitoring, and larger positions. Noise-trader theory explains why collective demand need not reflect fundamentals (De Long et al., 1990). We therefore expect herding to be positively associated with PCTS.
H2b.
Financial literacy is negatively associated with herding.
H3b.
Herding is positively associated with PCTS.
H4b.
Financial literacy has a negative statistical indirect association with PCTS through herding.
2.6. Loss Aversion
Prospect theory predicts that people often react more strongly to losses than to gains of the same size (Kahneman & Tversky, 1979). In investment settings, the related disposition effect occurs when investors realize gains early but retain losing positions to avoid recognizing losses (Odean, 1998a; Shefrin & Statman, 1985). The study items capture this tendency by asking about closing sure gains and retaining or increasing risk in losing crypto positions.
Financial knowledge provides a forward-looking basis for assessing a losing position through opportunity cost and diversification (Lusardi & Mitchell, 2014). The disposition-effect account instead emphasizes the original reference point and reluctance to realize a loss (Shefrin & Statman, 1985; Odean, 1998a). The proposed negative FL–loss-aversion association concerns these reported trading tendencies, not a directly measured loss-aversion parameter. Persistence and loss chasing may accompany the difficulties recorded by PCTS. We therefore expect a positive loss-aversion–PCTS association, while treating the proposed indirect path as cross-sectional rather than causal.
H2c.
Financial literacy is negatively associated with loss aversion.
H3c.
Loss aversion is positively associated with PCTS.
H4c.
Financial literacy has a negative statistical indirect association with PCTS through loss aversion.
2.7. Overconfidence
Overconfidence occurs when traders assess their information, timing, or skill too favorably. Success can reinforce confidence even when market noise or luck partly explains the outcome (Gervais & Odean, 2001). Theory and brokerage evidence link overconfidence with higher turnover and weaker net performance (Barber & Odean, 2000; Odean, 1998b). The retained items cover perceived outperformance, timing ability, reliance on one’s own view, and trading frequency relative to peers.
Demonstrated knowledge and perceived skill are different constructs. Knowledge may make forecasting limits more apparent, while self-attribution can sustain confidence after success that partly reflects luck (Lusardi & Mitchell, 2014; Gervais & Odean, 2001). We therefore hypothesize, rather than assume, that higher FL is associated with less overconfidence. The turnover and performance relationships examined by Barber and Odean (2000) motivate a separate positive association between overconfidence and trading-related difficulties. The present survey does not directly compare subjective probabilities with realized outcomes.
H2d.
Financial literacy is negatively associated with overconfidence.
H3d.
Overconfidence is positively associated with PCTS.
H4d.
Financial literacy has a negative statistical indirect association with PCTS through overconfidence.
2.8. Social Media Influence
Social media influence is an external information pathway, not a behavioral bias. The three items record regular use of social media for crypto information, the influence of posts on decisions, and greater willingness to trade after seeing other people’s reported profits. Attention research shows that visibility affects what retail investors buy, while studies on crypto document short-term market reactions to influential posts and weaker longer-term outcomes following influencer mentions (Ante, 2023; Barber & Odean, 2008; Merkley et al., 2024).
Attention research distinguishes the visibility of a claim from its information value (Barber & Odean, 2008; Merkley et al., 2024). Financial knowledge may help traders question whether displayed profits account for risk, fees, and unsuccessful trades. This provides the proposed basis for a negative FL–social-media association. It does not imply that knowledgeable traders avoid social media. Responsiveness to posts and peer profits may also accompany repeated monitoring and trading, supporting the proposed positive relationship with PCTS. Digital-engagement reports provide relevant context, but the model itself tests contemporaneous associations (ESMA, 2026; IOSCO, 2025).
H2e.
Financial literacy is negatively associated with susceptibility to social media influence.
H3e.
Susceptibility to social media influence is positively associated with PCTS.
H4e.
Financial literacy has a negative statistical indirect association with PCTS through susceptibility to social media influence.
2.9. Parallel Indirect Paths and Conceptual Model
The five pathways represent related but different concepts. FOMO concerns missed opportunities; herding concerns others’ actions; loss aversion concerns responses to gains and losses; overconfidence concerns perceived skill; and social media influence concerns digital information. Estimating them together gives each specific indirect association conditional on the other pathways. It does not make correlated pathways independent or establish that each explains a separate share of a causal process.
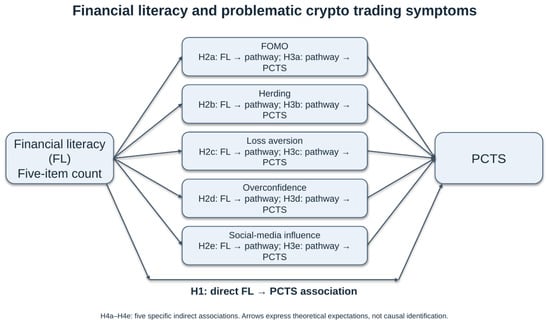
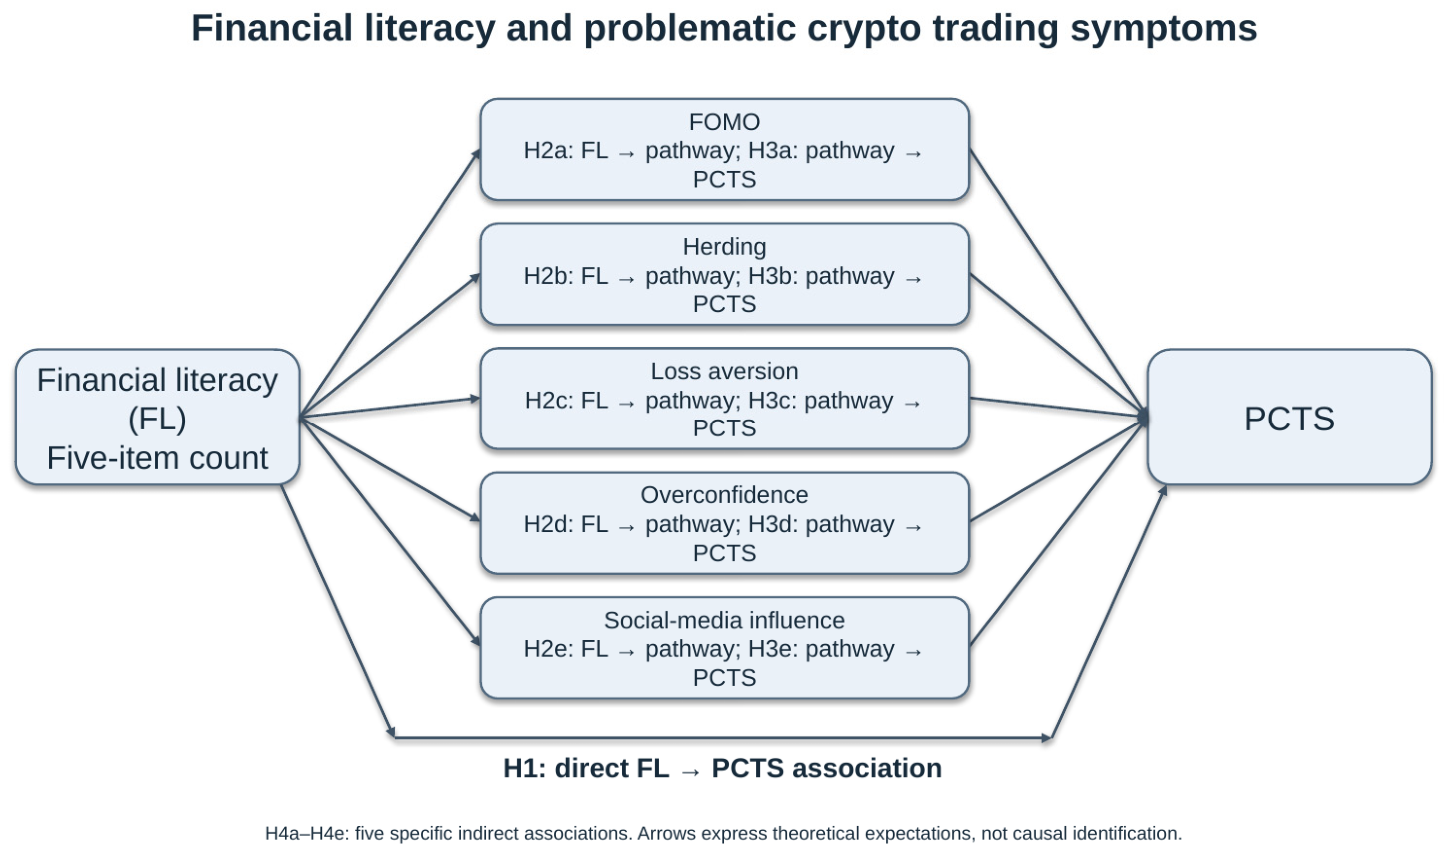
Figure 1 presents the conceptual model. H1 covers the direct association. H2a–H2e link FL with the five pathways, H3a–H3e link the pathways with PCTS, and H4a–H4e represent the five specific indirect associations. The arrows indicate theory-consistent statistical relationships, not temporal order.
Figure 1.
Final focal model. FL is the observed five-item knowledge count. The seven constructs and 11 structural paths are identical in the native algorithm and bootstrap. H4a–H4e concern the five specific indirect associations. Education is examined in a separate background model.
3. Materials and Methods
3.1. Participants and Reconstruction of the Analytic Sample
We administered an English-language SurveyMonkey questionnaire in April 2026. The target population comprised adult self-directed cryptocurrency traders or investors active during the preceding 12 months. The original export contained 1,344 panel response records and four expert questionnaire-test records from a separate collector. We excluded the four test records from all participant analyses. The sample-selection process described below yielded 428 panel respondents.
We reconstructed sample membership from the original row-level export. Among the 500 panel records with affirmative consent, 55 have no completed focal FL, pathway, or PCTS items. All 55 report less than one year of cryptocurrency experience; this association does not establish the cause of the survey routing. Of the remaining 445 complete records, 428 selected strongly agree, agree, or somewhat agree on AC1. Seventeen selected another AC1 response. This broad-agreement rule reproduces the historical retained panel sample. It is not equivalent to following AC1’s literal instruction to select agree.
Within the 428-case reference sample, 361 selected the exact AC1 answer of agree; 67 selected another agreement category. AC2 answers were mixed and do not establish that all retained cases passed that check. Nine retained records lack S2’s self-directed-trading response; one of those also lacks S1. We retain these records in the historical reference analysis rather than reconstruct unobserved answers. Separate checks restrict the sample to the 419 records with affirmative S1/S2 evidence and to the 361 literal AC1 passes. One age response is undisclosed; none reports an age below 18. These boundaries prevent describing the reference sample as independently verified eligible respondents in every case. Table A3 distinguishes observed response records and question totals from a verified invitation count, which the export does not supply.
3.2. Measures and Item Coding
We reconstructed FL1–FL5 directly from the selected response labels in the original export. A correct response receives 1. An observed incorrect, do-not-know, or prefer-not-to-say response receives 0. We did not treat an unanswered item as an incorrect answer. All focal items are complete in the reference sample. The primary FL measure, FL_COUNT5, is the exact sum of the five coded items and ranges from 0 to 5. It gives equal weight to the five knowledge domains. We do not interpret a fixed single-indicator loading as evidence of perfect measurement or report reflective average variance extracted (AVE) for this observed count.
Before analyzing the original data, we selected FL2–FL4 and documented this decision in our research diary. These items cover inflation, diversification, and bond-price sensitivity; they are not the conventional Big Three set. The primary analysis uses the exact five-item count, while the originally specified three-item reflective model provides a sensitivity comparison. We also estimate the five-item reflective specification to show its measurement performance. The retrospective score column is not used in the current models; Appendix C.3 describes the reconstruction and provenance checks.
The FOMO, herding, loss-aversion, and overconfidence items retain the questionnaire’s adapted wording and seven-point agreement scales (Kaur et al., 2024). The three social-media items are study-specific. Their coding runs from 1 (strongly disagree) to 7 (strongly agree). The 15 PCTS items use 1 (never) to 5 (always). We retain the source instrument’s item identifiers, including the gap at PCTS14, which the original scale-development study removed (Menteş et al., 2021). The PCTS measure captures symptom frequency, not a clinical diagnosis.
We additionally represent the PCTS measure as its two source domains: withdrawal/tolerance (PCTS1–PCTS10 and PCTS12) and money-seeking/denial (PCTS11, PCTS13, PCTS15, and PCTS16) (Table 1). FL and all five pathway constructs predict both domains. No structural path is imposed between the domains. Appendix A contains the administered item wording, and Appendix B contains the indicator-level diagnostics.
Table 1.
Construct operationalization.
3.3. Data Preparation and Controls
We preserved the original export and assigned a nonidentifying audit key to each response. The reconstruction script decodes the export’s one-hot response columns, checks valid ranges and unique response identifiers, removes the four expert test records, and reconstructs the exact FL count. It does not impute focal responses, delete cases based on model coefficients, or reuse the old derived score. The same 428 rows provide the descriptive and primary model results.
Demographic and trading categories come from the original responses. Undisclosed and not-applicable categories remain explicit rather than being replaced with the most common category. The native focal model excludes education. In the separately identified background and independent sensitivity specifications, four categorical education indicators predict FL, with high-school/vocational education as reference. The independent controlled model adds 16 indicators representing age, gender, income, experience, trading frequency, leverage, and liquidation history to the PCTS equation. Extra indicators preserve nonresponse categories. Table A8a and the codebook specify every rule and reference group. Product-use responses are multiple-selection self-reports; they do not verify legal access to a product or identify the trading venue.
3.4. Estimation and Analytical Provenance
The initial study analyses used SmartPLS 4 (Ringle et al., 2024). Earlier reporting used standardized rescalings of partially standardized FL coefficients rather than the values displayed in the original export, for example, −0.105 rather than −0.212. Binary-variable treatment can affect the coefficient metric (SmartPLS, n.d.-b). Subsequent independent Python analyses reconstructed the raw inputs and evaluated alternative specifications. The present focal results instead use a matched native SmartPLS 4.1.1.9 algorithm and bootstrap for the final education-free model. The focal coefficients and confidence intervals come directly from matching SmartPLS algorithm and bootstrap runs.
The native focal model contains the observed FL_COUNT5, five reflectively specified pathway blocks, and PCTS: seven constructs, 11 structural paths, and 36 modeled variables. We used ordinary partial least squares structural equation modeling (PLS-SEM) with path weighting, automatic outer weighting for the reflective blocks, standardized results, initial weights of 1.0, a convergence criterion of 10−7, and a maximum of 3000 iterations. The algorithm converged in six recorded iterations. Bootstrapping used 10,000 subsamples, complete results, two-tailed tests, a significance level of 0.05, percentile intervals, and the software’s fixed-seed option. The exported report does not disclose the numeric seed. Both runs use the same 428 cases and the same measurement and structural specification.
We report the native original-sample coefficients as standardized β, together with their corresponding native t-values, p-values, and 95% percentile intervals. The native combined-indirect and total intervals are taken directly from their own reported bootstrap distributions. We do not add separate interval endpoints (Nitzl et al., 2016). For independently calculated supplementary analyses, the interval criterion determines statistical support; approximate p-values and percentile intervals can differ for borderline paths, and both are reported.
Verification compared all 15,408 modeled input values, the inner and outer model matrices, and the algorithm coefficients against the bootstrap original-sample results. The 11 direct coefficients, five specific indirect coefficients, 36 loadings, and 36 weights agree exactly at the exported precision. Shared focal point estimates also agree with the preceding independent 428-case analysis to numerical precision. This verifies the current native focal model, not a native bootstrap for the education paths. Supplementary Material S1 contains the aggregate native-output verification, export-checking script, independent analytical code, model specifications, and aggregate results. It contains no participant-level data.
Education was examined separately because the education-inclusive native bootstrap did not complete. Omitting this upstream block left the shared focal point estimates unchanged to numerical precision. The supplementary Python analyses retain their own education specifications and bootstrap intervals.
3.5. Sensitivity and Prediction Checks
We retained the independent comparisons of the count and original three-item reflective specifications in the 428-case reference sample and two reduced samples. Sample A excludes the 48 records with a response of 7 on all 20 pathway items and 5 on all 15 PCTS items (n = 380). Sample B excludes the 52 records that are constant within both blocks (n = 376). The first group is a subset of the second; the exclusions are not sequential. The exclusion rules were specified before estimating the reduced-sample models. They identify response patterns for sensitivity analysis rather than classify individual respondents as invalid. These matched independent comparisons retain the education background block and are identified separately from the native education-free focal model.
Other independent checks cover five-item reflective FL, the two PCTS domains, the controlled model, explicit S1/S2 evidence, and literal AC1 compliance. They retain the same focal pathways and use the documented Python Mode A/path-weighting routine. Each of 10,000 resamples re-estimates standardization, weights, scores, and paths (seed 20261014). Rare education or control categories can become constant; only that predictor is omitted from the affected regression, and its coefficient is recorded as unavailable. All focal coefficients have 10,000 valid draws. Table A12 identifies each analysis and source.
Previously calculated prediction checks are retained as independent assessments of the education-inclusive background and controlled specifications, not as native PLSpredict results for the education-free focal model. They use 10-fold cross-validation repeated 10 times (seed 20261014), refitting scaling, weights, and paths within each training fold. Earliest-antecedent prediction uses the education indicators in the background model; direct-antecedent prediction assumes observed FL and pathway indicators. Both compare PCTS item errors with the training mean and a same-information linear model (SmartPLS, n.d.-a). The information sets remain distinct, and no superior predictive performance is claimed for the final native focal model.
Measurement assessment uses native loadings, reliability, AVE, indicator and structural variance inflation factors (VIFs), and heterotrait–monotrait ratio (HTMT) intervals for the six multi-item blocks (Hair et al., 2019, 2022; Henseler et al., 2015). The observed FL count has no reflective-block HTMT comparison. We compare unrounded upper limits of native two-sided 95% HTMT intervals with 0.85 and 0.90 (Franke & Sarstedt, 2019). Full-collinearity VIFs remain separately computed score diagnostics (Kock, 2015). Native composite and mixed saturated/estimated fit statistics and the complete-bootstrap fit reference quantiles appear in Table A9e. These reference quantiles are not two-sided coefficient confidence intervals. Prior independent fit recipes remain labeled background calculations in Table A9d. Neither set establishes satisfactory overall fit. The cross-validated predictive ability test (CVPAT) was not performed.
3.6. Procedure and Ethics
Questionnaire sections and different response formats provided procedural separation, but all focal responses were collected at one time. No unrelated marker variable was available. The diagnostics and sensitivity checks therefore do not eliminate common-source covariance or establish causal mediation (Podsakoff et al., 2003; Maxwell & Cole, 2007; Maxwell et al., 2011).
Participants received study information, an electronic consent choice, and an EIM contact for study-related concerns. The Institutional Review Board and Ethics Board of EIM approved the study on 27 March 2026 (IRB 20260301), as reported in the study documentation. Direct platform identifiers and the private audit crosswalk are not included in the public supplement.
4. Results
4.1. Sample and Descriptive Results
The analytical sample contains 428 panel respondents. Table 2 reports demographics, and Table 3 reports the trading profile, including undisclosed categories. The exact FL count has a mean of 2.888 and SD of 1.406; PCTS and pathway descriptives are calculated from the retained item responses (Table 4). These are not diagnostic prevalence estimates.
Table 2.
Demographic profile (n = 428).
Table 3.
Trading profile (n = 428).
Table 4.
Item-average descriptives and exact FL count.
4.2. Measurement and Discriminant Validity
Table 5 reports native SmartPLS reliability and convergent-validity statistics for the six reflective blocks. The primary FL variable is an observed count, not a five-item reflective scale. PCTS consistency remains unusually high; Appendix B reports its native indicator loadings and VIFs. High reliability does not rule out redundant content or response-style contributions.
Table 5.
Reflective measurement results for the primary count model.
Nine of 15 native HTMT interval upper limits exceed 0.85, and one exceeds 0.90 (Table A5). Discriminant validity is therefore not established for several pairs under the specified criterion. The 15 comparisons concern the six reflective constructs. The observed FL count is not included in the HTMT assessment. This change in denominator is a measurement change, not evidence that overlap was removed.
4.3. Direct and Indirect Associations
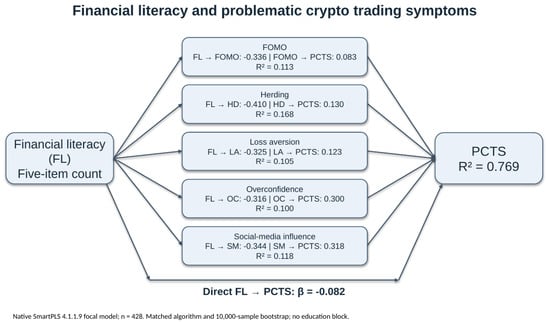
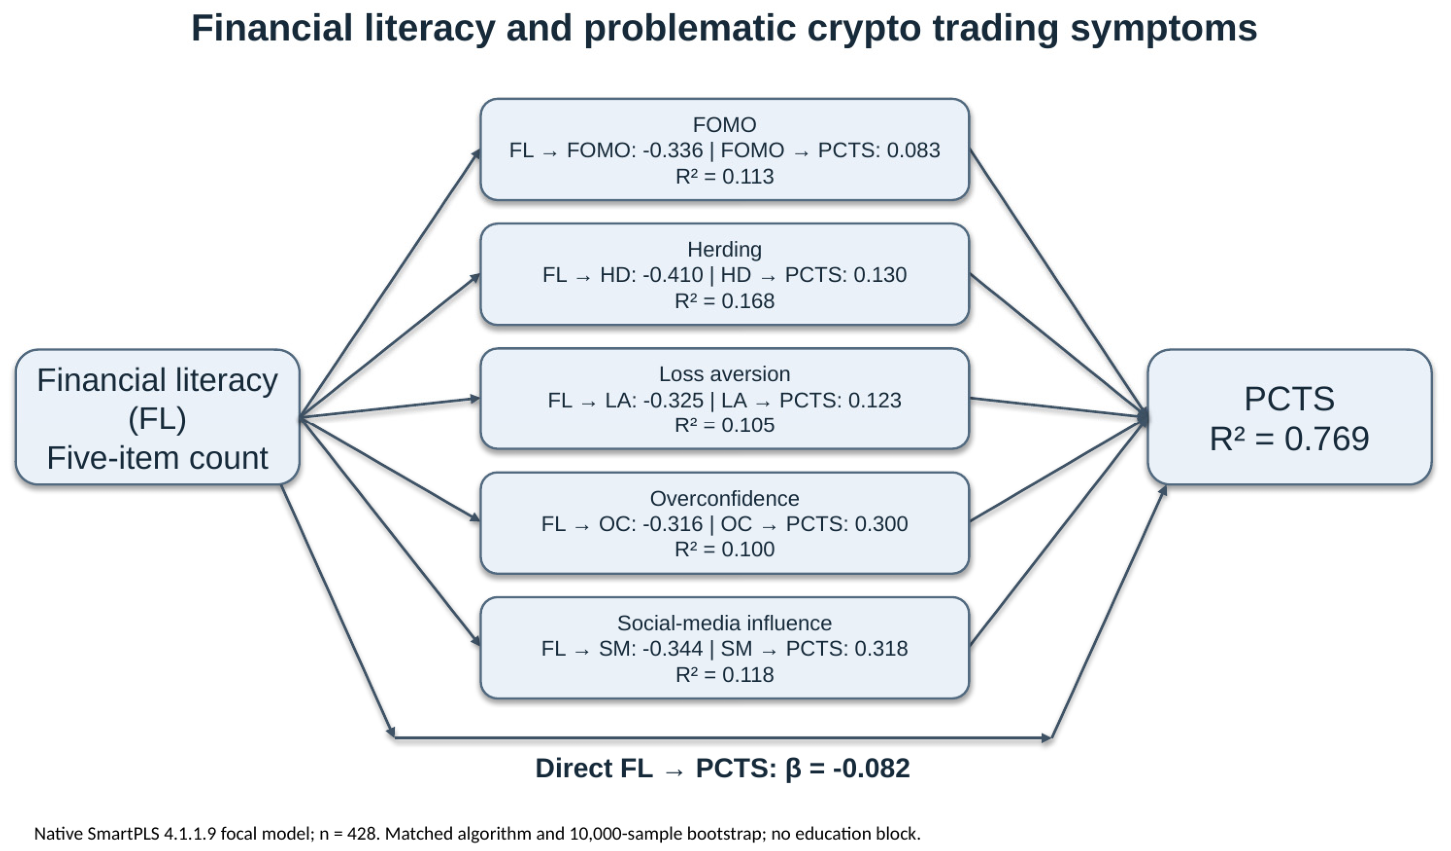
The native focal model yields a negative direct FL–PCTS coefficient (β = −0.082, p = 0.003, and 95% CI [−0.137, −0.030]). FL is negatively associated with each pathway, and each pathway has a positive conditional association with PCTS (Table 6). The model explains 76.9% of PCTS variance (R2 = 0.769; adjusted R2 = 0.766). The direct FL contribution has f2 = 0.024. Figure 2 summarizes the focal model. These are in-sample associations, not causal influence or verified future predictive performance.
Table 6.
Standardized focal direct associations (n = 428).
Figure 2.
Native SmartPLS focal model, n = 428. Labels show original-sample standardized coefficients and R2 from the matched education-free algorithm and bootstrap. Education is a separate background specification. The diagram does not imply temporal or causal identification.
The native combined-indirect coefficient is −0.326 [−0.393, −0.256], and the total FL–PCTS association is −0.408 [−0.491, −0.321] (Table 7). The decomposition is conditional on the joint specification of correlated constructs. It does not identify five distinct mechanisms or the proportion of a causal effect mediated.
Table 7.
Specific and combined indirect associations.
4.4. Response-Pattern Sensitivity
Table 8 retains the independently bootstrapped count and original three-item comparisons in the full and reduced samples. These matched specifications include the education background block; they are not new native reduced-sample runs. Their full-sample focal point estimates agree with the native focal values to numerical precision, while intervals retain their own source. The all-maximum and dual-block-constant groups remain 48 and 52 after removal of the experts. All six direct FL–PCTS intervals exclude zero. Overall coefficients and explained variance decrease after exclusion. The results show sensitivity to the flagged response patterns, without establishing whether individual respondents were careless.
Table 8.
Matched response-pattern sensitivity analyses.
FOMO requires a narrower interpretation. Its indirect percentile interval includes zero in both reduced three-item models. In the reduced count models, the interval narrowly excludes zero, but normal-approximation p-values are 0.059 and 0.053. This is borderline, criterion-dependent evidence rather than uniform pathway stability. The other four reduced-sample indirect intervals remain below zero. Table A10b,c and Supplementary Material S1 give the full numerical results.
The all-maximum group has a mean FL count of 1.729 versus 3.034 in the remaining 380 respondents. The dual-block-constant group has a mean of 1.673 versus 3.056 in the remaining 376 (Table A10a). All 48 all-maximum cases are among the 97 PCTS16 responses of always; 49 such responses remain after either exclusion. These differences do not establish random answering. PCTS standardized alpha falls from 0.981 to approximately 0.973, so high consistency persists.
4.5. Alternative Measurement, Controls, and Screening Boundaries
The five-item reflective FL model has a standardized alpha of 0.576, composite reliability of 0.649, and AVE of 0.363. These results do not support replacing the equal-weight primary count with a five-item reflective scale. The three-item comparison retains its planned measurement interpretation but does not establish superiority over the count (Table A7a).
In the two-domain count model, the direct FL associations are −0.068 [−0.122, −0.016] for withdrawal/tolerance and −0.113 [−0.181, −0.048] for money-seeking/denial. The FOMO indirect association with money-seeking/denial is positive but uncertain: 0.023 [−0.002, 0.052]. Domain HTMT is 0.915 [0.892, 0.936]. The domains remain strongly overlapping rather than independent (Table A7c).
With the seven control families, the direct FL–PCTS association remains negative (β = −0.082; 95% CI [−0.134, −0.029]). PCTS R2 is 0.804, and adjusted R2 is 0.793. Table A8a,b reports the coding and coefficients. These controls assess measured background differences; trading frequency and liquidation may, themselves, relate to trading difficulties, so the check does not establish causal deconfounding.
The screening-boundary checks also retain negative direct associations: β = −0.083 [−0.138, −0.029] in the 419 records with explicit S1/S2 responses, and β = −0.084 [−0.146, −0.022] among the 361 literal AC1 passes (Table A4b). These checks do not convert missing eligibility information into verified eligibility or validate every original response. The 428-case analysis remains the explicitly qualified historical panel reference.
4.6. Collinearity, Model Fit, and Prediction
Full-collinearity VIFs are FL, 1.244; FOMO, 2.798; herding, 3.022; loss aversion, 2.660; overconfidence, 3.460; social media influence, 3.632; and PCTS, 4.331 (Table A6a). Three exceed 3.3. For the matched native focal model, composite saturated/estimated standardized root mean square residual (SRMR) is 0.045/0.315; the corresponding mixed-report values are 0.052/0.338. Native fit discrepancies also exceed their reported 95% reference quantiles (Table A9e). These results do not support satisfactory overall fit. Numerical replication of coefficients does not resolve fit, construct overlap, or common-source covariance.
The retained prediction results concern the separate education-inclusive background specifications. For its full-sample count model, earliest-antecedent Q2predict ranges from 0.005 to 0.013, but the linear benchmark has lower root mean square error (RMSE) and mean absolute error (MAE) for all 15 PCTS indicators. Direct-antecedent prediction gives Q2predict of 0.529–0.647, with lower PLS error for seven indicators by RMSE and six by MAE. In both reduced samples, the earliest-antecedent Q2predict is negative for all PCTS items (Table A9a). The education-inclusive background models do not consistently outperform the linear benchmark. These prediction results apply only to those background specifications.
5. Discussion
5.1. Financial Literacy and PCTS
Higher financial literacy was associated with lower PCTS in the primary model and across the examined measurement and sample specifications. The direct association was modest (β = −0.082), while the total modeled association was −0.408. Both remained negative after excluding flagged response patterns, although their magnitudes decreased. The findings are consistent with a knowledge-evaluation account but do not demonstrate that increasing knowledge reduces symptoms. Ryu (2024) similarly connects financial literacy with problematic Bitcoin investment behavior; the present study tests a symptom-frequency outcome and documents how its results change under explicit data and measurement checks.
The exact count improves interpretability: one point represents one correctly answered knowledge question, and no PLS-estimated item weight determines the score. The retained three-item analysis shows that the inverse association is not unique to that scoring choice. Neither specification establishes that financial knowledge alone is sufficient for controlled trading. The poorer five-item reflective diagnostics support reporting the count without claiming a homogeneous five-item latent scale (Lusardi & Mitchell, 2014, 2023).
5.2. Interpretation of Behavioral and Social-Information Pathways
The five pathways connect PCTS with how traders interpret information, assess their abilities, and respond to trading opportunities and losses. Social media influence (β = 0.318) and overconfidence (β = 0.300) were positively associated with PCTS in the primary model. These findings concern responsiveness to online posts and self-assessed trading ability. Herding (β = 0.130), loss aversion (β = 0.123), and FOMO (β = 0.083) were also positively associated with PCTS, linking trading difficulties with reliance on peers, reluctance to realize losses, and concern about missed opportunities. Each association accounts for FL and the other pathways (Table 6). Higher FL was associated with lower scores on all five constructs, yielding negative specific indirect associations with PCTS (Table 7). Together, these findings motivate testing financial education that combines critical evaluation of online information, confidence calibration, independent assessment of trades, and explicit decision criteria.
The proposed constructs remain theoretically distinguishable, but the empirical measures are not sufficiently separated for several pairs under the chosen HTMT criterion. The indirect coefficients are conditional associations among correlated scores. They should not be read as five distinct mechanisms, five independent shares of investor harm, or a causal sequence. FOMO is particularly sensitive to measurement and sample choices. Evidence for the FOMO pathway varies across the domain, measurement, and reduced-sample specifications.
Removing flagged respondents reduces PCTS R2 and the total FL association. The flagged groups therefore contribute materially to the fitted strength of the full-sample associations; these flags do not establish each respondent’s response process. The persistent negative direct and combined indirect coefficients show that the association is not confined to the flagged groups, but they do not verify the validity of every remaining response. Full-collinearity and HTMT concerns remain after these checks (Kock, 2015; Henseler et al., 2015; Podsakoff et al., 2003).
5.3. Contribution and Comparison with Prior Research
The study contributes evidence of an inverse association between financial knowledge and trading-related difficulties and examines this association across alternative measurement and sample specifications. The PCTS outcome distinguishes this study from research on participation or investment intention (Kaur et al., 2024; Menteş et al., 2021). Recent financial-literacy studies link knowledge with financial management through attitudes, trust, or applied practices (Eche-Querevalú et al., 2026; Pérez-Campdesuñer et al., 2026). Here, comparable mechanism-oriented arguments motivate the model, but measurement overlap and cross-sectional data limit what the indirect paths establish.
5.4. Implications for Regulators and Industry
The implications for regulators and industry are to develop and evaluate investor-protection measures that combine financial knowledge, confidence calibration, and critical evaluation of online information. We recommend testing these components together in investor-education initiatives. Promotion disclosures should distinguish paid claims from independent analysis and present risks alongside returns. This agenda builds on existing work on digital engagement and investor education (IOSCO, 2023, 2024, 2025; ESMA, 2026).
For trading firms, we propose evaluating source labels, transparent net-performance displays, pre-trade risk prompts, and feedback comparing expected and realized outcomes. Leverage, funding, fees, and liquidation scenarios provide relevant educational content (Chen et al., 2024; Cheng et al., 2021). Randomized evaluations can test whether these measures improve trading decisions and reduce PCTS. Intervention priorities should follow the evidence generated by these evaluations.
5.5. Limitations
This study is cross-sectional and uses self-reported pathways and PCTS measures. It cannot establish temporal ordering, causal mediation, clinical diagnosis, or future financial losses (Maxwell & Cole, 2007; Maxwell et al., 2011). The sample has a high symptom profile, considerable leverage experience, and selected panel participation; it should not be treated as representative of all U.S. retail traders.
Raw-data reconstruction identified expert test records, incomplete screening responses, and a broader historical AC1 agreement selection than the literal instructed answer. The present 428-case reference excludes the expert tests but retains those historical screening boundaries openly. Checks with explicit eligibility evidence and literal AC1 passes support the direction of the association without proving that every retained response is valid. The observed export records cannot independently establish the cause of all missing responses or the original routing configuration.
The knowledge test is general rather than cryptocurrency-specific; the social-media items are study-specific; PCTS and the pathway measures overlap. High reliability, significant coefficients, and high in-sample R2 do not resolve those measurement limits. Reduced-sample and predictive results weaken broad claims of stability or predictive superiority. Future studies can build on these findings by combining verified respondent eligibility, cryptocurrency-specific knowledge measures, repeated observations, and transaction-level outcomes. Randomized evaluations can then test whether financial education and platform interventions reduce PCTS over time.
6. Conclusions
In the 428-case panel reference sample, higher financial literacy was associated with lower PCTS. The inverse direct association remained with the original three-item measure, both response-pattern exclusions, the PCTS domains, controls, and the screening-boundary checks. The strength of the relationship was sensitive to response patterns, and the indirect coefficients do not establish distinct causal mechanisms.
For regulators and trading firms, the findings provide an empirical basis for testing investor-protection measures that combine financial knowledge, confidence calibration, and critical evaluation of online information. Financial literacy therefore deserves explicit attention in the design and evaluation of initiatives addressing problematic cryptocurrency trading.
Supplementary Materials
The following supporting information can be downloaded at: https://www.mdpi.com/article/10.3390/jrfm19110935/s1, Supplementary Material S1 contains analytical code, model specifications, variable-coding documentation, aggregate native-output verification, and aggregate statistical results. It contains no participant-level responses or identifying audit records. Supplementary model names are mapped to their specifications in Table A12 and the accompanying README.
Author Contributions
Conceptualization, M.N., W.R., P.G. and M.L.; methodology, M.N.; software, M.N.; validation, M.N.; formal analysis, M.N.; investigation, M.N.; resources, M.N., W.R., P.G. and M.L.; data curation, M.N.; writing—original draft preparation, M.N.; writing—review and editing, M.N., W.R., P.G. and M.L.; supervision, M.N., W.R., P.G. and M.L. All authors have read and agreed to the published version of the manuscript.
Funding
The authors received no external funding.
Institutional Review Board Statement
The Institutional Review Board and Ethics Board of EIM—the European Institute of Management—approved the study on 27 March 2026 (IRB 20260301).
Informed Consent Statement
Informed consent was obtained from all subjects involved in the study.
Data Availability Statement
Analytical code and aggregate results are publicly available in Supplementary Material S1. Participant-level responses, identifying audit records, and complete SmartPLS reports containing respondent-level data are not publicly available. Requests for access to deidentified participant-level data should be directed to the corresponding author and are subject to the study’s approved confidentiality and data-management conditions.
Acknowledgments
The authors used ChatGPT (OpenAI 5.6) to assist with language editing, translation, formatting, and the checking of analytical code. The Methods distinguish the native SmartPLS estimates from the independent Python (3.15.2) supplementary analyses. The authors reviewed the outputs and remain responsible for the manuscript.
Conflicts of Interest
The authors declare no conflicts of interest.
Appendix A. Administered Focal Items and Coding
Table A1.
Original focal-item wording.
Appendix B. Indicator-Level Diagnostics
Table A2.
Primary-model outer loadings and VIFs.
Appendix C. Sample Reconstruction and Supplementary Analyses
Appendix C.1. Response Records and Screening Evidence
Table A3.
Original response totals and reconstructed sample.
Table A4.
(a) Observed attention-item answers in the reference sample. (b) Screening-boundary sensitivity analyses.
Appendix C.2. Measurement Separation and Score Diagnostics
Table A5.
HTMT and bootstrap intervals for the primary reflective blocks.
Table A6.
(a) Construct-score distribution and full-collinearity VIFs. (b) Focal construct-score correlations.
Appendix C.3. Financial-Literacy Specification and Raw-Input Audit
The retrospectively supplied FL_SCORE was not part of the raw one-hot questionnaire responses and is excluded from the current analytic files. The earlier 432-case working file showed 12 differences between that score and the sum of its own five coded items. We calculated the archived score retrospectively. The available records do not establish the cause of the discrepancies. All current FL inputs are reconstructed directly from the original response labels. Count-based models use FL_COUNT5, whereas the reflective sensitivity models use the corresponding item indicators. In particular, observed ‘Prefer not to say’ responses are coded 0, not as the correct answer.
Table A7.
(a) FL measurement alternatives in the 428-case sample. (b) Archived score discrepancies (historical working file only). (c) Source-domain results.
The new reconstruction checks every model input directly: all five knowledge items, 35 pathway/PCTS indicators, the exact count, four education indicators, and 16 control indicators. All current analysis values satisfy their stated coding rules. We do not import old product-count or contradiction summaries. We calculated descriptive product flags and counts from the raw multiple-selection responses. We retained contradictory selections as recorded and flagged them in the audit. This verifies the current analytic input, not every archived derived field or the historical cause of each old transformation. The original file and private crosswalk remain unchanged and restricted.
Appendix C.4. PCTS Domains and Controlled Models
Table A8.
(a) Education and control coding with estimated coefficients. (b) Focal paths with and without controls.
Appendix C.5. Out-of-Sample Prediction and Model-Fit Calculation
Table A9.
(a) Independent prediction summaries for education-inclusive background specifications. (b) Education-inclusive count background model: Earliest-antecedent predictions. (c) Education-inclusive count background model: Direct-antecedent predictions. (d) Independent background-model SRMR calculations. (e) Matched native focal-model fit statistics and bootstrap reference quantiles.
Appendix C.6. Response-Pattern Groups and Pathway Sensitivity
Table A10.
(a) FL profiles of flagged and remaining respondents. (b) Exact count: Specific indirect paths across samples. (c) Three-item reflective: Specific indirect paths across samples.
Table A11.
PCTS item distributions (n = 428).
Table A12.
Analytical sources and model scope.
References
- Almeida, J., & Gonçalves, T. C. (2023). A systematic literature review of investor behavior in the cryptocurrency markets. Journal of Behavioral and Experimental Finance, 37, 100785. [Google Scholar] [CrossRef] [Scilit]
- Ante, L. (2023). How Elon Musk’s Twitter activity moves cryptocurrency markets. Technological Forecasting and Social Change, 186, 122112. [Google Scholar] [CrossRef] [Scilit]
- Banerjee, A. V. (1992). A simple model of herd behavior. The Quarterly Journal of Economics, 107(3), 797–817. [Google Scholar] [CrossRef] [Scilit]
- Barber, B. M., & Odean, T. (2000). Trading is hazardous to your wealth: The common stock investment performance of individual investors. The Journal of Finance, 55(2), 773–806. [Google Scholar] [CrossRef] [Scilit]
- Barber, B. M., & Odean, T. (2008). All that glitters: The effect of attention and news on the buying behavior of individual and institutional investors. The Review of Financial Studies, 21(2), 785–818. [Google Scholar] [CrossRef] [Scilit]
- Bikhchandani, S., Hirshleifer, D., & Welch, I. (1992). A theory of fads, fashion, custom, and cultural change as informational cascades. Journal of Political Economy, 100(5), 992–1026. [Google Scholar] [CrossRef] [Scilit]
- Chen, E., Ma, M., & Nie, Z. (2024). Perpetual future contracts in centralized and decentralized exchanges: Mechanism and traders’ behavior. Electronic Markets, 34, 35. [Google Scholar] [CrossRef] [Scilit]
- Cheng, Z., Deng, J., Wang, T., & Yu, M. (2021). Liquidation, leverage, and optimal margin in bitcoin futures markets. Applied Economics, 53(47), 5415–5428. [Google Scholar] [CrossRef] [Scilit]
- Delfabbro, P., King, D. L., & Williams, J. (2021). The psychology of cryptocurrency trading: Risk and protective factors. Journal of Behavioral Addictions, 10(2), 201–207. [Google Scholar] [CrossRef] [Scilit]
- De Long, J. B., Shleifer, A., Summers, L. H., & Waldmann, R. J. (1990). Noise trader risk in financial markets. Journal of Political Economy, 98(4), 703–738. [Google Scholar] [CrossRef] [Scilit]
- Eche-Querevalú, P., Mejía-Osorio, A. G., Rojas-Villanueva, E. J., Vega-Lazo, F. H., & Chávez-Díaz, J. M. (2026). Applied financial learning as a key predictor of financial self-management in higher education evidence from Peruvian university students. Journal of Risk and Financial Management, 19(6), 415. [Google Scholar] [CrossRef] [Scilit]
- European Securities and Markets Authority. (2026). Report on the retail investor journey: Understanding retail participation in capital markets (ESMA35-243228190-7410). Available online: https://www.esma.europa.eu/sites/default/files/2026-03/ESMA35-243228190-7410_-_Report_CfE_on_retail_investor_journey.pdf (accessed on 21 May 2026).
- FINRA Investor Education Foundation. (2021). 2021 national financial capability study: State-by-state survey instrument. FINRA Investor Education Foundation. [Google Scholar]
- Franke, G. R., & Sarstedt, M. (2019). Heuristics versus statistics in discriminant validity testing: A comparison of four procedures. Internet Research, 29(3), 430–447. [Google Scholar] [CrossRef] [Scilit]
- Gervais, S., & Odean, T. (2001). Learning to be overconfident. The Review of Financial Studies, 14(1), 1–27. [Google Scholar] [CrossRef] [Scilit]
- Grubbs, J. B., & Kraus, S. W. (2024). Cryptocurrency and addictive behaviors in a census-matched U.S. sample. International Gambling Studies, 24(2), 291–305. [Google Scholar] [CrossRef] [Scilit]
- Hair, J. F., Hult, G. T. M., Ringle, C. M., & Sarstedt, M. (2022). A primer on partial least squares structural equation modeling (PLS-SEM) (3rd ed.). Sage. [Google Scholar]
- Hair, J. F., Risher, J. J., Sarstedt, M., & Ringle, C. M. (2019). When to use and how to report the results of PLS-SEM. European Business Review, 31(1), 2–24. [Google Scholar] [CrossRef] [Scilit]
- Henseler, J., Ringle, C. M., & Sarstedt, M. (2015). A new criterion for assessing discriminant validity in variance-based structural equation modeling. Journal of the Academy of Marketing Science, 43, 115–135. [Google Scholar] [CrossRef] [Scilit]
- International Organization of Securities Commissions. (2023). Policy recommendations for crypto and digital asset markets (Final Report FR11/23). Available online: https://www.iosco.org/library/pubdocs/pdf/IOSCOPD747.pdf (accessed on 21 May 2026).
- International Organization of Securities Commissions. (2024). Investor education on crypto-assets (Final Report FR06/2024). Available online: https://www.iosco.org/library/pubdocs/pdf/IOSCOPD769.pdf (accessed on 21 May 2026).
- International Organization of Securities Commissions. (2025). Digital engagement practices (DEPs) (Final Report FR/07/2025). Available online: https://www.iosco.org/library/pubdocs/pdf/IOSCOPD794.pdf (accessed on 21 May 2026).
- Jain, L., Velez-Figueroa, L., Karlapati, S., Forand, M., Ahmed, R., & Sarfraz, Z. (2025). Cryptocurrency trading and associated mental health factors: A scoping review. Journal of Primary Care & Community Health, 16, 21501319251315308. [Google Scholar] [CrossRef] [Scilit]
- Johnson, B., Co, S., Sun, T., Lim, C. C. W., Stjepanović, D., Leung, J., Saunders, J. B., & Chan, G. C. K. (2023). Cryptocurrency trading and its associations with gambling and mental health: A scoping review. Addictive Behaviors, 136, 107504. [Google Scholar] [CrossRef] [Scilit]
- Kahneman, D., & Tversky, A. (1979). Prospect theory: An analysis of decision under risk. Econometrica, 47(2), 263–291. [Google Scholar] [CrossRef] [Scilit]
- Kaur, M., Jain, J., & Sood, K. (2024). “All are investing in crypto, I fear of being missed out”: Examining the influence of herding, loss aversion, and overconfidence in the cryptocurrency market with the mediating effect of FOMO. Quality & Quantity, 58, 2237–2263. [Google Scholar] [CrossRef] [Scilit]
- Kock, N. (2015). Common method bias in PLS-SEM: A full collinearity assessment approach. International Journal of e-Collaboration, 11(4), 1–10. [Google Scholar] [CrossRef] [Scilit]
- Lusardi, A., & Mitchell, O. S. (2014). The economic importance of financial literacy: Theory and evidence. Journal of Economic Literature, 52(1), 5–44. [Google Scholar] [CrossRef] [Scilit]
- Lusardi, A., & Mitchell, O. S. (2023). The importance of financial literacy: Opening a new field. Journal of Economic Perspectives, 37(4), 137–154. [Google Scholar] [CrossRef] [Scilit]
- Maxwell, S. E., & Cole, D. A. (2007). Bias in cross-sectional analyses of longitudinal mediation. Psychological Methods, 12(1), 23–44. [Google Scholar] [CrossRef] [Scilit]
- Maxwell, S. E., Cole, D. A., & Mitchell, M. A. (2011). Bias in cross-sectional analyses of longitudinal mediation: Partial and complete mediation under an autoregressive model. Multivariate Behavioral Research, 46(5), 816–841. [Google Scholar] [CrossRef] [Scilit]
- Menteş, N., & Bulut, M. (2023). Using ROC analysis to determine the cutoff score for the Problematic Cryptocurrency Trading Scale. Journal of Dependence, 24, 438–447. [Google Scholar] [CrossRef] [Scilit]
- Menteş, N., Yolbaş, İ., & Bulut, M. (2021). Development and verification of Problematic Cryptocurrency Trading Scale. Psychiatry and Clinical Psychopharmacology, 31(3), 310–318. [Google Scholar] [CrossRef] [Scilit]
- Merkley, K. J., Pacelli, J., Piorkowski, M., & Williams, B. (2024). Crypto-influencers. Review of Accounting Studies, 29, 2254–2297. [Google Scholar] [CrossRef] [Scilit]
- Meshi, D., Jang, D., Mei, Z., Ratan, R., & Foxman, M. (2026). Problematic cryptoasset trading is associated with greater depressive symptoms, anxiety symptoms, and social isolation. PLoS ONE, 21, e0349874. [Google Scholar] [CrossRef] [Scilit]
- Nitzl, C., Roldán, J. L., & Cepeda, G. (2016). Mediation analysis in partial least squares path modeling: Helping researchers discuss more sophisticated models. Industrial Management & Data Systems, 116(9), 1849–1864. [Google Scholar] [CrossRef] [Scilit]
- Odean, T. (1998a). Are investors reluctant to realize their losses? The Journal of Finance, 53(5), 1775–1798. [Google Scholar] [CrossRef] [Scilit]
- Odean, T. (1998b). Volume, volatility, price, and profit when all traders are above average. The Journal of Finance, 53(6), 1887–1934. [Google Scholar] [CrossRef] [Scilit]
- Oksanen, A., Mantere, E., Vuorinen, I., & Savolainen, I. (2022). Gambling and online trading: Emerging risks of real-time stock and cryptocurrency trading platforms. Public Health, 205, 72–78. [Google Scholar] [CrossRef] [Scilit]
- Organization for Economic Co-operation and Development. (2023). OECD/INFE 2023 international survey of adult financial literacy (OECD Business and Finance Policy Papers No. 39). OECD Publishing. [Google Scholar] [CrossRef] [Scilit]
- Özbek, M., & Topal, G. (2026). Problematic cryptocurrency trading among traders in Türkiye: A cross-sectional study of prevalence and associations with anxiety, depression, and problem gambling. Journal of Gambling Studies, 42, 409–423. [Google Scholar] [CrossRef] [Scilit]
- Pérez-Campdesuñer, R., Sánchez-Rodríguez, A., Martínez-Vivar, R., Merizalde-Paredes, J. R., De Miguel-Guzmán, M., & García-Vidal, G. (2026). Financial literacy, trust, and socioeconomic determinants of borrowers’ behavior in credit card use: A PLS-SEM analysis. Journal of Risk and Financial Management, 19(1), 9. [Google Scholar] [CrossRef] [Scilit]
- Podsakoff, P. M., MacKenzie, S. B., Lee, J.-Y., & Podsakoff, N. P. (2003). Common method biases in behavioral research: A critical review of the literature and recommended remedies. Journal of Applied Psychology, 88(5), 879–903. [Google Scholar] [CrossRef] [Scilit]
- Przybylski, A. K., Murayama, K., DeHaan, C. R., & Gladwell, V. (2013). Motivational, emotional, and behavioral correlates of fear of missing out. Computers in Human Behavior, 29(4), 1841–1848. [Google Scholar] [CrossRef] [Scilit]
- Ringle, C. M., Wende, S., & Becker, J.-M. (2024). SmartPLS 4 [Computer software]. SmartPLS. Available online: https://www.smartpls.com (accessed on 21 May 2026).
- Ryu, H.-S. (2024). What drives problematic Bitcoin investment behavior? The role of financial literacy. International Journal of Bank Marketing, 42(7), 1437–1471. [Google Scholar] [CrossRef] [Scilit]
- Shefrin, H., & Statman, M. (1985). The disposition to sell winners too early and ride losers too long: Theory and evidence. The Journal of Finance, 40(3), 777–790. [Google Scholar] [CrossRef]
- SmartPLS. (n.d.-a). PLSpredict: Assessing predictive power in PLS-SEM. Available online: https://www.smartpls.com/documentation/algorithms-and-techniques/prediction-and-segmentation/predict/ (accessed on 21 May 2026).
- SmartPLS. (n.d.-b). Reasons for different results in SmartPLS 4. Available online: https://www.smartpls.com/faq/smartpls4/different-results/ (accessed on 21 May 2026).
- Thaler, R. H. (1980). Toward a positive theory of consumer choice. Journal of Economic Behavior & Organization, 1(1), 39–60. [Google Scholar] [CrossRef] [Scilit]
- van Rooij, M., Lusardi, A., & Alessie, R. (2011). Financial literacy and stock market participation. Journal of Financial Economics, 101(2), 449–472. [Google Scholar] [CrossRef] [Scilit]

Disclaimer/Publisher’s Note: The statements, opinions and data contained in all publications are solely those of the individual author(s) and contributor(s) and not of MDPI and/or the editor(s). MDPI and/or the editor(s) disclaim responsibility for any injury to people or property resulting from any ideas, methods, instructions or products referred to in the content. |
© 2026 by the authors. Licensee MDPI, Basel, Switzerland. This article is an open access article distributed under the terms and conditions of the Creative Commons Attribution (CC BY) license.