


Abstract
Financial decision-making is essential for achieving financial stability and well-being. Despite its importance, comprehensive and psychometrically validated instruments for assessing its multiple dimensions remain limited. This study aimed to develop and validate a multidimensional instrument for assessing financial decision-making. Data were collected from 481 Lithuanian adults, who were randomly assigned to exploratory (n = 240) and confirmatory (n = 241) subsamples. Exploratory factor analysis (EFA) and confirmatory factor analysis (CFA) were conducted to examine the factor structure and evaluate the psychometric properties of the instrument. The initial 45-item instrument was refined to 36 items, resulting in a final ten-factor model. The model demonstrated satisfactory fit (CFI = 0.926, TLI = 0.913, RMSEA = 0.054, SRMR = 0.057), together with satisfactory internal consistency and discriminant validity, while convergent validity was supported for nine of the ten constructs. The findings provide preliminary support for the proposed ten-factor structure, which requires further confirmation in an independent sample.
1. Introduction
Decision-making is a complex process studied across multiple disciplines, including economics, management and psychology (Bouzguenda, 2018). According to Özdemir (2022), financial decisions are among the factors affecting individuals’ quality of life. Activities undertaken to satisfy personal needs are closely linked to financial resources. Consequently, financial decisions can play an important role in shaping individuals’ lives (Frydman & Camerer, 2016).
As demonstrated in the relevant academic literature (Ho et al., 2025), financial decision-making can be analysed from a variety of perspectives. For instance, Freed (2026) showed that, in credit markets, insufficient sleep is associated with a higher risk of loan default and less deliberative borrowing decisions. Thus, financial decision-making may be influenced by a range of behavioural and contextual factors. At the same time, artificial intelligence is becoming increasingly relevant to consumer financial decision-making, particularly through consumers’ acceptance of and interaction with AI technologies (Meng et al., 2025).
Financial decision-making extends beyond financial knowledge alone. Everyday financial choices involve behaviours such as budgeting, saving, borrowing, investing, and insuring, while also being shaped by self-control, risk perceptions, economic conditions, emotions, and the digital financial environment. This broader conceptualisation is consistent with research on financial management behaviour, which has been shown to comprise multiple domains, including cash management, credit management, saving and investment, and insurance (Dew & Xiao, 2011). It is also important to distinguish financial decision-making from financial literacy and financial capacity. Financial literacy encompasses the knowledge, skills, attitudes, and behaviours needed to make sound financial decisions (OECD, 2022), whereas financial capacity refers to an individual’s ability to manage financial resources and make financial decisions consistent with their needs and interests (Marson, 2016).
In this study, financial decision-making is defined as the processes through which individuals evaluate financial alternatives and make decisions regarding the management of their financial resources. The instrument assesses self-reported financial behaviour and behavioural intentions. It also assesses perceptions of economic conditions and financial technologies, as well as emotional reactions to uncertainty, to describe the context in which individuals make financial decisions.
Existing instruments assess different aspects of financial decision-making, but few bring together everyday financial behaviours, perceptions of economic conditions, and psychological responses within a single measurement framework. Accordingly, the present study seeks to develop and validate a multidimensional instrument for assessing financial decision-making.
2. Theoretical Background and Instrument Development
2.1. Existing Approaches to Measuring Financial Decision-Making
Although numerous methods for evaluating financial decision-making can be found in the scientific literature, each has its own strengths and limitations. Some rely on laboratory tasks, require relatively high financial literacy, or are based on self-assessment, which may limit their applicability to the general adult population (Ho et al., 2025). Among the most frequently used measures identified by Ho et al. (2025) are variations of the Iowa Gambling Task (IGT), the Legal Capacity for Property Law Transactions Assessment Scale (LCPLTAS), the Decision-Making Competence Assessment Tool (DMCAT), the temporal discounting paradigm, and the Short Form of the Financial Capacity Instrument (FCI-SF).
The IGT has been used to study decision-making capabilities in individuals who have experienced acquired brain injury (Moore et al., 2026) and has also been adapted to assess social decision-making (Frei et al., 2026). Although the IGT provides a performance-based assessment of decision-making under uncertainty, it captures a relatively specific form of decision-making and does not directly assess broader patterns of everyday financial behaviour (Ho et al., 2025).
The LCPLTAS, proposed by Giannouli et al. (2018), is a financial capacity assessment tool designed to evaluate the ability of older adults to make financial decisions independently. The scale covers basic monetary concepts, cash transactions, bank statement management, bill payment, understanding financial concepts, financial decision-making, and knowledge regarding personal assets. Its primary focus is the assessment of specific financial capabilities and practical financial skills rather than the broader, multidimensional process of financial decision-making. Consequently, the LCPLTAS alone does not capture the full range of behavioural, contextual, and psychological dimensions examined in the present study.
The DMCAT is a task-based method developed to assess decision-making competence in older adults (Finucane & Gullion, 2010). It encompasses information comprehension, evaluation of information importance, cognitive reflection, and decision consistency. In its financial component, participants select the most suitable investment fund based on provided information (Ho et al., 2025). A key advantage is its objective assessment of decision-making performance, thereby avoiding some limitations of self-assessment. Nevertheless, the DMCAT primarily assesses decision-making competence within structured tasks and provides limited insight into broader patterns of everyday financial behaviour and contextual factors (Ho et al., 2025).
The temporal discounting paradigm evaluates intertemporal choices by presenting individuals with a choice between a smaller immediate reward and a larger delayed reward. It is useful for assessing how individuals discount future rewards and prioritise short-term benefits, but it captures only a narrow aspect of decision-making (Seaman et al., 2022). Thus, it does not directly assess dimensions such as financial management, borrowing, insurance, financial technology use, or responses to the economic environment.
The FCI-SF is a brief, performance-based assessment tool designed to evaluate everyday financial skills, including counting money, understanding financial concepts, and using chequebooks and bank statements. Its advantages include reduced administration time and strong psychometric properties (Gerstenecker et al., 2016). However, a subsequent analysis indicated that it does not cover some important aspects of financial capacity, including the evaluation of financial decisions and modern online banking activities (Gerstenecker et al., 2023). Therefore, the FCI-SF captures only part of the broader construct of financial decision-making examined in the present study.
Another instrument, the Financial Management Behavior Scale (FMBS), was developed by Dew and Xiao (2011). This multidimensional self-report instrument assesses individuals’ financial management practices. The scale consists of 15 items grouped into four domains: cash flow management, credit management, saving and investing, and insurance. Using data from a nationally representative sample of U.S. adults, the authors reported adequate overall internal consistency (Cronbach’s α = 0.81) and evidence of construct and criterion validity, although some subscales showed lower reliability.
Vieira et al. (2024) developed the Digital Financial Capability Scale (DFCS), a tool designed to assess individuals’ capacity to make financial decisions within a digital environment. The scale comprises 33 items across three dimensions: digital financial knowledge, digital financial behaviour, and digital financial confidence. The scale assesses an individual’s perceived ability to apply financial knowledge, manage finances appropriately, and make financial decisions with confidence in a digital environment. The validation of the instrument involved focus group research, expert assessment, pre-testing, exploratory and confirmatory factor analysis, and structural equation modelling.
In addition to the scales previously discussed, the OECD/INFE framework offers another established approach to assessing financial and digital financial literacy. The OECD/INFE toolkit (OECD, 2022) assesses financial knowledge, behaviours, and attitudes, while the digital financial literacy assessment instrument (OECD, 2024) focuses on the knowledge, skills, attitudes, and behaviours needed to use digital financial services safely and effectively.
The domains assessed by all the reviewed instruments are presented in Table 1.
Table 1.
Domains assessed by the reviewed instruments.
The comparison presented in Table 1 reveals the diversity of existing methods for assessing financial decision-making and related constructs. While instruments based on practical tasks are primarily designed to evaluate decision-making competence and practical financial skills, self-assessment-based instruments—such as the FMBS, DFCS, and those from the OECD/INFE—focus on specific aspects of financial behaviour, financial literacy, or digital financial skills.
The proposed instrument brings together self-reported financial behaviour, behavioural intentions, perceptions of economic and borrowing conditions, attitudes towards financial technologies, and emotional responses to economic uncertainty. Its main contribution is that it allows these distinct but potentially related dimensions to be assessed separately within a single questionnaire.
2.2. Conceptual Dimensions of Financial Decision-Making
Based on the literature review, the initial conceptual framework of the instrument was organised around seven domains. These domains were not assumed to correspond to seven distinct factors; rather, they represented theoretically grounded starting points for item development. The factor structure of the resulting items was subsequently examined through exploratory and confirmatory factor analysis.
The proposed research instrument is based on a broad conceptual framework that distinguishes between self-reported financial behaviour, behavioural intentions, and the contextual and psychological factors associated with financial decision-making. These aspects were included to provide a more comprehensive understanding of individual financial decision-making. However, it is not assumed that they are manifestations of a single, overarching latent construct.
Specifically, perceptions of the economic and borrowing environments describe how individuals view the conditions in which they make financial decisions, while economic anxiety captures emotional responses to economic uncertainty.
Consequently, the proposed instrument is conceptualised as a set of distinct, yet potentially interrelated, subscales designed to assess these dimensions separately, rather than to calculate a single, composite score for financial decision-making.
Day-to-Day Financial Management and Self-Control. Day-to-day financial management involves the routine management of income and expenditure, including budgeting, monitoring spending, controlling impulsive purchases, and aligning current expenditure with financial goals. Dew and Xiao (2011) demonstrated the multidimensional nature of financial management behaviour, identifying cash management, credit management, savings and investment, and insurance as distinct behavioural dimensions. Self-control is particularly relevant because achieving financial goals often requires individuals to resist immediate consumption in favour of longer-term objectives. A meta-analysis by Davydenko et al. (2021) found that financial self-control strategies can reduce spending and increase saving. Accordingly, the first theoretical dimension was designed to capture budgeting, expenditure monitoring, and financial self-control in everyday decisions.
Saving and Long-Term Accumulation. Saving represents both a regular financial behaviour and an intertemporal decision in which present consumption is deferred in favour of future financial security. Existing financial behaviour frameworks include saving and investment as core domains (Dew & Xiao, 2011). However, regular short-term saving and accumulation for distant goals need not be behaviourally identical. Fisher and Montalto (2010) found that saving motives and planning horizons are associated with saving behaviour, highlighting the relevance of financial goals and the time frame over which individuals plan to save. Saving for housing, retirement, or other long-term goals requires persistence and future orientation, particularly when income or economic conditions change. The initial framework therefore included items addressing both regular saving habits and long-term accumulation, while allowing the empirical analyses to determine whether these behaviours formed one or more latent dimensions.
Investment Behaviour. Investment decisions involve allocating financial resources to investment assets, evaluating potential returns and risks, and considering short- and long-term financial objectives. Financial literacy is relevant to investment participation, particularly when individuals face complex financial products. Using survey data from Singapore, Fong (2025) found that higher financial literacy was associated with ownership of financial assets, including stocks and annuities. These findings highlight the relevance of investment-related decisions within broader household financial behaviour. Accordingly, investment behaviour was included as a distinct conceptual domain encompassing willingness to invest, long-term investment orientation, strategic planning, and consideration of risk and return.
Borrowing Behaviour. Borrowing decisions involve more than obtaining credit. Responsible borrowing requires individuals to evaluate interest rates and loan conditions, compare available alternatives, assess repayment capacity, and consider the potential consequences of debt for future financial stability. Credit management has been identified as a distinct component of financial management behaviour (Dew & Xiao, 2011). However, borrowing decisions may also be shaped by individuals’ perceptions of external conditions, including institutional trust, social guarantees, and government support. The initial borrowing domain therefore incorporated both responsible borrowing practices and perceptions of the borrowing environment.
Insurance-Related Risk Management. Insurance provides a mechanism for transferring or mitigating financial risk and is therefore an important component of household financial management. Dew and Xiao (2011) identified insurance as a distinct domain of financial management behaviour, while Armantier et al. (2023) examined insurance and portfolio decisions within the broader context of household risk management. Beyond insurance ownership, relevant considerations include perceived exposure to financial loss, the adequacy of financial protection, and the extent to which insurance coverage meets individual needs. Accordingly, insurance-related risk management was included as a separate conceptual domain in the initial framework.
Economic Environment and Emotional Responses. Financial decisions are made within an economic environment that individuals cannot directly control. Changes in inflation, taxation, interest rates, labour-market conditions, and broader economic uncertainty may influence both household financial circumstances and perceptions of financial security. Silinskas et al. (2021) examined financial behaviour under economic strain, including responses such as reducing expenditure, borrowing, and seeking additional income. Białowolski (2019) found that individuals’ assessments of economic conditions were associated with household saving and borrowing behaviour, highlighting the relevance of perceived economic circumstances to financial decisions. In addition to these behavioural considerations, the risk-as-feelings perspective suggests that emotional reactions to risk and uncertainty may influence decision-making alongside cognitive evaluations (Loewenstein et al., 2001). The initial framework therefore included both perceptions of economic conditions and emotional responses to economic uncertainty.
Financial Technology Use. Digitalisation has changed the context in which financial decisions are made. Mobile banking, financial applications, online investment platforms, digital payments, and other financial technologies can facilitate access to financial information and services while introducing new requirements for digital financial knowledge and safe use. Lyons and Kass-Hanna (2021) highlighted the limitations of traditional financial literacy measures in capturing the specific characteristics of digital financial services. Similarly, the OECD/INFE framework defines digital financial literacy in terms of the knowledge, skills, attitudes, and behaviours required to use digital financial services safely and effectively (OECD, 2024). Vieira et al. (2024) further developed a multidimensional measure of digital financial capability encompassing digital financial knowledge, behaviour, and confidence. Within this broader context, the initial conceptual framework included financial technology use as a distinct domain, focusing on the perceived usefulness of digital financial technologies, their role in everyday financial management, and trust in their use.
Together, these seven domains provided the theoretical basis for item development, encompassing everyday financial management, longer-term financial decisions, and responses to economic and technological conditions.
2.3. Instrument Development
The instrument was developed based on a literature review covering financial decision-making, behavioural finance, financial management behaviour, and economic and technological factors influencing individual financial decisions. The seven conceptual domains identified in Section 2.2 provided the basis for item development.
Items were formulated to reflect the behavioural and contextual aspects of each domain while remaining understandable to adults with different levels of financial experience. The instrument was designed to assess self-reported financial behaviours, decision-making considerations, and responses to financial circumstances rather than specialist financial knowledge. Item wording was guided by the conceptual definitions and the literature discussed in Section 2.2, with statements developed to represent the specific financial practices, attitudes, and perceived influences associated with each domain. For example, items on day-to-day financial management, saving, borrowing, and insurance were informed by Dew and Xiao’s (2011) work on financial management behaviour. Items addressing the economic environment and emotional reactions were formulated based on research into economic conditions and financial decision-making (Białowolski, 2019; Loewenstein et al., 2001). Items related to financial technologies were developed based on research into digital financial literacy and capabilities (OECD, 2024; Vieira et al., 2024). These sources informed item development, and the items were written specifically for this study.
A summary of the seven initial conceptual domains and the number of items assigned to each is presented in Table 2. The original Lithuanian-language questionnaire and its English translation are provided in Appendix A. The questionnaire was developed, administered, and psychometrically evaluated in Lithuanian. The English translation was prepared by the authors and subsequently reviewed to ensure linguistic clarity, terminological consistency, and correspondence with the original Lithuanian version. The English version is provided to facilitate understanding by international readers and has not been psychometrically validated.
Table 2.
Initial theoretical dimensions of the instrument.
The initial questionnaire comprised 45 items measured on a five-point Likert scale ranging from 1 (“strongly disagree”) to 5 (“strongly agree”). Particular attention was paid to ensuring that the items were relevant to the constructs being measured, clearly worded, and understandable to respondents with different levels of financial experience.
The preliminary version of the questionnaire was reviewed by three experts with experience in economics and finance research to evaluate the relevance and clarity of the items. Each item was assessed using a five-point appropriateness scale, ranging from 1 (“completely inappropriate”) to 5 (“completely appropriate”). Across all expert ratings, 96.0% were 4 or 5, and the mean rating was 4.85 out of 5. The experts identified ambiguous wording and noted that some items might be difficult to answer for respondents without relevant financial experience. Based on the feedback, selected items were revised for clarity and relevance.
A pilot test involving 32 participants was then conducted to assess item clarity, the suitability of the response scale, and questionnaire completion time. Completion typically took 12–14 min. Pilot participants were not included in the main study sample. The pilot study indicated that the questionnaire items were generally clear and understandable. Following the pilot study, several questionnaire items were revised to improve their clarity and applicability to respondents with different levels of financial experience. In particular, selected statements concerning saving, investment, borrowing, and insurance were reworded. For example, the investment item “When I have available funds, I allocate part of them to investments” was changed to “If I had funds available, I would allocate part of them to investments.” Similarly, borrowing-related statements were reformulated to assess how respondents would evaluate loan conditions, interest rates, and financial obligations without assuming previous borrowing experience. Two additional questions were introduced to identify whether respondents had prior investment or borrowing experience. Furthermore, a brief explanation of digital financial technologies was added to the questionnaire instructions. The five-point Likert response scale was retained without modification.
3. Materials and Methods
3.1. Participants and Data Collection
The empirical study was conducted using a convenience sample of Lithuanian adults. Data were collected through the Apklausa.lt online survey platform between April and May 2026. The platform restricted repeated questionnaire submissions. The survey link was distributed through the college community, social media, and email. Participation was voluntary and anonymous. The survey was open to Lithuanian adults, with no additional eligibility criteria. All respondents received the same questionnaire instructions. No separate instructions were provided to respondents without investment or borrowing experience.
A total of 486 responses were obtained. During data cleaning, two responses were excluded because more than half of the questionnaire items were unanswered in each case. Three additional responses were excluded due to very short completion times (less than three minutes), resulting in a final sample of 481 respondents. The three-minute threshold was informed by a pilot study (n = 32), in which completion typically took 12–14 min. Remaining item-level missing values were handled using listwise deletion in exploratory factor analysis, whereas full-information maximum likelihood (FIML) was used in confirmatory factor analysis. Among the respondents, 70.5% were women, and the mean age of the respondents was 45.1 years (SD = 13.3). Most participants had tertiary education (college or university level; 82.7%), while 41.3% reported having investment experience and 66.3% had borrowing experience.
To evaluate the factor structure identified by EFA in a separate subsample (Brown, 2015), the total sample was randomly divided into two groups in IBM SPSS Statistics by generating uniformly distributed random values and sorting respondents by those values. The first subsample (n = 240) was allocated to exploratory factor analysis (EFA), whereas the second subsample (n = 241) was allocated to confirmatory factor analysis (CFA). For EFA, sample-size requirements depend on item communalities and how well each factor is defined by its indicators (MacCallum et al., 1999). For CFA, relevant considerations include the number of indicators per factor and the magnitude of the factor loadings (Wolf et al., 2013). The final CFA model comprised 36 indicators across ten factors. Nine factors had three to six indicators, while Economic Anxiety had two. Given the complexity of the model and its refinement within the CFA subsample, we interpret the findings as initial evidence for the proposed factor structure.
No statistically significant differences were observed between the EFA and CFA subsamples with respect to the characteristics presented in Table 3 (all p > 0.05).
Table 3.
Characteristics of the study sample.
3.2. Statistical Analysis
Differences between the EFA and CFA subsamples were assessed using the Mann–Whitney U test for age and chi-square (χ2) tests for categorical variables (gender, education, investment experience, and borrowing experience).
Exploratory factor analysis (EFA) was conducted using Principal Axis Factoring with Promax rotation (κ = 4), allowing the extracted factors to correlate (Fabrigar et al., 1999; Hair et al., 2022). EFA was used to identify the latent factor structure of the instrument. The suitability of the data for factor analysis was assessed using the Kaiser–Meyer–Olkin (KMO) measure and Bartlett’s test of sphericity. The number of factors was determined using parallel analysis, which is considered one of the most accurate methods for factor retention because it compares the observed eigenvalues with those obtained from randomly generated datasets of the same size (Horn, 1965; Hayton et al., 2004; Hair et al., 2022). The scree plot and theoretical considerations were also used to select the final factor solution. The factor solution was refined through several iterations. At each step, items were evaluated according to their factor loadings, communalities, cross-loadings, and theoretical relevance. Internal consistency was assessed using Cronbach’s alpha and McDonald’s omega.
The five-point Likert-scale items were treated as approximately continuous variables, and EFA was conducted using a Pearson correlation matrix. The factor structure identified in the EFA was subsequently evaluated using confirmatory factor analysis (CFA) within the structural equation modelling framework. CFA models were initially estimated using maximum likelihood (ML). The distributional characteristics of the 36 retained items in the CFA sample were examined using skewness and excess kurtosis. Skewness ranged from −1.411 to 0.114, while excess kurtosis ranged from −0.508 to 3.804. These values were below the commonly cited thresholds for substantial univariate non-normality (absolute skewness greater than 2 and excess kurtosis greater than 7; West et al., 1995). However, Mardia’s test indicated significant departures from multivariate normality (p < 0.001). Therefore, the final CFA model was additionally estimated using robust maximum likelihood (MLR) to assess the sensitivity of the results to non-normality. MLR provides robust standard errors and adjusted model fit statistics. Previous simulation research has examined the performance of MLR in CFA when ordinal indicators are treated as continuous (Li, 2016).
Model fit was assessed using the chi-square statistic (χ2), the chi-square to degrees of freedom ratio (χ2/df), the comparative fit index (CFI), the Tucker–Lewis index (TLI), the root mean square error of approximation (RMSEA), and the standardized root mean square residual (SRMR) (Hair et al., 2022). Construct reliability was evaluated using composite reliability (CR), convergent validity using average variance extracted (AVE) (Fornell & Larcker, 1981), and discriminant validity using the heterotrait–monotrait ratio (HTMT) (Henseler et al., 2015).
All reliability and validity statistics for the final instrument (α, ω, CR, AVE, and HTMT) were based on the CFA subsample (n = 241). CR and AVE were calculated from the unrounded fully standardized estimates of the final ten-factor model. AVE was calculated as the mean of the squared standardized factor loadings, and CR included the residual covariances specified in the model.
The CFA model was refined iteratively using modification indices (MI) and standardized residuals. Items were removed and correlated error terms were added only when supported by statistical evidence and theoretical justification (Brown, 2015). When the factor structure suggested that a construct might be multidimensional, additional exploratory factor analyses were conducted within the EFA subsample to further examine its internal structure before revising the CFA model (Fabrigar et al., 1999).
Statistical analyses were conducted using IBM SPSS Statistics 27 and JASP 0.97.1.
4. Results
4.1. Exploratory Factor Analysis
Prior to factor extraction, the suitability of the data for factor analysis was assessed. The Kaiser-Meyer-Olkin measure of sampling adequacy was 0.821, indicating good sampling adequacy (Kaiser, 1974), and Bartlett’s test of sphericity was statistically significant (χ2 = 5647.13, df = 990, p < 0.001), supporting the suitability of the correlation matrix for factor analysis.
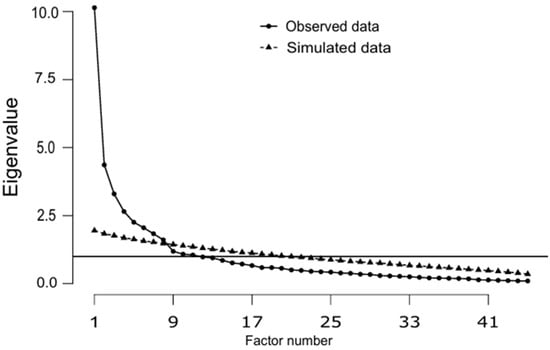
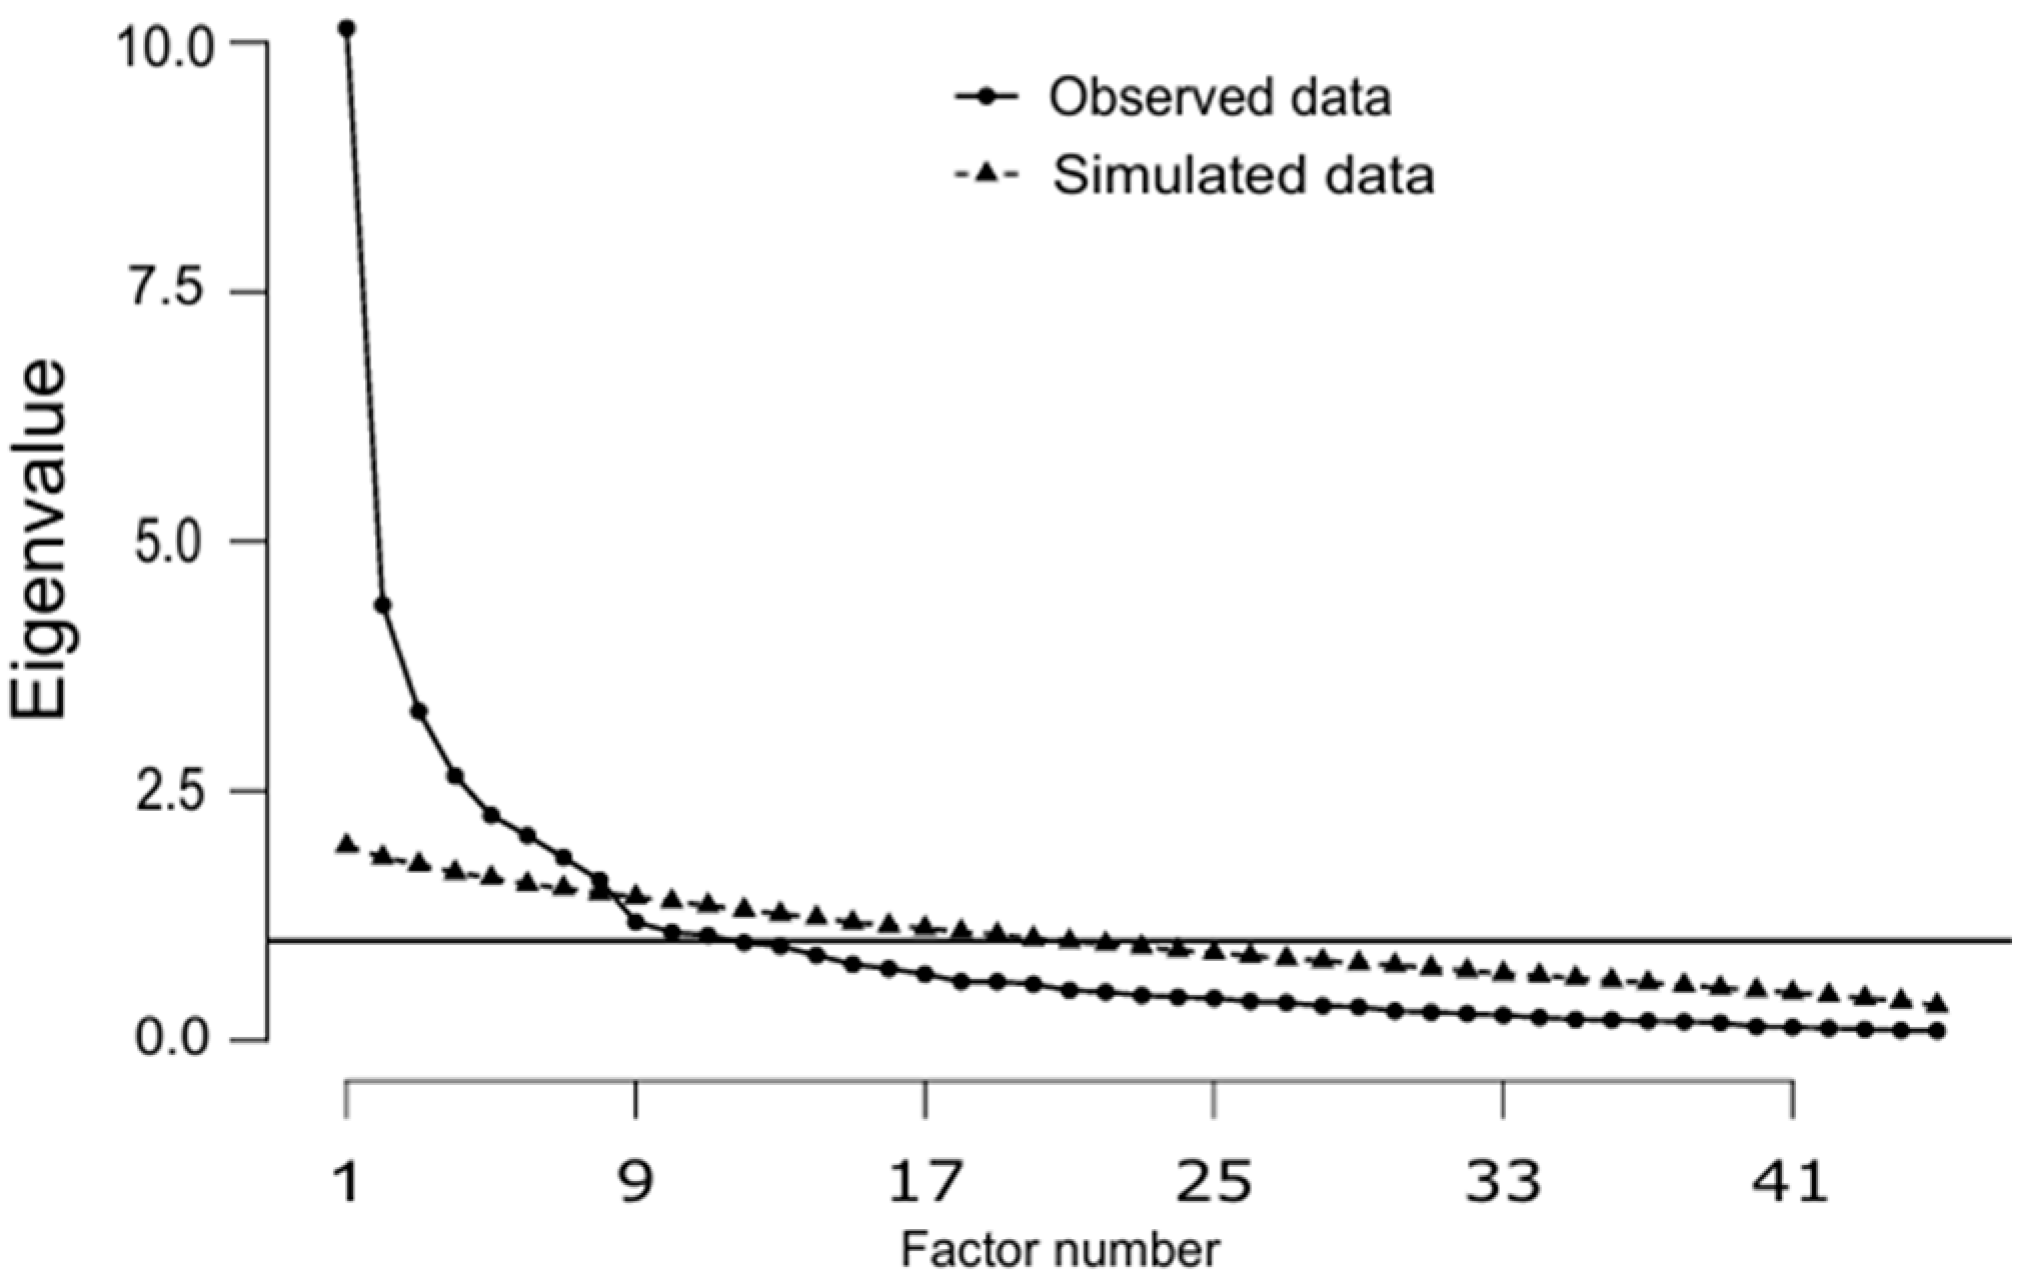
Exploratory factor analysis was first conducted on the 45-item instrument. Although the Kaiser criterion suggested an 11-factor solution, parallel analysis and inspection of the scree plot supported an eight-factor solution. As shown in Figure 1, the first eight observed eigenvalues exceeded the corresponding eigenvalues obtained from the simulated data, supporting the extraction of eight factors.
Figure 1.
Parallel analysis scree plot for the initial 45-item instrument. Note. The horizontal line represents an eigenvalue of 1 (Kaiser criterion).
The eight-factor solution was considered the most theoretically interpretable and was therefore selected as the final EFA solution. Four items were removed during the EFA refinement process. Item A7.5 did not load meaningfully on any factor. Items A3.5 and A7.4 were excluded because of low factor loadings and communalities, whereas item A4.10 was removed because of substantial cross-loadings across two factors. The final pattern matrix, communalities, explained variance, and internal consistency coefficients are presented in Table 4.
Table 4.
Factor loadings, communalities, and explained variance for the final EFA solution.
The eight-factor solution revealed a theoretically coherent structure covering several distinct domains of financial decision-making. Saving Behaviour comprised eight items (A2.1–A2.8) capturing both regular saving practices and long-term financial accumulation, including the tendency to maintain saving behaviour under adverse economic conditions. Factor loadings ranged from 0.563 to 0.904, and the factor demonstrated high internal consistency (Cronbach’s α = 0.906; McDonald’s ω = 0.909). Financial Self-management represented day-to-day financial discipline, including budgeting, spending control, and consideration of financial goals. Factor loadings ranged from 0.403 to 0.784, with satisfactory internal consistency (α = 0.820; ω = 0.823).
A notable feature of the EFA solution was the separation of borrowing-related items into two conceptually distinct factors. Borrowing Environment Perception captured the role of external conditions in borrowing decisions, including government support programmes, social guarantees, institutional trust, and broader economic conditions. Factor loadings ranged from 0.336 to 0.850, with internal consistency coefficients of α = 0.835 and ω = 0.837. In contrast, Responsible Borrowing Intentions reflected intentions regarding individual decision-making practices, such as comparing borrowing conditions, considering interest rates, assessing repayment capacity, and evaluating the potential impact of borrowing on financial stability. Factor loadings ranged from 0.600 to 0.746, with internal consistency coefficients of α = 0.855 and ω = 0.856. These results supported the interpretation of the two factors as distinct dimensions of borrowing-related decision-making.
Economic Sensitivity captured both perceptions of macroeconomic conditions—including inflation, taxation, and broader economic changes—and emotional responses to economic uncertainty. The six items forming this factor showed loadings ranging from 0.466 to 0.839 and high internal consistency (α = 0.873; ω = 0.874). Insurance Behaviour and Attitudes represented attitudes towards financial protection and consideration of financial risks, with consistently strong factor loadings ranging from 0.778 to 0.894 and satisfactory internal consistency (α = 0.818; ω = 0.834).
The remaining factors captured investment-related decision-making and the role of digital financial technologies. Investment Intentions and Attitudes reflected long-term investment orientation, strategic investment planning, and consideration of investment risk, with factor loadings ranging from 0.534 to 0.882 and internal consistency coefficients of α = 0.844 and ω = 0.857. Financial Technology Use and Perceptions represented the use of and confidence in digital financial technologies in financial decision-making. Factor loadings ranged from 0.821 to 0.885, and internal consistency was high (α = 0.910; ω = 0.902).
Overall, the EFA identified eight conceptually interpretable dimensions of financial decision-making. The solution explained 58.22% of the total variance, which is comparable to the average variance explained (56.6%) across 803 factor analyses reported by R. A. Peterson (2000). Primary factor loadings ranged from 0.336 to 0.904, communalities ranged from 0.316 to 0.844, and all eight factors demonstrated satisfactory internal consistency.
The factor correlations ranged from 0.085 to 0.471, with the strongest correlation observed between F3 and F5 (r = 0.471).
4.2. Confirmatory Factor Analysis
The eight-factor structure identified in the EFA was subsequently evaluated using confirmatory factor analysis (CFA) in a separate subsample (n = 241). The chi-square test was statistically significant (χ2 = 2006.11, df = 751, p < 0.001), indicating that the model did not fully reproduce the observed covariance matrix. Because the chi-square statistic is sensitive to sample size, model fit was evaluated in conjunction with the chi-square to degrees of freedom ratio (χ2/df) and approximate fit indices, including the CFI, TLI, RMSEA, and SRMR (Brown, 2015; Hair et al., 2022). The initial model showed inadequate fit (χ2/df = 2.67, CFI = 0.777, TLI = 0.757, RMSEA = 0.083, SRMR = 0.086), indicating that further model refinement was required.
The measurement model was refined in several steps. At each step, standardized factor loadings, modification indices (MI), standardized residuals, and theoretical interpretability were jointly evaluated. Items were removed only when multiple sources of evidence consistently indicated inadequate measurement performance and when their exclusion could be theoretically justified (Brown, 2015).
During this process, five items were removed. Item A6.4 was removed first because it showed a low standardized loading (λ = 0.351), low explained variance (R2 = 0.123), and an elevated modification index (MI = 22.35) indicating potential cross-loading. Following model re-estimation, A2.4 was removed because of its relatively low loading (λ = 0.419) and low explained variance (R2 = 0.175). Item A4.2 was subsequently excluded because it showed a low standardized loading (λ = 0.400), low explained variance (R2 = 0.160), and particularly large modification indices (MI = 33.05 and 16.48) suggesting substantial cross-loading. Finally, A1.6 and A4.9 were removed because both were associated with multiple elevated modification indices (MI = 34.02, 17.21, and 15.66 for A1.6; MI = 25.76 and 10.42 for A4.9), although A1.6 retained an acceptable primary loading.
The content coverage retained after each item deletion is summarised in Table 5.
Table 5.
Removed CFA items and content coverage of the retained subscales.
After these removals, model fit improved but did not meet the recommended thresholds, indicating that further refinement was required. Inspection of the modification indices identified residual covariance between three pairs of conceptually related items (A6.5–A6.6, A5.1–A5.2, and A2.1–A2.2), with corresponding MI values of 173.30, 120.80, and 81.91, respectively. Rather than removing additional items, correlated residuals were specified between these item pairs because of their similar wording and shared content beyond the common latent construct. These modifications were introduced only when they were theoretically justified and consistent with established recommendations for CFA model refinement (Brown, 2015).
Following these refinements, model fit improved substantially (χ2/df = 1.94, CFI = 0.897, TLI = 0.883, RMSEA = 0.063, SRMR = 0.065), although the CFI and TLI values remained slightly below the commonly recommended threshold of 0.90 (Hair et al., 2022).
The conceptual definition of the Saving Behaviour construct suggested that it might consist of more than one underlying dimension, as previous research distinguishes between saving motives and behaviours associated with different time horizons (Canova et al., 2005; Fisher & Montalto, 2010; Lunt & Livingstone, 1991). Although the initial EFA grouped all saving items within a single factor, additional exploratory analyses were conducted using the seven retained saving items to examine a theoretically motivated two-factor solution. The two-factor solution explained 69.90% of the item variance, compared with 58.06% for the one-factor solution. The pattern matrix revealed two interpretable dimensions: items A2.1–A2.3 primarily reflected regular saving habits (loadings ranging from 0.750 to 0.933), whereas A2.5–A2.8 represented long-term saving behaviour (loadings ranging from 0.613 to 0.997). The correlation between the two factors was 0.669, indicating a substantial relationship between the dimensions. Although the eigenvalue criterion favoured a one-factor solution, the theoretically meaningful distinction and clear loading patterns supported examining the two dimensions separately in the subsequent CFA. Accordingly, the original construct was specified as two correlated latent factors for subsequent CFA evaluation, labelled Saving Behaviour and Long-term Saving Behaviour.
This refinement resulted in a nine-factor model (χ2 = 948.10, df = 546, χ2/df = 1.74, CFI = 0.921, TLI = 0.909, RMSEA = 0.055, SRMR = 0.061). Convergent validity also improved, with AVE increasing from 0.593 for the original Saving Behaviour construct to 0.757 and 0.665 for Saving Behaviour and Long-term Saving Behaviour, respectively. Compared with the refined eight-factor model, the nine-factor solution showed improved model fit, with χ2/df decreasing from 1.94 to 1.74, CFI increasing from 0.897 to 0.921, TLI increasing from 0.883 to 0.909, RMSEA decreasing from 0.063 to 0.055, and SRMR decreasing from 0.065 to 0.061.
Similarly, the content of the Economic Sensitivity construct, together with its relatively low convergent validity (AVE = 0.363), suggested that it might consist of more than one underlying dimension. Specifically, the construct combined items describing the perceived impact of macroeconomic conditions on financial decision-making (A6.1–A6.3) with items reflecting emotional responses to economic uncertainty (A6.5–A6.6). To further examine the construct, an additional EFA specifying a two-factor solution was conducted using the five retained items (n = 236). The two-factor solution explained 70.39% of the item variance, compared with 49.19% for the one-factor solution. Both factors had initial eigenvalues greater than one (2.962 and 1.107), supporting the retention of two factors according to the Kaiser criterion. The results revealed two interpretable dimensions: A6.1–A6.3 loaded on a factor representing Economic Environment Perception (loadings ranging from 0.720 to 0.858), whereas A6.5 and A6.6 loaded on a factor representing Economic Anxiety (loadings of 0.891 and 0.916, respectively). The two factors were moderately correlated (r = 0.507). Based on these findings and the underlying theoretical framework, the original factor was specified as two correlated latent constructs for subsequent CFA evaluation, reflecting the conceptual distinction between perceptions of economic conditions and affective responses to economic uncertainty (Białowolski, 2019; Loewenstein et al., 2001; R. L. Peterson, 2007). Detailed results of the additional exploratory analyses are provided in Supplementary Material S1 (Tables S1–S4).
As shown in Table 6, the resulting ten-factor model provided the best overall fit among the tested models (χ2 = 916.4, df = 537, χ2/df = 1.71, CFI = 0.926, TLI = 0.913, RMSEA = 0.054, [90% CI: 0.048–0.060], SRMR = 0.057). Compared with the refined nine-factor model, the ten-factor solution showed further improvement across the examined fit indices. The residual covariance between A6.5 and A6.6 was no longer included in the final model following the identification of Economic Anxiety as a separate factor.
Table 6.
Comparison of model fit indices across CFA model refinement stages.
Two residual covariances were retained in the final ten-factor model: A5.1–A5.2 and A2.1–A2.2. Their standardized estimates were 0.654 (p < 0.001) and 0.235 (p = 0.032), respectively.
To assess the sensitivity of the CFA results to the estimation method, the final ten-factor model was re-estimated using robust maximum likelihood (MLR). The model demonstrated acceptable fit (CFI = 0.938, TLI = 0.927, RMSEA = 0.045, SRMR = 0.057). All 36 standardized factor loadings remained statistically significant (p < 0.001) and were identical to those obtained using conventional maximum likelihood estimation.
The psychometric properties of the final ten-factor model were further evaluated by examining standardized factor loadings and their standard errors, internal consistency, construct reliability, and convergent validity (Table 7).
Table 7.
Standardized factor loadings (λ), standard error (SE), Cronbach’s α, McDonald’s ω, composite reliability (CR), and average variance extracted (AVE).
Internal consistency was satisfactory across all constructs, with Cronbach’s α ranging from 0.786 to 0.910 and McDonald’s ω ranging from 0.785 to 0.911. Composite reliability (CR), which reflects the consistency of the indicators in measuring their respective latent constructs, ranged from 0.786 to 0.914, indicating satisfactory construct reliability. Average variance extracted (AVE), which reflects the proportion of variance in the indicators accounted for by the latent construct, supported convergent validity for nine of the ten constructs, with values ranging from 0.551 to 0.843 and thus exceeding the recommended value of 0.50 (Fornell & Larcker, 1981).
The only exception was Financial Self-management, which had an AVE of 0.428, indicating limited convergent validity despite satisfactory reliability (α = 0.811; ω = 0.803; CR = 0.816). Examination of the standardized factor loadings revealed that the weakest indicators were monthly budget planning (A1.1, λ = 0.512) and considering financial goals when making everyday spending decisions (A1.7, λ = 0.600). These findings may reflect some heterogeneity within the construct, which encompasses budgeting, expenditure management, and spending self-control. Although these aspects are conceptually related, they may not be equally strongly represented by a single latent factor. The construct was retained because of its theoretical relevance and acceptable reliability. However, reliability alone does not establish convergent validity. Further research should examine whether a more differentiated structure would better represent financial self-management.
Given the presence of a correlated residual between A2.1 and A2.2 within the three-item Saving Behaviour factor, an additional reliability sensitivity analysis was conducted. The standardized residual correlation was 0.235 (p = 0.032), indicating additional shared variance beyond that explained by the latent factor. When this residual association was accounted for in the composite reliability calculation, the estimate decreased from 0.903 to approximately 0.890. Nevertheless, the adjusted estimate remained high, suggesting that the local dependence between these two indicators did not substantially alter the reliability assessment of the Saving Behaviour construct. Similarly, accounting for the residual covariance between A5.1 and A5.2 reduced CR for Insurance Behaviour and Attitudes from 0.875 to 0.826, which remained above 0.70.
Discriminant validity was subsequently assessed using the HTMT criterion, with the results presented in Table 8.
Table 8.
Heterotrait–monotrait (HTMT) ratio matrix for discriminant validity assessment.
The final 36-item instrument and practical guidelines for scoring and interpreting its ten dimensions are provided in Appendix B.
All HTMT values were below the recommended threshold of 0.85 (Henseler et al., 2015), with the highest observed value being 0.756 between Saving Behaviour and Long-term Saving Behaviour. This finding reflects their conceptual relatedness while supporting their empirical distinctiveness. The HTMT value between Economic Environment Perception and Economic Anxiety was substantially lower (0.425), likewise supporting the empirical distinction between these two constructs. Together with the additional exploratory factor analyses, these findings supported the separation of the original Saving Behaviour and Economic Sensitivity constructs into theoretically meaningful dimensions.
Latent factor correlations ranged from −0.115 to 0.753 (Table 9). The strongest correlation was observed between Saving Behaviour and Long-term Saving Behaviour (r = 0.753), consistent with the HTMT results.
Table 9.
Correlations among the latent factors in the final CFA model.
The two-indicator Economic Anxiety factor was estimated within the full ten-factor CFA model using marker-variable scaling, with the first unstandardized loading fixed to 1 and correlations among latent factors freely estimated.
Economic Anxiety correlated with the other nine factors at values ranging from −0.115 to 0.441. The standardized residual variances were 0.300 for A6.5 (95% CI [0.242, 0.358]) and 0.014 for A6.6 (95% CI [−0.059, 0.086]). For A6.6, the estimate was close to zero and the interval included zero, so its high standardized loading (0.993) should be interpreted with caution.
Overall, the final ten-factor model demonstrated satisfactory model fit, construct reliability, and discriminant validity, while convergent validity was supported for nine of the ten constructs.
These findings provide evidence of discriminant validity among the dimensions of the proposed instrument but do not establish its distinctiveness from external constructs such as financial literacy, financial capability, or financial well-being.
5. Discussion
The present study aimed to develop and validate a multidimensional instrument for assessing financial decision-making. Following exploratory and confirmatory factor analyses, the final instrument included 36 items representing ten dimensions of financial decision-making. The final measurement model demonstrated satisfactory model fit, strong internal consistency, and evidence of discriminant validity among the identified dimensions. Convergent validity was supported for nine of the ten constructs. Financial Self-management showed satisfactory reliability, but its AVE (0.428) was below 0.50. These findings provide initial support for the instrument’s internal structure, while further external validation is required.
The findings suggested that the original Saving Behaviour construct could be represented by two correlated latent dimensions: Saving Behaviour and Long-term Saving Behaviour. Although the initial exploratory factor analysis grouped all saving-related items into a single factor, their content suggested two different aspects of saving. The first dimension included items describing regular saving practices and the ability to maintain saving habits despite financial difficulties, while the second reflected saving for long-term financial goals. An additional exploratory factor analysis suggested this distinction by separating the items into two factors. However, the second saving eigenvalue was 0.974, and the initial parallel analysis of the full item set supported eight factors. This distinction therefore requires cautious interpretation and further evaluation in an independent sample. This refinement improved model fit and convergent validity, while discriminant validity remained satisfactory. The relatively high HTMT value (0.76) was not unexpected, as both constructs describe saving behaviour. However, they focus on different aspects of saving. This finding is consistent with previous research describing saving as a multifaceted behaviour shaped by different motives and goals (Canova et al., 2005). The time horizon is also important, as saving behaviour varies according to saving horizons and long-term motives (Fisher & Montalto, 2010). Earlier research suggests that different forms of saving may be associated with different economic, demographic, and psychological determinants (Lunt & Livingstone, 1991). Thus, the proposed distinction between Saving Behaviour and Long-term Saving Behaviour is consistent with the view that saving is not a single, homogeneous form of financial behaviour.
Another important finding was the differentiation of the initial borrowing domain into two distinct dimensions: Responsible Borrowing Intentions and Borrowing Environment Perception. The first dimension reflects respondents’ intentions to evaluate loan conditions, repayment capacity, and financial stability, while the second captures perceptions of government support, social benefits, and trust in government institutions. These findings suggest that responsible borrowing orientations and perceptions of the external borrowing environment represent different aspects of financial decision-making.
Several investment and borrowing items assess what respondents would do in hypothetical situations. The financial technology items assess perceived usefulness, trust, and the perceived role of these technologies in everyday financial management. The corresponding subscale scores should be interpreted as measures of these intentions and perceptions.
The original Economic Sensitivity construct was also found to include two distinct dimensions: Economic Environment Perception and Economic Anxiety. Some items focused on how respondents perceived the influence of macroeconomic conditions on their financial decisions, while others reflected emotional responses to economic uncertainty. This distinction is consistent with previous research showing that individuals’ perceptions and assessments of the economic environment are associated with household financial behaviour (Białowolski, 2019), while affective and emotional responses can independently influence financial decision-making under conditions of risk and uncertainty (Loewenstein et al., 2001; R. L. Peterson, 2007).
The additional exploratory factor analysis supported this distinction, and the relatively low HTMT value (0.425) provided further evidence for the empirical separation between the two constructs.
The final scale includes ten dimensions covering financial management, saving, borrowing, insurance, investment, attitudes towards financial technologies, and responses to economic conditions. This multidimensional structure allows researchers to examine these dimensions separately and investigate their relationships with financial literacy, financial resilience, financial well-being, and other relevant constructs. If measurement invariance is established across relevant groups, the instrument may also be used to compare dimension scores across populations and cultural settings.
Compared with the Financial Management Behavior Scale developed by Dew and Xiao (2011), which focuses on financial management behaviours, the proposed scale covers a broader range of dimensions, including financial behaviours, attitudes, perceptions of economic conditions, and economic anxiety. It also includes attitudes towards financial technologies and distinguishes between regular and long-term saving. Thus, the proposed scale complements existing instruments, although further validation in more diverse populations is needed.
The study has several strengths. First, separate subsamples were used for exploratory factor analysis and the initial confirmatory evaluation of the factor structure (Brown, 2015). Second, both exploratory and confirmatory analyses were conducted systematically, with model modifications guided by theoretical considerations and empirical evidence, rather than statistical criteria alone (Brown, 2015). Third, multiple indicators of reliability and construct validity were evaluated, including Cronbach’s alpha, McDonald’s omega, composite reliability, average variance extracted, and the heterotrait–monotrait ratio (Fornell & Larcker, 1981; Henseler et al., 2015), providing complementary evidence of the instrument’s psychometric properties.
Several limitations should also be acknowledged. The study was based on a convenience sample of Lithuanian respondents. The high proportions of women (70.5%) and of respondents with tertiary education (82.7%) may have influenced the observed factor structure and limit the generalizability of the findings to other populations. Furthermore, the instrument is based on self-reported responses and captures individuals’ reported financial behaviours, decision-making considerations, and perceptions rather than the objectively assessed quality of their financial decisions. Consequently, the scale scores should not be interpreted as direct measures of financial decision-making competence or actual financial outcomes. The instrument’s criterion-related validity remains to be established. For example, a longitudinal study could test whether baseline Saving Behaviour scores predict the proportion of income saved over the following six months. Including an established measure of financial management behaviour in the same study would allow researchers to assess whether the Saving Behaviour scores improve prediction beyond that measure.
Although separate subsamples were used for EFA and CFA, the confirmatory subsample was also used for model refinement, including item removal, factor restructuring, and the specification of correlated residuals. Consequently, the final ten-factor structure should be regarded as provisionally supported rather than independently validated. Confirmation using a new independent sample is required to assess its stability and generalisability.
Previous financial experience may influence how the items are interpreted and how they relate to the underlying constructs. Consequently, measurement equivalence across experience groups cannot be assumed, and the comparability of the corresponding subscale scores requires further investigation (Vandenberg & Lance, 2000). Future validation studies should recruit more diverse samples, with better representation of adults with lower educational attainment and a range of financial experiences. They should also test measurement invariance across groups defined by gender, age, education, and financial experience before comparing subscale scores.
The Economic Anxiety factor was represented by two items that both address emotional responses to economic uncertainty and may overlap in content. The residual variance of A6.6 was positive but close to zero, and its confidence interval included zero. Its high standardized loading (0.993) should therefore be interpreted with caution. Furthermore, the two-item structure limits the content coverage of the construct, and high internal consistency alone does not establish comprehensive construct validity. Future studies should therefore include additional indicators capturing different aspects of economic anxiety and reassess the factor’s measurement properties in independent samples.
The validity evidence obtained in this study primarily concerns the internal structure of the instrument. Although the factor structure, AVE, and HTMT results support the proposed measurement model, they do not establish whether the instrument’s subscale scores are empirically distinct from measures of related constructs such as financial literacy, financial capability, and financial well-being. As established external measures of these constructs were not included in the survey, external construct validation could not be performed. Future studies should examine the relationships between the proposed scale and established measures of these constructs, as well as relevant financial behavioural indicators, to provide additional evidence of convergent, discriminant, and criterion-related validity.
6. Conclusions
This study developed a multidimensional instrument for assessing financial decision-making and provided initial evidence supporting its internal structure and reliability. Convergent validity was supported for nine of the ten dimensions. Financial Self-management showed satisfactory reliability, but its AVE (0.428) was below the 0.50 criterion.
The proposed instrument consists of ten conceptually distinct, yet potentially interrelated, subscales that assess financial behaviour, behavioural intentions, perception of context, and emotional reactions. Each subscale should be interpreted separately, and an overall score is not recommended.
The analyses suggested distinct dimensions within saving, borrowing, and responses to economic conditions, highlighting the complexity of financial decision-making. Because the final model was refined using the confirmatory subsample, its structure requires confirmation in a new independent sample.
Further studies across different populations and cultural contexts should examine how the subscale scores relate to established measures of financial literacy, financial resilience, and financial well-being, as well as to relevant indicators of self-reported financial behaviour, to assess the instrument’s broader validity and applicability.
Supplementary Materials
The following supporting information can be downloaded at: https://www.mdpi.com/article/10.3390/jrfm19110930/s1, Table S1. Factor loadings and communalities for Saving Behaviour items. Table S2. Eigenvalues and extracted variance for Saving Behaviour items. Table S3. Factor loadings and communalities for Economic Sensitivity items. Table S4. Eigenvalues and extracted variance for Economic Sensitivity items.
Author Contributions
Conceptualization, L.D. and A.Z.; methodology, L.D. and A.Z.; validation, L.D.; formal analysis, L.D.; investigation, L.D. and A.Z.; data curation, L.D.; visualization, L.D.; supervision, L.D.; writing—original draft preparation, L.D. and A.Z.; writing—review and editing, L.D. and A.Z. All authors have read and agreed to the published version of the manuscript.
Funding
This research received no external funding.
Institutional Review Board Statement
The study was conducted in accordance with the Code of Academic Ethics of Klaipėdos valstybinė kolegija, Higher Education Institution (KVK) (approved by Protocol Resolution No. SV1-07 of the Academic Council of KVK on 30 September 2021). The research was registered at KVK under registration No. TMV-259 on 26 June 2025.
Informed Consent Statement
Informed consent was obtained from all subjects involved in the study.
Data Availability Statement
The data supporting the findings of this study are available from the corresponding author upon reasonable request.
Acknowledgments
During the preparation of this manuscript, the authors used ChatGPT (GPT-5.6, OpenAI) primarily for English language editing and improving the clarity of the manuscript. All statistical analyses, including exploratory and confirmatory factor analyses, were independently conducted by the authors using IBM SPSS Statistics and JASP.
Conflicts of Interest
The authors declare no conflicts of interest.
Abbreviations
The following abbreviations are used in this manuscript:
| AVE | Average Variance Extracted |
| CFA | Confirmatory Factor Analysis |
| CFI | Comparative Fit Index |
| CR | Composite Reliability |
| EFA | Exploratory Factor Analysis |
| HTMT | Heterotrait–Monotrait Ratio |
| KMO | Kaiser–Meyer–Olkin |
| MI | Modification Index |
| RMSEA | Root Mean Square Error of Approximation |
| SD | Standard Deviation |
| SRMR | Standardized Root Mean Square Residual |
| TLI | Tucker–Lewis Index |
Appendix A. Original 45-Item Questionnaire in Lithuanian and English
Response scale/Atsakymų skalė: 1—Visiškai nesutinku/Strongly disagree; 2—Nesutinku/Disagree; 3—Nei sutinku, nei nesutinku/Neither agree nor disagree; 4—Sutinku/Agree; 5—Visiškai sutinku/Strongly agree.
Table A1.
Kasdienių finansų valdymas/Day-to-day Financial Management.
Table A2.
Taupymo ir kaupimo elgsena/Saving and Long-term Accumulation Behaviour.
Table A3.
Investavimo sprendimai/Investment Decisions.
Table A4.
Skolinimosi sprendimus lemiantys veiksniai/Factors Influencing Borrowing Decisions.
Table A5.
Draudimas/Insurance.
Table A6.
Ekonominės aplinkos suvokimas ir emocinės reakcijos/Perceptions of the Economic Environment and Emotional Responses.
Table A7.
Technologiniai veiksniai/Technological Factors.
Appendix B. Final Financial Decision-Making Scale: Dimensions and Scoring Guidelines
The final instrument consists of 36 items grouped into ten dimensions. Each item is rated on a five-point Likert scale from 1 (strongly disagree) to 5 (strongly agree). For practical application, each dimension is scored separately by calculating the mean of its items. All items within a dimension must be completed; otherwise, the dimension score is not calculated.
Higher scores indicate greater agreement with the statements representing each dimension. For Saving Behaviour, Long-term Saving Behaviour, and Financial Self-management, higher scores indicate stronger endorsement of the financial practices described in the items. For the insurance, responsible borrowing, investment, and financial technology subscales, higher scores indicate stronger endorsement of the behaviours, intentions, attitudes, or perceptions described in the respective items. For Economic Environment Perception and Borrowing Environment Perception, higher scores indicate greater perceived influence of external conditions on financial decisions. For Economic Anxiety, higher scores indicate greater anxiety related to economic uncertainty.
An overall instrument score is not recommended, as the validity of a total score has not been established. The instrument should therefore be interpreted as a profile of ten separate dimensions.
The table presents the final scale dimensions in Lithuanian and English, together with the corresponding item codes from the original questionnaire (Appendix A).
| Dimension (Lithuanian) | Dimension (English) | Retained Items |
| Taupymo elgsena | Saving Behaviour | A2.1, A2.2, A2.3 |
| Ilgalaikio taupymo elgsena | Long-term Saving Behaviour | A2.5, A2.6, A2.7, A2.8 |
| Asmeninių finansų valdymas | Financial Self-management | A1.1, A1.2, A1.3, A1.4, A1.5, A1.7 |
| Ekonominės aplinkos suvokimas | Economic Environment Perception | A6.1, A6.2, A6.3 |
| Draudimo elgsena ir nuostatos | Insurance Behaviour and Attitudes | A5.1, A5.2, A5.3, A5.4 |
| Atsakingo skolinimosi ketinimai | Responsible Borrowing Intentions | A4.1, A4.3, A4.4, A4.5 |
| Skolinimosi aplinkos suvokimas | Borrowing Environment Perception | A4.6, A4.7, A4.8 |
| Investavimo ketinimai ir nuostatos | Investment Intentions and Attitudes | A3.1, A3.2, A3.3, A3.4 |
| Finansinių technologijų naudojimas ir suvokimas | Financial Technology Use and Perceptions | A7.1, A7.2, A7.3 |
| Ekonominis nerimas | Economic Anxiety | A6.5, A6.6 |
References
- Armantier, O., Foncel, J., & Treich, N. (2023). Insurance and portfolio decisions: Two sides of the same coin? Journal of Financial Economics, 148(3), 201–219. [Google Scholar] [CrossRef] [Scilit]
- Bechara, A., Damasio, A. R., Damasio, H., & Anderson, S. W. (1994). Insensitivity to future consequences following damage to human prefrontal cortex. Cognition, 50(1–3), 7–15. [Google Scholar] [CrossRef] [Scilit]
- Białowolski, P. (2019). Economic sentiment as a driver for household financial behavior. Journal of Behavioral and Experimental Economics, 80, 59–66. [Google Scholar] [CrossRef] [Scilit]
- Bouzguenda, K. (2018). Emotional intelligence and financial decision making: Are we talking about a paradigmatic shift or a change in practices? Research in International Business and Finance, 44, 273–284. [Google Scholar] [CrossRef] [Scilit]
- Brown, T. A. (2015). Confirmatory factor analysis for applied research (2nd ed.). Guilford Press. [Google Scholar]
- Canova, L., Manganelli Rattazzi, A. M., & Webley, P. (2005). The hierarchical structure of saving motives. Journal of Economic Psychology, 26(1), 21–34. [Google Scholar] [CrossRef] [Scilit]
- Davydenko, M., Kolbuszewska, M., & Peetz, J. (2021). A meta-analysis of financial self-control strategies: Comparing empirical findings with online media and lay person perspectives on what helps individuals curb spending and start saving. PLoS ONE, 16(7), e0253938. [Google Scholar] [CrossRef] [Scilit]
- Dew, J., & Xiao, J. J. (2011). The financial management behavior scale: Development and validation. Journal of Financial Counseling and Planning, 22(1), 43–59. [Google Scholar]
- Fabrigar, L. R., Wegener, D. T., MacCallum, R. C., & Strahan, E. J. (1999). Evaluating the use of exploratory factor analysis in psychological research. Psychological Methods, 4(3), 272–299. [Google Scholar] [CrossRef]
- Finucane, M. L., & Gullion, C. M. (2010). Developing a tool for measuring the decision-making competence of older adults. Psychology and Aging, 25(2), 271–288. [Google Scholar] [CrossRef] [Scilit]
- Fisher, P. J., & Montalto, C. P. (2010). Effect of saving motives and horizon on saving behaviors. Journal of Economic Psychology, 31(1), 92–105. [Google Scholar] [CrossRef] [Scilit]
- Fong, J. H. (2025). Financial literacy and household financial behavior in Singapore. Pacific-Basin Finance Journal, 90, 102651. [Google Scholar] [CrossRef] [Scilit]
- Fornell, C., & Larcker, D. F. (1981). Evaluating structural equation models with unobservable variables and measurement error. Journal of Marketing Research, 18(1), 39–50. [Google Scholar] [CrossRef] [Scilit]
- Freed, P. G. (2026). Insufficient sleep and intraday financial decision making. Management Science. Ahead of Print. [Google Scholar] [CrossRef] [Scilit]
- Frei, V., Lighthall, N. R., Faulkner, R., El-Shafie, D., Lin, T., Ten Brinke, L., Wilson, R. C., & Ebner, N. C. (2026). The Social Iowa Gambling Task: A promising tool for assessing deception detection in real-world contexts in adulthood. The Journals of Gerontology: Series B, Psychological Sciences and Social Sciences, 81(6), gbag046. [Google Scholar] [CrossRef] [Scilit]
- Frydman, C., & Camerer, C. F. (2016). The psychology and neuroscience of financial decision making. Trends in Cognitive Sciences, 20(9), 661–675. [Google Scholar] [CrossRef] [Scilit]
- Gerstenecker, A., Eakin, A., Triebel, K., Martin, R., Swenson-Dravis, D., Petersen, R. C., & Marson, D. (2016). Age and education corrected older adult normative data for a short form version of the Financial Capacity Instrument. Psychological Assessment, 28(6), 737–749. [Google Scholar] [CrossRef] [Scilit]
- Gerstenecker, A., Kennedy, R., Zhang, Y., Martin, R. C., Mackin, R. S., Weiner, M. W., Howell, T., Petersen, R. C., Roberson, E. D., & Marson, D. C. (2023). Item response analysis of the Financial Capacity Instrument-Short Form. Archives of Clinical Neuropsychology, 38(5), 739–758. [Google Scholar] [CrossRef] [Scilit]
- Giannouli, V., Stamovlasis, D., & Tsolaki, M. (2018). Exploring the role of cognitive factors in a new instrument for elders’ financial capacity assessment. Journal of Alzheimer’s Disease, 62(4), 1579–1594. [Google Scholar] [CrossRef] [Scilit]
- Hair, J. F., Black, W. C., Babin, B. J., & Anderson, R. E. (2022). Multivariate data analysis (8th ed.). Cengage. [Google Scholar]
- Hayton, J. C., Allen, D. G., & Scarpello, V. (2004). Factor retention decisions in exploratory factor analysis: A tutorial on parallel analysis. Organizational Research Methods, 7(2), 191–205. [Google Scholar] [CrossRef] [Scilit]
- Henseler, J., Ringle, C. M., & Sarstedt, M. (2015). A new criterion for assessing discriminant validity in variance-based structural equation modeling. Journal of the Academy of Marketing Science, 43(1), 115–135. [Google Scholar] [CrossRef] [Scilit]
- Ho, E. H., Ece, B., Bucko, P., Karpouzian-Rogers, T., Pila, S., Hosseinian, Z., Hussein, Y., Han, S. D., Lichtenberg, P. A., Lim, A. C., Weintraub, S., & Gershon, R. C. (2025). A scoping review of financial decision-making measures in midlife and beyond: Results from the advancing reliable measurement in cognitive aging and decision-making ability (ARMCADA) study. Frontiers in Psychology, 16, 1540508. [Google Scholar] [CrossRef] [Scilit]
- Horn, J. L. (1965). A rationale and test for the number of factors in factor analysis. Psychometrika, 30(2), 179–185. [Google Scholar] [CrossRef] [Scilit]
- Kaiser, H. F. (1974). An index of factorial simplicity. Psychometrika, 39, 31–36. [Google Scholar] [CrossRef] [Scilit]
- Li, C.-H. (2016). Confirmatory factor analysis with ordinal data: Comparing robust maximum likelihood and diagonally weighted least squares. Behavior Research Methods, 48, 936–949. [Google Scholar] [CrossRef] [Scilit]
- Loewenstein, G. F., Weber, E. U., Hsee, C. K., & Welch, N. (2001). Risk as feelings. Psychological Bulletin, 127(2), 267–286. [Google Scholar] [CrossRef] [Scilit]
- Lunt, P. K., & Livingstone, S. M. (1991). Psychological, social and economic determinants of saving: Comparing recurrent and total savings. Journal of Economic Psychology, 12(4), 621–641. [Google Scholar] [CrossRef] [Scilit]
- Lyons, A. C., & Kass-Hanna, J. (2021). A methodological overview to defining and measuring “digital” financial literacy. Financial Planning Review, 4(2), e1113. [Google Scholar] [CrossRef] [Scilit]
- MacCallum, R. C., Widaman, K. F., Zhang, S., & Hong, S. (1999). Sample size in factor analysis. Psychological Methods, 4(1), 84–99. [Google Scholar] [CrossRef]
- Marson, D. (2016). Conceptual models and guidelines for clinical assessment of financial capacity. Archives of Clinical Neuropsychology, 31(6), 541–553. [Google Scholar] [CrossRef] [Scilit]
- Meng, K., Mahapatra, M. S., & Xiao, J. J. (2025). Artificial intelligence and consumer financial behavior: A systematic literature review and agenda for future research. Journal of Consumer Behaviour, 24(4), 1755–1786. [Google Scholar] [CrossRef] [Scilit]
- Moore, S., Naragon-Gainey, K., Pestell, C. F., Becerra, R., Buelow, M. T., Fynn, D. M., & Weinborn, M. (2026). The level and nature of impairment on the Iowa Gambling Task following acquired brain injury: A meta-analysis. Neuropsychology Review, 36(2), 140–159. [Google Scholar] [CrossRef] [Scilit]
- OECD. (2022). OECD/INFE toolkit for measuring financial literacy and financial inclusion 2022. OECD Publishing. [Google Scholar] [CrossRef] [Scilit]
- OECD. (2024). OECD/INFE survey instrument to measure digital financial literacy. OECD Publishing. [Google Scholar] [CrossRef] [Scilit]
- Özdemir, B. (2022). Financial literacy in education process: Literature study. The Universal Academic Research Journal, 4(2), 64–70. [Google Scholar] [CrossRef] [Scilit]
- Peterson, R. A. (2000). A meta-analysis of variance accounted for and factor loadings in exploratory factor analysis. Marketing Letters, 11, 261–275. [Google Scholar] [CrossRef] [Scilit]
- Peterson, R. L. (2007). Affect and financial decision-making: How neuroscience can inform market participants. Journal of Behavioral Finance, 8(2), 70–78. [Google Scholar] [CrossRef] [Scilit]
- Seaman, K. L., Abiodun, S. J., Fenn, Z., Samanez-Larkin, G. R., & Mata, R. (2022). Temporal discounting across adulthood: A systematic review and meta-analysis. Psychology and Aging, 37(1), 111–124. [Google Scholar] [CrossRef] [Scilit]
- Silinskas, G., Ranta, M., & Wilska, T.-A. (2021). Financial behaviour under economic strain in different age groups: Predictors and change across 20 years. Journal of Consumer Policy, 44, 235–257. [Google Scholar] [CrossRef] [Scilit]
- Vandenberg, R. J., & Lance, C. E. (2000). A review and synthesis of the measurement invariance literature: Suggestions, practices, and recommendations for organizational research. Organizational Research Methods, 3(1), 4–70. [Google Scholar] [CrossRef] [Scilit]
- Vieira, K. M., Matheis, T. K., & Lehnhart, E. d. R. (2024). Digital financial capability scale. Journal of Risk and Financial Management, 17(9), 404. [Google Scholar] [CrossRef] [Scilit]
- West, S. G., Finch, J. F., & Curran, P. J. (1995). Structural equation models with nonnormal variables: Problems and remedies. In R. H. Hoyle (Ed.), Structural equation modeling: Concepts, issues, and applications (pp. 56–75). Sage Publications. [Google Scholar]
- Wolf, E. J., Harrington, K. M., Clark, S. L., & Miller, M. W. (2013). Sample size requirements for structural equation models: An evaluation of power, bias, and solution propriety. Educational and Psychological Measurement, 73(6), 913–934. [Google Scholar] [CrossRef] [Scilit]

Disclaimer/Publisher’s Note: The statements, opinions and data contained in all publications are solely those of the individual author(s) and contributor(s) and not of MDPI and/or the editor(s). MDPI and/or the editor(s) disclaim responsibility for any injury to people or property resulting from any ideas, methods, instructions or products referred to in the content. |
© 2026 by the authors. Licensee MDPI, Basel, Switzerland. This article is an open access article distributed under the terms and conditions of the Creative Commons Attribution (CC BY) license.