


Abstract
This study examines whether conclusions regarding the ESG–financial performance relationship are sensitive to ESG measurement, functional form, and industry context. Using annual data for 188 listed firms across seven Asian markets and three sectors from 2019 to 2023, we evaluate return on assets (ROA) and return on equity (ROE) using Two-Way Fixed Effects (TWFE) as the primary econometric framework. ESG is represented by aggregate scores, individual pillars, and a PCA-based Latent ESG measure, while Elastic Net, Random Forest, and XGBoost provide supplementary predictive checks. The preferred aggregate specifications yield a negative linear and positive quadratic Latent ESG pattern, indicating convexity but not formally establishing a U-shaped relationship. Sector-specific estimates display directionally similar curvature, although confidence intervals are generally wide and cross-sector differences are treated as exploratory. The results are consistent with an interpretation in which early ESG implementation costs may temporarily weigh on profitability, whereas more mature integration may generate operational or reputational benefits. The study contributes by evaluating ESG measurement, nonlinearity, and industry heterogeneity within a common emerging-Asia framework while clearly separating econometric inference from predictive robustness. These findings also inform the Sustainable Development Goals (SDGs), particularly sustainable economic growth, responsible business practices, and climate action.
1. Introduction
Environmental, Social, and Governance (ESG) considerations have become increasingly central to corporate strategy and investment decisions worldwide. This global shift is driven by international frameworks, such as the United Nations Sustainable Development Goals (UN SDGs), alongside intensifying pressure from investors and consumers. As stakeholders demand greater corporate accountability for non-financial performance, understanding the relationship between ESG practices and financial outcomes has emerged as a critical research priority. Consequently, sustainability disclosure standards have evolved from largely voluntary practices toward more formal regulatory mechanisms, often accompanied by government incentives for compliance.
Although sustainability reporting across Asia initially originated as voluntary practice, regional regulatory frameworks have progressively transitioned toward institutionalized governance. Recent evidence highlights that key Asian economies increasingly mandate board-level oversight and legal accountability regarding sustainability data, embedding disclosure into formal corporate governance structures (OECD, 2025). Furthermore, regulatory enforcement across the region has predominantly embraced an enabling rather than punitive approach, prioritizing preventive guidance and capacity-building. This rapid institutional formalization underscores the necessity of investigating whether such governance shifts translate into measurable financial outcomes.
Numerous studies have examined the relationship between ESG performance and financial outcomes, yet the empirical evidence remains fragmented. While a substantial body of research reports positive associations between sustainability performance and financial outcomes (Ahmed et al., 2023; Gartia et al., 2024; Wu et al., 2022), other studies find statistically insignificant or negative relationships (Gutiérrez-Ponce & Wibowo, 2023; Meher et al., 2020; Tran Bui, 2023). Findings may also differ depending on whether ESG is represented by an aggregate score or by separate Environmental, Social, and Governance pillars (Bumin & Ertugrul, 2024; Gartia et al., 2024). These mixed results suggest that conclusions regarding the ESG–financial performance nexus may be sensitive to both measurement choice and empirical specification.
An additional source of variation concerns the functional form of the relationship. ESG investments may initially impose compliance, restructuring, and implementation costs, while more mature ESG integration may subsequently generate efficiency, reputational, or strategic benefits. Consistent with this possibility, previous research has considered nonlinear ESG–financial performance relationships (Pu, 2023). Machine learning approaches have also increasingly been employed to capture flexible predictive patterns in ESG-related data (Chaouech, 2025; Fettahoglu et al., 2025; Herman et al., 2025; Sultana & Zeya, 2025; Xiao et al., 2026); however, in the present study, machine learning is used only as a complementary predictive assessment rather than as a substitute for econometric inference.
The ESG–financial performance relationship may also differ across countries and industries because firms face different regulatory environments, operating structures, and ESG-related cost burdens. For example, Shrestha et al. (2025) show that the relationship varies across industries within emerging markets. Such heterogeneity raises the possibility that aggregating structurally different firms may obscure important differences in the direction or functional form of the ESG–financial performance association.
A remaining gap is therefore not whether industry heterogeneity, nonlinearity, or alternative ESG measures matter individually, as each has been examined in prior research, but whether conclusions regarding the ESG–financial performance relationship remain consistent when these dimensions are considered jointly within a common empirical framework. This issue is particularly relevant in emerging Asian markets, which remain comparatively underexplored despite their growing economic significance and evolving ESG regulatory environments.
To address this gap, this study examines the ESG–financial performance relationship within emerging Asian markets. Utilizing secondary data from 2019 to 2023, the study draws on observations from 188 listed firms across seven Asian markets, namely, China, South Korea, Taiwan, Indonesia, Thailand, India, and Malaysia. This research is guided by the following research questions:
RQ1: How is ESG performance—measured via aggregate scores, individual pillars, and latent constructs—associated with firm financial performance (ROA and ROE)?
RQ2: How does the association between ESG performance and financial outcomes vary across different industry sectors?
Financial performance is evaluated using two key profitability variables: ROA to reflect operational efficiency and ROE to indicate shareholder returns. This study makes two primary contributions to the literature. First, we examine whether conclusions regarding the ESG–financial performance relationship are sensitive to the way ESG is represented and to whether linear or nonlinear functional forms are imposed. Second, we examine whether these patterns persist or change across structurally different industries within the same multi-country panel, while using machine learning as a complementary predictive assessment rather than as a substitute for econometric inference. The formal hypotheses are developed at the end of the literature review after the theoretical, empirical, and industry-specific evidence has been established.
The remainder of this paper is organized as follows. Section 2 reviews the relevant literature regarding the relationship between financial performance and ESG scores. Section 3 describes the data and empirical methodology. Section 4 presents the empirical findings. Section 5 discusses these results, interprets the proposed mechanisms, and contrasts the findings with prior empirical studies. Finally, Section 6 concludes the paper by highlighting key implications and potential directions for future research.
2. Literature Review
2.1. Theoretical Framework
The theoretical foundation underpinning the relationship between ESG performance and corporate financial outcomes draws upon five complementary perspectives: Stakeholder Theory, Institutional Theory, Legitimacy Theory, a cost–benefit trade-off perspective, and the Resource-Based View (RBV). Together, these perspectives provide a comprehensive lens through which both external socio-political pressures and internal economic mechanisms driving ESG adoption can be understood.
Stakeholder Theory, originally advanced by Freeman (1984), provides a normative framework asserting that firms bear ethical responsibilities not only to shareholders but also to a broader constellation of stakeholders, including employees, customers, communities, and regulators. Under this paradigm, the integration of sustainability practices is conceptualized as a strategic mechanism for balancing competing stakeholder interests while simultaneously enhancing long-term financial performance. However, while Stakeholder Theory effectively explains the internal rationale for ESG adoption, it offers limited insight into the role of external socio-political pressures in shaping corporate behavior.
To address this limitation, Institutional Theory provides a complementary perspective, explaining how regulatory mandates, industry norms, and societal expectations compel firms to conform to prevailing sustainability standards. This framework is particularly relevant in the context of emerging markets, where domestic and regional mandates have increasingly obliged energy and industrial firms across economies such as Thailand, Indonesia, and Malaysia to restructure their corporate strategies in alignment with national Net-Zero commitments. As such, ESG adoption in these contexts is often driven not merely by voluntary commitment but by institutionalized compliance pressures.
Complementing this, Legitimacy Theory elucidates how organizations employ sustainability disclosures to manage public perception, signal corporate responsibility, and secure their social “license to operate.” Conversely, firms neglecting social responsibilities face legitimacy threats, manifesting as negative brand perception, heightened regulatory scrutiny, and diminished market valuation.
While Stakeholder, Institutional, and Legitimacy theories explain the external drivers and societal expectations surrounding ESG adoption, understanding the non-linear dynamics and industry-specific heterogeneity of financial returns requires complementary internal economic perspectives: the cost–benefit trade-off perspective and the RBV.
According to the cost–benefit trade-off perspective (Vance, 1975), corporate resources are finite, and diverting capital toward ESG practices imposes immediate compliance costs, administrative overheads, and capital expenditure (CAPEX) burdens. In capital-intensive or environmentally sensitive industries, these initial outlays temporarily outweigh short-term economic returns, generating an initial decline in profitability. This cost-burden mechanism theoretically accounts for the negative linear slope observed in early-stage ESG adoption.
Conversely, the RBV, as developed by Barney (1991), conceptualizes proactive sustainability initiatives as strategic, intangible assets that are valuable, rare, inimitable, and non-substitutable. As firms mature in their ESG implementation, these initial investments transition into core capabilities—fostering operational efficiencies, building relational capital, enhancing brand equity, and lowering the cost of capital. This capability-building process may contribute to an eventual upward trajectory in financial performance, providing a theoretical rationale for the positive quadratic term associated with a convex or U-shaped relationship.
Integrating the cost–benefit trade-off perspective with the RBV provides a robust rationale for expecting both non-linear patterns and cross-sectoral heterogeneity. The stage at which ESG investments transition from a compliance cost burden to a capability-enhancing asset differs fundamentally across sectors based on capital intensity, regulatory exposure, and operational structures, explaining why financial returns to sustainability vary across Asian industrial contexts.
2.2. ESG Performance and Corporate Financial Outcomes
Building upon these theoretical underpinnings, a substantial body of empirical literature has investigated whether ESG performance translates into measurable financial benefits. Prior research has examined the relationship between ESG disclosure—operationalized through Global Reporting Initiative (GRI) frameworks and standardized ESG scores—and key corporate financial performance indicators, including Tobin’s Q, ROE, ROA, and stock price indices. Employing approaches such as GMM estimation, panel data regression, Pearson correlation analysis, and Generalized Least Squares (GLS), a prominent stream of research consistently demonstrates a positive association between sustainability performance and financial outcomes (Gartia et al., 2024; Habib, 2023; Wu et al., 2022). Under this paradigm, robust ESG disclosure functions as an effective mechanism for satisfying stakeholder expectations and enhancing corporate reputation, which in turn fosters superior financial returns and mitigates unsystematic risk.
Nevertheless, a competing body of literature challenges this positive consensus, reporting statistically insignificant or even negative relationships between ESG performance and financial outcomes (Gutiérrez-Ponce & Wibowo, 2023; Meher et al., 2020; Tran Bui, 2023). Proponents of this view contend that prevailing ESG metrics may be insufficiently precise to capture the direct causal pathways through which sustainability initiatives influence corporate financial and investment returns. Moreover, the inherent volatility and structural instability of conventional financial ratios—including ROA, ROE, and price-to-earnings (P/E) ratios—may compromise the validity and robustness of empirical tests when modeled alongside panel ESG data, thereby contributing to inconclusive findings.
To address these inconsistencies and measurement ambiguities, it is important to clarify how corporate sustainability is operationalized in this study. The following section details the ESG measurement framework adopted.
ESG Performance
ESG performance is a critical variable employed to examine corporate sustainability relationships. Most empirical studies utilize aggregate ESG scores and individual Environmental, Social, and Governance pillar scores. The ESG variables employed in this study were obtained from Refinitiv Eikon for the 2019–2023 period and therefore correspond to the legacy Refinitiv/LSEG ESG scoring framework (LSEG Data & Analytics, 2024).
Under this framework, LSEG collects more than 870 company-level ESG measures, of which 186 comparable and material measures are used in the scoring process. These measures are organized into 10 categories that are subsequently aggregated into the Environmental, Social, and Governance pillars and the overall ESG score (see Figure 1) (LSEG Data & Analytics, 2024). The Environmental pillar comprises Resource Use, Emissions, and Innovation; the Social pillar comprises Workforce, Human Rights, Community, and Product Responsibility; and the Governance pillar comprises Management, Shareholders, and CSR Strategy.
Figure 1.
Legacy Refinitiv/LSEG ESG score structure. Source: London Stock Exchange Group (LSEG) (LSEG Data & Analytics, 2024).
The legacy scoring methodology applies percentile-rank calculations to generate ESG scores ranging from 0 to 100. Environmental and Social scores are primarily benchmarked against firms within the same industry group, whereas Governance scores are benchmarked by country of incorporation (LSEG Data & Analytics, 2024). Industry-specific materiality weights are then applied when aggregating category scores into the ESG pillars and the overall ESG score.
For the empirical analysis in this study, the aggregate ESG score is rescaled from its original 0–100 scale to a 0–1 scale. The Environmental, Social, and Governance pillar scores retain their original 0–100 scale prior to standardization for the PCA procedure used to construct the Latent ESG variable. This distinction explains the different numerical ranges reported for the aggregate ESG score and the individual pillars in the descriptive statistics.
LSEG subsequently introduced a redesigned ESG scoring framework in 2026 (LSEG Data & Analytics, 2026a). The new methodology differs materially from the legacy framework used in this study: it adopts a modular structure based on over 220 indicators across 12 ESG themes, expresses the resulting Theme, Pillar, and overall ESG Scores on a 0–5 scale, and separates core ESG management performance from broader risk and impact dimensions through the ESG Scores Plus architecture (LSEG Data & Analytics, 2026b). Because the present analysis uses historical Refinitiv Eikon observations from 2019–2023, the 2026 framework and ESG Scores Plus are not employed in the empirical analysis and are mentioned only to distinguish the current LSEG methodology from the legacy scoring system underlying the dataset.
The existing literature on corporate sustainability frequently relies on various proprietary ESG databases, including LSEG/Refinitiv (Aydoğmuş et al., 2022; Chaouech, 2025; El Khoury et al., 2023; Makridou et al., 2024; Naeem et al., 2022), Bloomberg (Buallay, 2019), and the ESGUI index (Sultana & Zeya, 2025). Because there is no globally standardized methodology for constructing ESG metrics, score definitions, weighting schemes, and benchmarking procedures differ across data providers. The use of a single historical Refinitiv/LSEG framework throughout the present sample therefore helps maintain measurement consistency across firms and years.
2.3. Disaggregated ESG Pillar Effects
Given the unresolved debate surrounding the aggregate ESG–performance relationship, contemporary researchers have increasingly shifted their focus toward examining the disaggregated impacts of individual ESG pillars—Environmental (E), Social (S), and Governance (G)—on corporate financial ratios. This approach proceeds from the recognition that the three pillars may exert heterogeneous effects on financial performance, and that aggregation may obscure meaningful variation across sustainability dimensions. However, this line of inquiry has similarly yielded mixed and nuanced results (Bumin & Ertugrul, 2024; Gartia et al., 2024).
On the one hand, several empirical findings support a positive nexus between individual pillar scores and financial performance. Bumin and Ertugrul (2024) identify a significant positive relationship between the Environmental pillar score and corporate financial performance, suggesting that ecologically conscious operations can generate superior economic returns, potentially through resource efficiency gains and reduced regulatory exposure. This finding is corroborated by Habib and Mourad (2024), who demonstrate that all three individual pillar scores correlate positively with financial performance across their sampled firms. On the other hand, alternative studies report that certain ESG pillars exhibit no statistically significant relationship with financial outcomes (Aydoğmuş et al., 2022; Gutiérrez-Ponce & Wibowo, 2023). These scholars postulate that long-term sustainability strategies frequently fail to translate into immediate, short-term financial gains. Indeed, environmental initiatives can impose a negative short-run trade-off on financial metrics, as firms often incur substantial upfront operational expenditures and compliance costs when implementing green strategies—such as advanced wastewater treatment systems and green product redesign (Bumin & Ertugrul, 2024).
2.4. Geographic Heterogeneity and Emerging Market Context
A significant portion of the divergence documented in the ESG–performance literature can be attributed to variations in geographical context and institutional maturity. A substantial share of prior research concentrates on developed economies, including the European Union (Bumin & Ertugrul, 2024; Gavrilakis & Floros, 2023; La Torre et al., 2020; Priem & Gabellone, 2024) and the United States (Aydoğmuş et al., 2022), where ESG disclosures are benchmarked against mature and rigorous sustainability reporting standards. In contrast, a growing but comparatively smaller body of work has directed attention toward developing regions, particularly Southeast Asia (Gutiérrez-Ponce & Wibowo, 2023; Trisnowati et al., 2022) and South Asia (Meher et al., 2020; Yadav et al., 2025), where regulatory frameworks remain nascent and institutional enforcement capacity is more limited.
Comparative studies further underscore the moderating role of national income levels in shaping the ESG–finance nexus, examining distinct economic blocs such as EU versus non-EU jurisdictions (Makridou et al., 2024) and the broader Asia-Pacific region (Albao et al., 2025). This body of evidence consistently reveals that firms operating in high-income, developed economies demonstrate a more uniform, positive alignment between ESG implementation and financial performance. In contrast, within lower-income or transitional economic zones, the financial outcomes of ESG integration are considerably more heterogeneous. This heterogeneity reflects the asymmetric financial burdens faced by certain sectors when undertaking substantive sustainability overhauls, alongside the capacity of other industries to leverage ESG practices as a signal of investment attractiveness.
Within the emerging Asian context specifically, recent empirical observations highlight a complex interplay between rapid disclosure acceleration, macroeconomic disruptions, and regulatory mandates. Although sustainability reporting across Asia was initially characterized by voluntary disclosure practices, regulatory frameworks have progressively transitioned toward institutionalized governance. According to the OECD (2025) report, Board Responsibility and Sustainability-Related Disclosure in Asia, key Asian economies—including Japan, South Korea, Singapore, and China—have established regulatory mechanisms that explicitly mandate board-level oversight, verification, and legal accountability regarding the integrity and accuracy of sustainability data. As a result, sustainability disclosure has shifted from a discretionary corporate activity into an integral component of formal corporate governance structures.
This transition has been further reinforced by the growing adoption of internationally recognized sustainability reporting standards, particularly those issued by the International Sustainability Standards Board (ISSB), which aim to establish a globally comparable baseline for sustainability-related disclosures across jurisdictions. In this regard, a regional assessment published by the Association of Chartered Certified Accountants (ACCA, 2025), entitled Sustainability Reporting in ASEAN: An Overview of Current Developments, reports that many ASEAN economies, including Indonesia, Malaysia, Singapore, Thailand, and the Philippines, have either adopted or are in the process of implementing reporting frameworks aligned with International Financial Reporting Standards General Requirements for Disclosure of Sustainability-related Financial Information (IFRS S1) and International Financial Reporting Standards Climate-related Disclosures (IFRS S2), reflecting a broader regional movement toward standardized and mandatory sustainability reporting. Furthermore, sustainability reporting is increasingly viewed not merely as a disclosure obligation but as a governance mechanism that supports transparency, accountability, strategic decision-making, and risk management. In this context, sustainability-related information is expected to inform board oversight of governance processes, corporate strategy, organizational resilience, and long-term value creation.
Notably, regulatory enforcement across the region has predominantly adopted an enabling and facilitative approach rather than a punitive one, largely attributable to the relative scarcity of sustainability-washing and greenwashing litigation in Asian jurisdictions. Consequently, regulatory authorities have prioritized preventive measures, such as administrative guidance, formal warning letters, educational initiatives, and capacity-building programmes, before resorting to formal statutory sanctions. OECD (2025) further suggests that this developmental regulatory approach seeks to strengthen reporting quality and governance capacity while supporting the gradual institutionalisation of sustainability disclosure across Asian markets.
Within the emerging Asian context specifically, recent empirical observations highlight a complex interplay between rapid disclosure acceleration, macroeconomic disruptions, and regulatory mandates. While overall ESG disclosure scores in Asia historically lagged behind North America, Europe, and Australia, Asian firms have demonstrated a significantly faster acceleration rate in reporting compared to developed counterparts (FTSE Russell, 2019; Kercher et al., 2026). Le (2024) examined 225 listed firms across six Southeast Asian economies—including Thailand, Malaysia, and Indonesia—and found that while one-period lagged ESG scores exert a significantly positive effect on ROA, macroeconomic disruptions such as the COVID-19 pandemic impose a significant negative impact. Building on these findings, it becomes evident that a high rate of ESG disclosure in these regions does not inherently translate to superior financial benefits. Instead, this surge in reporting is largely driven by external institutional pressures—such as stringent investor demands, tax incentives, and regulatory mandates—rather than purely voluntary corporate initiatives (Kercher et al., 2026).
Examining these specific trends further, Mustafa Kamal et al. (2026) observed a significant increase in ESG disclosure rates post-2019 within Asian emerging markets. However, industry and market evaluations reveal a critical concern: although these markets exhibit the highest growth in disclosure scores, their fundamentally weak underlying ESG performance exposes them to a substantially higher risk of greenwashing compared with other global benchmarks, as reported by FTSE Russell (2025). Furthermore, this regional growth exhibits notable country-level heterogeneity, particularly when confronting macroeconomic shocks. For instance, countries like Indonesia demonstrated a resilient and continuous upward trajectory in ESG disclosures throughout the COVID-19 pandemic. Conversely, Thailand and Malaysia experienced a temporary decline in their disclosure scores during the height of the crisis, followed by a robust recovery aligned with subsequent economic revitalization. These dynamic shifts are heavily influenced by decisive government interventions, including Malaysia’s MCCG reforms, Thailand’s One Report mandate, and Indonesia’s OJK regulations, alongside shifting investor expectations. Consequently, in the post-pandemic era, investors increasingly perceive ESG reporting not merely as a compliance exercise but as a critical and flexible strategy for ensuring long-term corporate resilience.
Ultimately, this highly dynamic regulatory environment—characterized by rapid reporting growth juxtaposed with high greenwashing risks and varying levels of macroeconomic resilience—makes emerging Asian markets a particularly relevant setting for this study. It underscores the importance of employing panel models that control for time-invariant firm heterogeneity and common time-specific shocks when estimating the conditional association between ESG practices and financial performance.
2.5. Methodological Approaches: Econometric and Machine Learning Frameworks
Beyond the substantive debate on ESG effects, a parallel methodological discussion has emerged regarding the most appropriate analytical frameworks for investigating the ESG–performance relationship. While traditional econometric approaches have dominated, a growing body of research increasingly applies machine learning (ML) algorithms to capture complex nonlinear relationships and predictive patterns in ESG-related data. For instance, De Lucia et al. (2020) applied machine learning alongside logistic regression to examine the relationship between ESG performance and firms’ financial outcomes, while more recent studies have extended ML applications to ESG prediction, classification, and performance evaluation (Chaouech, 2025; Sultana & Zeya, 2025; Xiao et al., 2026). These studies demonstrate the growing relevance of flexible computational approaches for capturing complex relationships that may not be adequately represented by conventional linear specifications. However, ML and traditional econometric models serve different analytical purposes: machine learning primarily emphasizes predictive performance and flexible functional forms, whereas panel econometric models provide a more interpretable framework for evaluating conditional relationships over time. Accordingly, the present study employs ML as a supplementary predictive framework rather than as a substitute for the panel estimations.
In response to the methodological challenges associated with panel data, prior studies have adopted a range of econometric approaches depending on their research objectives and data structures. For example, Zhou et al. (2023) employed a GMM-PVAR framework to examine the dynamic relationship between ESG and corporate financial performance, while Salem et al. (2025) applied system GMM and the Least Squares Dummy Variable Corrected (LSDVC) approach in a banking context. These approaches address different empirical objectives and rely on different assumptions; therefore, their use in prior studies does not imply that they are interchangeable or necessarily preferable for the short-T panel examined in the present study.
Given the methodological divergence in prior research and the specific constraints of short T panels, this study adopts the standard Fixed Effects (FE) model as the primary econometric framework. The core advantage of the FE model lies in its capacity to control for unobserved time-invariant firm heterogeneity, which is crucial when structural interpretability is required. To address dependence in the residuals, this study complements the baseline FE framework with firm-clustered, Driscoll–Kraay, and two-way clustered covariance estimators. The FE specification provides an interpretable baseline for the multi-country panel; however, the estimated coefficients are interpreted as conditional associations rather than definitive causal effects, and covariance estimators relying on a large time dimension are treated cautiously because the panel covers only five years.
Furthermore, Levene’s test is incorporated to examine whether residual variances differ across country groups.
2.6. Rationale for Industry Selection
While many studies rely on aggregated cross-industry samples to evaluate ESG effectiveness, a growing body of literature emphasizes the necessity of sector-specific analyses due to inherent differences in financial structures, systematic information, and regulatory environments. For instance, Lin and Hsu (2023) deliberately excluded financial institutions from their sample of Taiwanese firms, citing systematic differences in financial benchmarking and corporate structures. Conversely, other scholars have focused exclusively on the financial sector, arguing that banking institutions are deeply interconnected with global economic stability and serve as key conduits for ESG adoption through SME lending and green financing initiatives. Furthermore, commercial banks operate under high visibility and stringent regulatory oversight from central banks, making their ESG disclosures highly scrutinized by external stakeholders, including investors and citizens (Buallay, 2019; Cantero-Saiz et al., 2024; El Khoury et al., 2023).
Beyond the financial sector, empirical evidence highlights stark contrasts in ESG impacts between environmentally sensitive and non-sensitive industries. Li et al. (2024) observed that energy, utilities, mining, chemical, and steel industries generate substantial environmental externalities—such as carbon emissions and hazardous waste—necessitating highly intensive environmental expenditures to maintain ESG compliance. In a comprehensive cross-sectoral study, Tutar et al. (2025) found that the ESG-financial performance nexus is highly significant and positive in non-sensitive or consumer-facing sectors like technology, finance, retail, and manufacturing. However, in heavily regulated or environmentally intensive sectors such as energy, consumer goods, transportation, healthcare, and utilities, the relationship proved to be only weakly significant, reflecting the asymmetric financial burdens these industries face when implementing sustainability initiatives.
2.7. Research Gap and Hypotheses Development
Existing studies have already addressed several elements of the ESG–financial performance debate, but they have generally emphasized different dimensions. Shrestha et al. (2025) explicitly examine industry type as a moderator of the ESG–financial performance relationship in emerging markets, showing that the association varies across industries; however, their analysis focuses on industry moderation and cross-listing rather than on whether sectoral conclusions are sensitive to alternative ESG representations and functional forms. El Khoury et al. (2023) provide direct evidence of nonlinear ESG–financial performance relationships and differing pillar-level patterns, but their analysis is confined to banks in the MENAT region and therefore does not permit comparison across structurally different industries. Herman et al. (2025) combine linear regression with a feed-forward neural network to examine ESG and ROA/ROE, demonstrating the usefulness of comparing linear and nonlinear approaches, but they do not jointly evaluate alternative ESG representations within a sector-specific panel framework. Xiao et al. (2026) apply Decision Tree, Random Forest, and XGBoost across several industries, but their predictive direction is from financial fundamentals to ESG performance rather than from ESG performance to subsequent financial outcomes. Finally, Tutar et al. (2025) document sectoral and regional variation in the ESG–financial performance nexus across a broad global sample, yet their design combines aggregate and disaggregated ESG scores as separate regressors rather than as a PCA-derived latent construct and does not jointly evaluate these representations across linear and nonlinear panel specifications together with tuned machine learning models. Taken together, these studies establish that industry context, nonlinear functional forms, ESG measurement, and machine learning are each relevant, but more limited evidence examines whether the empirical conclusion itself remains stable when these analytical choices are evaluated jointly within the same dataset.
Against this background, two additional considerations remain relevant to the present study. First, a pronounced geographical imbalance persists, as prior research has predominantly concentrated on developed economies while leaving rapidly expanding emerging markets—particularly in Asia—comparatively underexplored, despite their accelerating economic trajectories and evolving institutional environments. Second, empirical inconsistencies may arise from the varying representations of sustainability performance employed across studies; aggregate ESG scores can yield conclusions that differ from those obtained using disaggregated pillar scores or latent constructs, even within broadly similar empirical settings.
To address these interconnected gaps, this study investigates the ESG–financial performance nexus within the context of emerging Asian markets, selected for their rapid economic growth and shifting institutional landscapes. Specifically, the analysis incorporates multiple representations of sustainability performance, including aggregate ESG scores, disaggregated pillar scores, and a latent construct synthesized through PCA, and evaluates their associations with key corporate profitability measures, namely, ROA and ROE. TWFE regressions provide the primary econometric framework for controlling for unobserved time-invariant firm heterogeneity and common year-specific shocks, while nonlinear machine learning models are employed as supplementary predictive robustness checks. The contribution therefore lies in testing the robustness of the empirical conclusion itself: whether the observed ESG–financial performance relationship remains similar, weakens, or changes when ESG measurement, functional form, and industry context are varied within the same empirical setting. Recent sector-specific evidence also indicates that the financial implications of ESG disclosure depend on profitability and industry context (Dorothy & Endri, 2024), reinforcing the rationale for examining both ESG–performance associations and sector heterogeneity. Based on these research objectives, the following hypotheses are formally proposed:
H1.
ESG performance has a statistically significant relationship with corporate financial performance, as measured by ROA and ROE.
H2.
The relationship between ESG performance and corporate financial performance varies across industry sectors because of industry-specific heterogeneity in regulatory exposure, operational structures, and ESG-related cost burdens.
3. Data and Methodology
3.1. Data and Sampling
Figure 2 summarizes the overall research design, from data collection through the final synthesis of econometric and predictive findings. This study utilizes an annual panel dataset of listed firms across seven Asian emerging markets, covering the period from 2019 to 2023. Firm-level financial and sustainability data were obtained primarily from the London Stock Exchange Group (LSEG)/Refinitiv Eikon database, with the financial-performance data supplemented by Yahoo Finance as indicated in Table 1. The 2019–2023 study period was selected because it provides the most complete common ESG coverage across the selected firms and markets under a consistent legacy Refinitiv/LSEG scoring framework, thereby limiting measurement inconsistency across the panel.
Figure 2.
Research data collection and methodology flowchart. Solid arrows indicate the sequential flow of the analytical procedure.
Table 1.
Data sources by variable category.
Before imputation and model estimation, observations with missing firm identifiers were excluded and duplicate firm-year records were consolidated. For duplicated firm-year observations, numeric values were averaged, while the first available non-missing categorical classification was retained. Following this data-cleaning procedure, the final analysis dataset contains 188 distinct firms. The sample comprises 31 firms assigned to China, 30 to India, 26 to Indonesia, 22 to Malaysia, 27 to South Korea, 25 to Taiwan, and 27 to Thailand. The usable number of firm-year observations nevertheless varies across variables and model specifications because of missing values and the construction of one-period lags. A complete list of the firm identifiers, country classifications, and industry classifications used in the empirical analysis is provided in Appendix A Table A1.
The final sample was not merely selected based on data availability within the Refinitiv Eikon database but was derived through a purposeful sampling strategy designed to fulfill the study’s core objectives. First, to rigorously evaluate industry heterogeneity, the selection was strictly confined to three targeted sectors, comprising 55 firms in Technology and Telecommunications, 69 firms in Financial Services and Banking, and 64 firms in Energy and Utilities. The country-by-sector distribution (Energy/Financial/Technology) is China 11/10/10, India 10/10/10, Indonesia 9/10/7, Malaysia 8/8/6, South Korea 10/10/7, Taiwan 6/10/9, and Thailand 10/11/6. These sectors were deliberately selected because they represent fundamentally different structural exposures to ESG risks, cost structures, and regulatory pressures. Second, focusing on publicly listed firms across seven major Asian emerging markets ensures that the sample comprises economically significant entities subject to stringent regional disclosure mandates and continuous stakeholder scrutiny. Finally, restricting the sample to these 188 firms ensures a sufficient density of continuous ESG and financial data across the observation period. This criterion minimizes the need for excessive data imputation while providing a stable and balanced foundation required for robust Two-Way Fixed Effects (TWFE) panel estimations.
- Energy and Utilities (Environmentally Sensitive Sector): This sector inherently generates substantial environmental externalities, such as high carbon emissions. Consequently, firms in this industry face intense regulatory scrutiny and may incur substantial environmental compliance and transition costs. This makes it a relevant setting for examining the ESG cost-burden interpretation.
- Financial Services and Banking (Highly Regulated Intermediary Sector): While possessing a lower direct environmental footprint, financial institutions play an important role in driving global ESG adoption through green financing and SME lending. Furthermore, operating under stringent central bank oversight, this sector faces substantial institutional pressure for robust corporate governance and systemic risk management.
- Technology and Telecommunications (Innovation-Driven and Consumer-Facing Sector): Characterized by high human capital intensity and rapid innovation, this sector’s ESG focus leans heavily toward the Social and Governance pillars, particularly concerning labor practices and data privacy.
The dataset contains missing observations for certain firm-year combinations, particularly for independent variables such as ESG pillar scores in earlier periods. To preserve the panel structure while retaining the available firms, missing predictor values are subsequently addressed through the hierarchical imputation procedure described in Section 3.2.1, whereas the dependent variables, ROA and ROE, are not imputed.
The variables employed in this study are categorized into three main components: dependent variables, ESG explanatory variables, and firm-level control variables, as detailed in Table 1. The dependent variables are ROA and ROE. ROA measures the efficiency with which a firm uses its assets to generate profits, whereas ROE measures returns generated on shareholders’ equity. Both outcomes are Winsorized to reduce the influence of extreme observations.
ESG performance serves as the principal explanatory construct. The aggregate ESG score and the individual Environmental, Social, and Governance pillar scores are obtained from Refinitiv Eikon. The aggregate ESG score is rescaled from its original 0–100 scale to range from 0 to 1. The Environmental, Social, and Governance pillar scores retain their original 0–100 scale in the descriptive statistics and are standardized only prior to PCA when constructing the LatentESG measure. FirmScale, FinancialRisk, and the ESG controversy score are included as firm-level controls in the relevant model specifications.
3.2. Methodology
The methodology proceeds through missing-data treatment, panel diagnostics, PCA-based latent-variable construction, TWFE estimation, model selection and optimization, and supplementary machine-learning prediction. These components jointly evaluate the ESG–financial performance relationship while separating econometric inference from predictive assessment.
3.2.1. Missing Data Treatment
Missing values in the independent variables mainly arise from incomplete sustainability disclosures or changes in reporting standards. To address this, a two-stage hierarchical imputation procedure is applied:
- -
- Within-firm filling: Missing values are first filled using available observations within the same firm.
- -
- Country-year median: Remaining values are replaced by the median within the same country and year.
As detailed in Appendix A Table A2, the hierarchical imputation procedure completed missing entries across the sustainability and financial variables used during data preparation. The primary within-firm stage resolved most missing observations, including all 56 missing values for each ESG pillar, 51 of 61 missing values for both the aggregate ESG and controversy scores, and 112 of 297 missing leverage observations. Remaining gaps were filled using the country-year median, including 10 observations for each of the aggregate ESG and controversy scores and 185 observations for leverage. This hierarchy prioritizes firm-specific information and then uses a contemporaneous country-level benchmark that is relatively robust to extreme observations.
The imputation framework also allowed industry-year, country-industry, year-specific, and global-median fallback levels. For the analytical variables used in estimation, however, these additional levels were not invoked: all missing entries were resolved by within-firm filling or the country-year median. The realized imputation path for the empirical analysis is therefore effectively two-stage, and the unused fallback levels do not alter the analytical dataset or subsequent estimates.
The dependent variables (ROA and ROE) are not imputed. Firm-year observations with missing values in the respective outcome are excluded from the corresponding outcome-specific analyses, so the usable sample size can differ between the ROA and ROE specifications. The completed predictors are then used to construct the lagged variables and PCA-based measures employed in estimation.
For the supplementary machine-learning analysis, the same transformed outcomes and PCA-derived predictors are used as in the econometric analysis. Because the common analytical variables are constructed before the chronological train–holdout split, the 2023 observations are excluded from model fitting and hyperparameter tuning but not from the preprocessing transformations used to construct the model inputs.
3.2.2. Panel Diagnostic Tests
The residual structure of the panel models is examined before statistical inference. Cross-sectional dependence is assessed using the Pesaran CD test. The null hypothesis () assumes cross-sectional independence, while rejection of indicates that unexplained shocks remain correlated across firms. Such dependence is economically plausible for listed firms because corporate performance and market conditions are jointly exposed to global and regional developments, including changes in financial-market sentiment, interest rates, commodity prices, macroeconomic conditions, and major external shocks.
Serial dependence is examined using the Breusch–Godfrey (BG) Lagrange Multiplier test. Rejection of the null hypothesis of no serial correlation indicates that residual shocks within a firm remain correlated over time. Country-level variance heterogeneity is examined separately using Levene’s test to determine whether residual dispersion differs systematically across national groups.
These diagnostics directly inform the inference strategy. Firm-clustered standard errors constitute the baseline covariance estimator because they allow arbitrary within-firm dependence over time. Driscoll–Kraay standard errors provide an additional robustness check against cross-sectional dependence, heteroskedasticity, and serial correlation, while two-way clustered standard errors further account for dependence within firms and common dependence across firms within the same year. These alternative covariance estimators affect the estimated uncertainty surrounding the TWFE coefficients rather than the coefficient estimates themselves.
3.2.3. Latent ESG Construction
To comprehensively capture corporate sustainability performance while reducing multicollinearity concerns in the regression models, this study constructs a latent ESG performance variable. Rather than treating the three pillar scores as entirely independent attributes, PCA is applied to ESG performance to extract their shared variation.
Prior research has documented that treating ESG pillars as independent regressors may introduce multicollinearity because ESG scores are inherently correlated (Naeem et al., 2022; Shobhwani & Lodha, 2024). To address this issue, dimensionality-reduction techniques can be employed to construct a composite latent measure. PCA has been widely adopted in financial and sustainability research to extract orthogonal factors that capture the maximum shared variance across correlated indicators (Allee et al., 2022; Dai et al., 2021). Accordingly, this study constructs a latent ESG variable (L) as the first principal component of the three pillar scores, weighted by the PCA loadings as follows:
where , , and denote the PCA loadings assigned to the standardized Environmental, Social, and Governance components, respectively. The indicators are standardized before component extraction, and the scree plot and eigenvalue criterion are used to guide component retention. This procedure reduces but does not necessarily eliminate informational overlap among the ESG pillars. The first principal component is retained as the latent ESG measure.
3.2.4. Econometric Regression Models
This study uses linear and nonlinear panel regressions to examine the association between ESG performance and financial performance in the following general form:
where denotes the dependent variable for firm i in period t, denotes the common intercept, denotes the lagged ESG variable, and denotes the lagged control variable or vector of control variables. The term denotes the firm fixed effect, denotes the year fixed effect, and denotes the idiosyncratic error term. The model specifications follow an economic rationale. M0 serves as the parsimonious baseline specification in linear form. M1 extends M0 by introducing a quadratic term for Latent ESG, allowing the ESG–financial performance association to exhibit curvature rather than imposing a strictly linear functional form.
The TWFE framework is selected as the primary econometric specification because the dataset has a short-time, multi-firm panel structure and contains substantial unobserved heterogeneity across firms. Firm-specific characteristics, such as corporate culture, managerial quality, business models, and inherent commitments to sustainability, are likely to influence both ESG performance and financial outcomes. Because these unobserved characteristics may be correlated with the explanatory variables, a fixed-effects specification is more appropriate than a random-effects framework. Firm fixed effects therefore control for time-invariant heterogeneity across companies, while year fixed effects account for common temporal shocks, including macroeconomic fluctuations, the COVID-19 disruption, changes in sustainability disclosure requirements, and shifts in regional regulatory conditions. The use of one-period-lagged explanatory variables further establishes temporal ordering between ESG performance and subsequent financial outcomes, although the estimated coefficients should be interpreted as conditional associations rather than definitive causal effects.
All specifications (–) are estimated using the TWFE structure defined above and are interpreted as conditional within-firm associations rather than causal effects.
Table 2 presents the structural specifications of the estimated models. Model 0 () serves as the baseline linear regression, utilizing the latent ESG variable derived from the individual pillar scores. Models 1 through 3 (–) introduce nonlinear functional forms by incorporating the quadratic term of the latent ESG construct. Whereas the linear framework imposes a constant marginal association between ESG performance and financial outcomes, the quadratic specifications allow the association to vary across the level of ESG performance and can accommodate convex or concave patterns. Model 2 additionally incorporates financial risk, while Model 3 incorporates the ESG controversy measure. Model 4 uses the aggregate ESG score and its squared term as an alternative nonlinear specification, whereas Model 5 enters the ESG pillar scores separately without quadratic terms. The presence of quadratic terms permits nonlinear patterns but does not, by itself, constitute a formal statistical test of a U-shaped relationship.
Table 2.
Regression models and estimating equations.
3.2.5. Model Selection and Optimization Framework
The empirical framework applies a two-stage model-selection and optimization strategy. The first stage determines the preferred econometric specification among the candidate TWFE models, whereas the second stage optimizes the hyperparameters of the supplementary machine-learning models. This separation is intentional because the econometric models are designed for interpretable conditional inference, while the machine-learning models are designed primarily for predictive performance.
Econometric Specification Selection
The econometric analysis evaluates the six theoretically motivated specifications – defined above, which vary systematically in ESG representation, functional form, and control structure.
For each financial-performance outcome, all candidate specifications are estimated using the same TWFE structure with firm and year fixed effects and one-period-lagged explanatory variables. The preferred specification is selected primarily by minimizing the in-sample root mean squared error (RMSE), while adjusted within- is used as a secondary criterion when competing specifications produce similar RMSE values. Formally, the preferred econometric model for outcome Y is defined as
where denotes the preferred specification for outcome Y, and denotes candidate specification j, . When competing specifications yield approximately equivalent RMSE values, adjusted within- is used as a secondary comparison criterion.
This selection procedure identifies the specification that provides the strongest empirical fit within the predefined theoretical model set; it does not constitute unrestricted data-driven model search. The candidate specifications are determined ex ante from the conceptual framework and differ only in economically interpretable representations of ESG performance and control structure.
Model fit is interpreted jointly with the residual diagnostics and covariance-robust inference described above. Fit statistics guide specification selection but are not treated as evidence of statistical significance or causal validity.
Machine-Learning Hyperparameter Optimization
Hyperparameter optimization is repeated separately for each – predictor specification, each financial-performance outcome (ROA and ROE), and each algorithm. Within a given specification, Elastic Net, Random Forest, and XGBoost receive the same lagged predictor set as the corresponding TWFE model, while all tuning is conducted exclusively on the training sample. The chronological holdout design is described in Section 3.2.6.
For Elastic Net, the coefficient vector is estimated by minimizing
where n is the number of training observations, is the observed outcome, is the intercept, is the predictor vector, and is the corresponding coefficient vector; the prime denotes transposition. The terms and denote the and norms, respectively. The parameter determines the balance between the LASSO and ridge penalties, while controls the overall degree of regularization. The optimal configuration is selected by minimizing five-fold cross-validation (CV) RMSE:
For Random Forest, candidate values are drawn from , where denotes the number of predictors randomly considered at each split, subject to this value not exceeding the number of available predictors in the relevant – specification. The minimum terminal-node size, denoted by , is evaluated over using out-of-bag (OOB) prediction error. Each candidate configuration contains 500 trees. The optimal configuration is
For XGBoost, maximum tree depth and learning rate are evaluated using five-fold cross-validation. The subsampling ratio is fixed at 0.8, the column sampling ratio is fixed at 1.0, and boosting is permitted for a maximum of 300 rounds with early stopping after 20 rounds without improvement. The optimal XGBoost configuration is defined as
where denotes the selected number of boosting rounds associated with the minimum cross-validation RMSE.
Optimization is conducted independently for every – specification and for both ROA and ROE. This two-stage framework separates econometric specification selection from predictive hyperparameter optimization while preserving direct comparability between the econometric and predictive specifications; final holdout evaluation is described next.
3.2.6. Predictive Robustness Checks
The predictive robustness analysis complements TWFE inference by evaluating out-of-sample financial-performance prediction under regularized linear and flexible nonlinear architectures. It is therefore used for predictive assessment rather than coefficient-level inference.
Three algorithms are employed: Elastic Net, Random Forest, and Extreme Gradient Boosting (XGBoost). Elastic Net serves as the regularized linear benchmark, while Random Forest and XGBoost provide flexible tree-based alternatives capable of capturing nonlinearities and higher-order interactions. Comparing these architectures establishes whether additional functional flexibility improves predictive performance relative to a regularized linear specification.
The primary predictive robustness exercise is specification-aligned. For each M0–M5 specification, Elastic Net, Random Forest, and XGBoost are estimated using the same lagged predictors defined by the corresponding econometric model. Holding the information set constant within each specification permits direct comparison of algorithmic flexibility while also showing whether predictive performance changes across ESG measurement and control structures. A separate broader full-information machine-learning benchmark is retained only for exploratory variable-importance and partial-dependence diagnostics and is not used to select among M0–M5.
The predictive evaluation follows a chronological design. Observations with outcome years 2020–2022 form the training sample, while 2019 observations are used only to construct one-period-lagged predictors for 2020; observations from 2023 constitute the final holdout sample. Model selection and hyperparameter optimization are conducted exclusively within the training period according to the procedures described in Section 3.2.5. The 2023 observations therefore remain outside the optimization process and are used only for final out-of-sample evaluation. After applying the lagged predictor structure and complete-case requirement, the ROA analysis contains 559 training and 187 holdout observations, while the ROE analysis contains 554 training and 186 holdout observations.
The winsorization thresholds, standardization parameters, and PCA loadings used to construct the common TWFE/ML variables are estimated from the full analytical panel before the chronological split. Accordingly, although 2023 outcomes are excluded from model fitting and tuning, the holdout-period distribution can contribute to the transformations used to construct the predictors. The resulting machine-learning metrics are therefore interpreted as supplementary predictive evidence rather than as a fully independent external validation exercise.
Predictive performance is assessed using root mean squared error (RMSE), mean absolute error (MAE), and out-of-sample , with RMSE serving as the primary ranking criterion. Lower RMSE and MAE and higher indicate stronger out-of-sample performance. Performance is compared both across algorithms within each M0–M5 specification and across the six predictor specifications. A lower RMSE for Random Forest or XGBoost indicates additional nonlinear predictive value within a fixed information set, whereas stronger Elastic Net performance indicates that additional functional flexibility does not improve holdout accuracy for that specification.
The predictive results are interpreted separately from econometric inference. Improved machine-learning performance does not establish causality or confirm the exact quadratic specification estimated by TWFE. Observed-versus-predicted plots and partial dependence profiles are therefore used as predictive diagnostics. In particular, the partial dependence profiles visualize the fitted response of financial performance to lagged Latent ESG while averaging over the remaining predictors and are not treated as formal tests of a U-shaped relationship.
3.2.7. Integrated Analytical Framework
Taken together, the framework combines TWFE inference, alternative ESG specifications, residual-robust covariance estimation, and specification-aligned out-of-sample machine-learning prediction across M0–M5. It therefore evaluates not only whether ESG is associated with financial performance but also whether the conclusion is robust to measurement choice, functional form, dependence structure, and predictive architecture. Sector-specific estimations provide supplementary evidence on potential differences across structurally distinct industries while remaining exploratory given the limited sector-level sample size and short time dimension.
4. Results
4.1. Descriptive Data
Table 3 presents the descriptive statistics for the variables utilized in this study. The financial performance metrics exhibit substantial dispersion before Winsorization; accordingly, Winsorized ROA and ROE are used in the panel estimations to reduce the influence of extreme observations. Winsorized ROA ranges from −0.1056 to 0.2801 with an S.D. of 0.0571, while Winsorized ROE ranges from −0.2600 to 0.5043 with an S.D. of 0.1100. For the sustainability predictors after imputation, the aggregate ESG score ranges from 0.1250 to 0.9583 (Mean = 0.6202, S.D. = 0.1686). The Environmental, Social, and Governance pillar scores remain on their original 0–100 scale, with observed means of 63.6734, 66.4176, and 59.0910, respectively. These sustainability-predictor descriptive statistics are reported after the hierarchical imputation procedure, whereas LatentESG, FirmScale, and FinancialRisk are PCA-derived constructs based on the completed predictor set. LatentESG ranges from −4.3868 to 2.9522 with an S.D. of 1.3871.
Table 3.
Descriptive statistics.
Additionally, Table 3 reports the distributional properties of the variables. Most variables exhibit skewness values between −1 and 1, while Winsorized ROA is positively skewed, and both Latent Firm Scale and the ESG controversy score are negatively skewed. Several variables also exhibit substantial kurtosis, and the Jarque–Bera test rejects normality for all reported variables. The unit-root column reports a mixture of level-stationary and first-difference-stationary classifications; therefore, the table does not support the statement that every variable is stationary at levels. Given the short five-year dimension, these classifications should be interpreted cautiously and are reported as descriptive diagnostics rather than as evidence of long-run time-series properties.
Notably, while the individual Environmental, Social, and Governance pillar series are classified as I(1), the PCA-derived LatentESG construct is classified as I(0).
Beyond the distributional properties of individual variables, this study also examines the relationships and potential multicollinearity among the independent variables using a correlation matrix. As illustrated in Figure 3, the heatmap presents Pearson correlation coefficients ranging from −1 to 1. The strong correlation between Latent ESG and its squared term is expected in a quadratic specification. This correlation does not by itself invalidate the model, although it may increase coefficient uncertainty when the linear and quadratic terms are interpreted separately.
Figure 3.
Correlation heat map.
4.2. Latent-Variable Construction
Table 4 reports the PCA results for ESG, firm size, and financial risk. PC1 is retained for each construct using the Kaiser (1974) eigenvalue criterion and the scree plots in Figure A1, Figure A2 and Figure A3. The corresponding eigenvalues are 1.9240, 1.9021, and 1.2753, explaining 64.13%, 63.40%, and 63.77% of the variance, respectively. PC1 therefore provides a parsimonious dimensionality-reduction choice for the short panel while not implying that the remaining components contain no relevant information.
Table 4.
Principal-component measurement of latent constructs.
4.3. ESG Performance Specification
This section presents the descriptive characteristics and diagnostic tests of the panel dataset.
Table 5 shows that the Pesaran CD test rejects cross-sectional independence across all estimated models (p < 0.001). The CD statistics range from 26.16 to 33.15 for ROA and from 12.20 to 15.42 for ROE. These results motivate the use of covariance estimators that account for dependence; however, Driscoll–Kraay and two-way clustered inference are interpreted cautiously because the panel contains only five annual periods.
Table 5.
Cross-sectional dependence test (CD Test).
In addition to checking for cross-sectional dependence, this study examines potential multicollinearity among the independent variables using a correlation matrix. As illustrated in Figure 3, the heatmap presents Pearson correlation coefficients ranging from −1 to 1. The strong correlation between Latent ESG and its squared term is expected in a quadratic specification. This correlation does not by itself invalidate the model, although it may increase coefficient uncertainty when the linear and quadratic terms are interpreted separately.
Table 6 presents the Breusch–Godfrey LM test results for serial correlation in the residuals of the estimated fixed-effects models. The BG statistics range from 94.88 to 102.73 for the ROA specifications and from 105.20 to 109.02 for the ROE specifications. All reported p-values are below 0.001, providing strong evidence against the null hypothesis of no serial correlation across all reported model specifications.
Table 6.
Breusch–Godfrey LM test for serial correlation in panel data.
Together with the evidence of cross-sectional dependence reported in Table 5, the presence of residual dependence—particularly in the preferred model specifications—indicates that conventional standard errors may not provide a reliable inference. Accordingly, the study reports firm-clustered standard errors as the baseline inference for the large-N, short-T panel and additionally reports Driscoll–Kraay and two-way clustered covariance estimators as sensitivity checks. The latter estimators are interpreted cautiously because the panel contains only five annual periods.
4.4. Latent ESG, Nonlinear Effects, and Control Factors
Because the main objective concerns the functional form of the ESG–financial performance association, Table 7 reports coefficient estimates together with 95% confidence intervals under firm-clustered, Driscoll–Kraay, and two-way clustered covariance estimators. The coefficient point estimates are identical across the three covariance specifications because the underlying TWFE coefficient estimates remain unchanged; only the estimated covariance matrix and therefore the associated uncertainty measures differ. Firm-clustered inference is treated as the baseline for this large-N, short-T panel, while Driscoll–Kraay and two-way clustered intervals are reported as sensitivity checks. The latter are interpreted cautiously because the panel contains only five annual periods.
Table 7.
Panel data regression results (fixed effects with cluster-robust inference).
For substantive coefficient evidence, Table 7 reports the minimum Bayes factor (MBF01) rather than relying on conventional coefficient-level p-values as the primary evidential measure. Following Goodman (1999), the MBF01 is calculated from the exact firm-clustered coefficient estimate and its corresponding cluster-robust standard error. Specifically, the standardized statistic is obtained as , and the calibrated minimum Bayes factor is computed as . Smaller MBF01 values indicate stronger evidence against the point null hypothesis relative to the best-supported point alternative, whereas values approaching one indicate weak discrimination between the null and the alternative. The MBF01 is interpreted jointly with the coefficient magnitude, confidence-interval width, and consistency of uncertainty estimates across covariance estimators; it should not be interpreted as a posterior probability or as a measure of economic significance.
Table 8 reports the in-sample RMSE ranking and model-fit statistics for all panel specifications. The adjusted within summarizes explanatory power after accounting for the fixed-effects transformation, whereas the Pesaran CD statistic reports the extent of cross-sectional dependence in the model residuals. Serial correlation is assessed separately using the Breusch–Godfrey LM test reported in Table 6. The differences in in-sample RMSE across several specifications are relatively small and are therefore interpreted as descriptive model-fit comparisons rather than as formal statistical evidence of nonlinearity.
Table 8.
Ranking of panel models.
Table 9 identifies M2 as the preferred ROA specification (RMSE = 0.0238; adjusted within = 0.8286) and M3 as the preferred ROE specification (RMSE = 0.0583; adjusted within = 0.7216). The lower within explanatory power for ROE may partly reflect greater sensitivity to leverage and capital-structure changes, although this mechanism is not directly tested. Both preferred specifications continue to reject cross-sectional independence, consistent with the covariance-robust inference reported above.
Table 9.
Preferred panel specifications.
4.5. Industry Heterogeneity Analysis
The aggregate analysis does not account for the possibility that the ESG–financial performance association varies across industries with different regulatory exposure, operational structures, and ESG-related cost burdens. This section therefore estimates the panel specifications separately for Energy and Utilities, Financial Services and Banking, and Technology and Telecommunications to examine sector-specific empirical patterns. The sector-specific estimates are used to assess whether the direction and functional form of the ESG–financial performance association appear heterogeneous across industries; however, differences across separately estimated sector models should not be interpreted as formal evidence of statistically significant cross-sector coefficient differences in the absence of pooled interaction or coefficient-equality tests.
Table 10 presents the comparative in-sample fit of the panel specifications across the three industries. RMSE measures the average magnitude of prediction errors within the fitted sample, with lower values indicating better in-sample fit. The within summarizes the proportion of within-firm outcome variation accounted for by the included regressors after the fixed-effects transformation; it should therefore not be attributed to ESG variables alone. Regarding ROA, M2 yields the lowest RMSE across all three industries, while differences in the accompanying within and adjusted statistics are small. For ROE, M3 yields the lowest or tied-lowest RMSE across the three industries. Accordingly, M2 and M3 are retained as the preferred sector-specific specifications for ROA and ROE, respectively.
Table 10.
Comparison of panel model fit across industries.
Table 11 summarizes the specifications with the strongest reported in-sample fit for each industry based on RMSE and adjusted within . Models 2 and 3 are selected across the sector–outcome combinations, indicating that specifications containing a quadratic Latent ESG term provide the strongest in-sample fit among the candidate models considered. This pattern is consistent with the possibility of nonlinear ESG–financial performance associations across industries; however, model-fit rankings alone do not constitute a formal statistical test of nonlinearity or of a U-shaped relationship.
Table 11.
The best-fitting models by industry.
Table 12 reports the sector-specific fixed-effects estimates for the best-fitting models identified in Table 11. Given the limited number of observations within each industry subsample, these estimates are interpreted primarily as exploratory directional evidence.
Table 12.
Sector-specific fixed-effects estimates for the ESG–financial performance relationship.
Across all six sector–outcome combinations, the Latent ESG point estimates display a negative or near-zero linear term together with a positive quadratic term. This recurring sign configuration is directionally consistent with convexity, but the confidence intervals for the ESG terms include zero in every sector-specific preferred model, excluding the linear term in Technology and Telecommunications for ROE, which exhibits a strictly negative interval of −0.0692 to −0.0034. The pattern is therefore not treated as formal evidence of a U-shaped relationship or of statistically significant cross-sector differences.
The control variables reveal additional sector heterogeneity. Financial risk is negatively associated with ROA in Financial Services and Banking, with its 95% confidence interval excluding zero. Firm scale is also positively associated with ROE in Financial Services and Banking. These contrasting signs reinforce the importance of interpreting financial controls within sector-specific operating and capital-structure contexts.
Overall, the sector analysis should be viewed as exploratory evidence of industry heterogeneity. A larger sector-level sample and a longer panel would permit more precise estimation and formal cross-sector comparisons and would help determine whether the directional patterns identified here persist in future research.
Cross-sector inference is based on the sector-specific estimations reported in Table 12 rather than on a pooled interaction specification. The two approaches impose different parameterizations, and formal coefficient-equality tests are especially sensitive in a five-year panel with uneven country–sector cell sizes. Accordingly, H2 is evaluated as exploratory evidence of sectoral heterogeneity, with emphasis on the direction, magnitude, and confidence intervals of the sector-specific estimates rather than on a formal cross-sector equality test.
4.6. Robustness
Levene’s test provides an additional check of country-level residual variance heterogeneity.
Table 13 presents the results of Levene’s test for groupwise heteroskedasticity at the country level across the estimated models. A p-value below 0.05 indicates the rejection of the null hypothesis of equal variances across country groups. As reported, all specifications for both ROA and ROE reject the null hypothesis at the 1% significance level (), providing robust evidence of country-level variance heterogeneity. These findings confirm that the residual variances differ significantly across countries depending on the outcomes and model specifications. However, while the test successfully detects these variance disparities, it does not identify the underlying economic or institutional mechanisms driving them.
Table 13.
Levene’s test for groupwise heteroskedasticity (Country-Level).
The specification-aligned tuned machine-learning models provide the supplementary out-of-sample predictive comparison across M0–M5.
Table 14 presents the specification-aligned holdout performance of the tuned machine-learning algorithms on the 2023 holdout set. To clearly identify the most accurate predictive model, the lowest RMSE for each specification is highlighted in bold. The bolded values identify the lowest holdout RMSE within each specification, with selection based on the unrounded values. The preferred algorithm differs across outcomes and specifications. For ROA, XGBoost under M2 provides the strongest overall performance, recording the lowest RMSE (0.0481) and the highest (0.2435) among all ROA models; XGBoost also yields the lowest RMSE under M3, M4, and M5, whereas Elastic Net performs best under M0 and M1. For ROE, Random Forest under M2 provides the strongest overall performance, with an RMSE of 0.1004 and an of 0.1675. Elastic Net yields the lowest RMSE for ROE under M0, M1, and M4; XGBoost performs best under M3; whereas Random Forest also yields the lowest RMSE under M5. The predictive evidence therefore supports the value of comparing regularized linear and selectively nonlinear approaches rather than assuming uniform superiority of a single machine-learning algorithm.
Table 14.
Specification-aligned tuned machine-learning performance by M0–M5 on the 2023 holdout set.
Furthermore, Figure A4 presents exploratory partial dependence profiles generated from the broader full-information tuned Random Forest benchmark for ROA and ROE. For both outcomes, the fitted response declines over lower values of lagged Latent ESG and rises again at higher values, although local fluctuations remain. The resulting shape is broadly compatible with nonlinearity and a U-shaped trajectory. Partial dependence nevertheless describes the fitted predictive model and does not establish a causal effect, identify a formal turning point, or validate the quadratic TWFE specification. The interpretation involving early adjustment costs and later benefits is therefore presented as a theory-consistent explanation rather than as a directly tested mechanism.
5. Discussion
The empirical findings provide evidence consistent with a nonlinear association between corporate ESG performance and financial outcomes. Notably, the Latent ESG specifications report slightly stronger in-sample fit for ROA than several alternative specifications, suggesting that a latent representation of ESG combined with relevant firm-level controls may capture financial-performance variation more effectively than simpler ESG representations. Furthermore, ROE exhibits sensitivity to firm scale and financial risk in selected specifications.
As presented in Table 7 and Table 9, the reported coefficient pattern combines a negative linear Latent ESG term with a positive quadratic term in several specifications. This sign pattern is consistent with convexity, but a formal U-shape conclusion additionally requires evidence that the turning point lies within the observed data range and that the slopes at the lower and upper bounds have the required signs. Given the five-year time dimension and limited within-firm temporal variation, such turning-point and endpoint-slope inference would have limited precision. The analysis therefore emphasizes the coefficient pattern and the reported 95% confidence intervals under alternative covariance estimators rather than treating a formal U-shape test as decisive. Accordingly, the results are described as a convex pattern that may be compatible with a U-shaped association rather than as evidence confirming a U-shape.
Further inspection of the specifications in Table 7 indicates that Model 2 provides the most representative fit for the ROA outcome, while Model 3 is the preferred estimator for ROE. Applying the minimum Bayes factor (MBF01) as a calibrated evidentiary measure, the coefficient estimates for firm scale display consistently small MBF01 values across specifications, indicating relatively strong evidence against the null hypothesis of no association. Financial risk also exhibits a relatively small MBF01 value in the ROA specifications. In contrast, the Latent ESG terms in the preferred specifications display larger MBF01 values, indicating weaker individual evidentiary support against the null than that observed for firm-level financial characteristics. Nevertheless, because the MBF01 is calibrated per coefficient and does not itself constitute a joint or multiple-hypothesis test, these values should be interpreted as an additional evidentiary lens rather than as a definitive statement that the ESG association is absent. Considered jointly with the consistent negative-linear/positive-quadratic sign pattern across specifications and covariance estimators, the results are best described as offering suggestive but individually weaker evidence for a nonlinear Latent ESG association, alongside stronger and more consistent evidence for the role of firm-level financial characteristics.
From a theoretical perspective, this nonlinear pattern offers one possible way to reconcile the long-standing debate among competing organizational theories. In accordance with Stakeholder Theory, initial ESG investments may require firms to allocate substantial capital toward internal and external stakeholder engagement—such as labor safety compliance, community relations, and environmental disclosures—generating upfront restructuring and compliance costs that may temporarily depress financial performance. As firms mature in their ESG implementation, however, these continuing engagements may foster strategic relational capital, trust, and organizational reputation among investors and consumers.
Institutional Theory and Legitimacy Theory provide complementary explanations for a possible upward inflection in the fitted relationship. In early stages, firms may face coercive and mimetic institutional pressures to adopt ESG standards, treating compliance primarily as a necessary operational requirement for maintaining their social “license to operate.” As ESG strategies become more deeply embedded in core operations, firms may move beyond symbolic compliance toward more substantive institutional legitimacy, potentially reducing regulatory risk, strengthening stakeholder relationships, and improving operating efficiency.
When the sample is disaggregated by industry (Table 12), the preferred sector-specific specifications display a recurring negative-linear/positive-quadratic Latent ESG sign pattern across both profitability outcomes. The pattern is therefore directionally consistent with convexity across the three sectors. However, the ESG confidence intervals include zero in all sector-specific preferred models except for the linear Latent ESG term in Technology and Telecommunications for ROE, whose confidence interval excludes zero. These results are consequently treated as exploratory patterns rather than as formal evidence of U-shaped relationships or statistically significant coefficient differences across industries.
Furthermore, the role of specific control variables and risk factors exhibits distinct sector-specific dynamics. Under the M2 specification for ROA, financial risk demonstrates a statistically significant negative association exclusively within the Financial Services and Banking sector. Conversely, under the M3 specification for ROE, firm scale serves as a significant positive driver of shareholder returns for the same financial sector. Although ESG controversy shows positive directional estimates across all sectors for ROE, its impact remains statistically insignificant.
More broadly, the Energy and Utilities sector provides comparatively weak coefficient-level evidence despite the use of nonlinear specifications. This outcome aligns with the cross-sectoral variation identified by Tutar et al. (2025) and suggests that substantial capital requirements, environmental compliance costs, and heterogeneous market conditions across Asian economies may weaken the uniformity of the ESG–financial performance relationship. Additionally, the weak convex pattern observed in the Financial Services and Banking sector differs from the concavity–convexity patterns reported by El Khoury et al. (2023) for banks in the MENAT region, thereby underscoring the critical influence of institutional and regional contexts. This lack of strong statistical significance across the profitability outcomes is not entirely anomalous when integrated with recent critical literature. For instance, Gutiérrez-Ponce and Wibowo (2023) examined the Indonesian banking sector and similarly found that sustainability activities did not immediately translate into significant financial performance improvements. Their findings corroborate our observation of a weak initial trend within the Financial Services and Banking sector, strongly supporting the interpretation that early ESG engagement involves substantial upfront compliance costs that temporarily delay recognizable financial benefits. Furthermore, the absence of a strictly significant relationship in our short panel broadly aligns with the conclusions of Tran Bui (2023), who also documented insignificant ESG impacts on corporate financial performance. However, when comparing these weak directional findings with the broader literature, careful conceptual distinctions regarding the choice of financial indicators must be drawn. While studies such as Meher et al. (2020) also report insignificant ESG effects, their analysis specifically focuses on market-based investment returns and stock price volatility rather than accounting-based metrics like ROA and ROE. Therefore, while Meher et al. (2020) provides conceptual support for the notion that ESG does not guarantee immediate financial gains, their findings operate through market valuation channels rather than the direct operational efficiency and shareholder equity returns examined in this study.
These observed sector-specific patterns can be interpreted through the combined lens of the RBV theory and the cost–benefit trade-off perspective. For capital-intensive and resource-dependent sectors such as Energy and Utilities, initial sustainability efforts may require substantial CAPEX outlays, while market and supply-side constraints can delay the realization of financial benefits. Conversely, for Financial Services, ESG adoption may enhance institutional reputation and mitigate climate-related credit risks, while higher levels of ESG-related expenditure may eventually generate diminishing marginal returns because of administrative overheads and greenwashing scrutiny.
To provide a supplementary predictive comparison, the tuned machine-learning analysis was repeated within each M0–M5 predictor specification and evaluated on the chronological 2023 holdout sample. M2 delivers the strongest holdout performance for both outcomes: XGBoost is the best-performing M2 algorithm for ROA, while Random Forest is the best-performing M2 algorithm for ROE. M5 also performs relatively well. Elastic Net nevertheless remains the strongest algorithm in several simpler specifications, showing that nonlinear tree-based methods do not uniformly dominate once the information set is held constant. The broader full-information Random Forest partial-dependence analysis in Figure A4 indicates nonlinear trajectories broadly consistent with the convex pattern observed in the econometric specifications; this visual correspondence remains exploratory rather than a formal confirmation of a U-shaped relationship.
In comparison with prior empirical literature, the results provide additional insights into the measurement of ESG performance. As demonstrated in Table 9, models based on separate ESG pillar scores provide less cohesive evidence regarding their joint relationship with financial performance. In contrast, the PCA-constructed Latent ESG measure provides a parsimonious representation of the common variation across ESG pillars and produces coefficient patterns consistent with nonlinearity in several specifications (e.g., Herman et al., 2025; Pu, 2023). Furthermore, the strongest specification-aligned predictive results for M2 and M5 are frequently obtained from tree-based models, which is broadly consistent with the growing use of machine-learning approaches in ESG-related prediction and financial-performance analysis (e.g., Chaouech, 2025; De Lucia et al., 2020; Sultana & Zeya, 2025; Xiao et al., 2026). Elastic Net remains competitive or superior in several simpler specifications, however, indicating that nonlinear flexibility is useful selectively rather than universally. These results do not establish that linear models generally obscure the true economic payoff of corporate sustainability.
The divergence in variable significance between aggregate and sector-specific models provides a theoretical contribution by highlighting the potential limitations of aggregation in conventional ESG research. A pooled or aggregate framework may implicitly treat structural relationships across heterogeneous industries as relatively homogeneous, even though sectors face different regulatory pressures, operational structures, capital requirements, and ESG-related cost burdens. Consequently, the marginal costs and marginal benefits associated with ESG implementation may differ across industries. By unpacking these sector-level patterns, the findings indicate that broad, unsegmented ESG evaluations may obscure meaningful industry-specific relationships. Subject to the absence of formal cross-sector coefficient tests, the results therefore support considering industry-tailored ESG strategies that reflect different structural, financial, and regulatory conditions.
Building on this sector-level divergence, the choice of financial indicators further illustrates distinct ESG transmission channels. In Model 2, ROA is evaluated conditional on financial risk, which captures balance-sheet conditions related to liabilities and long-term debt. This specification therefore separates the ESG–ROA association from variation associated with financial risk. Conversely, Model 3 aligns with ROE by incorporating ESG controversy as an additional control, although its coefficient is not statistically distinguishable from zero in the preferred aggregate specification. ESG controversies nevertheless remain a theoretically relevant channel through which investor confidence may affect equity-based profitability, but this mechanism is not directly established by the coefficient estimate. These findings highlight that ESG impacts manifest differently depending on whether performance is assessed through asset-based efficiency or equity-driven outcomes.
6. Conclusions
This study examined the association between ESG performance and corporate financial performance, paying particular attention to the direction and functional form of the relationship. Using a latent-variable approach, the analysis compared linear and nonlinear fixed-effects specifications to assess whether the ESG–financial performance relationship exhibits systematic curvature. The nonlinear findings were supplemented, rather than validated, by predictive comparisons using Elastic Net, Random Forest, and XGBoost.
The empirical results indicate that nonlinear Latent ESG specifications provide the strongest preferred in-sample fit for both ROA and ROE among the principal candidate models. In the preferred aggregate TWFE specifications, the Latent ESG linear term is negative and the quadratic term is positive for both ROA and ROE. This sign pattern is consistent with convexity but does not by itself confirm a U-shape over the observed range. Financial risk is also negatively associated with ROA in the preferred aggregate specification under the baseline firm-clustered inference. As a supplementary predictive check, the specification-aligned M0–M5 machine-learning analysis identifies M2 as the strongest holdout specification for both outcomes, with XGBoost performing best for ROA and Random Forest for ROE. Tree-based models also perform strongly under M5, while Elastic Net remains preferable in several simpler specifications; the predictive evidence therefore supports selective nonlinear flexibility rather than uniform dominance of nonlinear algorithms.
The weak and unstable coefficient-level evidence may partly reflect noise in ESG scores. In emerging Asian markets, rapid growth in disclosure has been driven largely by external institutional pressure rather than voluntary commitment Kercher et al. (2026), and disclosure quality may exceed underlying ESG performance FTSE Russell (2025). If scores partly capture disclosure rather than substantive practice, their association with accounting profitability would be attenuated and may differ across countries with different enforcement regimes. This interpretation is speculative, as the present study does not measure greenwashing directly.
Based on these empirical findings, this study offers three policy implications that should be interpreted conditionally rather than causally. First, if the observed convex pattern partly reflects initial ESG implementation costs that temporarily outweigh financial benefits, policymakers could consider targeted support mechanisms, such as tax incentives or transition assistance, to reduce early-stage adjustment burdens while preserving appropriate sustainability standards. Second, corporate executives and boards should manage sustainability investment and disclosure jointly, balancing the communication of long-term ESG commitments with active management of controversies and implementation costs. Finally, the sector-specific sensitivity to financial controls—particularly the significant negative association between financial risk and ROA within the Financial Services and Banking sector—suggests that regulators should avoid assuming a uniform leverage-profitability relationship across industries. Any monitoring or policy response should therefore remain proportionate to sector-specific balance-sheet structures and risk exposures.
Despite these empirical insights, this study is subject to constraints regarding its relatively short five-year time-series dimension, which limits the degrees of freedom and the precision of higher-order nonlinear inference. Accordingly, the study does not rely on a formal U-shape test; instead, it reports the nonlinear coefficient pattern together with 95% confidence intervals under alternative covariance estimators and interprets the resulting curvature cautiously.
Furthermore, the purposive selection of 188 listed firms across three specific industries in seven Asian markets may introduce sample selection limitations, as the included firms may not fully represent the broader population of listed companies in these countries. In addition, differences in country-level institutional environments and the uneven distribution of firms across country–industry groups may limit the extent to which the findings can be generalized to other Asian markets, industries, or firm populations. Accordingly, the empirical results should be interpreted within the specific sample and institutional context examined in this study rather than as representative evidence for all emerging Asian economies.
A limitation of the predictive analysis is that, although 2023 is reserved as the chronological holdout for final model evaluation, the common winsorization, standardization, and PCA transformations are estimated from the full panel before the split, and the internal five-fold tuning procedure is not explicitly blocked by time or grouped by firm. The reported predictive performance should therefore be interpreted as supplementary evidence. Future research should estimate all preprocessing transformations within each training split and employ time-aware or firm-grouped validation using panels with larger cross-sectional and temporal dimensions.
Beyond extending panel datasets, future research could examine moderators such as regulatory stringency, ownership structure, or institutional quality, together with additional ESG and financial indicators, to clarify when ESG effects differ across firms and markets. A further extension is to connect these firm-level dynamics to portfolio allocation: transition costs and capability-building may provide a micro-level basis for how investors price ESG-related uncertainty and nonlinear ESG penalties in sustainable portfolio choice (Müller & Joubrel, 2025; Müller, 2025, 2026). Such work could examine whether firm-level nonlinearities translate into portfolio-level robustness or diversification effects.
Author Contributions
Conceptualization, P.K., K.P., N.H., and W.S.; methodology, P.K. and W.S.; software, P.K. and W.S.; validation, P.K., K.P., N.H., and W.S.; formal analysis, P.K.; investigation, P.K., K.P., N.H., and W.S.; resources, P.K.; data curation, P.K. and W.S.; writing—original draft preparation, P.K. and W.S.; writing—review and editing, P.K., K.P., N.H., and W.S.; visualization, P.K.; supervision, P.K. and W.S.; project administration, P.K. and W.S.; funding acquisition, W.S. All authors have read and agreed to the published version of the manuscript.
Funding
Research was partially supported by the Faculty of Economics, Chiang Mai University, and Chiang Mai University.
Institutional Review Board Statement
Not applicable.
Informed Consent Statement
Not applicable.
Data Availability Statement
The data supporting the findings of this study were obtained from the secondary data sources described in the manuscript, principally LSEG/Refinitiv Eikon, with financial data supplemented by Yahoo Finance. The data are available from the respective original sources, subject to their applicable access and licensing conditions. No new primary data were collected or generated by the authors.
Acknowledgments
The authors would like to thank the Faculty of Economics, Chiang Mai University, and Chiang Mai University for their support. The first author is from the Faculty of Economics, Chiang Mai University, under the CMU Presidential Scholarship.
Conflicts of Interest
The authors declare no conflicts of interest.
Appendix A
Table A1.
Firm Identifiers and Company Names Included in the Empirical Sample.
Figure A1.
PCA scree plot for financial risk.
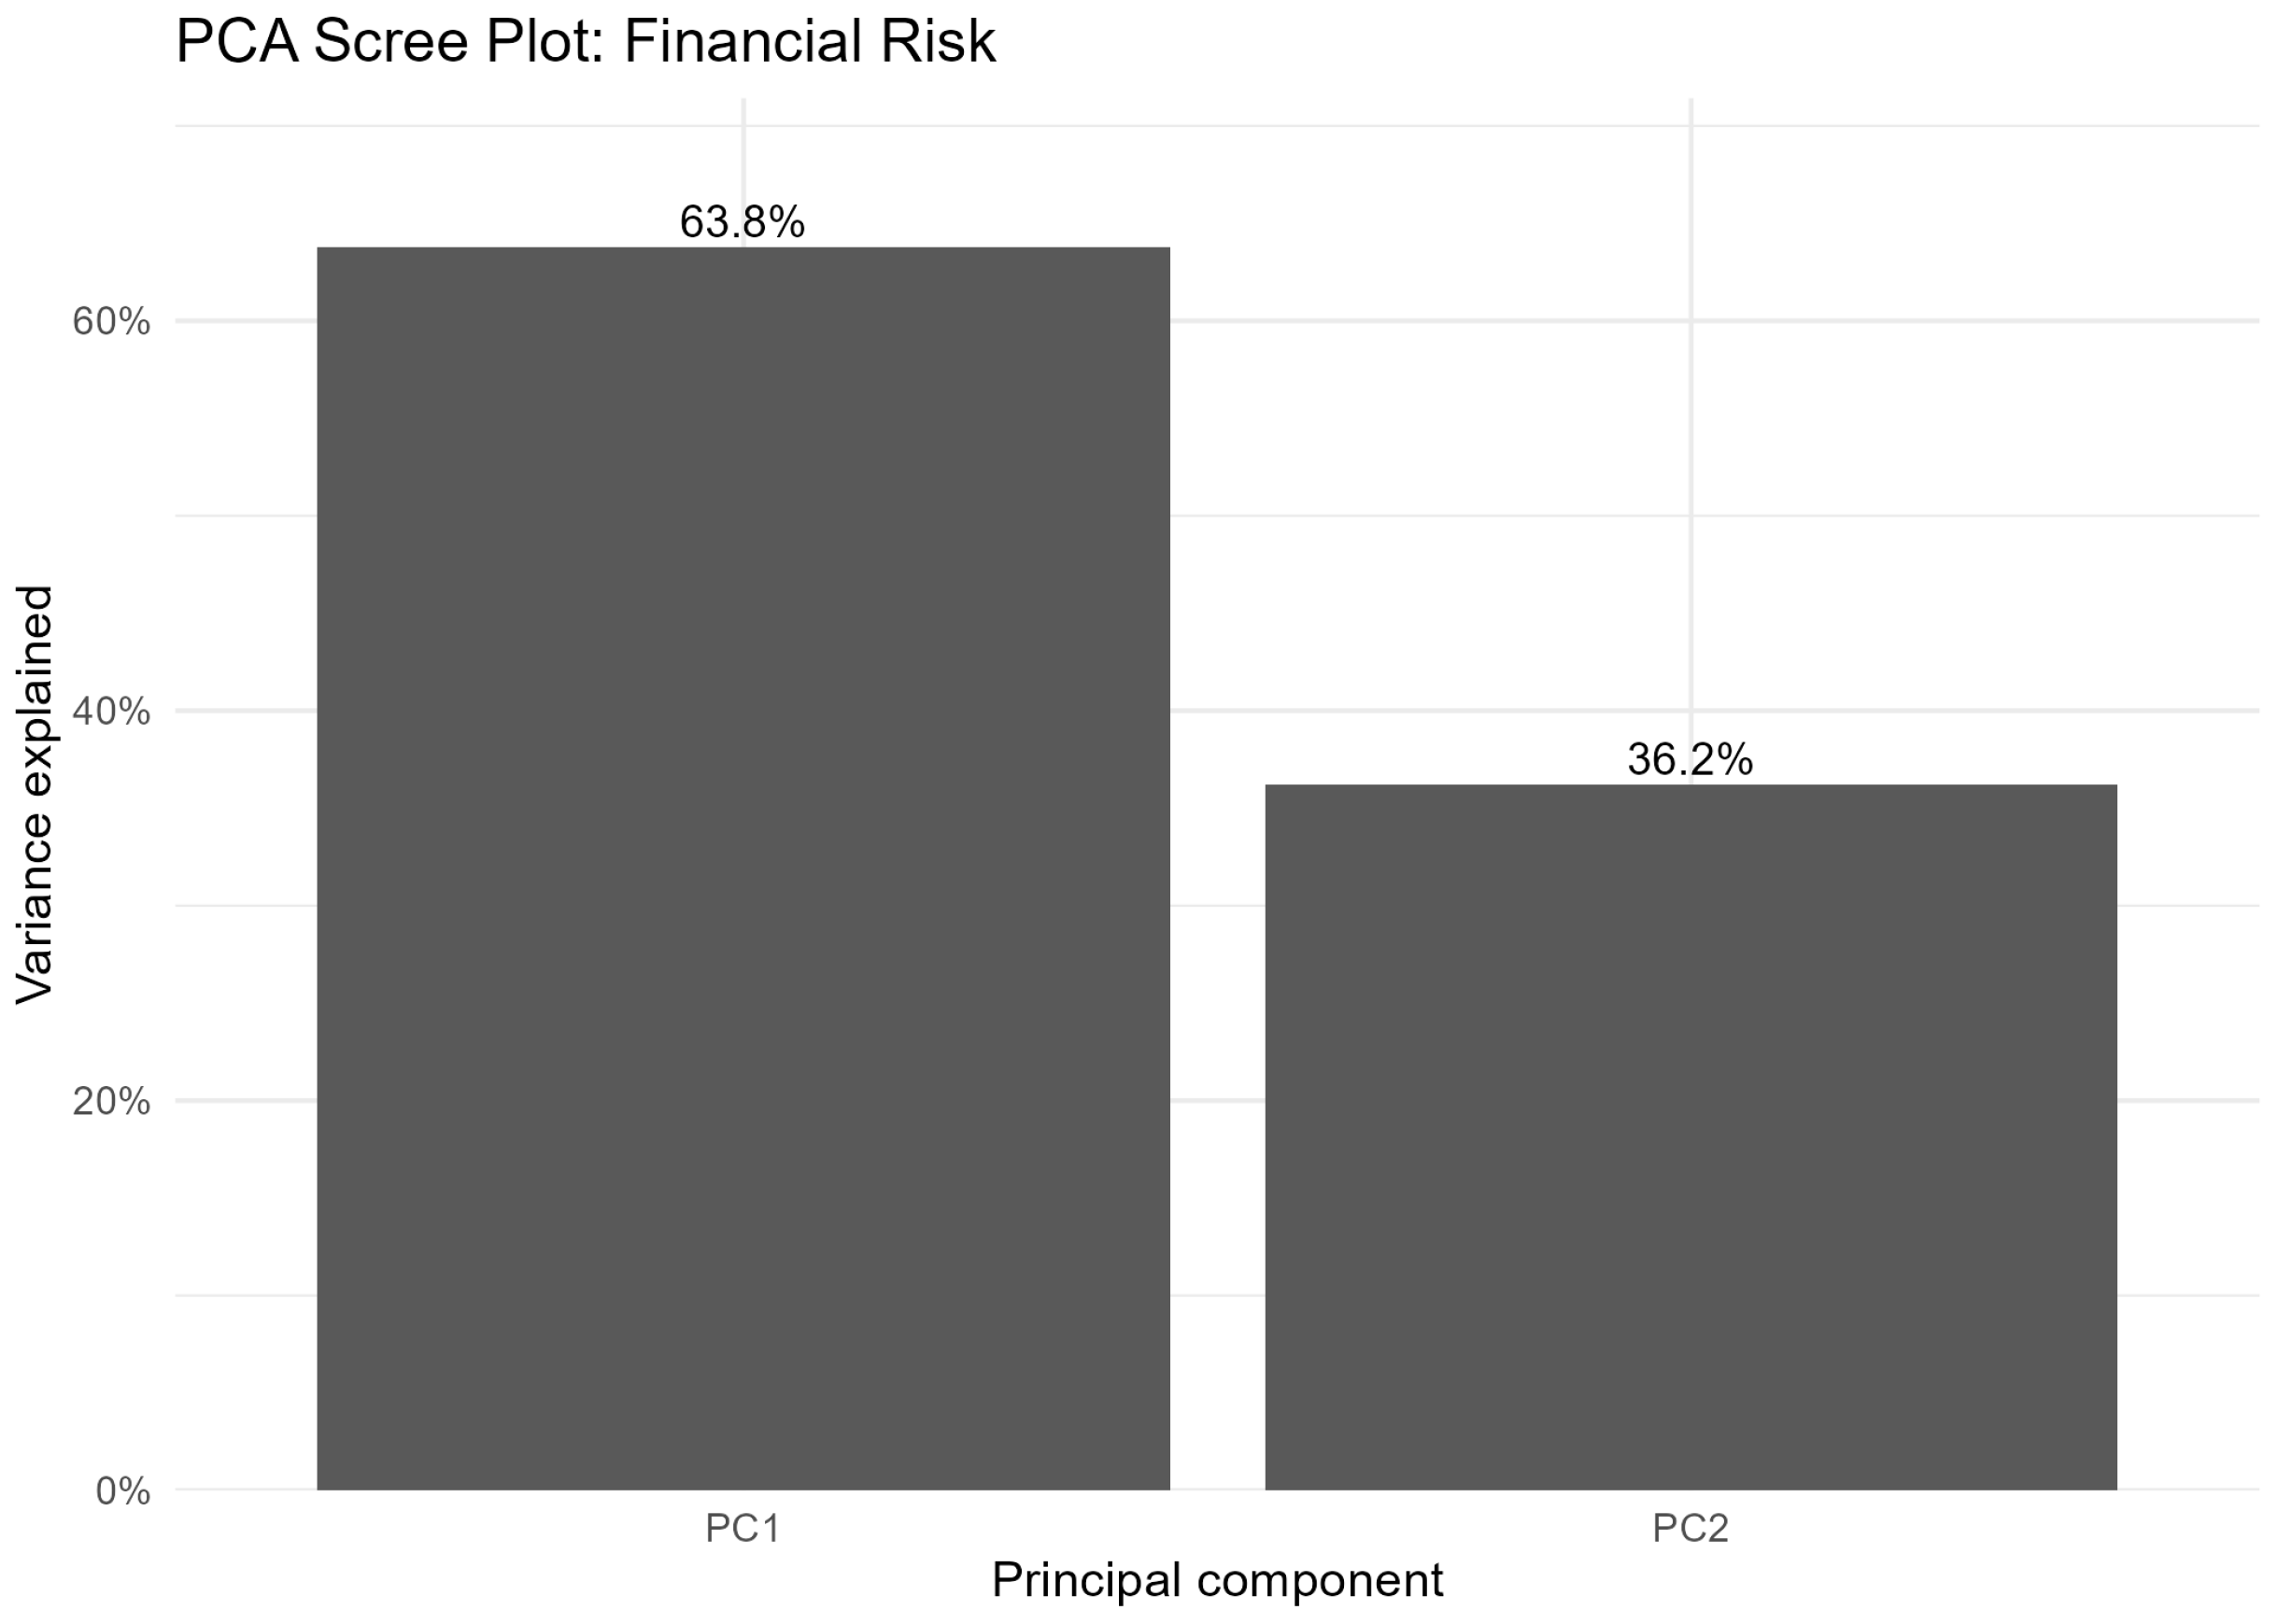
Figure A2.
PCA scree plot for firm scale.
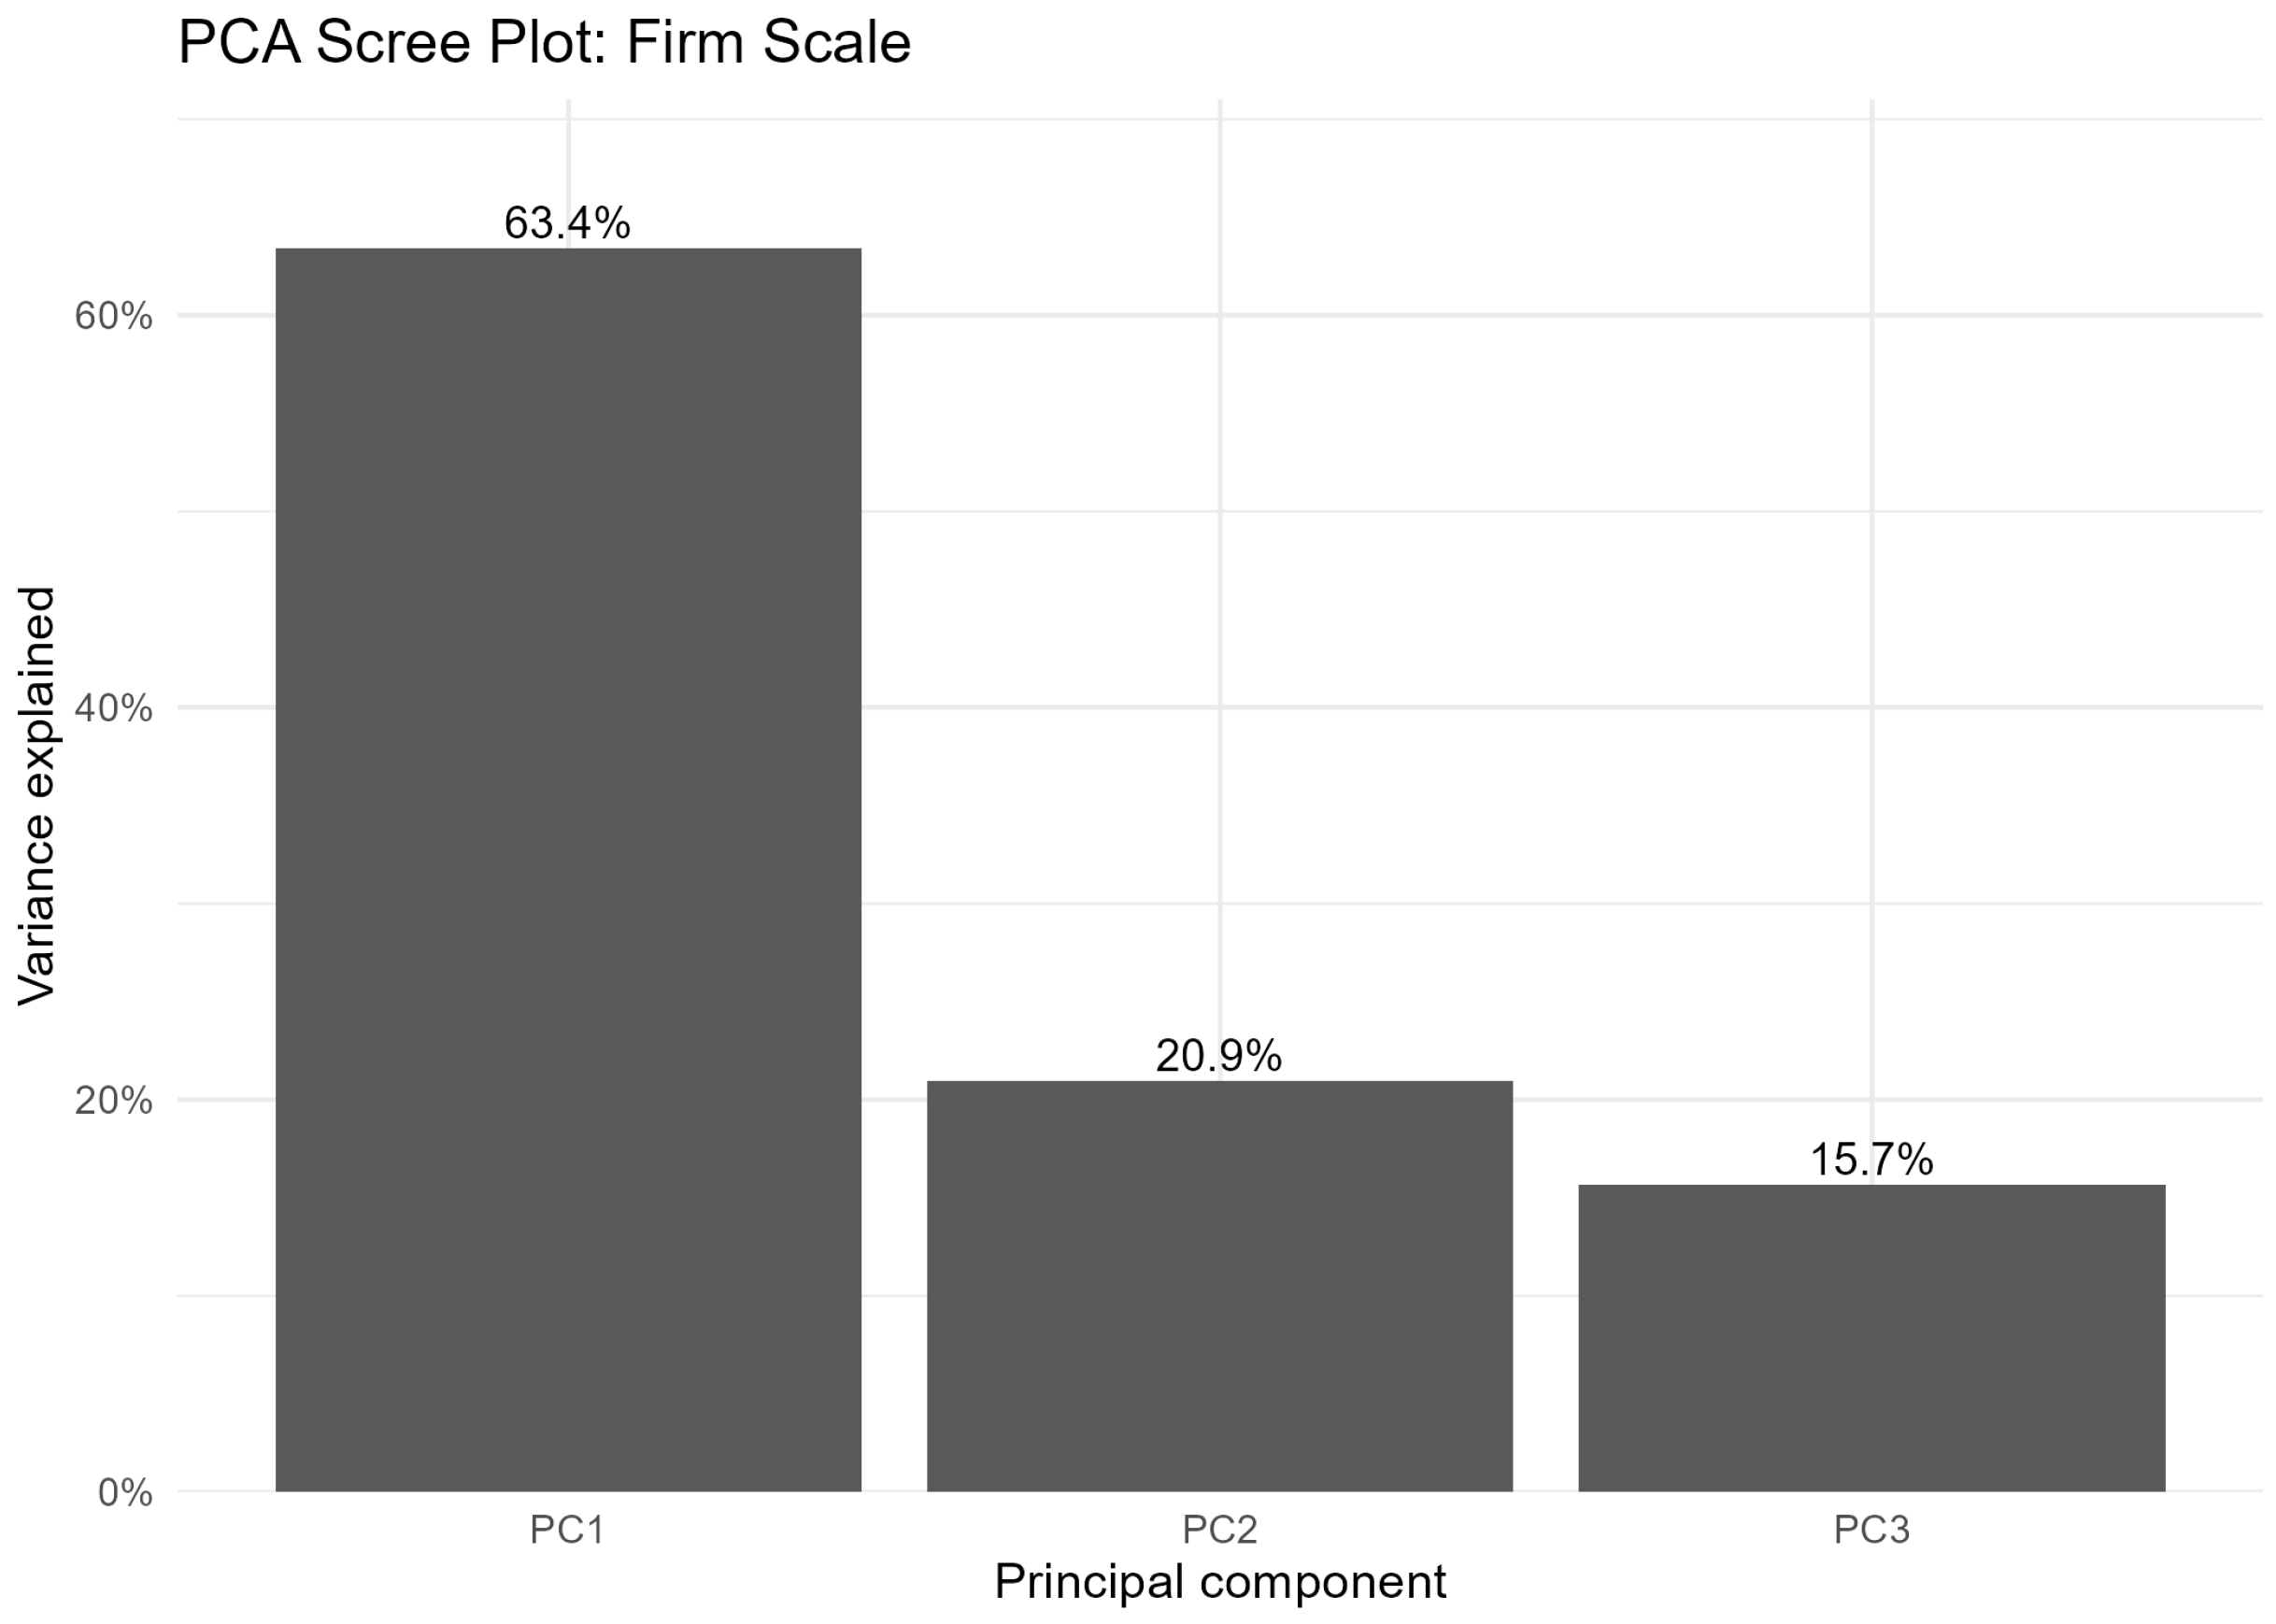
Figure A3.
PCA scree plot for ESG pillars.
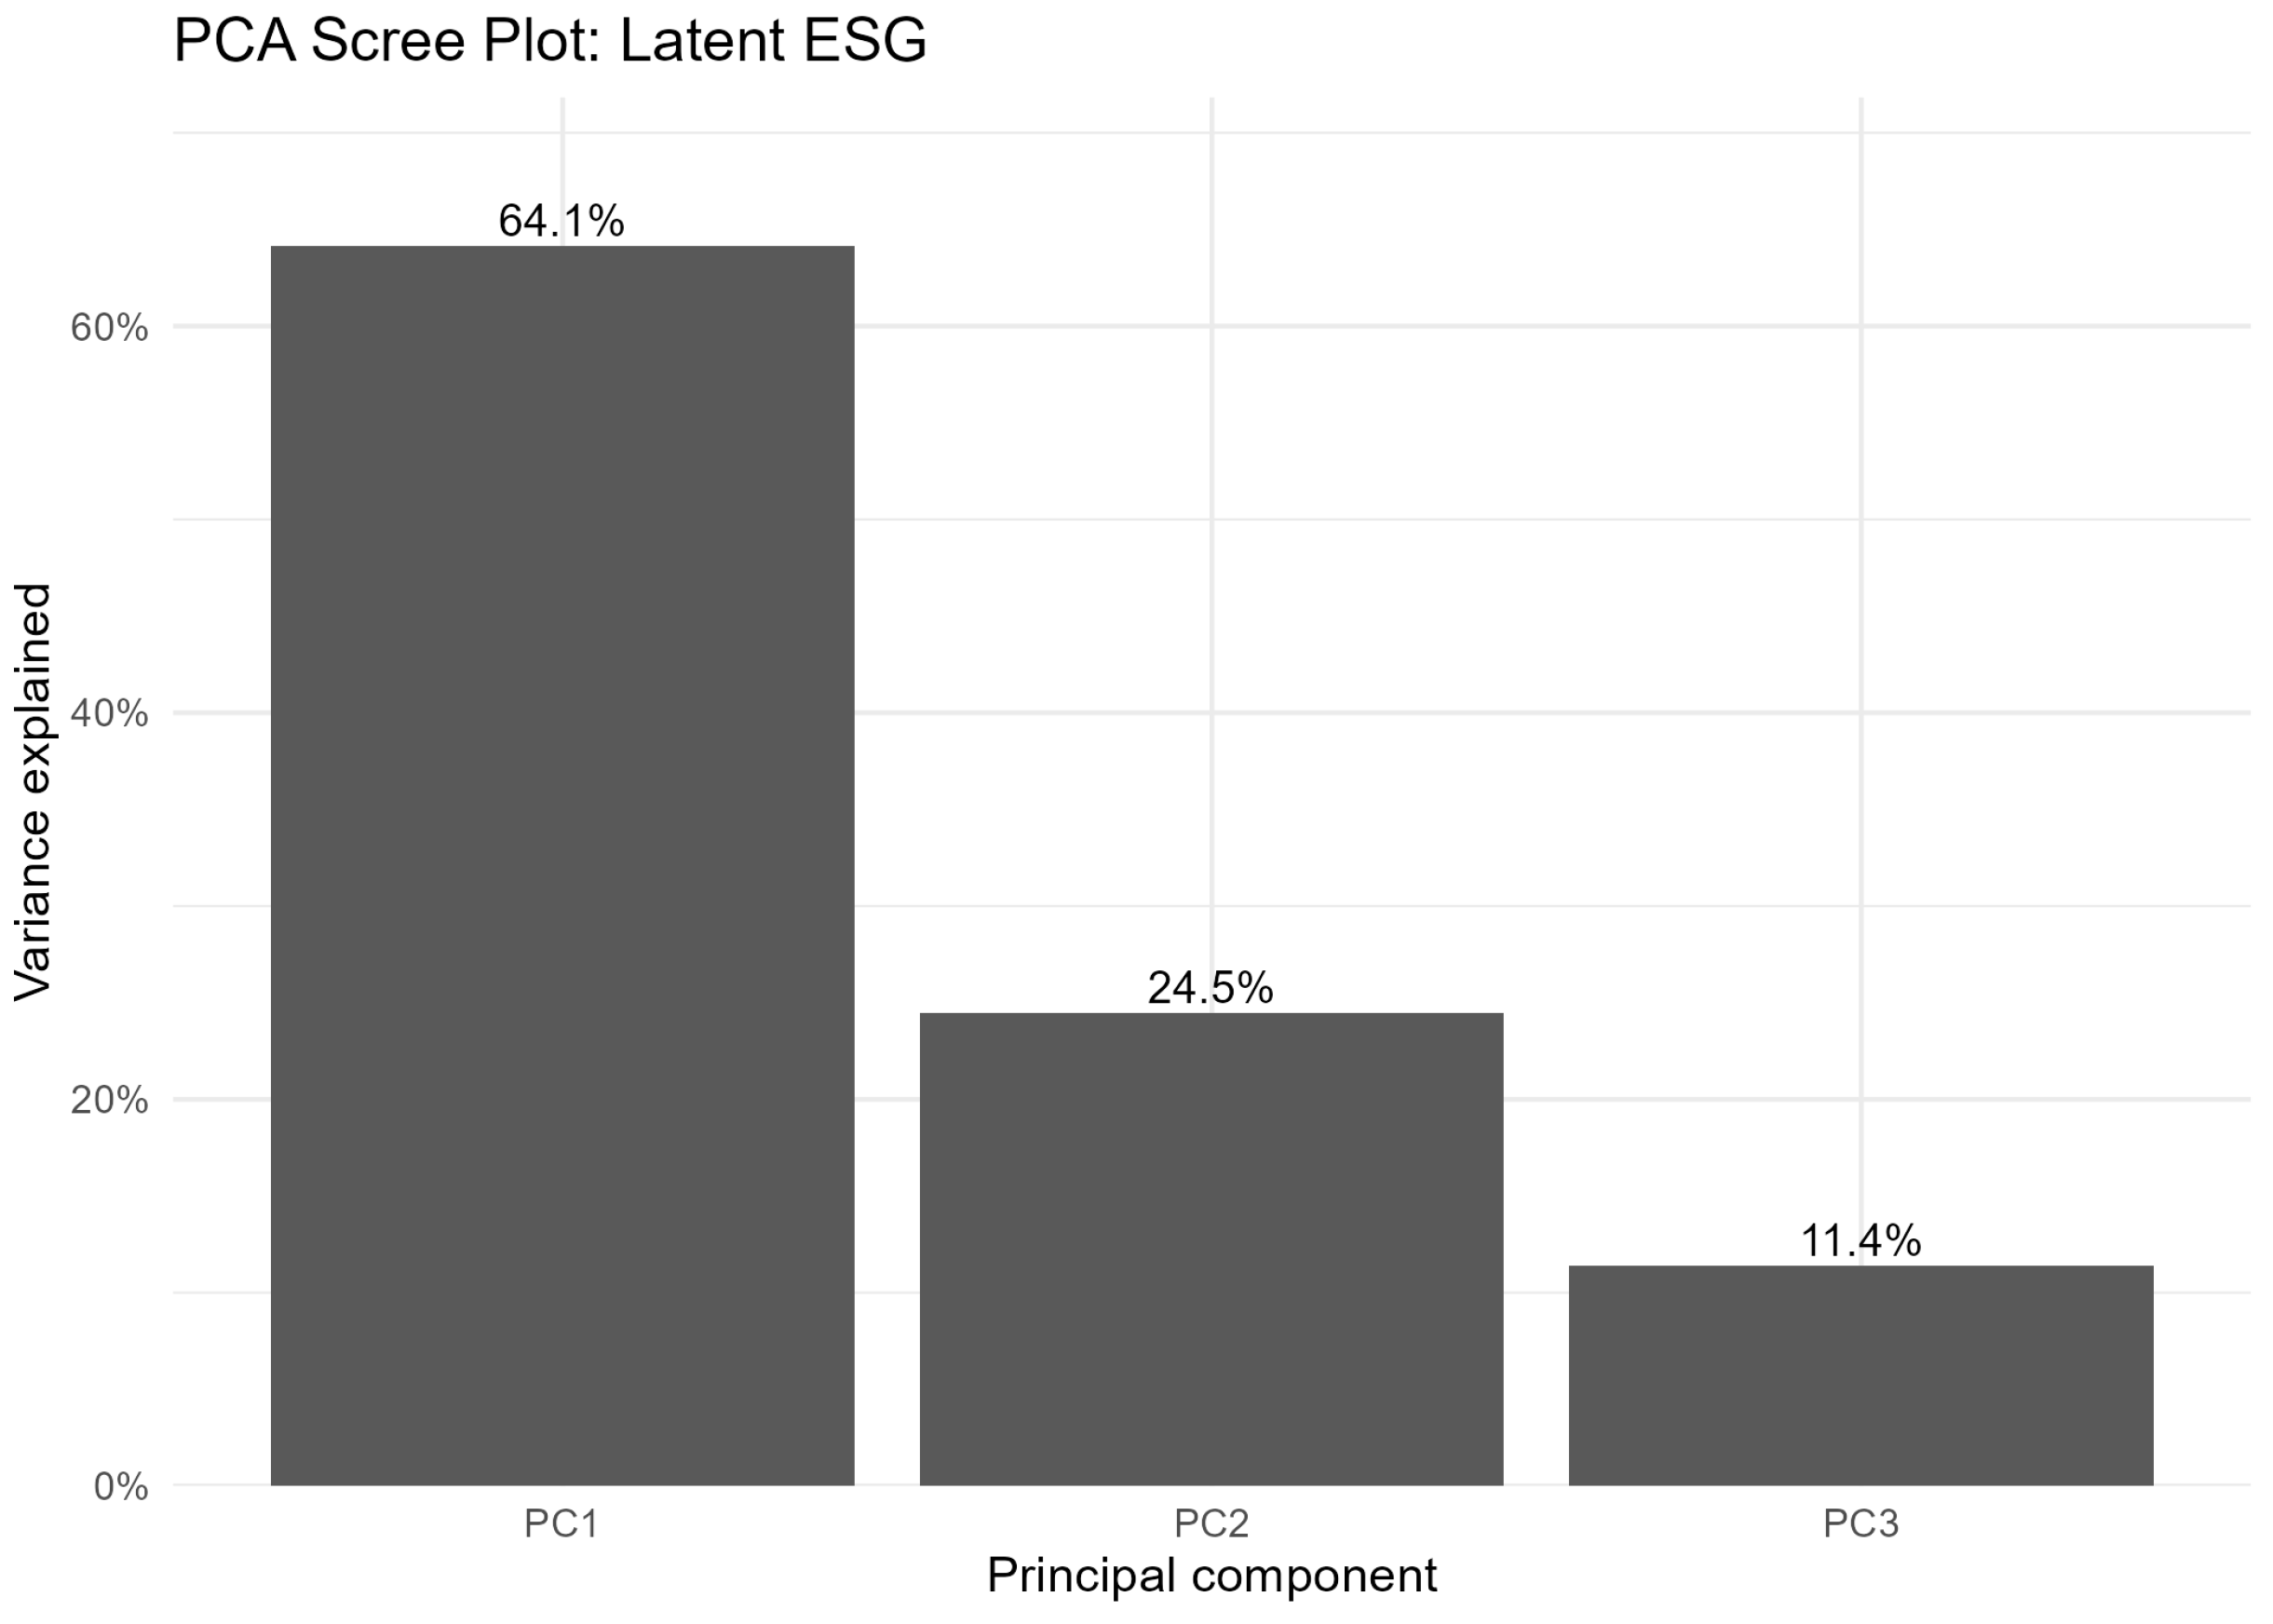
Figure A4.
Exploratory tuned Random Forest partial dependence plot for lagged Latent ESG.
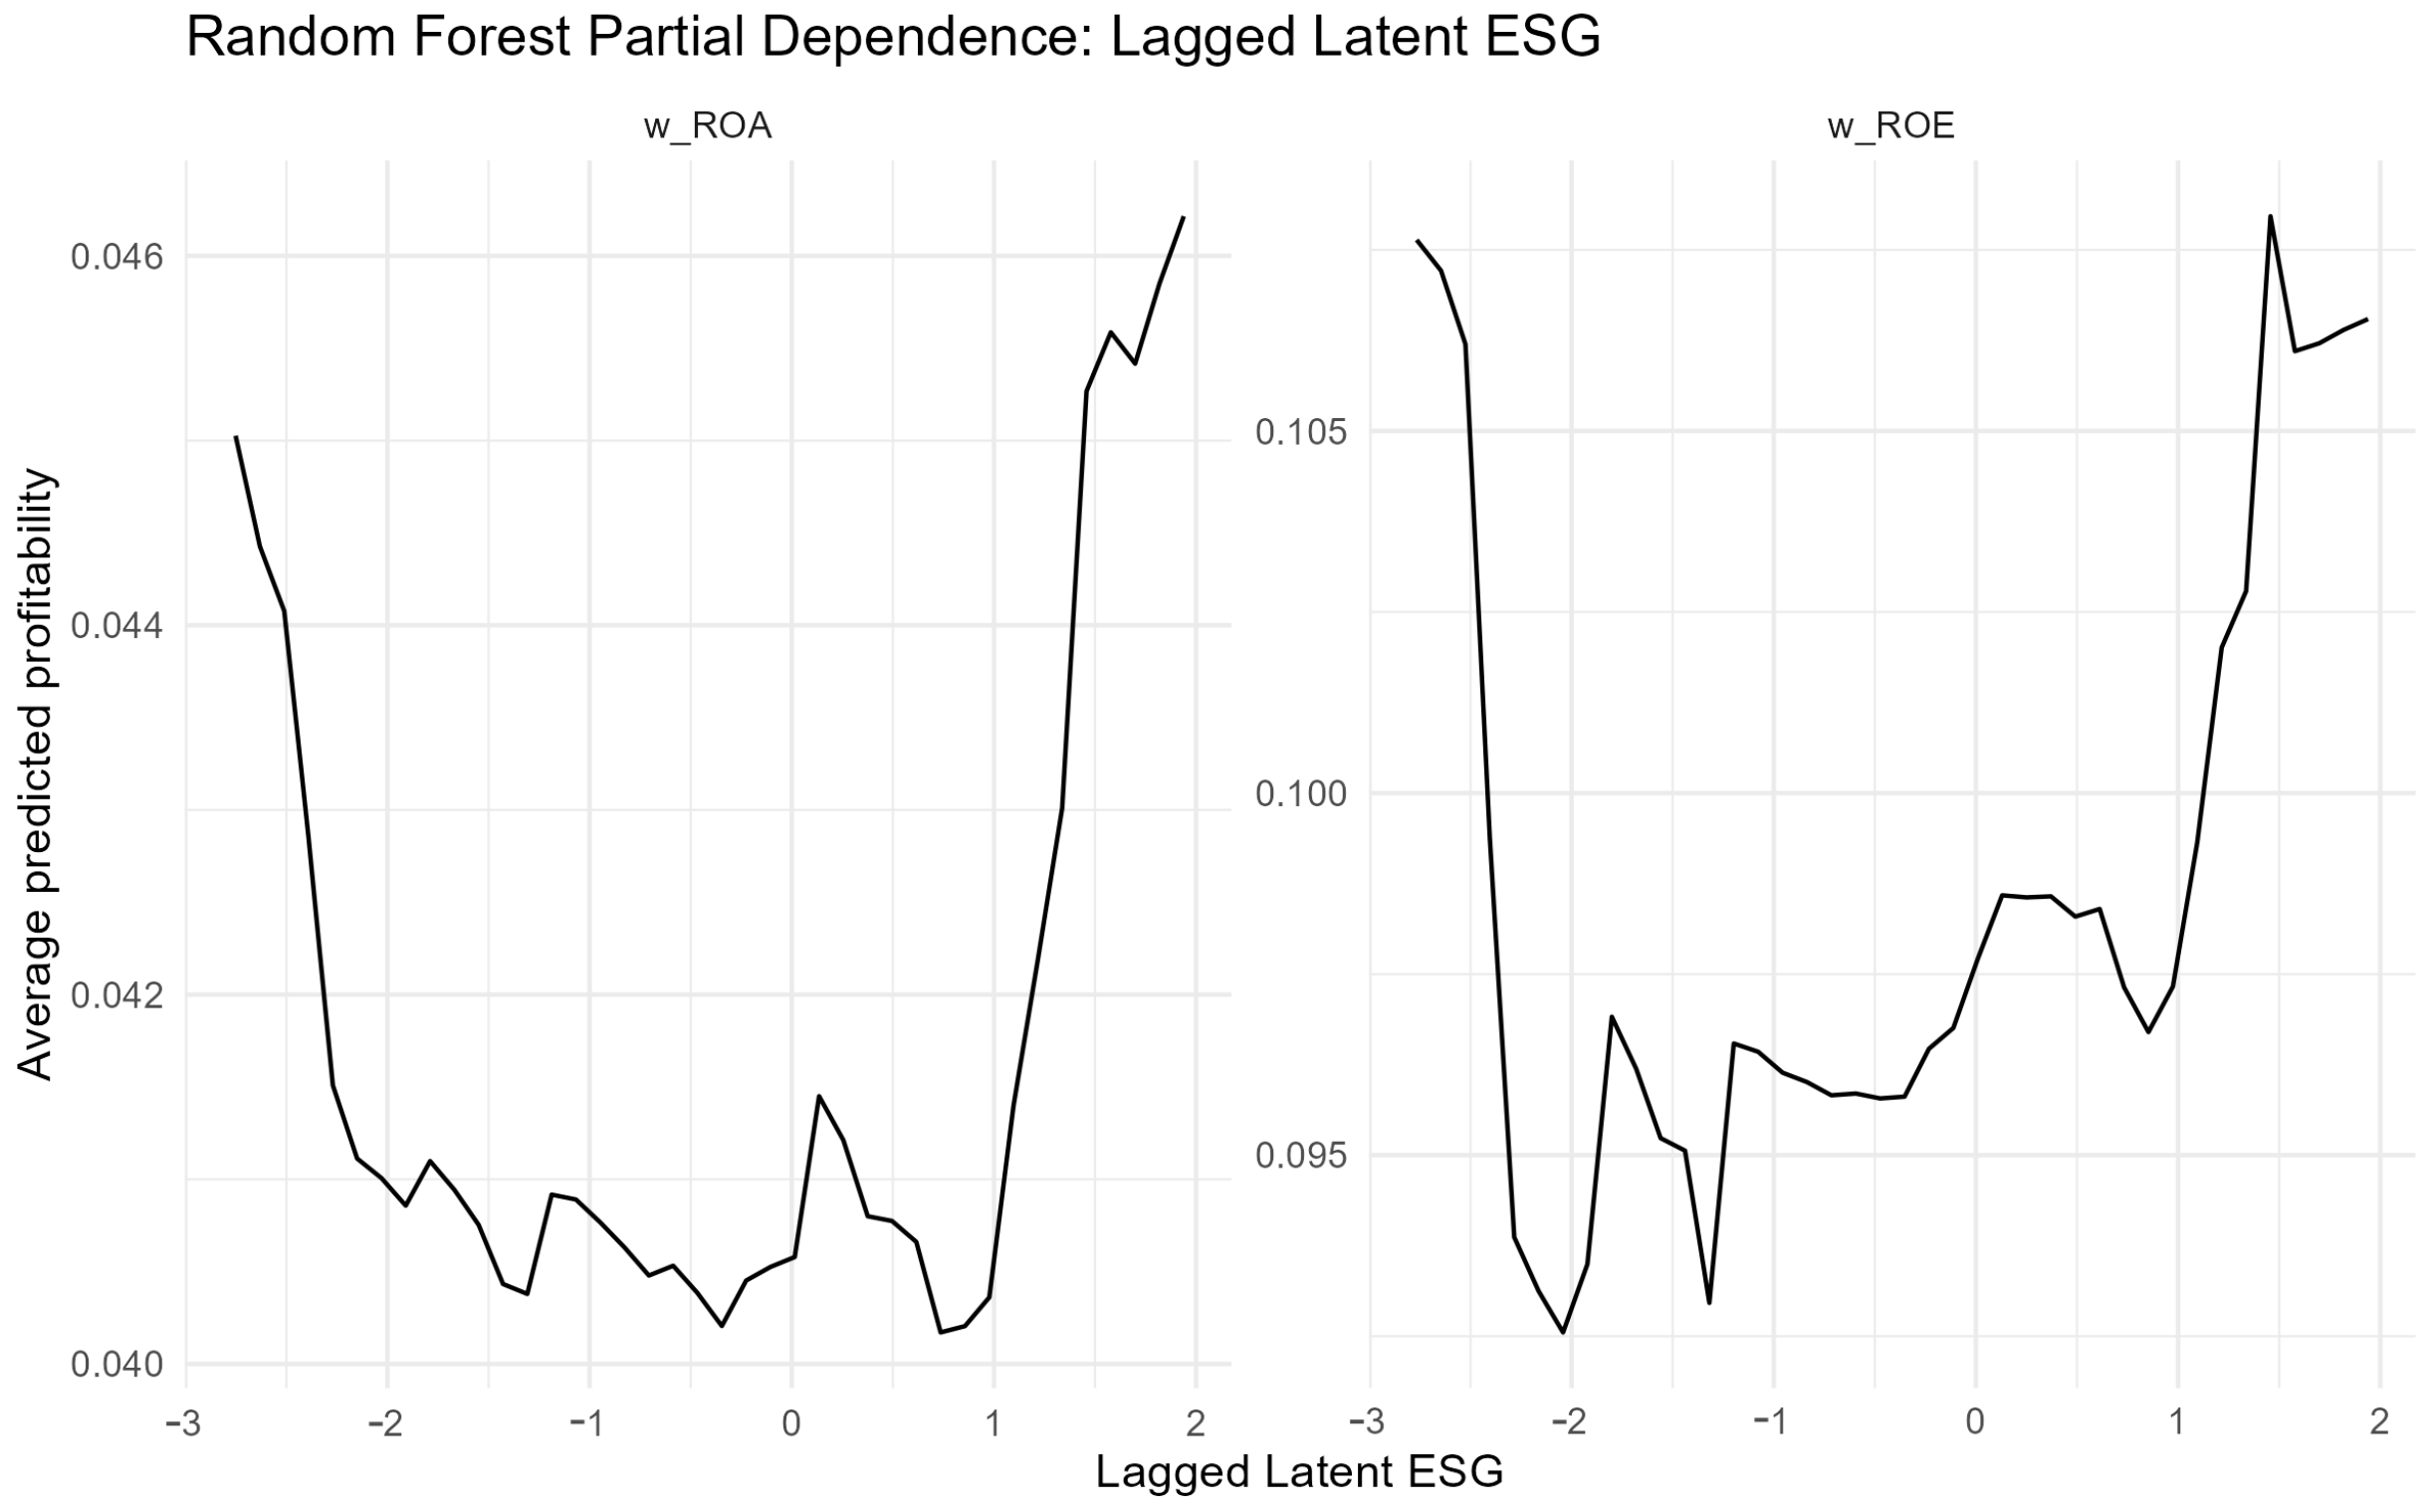
Table A2.
Summary of missing data imputation for variables used in the final empirical specifications.
Table A3.
Best machine-learning configurations (full feature set) on the 2023 holdout.
Table A4.
Best specification-aligned machine-learning configurations by M0–M5.
References
- ACCA. (2025). Sustainability reporting in ASEAN: An overview of current developments. Association of Chartered Certified Accountants. Available online: https://www.accaglobal.com/content/dam/gb/policy-and-insights/reports/2025/asean-sustainability-reporting.pdf (accessed on 16 April 2026).
- Ahmed, E. R., Alabdullah, T. T. Y., & Akyurek, M. (2023). Management of innovations in the environmental, social, and governance scores and sustainability performance through ESG disclosure: Evidence from emerging markets. Marketing and Management of Innovations, 14(4), 69–83. [Google Scholar] [CrossRef] [Scilit]
- Albao, M., Baylon, D., Jr., & Patiu, L. S. (2025). Impacts of sustainability on telecommunication firms’ financial performance in Asia Pacific region. Review of Integrative Business and Economics Research, 14(3), 434–446. [Google Scholar]
- Allee, K. D., Do, C., & Raymundo, F. G. (2022). Principal component analysis and factor analysis in accounting research. Journal of Financial Reporting, 7(2), 1–39. [Google Scholar] [CrossRef] [Scilit]
- Aydoğmuş, M., Gülay, G., & Ergun, K. (2022). Impact of ESG performance on firm value and profitability. Borsa Istanbul Review, 22, S119–S127. [Google Scholar] [CrossRef] [Scilit]
- Barney, J. (1991). Firm resources and sustained competitive advantage. Journal of Management, 17(1), 99–120. [Google Scholar] [CrossRef] [Scilit]
- Buallay, A. (2019). Is sustainability reporting (ESG) associated with performance? Evidence from the European banking sector. Management of Environmental Quality: An International Journal, 30(1), 98–115. [Google Scholar] [CrossRef] [Scilit]
- Bumin, M., & Ertugrul, A. (2024). Effect of ESG scores on firm performance: Evidence from Borsa Istanbul sustainability index. International Journal of Academic Research in Business and Social Sciences, 14(4), 1033–1047. [Google Scholar] [CrossRef] [Scilit] [PubMed]
- Cantero-Saiz, M., Polizzi, S., & Scannella, E. (2024). ESG and asset quality in the banking industry: The moderating role of financial performance. Research in International Business and Finance, 69, 102221. [Google Scholar] [CrossRef] [Scilit]
- Chaouech, O. (2025). Predicting corporate ESG scores from financial performance and environmental indicators: A machine learning framework. Journal of Cultural Analysis and Social Change, 10(3), 2042–2056. [Google Scholar] [CrossRef]
- Dai, P. F., Xiong, X., & Zhou, W. X. (2021). A global economic policy uncertainty index from principal component analysis. Finance Research Letters, 40, 101686. [Google Scholar] [CrossRef] [Scilit]
- De Lucia, C., Pazienza, P., & Bartlett, M. (2020). Does good ESG lead to better financial performances by firms? Machine learning and logistic regression models of public enterprises in Europe. Sustainability, 12(13), 5317. [Google Scholar] [CrossRef] [Scilit]
- Dorothy, P., & Endri, E. (2024). Environmental, social and governance disclosure and firm value in the energy sector: The moderating role of profitability. Problems and Perspectives in Management, 22(4), 588–599. [Google Scholar] [CrossRef] [Scilit]
- El Khoury, R., Nasrallah, N., & Alareeni, B. (2023). ESG and financial performance of banks in the MENAT region: Concavity–convexity patterns. Journal of Sustainable Finance & Investment, 13(1), 406–430. [Google Scholar] [CrossRef] [Scilit]
- Fettahoglu, S., Allak, S., & Ozcan Turkkan, B. (2025). ESG scores and corporate performance in emerging markets: Evidence from E7 countries. Sustainability, 17(19), 8936. [Google Scholar] [CrossRef] [Scilit]
- Freeman, R. E. (1984). Strategic management: A stakeholder approach. Pitman. [Google Scholar]
- FTSE Russell. (2019). Smart sustainability: 2019 global survey findings from asset owners. Available online: https://www.lseg.com/content/dam/ftse-russell/en_us/documents/reports/global-asset-owner/smart-sustainability-2019-global-survey-findings-from-asset-owners.pdf (accessed on 15 October 2026).
- FTSE Russell. (2025). Sustainable investment: Plateauing or poized for growth? London Stock Exchange Group. Available online: https://www.lseg.com/content/dam/ftse-russell/en_us/documents/reports/ftse-russell-asset-owner-survey-2025.pdf (accessed on 15 October 2026).
- Gartia, U., Panda, A. K., Hegde, A., & Nanda, S. (2024). Environmental, social and governance aspects and financial performance: A symbiotic relationship in Indian manufacturing. Cleaner Production Letters, 7, 100076. [Google Scholar] [CrossRef] [Scilit]
- Gavrilakis, N., & Floros, C. (2023). ESG performance, herding behavior and stock market returns: Evidence from Europe. Operational Research, 23(1), 3. [Google Scholar] [CrossRef] [Scilit]
- Goodman, S. N. (1999). Toward evidence-based medical statistics. 2: The Bayes factor. Annals of Internal Medicine, 130(12), 1005–1013. [Google Scholar] [CrossRef] [Scilit] [PubMed]
- Gutiérrez-Ponce, H., & Wibowo, S. A. (2023). Do sustainability activities affect the financial performance of banks? The case of Indonesian banks. Sustainability, 15(8), 6892. [Google Scholar] [CrossRef] [Scilit]
- Habib, A. M. (2023). Do business strategies and environmental, social, and governance (ESG) performance mitigate the likelihood of financial distress? A multiple mediation model. Heliyon, 9(7), e17847. [Google Scholar] [CrossRef] [Scilit] [PubMed]
- Habib, A. M., & Mourad, N. (2024). The influence of environmental, social, and governance (ESG) practices on US firms’ performance: Evidence from the coronavirus crisis. Journal of the Knowledge Economy, 15(1), 2549–2570. [Google Scholar] [CrossRef] [Scilit] [PubMed]
- Herman, A., Oplotnik, Ž. J., & Jagrič, T. (2025). The impact of ESG on business performance: An empirical analysis of NASDAQ–NYSE-listed companies. Sustainability, 17(21), 9683. [Google Scholar] [CrossRef] [Scilit]
- Kaiser, H. F. (1974). An index of factorial simplicity. Psychometrika, 39(1), 31–36. [Google Scholar] [CrossRef] [Scilit]
- Kercher, K., Duncan, K., Moore, G., & Southam, C. (2026). Global state of play for extended sustainability disclosures, performance, and assurance—Insights from cross-country benchmarking. Accounting & Finance, 66(1), 824–848. [Google Scholar] [CrossRef] [Scilit]
- La Torre, M., Mango, F., Cafaro, A., & Leo, S. (2020). Does the ESG index affect stock return? Evidence from the Eurostoxx50. Sustainability, 12(16), 6387. [Google Scholar] [CrossRef] [Scilit]
- Le, L. T. (2024). ESG and financial performance: Evidence from Southeast Asia. Cogent Business & Management, 11(1), 2379568. [Google Scholar] [CrossRef] [Scilit]
- Li, Q., Tang, W., & Li, Z. (2024). ESG systems and financial performance in industries with significant environmental impact: A comprehensive analysis. Frontiers in Sustainability, 5, 1454822. [Google Scholar] [CrossRef] [Scilit]
- Lin, H. Y., & Hsu, B. W. (2023). Empirical study of ESG score prediction through machine learning—A case of non-financial companies in Taiwan. Sustainability, 15(19), 14106. [Google Scholar] [CrossRef] [Scilit]
- LSEG Data & Analytics. (2024, October). Environmental, social and governance scores from LSEG. Available online: https://www.lseg.com/content/dam/data-analytics/en_us/documents/methodology/lseg-esg-scores-methodology.pdf (accessed on 15 October 2026).
- LSEG Data & Analytics. (2026a). Introducing the LSEG ESG scores. London Stock Exchange Group. [Google Scholar]
- LSEG Data & Analytics. (2026b). LSEG ESG scores methodology, version 1.0. London Stock Exchange Group. [Google Scholar]
- Makridou, G., Doumpos, M., & Lemonakis, C. (2024). Relationship between ESG and corporate financial performance in the energy sector: Empirical evidence from European companies. International Journal of Energy Sector Management, 18(4), 873–895. [Google Scholar] [CrossRef] [Scilit]
- Meher, B. K., Hawaldar, I. T., Mohapatra, L., Spulbar, C., & Birau, R. (2020). The effects of environment, society and governance scores on investment returns and stock market volatility. International Journal of Energy Economics and Policy, 10(4), 234–239. [Google Scholar] [CrossRef] [Scilit]
- Mustafa Kamal, M., Azmi, N. A., Mohamed Yunos, R., Mastini Razi, N. S., & Abd Sata, F. H. (2026). Comparative trends of ESG disclosure among Asian countries. Insight Journal, 13(1), 15–26. [Google Scholar] [CrossRef] [Scilit]
- Müller, L. (2025). From penalties to protection: The continuous time sustainable efficiency frontier. Journal of Risk and Financial Management, 18(11), 610. [Google Scholar] [CrossRef] [Scilit]
- Müller, L. (2026). Diversification effects of ESG penalties in sustainable mean–variance portfolios. Journal of Asset Management, 27, 12. [Google Scholar] [CrossRef] [Scilit]
- Müller, L., & Joubrel, M. (2025). A novel approach to sustainable mean-variance portfolio optimization: Accounting for ESG-related uncertainty. Finance Research Letters, 85, 108056. [Google Scholar] [CrossRef] [Scilit]
- Naeem, N., Cankaya, S., & Bildik, R. (2022). Does ESG performance affect the financial performance of environmentally sensitive industries? A comparison between emerging and developed markets. Borsa Istanbul Review, 22, S128–S140. [Google Scholar] [CrossRef] [Scilit]
- OECD. (2025). Board responsibility and sustainability-related disclosure in Asia. OECD Publishing. Available online: https://www.oecd.org/content/dam/oecd/en/publications/reports/2025/11/board-responsibility-and-sustainability-related-disclosure-in-asia_7509e0ac/8d2672e7-en.pdf (accessed on 13 October 2026).
- Priem, R., & Gabellone, A. (2024). The impact of a firm’s ESG score on its cost of capital: Can a high ESG score serve as a substitute for a weaker legal environment. Sustainability Accounting, Management and Policy Journal, 15(3), 676–703. [Google Scholar] [CrossRef] [Scilit]
- Pu, G. (2023). A non-linear assessment of ESG and firm performance relationship: Evidence from China. Economic research-Ekonomska istraživanja, 36(1), 2113336. [Google Scholar] [CrossRef] [Scilit]
- Salem, M. R. M., Shahimi, S., Alma‘amun, S., Mohd Azam, A. H., & Ghazali, M. F. (2025). ESG and banking performance in ASEAN-5: Disaggregated analysis using system GMM and LSDVC. Sage Open, 15(4), 1–19. [Google Scholar] [CrossRef] [Scilit]
- Shobhwani, K., & Lodha, S. (2024). Impact of ESG disclosure scores on financial performance: Evidence from NSE-100. Journal of Management Research, 32(3), 211–223. [Google Scholar] [CrossRef] [Scilit]
- Shrestha, C., Andrikopoulos, P., & Park, J. S. (2025). ESG rating and financial performance in the emerging markets: The moderating effects of cross-listing and industry type. Research in International Business and Finance, 77, 102916. [Google Scholar] [CrossRef] [Scilit]
- Sultana, N., & Zeya, F. (2025). Advancing firm–specific ESG sentiment analysis: A machine learning approach to clustering, prediction, and financial performance implications. Business Strategy & Development, 8(3), e70150. [Google Scholar] [CrossRef] [Scilit]
- Tran Bui, H. T. (2023). Relationship between financial performance and ESG performance: Perspectives from investors and firms from selected countries in European Union [Bachelor’s thesis, Haaga-Helia University of Applied Sciences]. [Google Scholar]
- Trisnowati, Y., Achsani, N. A., Sembel, R., & Andati, T. (2022). The effect of ESG score, financial performance, and macroeconomics on stock returns during the pandemic era in Indonesia. International Journal of Energy Economics and Policy, 12(4), 166–172. [Google Scholar] [CrossRef] [Scilit]
- Tutar, H., Štreimikienė, D., & Mutlu, H. T. (2025). The relationship between ESG and financial performance in global firms: A multidimensional study across sectors and regions for the period 2015–2025. Corporate Social Responsibility and Environmental Management, 32(6), 8280–8294. [Google Scholar] [CrossRef] [Scilit]
- Vance, S. C. (1975). Are socially responsible corporations good investment risks? Managerial Review, 64(8), 19–24. [Google Scholar]
- Wu, S., Li, X., Du, X., & Li, Z. (2022). The impact of ESG performance on firm value: The moderating role of ownership structure. Sustainability, 14(21), 14507. [Google Scholar] [CrossRef] [Scilit]
- Xiao, H.-J., Chou, T.-N., Li, J.-F., & Lai, K.-K. (2026). Leveraging machine learning to evaluate the ESG performance of listed and OTC firms in a small open economy. Applied System Innovation, 9(3), 52. [Google Scholar] [CrossRef] [Scilit]
- Yadav, M., Dhingra, B., Batra, S., Saini, M., & Aggarwal, V. (2025). ESG scores and stock returns during COVID-19: An empirical analysis of an emerging market. International Journal of Social Economics, 52(3), 390–405. [Google Scholar] [CrossRef] [Scilit]
- Zhou, R., Hou, J., & Ding, F. (2023). Understanding the nexus between environmental, social, and governance (ESG) and financial performance: Evidence from Chinese-listed companies. Environmental Science and Pollution Research, 30(29), 73231–73253. [Google Scholar] [CrossRef] [Scilit] [PubMed]
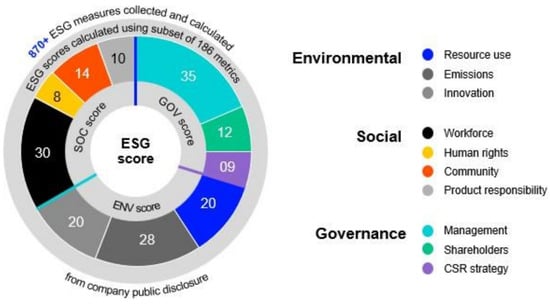
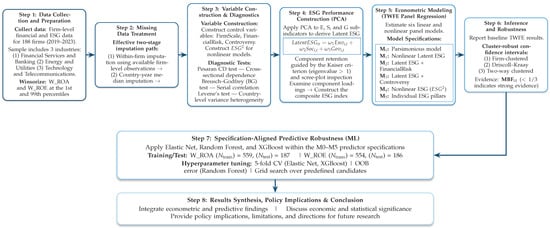
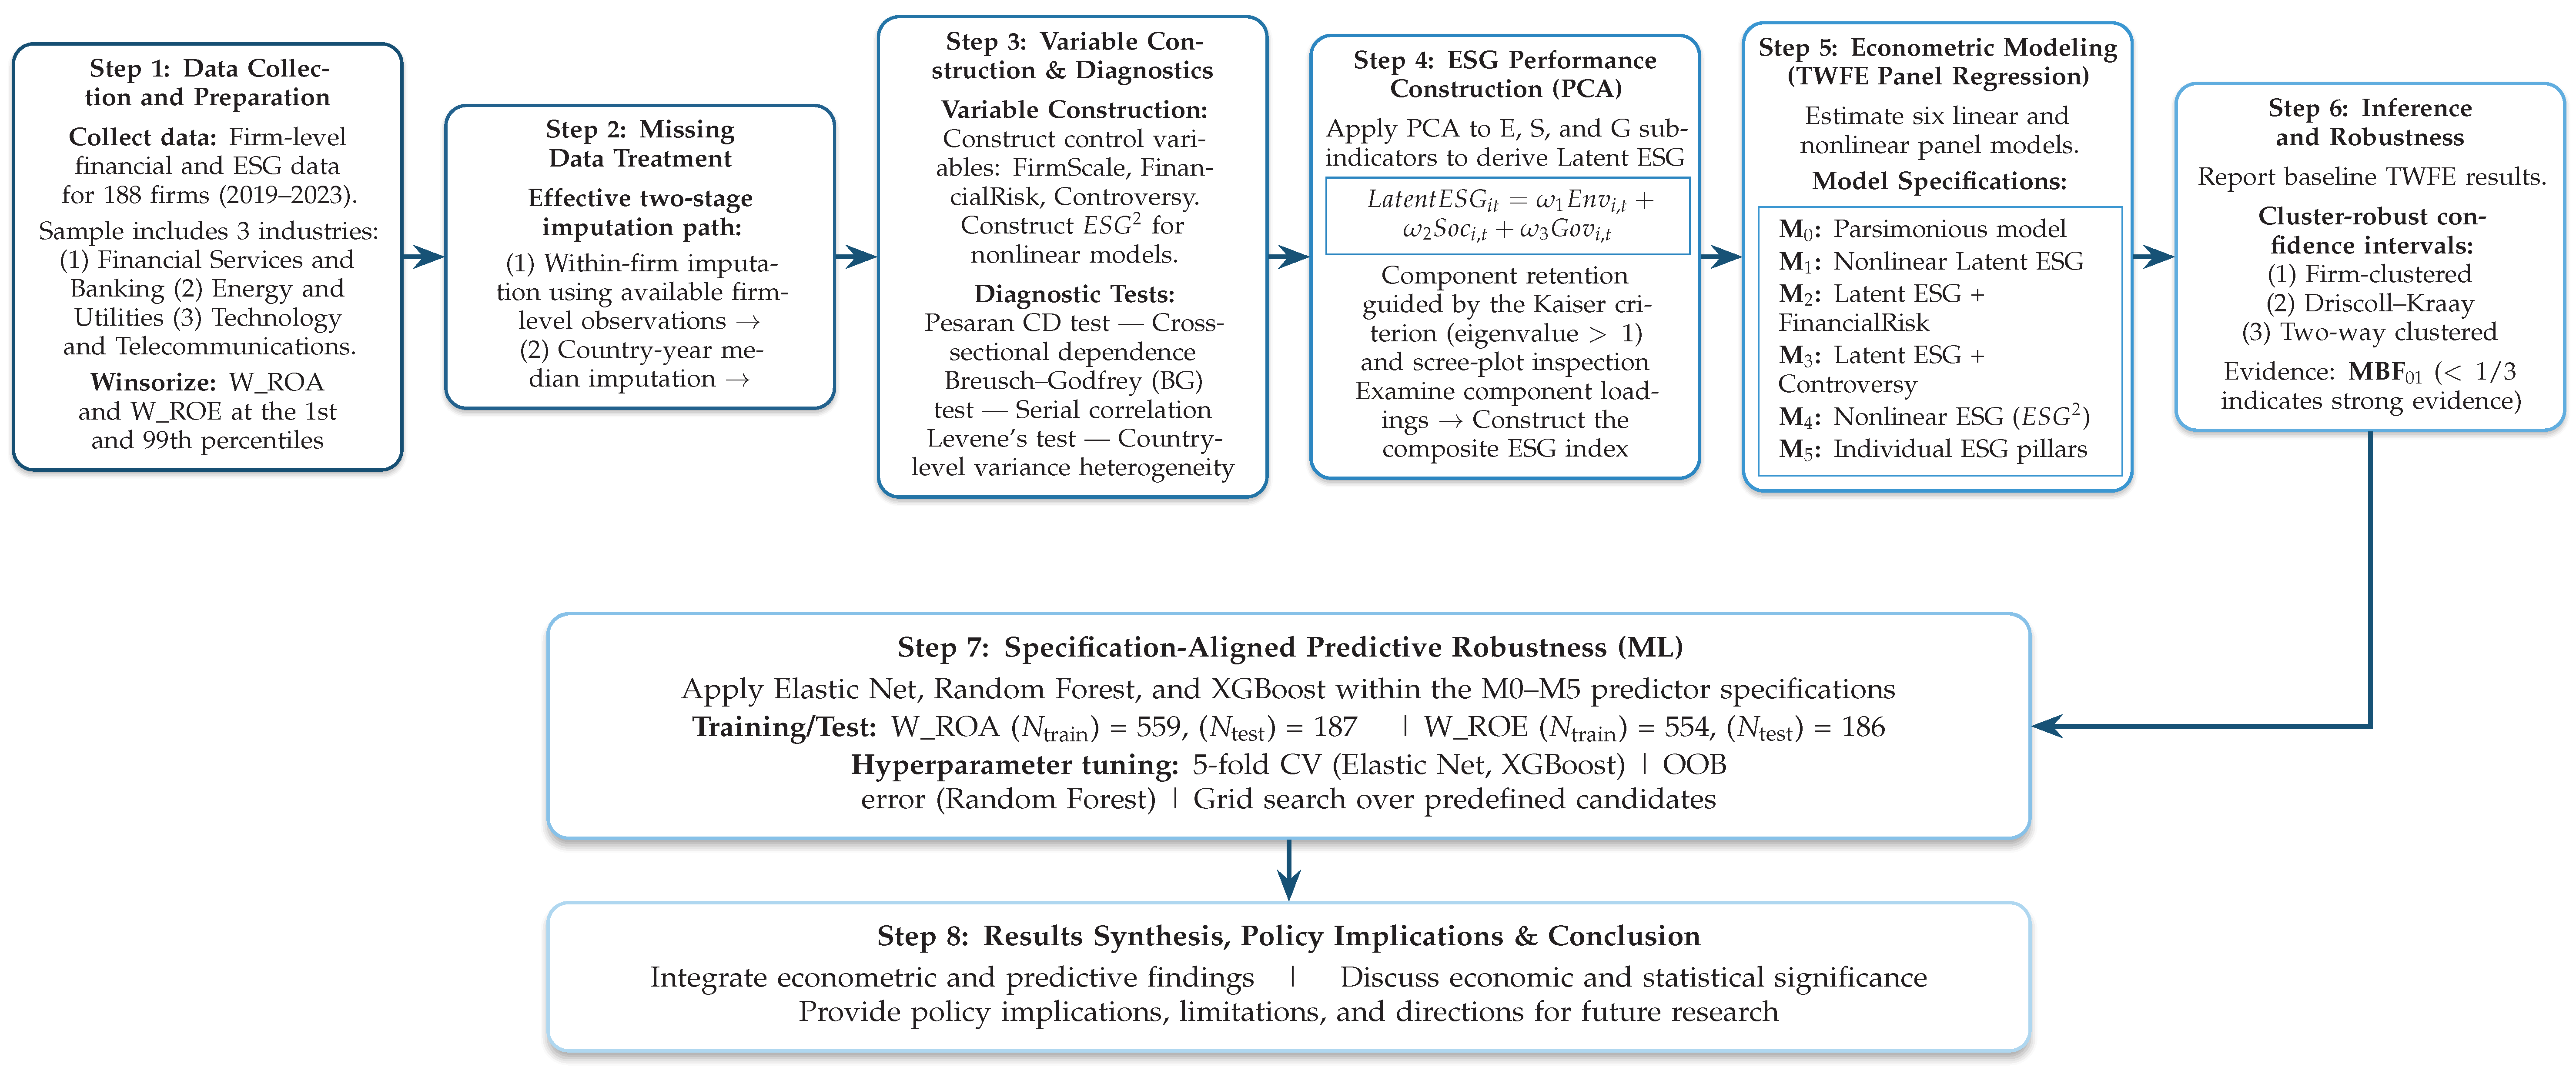
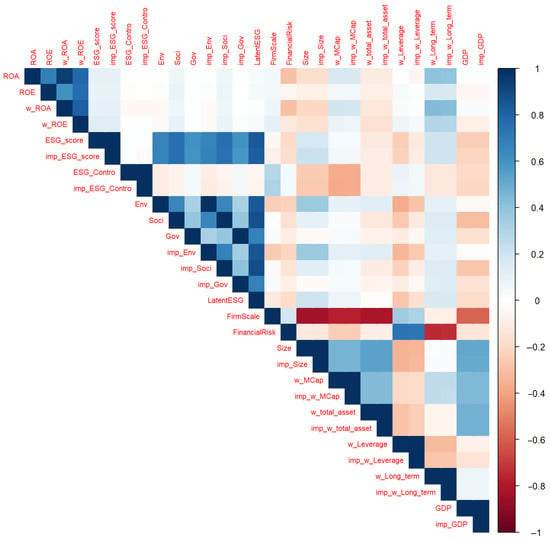
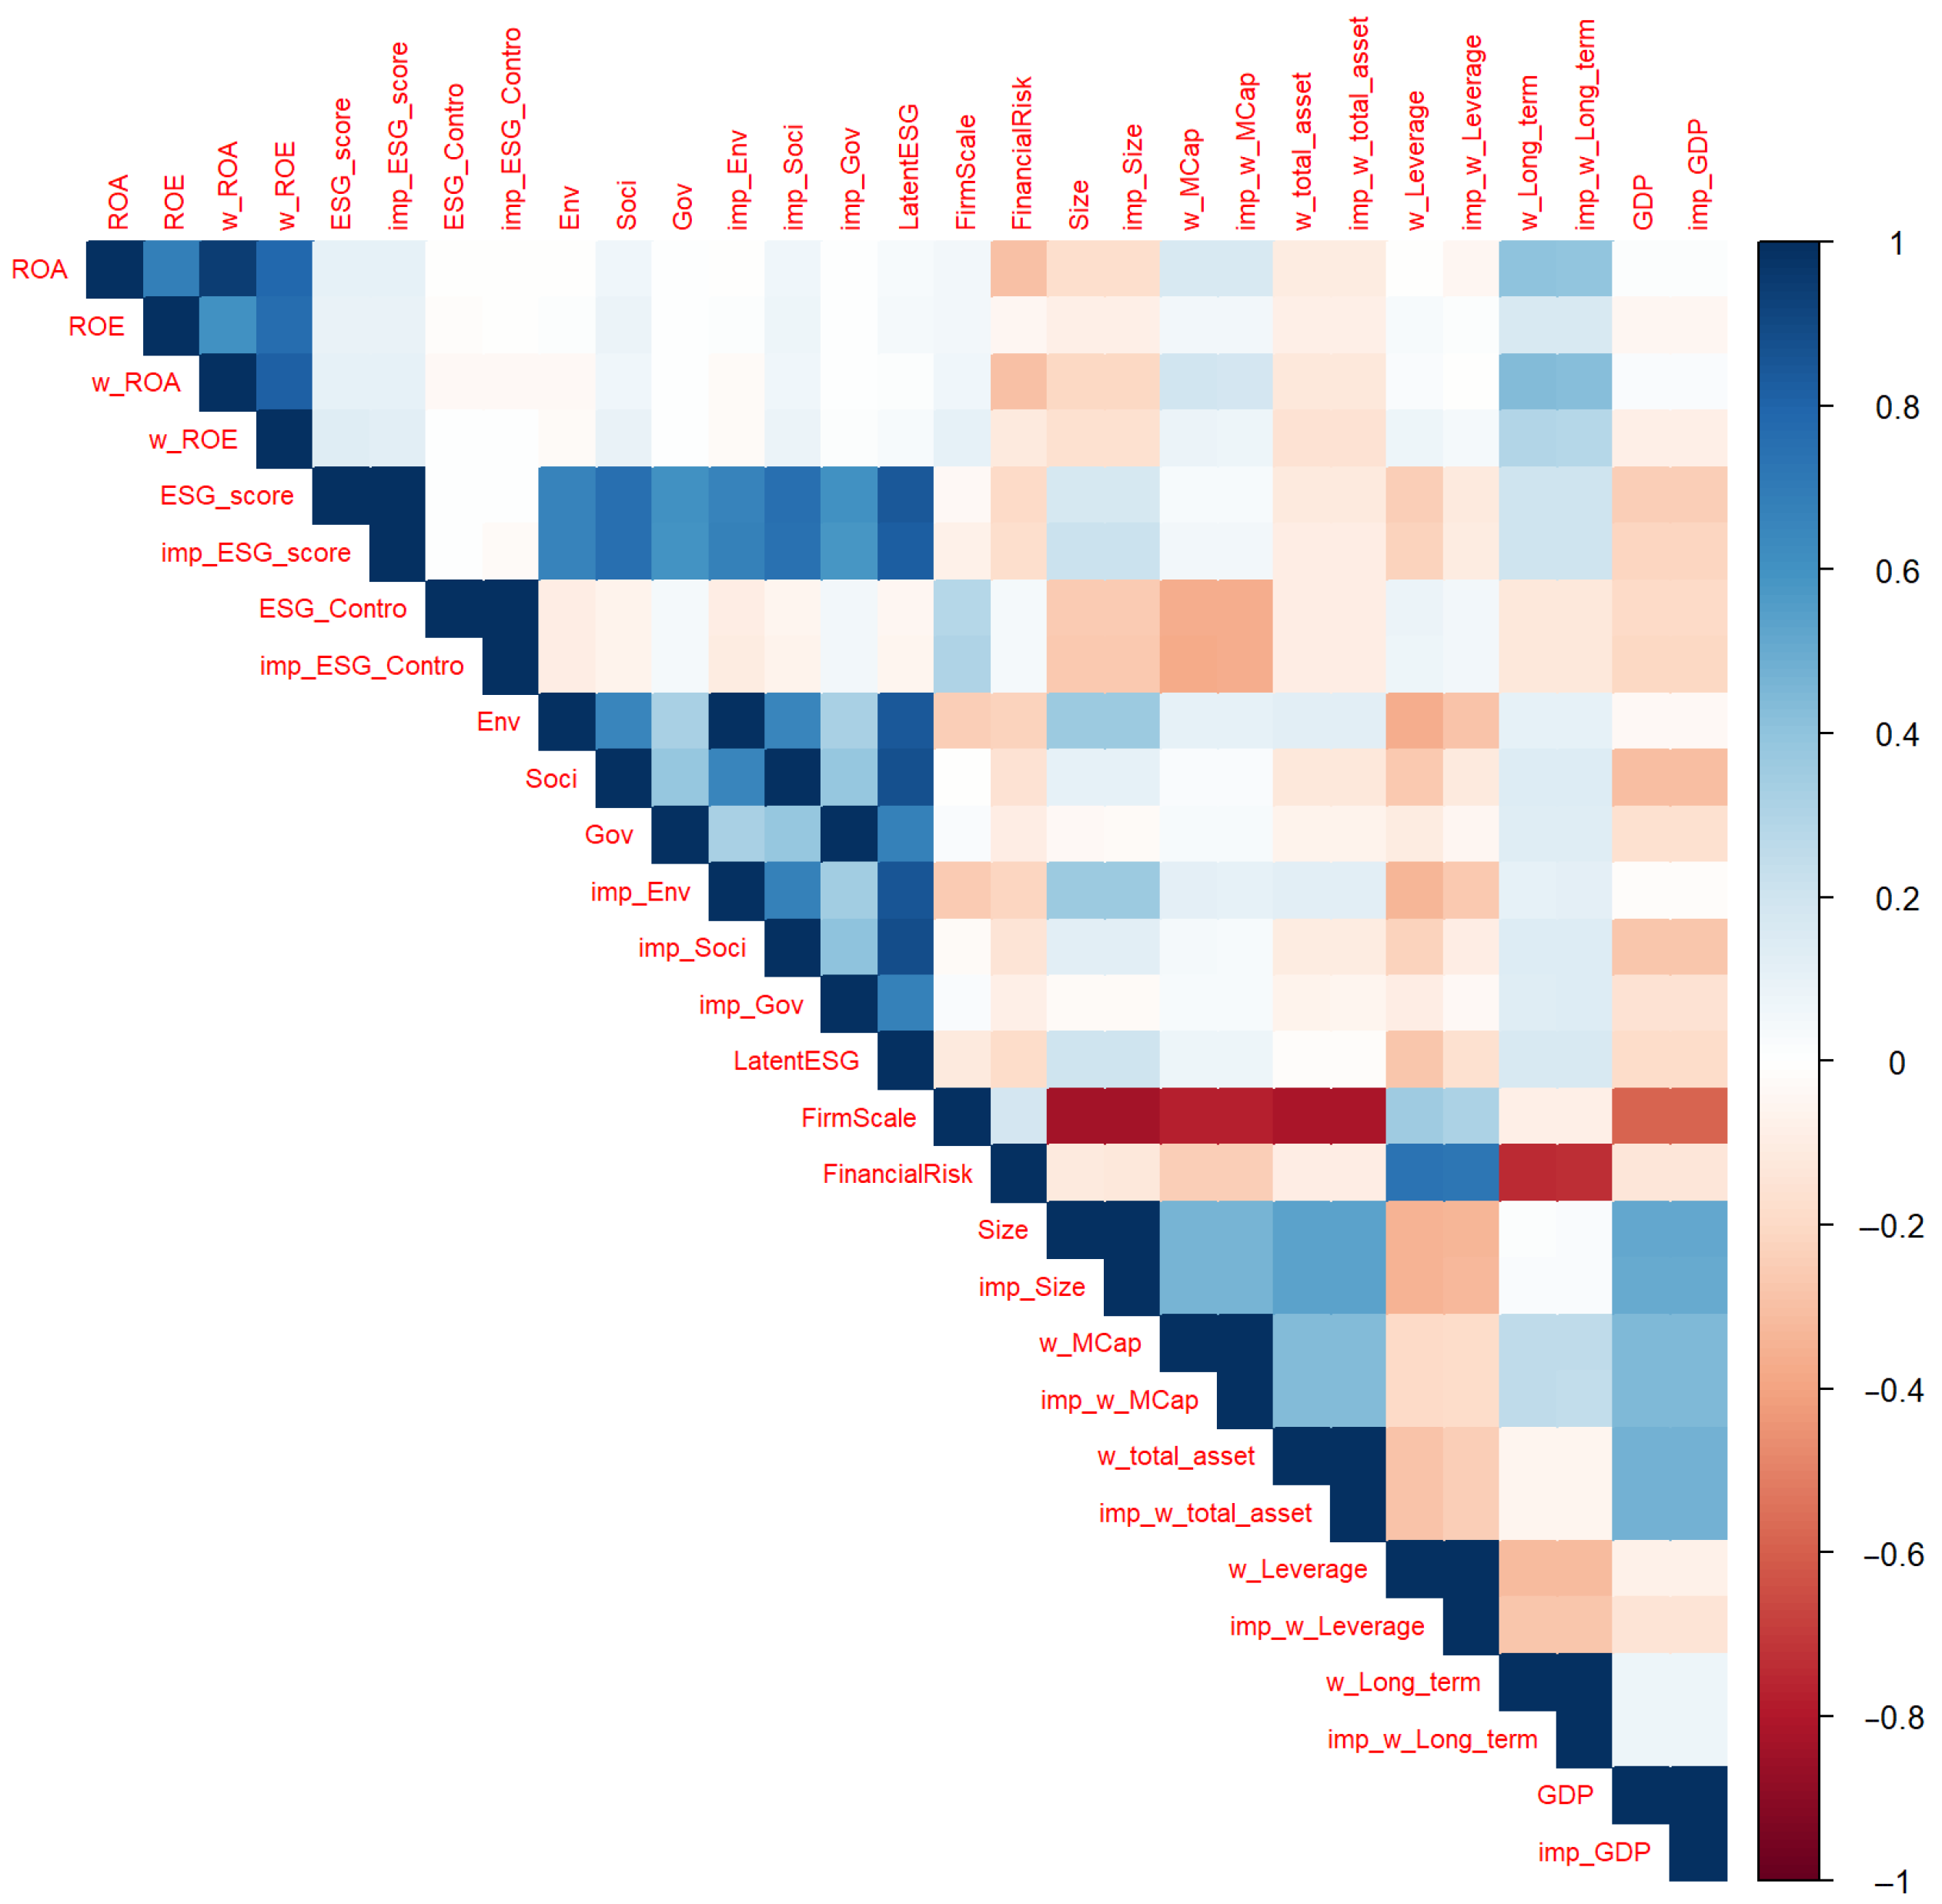

Disclaimer/Publisher’s Note: The statements, opinions and data contained in all publications are solely those of the individual author(s) and contributor(s) and not of MDPI and/or the editor(s). MDPI and/or the editor(s) disclaim responsibility for any injury to people or property resulting from any ideas, methods, instructions or products referred to in the content. |
© 2026 by the authors. Licensee MDPI, Basel, Switzerland. This article is an open access article distributed under the terms and conditions of the Creative Commons Attribution (CC BY) license.