


Abstract
Despite extensive regulatory harmonisation under the European Capital Markets Union (CMU), equity market development in several peripheral EU economies remains critically weak. While institutional infrastructure exists, issuer participation in public markets remains limited. This study aims to determine the capital market potential by assessing issuer-side financial readiness, with a specific focus on Latvia as a representative small EU, bank-dominated capital market. The study adopts a mixed-methods research design. Quantitatively, fuzzy c-means clustering is applied to firm-level financial statement data for 4070 Latvian non-financial companies for the period 2022–2023 to identify latent groups of potential equity issuers based on turnover, EBIT, equity, and employment size. Qualitatively, an expert-peer forum and a PESTEL framework are used to analyse institutional, political, economic, and behavioural barriers to IPO participation. The clustering analysis identifies 49 firms with comparatively strong financial and organisational characteristics consistent with potential issuer readiness; the analysis does not assess their willingness or complete organisational preparedness to undertake an IPO. Despite this latent issuer potential, Latvia recorded only two IPOs in 2024. The results show that Latvia has a critical mass of financially viable potential issuers, while IPO inactivity is driven by several factors. Qualitative findings reveal that issuer participation is constrained primarily by entrenched bank-financing dominance, disclosure aversion, weak political market signalling, low financial literacy, and insufficient market liquidity rather than by a lack of financially capable firms. The findings highlight several policy implications for increasing capital market potential, including targeted support to improve firms’ readiness for public issuance, selective listings of state-owned enterprises to strengthen market signalling, and initiatives to improve financial literacy and enhance equity investment culture.
1. Introduction
A well-functioning capital market plays a central role in economic growth by facilitating efficient resource allocation, risk sharing, and long-term investment financing (Levine, 2005; Rajan & Zingales, 1998). However, despite decades of financial integration efforts within the European Union, the structural depth and efficiency of European capital markets remain markedly below those of global peers such as the United States and China. While the EU accounts for approximately 20% of global GDP, it represents barely 10% of global equity market capitalisation, reflecting a persistent structural gap in market-based financing.
A developed capital market promotes efficient resource allocation, providing an opportunity for companies with high growth potential to attract resources and create added value; allows for attracting long-term capital for the implementation of large projects (for example, infrastructure, production, energy development), as well as promotes the attraction of foreign investment, which in turn supports the development of the country’s economy.
In turn, the Economic Bulletin (ECB, 2025), the Targeted consultation on integration of EU capital markets (EC, 2025) and numerous scholars, such as Arampatzi et al. (Arampatzi et al., 2025) and others, believe that the European capital market is underdeveloped. In addition, liquidity on the European stock market is lower than in other regions (USA, China, Japan), especially in the small- and medium-sized company segment. Public and private bond markets in Europe are also relatively small (130% of GDP in the EU compared to 200% in the US). All of the above affect the financing costs of European companies, as well as the opportunity to expand and develop.
The European capital market landscape is very complex and non-homogeneous, with 22 different stock exchange groups operating 35 different exchanges for listings, 41 exchanges for trading, and nearly 40 different CCPs and CSDs (Wright & Hamre, 2021; AFME, 2025). Moreover, the emerging capital markets in Central and Eastern Europe are, in general, underdeveloped, facing higher economic uncertainty, which slows down the development (Veselinovic, 2009; Draženović & Kusanović, 2016; Gucciardi, 2022). At the same time, these countries have higher development potential, especially for SMEs (Hartwell, 2018). The capital markets in Bulgaria, Lithuania, Slovenia and Latvia are poorly developed. So, while the EU-27 market capitalisation-to-GDP ratio was 47% in 2024, the market capitalisation-to-GDP ratio in these countries is below 10%, with the lowest at 1% in Latvia (World Bank).
Existing Capital Market Union (CMU) research focuses pre-dominantly on regulatory harmonisation, investor protection, post-trade integration, and cross-border capital mobility (Mitra et al., 2019). While these dimensions are essential, they offer only a partial explanation for the persistent equity financing gap in small EU economies. An underexplored but critical dimension is the issuer-side constraint, namely, whether a sufficient pool of financially suitable firms exists that is capable and willing to access public equity markets. It makes assessing capital market potential particularly timely and relevant.
From the perspective of corporate finance theory, the decision to go public reflects a trade-off between information disclosure costs, ownership dilution, financing flexibility, and reputational benefits. According to the pecking order theory, firms prefer internal funds and bank debt before equity issuance; market timing theory further suggests that firms access equity only under favourable valuation conditions (Baker & Wurgler, 2002; Frank & Goyal, 2003; Myers & Majluf, 1984).
The selection of Latvia as the focus of the analysis is particularly relevant given the exceptionally low level of capital market development in the country. Latvia offers an ideal laboratory for examining these dynamics (Briguglio, 1995; Grima et al., 2020). Despite its institutional maturity, Latvia remains one of the weakest equity markets in the EU in terms of issuer participation. Latvian non-financial corporations are characterised by a high dependence on bank financing (88% in 2025). As in other Central and Eastern European countries, such as Slovakia and Bulgaria, external funding from companies is primarily bank loans, whereas the use of capital market instruments is limited. This financing structure indicates the banking sector’s dominant role in the economy and the capital market’s insufficient development. As a result, Latvian companies face greater financial risk and fewer opportunities to secure long-term financing, thereby limiting innovation and the potential for business growth. Such a structure also makes companies sensitive to bank lending cycles and limits access to long-term risk capital.
Prior research by the authors suggests that equity instruments play only a marginal role in corporate financing structures in Latvia compared to neighbouring Baltic countries and EU averages (Kudinska et al., 2024). Against this background, this study introduces and operationalises the concept of capital market potential as an integrated system of issuer potential, investor potential, and infrastructure potential, with a primary focus on the issuer dimension. The issuer potential is formally conceptualised in Section 2.
The development of the Latvian capital market is also an urgent issue in the context of creating the European single capital market (Capital Market Union). The creation and development of the European single capital market is among the EU’s priorities, including in the context of economic security. A previous study conducted by the authors showed that companies in Latvia mainly rely on bank financing, while capital markets play a lesser role (Kudinska et al., 2024). Moreover, analysis of the sources of funding in the total financing structure of Latvian companies shows that companies use capital market instruments (debt securities, shares) less than in other Baltic countries and the EU average.
According to the Signet Bank survey (Signet Bank, 2023), one of the most critical reasons Latvian companies do not take advantage of opportunities to increase capital by attracting funds in the Latvian capital market is a lack of knowledge. As the survey data confirm, only 40% of entrepreneurs in 2023 and 51% in 2024 had heard of the opportunities the capital market offers for attracting company financing. Therefore, one of the main problems of the Latvian capital market is the lack of issuers, which hinders both its further development and integration into the common EU market.
In this paper, we aim to lay out the findings on the capital market potential by assessing the issuer’s potential, focusing on the case of Latvia. Given the particularly small proportion of shares issued within companies’ total financing structures in Latvia (see Figure 1), this study focuses on the capital market potential for share issuers.
Figure 1.
Share of different financing sources in the total financing structure of companies, Q1 2025, percentage. Source: Signet Bank.
The core objective of this paper is therefore twofold:
- To empirically identify the population of Latvian firms that exhibit financial characteristics consistent with financially suitable potential issuers using large-scale firm-level financial data and fuzzy clustering techniques.
- To explain why these firms nevertheless remain absent from the public equity market using an expert-peer forum and a PESTEL-based institutional analysis.
By combining unsupervised machine learning methods with institutional diagnostics, this paper contributes to the capital market development literature in three key ways. First, it shifts analytical focus from market infrastructure to issuer-side financial readiness in small EU economies. Second, it introduces a scalable, data-driven framework for identifying latent IPO potential across large firm populations. Third, it provides policy-relevant insights into why CMU reforms may yield asymmetric outcomes between core and peripheral EU markets.
The remainder of the paper is structured as follows: Section 2 reviews the theoretical and empirical literature on capital market development, capital market potential, and IPO readiness. Section 3 outlines the mixed-methods research design, data construction, variable selection, and fuzzy clustering methodology. Section 4 presents the empirical results, including European and Latvian capital market performance, clustering outcomes, identification of financially suitable potential issuers, and the analysis of institutional and behavioural barriers to issuer participation. Section 5 discusses the findings in the context of IPO-readiness theory, issuer-side coordination failures, and the policy implications of the Capital Markets Union. Section 6 and Section 7 concludes the paper and outlines limitations and directions for future research.
2. Literature Review
Promoting capital market development is a topical issue for many European countries. Therefore, it is crucial to determine the capital market potential. Thereby, the European Securities and Markets Authority (ESMA) points out that prior to policy recommendations, in-depth market research should be conducted: it is necessary to better understand the market structure and potential segments in which the capital market is underdeveloped (ESMA, 2024).
The development and efficiency of capital markets are closely related to macroeconomic stability. The capital market development in Europe is often analysed in relation to the initiative of the European Commission—Capital Markets Union (CMU), which aims to ensure easier access to finance through fully integrated capital markets in Europe (Busch, 2017; Veil et al., 2022). In addition, capital market development is closely related to the availability of investment and, consequently, economic growth (Yıldırım & Yıldırım, 2025).
Closer integration of the European market will reinforce the economic development of European countries, ensuring enhanced capital allocation and systemic risk mitigation (Orlowski, 2020). Furthermore, the integration of European capital markets is expected to enhance market efficiency, thereby contributing to economic growth through increased stock market capitalisation and improved capital mobility (Demertzis et al., 2021; Anderson et al., 2015; Veron & Wolff, 2016). However, due to numerous challenges related to transparency, market fragmentation, regulatory concerns, etc. (Mitra et al., 2019), the European capital market remains only partially integrated, and the capital market potential still receives limited attention.
2.1. Capital Market Development, Financial Systems, and Economic Growth
European financial systems remain structurally bank-dominated. The introduction of the CMU has led firms across most EU Member States to continue relying primarily on credit institutions for external financing. While regulatory fragmentation, post-trade inefficiencies, and legal heterogeneity remain important constraints, recent CMU evaluations emphasise that regulatory convergence alone does not automatically lead to deeper equity participation if issuer-side incentives remain weak.
Central and Eastern European capital markets are particularly affected by path dependence associated with post-transition financial architectures. Historical reliance on relationship banking, underdeveloped institutional investor bases, and low household participation in securities markets combine to suppress both demand and supply of public equity. As a result, market capitalisation-to-GDP ratios in several newer EU Member States remain below 10%, with Latvia at the bottom of the EU ranking at approximately 1% of GDP.
While the vast literature explains capital market underdevelopment through investor protection, legal enforcement, and macroeconomic stability, far less attention has been devoted to the issuer-side capacity to supply equity instruments. This creates a critical analytical gap: even well-designed capital markets cannot function without a sufficient pipeline of financially and strategically prepared firms.
2.2. Conceptualising Capital Market Potential: The Issuer–Investor–Infrastructure Triad
To capture this joint equilibrium, this study conceptualises capital market potential as an integrated system consisting of three interdependent pillars:
- Issuer Potential—the financial capacity and strategic readiness of firms to access public markets;
- Investor Potential—the depth, sophistication, and risk appetite of domestic and foreign investors;
- Infrastructure Potential—the regulatory, legal, technological, and supervisory systems ensuring market integrity and efficiency.
While existing CMU research predominantly focuses on infrastructure and investor participation, in this paper, we place primary analytical emphasis on issuer potential as the binding constraint in small EU markets. Without a critical mass of financially eligible firms, neither investor participation nor infrastructure upgrades can generate sustained market deepening.
Issuer potential in this study is operationalised through a multi-dimensional financial performance profile capturing
- Profitability (ROE, net profit margin);
- Growth capacity (turnover growth);
- Capital structure stability (equity ratio);
- Earnings sustainability (positive net income);
- Organisational scale (employment size).
This framework reflects both valuation requirements and post-listing survival conditions documented in IPO performance literature (see Figure 2).
Figure 2.
Capital market potential. Source: made by the authors.
Investor potential refers to the existence of investors and their willingness to invest their own resources in financial instruments such as shares and bonds. Infrastructure potential is a set of institutional mechanisms that ensure the functioning of the capital market as a whole, creating an attractive environment for issuers and investors and enabling successful operations.
Determining an issuer’s potential is important for assessing how attractive the company is to investors, how reliable it is, and whether it can successfully raise capital by issuing shares or bonds. Thereby, the determination includes both quantitative (financial) and qualitative (strategic and market-based) assessments, and it is very important to understand which specific indicators to consider and evaluate in determining the issuer’s potential. In this study, the authors focus on assessing the financial potential of stock issuers.
A share issue enables a company to address one of its most important tasks: raising capital, thereby obtaining the financial resources for growth and development. Furthermore, by placing shares on the stock exchange, the company strengthens its reputation and receives an objective market assessment of its assets. Lefebvre (2023) shows that the liquidity of a company (especially financially constrained smaller companies) often improves after the initial public offering (IPO) due to the increase in capital through the issue of shares, which increases their inventories-on-sales ratio, accounts receivable-on-sales ratio and operating working capital, which is consistent with the idea that going public relaxes financial constraints and allows firms to adopt more conservative working capital management practices (Lefebvre, 2023).
In the scientific literature, the potential of the capital market is traditionally assessed mainly in relation to the readiness of companies—potential issuers—to implement an initial public offering (IPO). The study complements the existing scientific literature by arguing that for the effective and sustainable development of the capital market, financial readiness of issuers alone is not sufficient. The mutual readiness and interaction of all elements of the capital market ecosystem, characterised by the “Issuer–Investor–Infrastructure Triad” approach, are of essential importance.
2.3. IPO Readiness and Issuer-Side Financial Capacity
The decision to go public represents a fundamental strategic shift in corporate financing and governance. From the perspective of pecking-order theory, firms prefer internal financing first, then bank debt, and use equity only as a last resort due to information asymmetries and ownership dilution. This financing hierarchy is particularly pronounced in bank-centric financial systems, where long-standing credit relationships reduce disclosure costs relative to public markets.
Market timing theory further predicts that firms access equity markets when valuations are favourable, market liquidity is high, and investor sentiment is strong. However, in small and illiquid capital markets, persistent valuation discounts and thin trading severely weaken these incentives (Baker & Wurgler, 2002, 2006).
Empirical IPO literature identifies financial performance as a core determinant of successful public offerings. Profitability, growth, cash flow generation, and capital structure stability consistently predict post-IPO survival and valuation. Prior studies demonstrate that firms with higher return on equity, greater operating margins, positive earnings volatility profiles, and sufficient working capital buffers are significantly more likely to sustain investor demand and aftermarket performance.
At the same time, recent evidence from emerging and small markets highlights that non-financial factors increasingly shape IPO outcomes. Corporate governance quality, disclosure capacity, management professionalism, and institutional visibility all affect investor confidence (Ritter, 1991).
This asymmetric interaction between financial readiness and institutional environment suggests that IPO participation in small markets is not constrained solely by firm-level fundamentals, but by a joint equilibrium between finance, institutions, and behavioural incentives.
To assess financial capacity for an initial public offering, researchers recommend considering several key factors. Yalçın and Ünlü (2018) recommend assessing a company’s potential before an IPO using several indicators, including Accounting-Based Performance (ABP), Value-Based Performance (VBP), and Overall Performance (OP). Yalçın and Ünlü complement the three traditional ABP approaches to evaluating companies in the pre-IPO period: return on assets (ROA), return on sales (ROS), and return on equity (ROE) with the cash flow to total assets (CF/TA) ratio. Other authors also emphasise the importance of the CF/TA ratio in assessing a company’s potential. For example, Kim et al. (2004) emphasise that since operating cash flows (earnings before interest and tax or EBIT + depreciation) constitute a significant component in net present value (NPV) calculations in valuing companies, CF/TA is a convenient alternative measure of operating performance. The second approach is value-based performance measurement (VBP). This method focuses on indicators that reflect the value created for shareholders, such as economic value added (EVA). A comprehensive view of the company’s financial position is provided by combining the ABP and VBP methods. To assess whether an IPO was successful, the authors recommend comparing the indicators calculated before and after the IPO.
On the other hand, analysing 27 companies that entered the capital market in Saudi Arabia in 2021–2022, Mohammed et al. (2025) prove that not only profitability indicators, but also company size and non-financial factors are significant for a company’s initial public offering to be successful.
To conduct an IPO successfully, a company must have high-quality financial statements. Sosnowski (2021) notes that company managers can manipulate announced financial results to achieve a higher stock valuation in an initial public offering. The company must be ready to disclose financial information and offer investors attractive growth and profit prospects. Understanding market trends and investor preferences is significant when preparing for an IPO. Companies with strong market prospects and stable growth are more attractive to public investors. It is important to accurately assess the company’s value and determine its share price to attract enough investors. A good reputation and investor trust are also necessary, as well as the ability to communicate effectively with the market.
The literature review also suggests that there is sufficient research on the development of the capital market, but a research gap exists in assessing its potential. In general, researchers focus on individual indicators, but there is no single, clear set of quantitative and qualitative criteria to assess a company’s potential to issue shares.
2.4. Development of Research Propositions
Given the exploratory and mixed-methods nature of this study, formal statistical hypothesis testing is not pursued. Instead, the study develops empirically grounded research propositions that are subsequently examined through unsupervised clustering of firm-level financial data and qualitative institutional triangulation. This approach is consistent with theory-building and explanatory research designs commonly applied in capital market diagnostics and institutional finance studies (Yin, 2009; Stake, 1995). Propositions served as a conceptual roadmap, allowing identification of the key issues expected to determine the issuer-side potential in the capital market.
Issuer participation in public equity markets depends not only on institutional conditions but also on firm-level financial and organisational capacity. In small, bank-dominated economies, firms must possess sufficient operational profitability, scale, and financial stability to sustain the disclosure, governance, and liquidity requirements associated with public listing. Based on this logic, issuer-side potential in this study is conceptualised as a composite function of absolute financial performance and organisational capacity rather than accounting ratios alone.
P1 (Operating profitability and issuer potential): Firms with stronger operating profitability, as measured by EBIT, exhibit higher issuer-side potential for accessing public equity markets.
P2 (Firm scale and organisational capacity): Firm scale, as measured by turnover and the number of employees, positively moderates issuer-side potential by enhancing administrative capacity, market visibility, and post-listing sustainability.
P3 (Capital base and financial stability): Firms with stronger absolute equity bases exhibit higher issuer-side potential by reducing perceived financial risk and increasing investor confidence. However, financial and organisational readiness alone do not guarantee public market participation. In small EU economies, issuer decisions are deeply influenced by institutional and behavioural constraints, including entrenched bank-financing dominance, disclosure aversion, weak equity culture, and inconsistent political market signalling.
P4 (Institutional and behavioural constraints): Even among financially and organisationally eligible firms, issuer-side participation in public equity markets is significantly constrained by institutional and behavioural factors, including bank-financing dominance, disclosure aversion, weak political market signalling, and limited equity market culture.
Finally, the interaction between issuer readiness, investor participation, and state commitment determines whether capital markets achieve a self-sustaining equilibrium.
P5 (Coordination failure proposition): Capital market underdevelopment in small EU economies reflects a coordination failure between issuer readiness, investor participation, and state-led market signalling, preventing financially eligible firms from entering public equity markets.
3. Methodology
3.1. Research Design
This study adopts a mixed-methods research design that combines large-scale, firm-level quantitative analysis with qualitative institutional diagnostics. The quantitative component identifies latent issuer potential using unsupervised machine learning techniques applied to comprehensive financial statement data. The qualitative component explains persistent non-participation in equity markets through expert-peer forum and PESTEL-based institutional analysis. This dual structure enables the identification of firms exhibiting financial characteristics consistent with potential issuer readiness and provides a contextual interpretation of the institutional and behavioural barriers associated with their non-participation in the public equity market. Figure 3 presents the study’s methodological approach.
Figure 3.
Study’s methodological approach. Source: made by the authors.
In this study, financial issuer readiness refers to the extent to which a firm exhibits financial- and organisational-scale characteristics considered compatible with public-equity issuance. It should not be interpreted as comprehensive IPO readiness. Full IPO readiness would also require evidence of corporate governance, ownership intentions, management willingness, audited-reporting capacity, disclosure systems, legal preparedness, strategic financing needs, and investor demand. Because these dimensions are not observed at the individual-firm level, the quantitative results identify financially suitable potential issuers rather than firms confirmed as ready or willing to undertake an IPO.
The overall methodological process of the study is shown in Figure 4.
Figure 4.
Methodological process of the study. Source: made by the authors.
3.2. Systematic Literature Review Procedure
To establish the conceptual foundations of issuer readiness and capital-market potential, the study incorporated a structured literature-review procedure alongside its empirical components. Relevant publications were identified through searches of the Scopus and Web of Science databases using “capital market” as the principal search term. The search and screening process was organised in accordance with the Preferred Reporting Items for Systematic Reviews and Meta-Analyses (PRISMA) framework to provide a transparent account of study identification, screening, eligibility assessment and inclusion.
The initial searches identified more than 16,550 records in Scopus and 12,970 records in Web of Science. Duplicate records were removed before applying the eligibility criteria. The review was restricted to English-language publications issued between 2004 and 2025. The year 2004 was selected because the enlargement of the European Union substantially changed the institutional and economic context of capital-market development in the new Member States. Applying these criteria reduced the dataset to 12,638 publications.
Conference papers, notes, short surveys and other publications that did not report sufficiently developed research findings were subsequently excluded. The remaining records comprised journal articles, books, book chapters and review articles. Keyword-based exclusions were then applied to remove publications primarily concerned with unrelated topics, including employment, innovation, energy markets, housing markets, labour markets and exchange-rate dynamics. This process reduced the sample to 1259 publications.
The titles and abstracts of the remaining publications were screened manually for direct relevance to capital-market development, issuer readiness and firms’ financing choices. We examined 143 publications in full, of which 41 met the substantive eligibility criteria and informed the literature review. Figure 5 summarises the identification and screening procedure.
Figure 5.
PRISMA Flow Diagram. Source: made by the authors.
In the subsequent assessment of relevance, document types that do not reflect full-fledged scientific research results (e.g., conference papers, notes, short surveys) were excluded from the selection, leaving only scientific publications, books, book chapters, and reviews. In the next stage, keyword filters were applied, excluding publications with keywords that were not relevant to the research topic, for example Employment, Costs, Innovation, Price Dynamics, Exchange Rate, Human, Energy Market, Credit Provisions, Labour Market, Housing Market, and Competition. After this filtering, the selection was narrowed down to 1259 publications. The subsequent selection was conducted manually based on the authors’ judgment. The titles and abstracts of the selected publications were checked to exclude irrelevant publications. Only those publications whose content was directly related to the issues of capital market development were selected. In total, 143 scientific articles were chosen and examined, and 41 met the research objective and were included in the literature review.
3.3. Data Source and Sample Construction
The quantitative analysis is based on financial statement data for the largest Latvian non-financial firms: 4077 companies with the annual turnover exceeding EUR 2.5 million. The sample includes all the largest companies in Latvia, representing various sectors of the economy: manufacturing, trade, logistics, services, construction, energy, and technology sectors. Financial data for two consecutive fiscal years (2022 and 2023) were extracted from firm-level balance sheets and income statements.
During the analysed period, 60.36% of the companies included in the sample showed an increase in business activity and potential for market growth (median value 1.06), including 60 companies (0.15% of the sample) showing a particularly rapid increase in net turnover during the year from 0 EUR in 2022 to more than 2.5 million EUR in 2023. In 2023, the average return on equity (ROE) of the analysed companies was 18.44% (median: 16.94%). At the same time, the ROE indicator shows a large dispersion (minimum value: −25,377.11%, maximum value: 9694.9%), indicating a high heterogeneity in the sample—it includes both companies with critical equity deficits and substantial losses, and companies with high profitability.
The financial performance of the sample shows relative stability; however, in 2023, there was a slight decrease in the share of profitable companies (82.9% of the sample). The number of loss-making companies increased from 553 in 2022 to 692 in 2023. The average equity ratio shows positive dynamics, reaching 0.4854 in 2023. The increase in the median from 0.4964 in 2022 to 0.5401 in 2023 suggests that the majority of the studied companies finance more than half of their assets with equity, which is considered a stable and financially secure indicator in the scientific literature.
The structure of capital raised by enterprises is dominated by short-term loans from credit institutions (in 2023: 1099) and long-term bank loans (727). The corporate bond market is relatively less developed—only a few companies in the entire sample use long-term or short-term bonds as a financing instrument (Figure 6). This justifies banks’ dominance in corporate financing.
Figure 6.
Capital raised by the companies in the sample, 2022–2023. Source: made by the authors.
The study focuses on the analysis of quantitative data due to the unavailability of qualitative data on the companies. The use of a two-year panel structure aligns with international IPO screening standards, which require evidence of profit sustainability, operational stability, and growth continuity. Firms operating in the financial sector were excluded to avoid balance sheet incomparability and regulatory distortions.
3.4. Variable Selection and Data Preparation
The analysis of the scientific literature revealed a lack of criteria for quantitatively assessing issuers’ potential. In response to the identified theoretical justification deficiency, the first phase of the expert-peer forum was conducted to validate issuer potential indicators. Representatives of the financial industry (two investment banks, the Financial Industry Association, the Nasdaq Baltic Stock Exchange), the financial market regulator (the Bank of Latvia) involved in the IPO process were invited to serve as experts. The experts were asked to identify the quantitative indicators proving the issuer potential. As a result of the peer-expert forum discussions and use of PRISMA method (Figure 5), a set of potential criteria and their threshold values was identified:
- ROE—Return on Equity (net profit/average equity) characterises how effectively a company uses the capital invested by shareholders to generate profit; investors perceive ROE as a return signal—the higher the ROE, the more attractive the company; threshold value > 20%;
- Net profit margin ratio (net profit/net turnover) is a strong indicator of the company’s profitability and efficiency; it shows how well the company controls costs, optimises operations and allows for comparison with competitors in the industry; threshold value > 20%;
- Equity ratio (equity/assets) shows the company’s financial stability and the sustainability of the capital structure. For investors, a higher equity ratio means lower financial risk; threshold value > 20%;
- Turnover growth rate shows the development of the company, the ability to potentially increase the market share, to access new markets, and ensure an increase in production and sales volumes; it signals the company’s development and growth; threshold value > 1;
- Net profit shows the company’s ability to invest in development; profit stability and growth are among the most important criteria for investors, because the ability to generate profit is important in the context of dividend payment; threshold value > 0;
- Equity capital shows the company’s financial “safety cushion”; substantial equity capital means greater financial stability and less risk for investors; threshold value > 0;
- The number of employees in the company provides an idea of the scale, capacity and scope of the company; threshold value > 50 people.
To assess the contextual plausibility of the expert-defined threshold values, they were compared with observed admission characteristics and practices in comparable European SME equity markets. Empirical evidence from Nasdaq Baltic listings and EU Growth Market admissions indicates that pre-IPO return on equity commonly exceeds 15–25%, equity ratios typically exceed 20%, and organisational scale rarely falls below 40–60 employees for sustainable post-listing performance. Similarly, EU Growth Prospectus regimes implicitly favour firms with demonstrated profitability, capital adequacy, and sufficient organisational capacity to meet ongoing disclosure obligations. Accordingly, the applied thresholds are broadly consistent with contemporary European SME IPO admission practices and reflect both market-based screening standards and regulatory sustainability requirements.
Issuer potential was operationalised through variables capturing profitability, scale, growth, and capital structure stability. These expert-defined criteria were operationalised as measurable balance sheet and performance variables suitable for quantitative clustering analysis. Following the theoretical framework developed in Section 2, the initial variable pool included
- Turnover;
- EBIT;
- Equity;
- Total assets;
- Net profit;
- Return on equity (ROE);
- Equity ratio;
- Turnover growth rate;
- Number of employees.
All monetary values were expressed in euros. Table 1 presents descriptive statistics for the selected indicators.
Table 1.
Descriptive Statistics of Variables Used in Clustering.
Pairwise correlations were examined to assess the degree of overlap among the candidate variables. Turnover, EBIT, equity and number of employees were retained in the final clustering model. The correlation between EBIT and equity was 0.814, indicating a relatively strong relationship. Nevertheless, both variables were retained because they represent conceptually distinct dimensions of issuer-side financial capacity: EBIT captures current operating profitability, whereas equity represents the accumulated capital base and capacity to absorb financial risk. The remaining pairwise correlations among the four retained variables were below 0.64. As a result, the final clustering feature space retained the following four variables:
- Turnover (2023): firm scale and revenue capacity;
- EBIT (2023): operating profitability;
- Equity (2023): capital structure stability;
- Number of employees (2023): organisational scale.
This reduced vector preserved maximal economic interpretability while minimising statistical overlap.
Table 2 shows that no pairwise correlation exceeded 0.815, indicating the absence of severe multicollinearity and supporting the selection of variables for clustering. Prior to clustering, all variables were standardised into the range using Min–Max normalisation from package:
where denotes the attribute’s and values.
Table 2.
Correlation Matrix.
Normalisation ensures that variables measured on different numerical scales contribute equally to distance calculations. Without standardisation, turnover and equity values would dominate the clustering process because of their larger magnitudes.
3.5. Data Analysis
The quantitative analysis was conducted in four stages. First, descriptive statistics were calculated to examine the distribution, central tendency and dispersion of the candidate financial indicators.
Second, a pairwise correlation matrix was used to identify potentially redundant variables. Where the absolute correlation between two variables exceeded 0.80, the variables were assessed for conceptual and statistical overlap. This procedure resulted in the retention of turnover, EBIT, equity and number of employees as the core clustering variables.
Third, the four retained variables were transformed using min–max normalisation so that differences in measurement scale would not determine the calculated distances. Each observation was transformed to the interval [0,1] using Equation (1). The same transformation parameters were applied consistently throughout the clustering procedure.
Fourth, fuzzy c-means clustering was applied to identify groups of firms with similar financial and organisational characteristics. Unlike hard clustering methods, fuzzy c-means assigns each firm a membership score for every cluster. This was considered appropriate because issuer readiness is gradual rather than dichotomous and firms may exhibit characteristics associated with more than one financial profile.
The fuzzy c-means objective function was minimised iteratively using the Euclidean distance measure, a fuzziness parameter of 1.5 and a convergence tolerance of . Candidate solutions with different numbers of clusters were evaluated using the elbow method and silhouette diagnostics. The four-cluster solution was retained because it offered an appropriate balance between within-cluster compactness, cluster separation and substantive interpretability.
After establishing the clusters, firms within each cluster were evaluated using two dynamic indicators: turnover growth between 2022 and 2023 and the EBIT-to-turnover ratio. A fuzzy equivalence relation was used to calculate each firm’s similarity to the strongest-performing reference firm within its cluster. Firms were then ranked according to their similarity scores. Applying the specified selection rule identified 49 firms with comparatively strong financial and organisational characteristics consistent with issuer readiness. The procedure identifies potential issuer readiness; it does not predict that the selected firms will undertake an IPO.
3.5.1. Quantitative Data Analysis
Firm-level financial data rarely exhibit strict group boundaries. Many firms simultaneously display features of multiple financial profiles. To accommodate this structural ambiguity, this study applies fuzzy c-means (FCM) clustering, which allows each observation to belong to multiple clusters with varying degrees of membership.
Unlike k-means, which imposes rigid classification, FCM better reflects real-world firm heterogeneity and reduces sensitivity to outliers by assigning low membership weights to extreme observations.
The FCM algorithm minimises the following objective function (Bezdek et al., 1984; Grigorenko & Mihailovs, 2022):
where
- = number of firms;
- = number of clusters;
- = membership degree of the firm in cluster ;
- = centroid of cluster ;
- = fuzziness parameter (set to 1.5, the standard empirical value);
- = Euclidean distance.
Cluster centroids are updated iteratively using
Convergence is achieved when the maximum change in the membership matrix falls below 10−5.
The optimal number of clusters was determined using the elbow method, which evaluates the within-cluster sum of squared distances for increasing values of . The inflexion point occurred at four clusters, indicating a balance between model parsimony and information retention. This four-cluster solution was subsequently validated using silhouette width diagnostics, confirming satisfactory separation across financial profiles.
3.5.2. Identification of Financially Suitable Potential Issuers Within Clusters
Following estimation of the fuzzy c-means model, the identification of financially suitable potential issuers proceeded in five stages.
Stage 1: Assignment to a reference cluster. Each firm was assigned to the cluster for which it had the highest fuzzy membership coefficient. The membership coefficients were retained to reflect uncertainty where a firm exhibited characteristics associated with more than one cluster.
Stage 2: Calculation of dynamic financial indicators. For each firm, two supplementary performance measures were calculated:
- Turnover Growth Factor;
- Operating efficiency ratio.
Stage 3: Selection of the reference firm. Within each cluster, the reference firm was the observation exhibiting the strongest joint performance across turnover growth and operating efficiency. The reference firm served as a within-cluster benchmark, not a universal representation of IPO readiness.
Stage 4: Calculation of fuzzy similarity. Each firm’s values of and were compared with those of its cluster reference firm using the fuzzy equivalence relation specified in Equations (4) and (5). This produced a similarity score bounded between 0 and 1, where a higher value indicated greater similarity to the reference firm’s financial-performance profile.
Stage 5: Application of the selection criteria. Firms were classified as financially suitable potential issuers where they: (a) obtained a similarity score of at least 0.8, and (b) satisfied the financial thresholds (see Section 3.2). Application of these rules resulted in the selection of 49 firms across the four clusters.
Across all four clusters, this procedure identified 49 firms exhibiting consistently financially suitable potential issuers.
3.5.3. Qualitative Data Collection and Analysis
In the second phase of the expert interview process, qualitative institutional barriers to market participation were examined. To explain why financially suitable firms remain absent from equity markets, semi-structured interviews were conducted with representatives of
- Investment banks;
- The national stock exchange;
- The Financial Industry Association;
- The central bank.
Interview protocols focused on
- IPO cost structures;
- Disclosure aversion;
- Bank–firm relationship dependencies;
- Investor demand constraints;
- Political commitment to public listings.
Findings were systematically mapped into a PESTEL framework, allowing structured interpretation across political, economic, social, technological, environmental, and legal dimensions.
3.6. Integration of Quantitative and Qualitative Evidence
The quantitative and qualitative components were integrated sequentially during interpretation. The quantitative analysis addressed the first research objective by identifying firms with financial and organisational characteristics consistent with issuer readiness. The qualitative analysis addressed the second objective by examining the institutional and behavioural conditions that may prevent such firms from entering the public equity market. The PESTEL themes were therefore not used as inputs to the clustering algorithm; instead, they provided contextual explanations for the gap between the identified pool of potentially ready firms and the observed level of IPO activity. Convergence between the two components was assessed by comparing the quantitative readiness profiles with the barriers identified by market participants. This sequential explanatory integration enabled us to distinguish financial readiness from firms’ willingness and institutional ability to issue public equity.
3.7. Methodological Validity and Robustness
Several procedures ensure the reliability of the results (Table 3).
Table 3.
Bias mitigation.
The integrated quantitative–qualitative design strengthens the interpretation of the quantitative findings by situating the firm-level financial screening results within Latvia’s institutional environment. Qualitative evidence is used to identify plausible institutional and behavioural explanations for the observed patterns and is not interpreted as establishing causal effects.
4. Research Results
4.1. Determining the Potential of Issuers: Case of Latvia
The objective of clustering was to group companies with similar balance sheet structures over the two years. By identifying clusters of companies with comparable financial profiles, the study aims to uncover patterns and potential segmentation in the Latvian corporate landscape based on financial stability and structure.
Following data preparation, clustering was performed to identify groups of companies with similar financial structures. The elbow method was implemented to determine the optimal number of clusters. The results indicated that four clusters were appropriate for this dataset (Figure 7).
Figure 7.
Cluster creation. Source: made by the authors.
To achieve this, the fuzzy c-means (FCM) clustering algorithm was applied. This soft clustering approach is especially well-suited for financial data, where companies may exhibit mixed characteristics and not fit neatly into a single category. A key advantage of fuzzy c-means over k-means is its reduced sensitivity to outliers. In k-means, even a small number of outliers can significantly shift the cluster centres, potentially distorting the entire cluster structure. In contrast, fuzzy c-means assigns lower membership values to outliers, preventing them from disproportionately influencing the location of cluster centroids. This property makes fuzzy c-means particularly robust and effective when working with real-world (non-simulated) datasets, which typically contain noise and irregularities. Another significant advantage is that fuzzy c-means performs well in scenarios where clusters lack strict boundaries or are not clearly separated. In financial data, this situation is common—companies may share similar attributes across clusters without fitting into a single cluster. In the next figure, the distribution of observations across the four clusters is shown for each pair of features.
Another significant advantage is that fuzzy c-means performs well in scenarios where clusters lack strict boundaries or are not clearly separated. In financial data, this situation is common—companies may share similar attributes across clusters without fitting into a single cluster. In Figure 8, the distribution of observations across the four clusters is shown for each pair of features.
Figure 8.
Distribution of observations across the four clusters.
4.2. Cluster Validation Statistics
The number of clusters was determined by combining the elbow criterion with several internal cluster-validation measures. The elbow analysis indicated a marked flattening of the within-cluster dispersion curve at , suggesting that additional clusters beyond four provide limited gains in compactness.
To evaluate the robustness of this choice, FCM solutions for were compared using the average silhouette coefficient, the Fuzzy Partition Coefficient (FPC), Partition Entropy (PE), and the Xie–Beni (XB) index. The numerical validity indices attain their most favourable values for the two-cluster solution, reflecting a broad division of the sample into highly aggregated firm groups. However, such a specification provides limited differentiation between economically distinct corporate profiles.
Importantly, the validation statistics remain strong for the four-cluster solution (Table 4). The average silhouette coefficient is , indicating substantial separation between dominant cluster assignments, while the FPC of indicates a high degree of membership concentration. Partition Entropy remains low at , suggesting limited ambiguity in fuzzy assignments, and the Xie–Beni index is .
Table 4.
Internal validation statistics for alternative fuzzy c-means solutions.
Moreover, the deterioration in cluster quality from three to four clusters is relatively limited, whereas a pronounced decline occurs when moving from four to five clusters. The silhouette coefficient decreases from to , Partition Entropy increases from to , and the Xie–Beni index increases from to . This indicates that partitioning the sample into more than four clusters introduces substantially greater overlap and weaker separation.
Accordingly, the four-cluster specification was retained as a compromise between statistical validity, model parsimony, and economic interpretability. Unlike the two- and three-cluster solutions, the four-cluster specification identifies four substantively distinct corporate profiles while avoiding the substantial deterioration in cluster quality observed when five or more clusters are introduced.
4.3. Clustering Results: Identification of Firm Typologies
The final fuzzy c-means model was estimated using four min–max-normalised variables: turnover, EBIT, equity and number of employees. The analysis produced a four-cluster solution representing substantively different financial and organisational profiles. Table 5 summarises the descriptive characteristics of the resulting cluster centroids.
Table 5.
Cluster Centroid Profiles (Standardised Values).
Cluster 0—Small but stable firms (n = 370): These firms have modest scale, but many display operating profitability. They are less likely to be financially suitable potential issuers due to limited organisational capacity to meet public-company obligations, supporting P2, which predicts that size moderates.
Cluster 1—Large, high-performance firms (n = 15): These firms demonstrate very high turnover, equity, and EBIT, consistent with large established corporations. Their financial volatility is also higher, reflecting more dynamic operational structures. This group naturally represents the strongest candidates for large-scale IPOs or secondary listings, aligning with P1 and P2.
Cluster 2—Small firms with weak capital structure (n = 1985): The largest cluster consists of firms with low turnover, weak EBIT margins, and thin equity buffers. These firms are the least likely to pursue IPOs under any regulatory regime.
Cluster 3—Medium-sized, financially stable firms (n = 72): Characterised by moderate turnover, stable equity ratios, and positive EBIT, these firms display clear operational maturity. Although smaller than Cluster 1 firms, they exhibit strong structural characteristics for SME-focused IPOs, particularly under the EU Growth Prospectus regime.
These results are associated with substantial heterogeneity in the Latvian corporate landscape and support the prepositions that a non-trivial share of firms exhibit sound financial fundamentals despite weak national IPO activity.
Following the clustering process, further analysis was conducted within each cluster. Each cluster consists of Latvian companies exhibiting similar financial patterns. The first cluster contains 15 larger Latvian companies, respectively, these companies have higher turnover, equity, EBIT ratio, but also have higher volatility of the mentioned indicators; the second cluster contains 1985 Latvian companies with lower turnover, equity, EBIT ratio, but also have lower volatility of the mentioned indicators, similar indicators in their cluster were also shown by companies in the zero (370 companies) and third (72 companies) clusters. Since each cluster consists of Latvian companies exhibiting similar financial patterns, it was reasonable to assume that companies within the same cluster could demonstrate comparable future behaviour. This assumption enabled more targeted, contextually meaningful analysis within relatively homogeneous groups. Within each cluster, authors focused on identifying the companies with the highest potential to go public. For each company, a growth factor was calculated by dividing 2023 turnover by 2022 turnover and using the EBIT-to-turnover ratio.
Using these two parameters, the authors constructed a similarity relation to compare each company with the best-performing one in its cluster. To measure similarity between companies, fuzzy equivalence relations were employed—a class of fuzzy relations that are reflexive, symmetric, and transitive (Jelinska & Grigorenko, 2024). These properties ensure that the similarity measure is both consistent and logically structured, enabling the identification of groups of companies that are mutually and meaningfully similar. By applying fuzzy equivalence relations, the authors calculated the degree to which each company is similar to the best one with respect to the growth factor and the EBIT-to-turnover ratio. Based on these degrees, all companies were ranked in the cluster, with higher degrees indicating a higher likelihood that the company is suitable for an IPO. As a result, the authors have selected 49 companies across all clusters with the highest potential to issue shares.
Within each cluster, issuer potential was assessed using
- Turnover growth rate (2023 vs. 2022);
- EBIT-to-turnover efficiency ratio;
- Fuzzy equivalence similarity to cluster benchmark firms.
This methodology allows the identification of firms that most closely resemble the optimal issuer profile within each cluster.
4.4. Key Finding
Across the four clusters, 49 firms (approximately 1.2% of the total sample) exhibited financial and organisational-scale characteristics that satisfied the study’s criteria for potential issuer suitability. This classification reflects financial screening and does not establish complete IPO readiness or willingness to list.
These firms share the following attributes:
- Consistent profitability (positive EBIT, ROE > 20% for many cases);
- Positive turnover growth (g > 1);
- Stable or increasing equity base;
- Organisational scale sufficient to meet disclosure burdens (usually >50 employees);
- Low financial risk (high equity-to-assets ratios),
This finding is particularly significant because it empirically helps to show that Latvia has a sufficient pipeline of potential issuers, contradicting the widespread perception that the corporate sector is inherently too small or too weak to support public markets.
4.5. Cluster-by-Cluster Potential Ranking
Cluster 1 (Large firms): All 15 firms exceed the financial thresholds for issuer potential. However, the expert-peer forum interviews indicate that these firms typically avoid IPOs due to fear of disclosure, control dilution, and existing long-term relationships with banks supporting P3.
Cluster 3 (Mid-sized firms): Approximately 24 firms (33%) display strong fundamentals. These firms represent the highest-impact short-term IPO candidates, particularly under SME listing regimes.
Cluster 0 (Small but stable firms): About 10 firms (2.7%) exhibit strong financial growth and stable profitability. While they may not support a regulated-market IPO, they are suitable for alternative markets with lighter regulatory burdens.
Cluster 2 (Weak financial structure): Only a very small fraction (approx. 0.25%) meets any IPO readiness criteria.
Although sectoral segmentation is limited by the data provided, expert interviews and known market structure strongly suggest that identification of financially suitable potential issuers firms are concentrated in
- Manufacturing and industrial production;
- Wholesale and logistics;
- ICT and technology-oriented services;
- Energy and utilities;
- Food and beverage producers.
These sectors align with industries that historically produce IPO candidates due to
- Predictable cash flows
- Tangible asset bases (supporting valuations)
- Higher scalability potential
4.6. Robustness of Clustering and IPO-Potential Classification
Several robustness indicators were used:
- Silhouette scores support the four-cluster configuration, providing meaningful separation.
- Membership distribution matrices showed consistent internal cohesion within Clusters 1 and 3.
- Alternative threshold sensitivity tests (10%, 15%, 25% ROE thresholds) changed the number of qualifying firms only marginally, suggesting stability.
- Cross-year volatility checks (2022 vs. 2023) support persistent profitability among identified high-potential issuers, supporting P1.
These indicators suggest that the clustering solution is statistically stable, economically interpretable, and robust to parameter changes.
4.7. Institutional Barriers and the Issuer Participation Gap
Building on the issuer-side financial evidence presented in Section 4.3, Section 4.4, Section 4.5 and Section 4.6, this section explains why IPO participation remains weak despite the existence of financially capable firms. Despite the identification of 49 financially suitable potential issuers, Latvia recorded only 2 IPOs in 2024, reinforcing a substantial issuer participation gap.
The question arises: why are there no new players in the Latvian capital market, and what factors hinder the entry of new issuers into the market, given their existing/estimated potential?
To answer this question, the authors have used a PESTEL analysis, which allows us to examine the problem from the perspectives of various external and internal qualitative factors, and have also conducted expert semi-structured interviews.
Expert interviews and PESTEL analysis reveal several binding constraints:
- Political reluctance to list state-owned companies (supports P4)
- Dominance of bank financing discourages public equity (supports P3)
- Low financial literacy and weak share culture among entrepreneurs and households
- High perceived administrative and disclosure burdens
- Low market liquidity, creating a self-reinforcing coordination failure
These findings substantiate P3 and P4: issuer-side participation is structurally inhibited by institutional and behavioural factors rather than firm-level financial weakness.
The results of the cluster analysis indicate that 49 companies exhibit strong issuer potential within the Latvian corporate sector. When assessing political factors, it is worth noting that the Latvian government has recognised the importance of the capital market, developing several strategies and programs. Despite the commitment expressed by several governments to develop the capital market, actual action is often delayed or not taken at all. The development of the capital market in Latvia needs a push, and such a push can be the listing of state and municipal capital companies on the stock exchange, which can positively influence the decisions of other potential issuers in favour of the capital market. Although developed programs provide for the listing of state and municipal capital companies on the stock exchange, real progress in this area has been limited. The 2025 Latvian Capital Market Forum concluded that significant progress had not been made and that government officials’ interest in developing the capital market was limited.
The main economic factor that significantly affects issuers’ potential is that non-financial companies in Latvia mainly rely on bank financing. Attracting financing through a bank is faster and cheaper according to entrepreneurs. Several surveys of issuers and potential issuers have mentioned high costs associated with the issuance process. However, CFLA financing is available, which reimburses 50% of the costs for investment banks, consultants, and lawyers and partly for marketing (IPO support up to EUR 200,000; bond support up to EUR 120,000). When assessing social aspects, it is necessary to note that the capital market in Latvia began to develop only in the 1990s, and society’s attitudes, behaviours, and actions in the capital market have not yet developed. Financial literacy is one of the most significant problems in Latvia. According to OECD estimates, the average financial literacy index for adults in Latvia is 60 out of 100, which is lower than the OECD average (OECD, 2023). Particularly low results were obtained in relation to long-term investments and investments. Results from several surveys show that a large proportion of entrepreneurs are unaware of, or do not consider, capital market opportunities. In total, 83% of Latvian entrepreneurs are currently not considering using capital market opportunities to meet their company’s needs (OECD, 2023). Therefore, it is essential to support national-level educational programs for entrepreneurs in financial management and investment attraction, as well as to strengthen financial literacy development in educational institutions.
Another important aspect concerns information disclosure. By attracting financing through the capital markets, a company changes its status to that of a public company. The obligation of a public company is to disclose information to investors about significant events and regularly provide financial reports on operating results, which greatly worries and scares company owners and managers. It is necessary to popularise the advantages of public joint-stock companies in the mass media using positive examples. Currently, intensive discussions and negotiations are taking place in the EU in the context of the CMU, and based on the EU guidelines, harmonisation processes are underway in each member state. All of the above slow down the development of the capital market.
4.8. Synthesis of Key Empirical Insights
- The Latvian market does contain a critical mass of firms that are financially and operationally capable of going public.
- These firms are primarily medium and large companies with stable profitability and growth.
- The combined evidence suggests that institutional and behavioural conditions may be more important explanations of IPO inactivity than an absence of firms with suitable financial characteristics.
The findings highlight a structural coordination failure, where issuers wait for political leadership and market liquidity, while policymakers expect issuers to take the initiative.
- These dynamics mirror IPO challenges in other small EU capital markets, implying broader CMU policy relevance.
4.9. Empirical Validation of Research Propositions Through Clustering and Qualitative Triangulation
This section evaluates the empirical support for the five research propositions using a combination of quantitative clustering results and qualitative institutional diagnostics. Rather than formal statistical hypothesis testing, validation is achieved through convergence between firm-level financial typologies derived from fuzzy c-means clustering and expert-based institutional evidence. This triangulation-based validation approach is consistent with mixed-method research designs applied in capital market and institutional finance studies.
P1—Operating Profitability and Issuer Potential: Results suggest that firms with higher operating profitability, as measured by EBIT, exhibit significantly greater issuer-side potential to access public equity markets. The clustering results show that firms in Clusters 1 (large, high-performance firms) and 3 (medium-sized, financially stable firms) exhibit consistently higher EBIT values than those in Clusters 0 and 2. These two clusters account for the vast majority of identified financially suitable potential issuers. Among the 49 high-potential issuers, virtually all exhibit strong positive operating profits, supporting the research proposition that operating profitability is a fundamental condition of issuer-side potential.
P2—Firm Scale and Organisational Capacity: Results suggest that firms’ scale, as measured by turnover and number of employees, positively moderates issuer-side potential by enhancing administrative capacity, market visibility, and post-listing sustainability. Clusters 1 (15 firms) and 3 (72 firms) exhibit materially higher turnover and larger employment structures than Clusters 0 and 2. Most identified financially suitable potential issuers are concentrated in these two clusters, while small firms in Cluster 2 are almost entirely excluded from the issuer-ready pool. This is associated with the decisive role of firm scale in determining issuer-side feasibility in a small capital market.
P3—Capital Base and Financial Stability: Results suggest that Firms with a stronger absolute equity base exhibit higher issuer-side potential by reducing perceived financial risk and increasing investor confidence. Firms in Clusters 1 and 3 display significantly stronger absolute equity positions than those in Clusters 0 and 2. The financially suitable potential issuers subset is almost entirely drawn from firms with high equity balances, confirming that capital base strength plays a critical stabilising role in issuer readiness from an investor-risk perspective.
P4—Institutional and Behavioural Constraints: Results suggest that even among financially and organisationally eligible firms, issuer-side participation in public equity markets is significantly constrained by institutional and behavioural factors, including bank-financing dominance, disclosure aversion, weak political market signalling, and limited equity market culture. Despite identifying 49 financially and organisationally eligible firms, only two Latvian IPOs occurred in 2024, revealing a severe issuer-participation gap. Expert interviews and the PESTEL analysis consistently identify bank-financing dominance, disclosure aversion, low financial literacy, weak equity culture, and limited political leadership as the dominant constraints on IPO participation. These qualitative findings directly corroborate P4.
P5—Coordination Failure Propositions: Results suggest that capital market underdevelopment in small EU economies reflects a coordination failure between issuer readiness, investor participation, and state-led market signalling. The Latvian capital market exhibits all structural features of a coordination failure:
- Issuers delay market entry due to persistent liquidity uncertainty;
- Investors remain passive due to limited issuer pipelines;
- State authorities hesitate to initiate large-scale benchmark listings.
This mutually reinforcing inertia explains the persistent stagnation of IPO activity despite the existence of financially capable firms, supporting the coordination-failure mechanism.
As a result of cluster analysis, the study identifies groups of companies according to their internal financial potential, while the results of PESTEL analysis help to determine macro-environmental factors that can promote or limit the growth of companies in a given cluster, attract investment and use capital market instruments. Expert assessments, in turn, provide methodological validation by allowing interpretation of quantitative results and identification of aspects that statistical indicators cannot fully capture. Experts link companies’ institutional readiness to become issuers to management quality, financial transparency, strategic development potential, investor interest, and other qualitative factors. Thus, expert assessments serve as a tool for interpreting clustering results and testing their practical significance. Integrating these methods allows assessment of issuers’ potential not only based on current economic and financial indicators, but also on development opportunities, external environmental conditions, and qualitative prerequisites for attracting capital market financing identified by experts.
The identified institutional barriers (especially reluctance to disclose information and the dominance of traditional bank financing) influence the decisions of the 49 companies that are fully ready for IPO according to financial indicators. This synthesis shows the discrepancy between financial readiness and actual readiness to enter the stock exchange, which is associated with institutional factors.
5. Discussion
5.1. Reinterpreting Capital Market Underdevelopment Through the Issuer-Side Lens
In analysing the literature, the authors noted disagreements over the criteria for evaluating potential issuers. Thus, Mohammed (Mohammed et al., 2025), Rathnayake (Rathnayake et al., 2022) and others believe that the size of the company is an essential prerequisite for a successful initial public offering of a company. The authors agree that a tiny company, with fewer than 50 employees and a turnover of less than 20 million, is unlikely to be able to provide sufficient administrative resources to prepare and service a public issue, as well as to provide investors with an appropriate financial return. However, size is certainly not a determining factor in starting to sell shares on the stock exchange. One direction for promoting the European capital market is to make public markets more attractive to small companies. Thus, European Regulation (EU) 2024/2809 (EU, 2024) provides for simplified prospectus and information disclosure requirements for SMEs in the IPO and post-IPO stages, supports an EU Growth Prospectus regime for SMEs with reduced information requirements compared to a full prospectus, etc. In Latvia, medium-sized companies constitute the greater potential of the capital market.
The authors agree with Chemmanur and Nandy (2008): large companies have greater potential to go public, and large turnovers facilitate liquidity provision and investor interest. As a result, the path to the stock exchange for a small company is possible, but companies choose it much less often.
This study set out to investigate whether the persistent weakness of the Latvian capital market and, by extension, that of several peripheral EU economies can be attributed solely to structural and regulatory deficiencies or whether issuer-side financial readiness constitutes an equally binding constraint. The empirical evidence strongly supports the latter interpretation.
The identification of a group of firms with comparatively strong financial characteristics suggests that weak corporate fundamentals alone are unlikely to provide a complete explanation for capital-market stagnation in Latvia. Instead, it reveals a systemic participation gap: financially eligible firms exist, but they do not enter the market.
This result reframes capital-market underdevelopment as an issuer-side coordination failure rather than a purely regulatory or infrastructural shortcoming. Even where listing venues, regulatory frameworks, and partial cost subsidies exist, rational firms may still avoid public issuance if liquidity expectations, disclosure costs, and institutional credibility remain insufficient.
Moreover, the results indicate that weak firm fundamentals alone may not adequately explain capital-market underdevelopment in Latvia. Instead, it reflects a systemic participation gap between financially capable firms and the public equity market.
5.2. Implications for IPO Readiness Theory in Bank-Dominated Systems
The findings provide support for Hypotheses P1 and P2, showing that profitability, equity strength, growth capacity, and organisational scale jointly determine issuer potential. However, the Latvian case also highlights the limitations of conventional IPO-readiness models, which implicitly assume market-based financial systems.
In bank-dominated systems, pecking order theory becomes path-dependent: firms that establish stable credit relationships early in their lifecycle develop a long-term preference for debt over equity. This preference persists even when firms become financially able to access capital markets. The Latvian evidence shows that financial readiness is a necessary but not sufficient condition for IPO participation.
This insight extends IPO theory by demonstrating that
- IPO timing is not driven purely by valuation opportunities or growth needs;
- But is structurally conditioned by the financial architecture of the economy;
- And reinforced by institutional lock-in mechanisms.
5.3. Institutional Barriers and Behavioural Frictions
Confirmation is also found for Hypotheses P3 and P4, which posit that institutional and behavioural barriers suppress issuer participation. The qualitative findings identify four dominant frictions:
- Bank Financing Dominance: Bank credit remains cheaper, faster, and culturally embedded, weakening incentives to pursue equity.
- Disclosure Aversion and Control Retention: Entrepreneurs perceive IPOs as a loss of strategic autonomy rather than a growth instrument.
- Weak Political Market Signalling: The absence of large-scale state-owned enterprise listings undermines confidence in market longevity.
- Low Financial Literacy and Equity Culture: Firms remain uncertain about valuation, investor relations, and post-IPO governance.
Together, these factors create a self-reinforcing low-equilibrium trap: the absence of issuers limits liquidity, and low liquidity discourages new issuers. This mechanism closely resembles coordination failure models observed in other small financial markets.
5.4. Reassessing the Capital Markets Union (CMU) from a Peripheral Economy Perspective
While the CMU reforms have focused extensively on prospectus simplification, supervisory convergence, and cross-border investment flows, this study shows that issuer-side capacity remains structurally under-addressed.
In peripheral EU markets,
- Regulatory streamlining does not automatically alter risk perceptions.
- Cost subsidies alone do not offset long-term control and disclosure fears.
- Investor integration cannot occur without issuer activation.
This suggests that CMU effectiveness is constrained not by insufficient legal harmonisation, but by asymmetric institutional readiness across Member States. Without targeted issuer-side activation policies, CMU risks reinforcing a two-speed capital market within the EU.
5.5. Issuer-Side Financial Capacity as a Necessary but Insufficient Condition (P1–P3)
The empirical results suggest that issuer-side potential in Latvia is fundamentally conditioned by operating profitability (P1), firm scale (P2), and absolute capital strength (P3). Firms exhibiting strong EBIT, substantial turnover, larger employee bases, and sizeable equity balances dominate the pool of financially suitable potential issuers. This aligns closely with empirical IPO literature emphasising the importance of scale and operating performance for sustaining post-listing obligations and liquidity formation.
However, the presence of 49 financially and organisationally capable firms alongside only two IPOs in 2024 demonstrates that financial readiness alone is insufficient to generate issuer participation. This supports the research proposition that traditional IPO-readiness models, which implicitly assume market-based financial systems, have limited explanatory power in bank-dominated economies.
5.6. Institutional and Behavioural Barriers as Binding Constraints (P4)
The evidence relating to P4 suggests that Latvia’s capital-market stagnation is associated not only with firm-level characteristics but also with substantial institutional and behavioural frictions. This suggests the bank-dominance constraint identified in Section 4.9. Thus, even financially and organisationally eligible firms rationally avoid IPOs under existing institutional conditions.
5.7. Capital Market Stagnation as a Coordination Failure (P5)
The empirical results strongly support the coordination-failure interpretation of capital-market underdevelopment in small EU economies. Issuers delay market entry due to low liquidity expectations; investors remain passive amid a limited issuer pipeline; and policymakers hesitate to intervene decisively amid uncertainty over market reception. This three-sided coordination failure produces a structurally stable low-liquidity equilibrium.
In this setting, regulatory harmonisation under the CMU, even when successful, cannot by itself overcome the equilibrium trap without targeted issuer activation mechanisms and credible state-led market signalling.
5.8. Implications for the Capital Markets Union
The results indicate that CMU reforms risk reinforcing a two-speed European capital market, where large core economies benefit from deeper integration while peripheral markets remain structurally constrained. In small EU economies, issuer-side activation must complement regulatory streamlining. Without targeted policies addressing behavioural and institutional barriers, CMU objectives of equity-based investment financing will remain unevenly distributed across Member States.
6. Conclusions
The analysis identifies 49 Latvian firms with financial and organisational-scale characteristics consistent with potential issuer suitability. This finding provides evidence of latent financial capacity within the corporate sector, but it does not establish that these firms are fully prepared or willing to undertake an IPO. Comprehensive readiness also depends on governance arrangements, ownership intentions, management commitment, disclosure capacity, strategic financing needs and prevailing market conditions. The qualitative evidence suggests that bank-financing dependence, disclosure concerns, limited equity-market experience, weak political signalling and low market liquidity may help explain the gap between financial suitability and observed IPO activity. Given the study’s exploratory, single-country design, these factors should be interpreted as plausible and mutually reinforcing explanations rather than as causally identified determinants.
The results are based on an analysis of the Latvian capital market and its infrastructure and cannot be generalised for all European countries. Nevertheless, the identified barriers and policy implications may be relevant for other Central and Eastern European countries with similar financial structures.
Based directly on the results of the study, several policy implications follow:
- Issuer Activation Policies: Financial readiness alone is insufficient; targeted IP education, governance support, and disclosure coaching are essential.
- Bank-to-Market Transition Mechanisms: Hybrid instruments (convertibles, pre-IPO placements) can gradually shift firms from debt to equity reliance.
- State-Led Benchmark Listings: Under appropriate investor conditions, selective public listings of state-owned enterprises may provide catalytic market signalling.
- Financial Literacy and Equity Culture: Long-term investment in investor and entrepreneurial education is necessary for changing behavioural equilibria.
The study makes three principal contributions:
- Theoretical Contribution: It indicates that capital market underdevelopment may result as an issuer-side coordination failure rather than a purely regulatory insufficiency.
- Methodological Contribution: It introduces a scalable, data-driven screening framework for identifying firms that warrant further assessment as potential public-equity issuers.
- Policy Contribution: It suggests that CMU effectiveness in peripheral economies depends critically on issuer activation rather than solely on legal harmonisation.
7. Limitations
Several limitations should be acknowledged. First, the analysis relies on two years of financial data, which captures short-term readiness but not long-cycle investment dynamics. Second, confidential firm-level ownership structures could not be incorporated. Third, sectoral segmentation remains constrained by data availability.
Moreover, this study identifies latent issuer potential based on observed firm-level financial strength and operational scale; however, several endogeneity and selection-related limitations must be acknowledged. First, reverse causality cannot be entirely excluded: firms that deliberately avoid public markets may pursue conservative financing strategies, rely more heavily on retained earnings and long-term bank credit, and therefore appear financially stronger within privately held corporate structures. In this sense, financial strength may be both a cause and a consequence of remaining outside public equity markets.
Second, Latvia’s bank-dominated financial architecture may generate long-term bank–firm lock-in effects, whereby stable credit relationships reduce firms’ incentives to transition to equity financing even when financially capable. Such path dependence can structurally bias observed financial performance in favour of debt-financed growth models.
Third, the sample construction relies on a turnover threshold exceeding EUR 2.5 million, which may introduce survivorship and size-selection bias by excluding smaller, younger, or high-risk firms that could otherwise transition into public markets over longer time horizons. While this threshold enhances financial comparability and IPO screening relevance, it necessarily limits inference about early-stage or micro-enterprise issuers.
In addition, the study has limitations associated with its single-country research design.
These limitations do not invalidate the issuer-side coordination failure identified in the study but indicate that future research should incorporate dynamic panel methods, ownership structures, and financing pathway transitions to more fully disentangle financial readiness from institutional lock-in.
These limitations provide direction for future research. In fact, we suggest that future studies should:
- Extend issuer potential analysis across multiple small EU economies for comparative inference;
- Integrate ownership, export orientation, and productivity measures;
- Model dynamic transitions from debt-to-equity financing;
- Evaluate post-IPO performance of newly listed Baltic firms.
Finally, the classification of the 49 firms is based primarily on observable financial performance and organisational scale. The available data do not permit firm-level assessment of governance quality, ownership intentions, management willingness, disclosure capacity, legal preparedness or strategic plans to raise public equity. Consequently, the identified firms should be interpreted as financially suitable potential issuers rather than as confirmed IPO-ready firms.
Author Contributions
Conceptualisation, I.R., M.K., I.S. and S.G.; Literature review, M.K.; methodology, O.G., I.S., M.K. and V.M.; data collection, I.R., M.K., I.S. and D.R.; data analysis, O.G., I.S., M.K. and V.M.; paper draft preparation, I.R., I.S. and M.K.; writing—review and editing, S.G. and I.R. All authors have read and agreed to the published version of the manuscript.
Funding
This research is supported by the University of Latvia project “Capital Market Potential for Promoting Latvia’s Economic Growth (ZDA 2025/6)” in accordance with priority development areas important for the Latvian economy.
Institutional Review Board Statement
Not applicable.
Informed Consent Statement
Not applicable.
Data Availability Statement
Research data are available upon request.
Conflicts of Interest
The authors declare no conflicts of interest.
References
- AFME. (2025). Capital market union. Key performance indicators. Available online: https://www.afme.eu/media/whjltpvv/afmecmukpis202311.pdf (accessed on 10 September 2026).
- Anderson, N., Brooke, M., Hume, M., & Kürtösiová, M. (2015). A European capital markets union: Implications for growth and stability (Financial Stability Paper, 33). Bank of England. [Google Scholar]
- Arampatzi, A.-S., Christie, R., Evrard, J., Parisi, L., Rouveyrol, C., & van Overbeek, F. (2025). Capital markets union: A deep dive—Five measures to foster a single market for capital (ECB Occasional Paper No. 2025/369). European Central Bank. [Google Scholar] [CrossRef] [Scilit]
- Baker, M., & Wurgler, J. (2002). Market timing and capital structure. The Journal of Finance, 57(1), 1–32. [Google Scholar] [CrossRef] [Scilit]
- Baker, M., & Wurgler, J. (2006). Investor sentiment and the cross-section of stock returns. The Journal of Finance, 61(4), 1645–1680. [Google Scholar] [CrossRef] [Scilit]
- Bezdek, J. C., Ehrlich, R., & Full, W. (1984). FCM: The fuzzy c-means clustering algorithm. Computers & Geosciences, 10(2–3), 191–203. [Google Scholar] [CrossRef] [Scilit]
- Briguglio, L. (1995). Small island developing states and their economic vulnerabilities. World Development, 23(9), 1615–1632. [Google Scholar] [CrossRef] [Scilit]
- Busch, D. (2017). A capital markets union for a divided Europe. Journal of Financial Regulation, 3(2), 262–279. [Google Scholar] [CrossRef] [Scilit]
- Chemmanur, T. J., He, S., & Nandy, D. K. (2008). The going public decision and the product market. SSRN Electronic Journal. [Google Scholar] [CrossRef] [Scilit][Green Version]
- Demertzis, M., Domínguez-Jiménez, M., & Guetta-Jeanrenaud, L. (2021). Europe should not neglect its capital markets union (Bruegel Policy Contribution 13/2021). Bruegel. [Google Scholar]
- Draženović, B. O., & Kusanović, T. (2016). Determinants of capital market in the new member EU countries. Economic Research-Ekonomska Istrazivanja, 29(1), 758–769. [Google Scholar] [CrossRef] [Scilit]
- EC. (2025). Targeted consultation on integration of EU capital markets. Available online: https://finance.ec.europa.eu/regulation-and-supervision/consultations-0/targeted-consultation-integration-eu-capital-markets-2025_en (accessed on 10 June 2026).
- ECB. (2025). Economic bulletin. Available online: https://www.ecb.europa.eu/pub/pdf/ecbu/eb202504.en.pdf (accessed on 10 June 2026).
- ESMA. (2024). Building more effective and attractive capital markets in the EU. Available online: https://www.esma.europa.eu/sites/default/files/2024-05/ESMA24-450544452-2130_Position_paper_Building_more_effective_and_attractive_capital_markets_in_the_EU.pdf (accessed on 10 June 2026).
- EU. (2024). Regulation (EU) 2024/2809 of the European Parliament and of the Council of 23 October 2024 amending regulations (EU) 2017/1129, (EU) No 596/2014 and (EU) No 600/2014 to make public capital markets in the Union more attractive for companies and to facilitate access to capital for small and medium-sized enterprises. Available online: https://eur-lex.europa.eu/eli/reg/2024/2809/oj/eng (accessed on 10 June 2026).
- Frank, M. Z., & Goyal, V. K. (2003). Testing the pecking order theory of capital structure. Journal of Financial Economics, 67(2), 217–248. [Google Scholar] [CrossRef] [Scilit]
- Grigorenko, O., & Mihailovs, V. (2022). Aggregated fuzzy equivalence relations in clustering process (pp. 448–459). Springer. [Google Scholar] [CrossRef] [Scilit]
- Grima, S., Baldacchino, P. J., Abela, J. M., & Spiteri, J. V. (2020). The implications of derisking: The case of Malta, a small EU state. Journal of Risk and Financial Management, 13(9), 216. [Google Scholar] [CrossRef] [Scilit]
- Gucciardi, G. (2022). Measuring the relative development and integration of EU countries’ capital markets using composite indicators and cluster analysis. Review of World Economics, 158(4), 1043–1083. [Google Scholar] [CrossRef] [Scilit]
- Hartwell, C. A. (2018). The effect of political volatility on capital markets in EU accession and neighborhood countries. Journal of Economic Policy Reform, 21(4), 260–280. [Google Scholar] [CrossRef] [Scilit]
- Jelinska, J., & Grigorenko, O. (2024). Metric-based fuzzy equivalence and inequality relations (pp. 298–309). Springer. [Google Scholar] [CrossRef] [Scilit]
- Kim, K. A., Kitsabunnarat, P., & Nofsinger, J. R. (2004). Ownership and operating performance in an emerging market: Evidence from Thai IPO firms. Journal of Corporate Finance, 10(3), 355–381. [Google Scholar] [CrossRef] [Scilit]
- Kudinska, M., Solovjova, I., & Romānova, I. (2024). Financial sector development in new EU member states (pp. 119–139). Emerald Publishing. [Google Scholar] [CrossRef] [Scilit]
- Lefebvre, V. (2023). Working capital management of IPO firms. Managerial Finance, 49(5), 808–828. [Google Scholar] [CrossRef] [Scilit]
- Levine, R. (2005). Finance and growth: Theory and evidence. In A. Philippe, & D. Steven (Eds.), Handbook of economic growth (1st ed., Vol. 1, pp. 865–934). Elsevier. [Google Scholar] [CrossRef] [Scilit]
- Mitra, S., Weber, A., Bhatia, A., Aiyar, S., Antoun de Almeida, L., Cuervo, C., Santos, A., & Gudmundsson, T. (2019). A capital market union for Europe (Vol. 2019, Issue 007). Staff Discussion Notes. International Monetary Fund. [Google Scholar] [CrossRef] [Scilit]
- Mohammed, A. M., Abdelmotalib Osman Ahmed, N., Omer Elzain Elamin, E., Dhaher Atqaa Alresheedi, A., & Jamil Alrawashdeh, W. (2025). Decoding IPO dynamics: The changing role of financial and non-financial metrics. The Journal of Risk Finance, 26(4), 533–550. [Google Scholar] [CrossRef] [Scilit]
- Myers, S. C., & Majluf, N. S. (1984). Corporate financing and investment decisions when firms have information that investors do not have. Journal of Financial Economics, 13(2), 187–221. [Google Scholar] [CrossRef] [Scilit]
- OECD. (2023). OECD/INFE 2023 international survey of adult financial literacy. Available online: https://www.oecd.org/content/dam/oecd/en/publications/reports/2023/12/oecd-infe-2023-international-survey-of-adult-financial-literacy_8ce94e2c/56003a32-en.pdf (accessed on 10 June 2026).
- Orlowski, L. T. (2020). Capital markets integration and economic growth in the European Union. Journal of Policy Modeling, 42(4), 893–902. [Google Scholar] [CrossRef] [Scilit]
- Rajan, R. G., & Zingales, L. (1998). Financial dependence and growth. American Economic Review, 88(3), 559–586. [Google Scholar]
- Rathnayake, D. N., Zhang, Z., Yang, B., & Louembé, P. A. (2022). The aftermarket performance of initial public offerings: New evidence from an emerging market. PLoS ONE, 17(8), e0272092. [Google Scholar] [CrossRef] [Scilit] [PubMed]
- Ritter, J. R. (1991). The long-run performance of initial public offerings. The Journal of Finance, 46(1), 3–27. [Google Scholar] [CrossRef]
- Signet Bank. (2023). Signet bank. Available online: https://signetbank.com/aktualitates_/signet-bank-prezente-aptaujas-datus-latvijas-uznemeju-finansialais-noskanojums-un-uznemejdarbibas-vide-latvija/ (accessed on 15 June 2026).
- Sosnowski, T. (2021). The credibility of earnings announced by new stock companies: Accrual and real earnings management. Equilibrium. Quarterly Journal of Economics and Economic Policy, 16(3), 661–677. [Google Scholar] [CrossRef] [Scilit]
- Stake, R. E. (1995). The art of case study research. SAGE. [Google Scholar]
- Veil, R., Wiesner, M., & Reichert, M. (2022). Disclosure and enforcement under the EU listing act. European Company and Financial Law Review, 19(3), 445–516. [Google Scholar] [CrossRef] [Scilit]
- Veron, N., & Wolff, G. B. (2016). Capital markets union: A vision for the long term. Journal of Financial Regulation, 2(1), 130–153. [Google Scholar] [CrossRef] [Scilit]
- Veselinovic, D. (2009). Slovenian financial markets. OECD Observer, 276–277. [Google Scholar]
- Wright, W., & Hamre, E. F. (2021). The problem with European stock markets. Available online: https://www.newfinancial.org/reports/the-problem-with-european-stock-markets (accessed on 21 May 2026).
- Yalçın, N., & Ünlü, U. (2018). A multi-criteria performance analysis of initial public offering (IPO) firms using CRITIC and VIKOR methods. Technological and Economic Development of Economy, 24(2), 534–560. [Google Scholar] [CrossRef] [Scilit]
- Yin, R. K. (2009). Case study research: Design and methods (Vol. 18, Issue 2). Applied Social Research Methods Series. Sage. ISBN 978-1-4129-6099-1. [Google Scholar]
- Yıldırım, M., & Yıldırım, D. (2025). Stock market development, financial development, and economic growth relationship: An application in fragile economies. International Journal of Business and Economic Studies, 7(2), 125–137. [Google Scholar] [CrossRef] [Scilit]
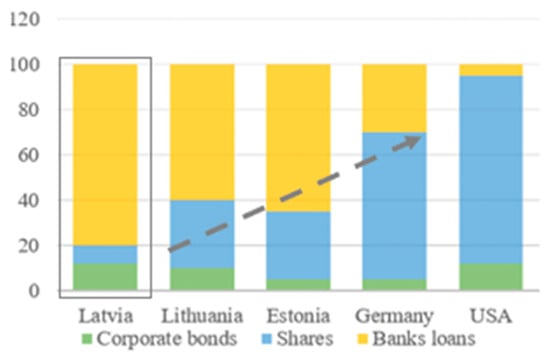
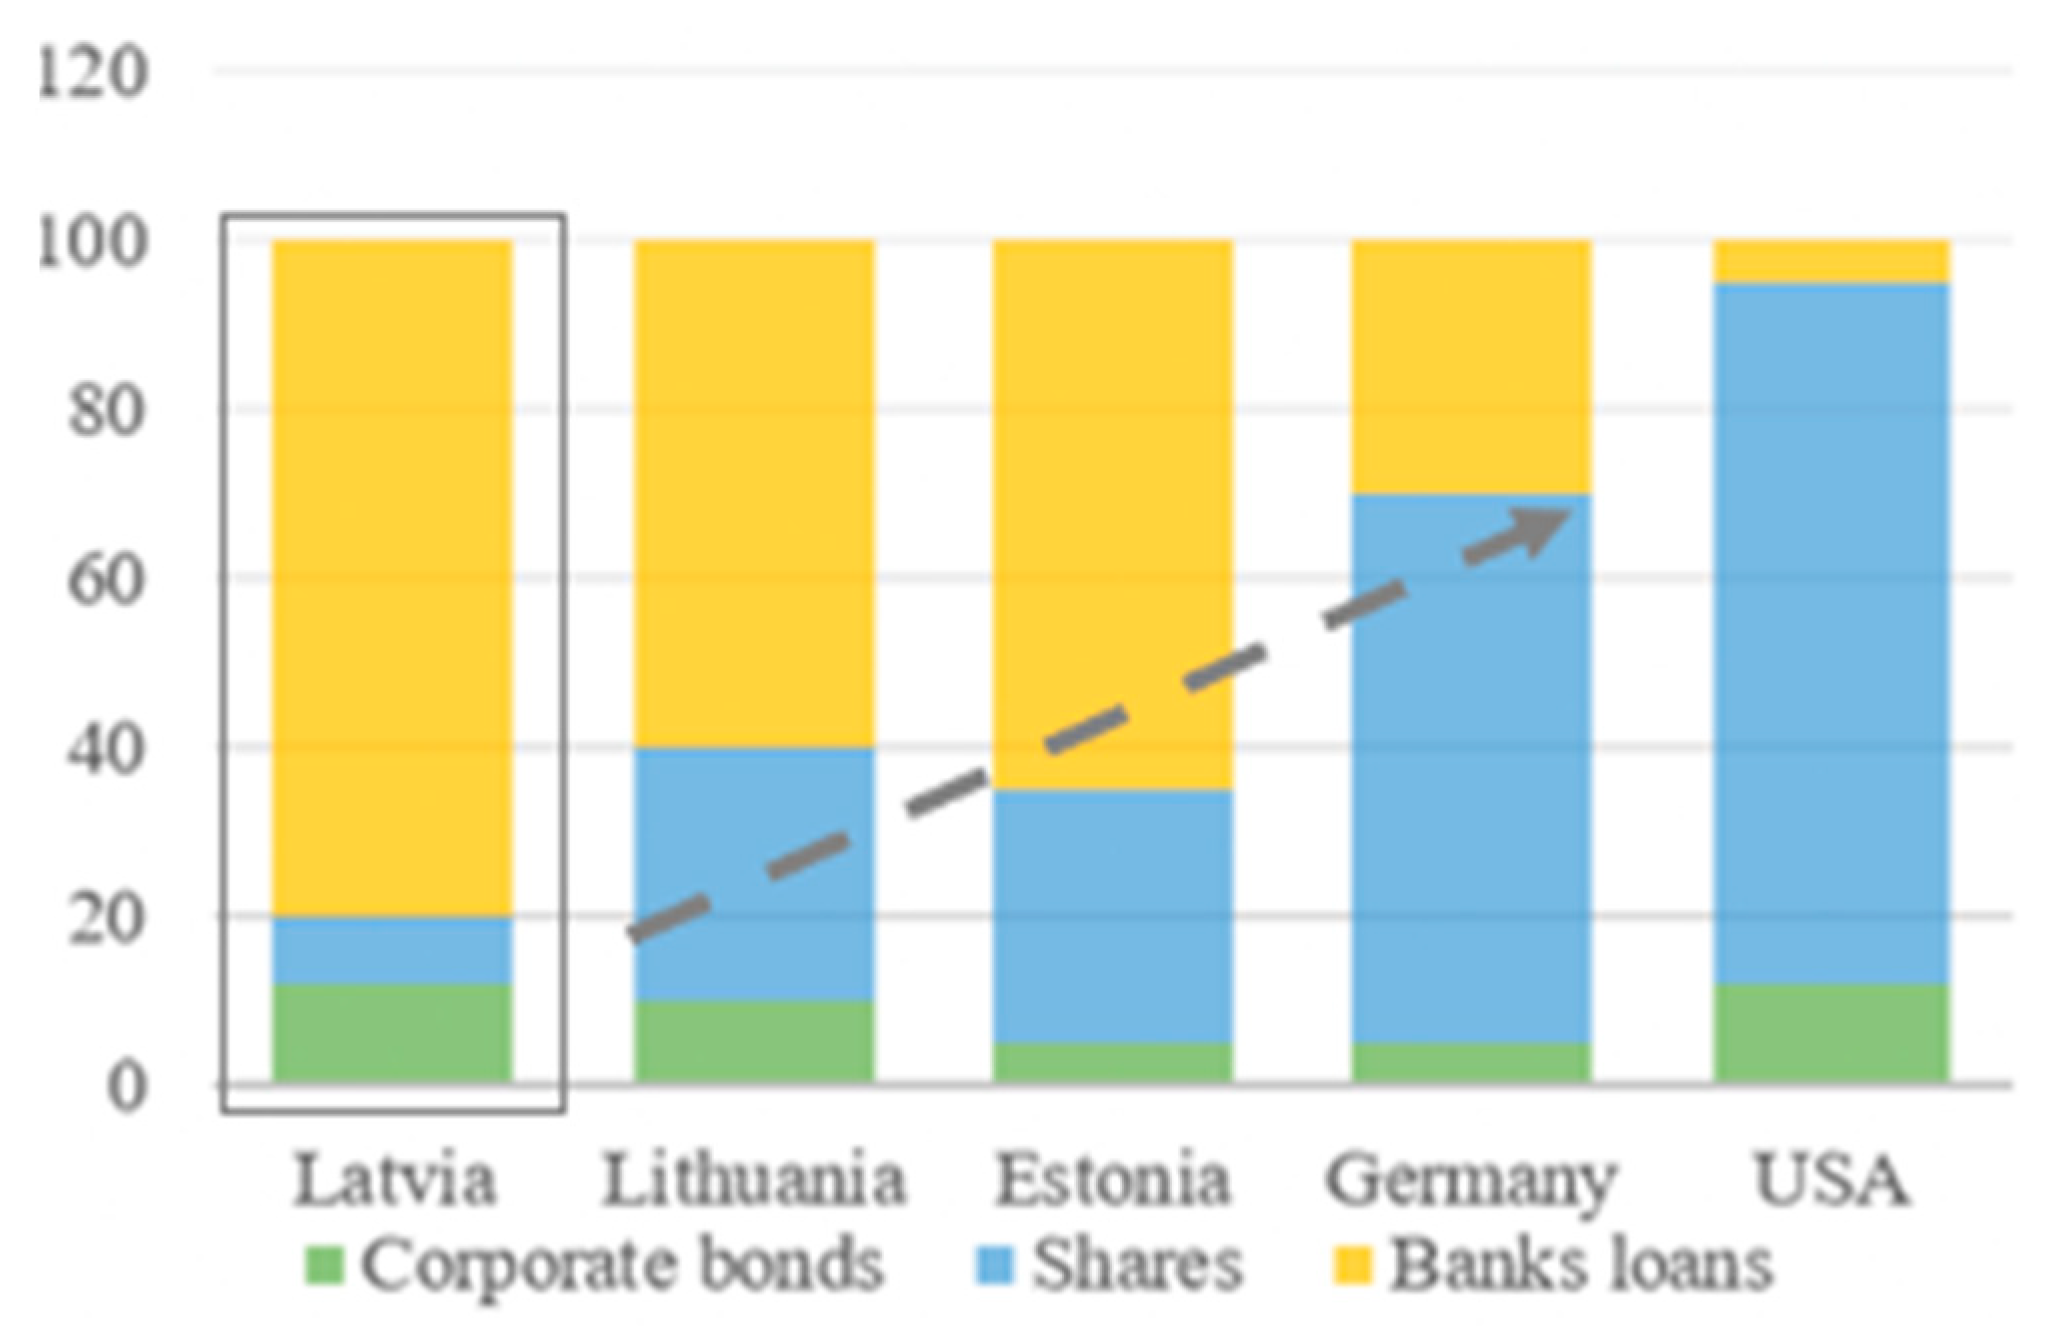
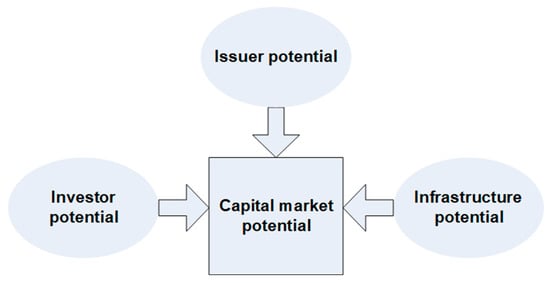
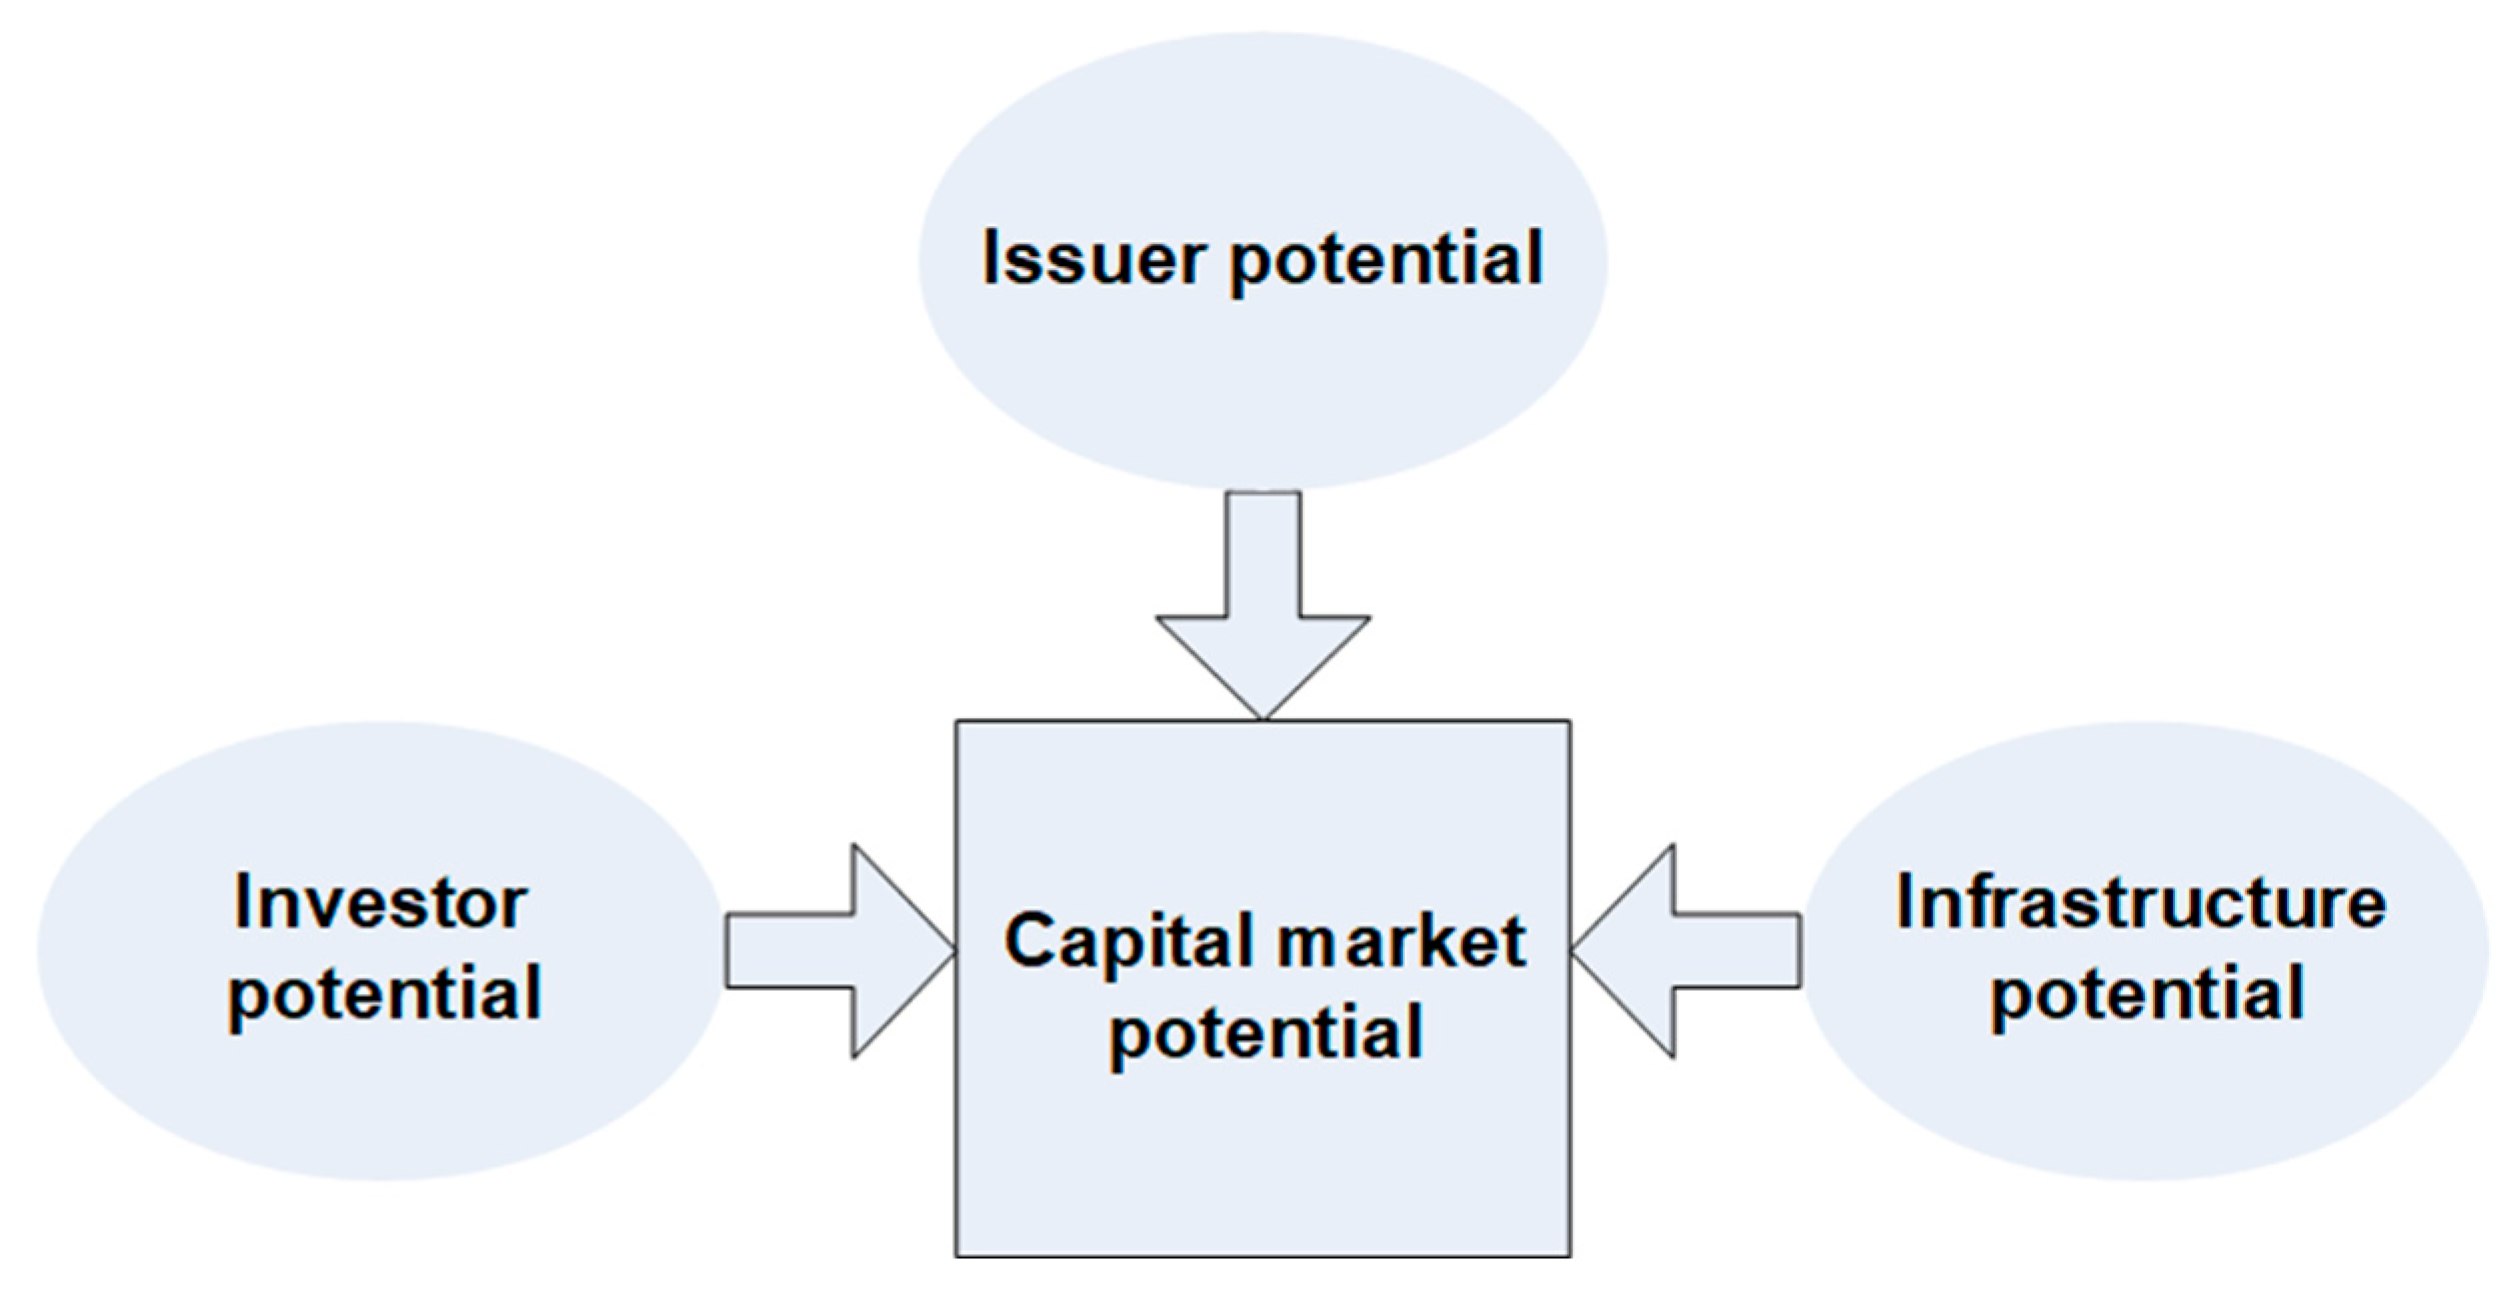
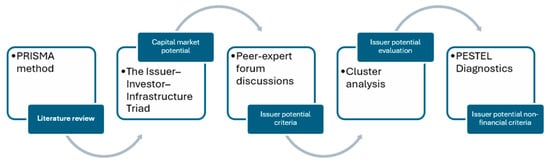
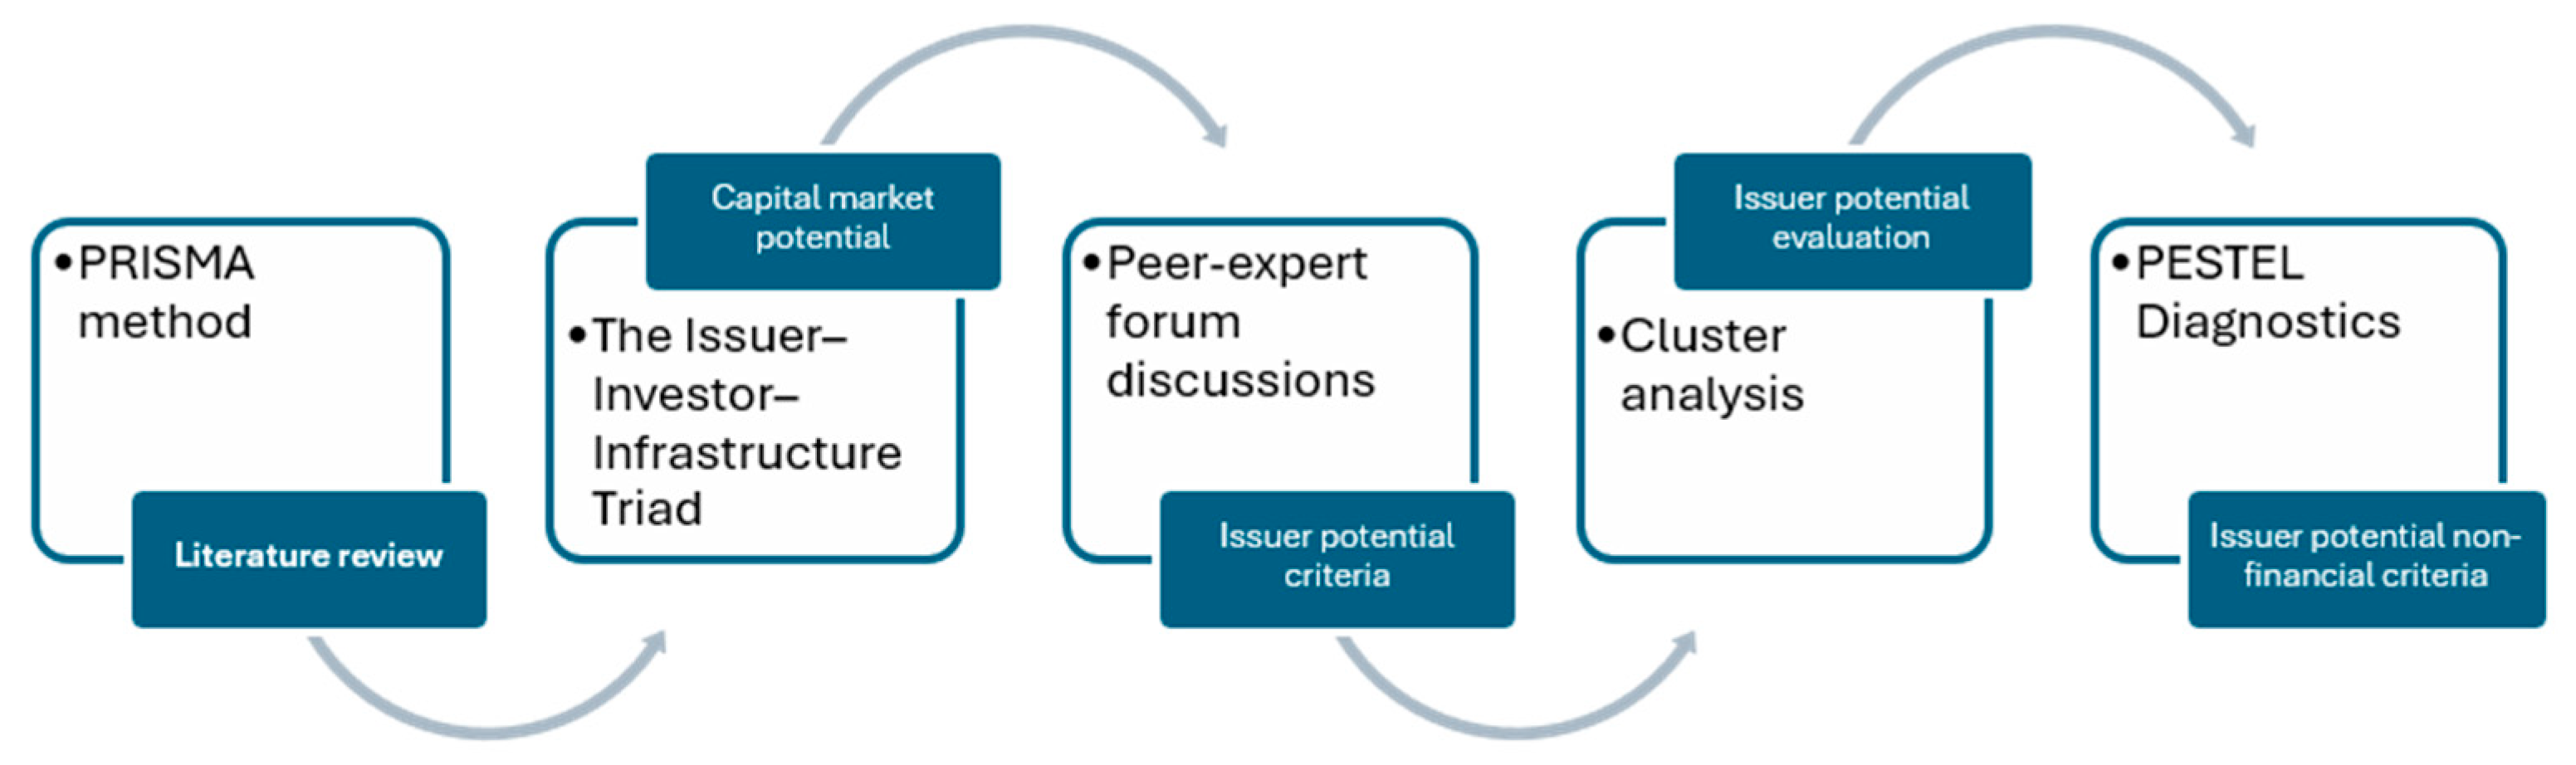
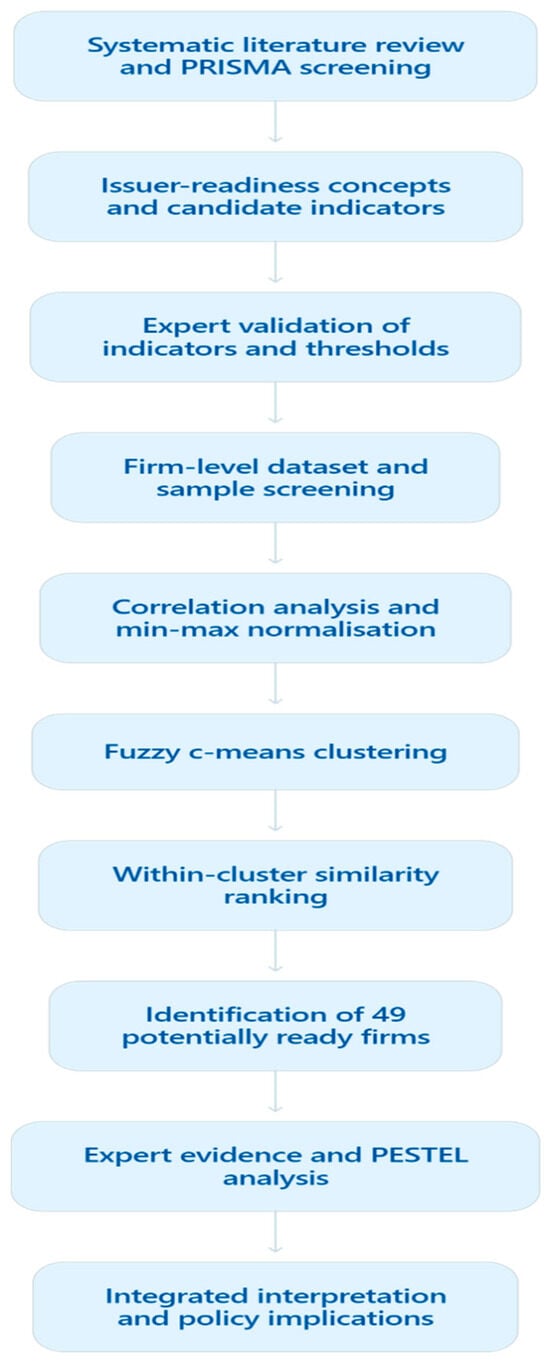
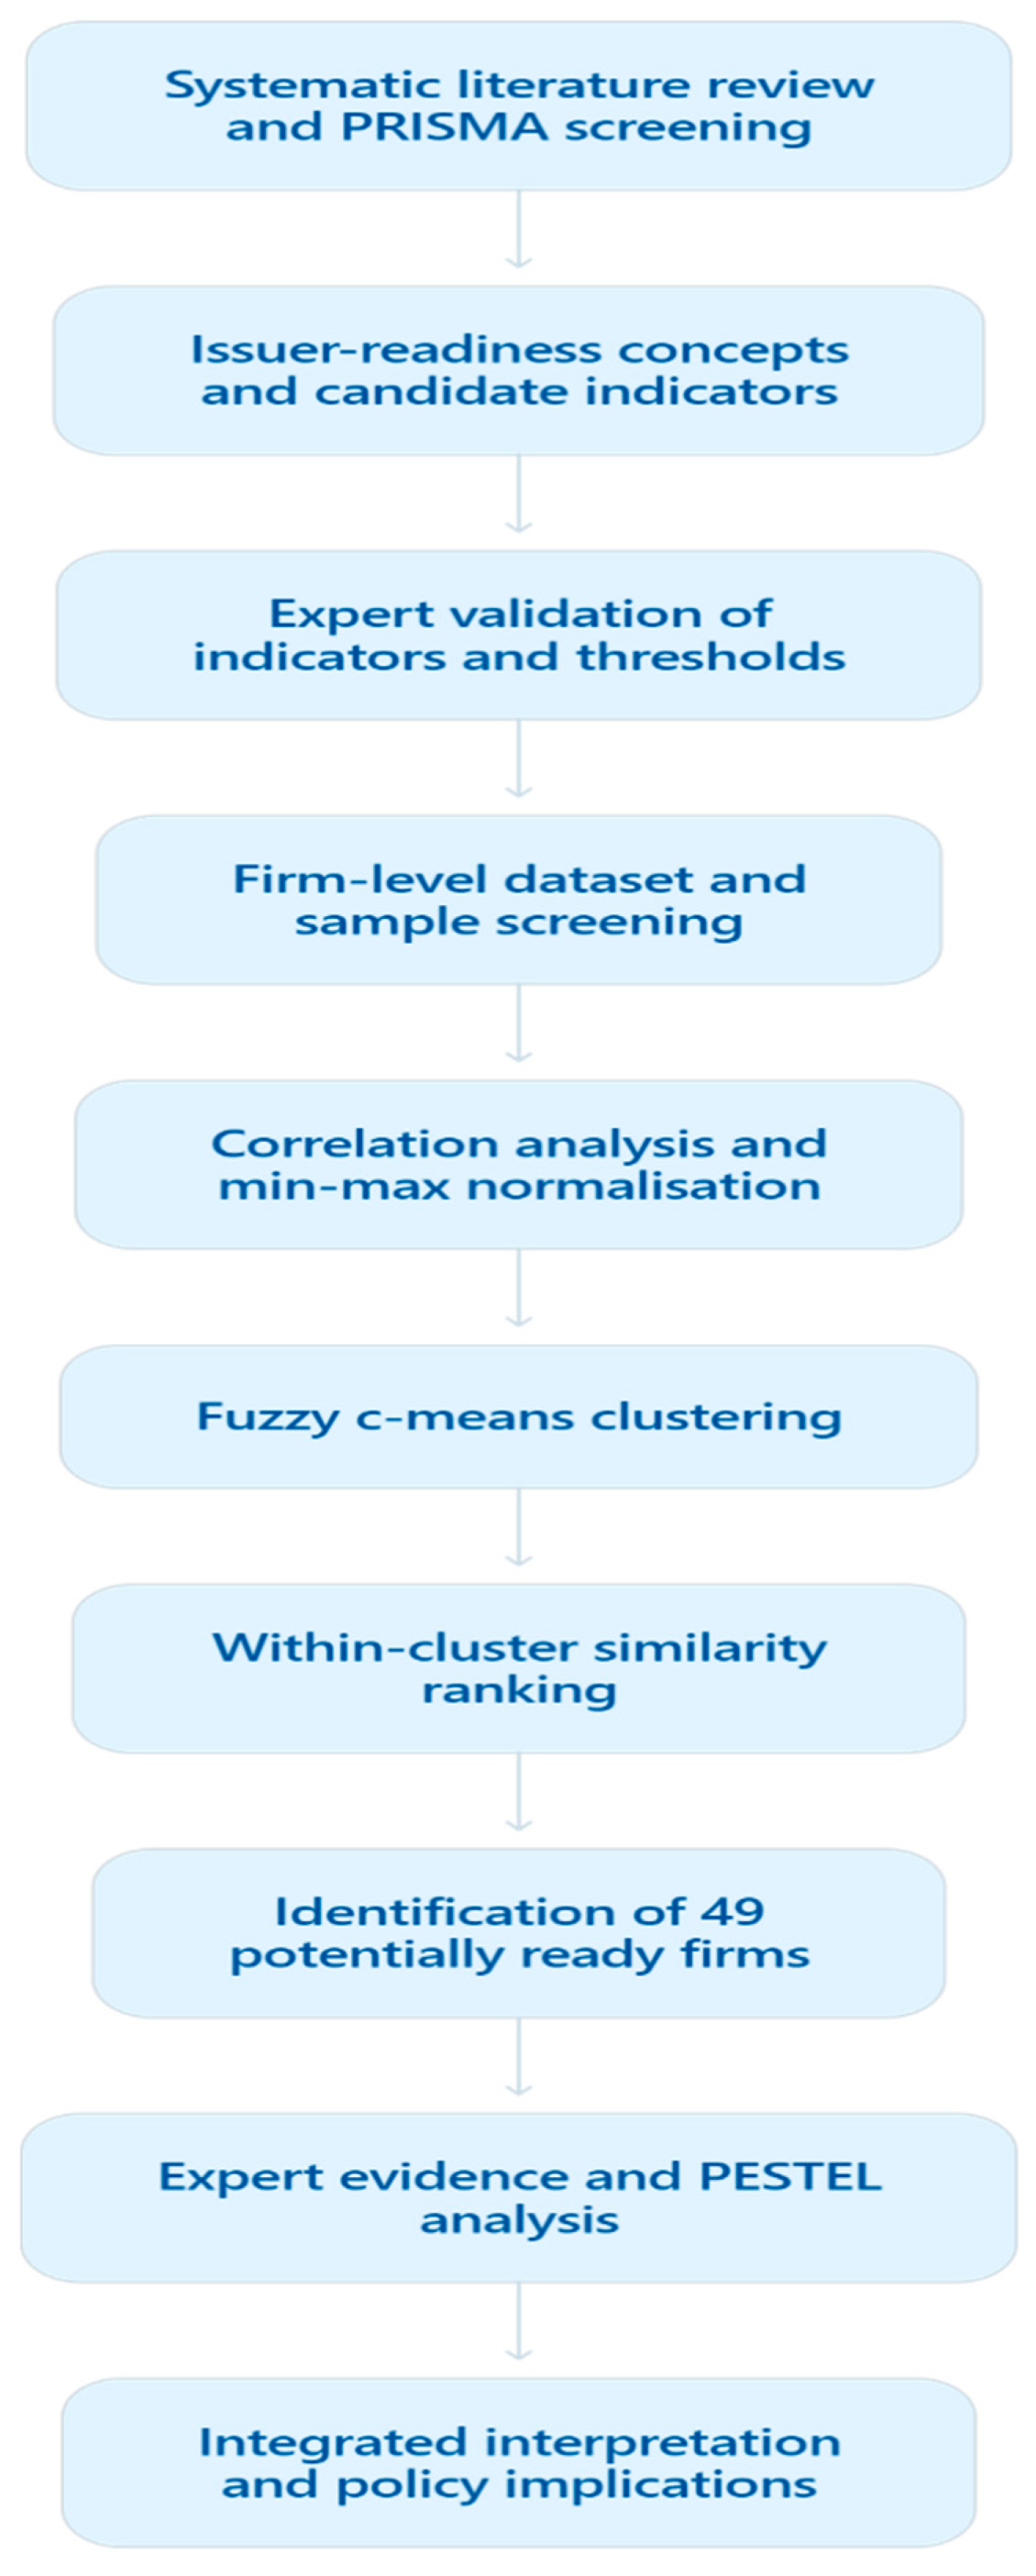
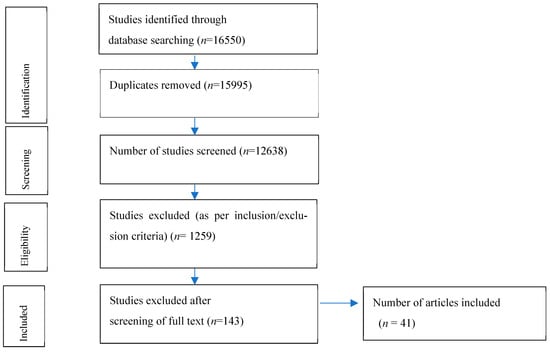
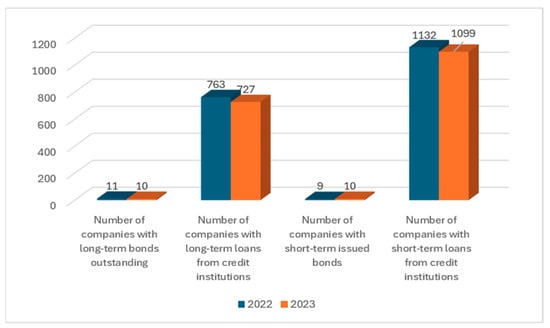
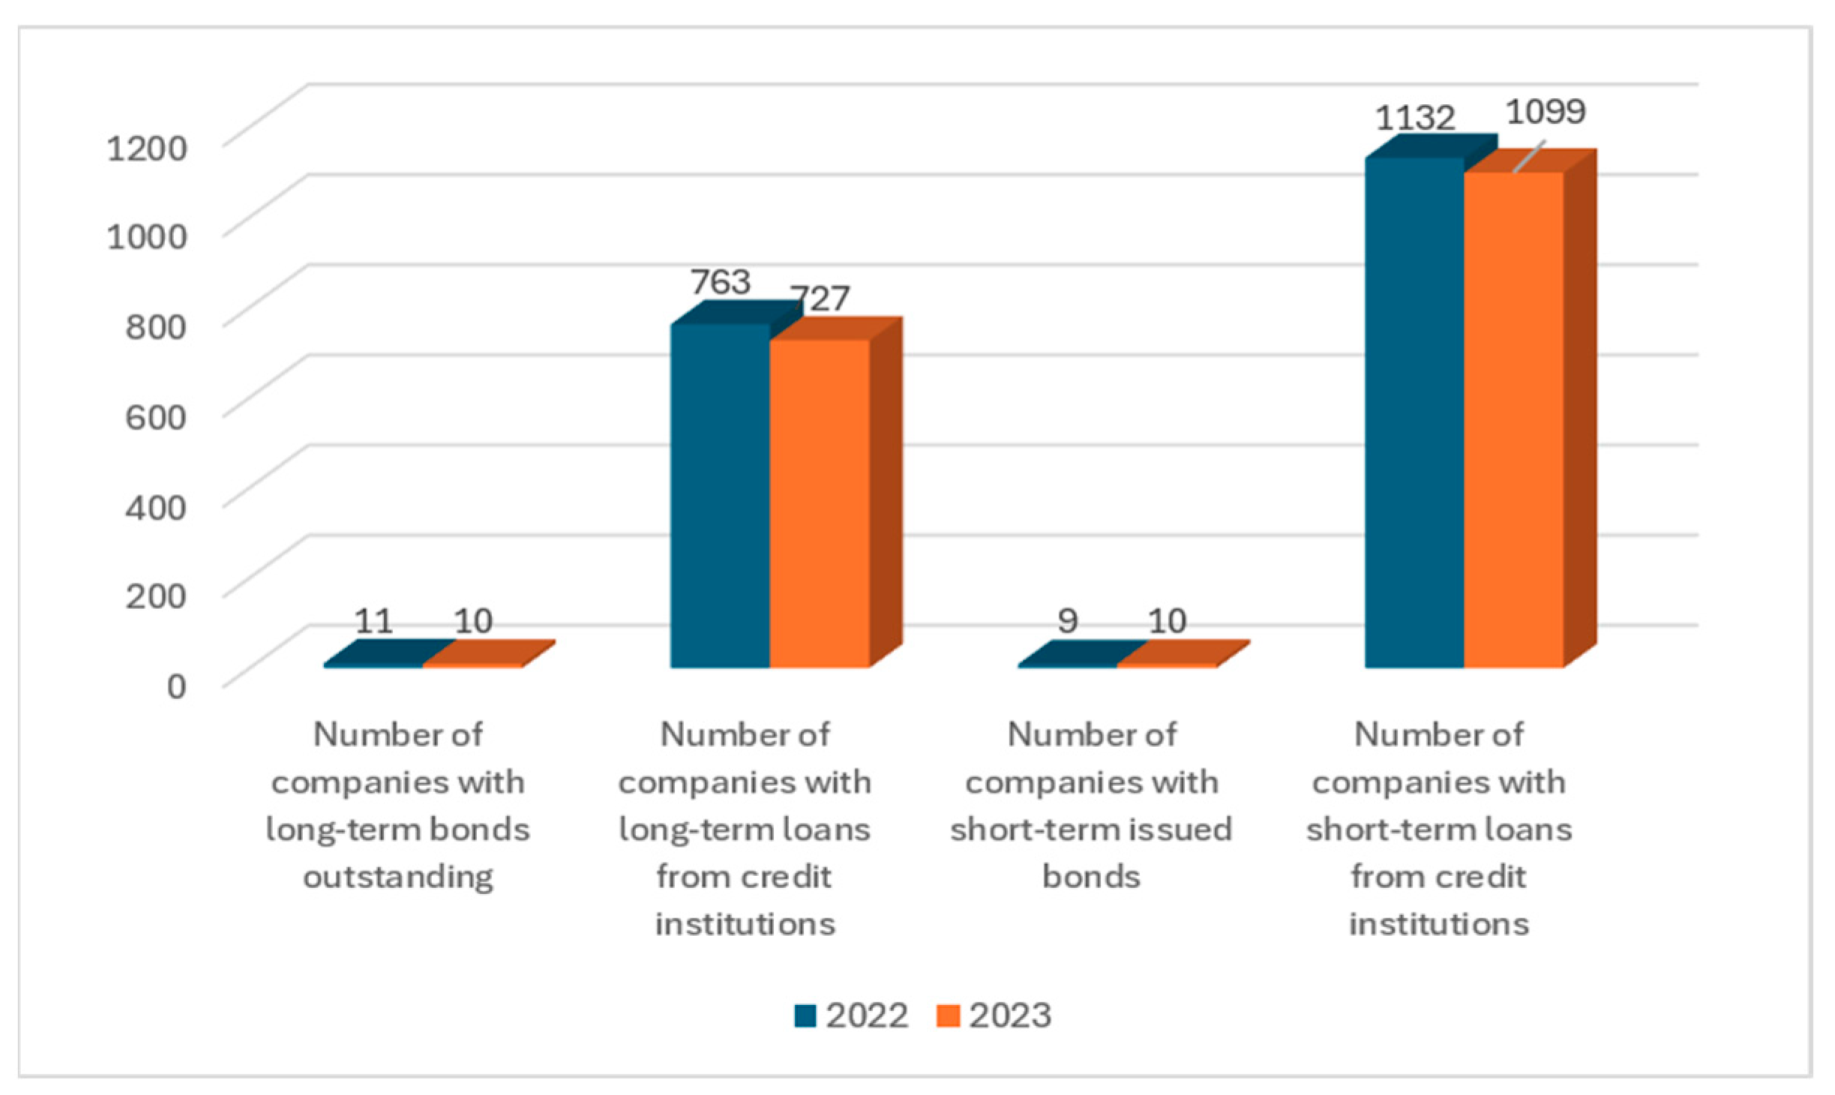
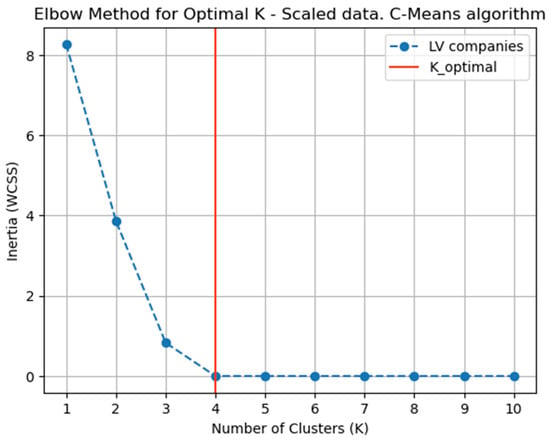
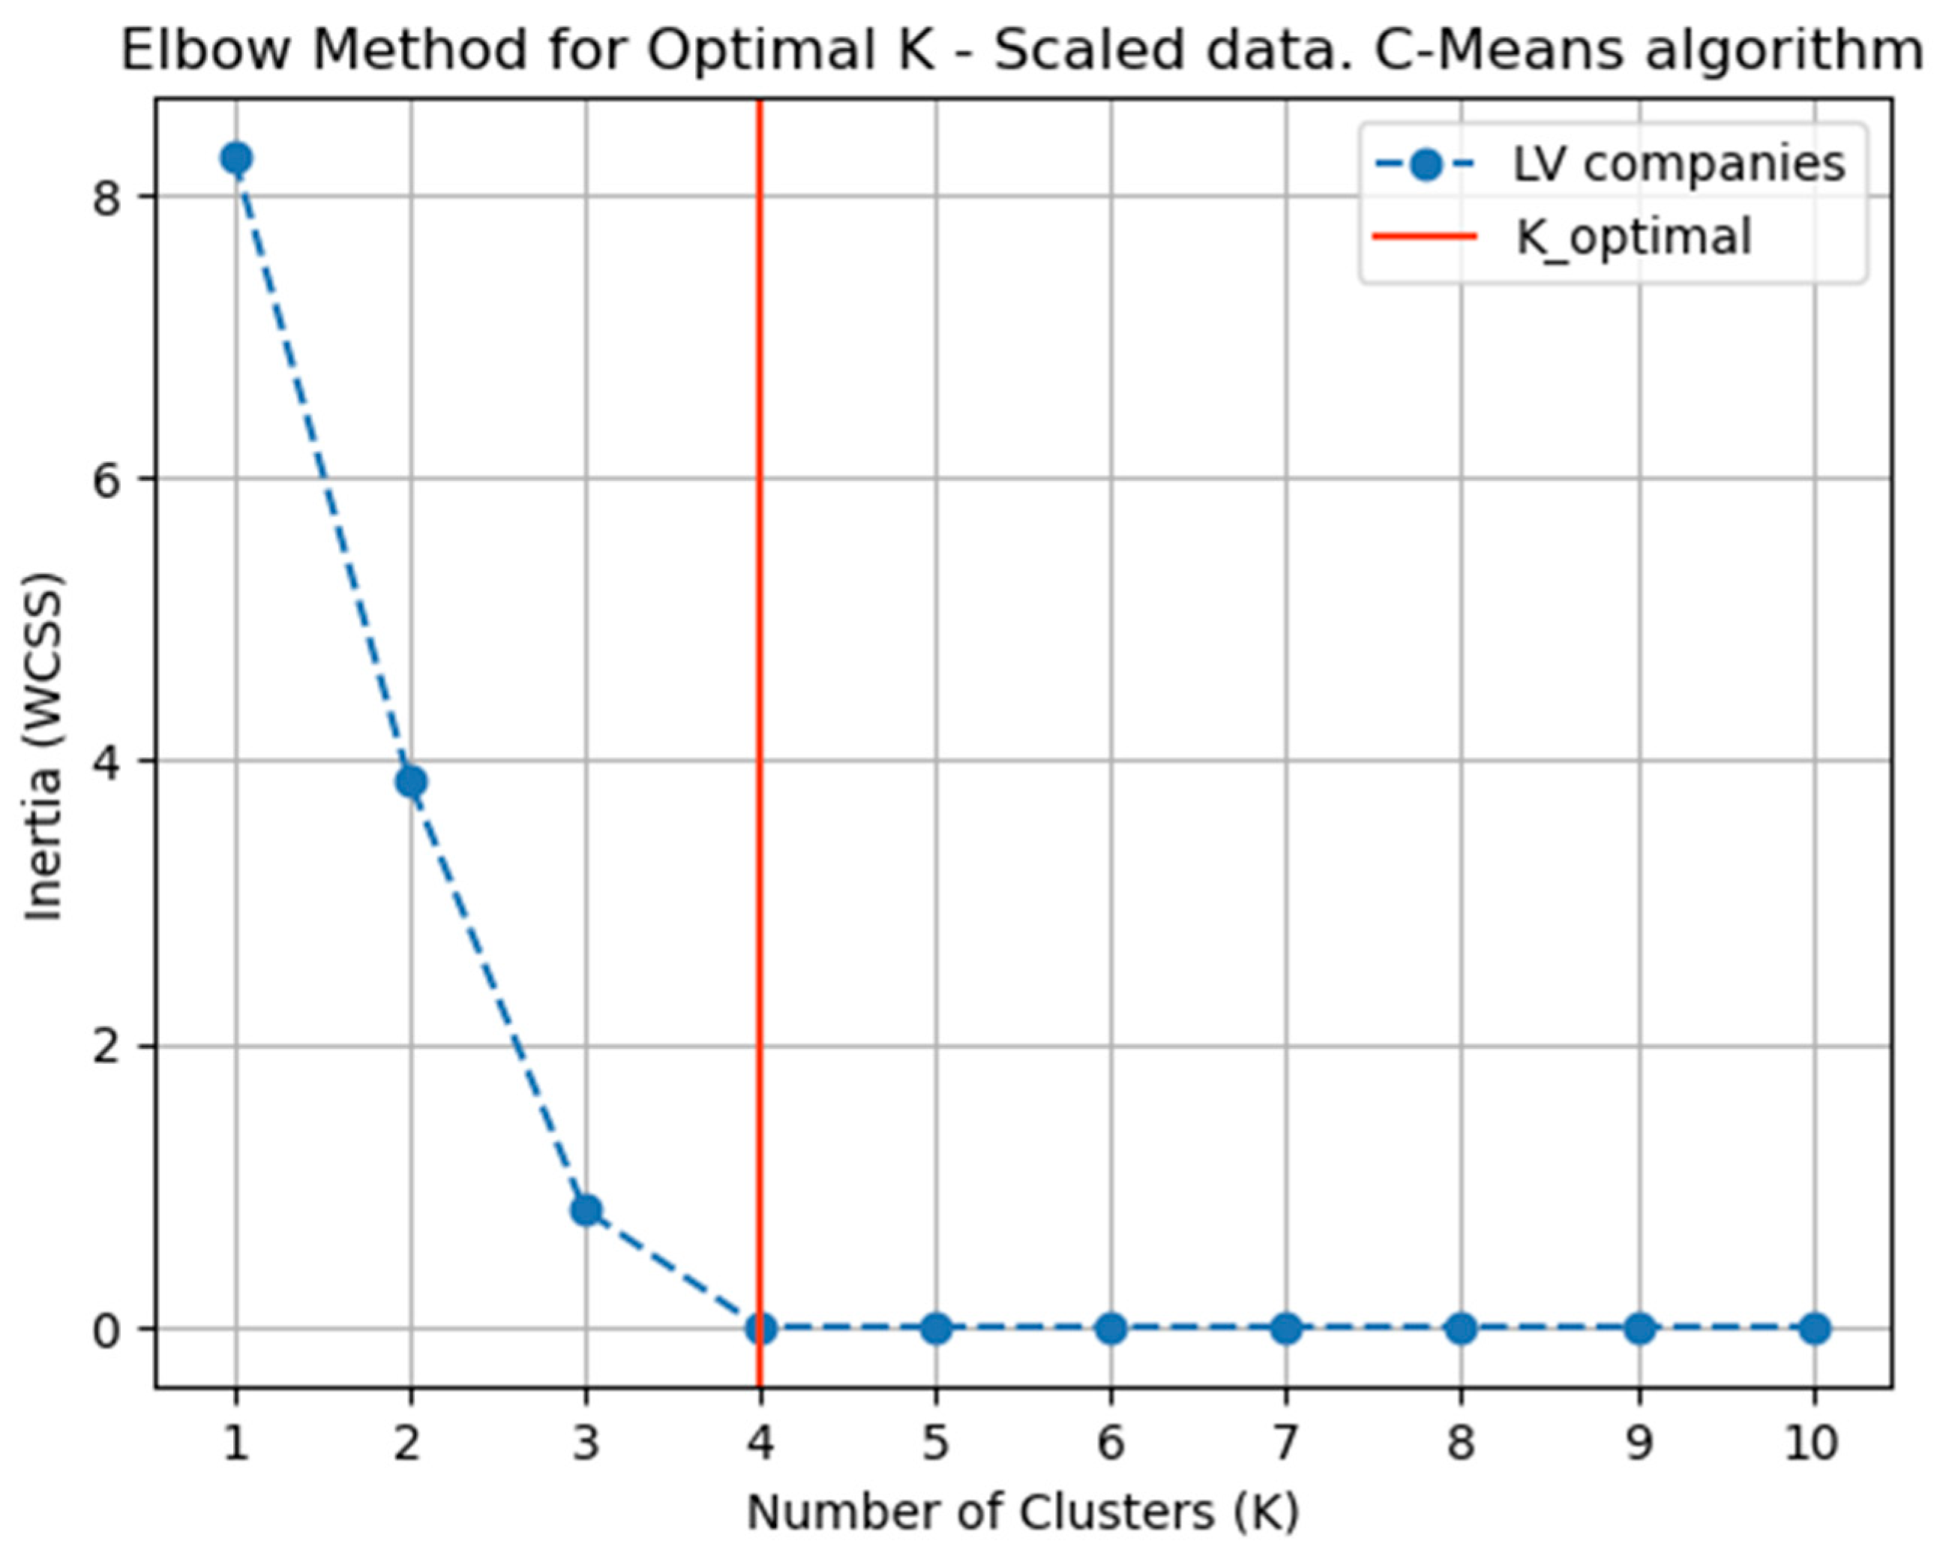
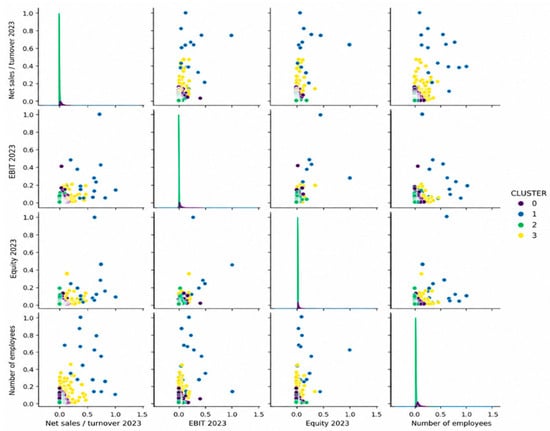
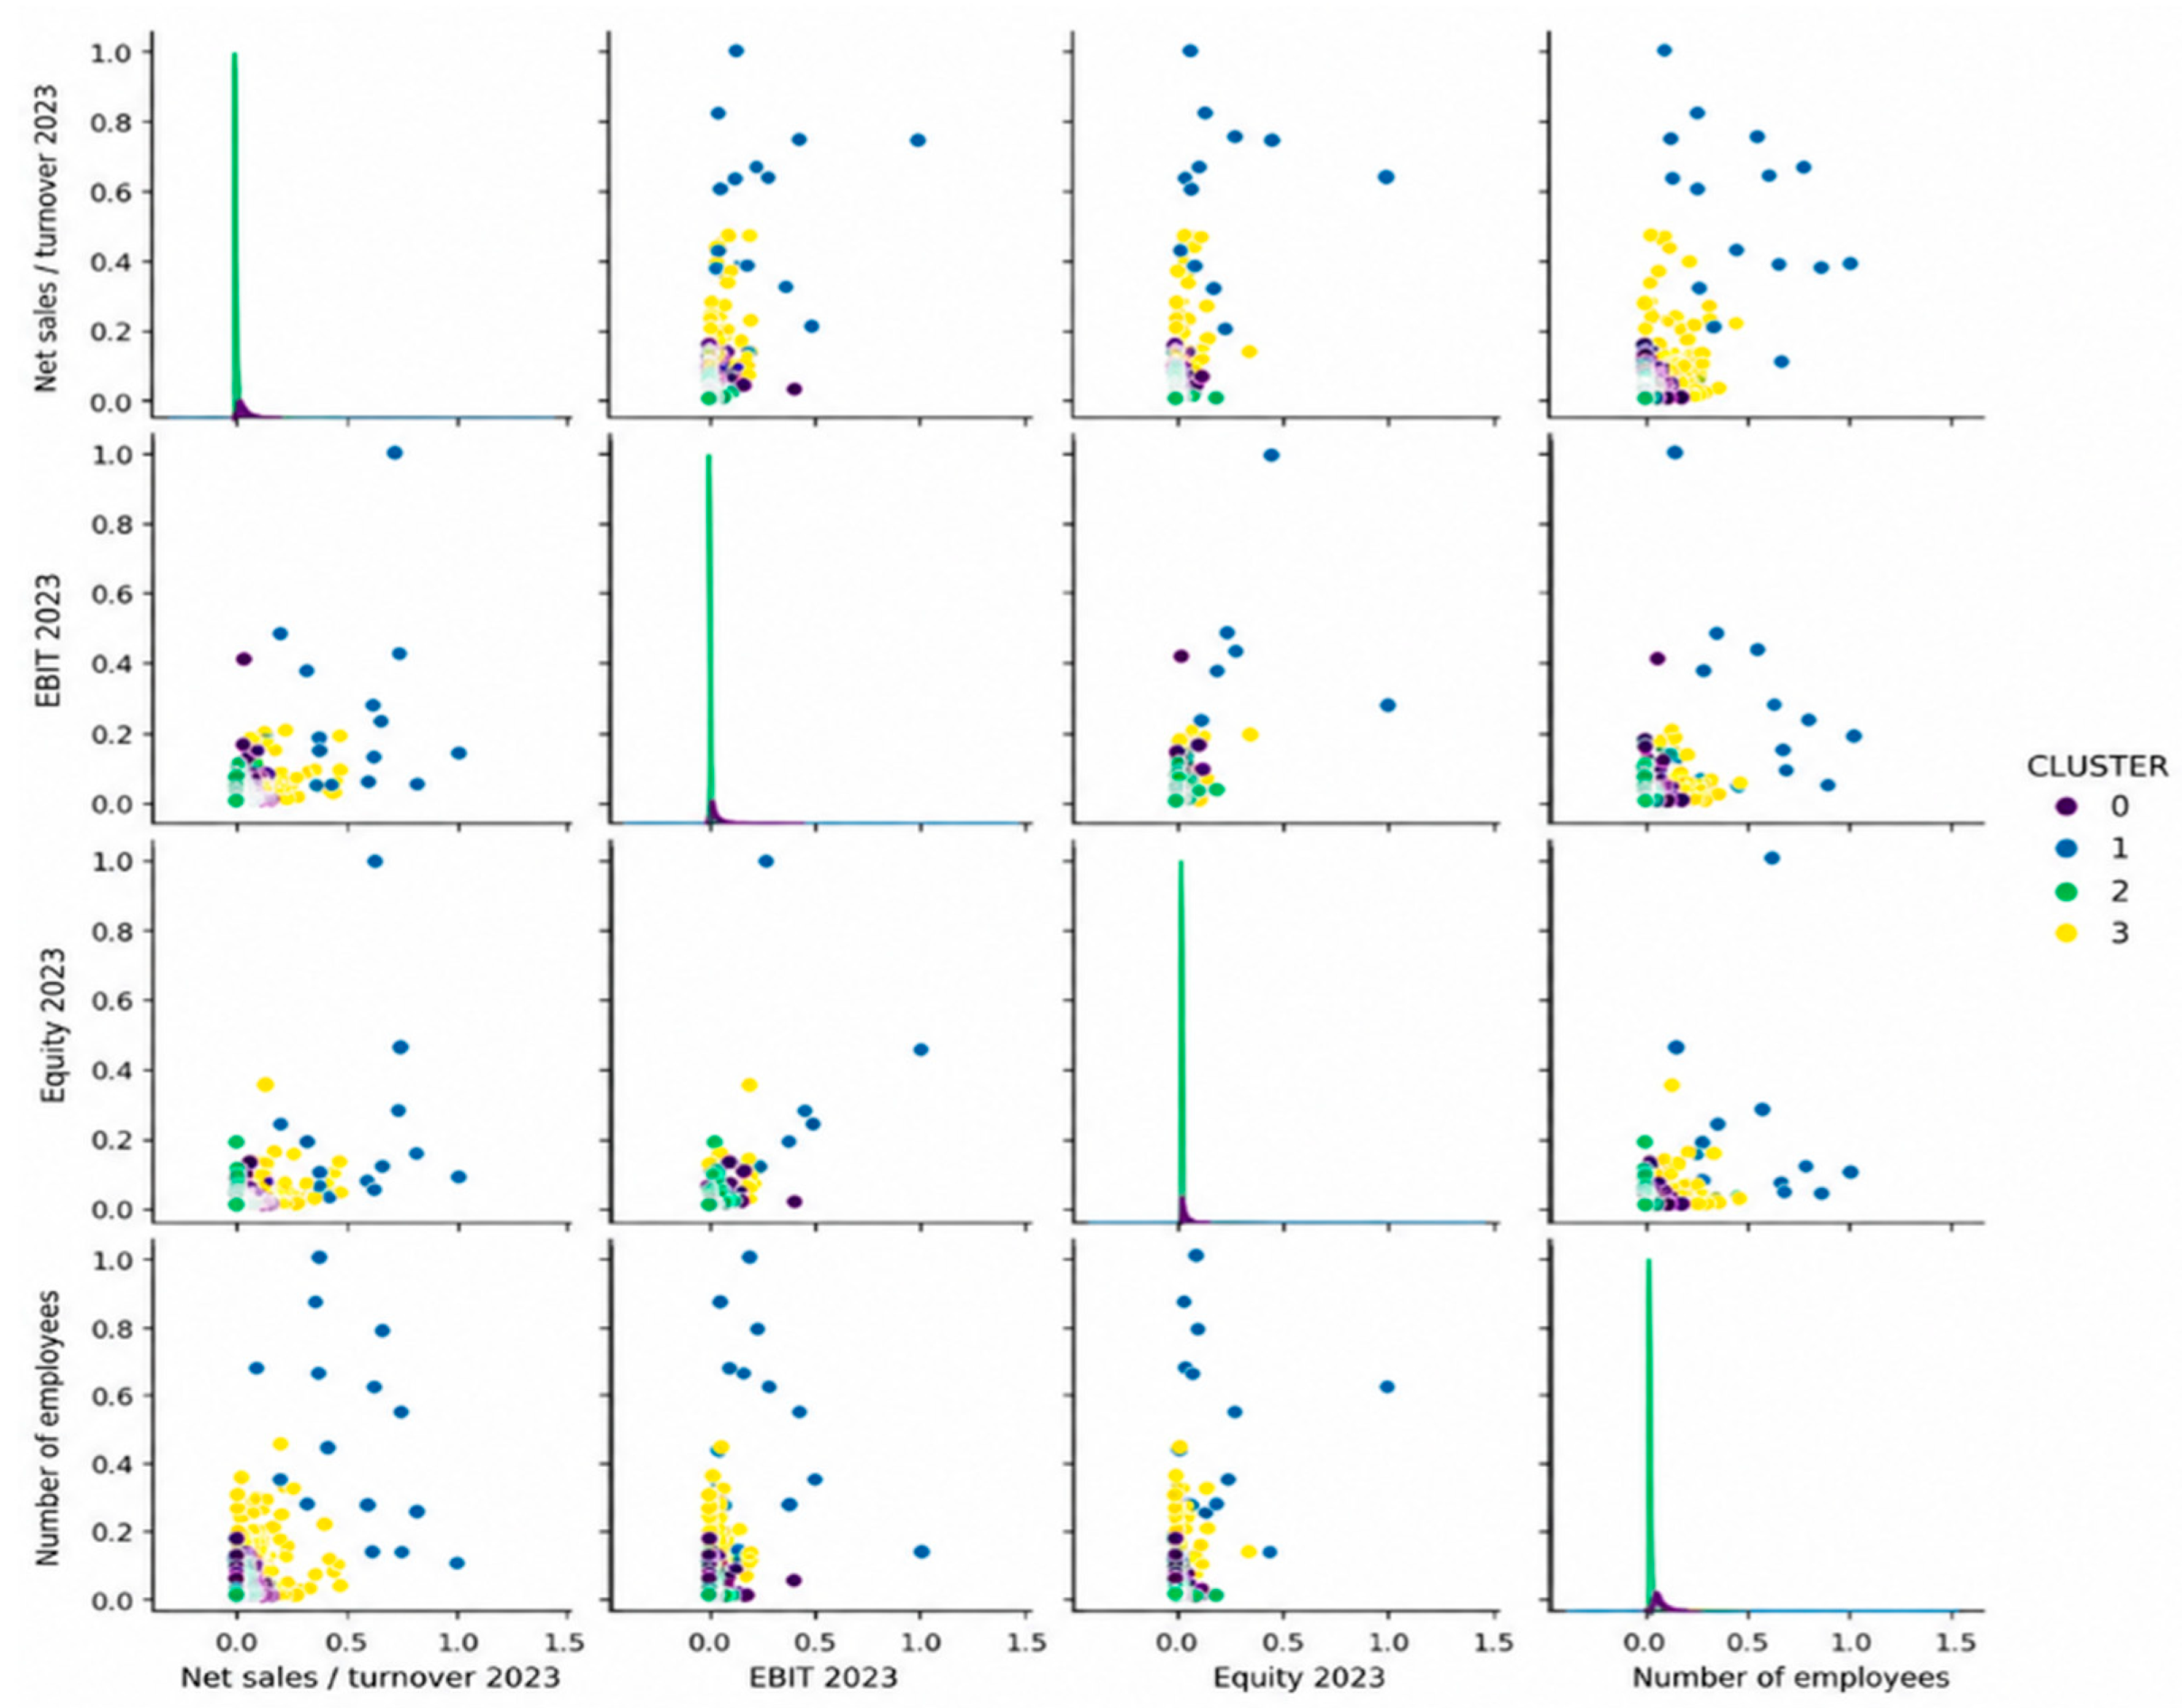

Disclaimer/Publisher’s Note: The statements, opinions and data contained in all publications are solely those of the individual author(s) and contributor(s) and not of MDPI and/or the editor(s). MDPI and/or the editor(s) disclaim responsibility for any injury to people or property resulting from any ideas, methods, instructions or products referred to in the content. |
© 2026 by the authors. Licensee MDPI, Basel, Switzerland. This article is an open access article distributed under the terms and conditions of the Creative Commons Attribution (CC BY) license.