


Abstract
Active travel, particularly walking and cycling, has been recommended because of the health benefits associated with increased physical activity. Use of public transport generally involves some walking to bus stops or train stations. This paper is a systematic review of how much time is spent in physical activity among adults using public transport. It also explores the potential effect on the population level of physical activity if inactive adults in NSW, Australia, increased their walking through increased use of public transport. Of 1,733 articles, 27 met the search criteria, and nine reported on absolute measures of physical activity associated with public transport. A further 18 papers reported on factors associated with physical activity as part of public transport use. A range of 8–33 additional minutes of walking was identified from this systematic search as being attributable to public transport use. Using “bootstrapping” statistical modelling, if 20% of all inactive adults increased their walking by only 16 minutes a day for five days a week, we predict there would be a substantial 6.97% increase in the proportion of the adult population considered “sufficiently active”. More minutes walked per day, or a greater uptake of public transport by inactive adults would likely lead to significantly greater increases in the adult population considered sufficiently active.
1. Introduction
Promoting physical activity is an established health promotion priority, and is as important stopping smoking and reducing high blood pressure [1]. It is well documented that population patterns of physical activity are influenced by the physical and built environments [2,3] with features of the built environment such as mixed land use, well-connected street networks and high residential density positively associated with higher levels of physical activity [4,5,6].
Single mode walking or cycling trips are generally the focus of research examining the effects of active transport on health, and often this is in the context of the journey to work [7,8,9]. However this may exclude the walking or cycling component of a trip that is mostly a public transport trip, given that the greatest time or distance is spent on public transport for that journey. The beginning or end of a public transport trip usually involves some walking to the next destination. This active travel component of a public transport trip could provide an important opportunity for physical activity [10] and may be missed in some assessments of physical activity.
To date there have been no systematic reviews of the literature examining physical activity associated with public transport use. The purpose of this paper is to systematically examine the extent of association between the use of public transport and time spent in physical activity (walking/cycling to transport stops/stations) among adults. In addition using statistical modelling we examine the potential effect on the population level of physical activity if inactive adults in NSW, Australia, were to increase their walking by the amount found to be attributable to public transport in this review.
2. Methods
2.1. Study Selection Criteria
Study inclusion criteria were any papers reporting on the relationship between public transport use and physical activity levels in adults published in the last ten years (2002–2012). All modes of public transport were included (for example, trams, trains, light rail, ferries, buses), but not single mode walking, cycling, freight transport and taxi trips. Walking and cycling to and from public transport stations were included. The review included all types of study design. Papers which reported on the relationship between public transport use and health status (for example, obesity, BMI) were also included. Excluded from the review were papers focused on land use planning and changes to the built environment aimed at facilitating physical activity which did not specifically include data on the extent of physical activity associated with public transport use. Articles generally discussing the issue or tangentially related topics were also excluded.
2.2. Search Strategy and Study Selection Process
Studies were identified through searching of the following electronic databases (January 2002–2012): Medline, Australian Transport index, Embase, Cinahl, Scopus, Psychinfo and Web of Knowledge limited to humans, English language and abstract. Grey literature (including government and agency reports) was included where it was frequently cited by other papers, or was readily identified through a Google search. The search focused on three key elements: (1) Population (adults); (2) physical activity and (3) public transport. Key search terms are listed in Table 1. These terms were mapped to appropriate subject headings and searched as a keyword in each database. All articles were imported into an Endnote library and duplicates removed (see Figure 1).
An initial screen of titles and abstracts was undertaken by one researcher (NC) to identify articles meeting the study inclusion criteria. The full text of potentially relevant articles not clearly identified from the title/abstract were obtained and assessed for eligibility. The set of 29 possible articles for inclusion were reviewed by a second author (CR), which led to two being excluded.
Figure 1.
Summary of Search Strategy and Identification of Articles Included in the Review.
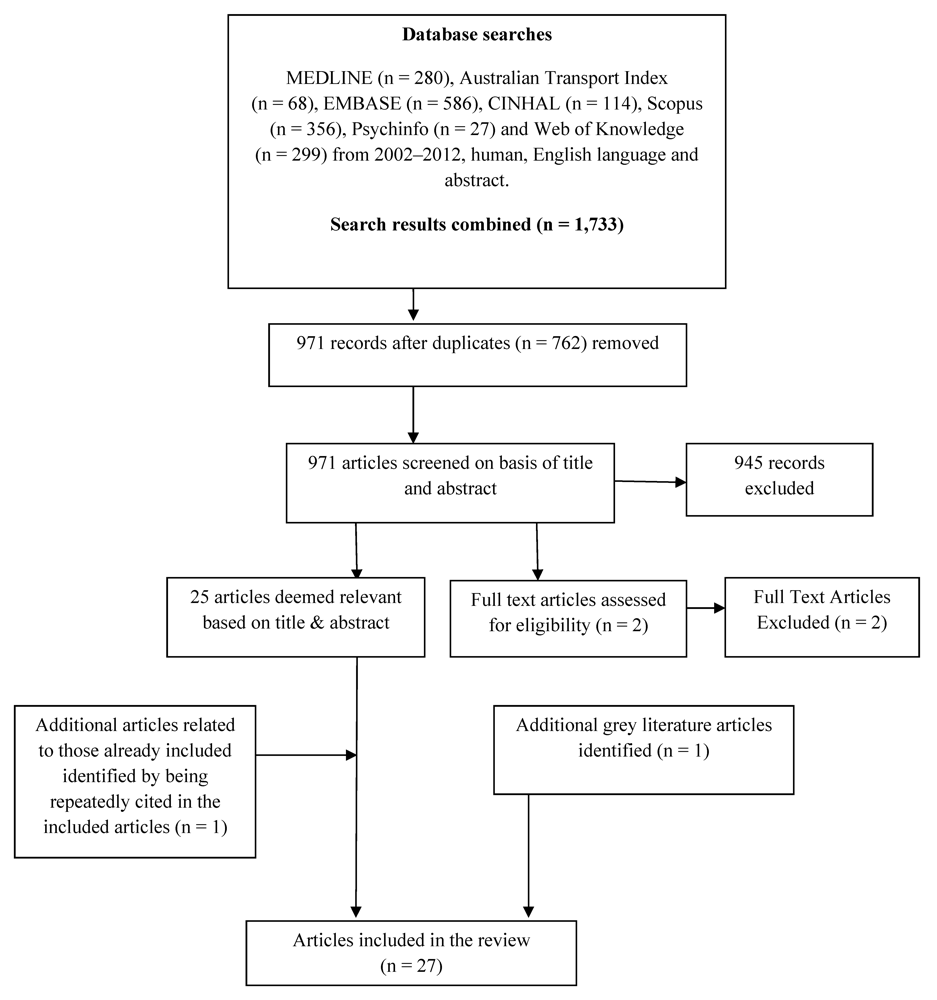
Table 1.
Electronic search strategy.
Key search terms, mapped to appropriate subject headings in each database and searched as a key word in all databases. MeSH: Medical subject heading (Medline medical index term); the dollar sign ($) stands for any character(s). All searches limited to English, humans, abstract and 2002–2012.
2.3. Modelling of NSW Health Survey Data
We also sought to explore the likely impact on the population of NSW in terms of the overall proportion of the adult population considered sufficiently active (defined as meeting the global physical activity recommendations of “150 or more minutes of at least moderate intensity physical activity” during the week) if there were increases in physical activity associated with increased public transport use. Data were drawn from the NSW Continuous Health Survey conducted in 2010 [11]. The NSW Continuous Health Survey is conducted by telephone among a representative sample of residents aged 16 years or over in NSW, Australia. The variable of interest was minutes of physical activity per week.
The distribution of physical activity in the inactive population and total population was modelled based on three scenarios where there was an increase in 8, 16, or 24 minutes of physical activity per week (five days, to represent using public transport during a working week), and if 10, 20 or 30% of the adult population added these additional minutes. All statistical analysis was done using the software package “R” [12]. All statistical analyses were weighted using the NSW Health Survey post-stratification weights. Minutes of physical activity per week was estimated using the weighted empirical distribution function. To calculate 95% confidence intervals, a survey bootstrapping technique was used with 1,000 replicates and the 2.5% and 97.5% quintiles of the replicates were found [13].
Percentage improvement in the proportion of the population who were sufficiently active as a function of additional minutes of physical activity per week was estimated using the weighted cumulative density function. The graph of this function was then smoothed using splines of the maximum degree which still retained the convexity of the functions [14].
3. Results
Using the search strategy described above, 1,733 articles were generated (see Figure 1). After removal of duplicates (n = 762), 971 article titles and abstracts were screened for relevance, with 27 articles meeting the eligibility criteria. Table 2 summarises nine studies where physical activity in relation to public transport was measured in absolute terms (using accelerometers or pedometers). Six were from the USA, two from the UK and one from Australia. None addressed cycling. While not using the same measurement units for physical activity, it appears that there are at least 8 minutes of additional physical activity [15] associated with public transport use a day, and several studies reported a range up to 12–15 minutes a day [15,16,17]. One study found public transport users accumulated up to about 24 minutes of walking a day, but did not examine walking related to car use [18]. The Australian study [17] was consistent with the USA and UK studies (and was in the 12–15 minutes of walking range), strengthening the likelihood that the overseas data is relevant to the Australian context. The median walking time associated with public transport use was 15 minutes.
Table 2.
Studies reporting objectively measured physical activity in adults in relation to public transport use.
In the US, 29 percent of those who use transit were physically active for 30 minutes or more each day (and considered as sufficiently active), solely by walking to and from public transit stops [18]. A similar result was found in the Australian context, with public transport users 3.5 times more likely to meet the recommended step target of 10,000 steps compared with car drivers [17]. Similarly in the US, transit users took 30 percent more steps per day and spent 8.3 more minutes walking per day than did people who relied on cars [16]. For seniors, each public transport trip in the UK was associated with an extra 412 steps, equivalent to about 8 minutes of walking (allowing for a slower speed) [22].
An Australian report (using Victorian Travel Survey data) reported that people who used public transport on a particular day also spent an average 41 minutes walking and/or cycling as part of their travel. This is five times more physical activity than those who only use private transport, who on average only spend 8 minutes walking or cycling for transport, and representing an additional 33 minutes of physical activity [10]. Public transport users (i.e., subways, light or heavy rail, buses, trolleys, or ferries) were less likely to be sedentary or obese than adults who did not use public transport [24]. Conversely, motor vehicle travel was associated with higher obesity rates at both the county and individual level [8,24,25] (there are a range of benefits associated with public transport use, and the 18 papers reporting these findings are summarised in the Appendix).
These studies measured walking in some way, but did not always differentiate between single mode walking for transport (which was excluded from this review) or walking to public transport (multi-mode). Some of the papers reported total minutes walking for transport, and factors associated with it. Compared with motor vehicle use, there were clear health benefits for users of public transport, particularly lower weight. A number of the papers compared energy expenditure of car users compared to public transport users, and all have concluded that there is significantly greater energy expenditure for public transport users [8,20,24].
There were higher levels of walking when public transport access points (stations and bus stops) were closer, and these associations were generally significant [25,26,27,28,29,30,31,32,33,34]. Good access to public transport is significantly associated with walking sufficiently per week to meet physical activity recommendations. Of the two longitudinal papers one showed significant increases in physical activity associated with new public transport stops/stations [28] but the other did not, although it reported that limited public transport availability was associated with low transport walking [29].
3.1. Modelling of NSW Health Survey Population Data
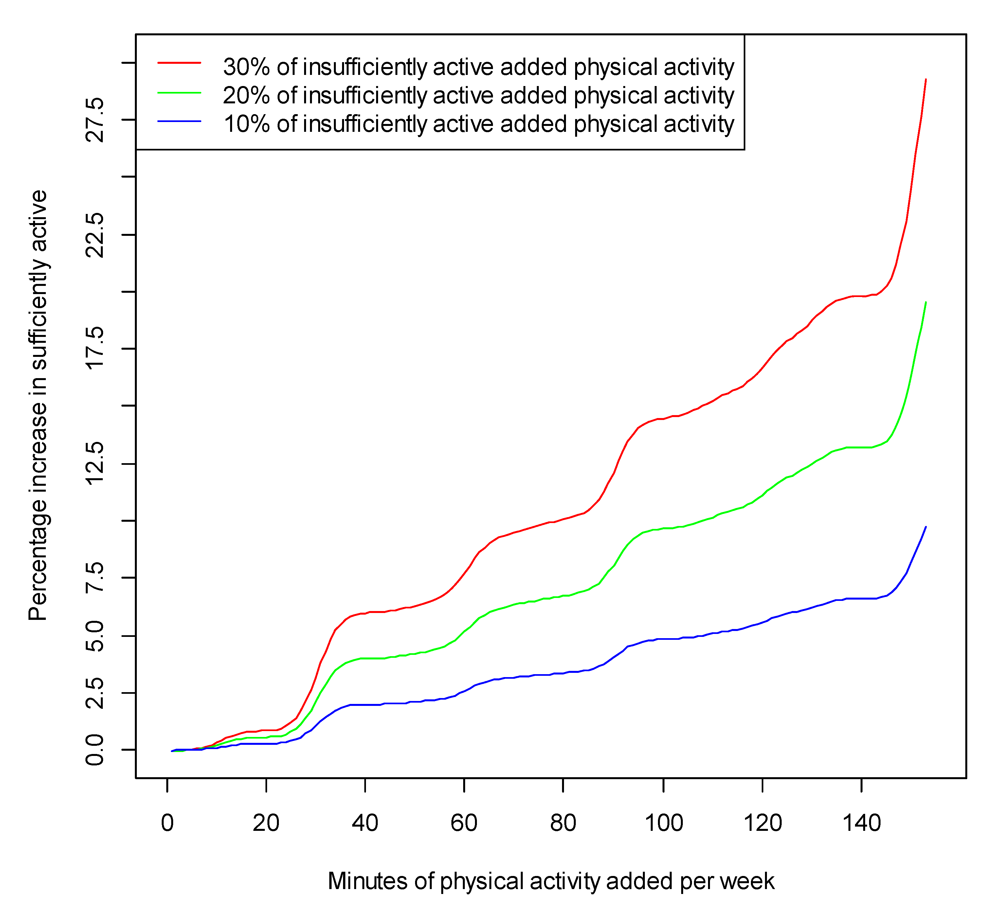
Using NSW Continuous Health Survey data for adults, almost half of women (49.8%) and 60.7 percent of men are classified as sufficiently physically active [35]. There is a clear dose-response relationship between the proportion of the population achieving 150 minutes per week of physical activity (and considered “sufficiently physically active”) by the addition of either 8, 16 or 24 minutes of walking. Conservatively, if only 20% of inactive people in NSW walked for 16 minutes more each week, across the state there would be 6.97% more adults meeting public health recommendations for physical activity, which has significant public health implications (see Table 3). As very few public health interventions increase population physical activity by anything like this amount, this would represent a significant improvement.
Table 3.
Population increase in the proportion of NSW adults who are sufficiently physically active by increases in minutes of physical activity and the percent uptake by those currently inactive.
This relationship is illustrated in Figure 2, which shows the increase in the proportion of the NSW population considered sufficiently active by increases in minutes of physical activity per week hypothetically associated with three scenarios of take up of public transport among insufficiently active NSW residents.
Figure 2.
Proportion of the NSW population considered sufficiently active by increases in minutes of physical activity per week associated with three scenarios of take up of public transport among insufficiently active NSW residents.
4. Discussion
There is relatively little data available on the extent of physical activity associated with public transport use, but it is clear that there is an additional amount ranging from 8 to 33 minutes of walking per day. The Australian Government recommends that adults should get at least 30 minutes of moderate intensity physical activity on most, preferably all, days of the week [36]. The globally accepted cut-point for sufficient physical activity for health is 150 minutes of moderate-intensity physical activity per week [37]. For some people transport related walking is sufficient to achieve the recommended levels of physical activity. Our statistical modelling shows that increases in people walking for transport, by as little as 8 minutes a day, would lead to significant increases in physical activity and improved population health in NSW.
There is much more data available on the health benefits of a modal shift away from motor vehicles to active travel (including public transport). In general, policy initiatives that favour active travel have many co-benefits [38] and even in the absence of complete data, there are many benefits from such a shift, including less congestion, less air and noise pollution, and stronger sense of local community.
4.1. Study Strengths and Limitations
The current review has a number of strengths and weaknesses. Strengths include the original nature of the review focusing on objective measures of physical activity in relation to public transport use with minutes of walking typically calculated from accelerometers, pedometers or travel diaries, rather than self-report. Also original is the population modelling of the likely effect of increased transport use by inactive adults using population survey data for NSW.
A limitation of the study was the review only covered the last ten years. However, this period included most of the known research on this topic. Another limitation is that only one of the researchers screened the initially identified articles, and this may have led to the exclusion of relevant papers. A third limitation is the large variation of measures used to assess physical activity and energy expenditure, and that the data come from a range of study types.
5. Conclusions
The nine papers identified in this review report a range of 8–33 minutes of additional physical activity associated with public transport use, with several papers reporting 12–15 minutes. Using bootstrapping analyses, we found that if public transport use by inactive adults was to increase, there would be a significant dose-response increase in the population level of sufficiently active adults in NSW.
Conflict of Interest
The authors declare no conflict of interest.
Acknowledgements
Funding from the New South Wales Ministry of Health to support the literature review.
References
- Bull, F.; Bauman, A. Physical inactivity: The cinderella risk factor for ncd prevention. J. Health Commun. 2011, 16(Suppl 2), S13–S26. [Google Scholar]
- Trost, S.G.; Owen, N.; Bauman, A.E.; Sallis, J.F.; Brown, W. Correlates of adults’ participation in physical activity: Review and update. Med. Sci. Sports Exerc. 2002, 34, 1996–2001. [Google Scholar]
- Kent, J.; Thompson, S.M.; Jalaludin, B. Healthy Built Environments: A Review of the Literature; Healthy Built Environments Program, City Futures Research Centre, The University of New South Wales: Sydney, Australia, 2011. [Google Scholar]
- Heath, G.W.; Brownson, R.C.; Kruger, J.; Miles, R.; Powell, K.; Ramsey, L.T. The effectiveness of urban design and land use and transport policies and practices to increase physical activity: A systematic review. Hum. Kinet. 2006, 3(Suppl 1), S55–S76. [Google Scholar]
- Pucher, J.; Dijkstra, L. Promoting safe walking and cycling to improve public health: Lessons from the netherlands and germany. Am. J. Public Health 2003, 93, 1509–1516. [Google Scholar] [CrossRef]
- Wilson, L.A.; Giles-Corti, B.; Burton, N.W.; Giskes, K.; Haynes, M.; Turrell, G. The association between objectively measured neighborhood features and walking in middle-aged adults. Am. J. Health Promot. 2011, 25, e12–e21. [Google Scholar]
- Wen, L.M.; Orr, N.; Millett, C.; Rissel, C. Driving to work and overweight and obesity: Findings from the 2003 new south wales health survey, Australia. Int. J. Obes. (Lond.) 2006, 30, 782–786. [Google Scholar]
- Wen, L.M.; Rissel, C. Inverse associations between cycling to work, public transport, and overweight and obesity: Findings from a population based study in Australia. Prev. Med. 2008, 46, 29–32. [Google Scholar] [CrossRef]
- Hansson, E.; Mattisson, K.; Bjork, J.; Ostergren, P.O.; Jakobsson, K. Relationship between commuting and health outcomes in a cross-sectional population survey in southern Sweden. BMC Public Health 2011. [Google Scholar] [CrossRef]
- Bus Association Victoria, Public Transport Use a Ticket to Health; Bus Association Victoria: Melbourne, Australia, 2010.
- NSW Ministry of Health. New South Wales Population Health Survey. Available online: http://www.health.nsw.gov.au/publichealth/surveys/phs.asp (accessed on 15 March 2012).
- R Development Core Team, R: A Language and Environment for Statistical Computing; R Foundation for Statistical Computing: Vienna, Austria, 2011.
- Davidson, A.C.; Hinkley, D.V. Bootstrap Methods and Their Application; Cambridge University Press: Cambridge, UK, 1997. [Google Scholar]
- Wegman, E.J.; Wright, I.W. Splines in statistics. J. Am. Stat. Assoc. 1983, 78, 351–365. [Google Scholar]
- Lachapelle, U.; Frank, L.; Saelens, B.E.; Sallis, J.F.; Conway, T.L. Commuting by public transit and physical activity: Where you live, where you work, and how you get there. J. Phys. Act. Health 2011, 8(Suppl 1), S72–S82. [Google Scholar]
- Edwards, R.D. Public transit, obesity, and medical costs: Assessing the magnitude. Prev. Med. 2008, 46, 14–21. [Google Scholar] [CrossRef]
- Villanueva, K.; Giles-Corti, B.; McCormack, G. Achieving 10,000 steps: A comparison of public transport users and drivers in a university setting. Prev. Med. 2008, 47, 338–341. [Google Scholar] [CrossRef]
- Besser, L.M.; Dannenberg, A.L. Walking to public transit steps to help meet physical activity recommendations. Am. J. Prev. Med. 2005, 29, 273–280. [Google Scholar] [CrossRef]
- Evans, A.W.; Addison, J.D. Interactions between rail and road safety in great Britain. Accid. Anal. Prev. 2009, 41, 48–56. [Google Scholar] [CrossRef]
- Morabia, A.; Mirer, F.E.; Amstislavski, T.M.; Eisl, H.M.; Werbe-Fuentes, J.; Gorczynski, J.; Goranson, C.; Wolff, M.S.; Markowitz, S.B. Potential health impact of switching from car to public transportation when commuting to work. Am. J. Public Health 2010, 100, 2388–2391. [Google Scholar] [CrossRef]
- Wener, R.; Evans, G. A morning stroll: Levels of physical activity in car and mass transit commuting. Environ. Behav. 2007, 39, 62–74. [Google Scholar] [CrossRef]
- Davis, M.G.; Fox, K.R.; Hillsdon, M.; Coulson, J.C.; Sharp, D.J.; Stathi, A.; Thompson, J.L. Getting out and about in older adults: The nature of daily trips and their association with objectively assessed physical activity. Int. J. Behav. Nutr. Phys. Act. 2011, 8. [Google Scholar] [CrossRef]
- MacDonald, J.M.; Stokes, R.J.; Cohen, D.A.; Kofner, A.; Ridgeway, G.K. The effect of light rail transit on body mass index and physical activity. Am. J. Prev. Med. 2010, 39, 105–112. [Google Scholar] [CrossRef]
- Lindstrom, M. Means of transportation to work and overweight and obesity: A population-based study in southern Sweden. Prev. Med. 2008, 46, 22–28. [Google Scholar] [CrossRef]
- McCormack, G.R.; Giles-Corti, B.; Bulsara, M. The relationship between destination proximity, destination mix and physical activity behaviors. Prev. Med. 2008, 46, 33–40. [Google Scholar] [CrossRef]
- Morabia, A.; Amstislavski, P.N.; Mirer, F.E.; Amstislavski, T.M.; Eisl, H.; Wolff, M.S.; Markowitz, S.B. Air pollution and activity during transportation by car, subway, and walking. Am. J. Prev. Med. 2009, 37, 72–77. [Google Scholar] [CrossRef]
- Coogan, P.F.; White, L.F.; Adler, T.J.; Hathaway, K.M.; Palmer, J.R.; Rosenberg, L. Prospective study of urban form and physical activity in the black women’s health study. Am. J. Epidemiol. 2009, 170, 1105–1117. [Google Scholar] [CrossRef]
- Brown, B.B.; Werner, C.M. A new rail stop: Tracking moderate physical activity bouts and ridership. Am. J. Prev. Med. 2007, 33, 306–309. [Google Scholar] [CrossRef]
- Cleland, V.J.; Timperio, A.; Crawford, D. Are perceptions of the physical and social environment associated with mothers’ walking for leisure and for transport? A longitudinal study. Prev. Med. 2008, 47, 188–193. [Google Scholar] [CrossRef]
- Frank, L.D.; Greenwald, M.J.; Winkelman, S.; Chapman, J.; Kavage, S. Carbonless footprints: Promoting health and climate stabilization through active transportation. Prev. Med. 2010, 50(Suppl 1), S99–S105. [Google Scholar]
- Lachapelle, U.; Frank, L.D. Transit and health: Mode of transport, employer-sponsored public transit pass programs, and physical activity. J. Public Health Policy 2009, 30(Suppl 1), S73–S94. [Google Scholar]
- Li, F.; Harmer, P.A.; Cardinal, B.J.; Bosworth, M.; Acock, A.; Johnson-Shelton, D.; Moore, J.M. Built environment, adiposity, and physical activity in adults aged 50-75. Am. J. Prev. Med. 2008, 35, 38–46. [Google Scholar] [CrossRef]
- Liao, Y.; Harada, K.; Shibata, A.; Ishii, K.; Oka, K.; Nakamura, Y.; Inoue, S.; Shimomitsu, T. Perceived environmental factors associated with physical activity among normal-weight and overweight Japanese men. Int. J. Environ. Res. Public Health 2011, 8, 931–943. [Google Scholar] [CrossRef]
- McConville, M.E.; Rodriguez, D.A.; Clifton, K.; Cho, G.; Fleischhacker, S. Disaggregate land uses and walking. Am. J. Prev. Med. 2011, 40, 25–32. [Google Scholar] [CrossRef]
- New South Wales Department of Health, The Health of the People of NSW—Report of the Chief Health Officer; New South Wales Department of Health: Sydney, Australia, 2010.
- Australian Government, National Physical Activity Guidelines for Adults; Department of Health and Aged Care, Australian Government: Canberra, Australia, 2005.
- Australian Institute of Health and Welfare (AIHW), Australia’s Health Series No. 12. In Australia’s Health 2010; AIHW: Sydney, Australia, 2010.
- Douglas, M.; Thomson, H.; Jepson, R.; Hurley, F.; Higgins, M.; Muirie, J.; Gorman, D. Health Impact Assessment of Transport Initiatives: A Guide; NHS Health Scotland: Edinburgh, UK, 2007. [Google Scholar]
- De Bourdeaudhuij, I.; Sallis, J.F.; Saelens, B.E. Environmental correlates of physical activity in a sample of Belgian adults. Am. J. Health Promot. 2003, 18, 83–92. [Google Scholar] [CrossRef]
- Kamada, M.; Kitayuguchi, J.; Inoue, S.; Kamioka, H.; Mutoh, Y.; Shiwaku, K. Environmental correlates of physical activity in driving and non-driving rural Japanese women. Prev. Med. 2009, 49, 490–496. [Google Scholar] [CrossRef]
- Pikora, T.J.; Giles-Corti, B.; Knuiman, M.W.; Bull, F.C.; Jamrozik, K.; Donovan, R.J. Neighborhood environmental factors correlated with walking near home: Using spaces. Med. Sci. Sports Exerc. 2006, 38, 708–714. [Google Scholar] [CrossRef]
- Lovasi, G.S.; Neckerman, K.M.; Quinn, J.W.; Weiss, C.C.; Rundle, A. Effect of individual or neighborhood disadvantage on the association between neighborhood walkability and body mass index. Am. J. Public Health 2009, 99, 279–284. [Google Scholar] [CrossRef]
- Cerin, E.; Leslie, E.; du Toit, L.; Owen, N.; Frank, L.D. Destinations that matter: Associations with walking for transport. Health Place 2007, 13, 713–724. [Google Scholar] [CrossRef]
Appendix
Table 4.
Studies reporting associations between the use of public transport and health outcomes in adults.
© 2012 by the authors; licensee MDPI, Basel, Switzerland. This article is an open-access article distributed under the terms and conditions of the Creative Commons Attribution license (http://creativecommons.org/licenses/by/3.0/).