


Highlights
Public health relevance—How does this work relate to a public health issue?
- Non-medical use of cannabis or opioids and their adverse health effects represent growing public health concerns amid increasing cannabis legalization and the ongoing opioid overdose epidemic.
- Adverse childhood experiences (ACEs), a widespread and preventable public health problem, are strongly associated with substance use behaviors, yet their contribution to substance-related harms is not well quantified.
Public health significance—Why is this work of significance to public health?
- This study quantifies that nearly 65% of adverse health effects from non-medical cannabis or opioid use are attributable to exposure to two or more ACEs, highlighting a substantial and previously undermeasured burden.
- By linking ACEs to both substance use and resulting adverse health effects using population-level data, this work advances understanding beyond prior studies that focused primarily on use rather than harm.
Public health implications—What are the key implications or messages for practitioners, policy makers and/or researchers in public health?
- Preventing ACEs through evidence-based strategies (e.g., economic supports, early childhood interventions, and family-focused programs) may substantially reduce substance-related harms in adulthood.
- Integrated public health approaches that address both childhood adversity and substance use are critical for reducing long-term health consequences and improving population health outcomes.
Abstract
Non-medical use of cannabis (NmC) and/or opioids (NmO) can lead to adverse health effects (AHEs), yet the proportion of these harms attributable to adverse childhood experiences (ACEs) remains unclear. This study estimated the contribution of ACEs to AHEs from NmC and/or NmO among adults aged ≥18 years using 2019–2020 Behavioral Risk Factor Surveillance System data from Arizona and Massachusetts. We conducted a retrospective cohort analysis of 24,739 respondents, linking past ACE exposure to self-reported NmC/NmO/NmC&NmO and related AHEs. Generalized linear models with a log link and binomial distribution adjusted for socio-demographic, healthcare access, and geographic factors were used to estimate associations and population-attributable fractions (PAFs). Propensity score methods matched respondents with and without ACEs on demographic and location characteristics. Among all the adults, 17.9% reported NmC, 5.8% reported NmO, and 2.4% reported NmC&NmO; among users of NmC/NmO/NmC&NmO, 5.0%/13.2%/36.0% reported AHEs. Among the respondents reporting AHEs from non-medical substance use, exposure to ≥2 ACEs was common (NmC: 89%; NmO: 82%; NmC&NmO: 84%). Compared to adults without ACEs, those with ≥2 ACEs had a higher likelihood of AHEs for NmC (adjusted relative risk [aRR] = 3.54, 95% CI: 1.65–7.59) and NmO (aRR = 3.64, 95% CI: 1.99–6.66) but not NmC&NmO (aRR: 1.86, 95% CI: 0.84–4.09). PAFs indicated that 63% (NmC) to 64% (NmO) of AHEs among the adults reporting NmC or NmO were attributable to ≥2 ACEs. Preventing childhood adversity may substantially reduce substance-related harms in adulthood.
1. Introduction
The legal treatment of cannabis use has undergone significant transformations in recent years, with 24 states enacting measures that permit adult non-medical use [1,2]. This shift in the cannabis policy landscape has coincided with the opioid overdose epidemic, during which the drug overdose deaths involving opioids increased five-fold from 2003 to 2023 [3]. Commonalities in non-medical use of cannabis (NmC) or opioids (NmO) can be attributed to several factors: cannabis may lead to use of non-prescription opioids [4,5,6,7], cannabis used concurrently with opioids may enhance analgesic opioid effects [8], cannabis may be used as self-treatment to alleviate opioid withdrawal symptoms [9,10], or adults may use cannabis to substitute for non-medical opioids use. The intricate relationship between these two substances necessitates research into the health implications when they are used separately and concurrently, as well as an understanding of risk factors that may be related to co-use-related harms, such as adverse childhood experiences (ACEs).
ACEs are potentially traumatic events that occur in childhood (0–17 years) [11]. A substantial body of literature has documented an increased risk of cannabis or illicit drug use among individuals with ACEs [7,12,13,14,15,16,17,18]. However, given that nearly 50% of U.S. states have already legalized the non-medical use of cannabis, it is now crucial to expand focus from risk factors for substance use to understanding risk factors for adverse health effects (AHEs). AHEs associated with non-medical cannabis and/or opioid use range in type and severity, including psychiatric and mental health effects [19,20,21,22]; substance use disorder [22,23]; withdrawal symptoms [22]; emergency room visits and hospitalizations [24,25,26]; acute poisoning and overdose [22,27]; and mortality [22,28,29,30]. Despite the scope and severity of AHEs associated with non-medical substance use [31], less is known about factors that modify risk for AHEs [32], including ACEs. Presently, evidence of the relationship between ACEs and substances’ AHEs comes predominantly from smaller studies that analyzed adults in a single healthcare facility [12] or adolescents in select school districts [7,18]. Among a few larger studies, some utilized data from over a decade ago, while others did not attempt to assess the proportion of AHEs attributable to ACEs [7,12,13,14,18]. To address the evolving landscape of cannabis use in the United States and the complex relationship between cannabis and opioid use, this study analyzed the recent data from Arizona and Massachusetts—two states that included detailed questions on AHEs due to NmC or NmO on their Behavioral Risk Factor Surveillance System (BRFSS) surveys. We estimated the prevalence of NmC, NmO, non-medical use of both substances (NmC&NmO), and AHEs from non-medical substance use; examined associations between cumulative ACE exposure, NmC/NmO/NmC&NmO, and AHEs; and calculated population-attributable fractions to estimate the proportion of AHEs due to one or both substances that could potentially be averted by preventing childhood adversities.
2. Materials and Methods
This analysis used individual-level 2019–2020 data from the BRFSS survey―an annual, random-digit-dialed cellular and landline phone survey collecting self-reported information on health conditions and risk behaviors from U.S. adults 18+ years who live in a private residence or college housing [33]. The median survey response rates in 2019/2020 were 49.4%/46.8%, respectively. As a secondary analysis of publicly available data without personal identifiers, this study did not require institutional review board approval.
2.1. Measures
2.1.1. Exposures
For each 2019–2020 BRFSS respondent, individual-level ACE exposures (Table 1) were obtained through small area estimation (SAE). As described in Aslam et al. [34,35], predictive SAE models—logistic regressions (LR) and multilevel mixed-effects LR (MMEL) performed on each ACEs—controlled for individual-level BRFSS variables and state-level factors from five external sources, including socio-demographic characteristics, access to care, and ACE-related health outcomes. Model performance was evaluated by comparing observed ACE measures from BRFSS with corresponding predictions using standard metrics (e.g., sensitivity, specificity, predictive values, percent agreement, and Pearson correlation). Resampling methods—jackknifed MMEL/LR that leave out one state at a time—were used as sensitivity analyses, since they reduce possible state-specific non-response bias by resampling models with different ACEs non-response patterns. Additional details on model specification, validation performance, and limitations are provided in Aslam et al. [34,35]. SAE-based affirmative individual ACEs (household member with mental health or substance use problems, or incarcerated; parental separation/divorce; witnessing intimate partner violence; or experiencing physical, emotional, or sexual abuse during childhood) were summed and then grouped into exposure to no, any, or 2+ ACEs [36]. Coding of qualifying responses to each ACE question [37,38] is described elsewhere.
Table 1.
Definition of study variables.
2.1.2. Outcomes
For those 2019–2020 BRFSS survey participants who resided in Arizona or Massachusetts, we linked estimates of ACE exposure during childhood with the state-added individual-level data on the following six outcomes (Table 2) self-reported during adulthood:
Table 2.
Questions on the non-medical use of cannabis or opioids and resultant adverse health effects in the 2019–2020 Behavioral Risk Factor Surveillance System surveys.
- Non-medical use of cannabis (NmC);
- Non-medical use of opioids (NmO);
- Non-medical use of both substances (NmC&NmO);
- Adverse health effects due to non-medical use of cannabis alone (NmC AHEs);
- Adverse health effects due to non-medical use of cannabis alone NmO alone (NmO AHEs);
- Adverse health effects due to either of the two used substances (NmC&NmO AHEs).
2.1.3. Covariates
Covariates (Table 1) included demographic characteristics (sex, race/ethnicity, and age), socio-economic characteristics (marital status, education, employment, annual household income, and home ownership), healthcare access (availability of health care coverage, access to a personal healthcare provider, and need to skip medical visits due to costs), and location (urbanicity and metropolitan statistical area [MSA] identifier).
2.2. Statistical Analysis
2.2.1. Inclusion and Exclusion Criteria
Of those 26,141 survey respondents who received NmC/NmO questions in Arizona (N = 19,232) and Massachusetts (N = 6909), we excluded 1402 (5.36%) respondents who did not live in the state when surveyed, leaving 24,739 (94.64%) participants total, including 17,830 respondents in Arizona and 6909 respondents in Massachusetts (92.71% and 100.00% of the respondents who received NmC/NmO questions in each state, respectively). The non-response rate by outcome was 2.95% for NmC, 0.58% for NmC AHEs, 0.19% for NmO, 36.63% for NmO AHEs, 13.26% for NmC&NmO, and 0.29% for NmC&NmO AHEs.
2.2.2. Propensity Score Matching
To better isolate the exposure effect, we used propensity score methods (Stata v17.0 StataCorp LP, College Station, TX, USA; command psmatch2) to match characteristics of persons with ACE exposure to persons without ACEs on the characteristics that were unlikely affected by ACE exposures, including location (state, urbanicity, MSA) and demographics (sex, race/ethnicity, age) [39,40]. Propensity score methods are particularly useful when randomization of exposure is unethical (e.g., intentional exposure of children to ACEs) [39]. To reduce bias and improve the precision of exposure estimates, we conducted a one-to-many match by applying kernel weights appropriate for complex survey designs [39,41] and using Mahalanobis distance between model covariates [42,43]. Among the six study outcomes, we matched the characteristics of persons with/without ACE exposure only for substance use (NmC, NmO, and NmC&NmO) and not for resulting AHEs, since AHE intensity may depend on epigenetic characteristics unobserved in our model [4].
In all substance use specifications, propensity score matching ensured a close match (Table S1) between demographic characteristics of the respondents with and without exposure to ACEs (zero standardized differences in covariates across the exposure and non-exposure groups; sample balance t-test p-value = 1.00). Similarity in demographic characteristics between the persons with and without ACE exposure allowed for minimizing the estimated impact of those characteristics on outcomes and ensuring that any differences in outcomes between persons with/without ACE exposure were likely attributable to the impact of ACEs rather than to the different distribution of covariates within the exposure and non-exposure groups [44].
2.2.3. Modeling
We assessed the association between our six outcomes and exposure to any or 2+ ACEs by using the survey-weighted generalized linear models (GLMs) with log link and binomial distribution, where module-appropriate survey weights were adjusted for multi-year complex survey design [33,45], and standard errors were estimated using Taylor linearization (Stata v17.0 vce(linearized)) default. Each GLM model included one cumulative ACE variable at a time (any ACEs versus exposure to 2+ ACEs), with adjusted models additionally controlling for the respondents’ demographic and socio-economic characteristics, healthcare access, and location. Population-attributable fractions (PAFs) by ACE category were estimated for the outcome/ACEs combinations with statistically significant (two-sided p < 0.05) associations by using Miettinen’s method; PAFs reflect the proportion of prevalent conditions associated with ACE exposure under model assumptions and do not imply causality [46,47] (Stata v17.0 command punaf [48]). All analyses were performed from October 2023 to September 2024.
2.2.4. Sensitivity Analyses
Additionally, we conducted two types of sensitivity analyses. While our main results combined Arizona’s and Massachusetts’ data into a pooled sample (Table 3); we also conducted separate analyses for Arizona and Massachusetts to evaluate state-specific differences in defining study outcomes (Table 4), with Arizona predominantly focusing on recent substance use (NmC AHEs: within past 6 months; NmO AHEs and NmC/NmO: past 12 months; Table 2) and short-term AHEs (e.g., anxiety, vomiting, and breathing problems after using a substance), while Massachusetts focused on lifetime use and AHEs related to substance use disorder (e.g., feeling addicted or experiencing trouble getting off a substance). Second, we used the 2020 BRFSS data from Arizona—a state and year where both the actual and predicted responses to ACEs questions were available [34,35]—and conducted separate analyses involving either the actual or predicted responses to assess the sensitivity of key findings to the use of predicted ACE estimates. In sensitivity analyses involving subgroups with smaller samples (e.g., AHEs to both substances in each state), we used two-sided p < 0.1 to account for the potential for type I error [49,50].
Table 3.
Associations between the exposure to adverse childhood experiences and non-medical use of cannabis or opioids among adults in Arizona and Massachusetts in 2019–2020: relative risks and population-attributable fractions by ACE category.
Table 4.
Associations between the exposure to two and more adverse childhood experiences and non-medical use of cannabis or opioids among adults in Arizona and Massachusetts in 2019–2020: relative risks and population-attributable fractions by state.
3. Results
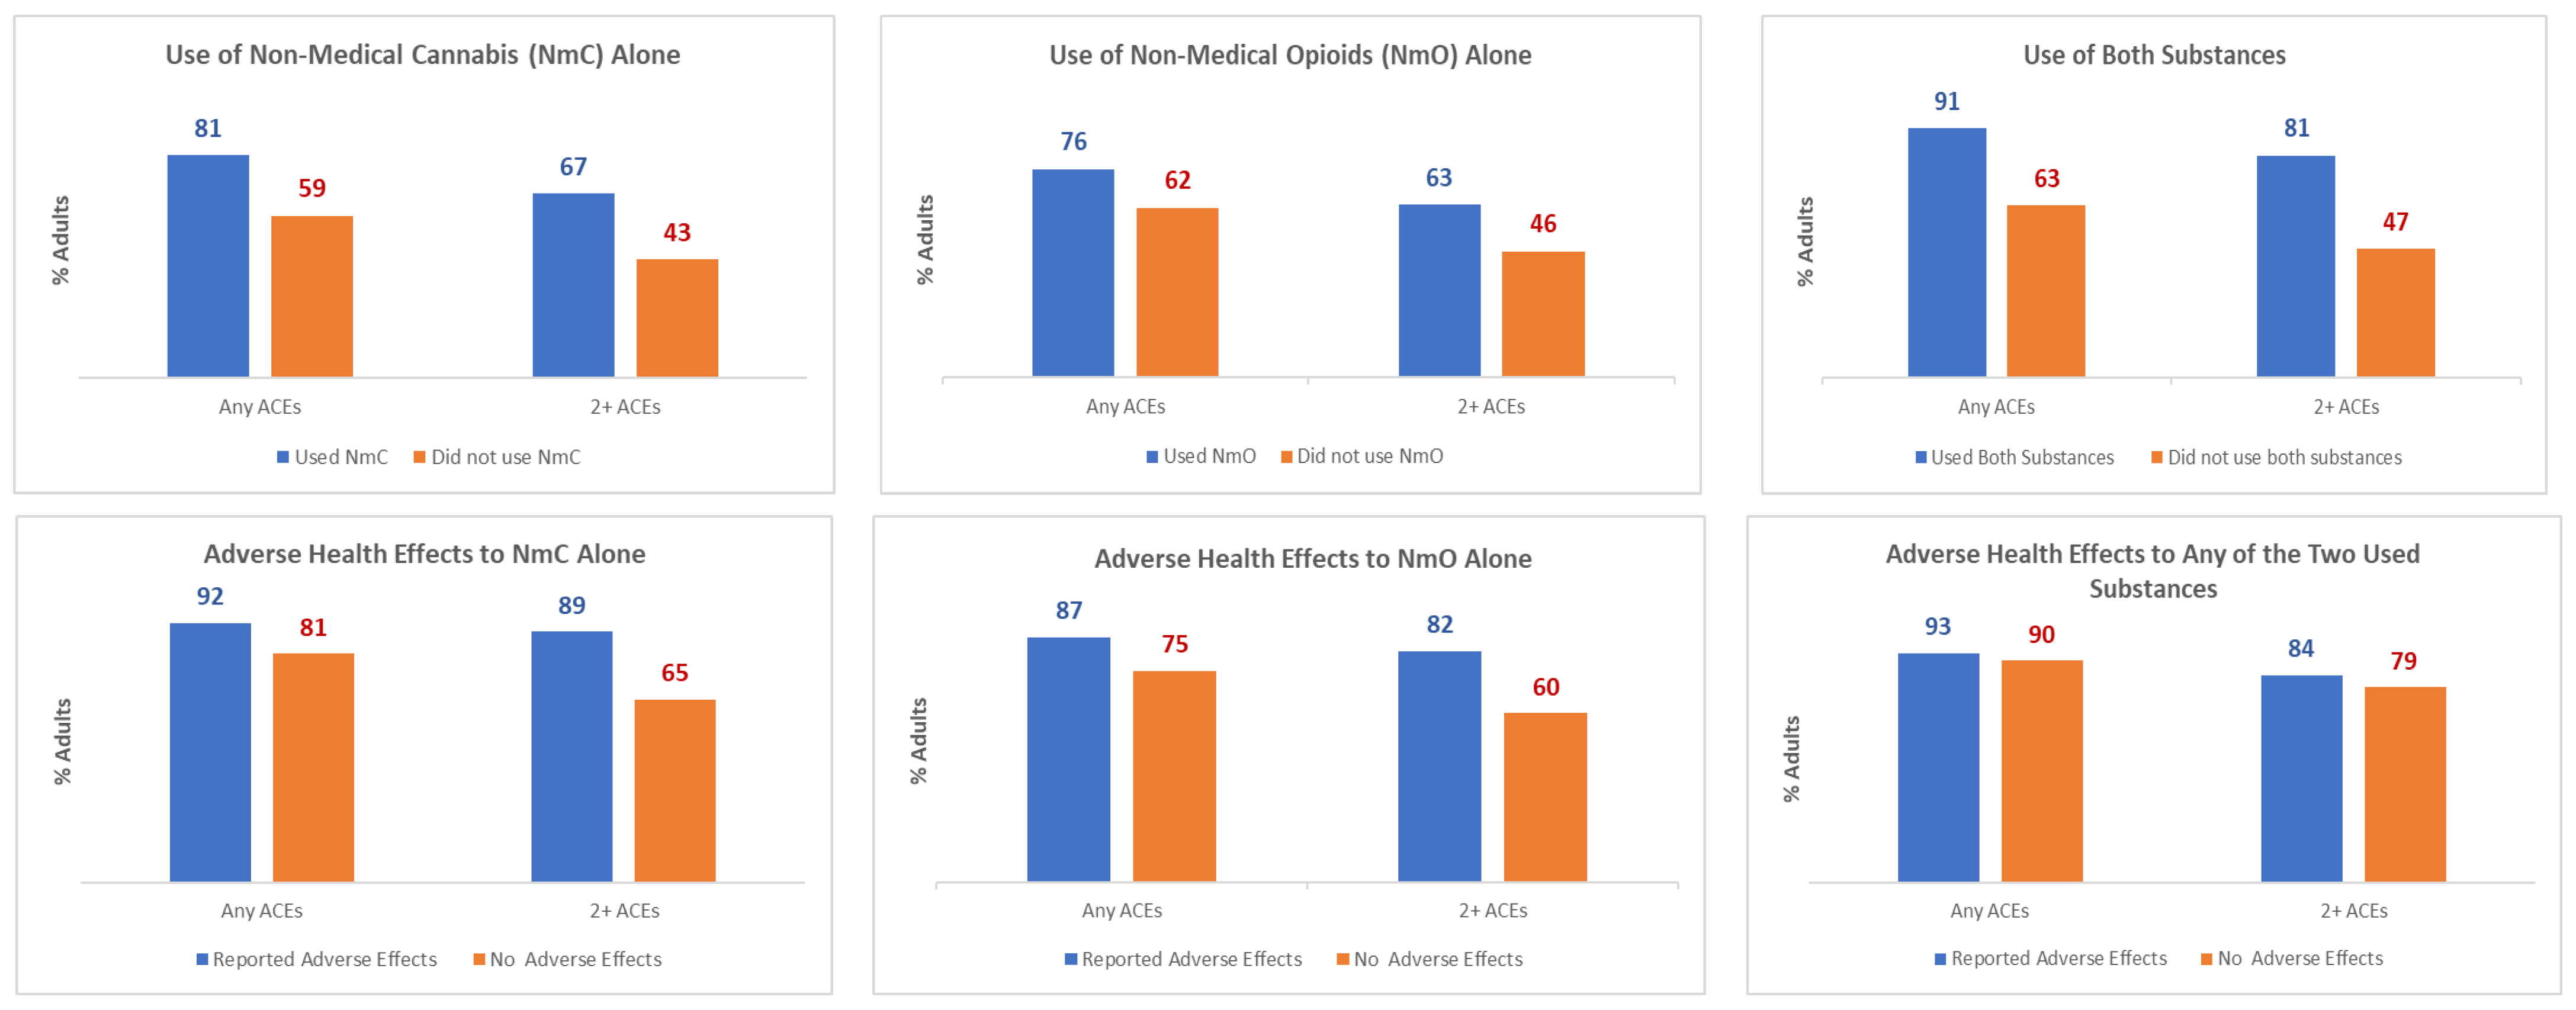
In Massachusetts and Arizona, an estimated 1,565,367 (17.9%) adults reported the use of NmC; 515,525 (5.8%) adults reported NmO; and 222,731 (2.4%) reported NmC&NmO (Table S2). Of those, 78,797 adults (5.0% of NmC) reported NmC AHEs; 67,895 adults (13.2% of NmO) reported NmO AHEs; and 80,159 adults (36.0% of NmC&NmO) reported NmC&NmO AHEs. Among the adults who reported substance use and resultant AHEs, the percentage of adults with past exposure to ACEs was considerably higher compared to the adults with no reported substance use (Figure 1; Table S2). For instance, the exposure to 2+ ACEs was estimated to be 67%/63%/81% among the adults who reported NmC/NmO/NmC&NmO, respectively―a significantly (p < 0.001) higher percentage as compared to 43%/46%/47% of the adults who did not report the use of those substances. Among the adults with non-medical use of substances, the exposure to 2+ ACEs was estimated to be 89%/82%/84% among the adults who reported NmC/NmO/NmC&NmO AHEs, which was substantially higher as compared to 65%/60%/79% of the adults who did not report AHEs (p-value of <0.001 < 0.001/0.353, respectively).
Figure 1.
ACE Prevalence Among Adults Who Reported the Non-medical Use of Cannabis and Opioids and the Resulting Adverse Health Effects in Arizona and Massachusetts, 2019–2020. Weighted estimates of ACE prevalence are reported by substance use or adverse health effects category. For instance, the exposure to 2+ ACEs was estimated to be 67% among the adults in Arizona and Massachusetts who in 2019–2020 reported the non-medical use of cannabis (NmC) and 43% among the adults who did not report NmC.
Regression analysis corroborated the key associations between ACEs, non-medical use of substances, and resultant AHEs (Table 3). Compared to the adults without ACE exposures, the probability of reporting non-medical substance use was significantly higher for all outcomes and exposures (NmC, NmO, or NmC&NmO; any ACEs or 2+ ACEs). By contrast, the results for AHEs were statistically significant for each individual substance (but not for non-medical use of both substances) among the adults exposed to 2+ ACEs. Notably, compared to the adults without ACE exposure, among the adults exposed to 2+ ACEs, the probability of AHEs was approximately 250% higher for each type of non-medical substance use (NmC: aRR = 3.54, 95%CI, 1.65–7.59; NmO: aRR = 3.64, 95%CI, 1.99–6.66). PAFs for Massachusetts and Arizona (Table 3) demonstrate that preventing exposure to 2+ ACEs may contribute to averting one in three NmC or NmO (NmC: PAF = 32.38%, NmO: PAF = 36.17%) or one in two NmC&NmO (PAF = 53.96%). Furthermore, preventing exposure to 2+ ACEs may contribute to averting six in ten NmC AHEs or NmO AHEs (NmC PAF = 62.78%, NmO PAF = 64.10%).
The sensitivity analyses corroborated the main findings from this study. Regardless of the state-specific differences in defining study outcomes, we found consistently higher NmC or NmO and resulting AHEs among the adults with past exposure to 2+ ACEs (Table 4). For instance, compared to the adults without ACE exposure, the probability of NmC AHEs among the adults with past exposure to 2+ ACEs was 105% higher in Arizona, which examined short-term AHEs (aRR = 2.05, 90%CI, 1.04–4.02), and 608% higher in Massachusetts, which examined longer-term AHEs (aRR = 7.08, 95%CI, 2.76–18.15), while the probability of NmO AHEs was 143% higher in Arizona (short-term AH aRR = 2.43, 95%CI, 1.17–5.06) and 228% higher in Massachusetts (longer-term AHE aRR = 3.28, 95%CI, 1.06–10.22). The resulting PAFs demonstrated that preventing 2+ ACEs may contribute to averting 40–80% of NmC AHEs (Arizona short-term AHE PAF = 37.30%, Massachusetts longer-term AHE PAF = 79.14%) or 50–65% of NmO AHEs (Arizona short-term AHE PAF = 50.26%, Massachusetts longer-term AHE PAF = 64.57%).
Furthermore, the sensitivity analyses demonstrated robustness of key findings from this study to the use of the actual versus predicted ACE estimates. Due to the high accuracy of predicted ACE exposures—83%/100% of the respondents who actually experienced any/2+ ACEs were predicted to experience any/2+ ACEs—results from specifications that involved actual ACE exposure closely matched specifications with predicted ACE exposures (Supplementary Materials Table S3). For instance, for both NmC/NmO and resulting AHEs, the predicted ACEs aRR/PAFs either matched the actual aRR/PAFs or represented the conservative lower bound of the effect.
4. Discussion
Using recent data from states that included questions on non-medical use of cannabis/opioids and resultant adverse health effects, we estimated considerably higher probability of reporting non-medical use of and AHEs to these substances among adults with past ACE exposure as compared to adults without ACE exposures. Compared to the adults without ACE exposure, the probability of non-medical use of either cannabis or opioids was approximately 100% higher and the probability of AHEs from either substance was approximately 250% higher among the adults with past exposure to 2+ ACEs. Consequently, estimated PAFs demonstrated that preventing exposure to 2+ ACEs may contribute to averting up to nearly 40% of NmC or NmO and up to 65% of AHEs from either substance.
The general patterns for the associations between ACEs and substance use/AHEs were consistent across model specifications. At the same time, the magnitude of the effect differed by state, likely reflecting variations in survey measurement of substance use/AHEs and differences in NmC legalization. For instance, the probabilities of NmO and associated AHEs among the adults with ACEs were higher in Massachusetts compared to Arizona (e.g., for 2+ ACEs and NmO AHEs: aRR = 3.28 in Massachusetts, aRR = 2.43 in Arizona), possibly reflecting the lifetime orientation of substance use questions in Massachusetts versus the past-year questions used by Arizona. Similarly, for Massachusetts, we estimated a higher probability of NmC compared to Arizona among people with ACEs (e.g., for 2+ ACEs: aRR = 2.02 in Massachusetts, aRR = 1.60 in Arizona), which may reflect either timing of NmC legalization (Massachusetts: 2016 [2,51]; Arizona: November 2020 [52,53] or duration of experiences (Massachusetts: lifetime use; Arizona: use within past 6 months). In terms of AHEs, Massachusetts included in their BRFSS a comprehensive list of questions to capture the signs of substance use disorder [54] due to NmC and focused on lifetime AHE experiences. By contrast, Arizona included questions on short-term AHEs related to substance use and focused on the use within the past 6 months. Consequently, the probability of NmC AHEs and related PAFs was consistently higher in Massachusetts as compared to Arizona (e.g., for 2+ ACEs: aRR = 7.08 in Massachusetts, aRR = 2.05 in Arizona). Although the data from these two states did not allow for exploring which of the reasons―either the definition of substance use/AHEs or the duration of experiences―contributed the most to higher aRR and PAFs in Massachusetts versus Arizona, we found consistently higher NmC/NmO use and related AHEs among the adults with past ACE exposure, regardless of state-specific variations in measurements. Furthermore, compared to the adults without ACE exposure, we estimated consistently higher probability of non-medical use of each substance and resultant AHEs among the adults with past ACE exposure, regardless of whether we analyzed non-medical use of cannabis or opioids. In terms of co-use, ACEs were consistently associated with increased use of both substances, regardless of whether we combined Arizona and Massachusetts or estimated them separately. The mixed results for NmC&NmO AHEs—the statistically insignificant results for Massachusetts alone or when combined with Arizona—underscore the need for additional longitudinal or quasi-experimental analyses to assess the changes in co-use AHEs after states legalized NmC, particularly among adults facing barriers to opioid treatment [55].
Direct comparisons of our results to a wealth of research on substance use are difficult, given heterogeneous definitions of ACEs and substance use [56,57]. Generally, our study corroborates previous findings demonstrating strong associations between ACEs and substance use [7,12,13,14,15,16,17,57,58,59,60,61]. Our study uniquely contributes to the literature by focusing on AHEs due to substance use and quantifying the proportion of NmC/NmO AHEs that could be averted by preventing ACEs, measured as PAF. While our cross-sectional study design limits causal inference of PAFs, our PAF estimates quantify the proportion of outcome burden in the population statistically associated with ACEs and therefore indicate the potential public health impact if those ACE exposures were reduced. Few studies have examined ACEs PAFs for substance use and AHE outcomes. Dube et al. used data from the original CDC-Kaiser study to estimate PAFs due to experiencing any ACEs: 63% for ever being addicted to illicit drugs and 64% for ever using injection drugs [12]. Similarly, a study by Swedo et al. among adolescents in a rural county in Ohio found that 71.6% of past 30-day use of NmO was attributable to experiencing any ACEs [7]. Consistent with Dube et al. and Swedo et al., we estimated PAF for NmO AHEs to be 64.10%. However, to our knowledge, our study is the first to estimate PAF for NmC AHEs (62.78%) and, equally noteworthy, to establish its comparability with the PAF for NmO AHEs (64.10%). Furthermore, in our study, the unique set of AHE questions asked by each state allowed for drawing conclusions about associations between ACEs and both short- and long-term AHEs due to NmC/NmO. We found considerable PAFs for experiencing 2+ ACEs and both short-term AHEs due to NmC (37.30%) or NmO (50.26%) in Arizona, and long-term AHEs due to NmC (79.14%) or NmO (64.57%) in Massachusetts. Elevated substance AHEs among adults exposed to ACEs may reflect various biological and environmental pathways, including genetic transmission of drug vulnerability, in utero drug exposure among adults with familial substance abuse [62], substance abuse as a coping mechanism for neurotransmitter dysregulation from ACEs-related stress [63], or pain management necessitated by increased reports of chronic pain among the adults who experienced child abuse/neglect [13]. Regardless of the reasons, the sizable PAFs―for various ACEs/AHE combinations estimated in our paper―highlight the strong potential for ACEs prevention as a public health tool to prevent substance use and resulting negative health consequences.
The interrelated, preventable problems of ACEs and substance use require a coordinated approach. Focusing on prevention of both ACEs and substance use through system-level changes, public education, and implementation of evidence-based policies/programs can prevent ACEs [64], mitigate their harms, and decrease both substance use and their AHEs [65]. The American Public Health Association (APHA) and CDC collaborated on the Urgent. Related. Preventable. initiative to highlight the need for a coordinated approach to address the interrelated crises of exposure to ACEs, overdose, and suicide [66]. Prevention strategies can be amplified through a comprehensive public approach to these problems, and through alignment of policy, funding, and programs to address both ACEs and substance use together, rather than focusing on the issues independently. Effective approaches to prevent ACEs include providing long-term social and economic supports, including paid family/sick leave, high-quality childcare, housing support [64], or early childhood home visitation [49]. Improving access to substance use treatment increases safe, stable, nurturing relationships/environments; mitigates the negative impact of ACEs for people with substance use disorder; and prevents ACEs in the next generation [64]. While our study quantifies the strong potential impact of ACEs prevention on use of and AHEs from NmC/NmO, additional research is needed to develop and translate evidence-based strategies that address the interconnectedness between ACEs and substance use prevention.
Limitations
This study has several limitations. First, BRFSS relies on self-reported data that may be subject to recall bias [67,68,69,70]. Second, BRFSS data are collected for private residences and exclude populations at higher risk for NmC/NmO use and AHEs (e.g., those incarcerated or homeless). Third, NmO AHE non-response of 36.63% may introduce bias, with current estimates representing the upper bound of the effect if non-respondents did not experience AHEs and the lower bound otherwise. Fourth, ACE estimates for Arizona (2019) and Massachusetts (2019/2020) were predicted through small area estimation. Fifth, the results from two states are not generalizable nationwide.
5. Conclusions
Up to 40% of NmC or NmO and up to 65% of the resulting AHEs were associated with past exposure to 2+ ACEs. Upstream public health prevention strategies across sectors aimed to prevent ACEs [71,72,73] may decrease non-medical substance use and limit substance-related adverse health effects in the future.
Supplementary Materials
The following supporting information can be downloaded at https://www.mdpi.com/article/10.3390/ijerph23050574/s1, Table S1: Socio-demographic characteristics of BRFSS respondents matched on exposure to ACEs; Table S2: ACE prevalence among the adults who reported non-medical use of cannabis and opioids and the resulting adverse health effects in Arizona and Massachusetts, 2019–2020; Table S3: Non-medical use of cannabis and opioids in Arizona in 2020: relative risks and population-attributable fractions for the actual ACEs compared to predicted ACE Exposures.
Author Contributions
Conceptualization, M.V.A., C.R.-P. and E.A.S.; methodology, M.V.A.; validation, C.R.-P. and E.A.S.; formal analysis, M.V.A.; data curation, M.V.A., C.R.-P., C.F., S.B.L.B., C.G. and E.A.S.; writing—original draft preparation, M.V.A., C.R.-P., C.F., S.B.L.B., C.G. and E.A.S.; writing—review and editing, M.V.A., C.R.-P., C.F., S.B.L.B., C.G. and E.A.S.; visualization, M.V.A.; supervision, C.F. All authors have read and agreed to the published version of the manuscript.
Funding
This research received no external funding.
Institutional Review Board Statement
This activity was reviewed by CDC, deemed not research, and was conducted consistent with applicable federal law and CDC policy. See, e.g., 45 C.F.R. part 46, 21 C.F.R. part 56; 42 U.S.C. §241(d); 5 U.S.C. §552a; 44 U.S.C. §3501 et seq.
Informed Consent Statement
Not applicable to secondary use of public health surveillance data.
Data Availability Statement
Restrictions apply to the availability of these data. Data were obtained from the Massachusetts Department of Public Health and the Arizona Department of Health Services and are available by contacting the states’ BRFSS coordinators.
Conflicts of Interest
The authors declare no conflicts of interest. Author M.V.A. performed this work as an official duty as an employee of CDC and did not join Emory Healthcare until after this work was completed.
Abbreviations
The following abbreviations are used in this manuscript:
| ACEs | Adverse Childhood Experiences |
| NmC | Non-medical Cannabis |
| NmO | Non-medical Opioids |
| NmC&NmO | Non-medical Use of Both Cannabis and Opioids |
| AHEs | Adverse Health Effects |
| BRFSS | Behavioral Risk Factor Surveillance System |
| MSA | Metropolitan Statistical Area |
| PAF | Population-Attributable Fraction |
| GLM | Generalized Linear Model |
| aRR | Adjusted Relative Risk |
| CI | Confidence Interval |
| HMO | Health Maintenance Organization |
| CDC | Centers for Disease Control and Prevention |
References
- National Conference of State Legislatures. Cannabis Overview. 2024. Available online: https://www.ncsl.org/civil-and-criminal-justice/cannabis-overview (accessed on 21 April 2026).
- National Conference of State Legislatures. State Medical Cannabis Laws. 2024. Available online: https://www.ncsl.org/health/state-medical-cannabis-laws#anchor8842 (accessed on 21 April 2026).
- Centers for Disease Control and Prevention. Drug Overdose Deaths in the United States, 2003–2023. 2024. Available online: https://www.cdc.gov/nchs/products/databriefs/db522.htm (accessed on 21 April 2026).
- American Psychiatric Association. Substance-related and addictive disorders. In Diagnostic and Statistical Manual of Mental Disorders, 5th ed.; American Psychiatric Association Publishing: Washington, DC, USA, 2022. [Google Scholar]
- Olfson, M.; Wall, M.M.; Liu, S.-M.; Blanco, C. Cannabis use and risk of prescription opioid use disorder in the United States. Am. J. Psychiatry 2018, 175, 47–53. [Google Scholar] [CrossRef] [Scilit]
- Wilson, J.; Mills, K.; Freeman, T.P.; Sunderland, M.; Visontay, R.; Marel, C. Weeding out the truth: A systematic review and meta-analysis on the transition from cannabis use to opioid use and opioid use disorders, abuse or dependence. Addiction 2022, 117, 284–298. [Google Scholar] [CrossRef] [Scilit] [PubMed]
- Swedo, E.A.; Sumner, S.A.; de Fijter, S.; Werhan, L.; Norris, K.; Beauregard, J.L.; Montgomery, M.P.; Rose, E.B.; Hillis, S.D.; Massetti, G.M. Adolescent opioid misuse attributable to adverse childhood experiences. J. Pediatr. 2020, 224, 102–109.e3. [Google Scholar] [CrossRef] [Scilit] [PubMed]
- Frohe, T.; Beseler, C.L.; Mendoza, A.M.; Cottler, L.B.; Leeman, R.F. Perceived health, medical, and psychiatric conditions in individual and dual-use of marijuana and nonprescription opioids. J. Consult. Clin. Psychol. 2019, 87, 859. [Google Scholar] [CrossRef] [Scilit] [PubMed]
- Le, K.; Le, K.D.R.; Nguyen, J.; Hua, J.; Munday, S. The Role of Medicinal Cannabis as an Emerging Therapy for Opioid Use Disorder. Pain Ther. 2024, 13, 435–455. [Google Scholar] [CrossRef] [Scilit]
- Bergeria, C.L.; Huhn, A.S.; Dunn, K.E. The impact of naturalistic cannabis use on self-reported opioid withdrawal. J. Subst. Abus. Treat. 2020, 113, 108005. [Google Scholar] [CrossRef] [Scilit]
- Centers for Disease Control and Prevention. About Adverse Childhood Experiences. 2025. Available online: https://www.cdc.gov/aces/about/index.html (accessed on 21 April 2026).
- Dube, S.R.; Felitti, V.J.; Dong, M.; Chapman, D.P.; Giles, W.H.; Anda, R.F. Childhood abuse, neglect, and household dysfunction and the risk of illicit drug use: The adverse childhood experiences study. Pediatrics 2003, 111, 564–572. [Google Scholar] [CrossRef] [Scilit]
- Merrick, M.T.; Ford, D.C.; Haegerich, T.M.; Simon, T. Adverse childhood experiences increase risk for prescription opioid misuse. J. Prim. Prev. 2020, 41, 139–152. [Google Scholar] [CrossRef] [Scilit]
- LeTendre, M.L.; Reed, M.B. The effect of adverse childhood experience on clinical diagnosis of a substance use disorder: Results of a nationally representative study. Subst. Use Misuse 2017, 52, 689–697. [Google Scholar] [CrossRef] [Scilit]
- Sebalo, I.; Königová, M.P.; Sebalo Vňuková, M.; Anders, M.; Ptáček, R. The associations of adverse childhood experiences (ACEs) with substance use in young adults: A systematic review. Subst. Abus. Res. Treat. 2023, 17, 11782218231193914. [Google Scholar] [CrossRef] [Scilit]
- Zhu, J.; Racine, N.; Devereux, C.; Hodgins, D.C.; Madigan, S. Associations between adverse childhood experiences and substance use: A meta-analysis. Child Abus. Negl. 2023, 168, 106431. [Google Scholar] [CrossRef] [Scilit]
- De la Peña-Arteaga, V.; Nogueira, S.O.; Lynskey, M.; Hines, L.A. The relationship between childhood physical and sexual abuse and adolescent cannabis use: A systematic review. Front. Psychiatry 2021, 12, 631245. [Google Scholar] [CrossRef] [Scilit] [PubMed]
- Mersky, J.P.; Topitzes, J.; Reynolds, A. Impacts of adverse childhood experiences on health, mental health, and substance use in early adulthood: A cohort study of an urban, minority sample in the US. Child Abus. Negl. 2013, 37, 917–925. [Google Scholar] [CrossRef] [Scilit] [PubMed]
- Hjorthøj, C.; Compton, W.; Starzer, M.; Nordholm, D.; Einstein, E.; Erlangsen, A.; Nordentoft, M.; Volkow, N.D.; Han, B. Association between cannabis use disorder and schizophrenia stronger in young males than in females. Psychol. Med. 2023, 53, 7322–7328. [Google Scholar] [CrossRef] [Scilit] [PubMed]
- Jefsen, O.H.; Erlangsen, A.; Nordentoft, M.; Hjorthøj, C. Cannabis Use Disorder and Subsequent Risk of Psychotic and Nonpsychotic Unipolar Depression and Bipolar Disorder. JAMA Psychiatry 2023, 80, 803. [Google Scholar] [CrossRef] [Scilit] [PubMed]
- Rizk, M.M.; Herzog, S.; Dugad, S.; Stanley, B. Suicide Risk and Addiction: The Impact of Alcohol and Opioid Use Disorders. Curr. Addict. Rep. 2021, 8, 194–207. [Google Scholar] [CrossRef] [Scilit]
- Werb, D.; Scheim, A.I.; Soipe, A.; Aeby, S.; Rammohan, I.; Fischer, B.; Hadland, S.E.; Marshall, B.D.L. Health harms of non-medical prescription opioid use: A systematic review. Drug Alcohol. Rev. 2022, 41, 941–952. [Google Scholar] [CrossRef] [Scilit]
- Lapham, G.T.; Matson, T.E.; Bobb, J.F.; Luce, C.; Oliver, M.M.; Hamilton, L.K.; Bradley, K.A. Prevalence of Cannabis Use Disorder and Reasons for Use Among Adults in a US State Where Recreational Cannabis Use Is Legal. JAMA Netw. Open 2023, 6, e2328934. [Google Scholar] [CrossRef] [Scilit]
- Hall, W.; Stjepanović, D.; Dawson, D.; Leung, J. The implementation and public health impacts of cannabis legalization in Canada: A systematic review. Addiction 2023, 118, 2062–2072. [Google Scholar] [CrossRef] [Scilit]
- Leung, J.; Chiu, V.; Chan, G.C.K.; Stjepanović, D.; Hall, W.D. What Have Been the Public Health Impacts of Cannabis Legalisation in the USA? A Review of Evidence on Adverse and Beneficial Effects. Curr. Addict. Rep. 2019, 6, 418–428. [Google Scholar] [CrossRef] [Scilit]
- Substance Abuse and Mental Health Services Administration. Drug Abuse Warning Network: National Estimates From Drug-Related Emergency Department Visits, 2024; Substance Abuse and Mental Health Services Administration: Rockville, MD, USA, 2025. [Google Scholar]
- Allaf, S.; Lim, J.S.; Buckley, N.A.; Cairns, R. The impact of cannabis legalization and decriminalization on acute poisoning: A systematic review. Addiction 2023, 118, 2252–2274. [Google Scholar] [CrossRef] [Scilit]
- Myran, D.T.; Pugliese, M.; McDonald, A.J.; Xiao, J.; Fischer, B.; Finkelstein, Y.; Tanuseputro, P.; Firth, J.; Pakpour, A.; Hsu, C.-W.; et al. Cannabis Use Disorder Emergency Department Visits and Hospitalizations and 5-Year Mortality. JAMA Netw. Open 2025, 8, e2457852. [Google Scholar] [CrossRef] [Scilit]
- Alimoradi, Z.; Lin, C.Y.; Myran, D.T.; Solmi, M.; Pakpour, A.H. Relative Risk of All-Cause Mortality Associated with Cannabis Use: A Systematic Review and Meta-Analysis of Cohort Studies. Health Sci. Rep. 2025, 8, e71212. [Google Scholar] [CrossRef] [Scilit]
- Ahmad, F.; Cisewski, J.; Rossen, L.; Sutton, P. Provisional Drug Overdose Death Counts Hyattsville; National Center for Health Statistics: Hyattsville, MD, USA, 2026. [Google Scholar] [CrossRef] [Scilit]
- Mekonen Yimer, T.; Hoch, E.; Fischer, B.; Dawson, D.; Hall, W. The adverse public health effects of non-medical cannabis legalisation in Canada and the USA. Lancet Public Health 2025, 10, e148–e159. [Google Scholar] [CrossRef] [Scilit] [PubMed]
- Fischer, B.; Russell, C.; Sabioni, P.; Van Den Brink, W.; Le Foll, B.; Hall, W.; Rehm, J.; Room, R. Lower-Risk Cannabis Use Guidelines: A Comprehensive Update of Evidence and Recommendations. Am. J. Public Health 2017, 107, e1–e12. [Google Scholar] [CrossRef] [Scilit]
- Centers for Disease Control and Prevention. 2020 BRFSS Survey Data and Documentation. 2012. Available online: https://www.cdc.gov/brfss/annual_data/annual_2020.html (accessed on 21 April 2026).
- Aslam, M.V.; Peterson, C.; Swedo, E.; Niolon, P.H.; Bacon, S.; Florence, C. Adults’ exposure to adverse childhood experiences in the United States nationwide and in each state: Modeled estimates from 2019–2020. Inj. Prev. 2024, 30, 256–260. [Google Scholar] [CrossRef] [Scilit] [PubMed]
- Aslam, M.V.; Swedo, E.; Niolon, P.H.; Peterson, C.; Sarah, B.; Florence, C. Adverse Childhood Experiences Among U.S. Adults: National and State Estimates by Adversity Type, 2019–2020. Am. J. Prev. Med. 2024, 67, 55–66. [Google Scholar] [CrossRef] [Scilit] [PubMed]
- Centers for Disease Control and Prevention. BRFSS Questionnaires. 2023. Available online: https://www.cdc.gov/brfss/questionnaires/index.htm (accessed on 21 April 2026).
- Swedo, E.A.; Aslam, M.V.; Dahlberg, L.L.; Niolon, P.H.; Guinn, A.S.; Simon, T.R.; Mercy, J.A. Prevalence of Adverse Childhood Experiences Among U.S. Adults—Behavioral Risk Factor Surveillance System, 2011–2020. Morb. Mortal. Wkly. Rep. 2023, 72, 707–715. [Google Scholar] [CrossRef] [Scilit]
- Centers for Disease Control and Prevention. BRFSS Adverse Childhood Experience (ACE) Module. Available online: https://www.cdc.gov/violenceprevention/pdf/brfss_adverse_module.pdf (accessed on 21 April 2026).
- Garrido, M.M.; Kelley, A.S.; Paris, J.; Roza, K.; Meier, D.E.; Morrison, R.S.; Aldridge, M.D. Methods for constructing and assessing propensity scores. Health Serv. Res. 2014, 49, 1701–1720. [Google Scholar] [CrossRef] [Scilit]
- Garrido, M.M. Propensity scores: A practical method for assessing treatment effects in pain and symptom management research. J. Pain Symptom Manag. 2014, 48, 711–718. [Google Scholar] [CrossRef] [Scilit]
- Wang, L.; Graubard, B.I.; Katki, H.A.; Li, Y. Improving external validity of epidemiologic cohort analyses: A kernel weighting approach. J. R. Stat. Soc. 2020, 183, 1293–1311. [Google Scholar] [CrossRef] [Scilit]
- Baser, O. Too much ado about propensity score models? Comparing methods of propensity score matching. Value Health 2006, 9, 377–385. [Google Scholar] [CrossRef] [Scilit]
- Imbens, G.W.; Wooldridge, J.M. Recent developments in the econometrics of program evaluation. J. Econ. Lit. 2009, 47, 5–86. [Google Scholar] [CrossRef] [Scilit]
- Caliendo, M.; Kopeinig, S. Some practical guidance for the implementation of propensity score matching. J. Econ. Surv. 2008, 22, 31–72. [Google Scholar] [CrossRef] [Scilit]
- Centers for Disease Control and Prevention. 2019 BRFSS Survey Data and Documentation. 2020. Available online: https://www.cdc.gov/brfss/annual_data/annual_2019.html (accessed on 21 April 2026).
- Benichou, J. A review of adjusted estimators of attributable risk. Stat. Methods Med. Res. 2001, 10, 195–216. [Google Scholar] [CrossRef] [Scilit] [PubMed]
- Hanley, J. A heuristic approach to the formulas for population attributable fraction. J. Epidemiol. Community Health 2001, 55, 508–514. [Google Scholar] [CrossRef] [Scilit] [PubMed]
- Newson, R.B. Attributable and unattributable risks and fractions and other scenario comparisons. Stata J. 2013, 13, 672–698. [Google Scholar] [CrossRef] [Scilit]
- Cameron, A.C.; Trivedi, P.K. Microeconometrics: Methods and Applications; Cambridge University Press: Cambridge, UK, 2005. [Google Scholar]
- Wooldridge, J.M. Econometric Analysis of Cross Section and Panel Data; MIT Press: Cambridge, MA, USA, 2010. [Google Scholar]
- U.S. News. Where Is Marijuana Legal? A Guide to Marijuana Legalization. 2022. Available online: https://www.usnews.com/news/best-states/articles/where-is-marijuana-legal-a-guide-to-marijuana-legalization (accessed on 21 April 2026).
- Arizona Department of Revenue. Adult Use Marijuana. 2022. Available online: https://azdor.gov/transaction-privilege-tax/adult-use-marijuana#:~:text=Proposition%20207%2C%20the%20Safe%20and,Title%2036%2C%20Chapter%2028.2 (accessed on 21 April 2026).
- Arizona Department of Health Services. Adult Use of Marijuana. 2022. Available online: https://www.azdhs.gov/licensing/marijuana/adult-use-marijuana/ (accessed on 21 April 2026).
- CDC. Understanding Your Risk for Cannabis Use Disorder. 2024. Available online: https://www.cdc.gov/cannabis/health-effects/cannabis-use-disorder.html?CDC_AAref_Val=https://www.cdc.gov/marijuana/health-effects/addiction.html (accessed on 21 April 2026).
- Hutchison, M.; Russell, B.S.; Leander, A.; Rickles, N.; Aguiar, D.; Cong, X.S.; Harel, O.; Hernandez, A.V. Trends and barriers of medication treatment for opioid use disorders: A systematic review and meta-analysis. J. Drug Issues 2023, 55, 193–214. [Google Scholar] [CrossRef] [Scilit]
- Leza, L.; Siria, S.; López-Goñi, J.J.; Fernandez-Montalvo, J. Adverse childhood experiences (ACEs) and substance use disorder (SUD): A scoping review. Drug. Alcohol. Depend. 2021, 221, 108563. [Google Scholar] [CrossRef] [Scilit]
- Rogers, C.J.; Pakdaman, S.; Forster, M.; Sussman, S.; Grigsby, T.J.; Victoria, J.; Unger, J.B. Effects of multiple adverse childhood experiences on substance use in young adults: A review of the literature. Drug Alcohol. Depend. 2022, 234, 109407. [Google Scholar] [CrossRef] [Scilit]
- Meyer, D.; Siddiqui, Z.; Deol, E.; Paracha, A.; Mujovic, H.; Abro, Z.; Chang, S.; Abid, A.; Tyler, J.; Rehman, H. Adverse childhood experiences and opioid use disorder: A systematic review. Psychoneuroendocrinology 2023, 153, 106224. [Google Scholar] [CrossRef] [Scilit]
- Regmi, S.; Kedia, S.K.; Ahuja, N.A.; Lee, G.; Entwistle, C.; Dillon, P.J. Association between adverse childhood experiences and opioid use-related behaviors: A systematic review. Trauma. Violence Abus. 2024, 25, 2046–2064. [Google Scholar] [CrossRef] [Scilit]
- Grummitt, L.; Barrett, E.; Kelly, E.; Newton, N. An umbrella review of the links between adverse childhood experiences and substance misuse: What, why, and where do we go from here? Subst. Abus. Rehabil. 2022, 13, 83–100. [Google Scholar] [CrossRef] [Scilit]
- Santo, T., Jr.; Campbell, G.; Gisev, N.; Tran, L.T.; Colledge, S.; Di Tanna, G.L.; Degenhardt, L. Prevalence of childhood maltreatment among people with opioid use disorder: A systematic review and meta-analysis. Drug Alcohol. Depend. 2021, 219, 108459. [Google Scholar] [CrossRef] [Scilit] [PubMed]
- Compton, W.M.; Thomas, Y.F.; Conway, K.P.; Colliver, J.D. Developments in the epidemiology of drug use and drug use disorders. Am. J. Psychiatry 2005, 162, 1494–1502. [Google Scholar] [CrossRef] [Scilit] [PubMed]
- Anda, R.F.; Brown, D.W.; Felitti, V.J.; Dube, S.R.; Giles, W.H. Adverse childhood experiences and prescription drug use in a cohort study of adult HMO patients. BMC Public Health 2008, 8, 198. [Google Scholar] [CrossRef] [Scilit] [PubMed]
- Centers for Disease Control and Prevention. Preventing Adverse Childhood Experiences: Leveraging the Best Available Evidence; National Center for Injury Prevention and Control, Centers for Disease Control and Prevention: Atlanta, GA, USA, 2019. Available online: https://stacks.cdc.gov/view/cdc/82316 (accessed on 21 April 2026).
- Centers for Disease Control and Prevention. Evidence-Based Strategies for Preventing Opioid Overdose: What’s Working in the United States; National Center for Injury Prevention and Control, Centers for Disease Control and Prevention: Atlanta, GA, USA, 2018. Available online: https://archive.cdc.gov/www_cdc_gov/drugoverdose/featured-topics/evidence-based-strategies.html (accessed on 21 April 2026).
- American Public Health Association and Centers for Disease Control and Prevention. Urgent. Related. Preventable. 2024. Available online: http://www.urgentrelatedpreventable.org/ (accessed on 21 April 2026).
- Della Femina, D.; Yeager, C.A.; Lewis, D.O. Child abuse: Adolescent records vs. adult recall. Child Abus. Negl. 1990, 14, 227–231. [Google Scholar] [CrossRef] [Scilit]
- Williams, L.M. Recovered memories of abuse in women with documented child sexual victimization histories. J. Trauma. Stress 1995, 8, 649–673. [Google Scholar] [CrossRef]
- Widom, C.S.; Morris, S. Accuracy of adult recollections of childhood victimization, part 2: Childhood sexual abuse. Psychol. Assess. 1997, 9, 34. [Google Scholar] [CrossRef]
- Hardt, J.; Rutter, M. Validity of adult retrospective reports of adverse childhood experiences: Review of the evidence. J. Child Psychol. Psychiatry 2004, 45, 260–273. [Google Scholar] [CrossRef] [Scilit]
- Grummitt, L.; Kelly, E.; Barrett, E.; Keyes, K.; Newton, N. Targets for intervention to prevent substance use in young people exposed to childhood adversity: A systematic review. PLoS ONE 2021, 16, e0252815. [Google Scholar] [CrossRef] [Scilit]
- Becker, T.D.; Castañeda Ramirez, S.; Bruges Boude, A.; Leong, A.; Ivanov, I.; Rice, T.R. Interventions for Prevention and Treatment of Substance Use in Youth with traumatic childhood experiences: A systematic review and synthesis of the literature. Eur. Child Adolesc. Psychiatry 2023, 33, 3419–3438. [Google Scholar] [CrossRef] [Scilit]
- Latimore, A.D.; Schoyer, E.; Mossburg, S.; Kellett, B.; Derrington, T.M.; Caglayan, K.; Lin, D. A Public Health Approach to Preventing Intergenerational Transmission of Substance Use Disorder. Child Welf. 2023, 100, 23–64. [Google Scholar]

Disclaimer/Publisher’s Note: The statements, opinions and data contained in all publications are solely those of the individual author(s) and contributor(s) and not of MDPI and/or the editor(s). MDPI and/or the editor(s) disclaim responsibility for any injury to people or property resulting from any ideas, methods, instructions or products referred to in the content. |
© 2026 by the authors. Licensee MDPI, Basel, Switzerland. This article is an open access article distributed under the terms and conditions of the Creative Commons Attribution (CC BY) license.