


Highlights
Public health relevance—How does this work relate to a public health issue?
- This study examines current BDH receipt in relation to child stunting in Ecuador using a revised analytical sample that retains 99.4% of linked children.
- Stunting is cumulative, whereas ENDI records only current BDH receipt and cannot reconstruct exposure history.
Public health significance—Why is this work of significance to public health?
- Kernel matching reduced mean standardised bias to 3.0% and yielded a +1.36 percentage-point recipient–non-recipient contrast; residual multivariate imbalance remained.
- The survey-weighted linear probability model estimated a +1.41 percentage-point adjusted difference (95% CI −5.38 to +8.19; p = 0.684).
Public health implications—What are the key implications or messages for practitioners, policy makers and/or researchers in public health?
- The cross-sectional contrast was sensitive to covariate specification, increasing to +4.87 percentage points in the reduced background-covariate model estimated on the same 6310-observation analytical sample.
- Small or imprecise adjusted contrasts do not establish programme ineffectiveness;
Abstract
This study examines whether current household receipt of Ecuador’s Bono de Desarrollo Humano (BDH) is associated with child stunting using ENDI 2023–2024. The linked dataset included 6345 children; the revised analytical sample comprised 6310, including 792 current recipients. Propensity scores were estimated from 45 substantively selected balancing covariates; multicategory variables were indicator-coded, and sparse categories in eight variables were pooled to avoid complete separation. Kernel matching yielded the most favourable broad-specification balance (mean standardised bias 3.0%; Rubin’s B = 34.3; Rubin’s R = 1.20) and a recipient–non-recipient stunting-prevalence difference of +1.36 percentage points. A survey-weighted linear probability model estimated an adjusted difference of +1.41 points (95% CI −5.38 to +8.19; p = 0.684). A reduced 14-background-covariate kernel model, estimated on the same 6310 observations, yielded +4.87 points and stronger global balance (Rubin’s B = 18.0; Rubin’s R = 1.26), indicating sensitivity to covariate specification. Because ENDI records only current BDH status, not exposure timing, duration or continuity, these findings are adjusted cross-sectional contrasts rather than causal programme effects and do not establish programme ineffectiveness.
1. Introduction
Child stunting is a cumulative manifestation of sustained nutritional and health deprivation during early life and remains one of the most consequential indicators of unequal conditions in childhood. The World Health Organization characterises height-for-age deficit as the result of prolonged exposure to inadequate diets, recurrent infection and suboptimal care during critical periods of growth [1,2]. Its significance therefore extends beyond anthropometric measurement: impaired linear growth is associated with disadvantages in learning, human-capital formation, future productivity and intergenerational mobility. Because stunting reflects accumulated rather than short-term deprivation, policies intended to reduce it must act early enough, persist long enough and reach several of the pathways that shape child growth.
In Ecuador, child stunting continues to represent a major public health challenge despite recent improvements. The National Institute of Statistics and Censuses (INEC) reported a prevalence of 20.1% among children under two years of age in the first round of the National Survey on Child Malnutrition (ENDI), while the 2024 update placed the corresponding figure at 19.3% [3,4]. These national estimates conceal socioeconomic and territorial inequalities, particularly among poorer households and populations facing weaker access to basic services. The persistence of stunting has therefore kept early-childhood nutrition at the centre of the national policy agenda.
The relationship between household income and linear growth is theoretically plausible but not automatic. Additional resources can relax budget constraints, improve food consumption, facilitate transport to health facilities and help households absorb shocks without reducing expenditures on children. At the same time, the more proximal determinants of stunting include diet quality, infectious morbidity, maternal health, feeding and caregiving practices, safe water, sanitation and effective health services. Income support can influence some of these conditions indirectly, but a monetary transfer cannot guarantee that they change simultaneously or with sufficient intensity. For height-for-age, the biological response also depends on when resources are received, for how long, how regularly and in what service environment.
Ecuador’s Bono de Desarrollo Humano (BDH) is a major cash-transfer programme targeted at households living in poverty and extreme poverty. By relaxing liquidity constraints, it may increase resources available for food, transport, medicines and child-related expenditures; historically, the BDH has also been linked to human-capital objectives involving education and health-service use. However, programme receipt observed at one point in time is not equivalent to sustained nutritional exposure. Administrative barriers, transaction costs and psychological costs can affect effective take-up [5], while current beneficiary status does not reveal whether the transfer was received during pregnancy, throughout the first 1000 days, or continuously enough to influence cumulative growth.
Previous Ecuadorian research provides strong reasons to expect heterogeneous effects across outcomes. Paxson and Schady [6] reported modest positive effects on dimensions of child development among poorer rural households. Fernald and Hidrobo [7], using a randomised design, identified improvements in language development and selected child-oriented inputs but no statistically significant effect on height-for-age. Moncayo et al. [8] found that greater cantonal BDH coverage was associated with lower childhood mortality from poverty-related causes, while Maggio and Cavanagh [9] showed that cash incentives can modify some maternal health-seeking behaviours, with heterogeneous effects across the continuum of care. Together, these studies suggest that the BDH may influence behaviours, service use and selected dimensions of child welfare without necessarily producing a detectable change in an accumulated anthropometric outcome.
The BDH also belongs to the broader international experience of conditional cash-transfer programmes, which combine income support with incentives related to human-capital accumulation [6,7,10]. Systematic reviews and meta-analyses indicate that cash transfers can improve food security, preventive-service use and some measures of child nutrition, but effects on linear growth are generally modest and heterogeneous [11,12,13,14]. Transfer size, exposure duration, service availability and complementary nutrition or behaviour-change interventions appear to influence whether additional household resources translate into anthropometric gains. Evidence from Peru, Colombia, the Philippines, Mexico, Pakistan and African settings points in the same direction: favourable effects on some maternal–child health or nutritional outcomes coexist with persistent anaemia, multiple forms of malnutrition and implementation constraints [15,16,17,18,19,20,21,22,23,24].
Despite this substantial literature, the contemporary relationship between BDH receipt and child stunting in Ecuador remains insufficiently characterised. Much of the Ecuadorian evidence refers to earlier phases of the programme or focuses on outcomes such as cognitive development, mortality and health-service use. Less is known about whether current household receipt of the BDH is associated with stunting in the context captured by ENDI 2023–2024, after accounting for the pronounced socioeconomic, demographic, territorial and household-environment differences that separate beneficiary from non-beneficiary households. This gap is particularly relevant because programme targeting makes unadjusted comparisons difficult to interpret.
This study addresses that gap using the most recent specialised national survey on child malnutrition in Ecuador. ENDI 2023–2024 provides anthropometric data together with detailed information on children, households and household representatives [3,25]. Integrating these levels permits construction of a rich set of observed balancing covariates. The empirical strategy uses propensity score matching (PSM) with one-nearest-neighbour, five-nearest-neighbour and kernel specifications, supported by overlap and balance diagnostics, and a sensitivity analysis that varies the covariate set. Complementary survey-weighted models incorporate ENDI sampling weights, strata and primary sampling units. These strategies improve the observed comparison and characterise statistical uncertainty, but they cannot recover unobserved programme-exposure histories, establish temporal ordering for all covariates or eliminate residual confounding.
Accordingly, this study asks whether current household receipt of the BDH is associated with child stunting in ENDI 2023–2024 after balancing observed differences between recipient and non-recipient households. The objective is explicitly associational rather than causal. The survey does not establish whether BDH exposure preceded growth faltering; does not measure duration, continuity or intensity of programme receipt; and cannot determine whether exposure occurred during the biologically critical window for linear growth. The analysis therefore evaluates adjusted contemporary contrasts and their sensitivity to alternative specifications; small or imprecise estimates should not be interpreted as evidence that the programme is ineffective or that cash transfers cannot reduce stunting under other exposure histories, designs or institutional conditions.
2. Materials and Methods
2.1. Data Source and Survey Design
An observational, cross-sectional analysis was conducted using ENDI 2023–2024, produced by INEC [3,25]. ENDI uses a probabilistic, stratified, two-stage cluster sampling design. In the first stage, primary sampling units (UPMs) are selected within sampling strata; in the second stage, eligible dwellings are selected systematically within the sampled UPMs. The public-use files provide the coded UPM identifier (id_upm), the sampling stratum (estrato) and a normalised expansion factor (fexp) for the person, household and child-health tables [3,25].
The primary PSM analysis was conducted without applying the ENDI expansion factor or design-based variance estimation inside the matching algorithm; sampling strata and UPM clustering were therefore not used as matching weights. The matched estimates are interpreted as sample-based adjusted recipient–non-recipient contrasts rather than nationally representative population effects. To assess statistical precision while respecting the complex survey structure, a complementary design-based analysis used the ENDI expansion factor, sampling strata and UPM clustering. The survey-design models were estimated separately from PSM because the two procedures address different components of the analysis.
A further feature of the analytical strategy was the linkage of three information levels originally stored in different ENDI files: child, household and household-representative information. This made it possible to combine the child’s anthropometric status with socioeconomic, demographic and household-environment characteristics in the same analytical record, thereby broadening adjustment for observed differences between BDH recipient and non-recipient households. The contribution of each information level to the analytical model is summarised in Table 1.
Table 1.
Analytical integration of the ENDI databases used in this study.
2.2. Analytical Sample, Exposure, Outcome and Covariates
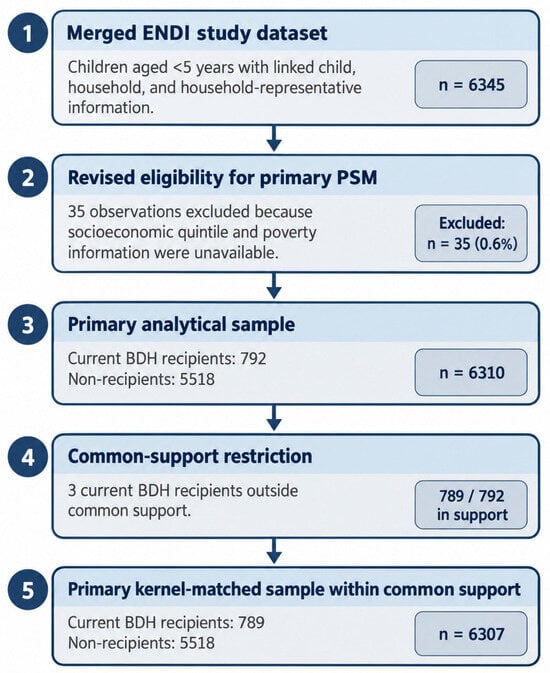
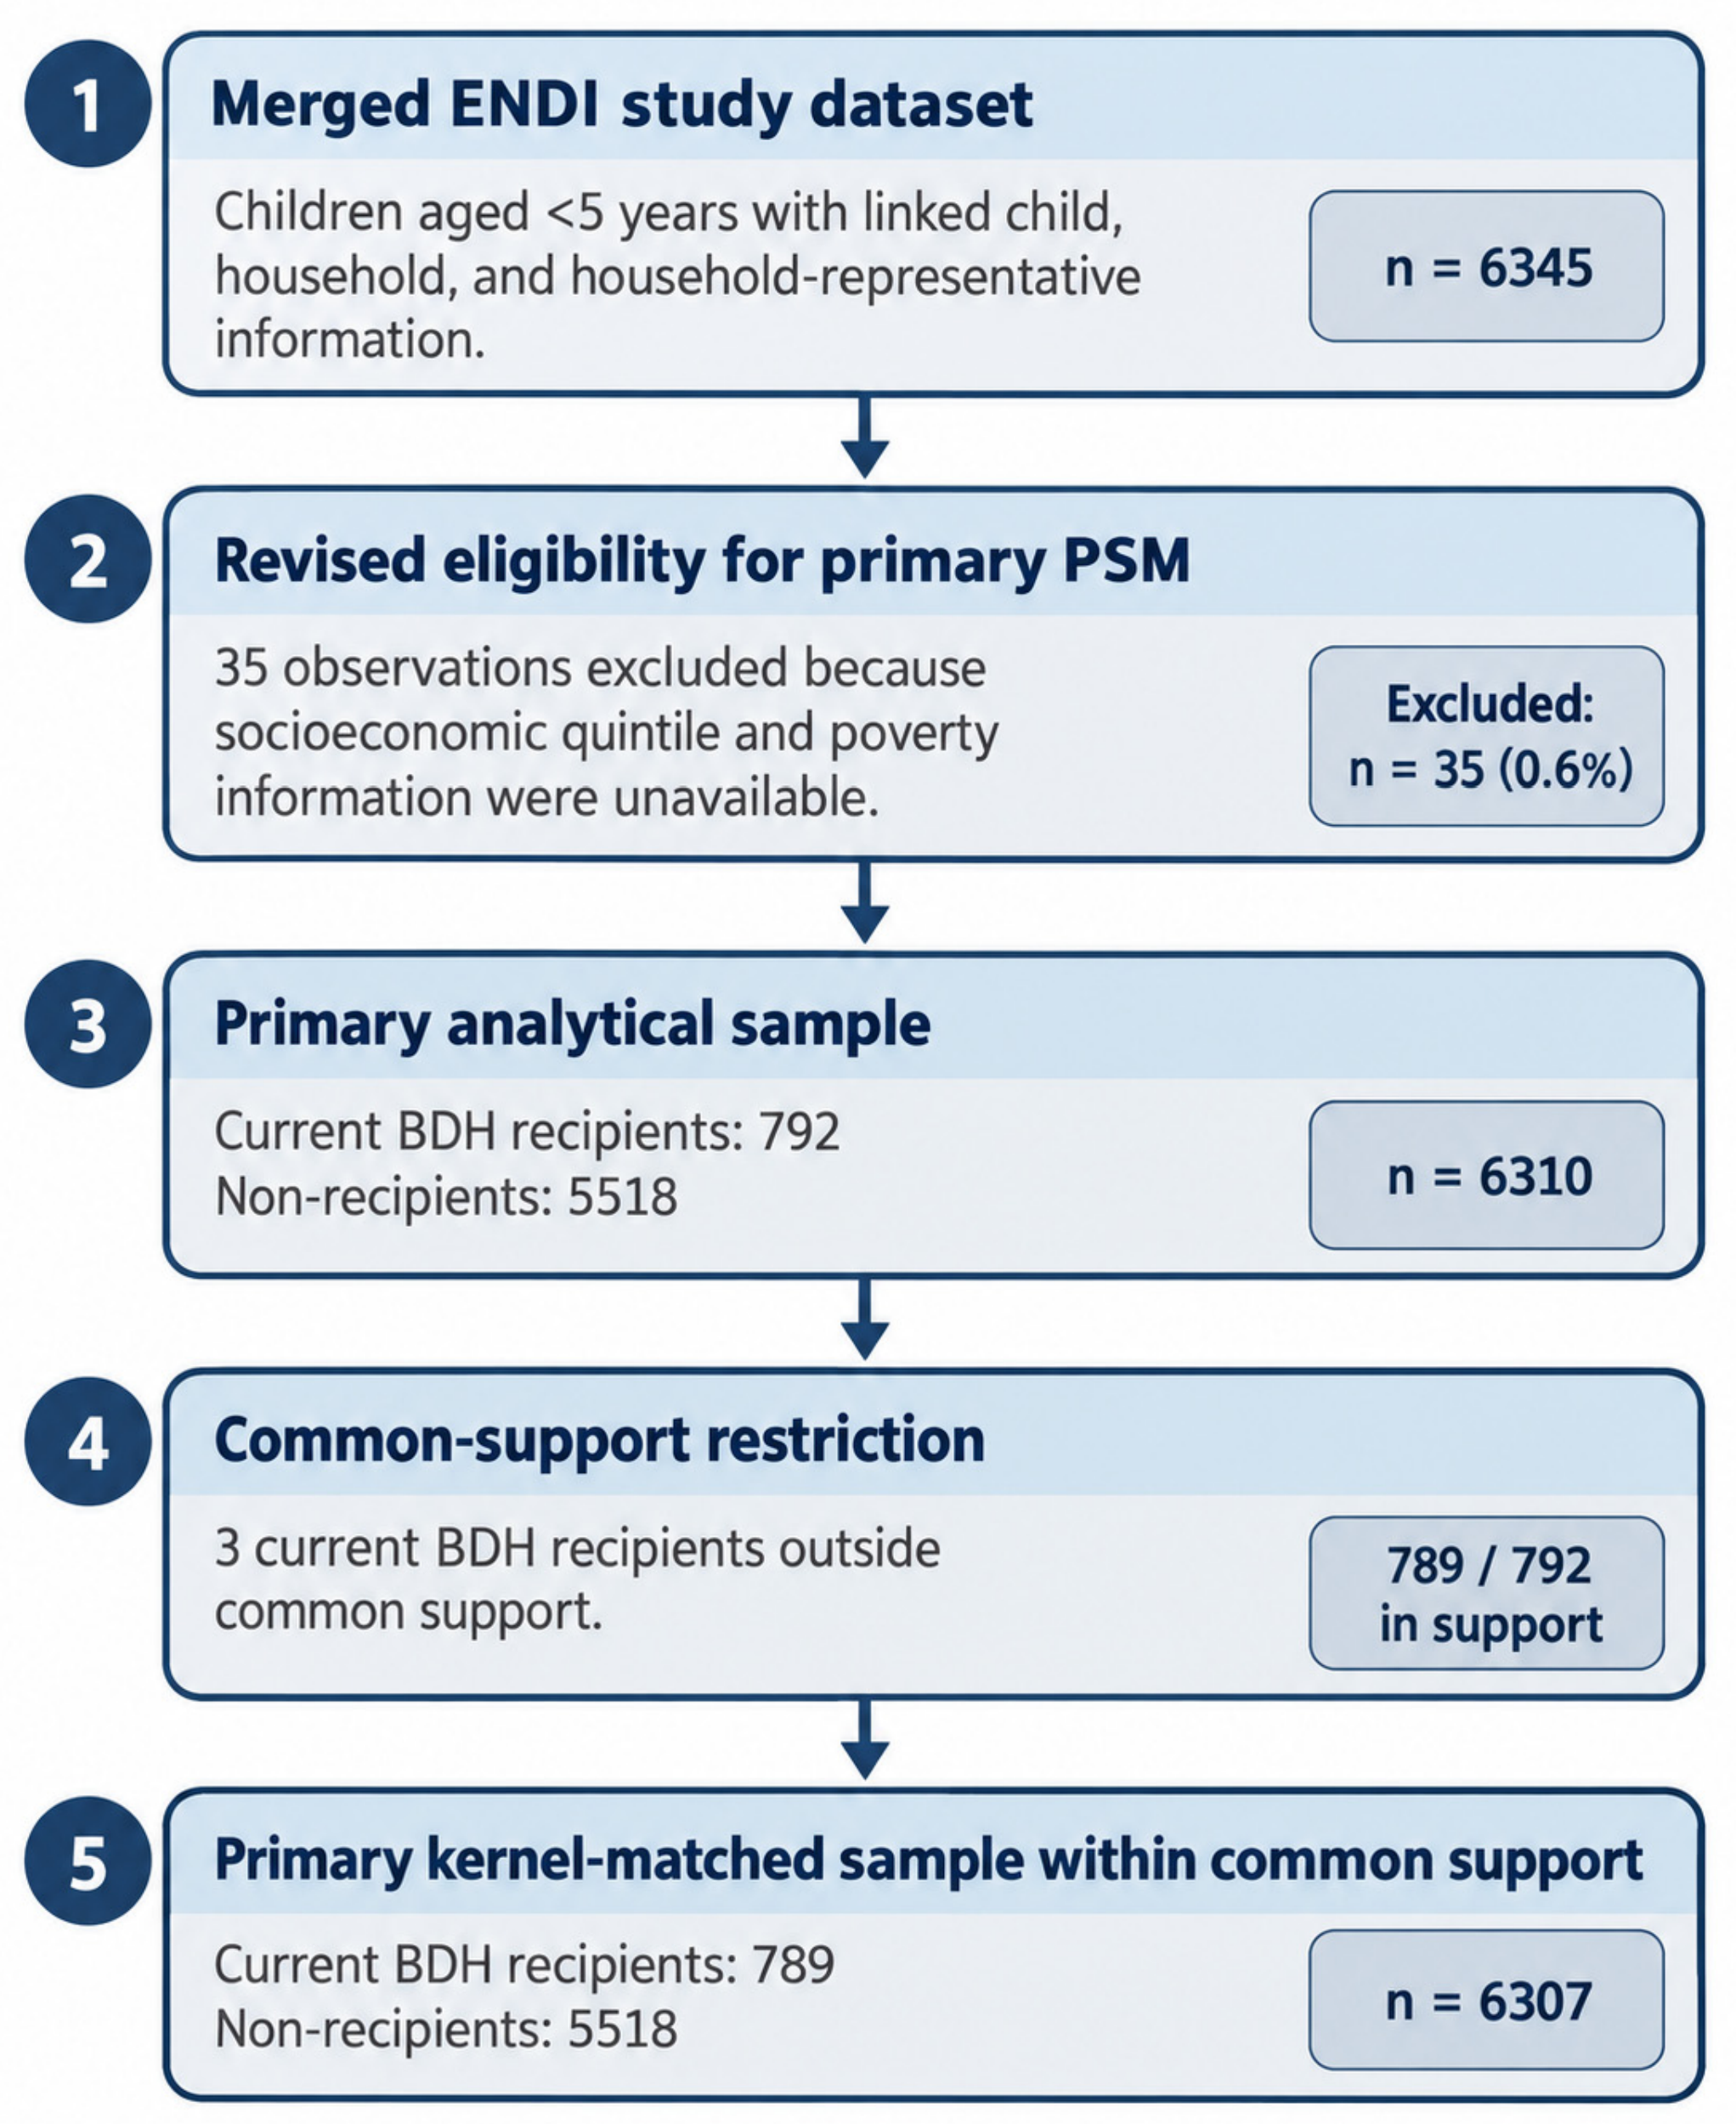
The merged study dataset contained 6345 children under five years of age. Review of the ENDI questionnaire routing showed that three variables used in the previous specification—the detailed occupation variable (distinct from the household-head work-status indicator retained in the final balancing set), caregiver-responsibility status and observed soap availability at the handwashing place—generated substantial structural non-applicability or skip-pattern missingness. These variables were therefore removed from the primary propensity-score specification rather than treating their structural absence as a criterion for excluding children. With the revised covariate set, 6310 children (99.4% of the linked sample) had complete information on current BDH receipt, stunting and all primary balancing covariates. The revised sample included all 792 current BDH recipients and 5518 non-recipients. The remaining 35 observations, all non-recipients, lacked both socioeconomic-quintile and poverty information. Three recipients subsequently fell outside common support, leaving 6307 observations for the primary kernel-matched comparison (789 recipients and 5518 non-recipients). Figure 1 summarises the revised analytical flow.
Figure 1.
Revised analytical sample flow from the merged ENDI study dataset to the primary kernel-matched sample within common support. Note. Review of ENDI questionnaire routing showed that occupation, caregiver-responsibility status and observed soap availability contained structural non-applicability or skip-pattern missingness and were therefore not used to define primary PSM eligibility. The revised primary analysis excluded only 35 observations lacking socioeconomic-quintile and poverty information. The figure describes sample construction and does not imply causal identification.
The outcome was child stunting, defined as a binary indicator equal to 1 when the child’s height- or length-for-age z-score was below −2 standard deviations from the median of the World Health Organization child growth standards and 0 otherwise [1]. The exposure was current household receipt of the BDH at the survey date. ENDI does not identify the start date, cumulative duration, continuity, previous episodes, historical transfer amount or timing of receipt relative to pregnancy and the first 1000 days. Current recipient status is therefore a contemporaneous exposure marker rather than a measure of cumulative programme exposure. This temporal limitation is especially important for stunting because current recipients may include recent entrants, while current non-recipients may include households with previous BDH exposure; the resulting exposure-history misclassification may alter the magnitude or direction of the observed association in ways that cannot be identified from the survey.
The primary propensity-score strategy followed established matching guidance [26,27,28,29] and originated from 45 observed balancing covariates selected on substantive grounds, spanning socioeconomic conditions, territorial characteristics, child characteristics, housing and WASH conditions, and characteristics of the household head or representative. Multicategory covariates were represented by indicator variables rather than by a single numeric score. In the initial correctly dummy-coded specification, sparse categories in eight variables—dwelling type, wall material, floor material, sanitation, waste disposal, cooking type, household-head education and insurance—generated complete prediction of non-receipt and would have removed 410 observations from the logistic model. To retain the revised analytical sample, categories represented by fewer than 200 observations within those eight variables were pooled with the modal category of the same variable before generating indicators. The 200-observation threshold was fixed for the final re-estimation after separation had been identified and was not tuned using stunting, the matched contrast or coefficient significance. After pooling, cooking type became invariant and therefore contributed no estimable coefficient, whereas insurance remained binary and contributed one indicator. The broad propensity model retained all 6310 observations and contained 96 estimated predictor terms derived from the 45 conceptual covariates. Covariates were retained on substantive grounds irrespective of individual statistical significance; the complete model is reported in Supplementary Table S3, and the exact sparse-category pooling operations are documented in Supplementary Table S4. The frequency-based pooling was an operational strategy to stabilise estimation under sparse-category separation and should not be interpreted as implying substantive equivalence between pooled ENDI categories. Because ENDI measures BDH status and the balancing variables in the same survey wave, these characteristics cannot uniformly be regarded as pre-exposure confounders. PSM is therefore used to improve comparability of contemporaneously observed recipient and non-recipient profiles rather than to reconstruct a fully pre-treatment covariate distribution. Proximal determinants such as current diet, recent infections, care practices and health-service use were not modelled as mediators because their temporal ordering relative to BDH receipt cannot be established and conditioning on possible post-exposure variables could introduce additional bias.
2.3. Propensity Score Matching
The propensity score was estimated with a binary logistic model in which current BDH receipt was the dependent variable and the broad covariate specification described above was represented by continuous/binary terms and indicator variables for multicategory characteristics. No significance-based variable selection was performed. Sparse-category pooling was restricted to the eight variables that generated complete separation and followed the frequency rule described in Section 2.2; the final logistic model retained all 6310 primary analytical observations. After estimation, overlap between recipient and non-recipient observations was examined visually and numerically (Supplementary Figure S1). Three matching algorithms were applied using the same broad specification: one-nearest-neighbour, five-nearest-neighbour and kernel matching. The neighbour specifications imposed common support and a caliper of 0.05, while kernel matching used a bandwidth of 0.05.
The primary matched quantity was the average difference in stunting prevalence between children in households reporting current BDH receipt and propensity-score-matched children in non-recipient households. Matching was anchored on recipient observations, as implemented by the matching routine, but the resulting quantity is not interpreted as an average treatment effect in the causal sense. Given the cross-sectional exposure measure, uncertain temporal ordering of covariates and possible unmeasured confounding, it represents an adjusted contemporary recipient–non-recipient contrast.
Matching performance was assessed using covariate-level standardised bias together with global diagnostics: post-matching pseudo R2, likelihood-ratio chi-square, mean and median standardised bias, Rubin’s B and Rubin’s R, and common support. Kernel matching was designated the primary matching specification because it produced the most favourable overall balance among the three broad algorithms. Balance was nevertheless described as substantially improved rather than fully satisfactory whenever diagnostics remained outside conventional reference values, particularly Rubin’s B. One- and five-nearest-neighbour estimates were retained as sensitivity specifications.
Matching-derived standard errors and p-values were not used as the basis for formal inference. The standard errors returned by the matching routine do not fully account for uncertainty from propensity-score estimation, and conventional bootstrap procedures are problematic for fixed-neighbour matching estimators [30]. The revised manuscript therefore reports matched prevalence contrasts descriptively and evaluates statistical precision with the separate survey-design models described below.
2.4. Sensitivity Analyses and Inferential Scope
Sensitivity to covariate specification was examined with a second kernel-matching model restricted to 14 relatively stable demographic and geographic background characteristics: area, region, ethnicity, altitude, child sex, age, disability and civil registration, together with household-head sex, age, disability, ethnicity, education and marital status. Multicategory characteristics were represented by indicators, with the same sparse-category treatment applied to household-head education. Crucially, this reduced model was estimated on the same 6310 primary analytical observations as the broad specification so that the sensitivity comparison changed the balancing set but not sample composition. This reduced specification is not assumed to be causally sufficient; it was used to assess how strongly the observed contrast depends on adjustment for contemporaneous socioeconomic, housing and service conditions.
To evaluate statistical precision under ENDI’s complex sampling design, the original design variables were merged to all 6345 linked records, and the survey was declared using the UPM identifier as the primary sampling unit, the sampling stratum and the person-level expansion factor. Design-based estimates used Taylor linearisation; single-PSU strata were handled with a centred variance adjustment, and the 6310 primary analytical observations were treated as a survey subpopulation. Formal design-based inference was based on a survey-weighted linear probability model using the same broad covariate representation as the primary propensity-score specification; this model directly estimates an adjusted prevalence difference. An exploratory survey-weighted logistic model with the fully expanded categorical specification produced a highly singular variance matrix and was therefore not retained for formal inference or reported as a robustness estimate.
The inferential scope is deliberately limited. The matching analysis addresses observed imbalance but cannot resolve unmeasured confounding or reconstruct programme exposure histories. The survey-design models account for weighting, stratification and clustering but do not solve temporality or post-exposure adjustment. Differences between the broad and reduced matching specifications are interpreted as sensitivity to covariate choice rather than as competing causal estimates. Neither approach supports a nationally representative causal programme-effect interpretation.
2.5. Ethical Considerations
This study used publicly available ENDI secondary microdata. INEC applies formal anonymisation procedures before public release, excluding direct identifiers and other potentially identifying information [25]. The authors had no direct contact with participants and no access to identifiable personal information.
All statistical analyses were conducted using Stata 17 (StataCorp LLC, College Station, TX, USA).
3. Results
The revised primary analytical sample comprised 6310 of the 6345 linked children (99.4%). Only 35 observations were excluded because socioeconomic-quintile and poverty information was unavailable; all 792 children in households reporting current BDH receipt were retained in the analytical sample, together with 5518 non-recipients. The excluded group represented 0.6% of the linked sample, had an unweighted stunting prevalence of 22.86% compared with 18.84% among included observations, and was slightly older on average (2.49 vs. 2.12 years). Because poverty and quintile were precisely the unavailable variables among the excluded observations, those characteristics cannot be compared across inclusion groups. Revised inclusion diagnostics are reported in Supplementary Table S2.
Descriptive characteristics are unweighted and refer to the merged study sample rather than to national population estimates. Children were 51.35% male and had a mean age of 2 years; 60.39% lived in urban areas, 33.03% lived in households classified as poor; and 32.29% lived in households with unmet basic needs. The unweighted prevalence of stunting in the merged sample was 18.87%. Additional descriptive characteristics are reported in Supplementary Table S1.
These descriptive figures are presented only to characterise the study dataset. National prevalence estimates should be taken from INEC’s design-weighted ENDI publications [3,4] because the PSM analysis and the characteristics reported here do not incorporate survey weights.
3.1. Estimation of the Propensity Score and Matching
The final broad propensity-score model retained all 6310 primary analytical observations and included 96 estimated predictor terms derived from the 45 conceptual balancing covariates after indicator coding and sparse-category pooling. The model showed substantial observable separation between current BDH recipients and non-recipients before matching (LR χ2(96) = 2174.14; p < 0.001; pseudo R2 = 0.456). The complete coefficient table is provided in Supplementary Table S3; no covariates were removed on the basis of p-values.
Before matching, mean and median standardised biases were 26.3% and 22.3%, respectively, with Rubin’s B = 216.8 and Rubin’s R = 0.29, confirming pronounced differences in observed recipient and non-recipient profiles. All three matching algorithms reduced imbalance, but kernel matching produced the most favourable overall diagnostics among the broad specifications (Table 2).
Table 2.
Global balance diagnostics before and after matching.
After kernel matching, mean standardised bias fell to 3.0%, and median bias fell to 2.1%; the post-matching pseudo R2 was 0.021, the likelihood-ratio balance test was non-significant (p = 1.000), Rubin’s B was 34.3, and Rubin’s R was 1.20. One-neighbour matching produced Rubin’s B = 53.6, while five-neighbour matching produced B = 36.5. Kernel matching was therefore retained as the primary broad matching specification because it yielded the strongest overall reduction in observed imbalance, but the residual Rubin’s B above 25 indicates that multivariate balance was not complete. At the individual-term level, child age retained a standardised bias of 10.1%, and household-head disability retained a standardised bias of −11.0%; this residual imbalance is reflected in the global diagnostics.
Formal common support was nearly complete in the broad specification. Of the 792 current BDH recipients, 789 were within support, and three were outside; all 5518 non-recipient observations remained within the common region. The common-support distribution was identical across the three broad matching algorithms (Table 3), although the propensity-score distributions remained uneven across parts of their range (Supplementary Figure S1).
Table 3.
Common support in the broad matching specifications.
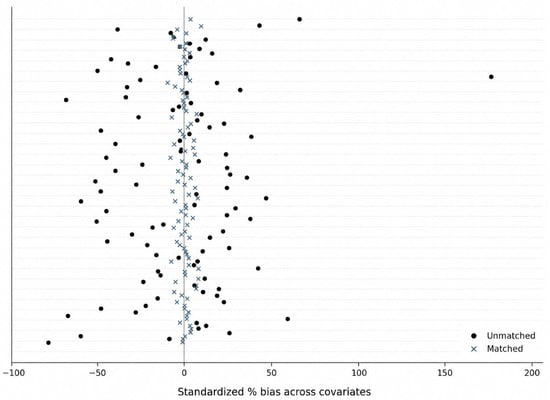
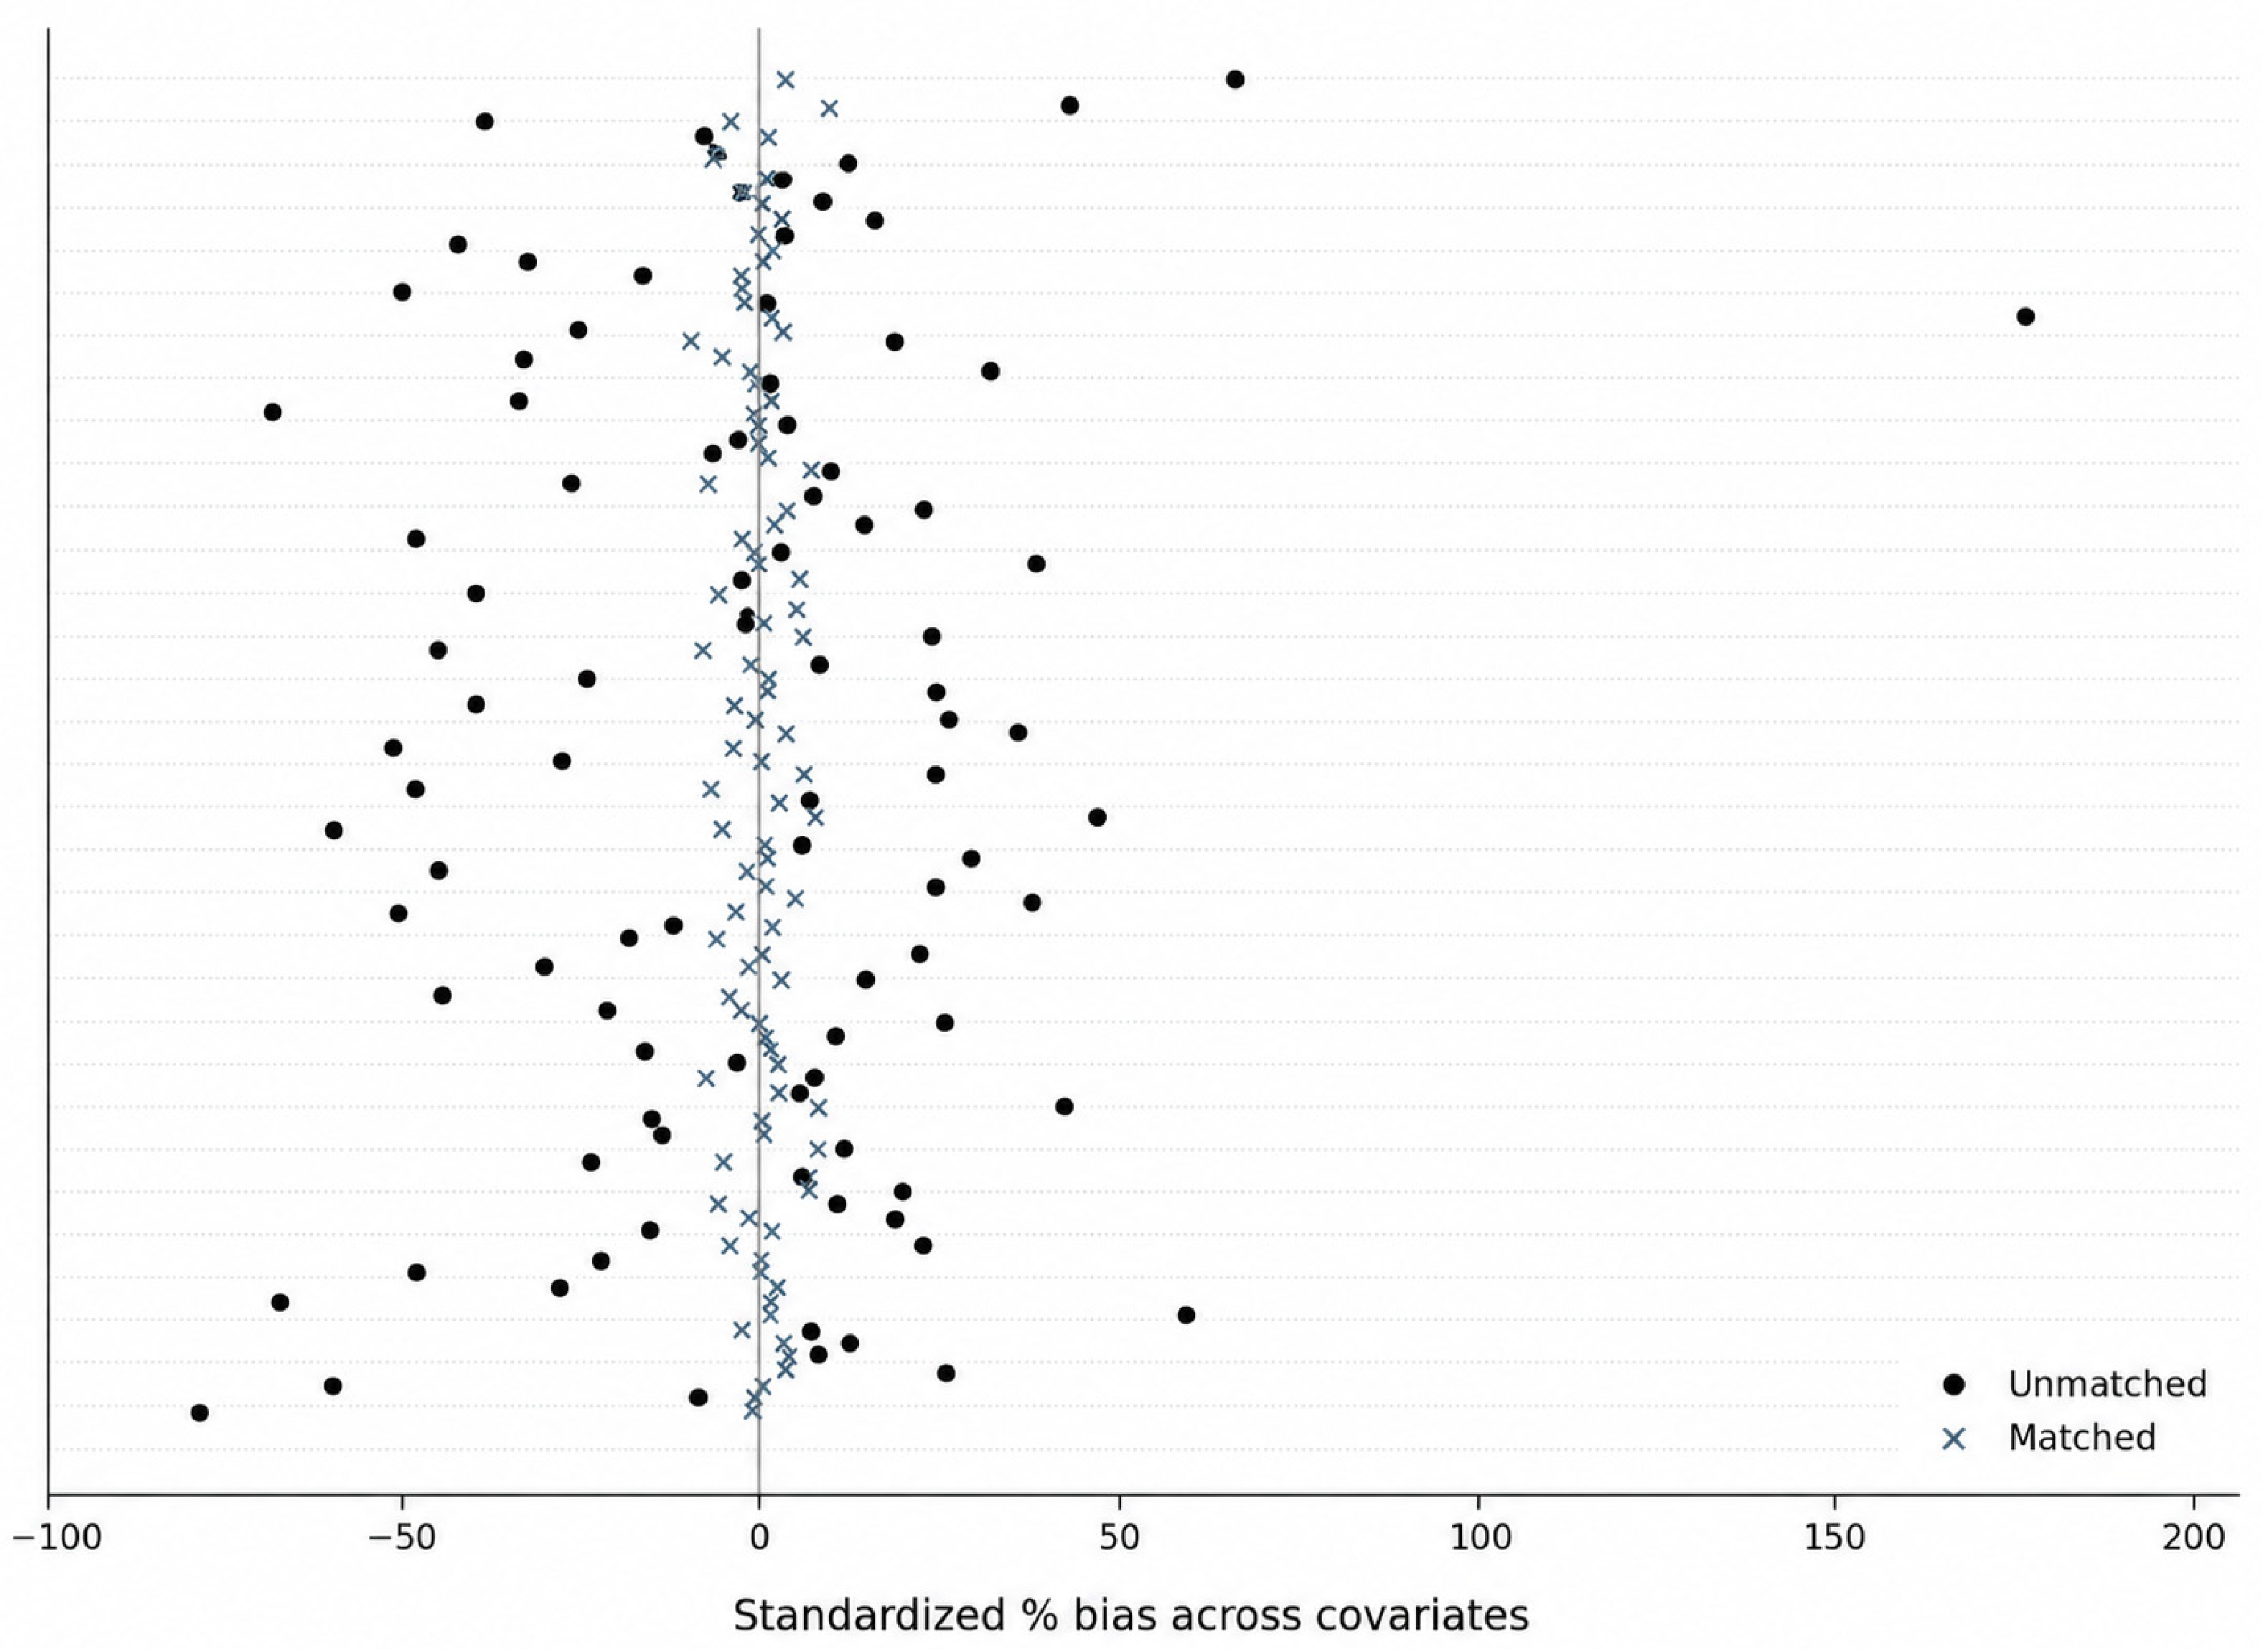
Figure 2 displays standardised percentage bias for the 96 expanded covariate terms before and after kernel matching. Matched values are concentrated much closer to zero than unmatched values; dotted reference lines at ±10% make the small number of terms with residual imbalance visually explicit.
Figure 2.
Standardised percentage bias across expanded covariate terms before and after kernel matching. Note. The solid vertical line denotes zero standardised bias; dotted vertical lines denote ±10%. Circles indicate unmatched values, and crosses indicate values after kernel matching. The figure displays the 96 expanded covariate terms used in the final broad propensity-score model.
In the revised analytical sample, unweighted stunting prevalence was 22.98% among current BDH recipients and 18.25% among non-recipients, a crude difference of +4.73 percentage points. After common-support restriction, stunting prevalence among matched recipients was 22.94%. The matched non-recipient prevalence was 19.52% with one neighbour, 21.04% with five neighbours and 21.58% with kernel matching, corresponding to adjusted matched differences of +3.42, +1.90 and +1.36 percentage points, respectively (Table 4). These matching estimates are reported as descriptive adjusted contrasts; matching-derived hypothesis tests are not used for formal inference.
Table 4.
Matched stunting-prevalence contrasts by matching specification.
The broad matching specifications reduced the crude +4.73-percentage-point difference to adjusted descriptive contrasts between +1.36 and +3.42 points. Because these values are descriptive matched contrasts, conclusions about statistical precision are based on the separate survey-design linear probability model rather than on matching-derived hypothesis tests.
3.2. Survey-Design Sensitivity Analysis
Survey-design estimates were based on the 6310-observation analytical subpopulation within the full linked ENDI design. Weighted stunting prevalence was 16.05% (95% CI 14.12–17.98) among non-recipients and 20.19% (95% CI 13.65–26.72) among current BDH recipients. The crude survey-weighted prevalence difference was +4.13 percentage points (95% CI −3.12 to 11.38; p = 0.263). After adjustment for the same broad covariate representation used in the primary propensity model, the survey-weighted linear probability model estimated +1.41 percentage points (95% CI −5.38 to 8.19; p = 0.684) (Table 5). This interval is compatible with adjusted differences in either direction and therefore does not establish equivalence or absence of an association.
Table 5.
Survey-design analyses for current BDH receipt and child stunting.
3.3. Sensitivity to Covariate Specification
The reduced background-covariate kernel specification was estimated on the same 6310 primary analytical observations as the broad specification; a total of 788 of the 792 current recipients were within common support. Overall balance after matching was favourable (mean standardised bias 3.0%, median bias 3.2%, Rubin’s B = 18.0, Rubin’s R = 1.26), and the matched recipient–non-recipient difference was +4.87 percentage points, compared with +1.36 points under the broad kernel specification (Table 6). The difference between the unrounded estimates was approximately 3.50 percentage points. Because sample composition was held constant, this divergence reflects a change in the balancing set rather than a change in analytical sample composition. It therefore indicates that the magnitude of the cross-sectional contrast is sensitive to whether contemporaneous socioeconomic, housing and service characteristics are included in the balancing set. Because neither specification establishes the temporal ordering of these covariates relative to BDH receipt, the difference is interpreted as identification uncertainty rather than evidence favouring one causal estimate.
Table 6.
Sensitivity of the kernel-matched contrast to covariate specification.
4. Discussion
The revised analyses support a more qualified interpretation than a simple conclusion of “no association”. In the primary analytical sample of 6310 children, unweighted stunting prevalence was 22.98% among households reporting current BDH receipt and 18.25% among non-recipient households, a crude difference of 4.73 percentage points. After balancing the broad observed profile, the kernel-matched difference decreased to +1.36 percentage points; the corresponding one- and five-neighbour differences were +3.42 and +1.90 points. The complementary survey-weighted linear probability model produced a similarly small adjusted estimate of +1.41 percentage points, but its 95% confidence interval ranged from −5.38 to +8.19 points. The recipient group was also substantially smaller than the non-recipient group (792 versus 5518), a feature that should be considered when interpreting the relatively wide design-based confidence interval. The broad-adjustment analyses therefore produced small positive cross-sectional point estimates with limited statistical precision, not evidence that current receipt is equivalent to non-receipt or that a true association is absent.
The temporal measurement of programme exposure is central to this interpretation. Stunting reflects nutritional, infectious and caregiving conditions accumulated over early childhood, whereas ENDI identifies only whether the household reports BDH receipt at the survey date. The data do not reveal when payments began, how long they continued, whether receipt was interrupted, historical transfer amounts or whether exposure occurred during pregnancy and the first 1000 days. Current recipients may therefore include households that entered after growth faltering had already developed, while current non-recipients may include households with previous exposure during biologically relevant periods. Such exposure-history misclassification may attenuate group contrasts, but because programme entry, persistence and exit can also be related to socioeconomic vulnerability, its net direction cannot be predicted. A small or imprecise contemporary contrast consequently cannot distinguish between absence of an association and inadequate measurement of the exposure history relevant to linear growth.
The sensitivity analysis further shows that the magnitude of the contrast depends on the covariate set used to construct comparability. Under the broad specification, which originated from 45 contemporaneously observed characteristics and used indicator coding with sparse-category pooling where needed to avoid separation, the kernel-matched difference was +1.36 percentage points. When matching was restricted to 14 relatively stable demographic and geographic background characteristics on the same 6310-observation analytical sample, the kernel contrast increased to +4.87 points, and global balance improved further (Rubin’s B = 18.0; Rubin’s R = 1.26). The approximately 3.50-point difference between the unrounded kernel contrasts therefore reflects sensitivity to the balancing specification rather than inclusion of additional observations. This matters because poverty, material conditions, housing and service indicators may be determinants of programme receipt, markers of current vulnerability, or conditions that changed after programme entry. ENDI cannot establish their temporal ordering. The broad model therefore compares current recipients and non-recipients with similar contemporary observed profiles, whereas the reduced model conditions on a narrower background profile. Neither specification recovers a causal programme effect, and the difference between them should be read as evidence of identification uncertainty.
The findings also illustrate why outcomes and exposure windows matter in the cash-transfer literature. In Ecuador, Fernald and Hidrobo [7] reported improvements in language development and selected child-oriented inputs without a statistically significant height-for-age effect, while Paxson and Schady [6] found gains in other dimensions of child development among poorer rural households. Moncayo et al. [8] and Maggio and Cavanagh [9] examined mortality and maternal health-service use, outcomes with different temporal dynamics from linear growth. International reviews likewise describe generally modest and heterogeneous effects of cash transfers on child anthropometry [11,12,13,14], with programme intensity, duration and the service environment identified as plausible sources of heterogeneity. The present analysis neither confirms nor contradicts causal estimates from those studies because it observes only current BDH status; it adds recent ENDI evidence on the cross-sectional distribution of stunting among recipient and observationally similar non-recipient households.
Several features strengthen the adjusted comparison while defining its limits. Revising the covariate eligibility rules after examining ENDI questionnaire routing increased the analytical sample from 4734 to 6310 children and retained all 792 current BDH recipients; only 35 observations were excluded because poverty and socioeconomic-quintile information was unavailable. Correct representation of multicategory covariates as indicators initially revealed complete separation in sparse levels; applying the transparent within-variable frequency-pooling rule retained the full 6310-observation propensity-score sample, and Supplementary Table S4 documents each pooled category. In the final specification, insurance remained binary and contributed one indicator, whereas cooking type became invariant after pooling. Kernel matching reduced mean standardised bias to 3.0% and median bias to 2.1%, with Rubin’s R = 1.20, although Rubin’s B = 34.3 and two expanded covariate terms with residual biases around 10% indicate that multivariate balance was not complete. The complementary design-based linear probability model respected ENDI’s expansion factor, strata and UPM clustering and provides the main assessment of statistical precision. The smaller recipient group relative to the non-recipient group should also be borne in mind when interpreting the width of the design-based confidence interval. Nevertheless, PSM cannot remove unmeasured confounding, survey-design models do not resolve temporality, and contemporaneous covariates cannot uniformly be treated as pre-exposure confounders. The frequency-based pooling should be understood as an operational response to sparse-category separation, not as evidence that the pooled ENDI categories are substantively equivalent. This study also does not identify mediation through diet, infection, care, maternal health or service use because their temporal ordering relative to BDH receipt is unavailable.
From a public-health perspective, these results should not be used to infer programme ineffectiveness or to justify reducing cash support. They instead show the limits of evaluating an accumulated nutritional outcome with a single contemporaneous indicator of programme receipt. Complementary nutrition, health, water, sanitation and care services remain plausible pathways through which social protection may influence child growth [11,12,13,14], but their contribution was not tested directly here. Stronger evaluation requires longitudinal payment histories linked to repeated anthropometric measurements, information on exposure during pregnancy and the first 1000 days, and repeated measures of diet, morbidity, care and service use. Such data would permit clearer separation of programme selection, exposure duration, proximal mechanisms and child-growth trajectories and would provide a firmer basis for policy conclusions about cash transfers and chronic child malnutrition.
5. Conclusions
In this cross-sectional ENDI 2023–2024 analysis, the revised primary sample included 6310 children, of whom 792 lived in households reporting current BDH receipt. Matching substantially reduced observed differences between recipient and non-recipient profiles. Kernel matching produced the most favourable overall balance among the broad algorithms and a matched stunting-prevalence difference of +1.36 percentage points; one- and five-neighbour specifications yielded +3.42 and +1.90 points. Rubin’s B remained above the conventional 25% reference value in the broad kernel model (34.3), indicating residual multivariate imbalance. The complementary survey-weighted linear probability model estimated an adjusted difference of +1.41 percentage points (95% CI −5.38 to +8.19; p = 0.684). These findings therefore should not be interpreted as demonstrating absence of an association, equivalence between groups or programme ineffectiveness.
Interpretation is constrained primarily by the measurement of exposure. ENDI records BDH receipt only at the survey date and cannot establish its onset, duration, continuity, historical amount or timing during pregnancy and the first 1000 days. In addition, several balancing covariates are contemporaneous and cannot uniformly be verified as pre-exposure confounders. The larger +4.87-percentage-point kernel contrast obtained when matching was restricted to relatively stable background characteristics on the same 6310-observation sample, compared with +1.36 points under the broad model, shows that the estimated cross-sectional difference is sensitive to covariate specification rather than sample composition. PSM cannot address unmeasured confounding, and the survey-design model addresses sampling structure rather than causal identification.
Future evaluation should link longitudinal BDH payment histories to repeated child-growth measurements and proximal nutrition, morbidity, care and health-service indicators. Until such evidence is available, the present results are best understood as adjusted cross-sectional comparisons of current recipients and non-recipients rather than estimates of cumulative programme effects on linear growth. Policy decisions regarding cash support should therefore not be based on these estimates alone.
Supplementary Materials
The following supporting information can be downloaded at: https://www.mdpi.com/article/10.3390/ijerph23101316/s1, Table S1: Selected unweighted characteristics of the merged descriptive sample; Table S2: Comparison of observations included in and excluded from the revised primary analytical sample; Table S3: Full Logistic Model Used to Estimate the Final Primary Propensity Score. Table S4: Traceability of sparse-category pooling used in the final propensity-score specification; Figure S1: Propensity-score distribution by current BDH-recipient status in the final broad specification.
Author Contributions
Conceptualisation, P.H.-M. and M.P.-H.; methodology, P.H.-M.; software, P.H.-M.; validation, P.H.-M., M.M.-R. and G.S.-M.; formal analysis, P.H.-M. and M.P.-H.; investigation, P.H.-M., M.M.-R. and G.S.-M.; resources, P.H.-M.; data curation, P.H.-M. and M.P.-H.; writing—original draft preparation, P.H.-M.; writing—review and editing, P.H.-M., M.M.-R. and G.S.-M.; visualisation, P.H.-M.; supervision, P.H.-M.; project administration, P.H.-M.; funding acquisition, P.H.-M. All authors have read and agreed to the published version of the manuscript.
Funding
This research was funded by Universidad Nacional de Chimborazo through the research project “Impacto del Bono de Desarrollo Humano en las condiciones de bienestar del hogar: calidad de empleo, desnutrición crónica infantil y capital humano”. The authors acknowledge the institutional support provided for the development of this study. The funder had no role in the design of the study; in the collection, analyses, or interpretation of data; in the writing of the manuscript; or in the decision to publish the results.
Institutional Review Board Statement
Ethical review and approval were not required for this study because it used publicly available, anonymised secondary data from the Encuesta Nacional sobre Desnutrición Infantil (ENDI), produced by the Instituto Nacional de Estadística y Censos (INEC) of Ecuador. The authors did not collect primary data, did not interact directly with human participants, and did not have access to identifiable personal information.
Informed Consent Statement
Not applicable. This study used anonymised public-use secondary data from INEC and did not involve direct contact with participants by the authors.
Data Availability Statement
The data supporting the reported results are publicly available from the Instituto Nacional de Estadística y Censos (INEC) of Ecuador through the Encuesta Nacional sobre Desnutrición Infantil (ENDI) website: https://www.ecuadorencifras.gob.ec/encuesta-nacional-sobre-desnutricion-infantil/ (accessed on 20 July 2026).
Acknowledgments
Artificial intelligence (AI) tools were used to support the linguistic revision of the manuscript and the visual preparation of the graphical abstract. The authors carefully reviewed and validated all AI-assisted suggestions and graphical content and retained full responsibility for the accuracy, interpretation, and scientific content of the final manuscript and graphical abstract.
Conflicts of Interest
The authors declare no conflicts of interest.
Abbreviations
The following abbreviations are used in this manuscript:
| BDH | Bono de Desarrollo Humano |
| CI | Confidence interval |
| ENDI | National Survey on Child Malnutrition/Encuesta Nacional sobre Desnutrición Infantil |
| INEC | Instituto Nacional de Estadística y Censos |
| LR | Likelihood-ratio |
| PSM | Propensity score matching |
| SE | Standard error |
| USD | United States dollar |
| WHO | World Health Organization |
References
- World Health Organization. WHO Child Growth Standards: Length/Height-for-Age; WHO: Geneva, Switzerland, 2006. [Google Scholar]
- World Health Organization. Global Nutrition Targets 2025: Stunting Policy Brief; WHO: Geneva, Switzerland, 2014. [Google Scholar]
- Instituto Nacional de Estadística y Censos. Documento Metodológico de la Encuesta Nacional Sobre Desnutrición Infantil (ENDI) 2023–2024; INEC: Buenos Aires, Argentina, 2023.
- Instituto Nacional de Estadística y Censos. Encuesta Nacional Sobre Desnutrición Infantil (ENDI) 2023–2024, Ronda 2: Principales resultados; INEC: Buenos Aires, Argentina, 2024.
- Rinehart, C.S.; McGuire, J.W. Obstacles to takeup: Ecuador’s conditional cash transfer program, the Bono de Desarrollo Humano. World Dev. 2017, 97, 165–177. [Google Scholar] [CrossRef] [Scilit]
- Paxson, C.; Schady, N. Does money matter? The effects of cash transfers on child development in rural Ecuador. Econ. Dev. Cult. Change 2010, 59, 187–229. [Google Scholar] [CrossRef] [Scilit] [PubMed]
- Fernald, L.C.H.; Hidrobo, M. Effect of Ecuador’s cash transfer program (Bono de Desarrollo Humano) on child development in infants and toddlers: A randomized effectiveness trial. Soc. Sci. Med. 2011, 72, 1437–1446. [Google Scholar] [CrossRef] [Scilit] [PubMed]
- Moncayo, A.L.; Granizo, G.; Grijalva, M.J.; Rasella, D. Strong effect of Ecuador’s conditional cash transfer program on childhood mortality from poverty-related diseases: A nationwide analysis. BMC Public Health 2019, 19, 1132. [Google Scholar] [CrossRef] [Scilit] [PubMed]
- Maggio, D.; Cavanagh, J. The effect of cash transfers on maternal health seeking: Evidence from Ecuador. Econ. Hum. Biol. 2025, 59, 101554. [Google Scholar] [CrossRef] [Scilit] [PubMed]
- World Bank. Ecuador—Social Safety Net Project: Additional Financing; World Bank: Washington, DC, USA, 2022; Available online: https://documents.worldbank.org/en/publication/documents-reports/documentdetail/149151653594377318/ecuador-social-safety-net-project-additional-financing (accessed on 20 September 2026).
- Manley, J.; Balarajan, Y.; Malm, S.; Harman, L.; Owens, J.; Murthy, S.; Stewart, D.; Winder-Rossi, N.E.; Khurshid, A. Cash transfers and child nutritional outcomes: A systematic review and meta-analysis. BMJ Glob. Health 2020, 5, e003621. [Google Scholar] [CrossRef] [Scilit] [PubMed]
- Manley, J.; Alderman, H.; Gentilini, U. More evidence on cash transfers and child nutritional outcomes: A systematic review and meta-analysis. BMJ Glob. Health 2022, 7, e008233. [Google Scholar] [CrossRef] [Scilit] [PubMed]
- Leroy, J.L.; Ruel, M.; Verhofstadt, E. The impact of conditional cash transfer programmes on child nutrition: A review of evidence using a programme theory framework. J. Dev. Eff. 2009, 1, 103–129. [Google Scholar] [CrossRef] [Scilit]
- de Groot, R.; Palermo, T.; Handa, S.; Ragno, L.P.; Peterman, A. Cash transfers and child nutrition: Pathways and impacts. Dev. Policy Rev. 2017, 35, 621–643. [Google Scholar] [CrossRef] [Scilit] [PubMed]
- Pérez-Lu, J.E.; Cárcamo, C.; Nandi, A. Health effects of Juntos, a conditional cash transfer programme in Peru. Matern. Child Nutr. 2017, 13, e12348. [Google Scholar] [CrossRef] [Scilit] [PubMed]
- Cahuana Lipa, R.; Perez Ccasa, M.E.; Machaca Mamani, J.C.; Perez Ccasa, E.; Cárdenas Solano, J. Conditional cash transfer program, child malnutrition and school dropout in the high Andean region of Peru. Sapienza Int. J. Interdiscip. Stud. 2024, 5, e24063. [Google Scholar] [CrossRef] [Scilit]
- López-Arana, S.; Avendaño, M.; Forde, I.; van Lenthe, F.J.; Burdorf, A. Conditional cash transfers and the double burden of malnutrition among children in Colombia: A quasi-experimental study. Br. J. Nutr. 2016, 115, 1780–1789. [Google Scholar] [CrossRef] [Scilit] [PubMed]
- Kandpal, E.; Alderman, H.; Friedman, J.; Filmer, D.; Onishi, J.; Avalos, J. A conditional cash transfer program in the Philippines reduces severe stunting. J. Nutr. 2016, 146, 1793–1800. [Google Scholar] [CrossRef] [Scilit] [PubMed]
- Herrera, D.J.; Herrera, M.L.; Amora, D.; Bas, S.; Miranda, C.A.; Van Hal, G. Mixed-method study on the association between inclusion to conditional cash transfer program and the multiple faces of malnutrition in children and adolescents aged 3 to 19 years: A school-based evidence from Caraga Region, the Philippines. BMC Pediatr. 2023, 23, 630. [Google Scholar] [CrossRef] [Scilit] [PubMed]
- García-Guerra, A.; Neufeld, L.M.; Bonvecchio Arenas, A.; Fernández-Gaxiola, A.C.; Mejía-Rodríguez, F.; García-Feregrino, R.; Rivera-Dommarco, J.A. Closing the nutrition impact gap using program impact pathway analyses to inform the need for program modifications in Mexico’s conditional cash transfer program. J. Nutr. 2019, 149, 2281S–2289S. [Google Scholar] [CrossRef] [Scilit] [PubMed]
- Neufeld, L.M.; García-Guerra, A.; Quezada, A.D.; Théodore, F.; Bonvecchio Arenas, A.; Islas, C.D.; García-Feregrino, R.; Hernández, A.; Colchero, A.; Habicht, J.P. A fortified food can be replaced by micronutrient supplements for distribution in a Mexican social protection program based on results of a cluster-randomized trial and costing analysis. J. Nutr. 2019, 149, 2302S–2309S. [Google Scholar] [CrossRef] [Scilit] [PubMed]
- Théodore, F.L.; Bonvecchio Arenas, A.; García-Guerra, A.; Blanco García, I.; Alvarado, R.; Rawlinson, C.J.; Neufeld, L.M.; Pelto, G.H. Sociocultural influences on poor nutrition and program utilization of Mexico’s conditional cash transfer program. J. Nutr. 2019, 149, 2290S–2301S. [Google Scholar] [CrossRef] [Scilit] [PubMed]
- Soofi, S.B.; Ariff, S.; Khan, G.N.; Habib, A.; Kureishy, S.; Ihtesham, Y.; Hussain, M.; Rizvi, A.; Sajid, M.; Akbar, N.; et al. Effectiveness of unconditional cash transfers combined with lipid-based nutrient supplement and/or behavior change communication to prevent stunting among children in Pakistan: A cluster randomized controlled trial. Am. J. Clin. Nutr. 2022, 115, 492–502. [Google Scholar] [CrossRef] [Scilit] [PubMed]
- Eluwa, T.F.; Eluwa, G.I.E.; Iorwa, A.; Daini, B.O.; Abdullahi, K.; Balogun, M.; Yaya, S.; Ahinkorah, B.O.; Lawal, A. Impact of unconditional cash transfers on household livelihood outcomes in Nigeria. J. Soc. Policy 2025, 54, 595–610. [Google Scholar] [CrossRef] [Scilit]
- Instituto Nacional de Estadística y Censos. Guía de Uso de Base de Datos de la Encuesta Nacional Sobre Desnutrición Infantil (ENDI) 2023–2024; INEC: Buenos Aires, Argentina, 2023.
- Rosenbaum, P.R.; Rubin, D.B. The central role of the propensity score in observational studies for causal effects. Biometrika 1983, 70, 41–55. [Google Scholar] [CrossRef]
- Austin, P.C. An introduction to propensity score methods for reducing the effects of confounding in observational studies. Multivar. Behav. Res. 2011, 46, 399–424. [Google Scholar] [CrossRef] [Scilit] [PubMed]
- Stuart, E.A. Matching methods for causal inference: A review and a look forward. Stat. Sci. 2010, 25, 1–21. [Google Scholar] [CrossRef] [Scilit] [PubMed]
- Caliendo, M.; Kopeinig, S. Some practical guidance for the implementation of propensity score matching. J. Econ. Surv. 2008, 22, 31–72. [Google Scholar] [CrossRef] [Scilit]
- Abadie, A.; Imbens, G.W. On the failure of the bootstrap for matching estimators. Econometrica 2008, 76, 1537–1557. [Google Scholar] [CrossRef] [Scilit]

Disclaimer/Publisher’s Note: The statements, opinions and data contained in all publications are solely those of the individual author(s) and contributor(s) and not of MDPI and/or the editor(s). MDPI and/or the editor(s) disclaim responsibility for any injury to people or property resulting from any ideas, methods, instructions or products referred to in the content. |
© 2026 by the authors. Licensee MDPI, Basel, Switzerland. This article is an open access article distributed under the terms and conditions of the Creative Commons Attribution (CC BY) license.