


Highlights
Public health relevance—How does this work relate to a public health issue?
- Physical literacy is a multidimensional determinant of lifelong physical activity and health, encompassing physical, behavioural, cognitive, and emotional attributes.
- University students represent an important population for health promotion, as the transition to higher education is often accompanied by reduced physical activity and increased sedentary behaviour.
Public health significance—Why is this work of significance to public health?
- This study provides a cross-cultural adaptation and initial psychometric evaluation of the developer-supplied version of the College Student Physical Literacy Questionnaire (CSPLQ) for Slovenian university students.
- The 41-item Slovenian CSPLQ showed initial evidence regarding internal structure and internal consistency, with uneven support across eight dimensions conceptually grouped into four physical literacy domains.
Public health implications—What are the key implications or messages for practitioners, policy makers and/or researchers in public health?
- The 41-item Slovenian CSPLQ provides a basis for further research on self-reported physical literacy among university students; its use for programme evaluation requires additional evidence of temporal stability, external validity, and responsiveness.
- The instrument provides a foundation for population-level research and future cross-cultural studies examining physical literacy and its relationships with physical activity and health outcomes.
Abstract
Background: The transition to university often involves lifestyle changes, reduced physical activity, increased sedentary behaviour, and greater responsibility for health-related choices, making university students an important population for health promotion. Assessing physical literacy may help inform research on students’ engagement in active lifestyles. This study aimed to translate, culturally adapt, and evaluate the psychometric properties of the 41-item Slovenian College Student Physical Literacy Questionnaire (CSPLQ). Methods: The developer-supplied 41-item CSPLQ was translated and cross-culturally adapted through forward translation, back-translation, expert review, and pilot testing. A total of 645 Slovenian university students were randomly divided into exploratory (n = 322) and confirmatory (n = 323) factor analysis samples. Internal consistency, convergent validity, and discriminant validity were also examined. Results: An eight-factor exploratory solution explained 51.4% of the variance. The final 41-item confirmatory model comprised eight correlated dimensions conceptually grouped into four physical literacy domains and yielded CFI = 0.981, TLI = 0.979, RMSEA = 0.071, and SRMR = 0.084, with SRMR slightly exceeding the conventional reference value of 0.08. Ordinal alpha coefficients ranged from 0.742 to 0.878, although omega estimates indicated weaker internal consistency for Physical Activity Cognition (0.590–0.604) and borderline estimates for Sedentary Behaviour (0.698). All HTMT values were below 0.85. AVE-based evidence of within-dimension convergence was uneven, with the lowest AVE observed for Motivation (0.397). Conclusions: The findings provide initial evidence regarding the internal structure and internal consistency of the 41-item Slovenian CSPLQ, with uneven support across dimensions.
1. Introduction
Physical literacy has emerged as an important holistic concept for understanding and promoting lifelong engagement in physical activity. It integrates physical, affective, cognitive, and behavioural attributes that enable individuals to participate meaningfully in movement across the life course. Whitehead conceptualised physical literacy as the motivation, confidence, physical competence, knowledge, and understanding required to maintain physical activity at an individually appropriate level throughout life [1]. This conceptualisation emphasises that embodied experience, personal meaning, interaction with the environment, and informed movement-related decisions are closely interconnected. These core attributes are also reflected in other definitions and operationalisations of the construct [1,2]. Physical literacy extends beyond movement skills. It represents a dynamic and individual journey that may influence how people perceive their own capabilities, respond to movement opportunities, and assume responsibility for an active lifestyle. Contemporary models position physical literacy as a potential determinant of physical activity and health, proposing reciprocal relationships among physical competence, motivation, confidence, knowledge, participation in physical activity, and health-related outcomes [3,4]. This perspective may help explain why some individuals maintain active lifestyles whereas others disengage from physical activity, even when they possess adequate knowledge of its health benefits [3].
The relevance of lifestyle-related knowledge to health promotion is also illustrated by research in younger populations. In a cross-sectional study of children and adolescents undergoing sports eligibility assessments, Lodi et al. identified gaps in cardiovascular health knowledge, including knowledge of physical activity recommendations, and reported lower knowledge scores among participants with overweight or obesity [5]. The authors advocated integrating lifestyle education with preventive assessment. Although these findings concern a younger population, they provide a broader preventive context for considering knowledge and understanding alongside behavioural and physical attributes within physical literacy.
University students represent an important population for physical literacy research and health promotion [6,7,8]. The transition to higher education involves changes in daily routines, social environments, and opportunities for organised physical activity and may be accompanied by reduced physical activity and fitness [8]. Preliminary research suggests that physical literacy interventions may help students maintain activity and fitness during this transition, although larger studies are needed [5,9]. Perceived physical literacy has also been associated with broader aspects of student health [10,11]. A scoping review reported positive associations with quality of life, well-being, resilience, and adherence to sleep recommendations, and negative associations with psychological distress [12].
Assessing physical literacy requires instruments aligned with its conceptual framework and intended population [13,14]. The theoretical construct should be distinguished from its measurement: self-report questionnaires assess perceived attributes and reported experiences or behaviours, whereas performance-based assessments and device-based measures capture different aspects of competence and behaviour. Whether exclusively subjective measures can fully capture the holistic construct remains uncertain [15]. Reviews of available instruments have identified variation in conceptual coverage and limited evidence for several measurement properties, including temporal stability, concurrent validity, and measurement invariance [13,16,17].
Relatively few self-report instruments have been developed specifically for university students, highlighting the need for population-specific assessment tools in higher education [17,18]. Several widely used instruments were instead developed for children, adolescents, or general adult populations [13,14,19]. Assessment in this population should account for movement-related demands and barriers, including sedentary academic work, changing access to organised sport [7,8,10,11,20,21], and diverse prior movement experiences, while remaining practical for administration in large and academically diverse student samples [6,17,21,22].
The College Student Physical Literacy Questionnaire (CSPLQ) was developed as a multidimensional self-report instrument for assessing physical literacy among university students. Its development involved a literature review, expert consultation, content evaluation, and psychometric testing. A preliminary pool of 43 items was reduced to 41 following expert review. Subsequent item analysis led to the removal of three further items, resulting in the published 38-item Chinese questionnaire comprising seven dimensions and three overarching domains [21]. For the present study, the developers supplied the 41-item version and recommended it for translation into Slovenian. The Slovenian adaptation therefore draws on this developer-supplied 41-item version, which preceded statistical item reduction, rather than on the published 38-item Chinese version of the CSPLQ.
Nevertheless, evidence supporting an instrument in its original language and cultural setting cannot automatically be generalised to another population. Translation alone does not ensure that questionnaire items retain equivalent meanings, cultural relevance, or measurement properties. Cross-cultural adaptation therefore requires attention to conceptual, semantic, and experiential equivalence, followed by psychometric evaluation in the target population. This is especially important for a multidimensional construct such as physical literacy, because changes in item interpretation may affect the number and composition of latent factors and consequently compromise comparisons between populations [22,23].
To date, no Slovenian adaptation of the CSPLQ with published evidence of its psychometric properties has been available for assessing physical literacy among university students. Translation and cross-cultural adaptation of the developer-supplied 41-item version, followed by psychometric evaluation, could provide a basis for research on self-reported physical literacy in Slovenian higher education.
Accordingly, the aim of the present study was to translate, culturally adapt, and evaluate the psychometric properties of the Slovenian adaptation of the developer-supplied 41-item version of the CSPLQ among university students. Specifically, the study examined the questionnaire’s latent structure using exploratory factor analysis and confirmatory factor analysis and evaluated its internal consistency, within-dimension convergence, and discriminant validity. It also examined whether retaining all items from the developer-supplied 41-item version was justified in the Slovenian context.
2. Materials and Methods
2.1. Study Design
The present study employed a methodological cross-sectional design to translate, culturally adapt, and psychometrically evaluate the 41-item Slovenian version of the College Student Physical Literacy Questionnaire (CSPLQ). The validation process comprised two sequential phases. First, the original English version of the questionnaire underwent a systematic process of translation and cross-cultural adaptation to ensure conceptual, semantic, and linguistic equivalence with the original instrument. Second, the psychometric properties of the translated questionnaire were evaluated in a sample of Slovenian university students using contemporary latent variable modelling techniques.
The evaluation of the questionnaire focused primarily on evidence based on internal structure, including exploratory factor analysis (EFA), confirmatory factor analysis (CFA), internal consistency, convergent validity, discriminant validity, and sensitivity analyses. The study design followed internationally accepted recommendations for the translation, cross-cultural adaptation, and psychometric validation of self-report instruments, with exploratory and confirmatory analyses conducted on two independent subsamples to minimise overfitting and improve the generalisability of the obtained measurement model.
2.2. Participants
Participants were recruited through convenience sampling during the 2025/2026 academic year. An invitation was emailed to higher education teachers, who were asked to forward an online survey link to their students. The invitation described the purpose of the study, stated that the survey was anonymous, and included a QR code for access via mobile devices. The main survey was administered during the 2025/2026 academic year. Participants completed the questionnaire independently, without researcher supervision, using standardised written instructions based on those accompanying the original questionnaire. The average completion time for the online questionnaire was approximately 4.5 min (median: 4.1 min). Because the survey link was distributed indirectly through higher education teachers, the exact number of students who received the invitation could not be determined; therefore, a response rate could not be calculated.
The sample included students from all three Slovenian public universities, as well as private higher education institutions in Slovenia. Participants reported programmes spanning education, social sciences, humanities, engineering, natural sciences, and health-related fields. However, the distribution across academic backgrounds was uneven: 384 participants (59.5%) reported studying at a faculty of education.
Eligible participants were students aged 18 years or older who were currently enrolled in an undergraduate or graduate study programme at a Slovenian higher education institution and voluntarily agreed to participate in the study. No additional exclusion criteria were specified. Participation was anonymous and no financial or academic incentives were provided.
Before completing the questionnaire, participants received information about the purpose and content of the study. They were informed that participation was voluntary, that they could discontinue the questionnaire at any time without consequences, and that proceeding with or submitting the questionnaire constituted consent to participate.
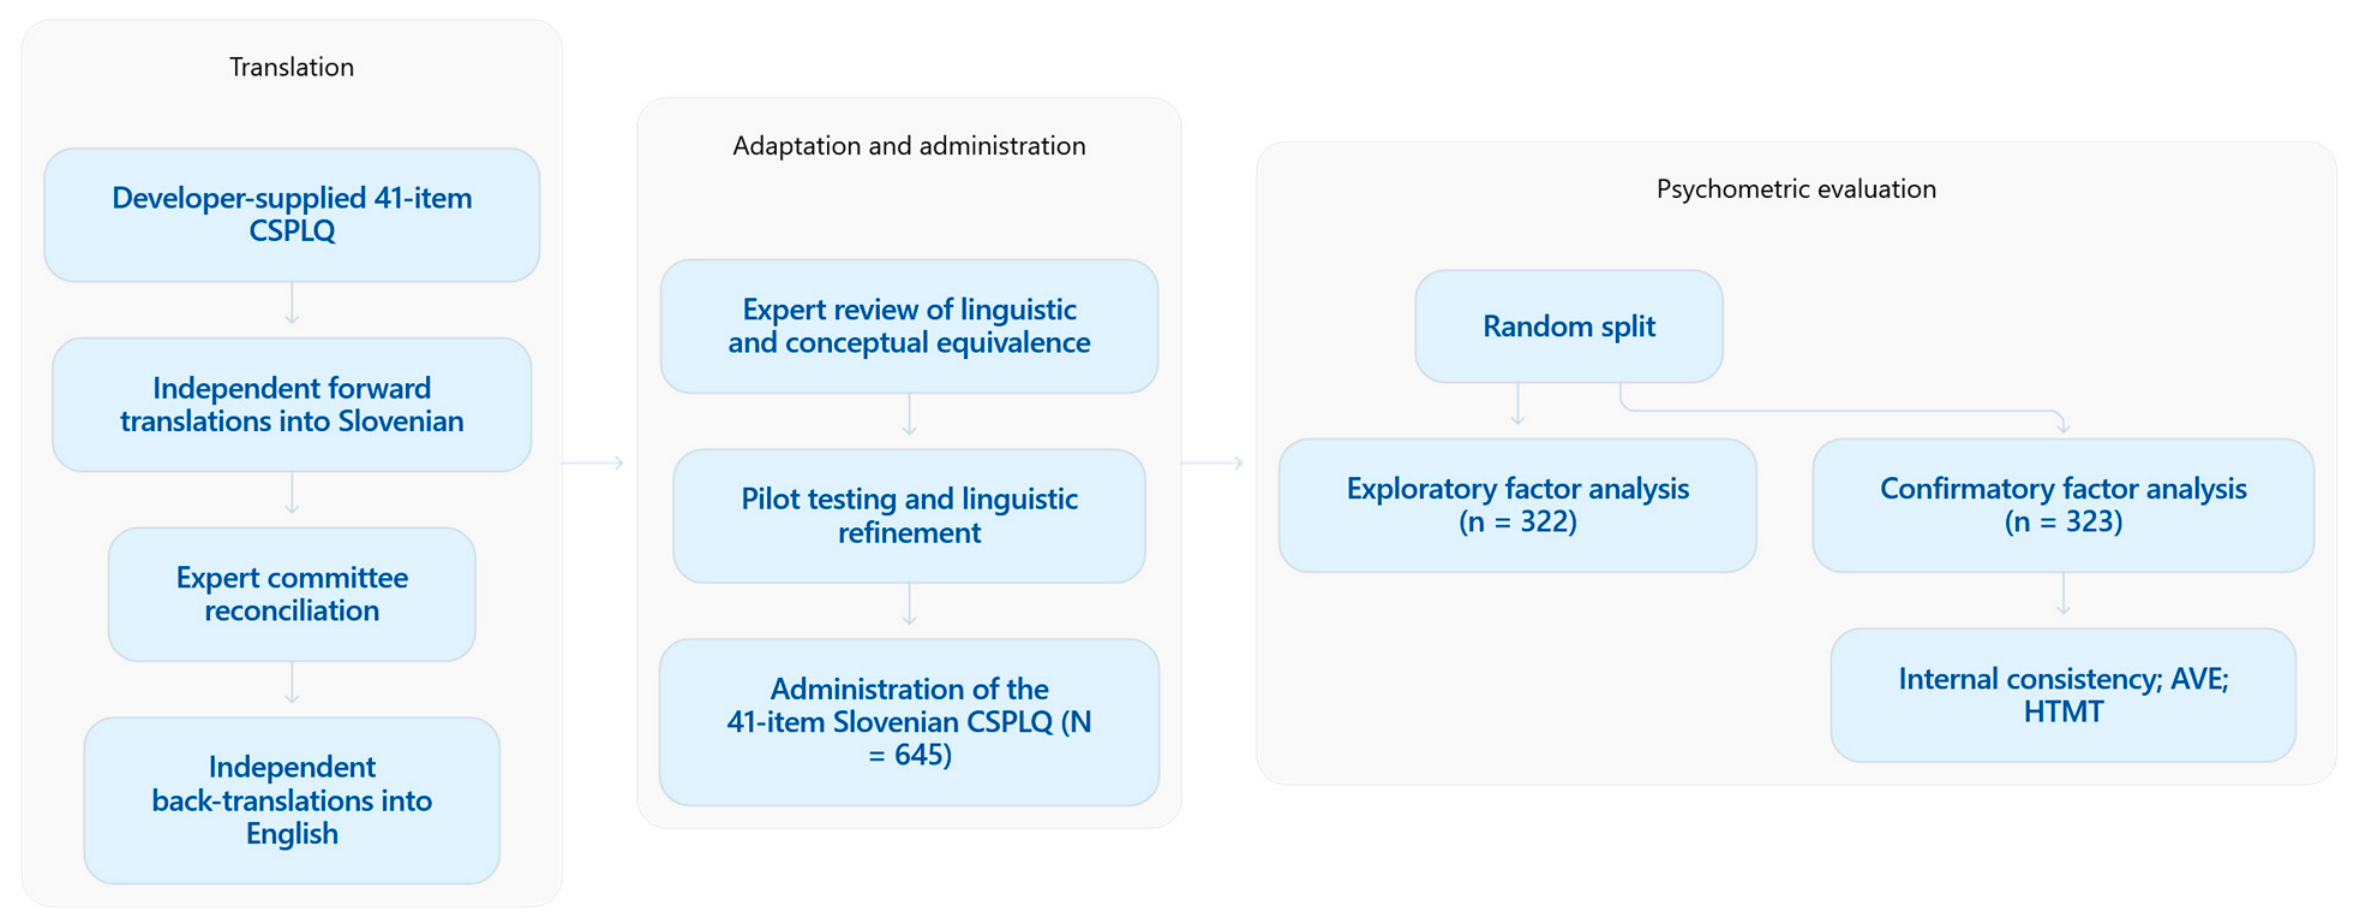
A total of 686 participants started completing the questionnaire. Of these, 645 completed all 41 CSPLQ items, whereas 41 provided incomplete responses and were not included in the psychometric analyses. The final analytical sample therefore comprised 645 participants. The total sample was randomly divided into two approximately equal independent subsamples using a computer-generated random variable. Specifically, a uniformly distributed random number was generated for each participant, after which participants were sorted according to the generated value and assigned sequentially to either the exploratory or confirmatory subsample. This procedure resulted in an exploratory factor analysis sample of 322 participants and an independent confirmatory factor analysis sample of 323 participants. The split-sample approach reduced the likelihood of capitalising on chance and provided a more rigorous assessment of the stability and construct validity of the proposed measurement model.
The overall sample consisted of 494 women (76.6%) and 151 men (23.4%), with a mean age of 22.91 years (SD = 1.96; range 20–38 years). Participant characteristics for the total sample and both validation subsamples are reported in Section 3.
2.3. Instrument
The present study used the developer-supplied 41-item version of the College Student Physical Literacy Questionnaire (CSPLQ), a multidimensional self-report instrument developed for university students. The developers supplied this version to the research team and recommended it for translation into Slovenian. Their recommendation guided the selection of this version rather than the published 38-item Chinese version of the CSPLQ [21]. Accordingly, the present study evaluates the Slovenian adaptation of the developer-supplied 41-item version.
The two versions differ in item coverage and dimensional organisation. In the original Chinese study, Q17, Q18, and Q33 were removed during item analysis because their item–total correlations were below 0.20 [21]. The Slovenian adaptation retained all three items, with Q17 and Q18 assigned to Sedentary Behaviour and Q33 to Motivation. In addition, Q27 was assigned to Physical Activity Cognition in the Slovenian CFA model, whereas it was included in Motivation in the published Chinese model. Item numbers here refer to the 41-item set.
The supplied 41-item version served as the basis for the translation and cross-cultural adaptation procedure described below. All 41 items were administered in the Slovenian psychometric evaluation. Responses were recorded on a five-point Likert scale ranging from 1 (strongly disagree) to 5 (strongly agree). Scores for each of the eight dimensions were calculated as the arithmetic mean of the item responses assigned to that dimension, as specified in Table 1, yielding a possible range of 1–5. For dimension score calculation, items Q17 and Q18, which describe sedentary behaviour, were reverse-scored using the transformation 6-original response (1 ↔ 5, 2 ↔ 4, and 3 unchanged). The Sedentary Behaviour score was calculated as the mean of these two reverse-scored items; higher scores therefore indicate less self-reported sedentary behaviour. No other items were reverse-scored when calculating dimension scores. For the remaining dimensions, higher scores indicate higher self-reported levels of the respective attributes or behaviours. All participants provided valid responses to all 41 items, so dimension scores were calculated using all constituent items without imputation.
Table 1.
Conceptual organisation of the 41-item Slovenian College Student Physical Literacy Questionnaire (CSPLQ).
Scoring and interpretation in the present study were restricted to the eight dimensions listed in Table 1. No composite scores for the four broader domains or overall CSPLQ score were reported. The correlated eight-factor model evaluated in this study did not establish the psychometric adequacy of these aggregate scores. Further validation would therefore be required before recommending their use.
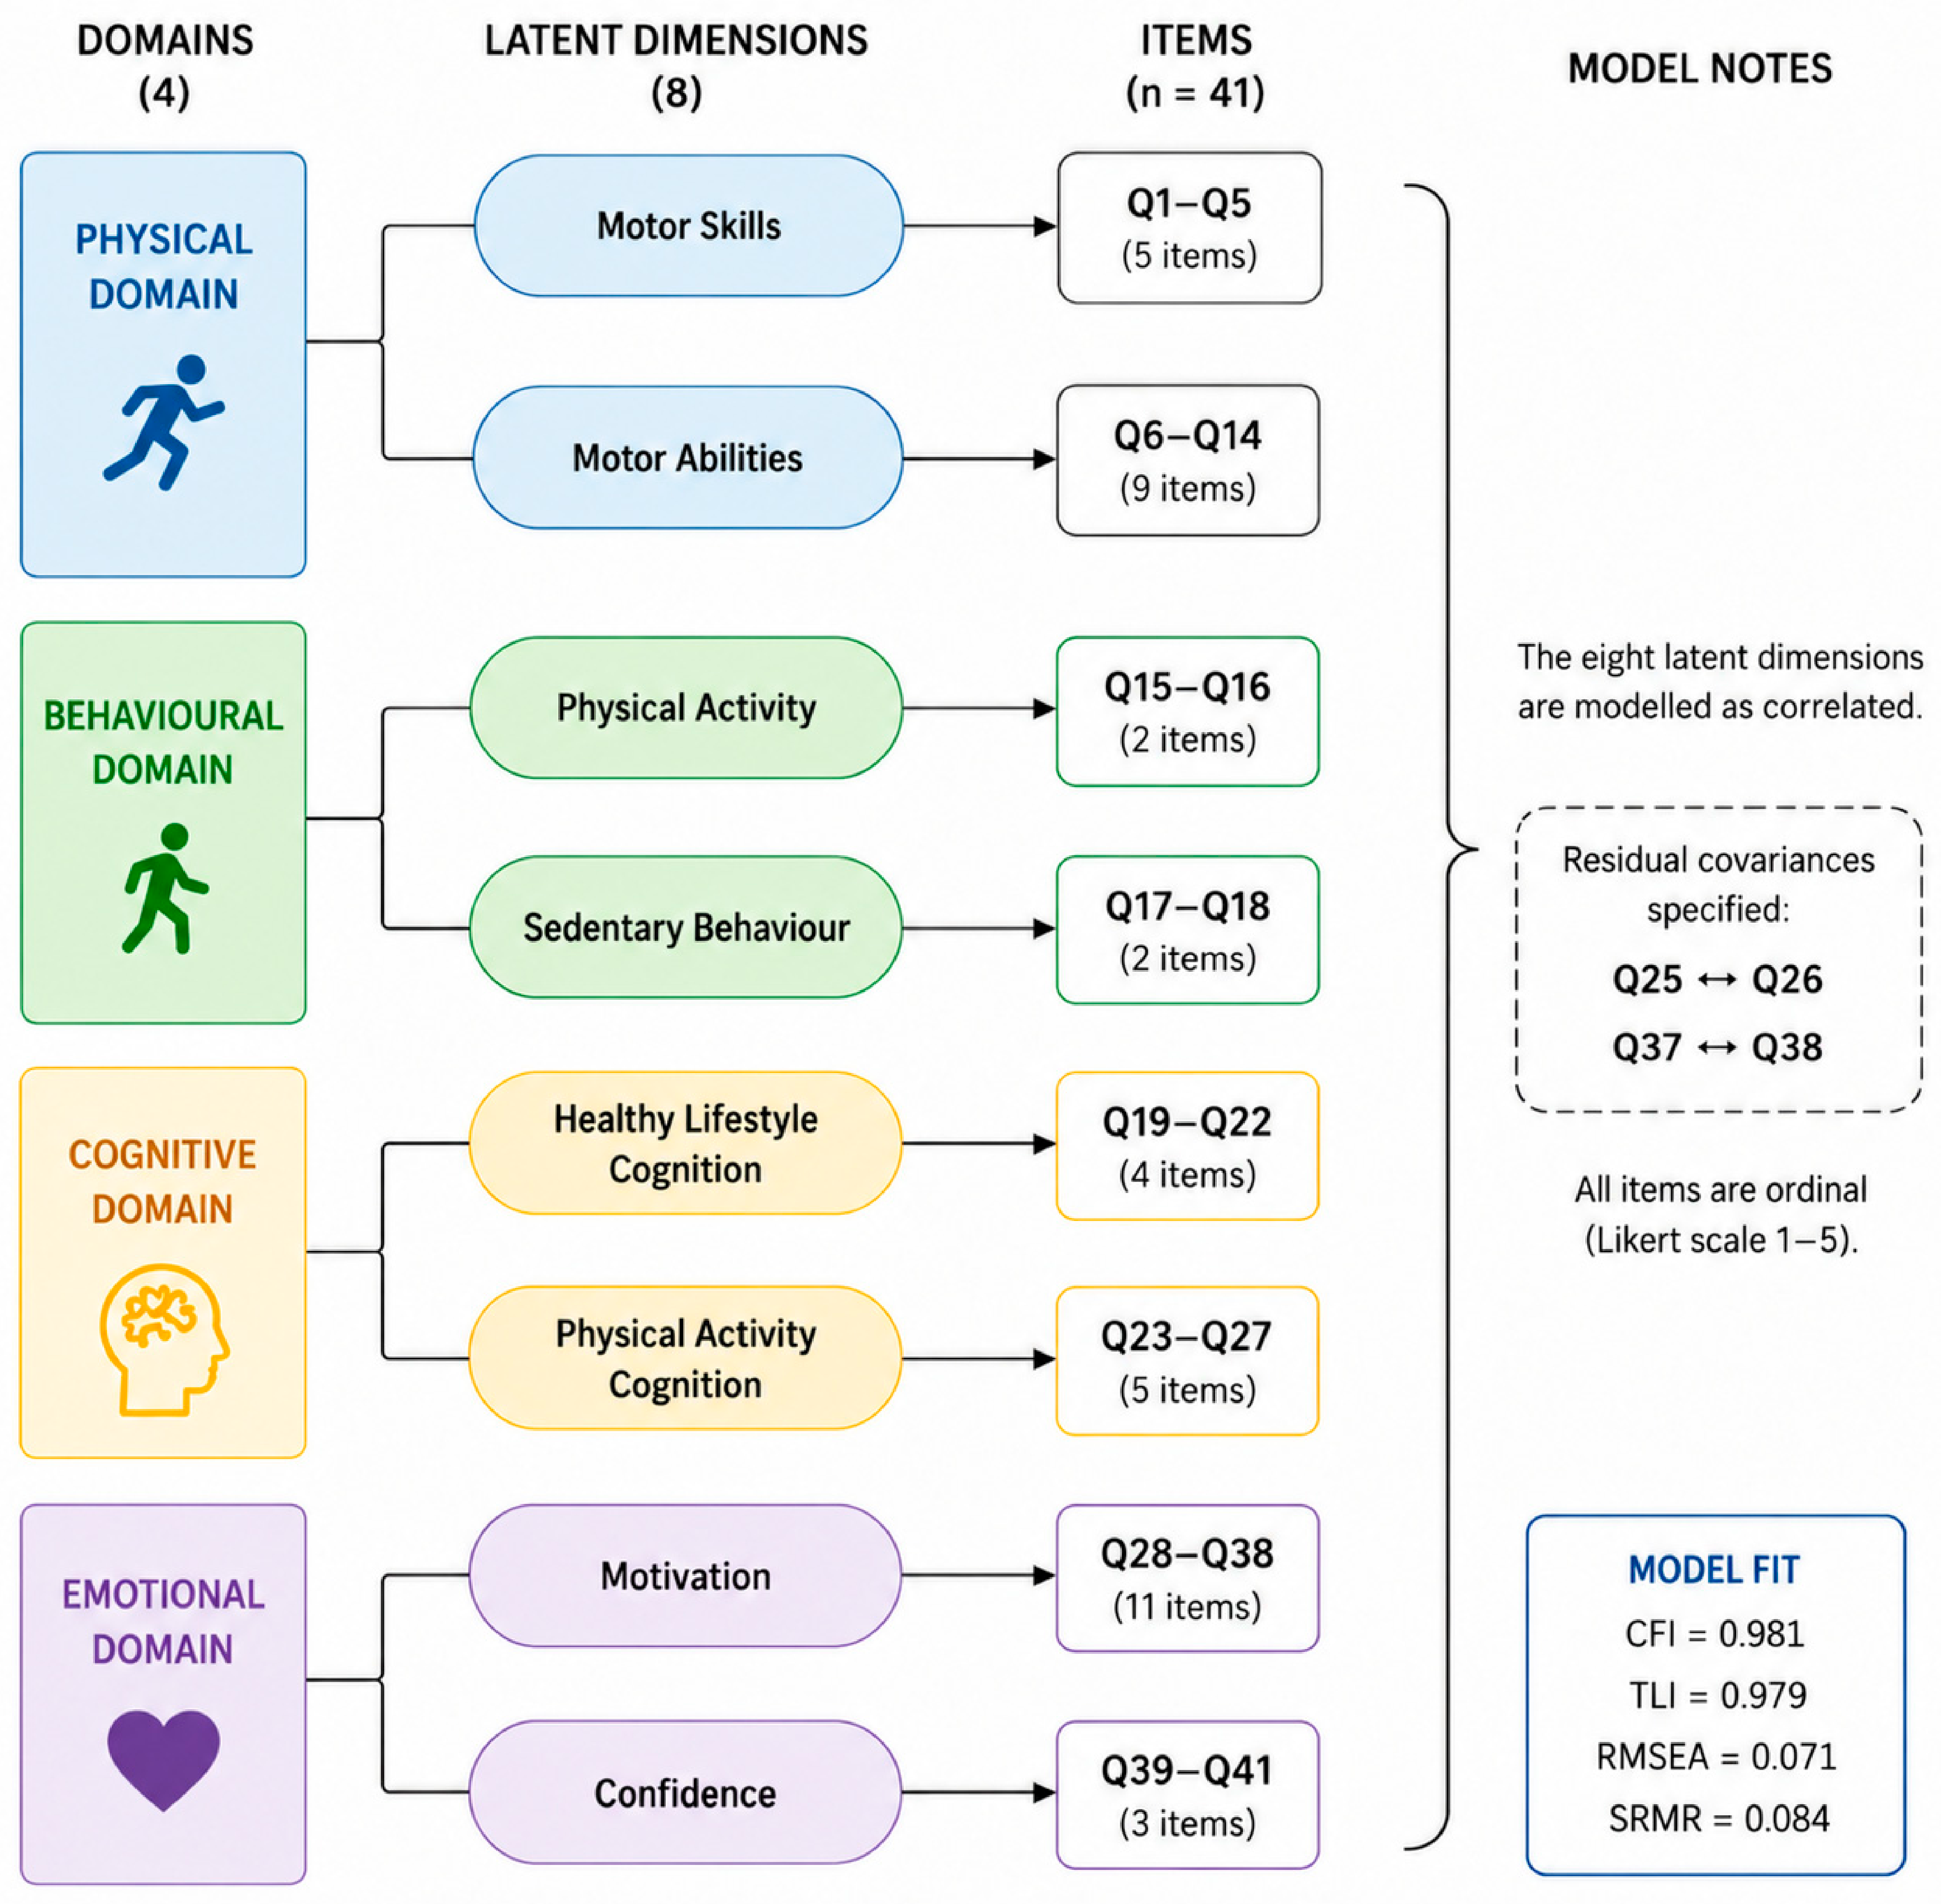
Conceptually, the 41-item Slovenian CSPLQ reflects the four domains of physical literacy proposed by the International Physical Literacy Association: Physical, Behavioural, Cognitive, and Emotional. The eight dimensions are conceptually grouped into four broader domains: Motor Skills and Motor Abilities within the Physical domain; Physical Activity and Sedentary Behaviour within the Behavioural domain; Healthy Lifestyle Cognition and Physical Activity Cognition within the Cognitive domain; and Motivation and Confidence within the Emotional domain. The conceptual organisation of the questionnaire is presented in Table 1.
The 41-item Slovenian CSPLQ assesses university students’ self-perceived attributes and self-reported behaviours related to physical literacy; its scores should not be interpreted as direct measures of demonstrated motor competence or objectively measured physical activity.
2.4. Translation and Cross-Cultural Adaptation
The translation and cross-cultural adaptation of the initial 41-item version of the CSPLQ followed a multistage procedure designed to establish semantic, idiomatic, experiential, and conceptual equivalence between the original and Slovenian versions. The process comprised the establishment of a multidisciplinary expert committee, independent forward translations, reconciliation, independent back-translations, expert review, pilot testing, and final linguistic refinement [24,25].
A multidisciplinary expert committee comprising four members was established before the translation process began. The committee included experts in kinesiology, research methodology and psychometrics, educational sciences, and linguistics. The committee was responsible for coordinating the adaptation process, resolving discrepancies between translated versions, and ensuring that the Slovenian questionnaire retained the conceptual meaning and content coverage of the original instrument.
Two independent forward translations from English into Slovenian were produced by translators whose native language was Slovenian and who were fluent in English. One translator was familiar with the objectives, conceptual framework, and intended constructs of the questionnaire, whereas the second translator was not provided with detailed information about the instrument and acted as a naïve translator. This combination was used to preserve the intended conceptual meaning while also identifying wording that could be interpreted differently by respondents without prior knowledge of the physical literacy framework.
The two forward translations were compared by the expert committee and reconciled into a single preliminary Slovenian version through consensus discussion. No major cultural adaptation issues were identified during translation. Minor differences between translators concerned wording and were resolved through discussion and consensus. For example, item 38 (“I think people in physical activity are very dynamic”) prompted discussion about whether the wording should refer to people during physical activity or to people who engage in physical activity. The final Slovenian formulation explicitly referred to people who engage in physical activity.
The reconciled Slovenian version was then independently back-translated into English by two additional translators whose native language was English and who were fluent in Slovenian. Neither back-translator had access to the original English questionnaire or detailed information about its conceptual framework and intended measurement structure. This blinding procedure was used to minimise bias and facilitate the identification of discrepancies between the original and back-translated versions.
The expert committee subsequently compared the original questionnaire, both forward translations, the reconciled Slovenian version, and both back-translations. Each item was evaluated for semantic equivalence, referring to the meaning of words and sentences; idiomatic equivalence, referring to culturally specific expressions; experiential equivalence, referring to the relevance of the described experiences to Slovenian university students; and conceptual equivalence, referring to whether the translated item represented the same underlying construct as the original item. Discrepancies were resolved through consensus, resulting in a pre-final Slovenian version of the questionnaire.
The pre-final version was subsequently pilot-tested among 32 university students. Participants completed the questionnaire in person under supervised conditions. Immediately after completion, brief individual or small-group interviews were conducted to identify potentially unclear, ambiguous, culturally inappropriate, or difficult-to-understand items and response options. Participants were also invited to provide open-ended feedback regarding the wording, comprehensibility, relevance, and interpretation of individual items.
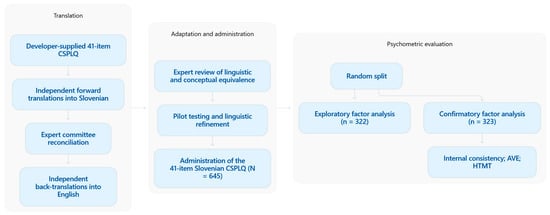
The expert committee reviewed feedback obtained during pilot testing. The pilot participants did not identify any substantial conceptual difficulties, although minor linguistic refinements were introduced to improve clarity and naturalness of expression. No item was removed or substantively altered. Following these revisions, the committee approved the final Slovenian version for psychometric evaluation. The overall sequence of translation, cross-cultural adaptation, questionnaire administration, and psychometric evaluation is summarised in Figure 1.
Figure 1.
Overview of the translation, cross-cultural adaptation, and psychometric evaluation of the 41-item Slovenian CSPLQ. Note. AVE = average variance extracted; HTMT = heterotrait–monotrait ratio.
2.5. Ethical Considerations
The study was conducted in accordance with the ethical principles of the Declaration of Helsinki and applicable national guidelines for research involving human participants. Ethical approval was obtained from the Ethics Committee for Research of the Faculty of Arts, University of Maribor. The committee concluded that the proposed research did not pose foreseeable risks to participants and complied with applicable ethical standards for scientific research.
Participation was voluntary and anonymous. Before completing the questionnaire, all participants received written information regarding the objectives of the study, the confidential handling of collected data, and their right to withdraw from participation at any stage without consequences. They were informed that proceeding with or submitting the questionnaire constituted consent to participate.
2.6. Statistical Analysis
All statistical analyses were performed using Jamovi (version 2.6.44.0), with psychometric procedures implemented through the R statistical environment. Descriptive statistics were calculated for all study variables and included means, standard deviations, minimum and maximum values, skewness, and kurtosis to examine the distributional properties of the questionnaire domains.
Data completeness was examined before the psychometric analyses were conducted. Of the 686 participants who started completing the questionnaire, 41 provided incomplete responses and were excluded from the psychometric analyses. The final analytical sample comprised 645 participants, all of whom provided responses to all 41 CSPLQ items. No item-level data were missing in the final analytical sample; therefore, no missing-data imputation procedure was required. All psychometric analyses were therefore conducted using the complete dataset of 645 participants and the corresponding complete EFA and CFA subsamples.
Given that all items of the 41-item Slovenian CSPLQ were measured on five-point Likert scales, they were treated as ordinal variables throughout the psychometric evaluation. Consequently, polychoric correlation matrices were used as the basis for factor analyses because they provide more accurate estimates of the associations among latent continuous variables underlying ordinal responses than conventional Pearson product-moment correlations.
To ensure independent model development and validation, the computer-generated random split described above was used to divide the total sample into an exploratory factor analysis subsample (n = 322) and an independent confirmatory factor analysis subsample (n = 323). The split-sample approach reduced the likelihood of overfitting and provided stronger evidence for the stability and generalisability of the proposed measurement model.
2.6.1. Exploratory Factor Analysis
Exploratory factor analysis was conducted using the minimum residual (MinRes) extraction method. Because the theoretical framework of physical literacy assumes that its dimensions are conceptually related rather than statistically independent, an oblimin rotation was applied, allowing latent factors to correlate.
Prior to factor extraction, the suitability of the data for factor analysis was assessed using the Kaiser–Meyer–Olkin (KMO) measure of sampling adequacy and Bartlett’s test of sphericity. The overall KMO value and significant Bartlett’s test were considered indicators that the correlation matrix was appropriate for factor analysis.
The number of retained factors was determined by combining theoretical considerations derived from the conceptual framework of physical literacy with empirical evidence obtained during the exploratory analyses. Factor loadings, uniqueness values, and the proportion of explained variance were examined to evaluate the interpretability of the extracted solution. Items were assigned to the factor on which they demonstrated the strongest standardized loading while maintaining conceptual consistency with the underlying construct. Cross-loadings and factor interpretability were evaluated jointly rather than relying on a single statistical criterion.
2.6.2. Confirmatory Factor Analysis
Confirmatory factor analysis evaluated a theoretically specified measurement model comprising eight correlated first-order latent factors in the independent validation sample. The four broader domains—Physical, Behavioural, Cognitive, and Emotional—served as conceptual groupings and were not estimated as second-order latent factors. Consequently, the CFA results pertain to the eight-factor model and do not establish the validity of a four-domain higher-order structure. Because the questionnaire consisted of ordinal indicators, model parameters were estimated using the Diagonally Weighted Least Squares (DWLS) estimator, which has been shown to provide robust parameter estimates and goodness-of-fit statistics for ordinal categorical data.
Overall model fit was evaluated using several complementary fit indices, including the Comparative Fit Index (CFI), Tucker–Lewis Index (TLI), Root Mean Square Error of Approximation (RMSEA), and Standardized Root Mean Square Residual (SRMR). Following widely accepted recommendations, CFI and TLI values of at least 0.95 and RMSEA values below 0.08 were considered indicative of good model fit [26]. Model fit was evaluated holistically across all fit indices rather than relying on a single predefined cutoff value.
Standardized factor loadings were examined for all observed variables. Modification indices were inspected to identify potential sources of local misfit, and candidate modifications were considered in relation to item content. Residual covariances were added between Q25–Q26 and Q37–Q38. Q25 and Q26 share nearly identical wording and assess familiarity with WHO recommendations for the respondent’s age group, concerning physical activity and sedentary behaviour, respectively. This shared reference to a specific source of recommendations may generate covariance beyond that explained by the broader Physical Activity Cognition factor. Q37 and Q38 both express favourable evaluations of other people in relation to physical fitness or activity, referring to attractiveness and dynamism, respectively. Their shared evaluative framing may similarly contribute covariance beyond the Motivation factor. These modifications were informed by the observed data and item content; no cross-loadings or additional latent paths were introduced.
2.6.3. Reliability and Convergent Validity
Internal consistency was evaluated using ordinal Cronbach’s alpha, McDonald’s omega total (ω1), and McDonald’s omega hierarchical (ω3). Because the questionnaire items were ordinal, ordinal reliability coefficients were considered more appropriate than conventional Cronbach’s alpha. McDonald’s omega coefficients were additionally reported because they provide reliability estimates that do not rely on the restrictive assumption of tau-equivalence [27].
Within-dimension convergence was assessed using the Average Variance Extracted (AVE) for each latent construct. Although an AVE value of 0.50 or greater is generally regarded as desirable, slightly lower values were interpreted alongside composite reliability estimates.
2.6.4. Discriminant Validity
Discriminant validity was evaluated using the Heterotrait–Monotrait ratio of correlations (HTMT) to assess whether the latent dimensions of the questionnaire were empirically distinguishable from one another. HTMT values below 0.85 were interpreted as evidence that the latent constructs represented empirically distinguishable dimensions of physical literacy. The HTMT approach was preferred over traditional Fornell–Larcker criteria because it has demonstrated superior sensitivity for detecting insufficient discriminant validity in structural equation models [28].
2.6.5. Sensitivity Analysis
Following estimation of the final CFA model, an additional sensitivity analysis was performed to evaluate the influence of Item Q34 on the Motivation construct. An alternative model excluding Q34 was estimated and compared with the original model.
3. Results
3.1. Participant Characteristics
The study included 645 university students enrolled in undergraduate and graduate study programmes across multiple faculties and higher education institutions in Slovenia. The mean age of participants was 22.91 years (SD = 1.96; range 20–38 years), and the majority were women (76.6%). The total sample was randomly divided into two independent subsamples comprising 322 participants for exploratory factor analysis and 323 participants for confirmatory factor analysis. Demographic characteristics of the total sample and both subsamples are presented in Table 2.
Table 2.
Participant characteristics of the total sample and validation subsamples.
3.2. Exploratory Factor Analysis
The suitability of the data for exploratory factor analysis was confirmed by a high Kaiser–Meyer–Olkin measure of sampling adequacy (KMO = 0.892) and a statistically significant Bartlett’s test of sphericity (χ2 = 6892, df = 820, p < 0.001), indicating that the correlation matrix was appropriate for factor analysis.
Exploratory factor analysis using minimum residual extraction with oblimin rotation yielded an interpretable eight-factor solution that was broadly consistent with the theoretical structure of the questionnaire. Together, the retained factors explained 51.4% of the total variance.
The extracted factors corresponded to the conceptual dimensions of Motor Skills, Motor Abilities, Physical Activity, Sedentary Behaviour, Healthy Lifestyle Cognition, Physical Activity Cognition, Motivation, and Confidence. The eight-factor solution was broadly interpretable and generally consistent with the proposed conceptual structure. Most items showed their strongest loading on a conceptually corresponding factor, although several items demonstrated weaker or more complex loading patterns. Together, these eight latent dimensions represented the four overarching domains of physical literacy proposed in the conceptual framework of the questionnaire.
3.3. Descriptive Statistics
Descriptive statistics for the eight latent dimensions of the 41-item Slovenian CSPLQ are presented in Table 3.
Table 3.
Descriptive statistics for the latent dimensions of the 41-item Slovenian College Student Physical Literacy Questionnaire (CSPLQ).
Mean scores ranged from 2.60 for Sedentary Behaviour to 4.42 for Motor Skills. Healthy Lifestyle Cognition and Motivation also demonstrated relatively high average scores, whereas Confidence and Motor Abilities showed comparatively lower values. Distributional characteristics varied across dimensions. Most dimensions showed relatively limited skewness and kurtosis, although Motor Skills demonstrated pronounced negative skewness and elevated kurtosis, consistent with a concentration of responses at the upper end of the scale.
3.4. Confirmatory Factor Analysis
The eight-factor structure identified in the exploratory analyses was subsequently evaluated using confirmatory factor analysis in an independent validation sample.
The initial eight-factor model showed mixed fit, χ2(751) = 3423, p < 0.001, CFI = 0.958, TLI = 0.954, RMSEA = 0.105 (95% CI [0.102, 0.109]), and SRMR = 0.104. Inspection of modification indices and item content suggested residual dependence between Q25 and Q26, two items within the Physical Activity Cognition dimension. Allowing their residuals to correlate substantially improved model fit, χ2(750) = 2075, p < 0.001, CFI = 0.979, TLI = 0.977, RMSEA = 0.074 (95% CI [0.070, 0.078]), and SRMR = 0.084. Subsequent inspection indicated residual dependence between Q37 and Q38, two items within the Motivation dimension. Allowing this additional within-factor residual covariance resulted in the final model, χ2(749) = 1977, p < 0.001, CFI = 0.981, TLI = 0.979, RMSEA = 0.071 (95% CI [0.068, 0.075]), and SRMR = 0.084. Although CFI and TLI indicated strong incremental fit and RMSEA was within an acceptable range, SRMR remained slightly above the commonly used 0.08 reference value; the final model was therefore interpreted as showing generally supportive, but not uniformly optimal, fit. Standardized factor loadings for all 41 items in the final CFA model are provided in Supplementary Table S2.
Fit indices for the initial and modified models are presented in Table 4. The initial model yielded CFI = 0.958 and TLI = 0.954, alongside RMSEA = 0.105 and SRMR = 0.104. After adding residual covariances between Q25–Q26 and Q37–Q38, CFI increased to 0.981 and TLI to 0.979, while RMSEA decreased to 0.071 and SRMR to 0.084. These changes indicated improved fit, although the final SRMR remained above 0.08, warranting caution in interpreting overall model fit.
Table 4.
Fit indices for the initial and modified eight-factor CFA models.
Although CFI and TLI exceeded the specified reference value of 0.95 and RMSEA was below 0.08, SRMR slightly exceeded the commonly used reference value of 0.08. The fit indices therefore provided a mixed picture, warranting a qualified interpretation of overall model fit.
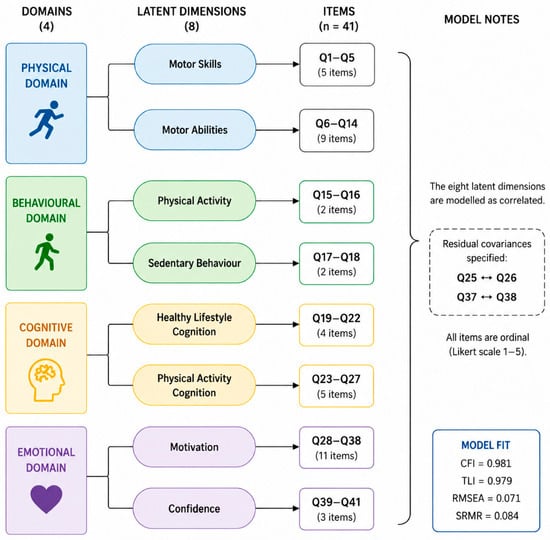
All retained items loaded on their intended latent constructs. Most standardized factor loadings were moderate to strong, although several items showed comparatively weaker loadings, most notably Q34 within the Motivation dimension. The final measurement model is presented in Figure 2.
Figure 2.
Schematic representation of the eight-factor CFA model and conceptual domain groupings of the 41-item Slovenian College Student Physical Literacy Questionnaire (CSPLQ). Note. The figure summarises the assignment of 41 items to eight correlated first-order latent factors. Item sets are displayed in grouped boxes, and correlations among factors are not individually depicted. The four broader domains represent conceptual groupings only and were not estimated as second-order latent factors. Residual covariances were specified between Items Q25–Q26 and Q37–Q38 based on theoretical justification and modification indices. Model fit indices refer to the final CFA model estimated using diagonally weighted least squares (DWLS) for ordinal data. CFI = Comparative Fit Index; TLI = Tucker–Lewis Index; RMSEA = Root Mean Square Error of Approximation; SRMR = Standardized Root Mean Square Residual.
3.5. Reliability and Convergent Validity
Internal consistency and within-dimension convergence were evaluated for each latent dimension. Standardized factor loadings and AVE were used to assess how well the items represented their respective dimensions. These analyses did not assess convergence with external measures of physical literacy or related constructs. Reliability and AVE estimates are presented in Table 5.
Table 5.
Reliability and convergent validity estimates for the latent dimensions of the 41-item Slovenian College Student Physical Literacy Questionnaire (CSPLQ).
Internal consistency estimates varied across dimensions and coefficients. Ordinal alpha values ranged from 0.742 to 0.878. However, the reported omega estimates were notably lower for Physical Activity Cognition (ω1 = 0.590; ω3 = 0.604), despite an ordinal alpha of 0.809. For Sedentary Behaviour, ordinal alpha was 0.742 and both omega estimates were 0.698. These results indicate that internal consistency was not uniformly supported across all eight dimensions and warrant particular caution when interpreting Physical Activity Cognition and Sedentary Behaviour scores.
AVE exceeded 0.50 for five dimensions. Motor Abilities (AVE = 0.496) and Physical Activity Cognition (AVE = 0.492) fell slightly below this benchmark, whereas Motivation had a lower AVE of 0.397. Although Motivation had an ordinal alpha of 0.861 and omega estimates of 0.784 and 0.799, these internal consistency estimates do not resolve the concern indicated by its lower AVE. The AVE results provide evidence concerning convergence among indicators within the specified measurement model; they do not establish convergence with external measures, which was not assessed in this study.
3.6. Discriminant Validity
Discriminant validity was assessed using the Heterotrait–Monotrait ratio of correlations (HTMT). The HTMT matrix is presented in Table 6.
Table 6.
Heterotrait–Monotrait ratio of correlations (HTMT) among the eight latent dimensions of the 41-item Slovenian College Student Physical Literacy Questionnaire (CSPLQ).
All HTMT values were below the recommended threshold of 0.85, providing evidence that the eight latent dimensions represent empirically distinct constructs. The highest HTMT value (0.835) was observed between Motor Skills and Motor Abilities, reflecting the conceptual relatedness of these two dimensions while remaining below the recommended criterion. The second-highest value (0.809) was observed between Physical Activity Cognition and Motivation, which also remained within the acceptable range. Collectively, these findings support satisfactory discriminant validity of the 41-item Slovenian CSPLQ.
3.7. Sensitivity Analysis
To evaluate the stability of the final measurement model, a sensitivity analysis was conducted by estimating an alternative model excluding Item Q34.
To evaluate the influence of Q34, which showed the weakest standardized loading within the Motivation dimension (λ = 0.297, p < 0.001), an alternative CFA model excluding this item was estimated. The 41-item model yielded CFI = 0.981, TLI = 0.979, RMSEA = 0.071, and SRMR = 0.084. After Q34 was excluded, CFI and TLI remained unchanged (CFI = 0.981; TLI = 0.979), whereas RMSEA increased slightly to 0.073 and SRMR to 0.085. Thus, removal of Q34 did not improve overall model fit.
Exclusion of Q34 produced modest improvements in the psychometric estimates for the Motivation dimension. Ordinal Cronbach’s alpha increased from 0.861 to 0.870, McDonald’s ω1 from 0.784 to 0.789, and ω3 from 0.799 to 0.811, while AVE increased from 0.397 to 0.428. However, AVE remained below the conventional 0.50 criterion. Taken together, these findings indicate that removing Q34 modestly improved some dimension-level estimates but did not improve global model fit or fully resolve the limited within-dimension convergence observed for Motivation. Q34 was therefore retained in the present 41-item version, while its comparatively weak loading was considered in the interpretation of the Motivation dimension.
4. Discussion
4.1. Main Findings and Relationship to the Original Version
The present study translated, culturally adapted, and psychometrically evaluated the 41-item Slovenian version of the College Student Physical Literacy Questionnaire (CSPLQ), using the developer-supplied 41-item version recommended for translation. Overall, the findings provide initial evidence regarding the psychometric properties of the Slovenian instrument, with stronger support for some dimensions than others. An eight-factor correlated model was evaluated using confirmatory factor analysis, yielding CFI = 0.981, TLI = 0.979, RMSEA = 0.071 and SRMR = 0.084. These eight latent dimensions were conceptually grouped into four overarching domains of physical literacy; the four-domain structure was not tested as a higher-order model. Internal consistency and AVE-based evidence of within-dimension convergence varied across dimensions, warranting particular caution for Physical Activity Cognition, Sedentary Behaviour, and Motivation. HTMT results supported the empirical distinctiveness of the eight dimensions in the analysed sample. All 41 items were retained in the current model. Sensitivity analysis indicated that removing Q34, the weakest indicator of Motivation, did not improve global model fit, although modest improvements were observed in reliability and AVE for the Motivation dimension. Importantly, AVE remained below the conventional 0.50 criterion even after Q34 was removed. These findings support retaining the complete item pool for the present validation while also indicating that the adequacy of Q34 and the broader measurement of Motivation requires further evaluation.
The present findings should be interpreted in relation to the version of the CSPLQ used in this study. The Slovenian adaptation was based on the developer-supplied 41-item version recommended for translation, whereas subsequent item analysis in the original Chinese study resulted in the published 38-item version comprising seven dimensions and three overarching domains [21]. The Slovenian CFA model included all 41 items organised into eight correlated dimensions, conceptually grouped into four domains. Differences between the versions include the retention of Q17, Q18, and Q33 and the different assignment of Q27. Thus, the present study evaluated the Slovenian adaptation of the supplied 41-item version rather than directly replicating the published Chinese instrument. Direct comparability of scores and measurement equivalence between the two versions were not established. Linguistic, cultural, educational, or sample-related factors may contribute to differences in item functioning and dimensional organisation, but their contribution cannot be determined from the present study.
4.2. Factor Structure and Model Fit
Exploratory factor analysis examined the clustering of the Slovenian items, while confirmatory factor analysis evaluated the specified eight-factor measurement model. The number of retained factors and the assignment of individual items to those factors should be distinguished: an eight-factor solution does not necessarily establish the precise dimensional organisation specified in the CFA. The exploratory findings therefore need to be considered alongside the theoretical rationale for the model and the complete pattern of item loadings and cross-loadings.
Although the SRMR value slightly exceeded the conventional reference value of 0.08, the remaining fit indices (CFI, TLI, and RMSEA) were more favourable [26]. Contemporary structural equation modelling literature recommends evaluating model fit using multiple complementary indices rather than relying on a single cutoff criterion, particularly when analysing multidimensional questionnaires with ordinal indicators [29]. Taken together, these indices suggest that some model misfit remained, warranting caution in interpreting the final model.
Two residual covariances (Q25–Q26 and Q37–Q38) were introduced during model refinement. Q25 and Q26 both refer to knowledge of WHO recommendations, concerning physical activity and sedentary behaviour, respectively. Q37 and Q38 both express favourable evaluations of physically fit or physically active people. These similarities provide a substantive rationale for shared variance beyond the respective latent factors. However, shared wording and content are possible explanations for the residual associations rather than established causes. No cross-loadings or additional factor paths were specified, but this does not exclude the possibility that alternative model specifications could be appropriate.
4.3. Reliability and Validity of Dimension Scores
The findings indicate that internal consistency was not equally supported across all dimensions. For Motivation, satisfactory internal consistency estimates should be considered alongside its lower AVE and weaker loadings for some items. Reliability coefficients alone do not resolve these limitations of the measurement model. Motor Abilities and Physical Activity Cognition also had AVE values close to, but below, 0.50. Thus, evidence of convergent validity was uneven and was particularly limited for Motivation. This evidence concerns convergence among indicators within the specified dimensions. Convergent validity based on associations with external measures was not examined and remains to be established. The differences between ordinal alpha and omega also highlight the importance of considering multiple coefficients rather than relying on a single estimate of internal consistency. The lower omega estimates for Physical Activity Cognition and Sedentary Behaviour qualify the otherwise favourable ordinal alpha results and warrant caution when interpreting these dimension scores [27,30]. The Physical Activity and Sedentary Behaviour dimensions each comprise only two items. Although the items address related aspects of their respective constructs, their brevity limits content coverage. In particular, phone or computer use does not necessarily involve sitting or lying down, which should be considered when interpreting the Sedentary Behaviour dimension. The reliability estimates and factor loadings of these dimensions should therefore be evaluated alongside their content, and future studies should consider whether additional or revised items would improve their assessment.
The weak factor loading of Q34 warrants caution when interpreting the Motivation dimension. Retaining an item should be supported by both its empirical performance and a clear substantive rationale regarding its contribution to the intended construct. Accordingly, the inclusion of Q34 in the present model should not be interpreted as definitive evidence of its adequacy. Further evaluation is needed to determine whether this item contributes meaningfully to the assessment of motivation or whether revision or removal would be more appropriate. Future studies should further examine the Motivation dimension, particularly items with weaker factor loadings. Depending on these findings, targeted wording refinements or the addition of items could be considered to strengthen the assessment of motivation for physical activity. Any proposed changes would require subsequent psychometric evaluation in an independent sample.
Discriminant validity was examined using HTMT to assess whether the latent dimensions of the questionnaire were empirically distinguishable from one another. All HTMT values remained below the recommended threshold of 0.85, with the highest value observed between Motor Skills and Motor Abilities. Although these constructs were strongly associated, the HTMT results supported their empirical distinction in the analysed sample. Compared with traditional approaches such as the Fornell–Larcker criterion, HTMT has been recognised as a more sensitive method for detecting insufficient discriminant validity in structural equation models [28,31].
4.4. Strengths and Limitations
The present study has several methodological strengths that enhance the credibility of the reported findings. First, this is the first study to translate, culturally adapt, and psychometrically evaluate the 41-item College Student Physical Literacy Questionnaire for use among Slovenian university students, thereby providing a standardized instrument for assessing physical literacy in higher education. Second, the translation process followed internationally accepted recommendations for cross-cultural adaptation and included forward translation, back-translation, expert review, and pilot testing to ensure conceptual and linguistic equivalence [24,25]. Furthermore, the use of independent exploratory and confirmatory samples reduced the risk of sample-specific model optimisation and strengthened the evidence for construct validity. The psychometric evaluation also incorporated analytical procedures appropriate for ordinal questionnaire data, including polychoric correlations, the DWLS estimator, ordinal reliability coefficients, and the HTMT criterion for discriminant validity, reflecting current best-practice recommendations for psychometric validation studies. Collectively, these analytical procedures strengthen confidence in the psychometric properties reported in the present study because they minimise bias associated with treating ordinal Likert-scale responses as continuous variables [32].
Several limitations should be considered when interpreting the findings. First, although the study included students from multiple Slovenian higher education institutions, the sample was obtained using convenience sampling, and the sample may therefore not be fully representative of the entire Slovenian university student population. Second, women accounted for 76.6% of participants. The findings therefore primarily reflect responses from women and should be generalised cautiously to men and to student populations with different sex distributions. Third, all data were collected using a self-report questionnaire, making the results susceptible to response biases, including socially desirable responding and potential inaccuracies in self-perception. Fourth, cross-cultural differential item functioning was not examined. Comparable Chinese participant-level item responses were not available for this analysis. Consequently, the present findings cannot establish whether differences between the Slovenian and Chinese versions reflect cultural or educational influences on item functioning. Fifth, the residual covariances between Q25–Q26 and Q37–Q38 were introduced following inspection of modification indices and item content in the CFA sample. Although these modifications had a substantive rationale, they were informed by the same data used to evaluate the modified model. Replication in an independent sample is therefore needed to assess whether these residual associations and the improved model fit are reproducible. Finally, several measurement properties remain to be established. The absence of repeated measurements prevented an assessment of test–retest reliability, and the internal consistency estimates reported here do not establish the temporal stability of the dimension scores. External convergent validity was not examined using independent measures of physical literacy or related constructs. Objective measures of physical activity and physical fitness, as well as subsequent behavioural or health outcomes, were not collected. Consequently, associations with these objective measures and the predictive validity of CSPLQ scores could not be evaluated. Responsiveness to change also remains to be examined. Measurement invariance across relevant demographic and academic groups was not assessed. Current best-practice guidelines recommend evaluating measurement invariance before comparing latent constructs across groups, as differences in observed scores may otherwise reflect measurement artefacts rather than true differences in the underlying construct [32,33]. In addition, the Physical Activity and Sedentary Behaviour dimensions were each represented by only two items. Although their reliability and AVE estimates were generally acceptable, such brief dimensions provide limited coverage of the underlying constructs and should therefore be interpreted cautiously.
4.5. Directions for Future Research
The broader public health relevance of this work lies in examining how knowledge, motivation, and behaviour relate to opportunities for health education and prevention. Lodi et al. highlighted the potential value of combining lifestyle education with assessments of health-related behaviours and physical indicators in younger populations [5]; in university students, this perspective supports further investigation of how the cognitive and behavioural dimensions assessed by the CSPLQ relate to independently assessed knowledge, activity patterns, and health outcomes.
Future research should examine the temporal stability of the dimension scores by administering the questionnaire to the same participants on two occasions, approximately 2–4 weeks apart, and estimating appropriate intraclass correlation coefficients with confidence intervals. Measurement invariance should also be evaluated across sex, fields of study, study level, and other relevant population subgroups. Establishing the appropriate level of measurement invariance would support comparisons of the assessed dimensions across these groups. Cross-cultural comparisons would additionally require comparable data from the relevant cultural settings. In addition, further studies should examine theoretically expected associations with established measures of physical literacy and related constructs to provide external evidence of convergent validity. Associations with objective indicators of physical activity, physical fitness, body composition, and health-related outcomes could provide complementary validity evidence, recognising the distinction between self-reported attributes and objectively assessed behaviour or performance. Predictive validity could be investigated by examining whether CSPLQ scores predict relevant subsequent behaviours or outcomes. Longitudinal studies would also provide valuable insight into the responsiveness of the questionnaire and its ability to detect changes in physical literacy following educational or behavioural interventions. Future validation studies should aim for more representative samples through stratified random sampling across relevant characteristics, such as sex, institution, and field of study. Where suitable population data are available, post-stratification weighting could also be considered to address imbalances in sample composition, while recognising that weighting alone cannot eliminate selection bias associated with convenience sampling. Studies in other European countries would further strengthen evidence for the generalisability and cross-cultural applicability of the CSPLQ [34].
5. Conclusions
The 41-item Slovenian version of the College Student Physical Literacy Questionnaire provided initial evidence of internal structure and internal consistency, with uneven support across dimensions, for the self-reported assessment of physical literacy among Slovenian university students. Beginning with the initial 41-item version supplied by the questionnaire developers, the Slovenian adaptation retained all items and was evaluated using a multidimensional measurement model comprising eight correlated latent dimensions conceptually grouped into four domains of physical literacy, with limitations in model fit and in the reliability and convergent validity of some dimensions. The rigorous translation, cross-cultural adaptation, and psychometric evaluation process provides a foundation for further investigation of the 41-item Slovenian CSPLQ in higher education settings. The availability of the Slovenian version provides a basis for further research on self-reported physical literacy among university students, while its use for programme evaluation and comparisons across populations requires additional evidence regarding temporal stability, external validity, responsiveness, and measurement invariance.
Supplementary Materials
The following supporting information can be downloaded at https://www.mdpi.com/article/10.3390/ijerph23101286/s1: Table S1: English version of the 41-item College Student Physical Literacy Questionnaire (CSPLQ); Table S2: Standardized factor loadings for the final eight-factor CFA model; Table S3: Slovenian version of the 41-item College Student Physical Literacy Questionnaire (CSPLQ).
Author Contributions
Conceptualization, D.K., J.U. and Č.M.; methodology, D.K., J.U. and Č.M.; software, D.K., J.U. and Č.M.; validation, D.K., J.U. and Č.M.; formal analysis, D.K., J.U. and Č.M.; investigation, D.K., J.U. and Č.M.; resources, D.K. and Č.M.; data curation, D.K. and Č.M.; writing—original draft preparation, D.K. and Č.M.; writing—review and editing, D.K., J.U. and Č.M.; visualization, D.K., J.U. and Č.M.; supervision, D.K. and Č.M.; project administration, D.K. and Č.M.; funding acquisition, D.K. and Č.M. All authors have read and agreed to the published version of the manuscript.
Funding
This research did not receive any specific grant from funding agencies in the public, commercial, or not-for-profit sectors.
Institutional Review Board Statement
The study was conducted in accordance with the Declaration of Helsinki, and applicable national guidelines for research involving human participants, and was approved by the Ethics Committee for Research of the Faculty of Arts, University of Maribor (Approval No. 038-07-258/2026/5/FF/UM, 5 May 2026).
Informed Consent Statement
Informed consent was obtained from all subjects involved in the study. Participants received information about the study before completing the questionnaire and were informed that proceeding with or submitting the questionnaire constituted consent to participate.
Data Availability Statement
The data supporting the findings of this study are available from the corresponding author upon reasonable request, subject to applicable ethical and data-protection requirements. The data are not currently deposited in a public repository.
Acknowledgments
During the preparation of this manuscript, the authors used ChatGPT (OpenAI, GPT-5.5) for the purposes of language editing, improving clarity and readability, refining the structure of selected sections, and supporting the visualization and presentation of the study findings. The authors have reviewed and edited the output and take full responsibility for the content of this publication. All scientific content, data analysis, interpretation of results, and final editorial decisions were performed and verified by the authors.
Conflicts of Interest
The authors declare no conflicts of interest. The funders had no role in the design of the study; in the collection, analyses, or interpretation of data; in the writing of the manuscript; or in the decision to publish the results.
Abbreviations
The following abbreviations are used in this manuscript:
| AVE | Average Variance Extracted |
| CFA | Confirmatory Factor Analysis |
| CFI | Comparative Fit Index |
| CSPLQ | College Student Physical Literacy Questionnaire |
| DWLS | Diagonally Weighted Least Squares |
| EFA | Exploratory Factor Analysis |
| HTMT | Heterotrait–Monotrait Ratio of Correlations |
| KMO | Kaiser–Meyer–Olkin Measure of Sampling Adequacy |
| RMSEA | Root Mean Square Error of Approximation |
| SRMR | Standardized Root Mean Square Residual |
| TLI | Tucker–Lewis Index |
References
- Whitehead, M. Physical Literacy: Throughout the Lifecourse; Routledge: London, UK, 2010. [Google Scholar]
- Edwards, L.C.; Bryant, A.S.; Keegan, R.J.; Morgan, K.; Jones, A.M. Definitions, Foundations and Associations of Physical Literacy: A Systematic Review. Sports Med. 2017, 47, 113–126. [Google Scholar] [CrossRef] [Scilit] [PubMed]
- Cairney, J.; Dudley, D.; Kwan, M.; Bulten, R.; Kriellaars, D. Physical literacy, physical activity and health: Toward an evidence-informed conceptual model. Sports Med. 2019, 49, 371–383. [Google Scholar] [CrossRef] [Scilit] [PubMed]
- Öztürk, Ö.; Aydoğdu, O.; Kutlutürk Yıkılmaz, S.; Feyzioğlu, Ö.; Pişirici, P. Physical literacy as a determinant of physical activity level among late adolescents. PLoS ONE 2023, 18, e0285032. [Google Scholar] [CrossRef] [Scilit] [PubMed]
- Lodi, E.; Poli, M.L.; Paoloni, E.; Lodi, G.; Savino, G.; Tampieri, F.; Modena, M.G. Anthropometric Indicators and Early Cardiovascular Prevention in Children and Adolescents: The Role of Education and Lifestyle. J. Cardiovasc. Dev. Dis. 2026, 13, 57. [Google Scholar] [CrossRef] [Scilit] [PubMed]
- Santos Souza, M.F.; Jerónimo, F.; Franco, S.; Veiga Carraça, E.C.; Nunes da Silva, M. Physical Literacy Dimensions in University Students and their Relations with Present and Past Physical Activity: An Exploratory, Observational Study. Retos Nuevas Perspect. Educ. Física Deporte Recreación 2022, 45, 524–537. [Google Scholar] [CrossRef] [Scilit]
- Matejek, Č.; Kukovica, D.; Vršnik Perše, T. Physical literacy across years of study: Evidence from Slovenian higher education. Front. Sports Act. Living 2026, 8, 1922726. [Google Scholar] [CrossRef] [Scilit] [PubMed]
- Matejek, Č.; Kukovica, D.; Štirn Janota, P.; Vršnik Perše, T. Healthy Lifestyle and Educational Practices in Relation to Student Wellbeing; Waxmann: Münster, Germany, 2026. [Google Scholar] [CrossRef] [Scilit]
- Kwan, M.Y.; Graham, J.D.; Healey, C.; Paolucci, N.; Brown, D.M. Stopping the drop: Examining the impact of a pilot physical literacy-based intervention program on physical activity behaviours and fitness during the transition into university. Int. J. Environ. Res. Public Health 2020, 17, 5832. [Google Scholar] [CrossRef] [Scilit] [PubMed]
- Gao, T.Y.; Huang, F.H.; Liu, T.; Sum, R.K.W.; De Liu, J.; Tang, D.; Cai, D.Y.; Jiang, Z.K.; Ma, R.S. The role of physical literacy and mindfulness on health-related quality of life among college students during the COVID-19 pandemic. Sci. Rep. 2024, 14, 237. [Google Scholar] [CrossRef] [Scilit] [PubMed]
- Liu, Y.; Liu, S.; Sum, R.; Duncan, M.; Gu, Y.; Li, M. Associations between levels of physical literacy and adherence to the 24-h movement guidelines among university students: A cross-sectional study. J. Exerc. Sci. Fit. 2024, 22, 221–226. [Google Scholar] [CrossRef] [Scilit] [PubMed]
- Leung, W.K.C.; Sum, R.K.W.; Lam, S.C. Relationships between perceived physical literacy and mental health in tertiary education students: A scoping review. BMC Public Health 2025, 25, 117. [Google Scholar] [CrossRef] [Scilit] [PubMed]
- Jean de Dieu, H.; Zhou, K. Physical literacy assessment tools: A systematic literature review for why, what, who, and how. Int. J. Environ. Res. Public Health 2021, 18, 7954. [Google Scholar] [CrossRef] [Scilit] [PubMed]
- Barnett, L.M.; Jerebine, A.; Keegan, R.; Watson-Mackie, K.; Arundell, L.; Ridgers, N.D.; Salmon, J.; Dudley, D. Validity, reliability, and feasibility of physical literacy assessments designed for school children: A systematic review. Sports Med. 2023, 53, 1905–1929. [Google Scholar] [CrossRef] [Scilit] [PubMed]
- Boldovskaia, A.; Dias, N.M.G.; Silva, M.N.; Carraça, E.V. Physical literacy assessment in adults: A systematic review. PLoS ONE 2023, 18, e0288541. [Google Scholar] [CrossRef] [Scilit] [PubMed]
- Edwards, L.C.; Bryant, A.S.; Keegan, R.J.; Morgan, K.; Cooper, S.-M.; Jones, A.M. ‘Measuring’physical literacy and related constructs: A systematic review of empirical findings. Sports Med. 2018, 48, 659–682. [Google Scholar] [CrossRef] [Scilit] [PubMed]
- Hu, R.; Wang, W. A structural model of perceived physical literacy of educational/sports college students based on PPLI. Sci. Rep. 2025, 16, 2955. [Google Scholar] [CrossRef] [Scilit] [PubMed]
- Vašíčková, J.; Cuberek, R.; Pernicová, H. Reliabilita Dotazníku sebehodnocení pohybové gramotnosti u vysokoškolské populace. Phys. Cult./Tělesná Kult. 2020, 43, 6. [Google Scholar] [CrossRef] [Scilit]
- Ryom, K.; Hargaard, A.-S.; Melby, P.S.; Maindal, H.T.; Bentsen, P.; Ntoumanis, N.; Schoeppe, S.; Nielsen, G.; Elsborg, P. Self-reported measurements of physical literacy in adults: A scoping review. BMJ Open 2022, 12, e058351. [Google Scholar] [CrossRef] [Scilit] [PubMed]
- Matejek, Č.; Kukovica, D. Promoting Physical Literacy Through Experiential Education: A Quantitative Study of Prospective Teachers. In Experiential Education for Primary Students: Excelling Beyond Classroom Boundaries; Jančič Hegediš, P., Hus, V., Eds.; IGI Global Scientific Publishing: Hershey, PA, USA, 2026; pp. 31–54. [Google Scholar] [CrossRef] [Scilit]
- Luo, L.; Song, N.; Huang, J.; Zou, X.; Yuan, J.; Li, C.; Yang, J.; Zhou, L.; Zhang, L.; Luo, S.; et al. Validity evaluation of the college student physical literacy questionnaire. Front. Public Health 2022, 10, 856659. [Google Scholar] [CrossRef] [Scilit] [PubMed]
- Naylor, A.; Flood, A.; Barnett, L.M.; Keegan, R. Development of the physical literacy in adults scale (PLAS). J. Sports Sci. 2024, 42, 1099–1111. [Google Scholar] [CrossRef] [Scilit] [PubMed]
- Boldovskaia, A.; Teixeira, D.S.; Silva, M.N.; Carraça, E.V. Validation of the Portuguese version of the perceived physical literacy instrument. J. Phys. Act. Health 2024, 21, 341–349. [Google Scholar] [CrossRef] [Scilit] [PubMed]
- Beaton, D.E.; Bombardier, C.; Guillemin, F.; Ferraz, M.B. Guidelines for the process of cross-cultural adaptation of self-report measures. Spine 2000, 25, 3186–3191. [Google Scholar] [CrossRef] [Scilit] [PubMed]
- Wild, D.; Grove, A.; Martin, M.; Eremenco, S.; McElroy, S.; Verjee-Lorenz, A.; Erikson, P. ISPOR Task Force for Translation and Cultural Adaptation. Principles of good practice for the translation and cultural adaptation process for patient-reported outcomes (PRO) measures: Report of the ISPOR Task Force for Translation and Cultural Adaptation. Value Health 2005, 8, 94–104. [Google Scholar] [CrossRef] [Scilit] [PubMed]
- Hu, L.T.; Bentler, P.M. Cutoff criteria for fit indexes in covariance structure analysis: Conventional criteria versus new alternatives. Struct. Equ. Model. A Multidiscip. J. 2009, 6, 1–55. [Google Scholar] [CrossRef] [Scilit]
- McNeish, D. Thanks coefficient alpha, we’ll take it from here. Psychol. Methods 2018, 23, 412–433. [Google Scholar] [CrossRef] [Scilit] [PubMed]
- Henseler, J.; Ringle, C.M.; Sarstedt, M. A new criterion for assessing discriminant validity in variance-based structural equation modeling. J. Acad. Mark. Sci. 2015, 43, 115–135. [Google Scholar] [CrossRef] [Scilit]
- Holler, P.; Carl, J.; van Poppel, M.N.; Jaunig, J. Development of the Perceived Physical Literacy Questionnaire (PPLQ) for the adult population. J. Exerc. Sci. Fit. 2023, 21, 424–433. [Google Scholar] [CrossRef] [Scilit] [PubMed]
- Barbaranelli, C.; Lee, C.S.; Vellone, E.; Riegel, B. The problem with Cronbach’s alpha: Comment on Sijtsma and van der Ark (2015). Nurs. Res. 2015, 64, 140. [Google Scholar] [CrossRef] [Scilit] [PubMed]
- Qu, Z.; Wu, J.; Kueh, Y.C.; Ye, D.; Kuan, G. Psychometric properties of the Chinese version physical literacy assessment questionnaire among high school students in Gansu, China. PeerJ 2025, 13, e19093. [Google Scholar] [CrossRef] [Scilit] [PubMed]
- Stefana, A.; Damiani, S.; Granziol, U.; Provenzani, U.; Solmi, M.; Youngstrom, E.A.; Fusar-Poli, P. Psychological, psychiatric, and behavioral sciences measurement scales: Best practice guidelines for their development and validation. Front. Psychol. 2025, 15, 1494261. [Google Scholar] [CrossRef] [Scilit] [PubMed]
- Vandenberg, R.J.; Lance, C.E. A review and synthesis of the measurement invariance literature: Suggestions, practices, and recommendations for organizational research. Organ. Res. Methods 2000, 3, 4–70. [Google Scholar] [CrossRef] [Scilit]
- Putnick, D.L.; Bornstein, M.H. Measurement invariance conventions and reporting: The state of the art and future directions for psychological research. Dev. Rev. 2016, 41, 71–90. [Google Scholar] [CrossRef] [Scilit] [PubMed]

Disclaimer/Publisher’s Note: The statements, opinions and data contained in all publications are solely those of the individual author(s) and contributor(s) and not of MDPI and/or the editor(s). MDPI and/or the editor(s) disclaim responsibility for any injury to people or property resulting from any ideas, methods, instructions or products referred to in the content. |
© 2026 by the authors. Licensee MDPI, Basel, Switzerland. This article is an open access article distributed under the terms and conditions of the Creative Commons Attribution (CC BY) license.