


Abstract
Postoperative neurocognitive disorder is a common complication that primarily affects senile patients and is associated with increased morbidity/mortality after surgery. Systematic reviews and meta-analyses of the associated risk factors, including types of surgery and anesthesia, baseline status before surgery, and biomarkers of cognitive function, have led to ambiguous conclusions, which complicate the understanding of pathogenesis and limit the strategies for the prevention/treatment of this condition. In this study, a panel of 12 preoperative cerebrospinal fluid protein markers that displayed high predictive accuracy of postoperative delirium was revealed by a LASSO logistic regression analysis of the proteomic data from 24 matched pairs of patients. Functional enrichment analysis revealed significant enrichment in immune regulation in these proteins. Further expression analysis displayed a sustained differential expression of some of these genes up to one month after surgery in the brains of mice with postoperative neurocognitive disorder, suggesting potential prognostic roles for these biomarkers. Given the well-recognized anti-inflammatory and immunomodulatory functions of fucoidan, the potential influence of the perioperative administration of fucoidan on immune-related gene expression was investigated in mouse brains and PBMCs using quantitative PCR and RNA-seq, respectively. Our results showed that perioperative administration of fucoidan partially restored the gene expression pattern of the immune-related gene signatures in mouse PBMCs as well as in mouse brains.
1. Introduction
Cognitive dysfunction associated with anesthesia and surgery is a common complication that predominantly affects elderly patients. According to the recommendations of a nomenclature consensus group, perioperative neurocognitive disorders should be classified into the following categories: preexisting neurocognitive disorder (NCD), referring to baseline cognitive impairment; postoperative delirium (POD), referring to delirium during the acute (within 7 days) postoperative period, when other specific causes can be excluded; and delayed neurocognitive recovery and postoperative NCD (PND), referring to any objectively measurable cognitive decline up to 30 days and 12 months after anesthesia/surgery, respectively [1]. Surgical insults result in peripheral inflammatory responses. Microglial cells in the central nervous system (CNS) are primed by infiltrating peripheral inflammatory factors and immune cells through a disrupted blood–brain barrier to induce neuroinflammation, which is believed to be the primary pathological alteration underlying postoperative neural dysfunction [2]. Sustained neuroinflammation resulted in impaired synaptic plasticity, a reduced expression of neurotrophins and an inhibition of neural regeneration, along with other pathological changes [3]. However, whether neuroinflammation is a causative or an associated change in the pathogenesis of POD/PND remains poorly understood.
Despite the well-known risk factors, including advanced age and pre-existing complications, an increasing need for objective parameters that can provide precise diagnosis and prediction has propelled rigorous research on the potential biomarkers for perioperative neurocognitive disorders [4,5,6]. Following surgery-induced systemic inflammation and CNS injury, the levels of these biomarkers change in the bloodstream and cerebrospinal fluid (CSF) due to altered local expression and secretion in the CNS, as well as the destruction of neural cells and the BBB [7]. These biomarkers are either brain-derived or inflammation-related factors; nevertheless, no biomarkers found so far have displayed specificity for postoperative NCD [8,9,10]. For instance, elevated serum levels of S100B and neuron-specific enolase [11] (NSE) have been found in patients after cardiac surgery and in patients with acute ischemic stroke [11,12]. Reduced preoperative Aβ42 and a decreased Aβ42/Tau ratio in CSF, biomarkers routinely used for Alzheimer’s disease diagnosis, were observed in patients who subsequently developed cognitive impairment after elective total hip or knee replacement surgery [13,14]. Therefore, the identification of specific biomarkers and/or a panel of biomarkers that can aid the early diagnosis and prediction of postoperative NCD is of particular interest, given that the heterogeneity in the composition of neuropsychological tests, cut-off values and timing of assessment has long hampered diagnosis and pathogenic studies of this condition.
A nested case–control proteomic analysis of preoperative CSF from 24 matched POD and non-POD individuals revealed that 32 proteins with significant differences in preoperative CSF were associated with the development of POD [15]. In this study, the expression data of these 32 proteins were extracted and analyzed by univariate logistic regression and least absolute shrinkage and selection operator (LASSO) logistic regression. As a result, a group of 12 gene signatures enriched in immune-related and stress-related functions was identified as a robust POD-related protein signature with a high predictive accuracy (AUC of 96.7%). To assess whether these predictors could be causative “risk factors”, the expression of genes encoding these proteins was analyzed in the transcriptome of the hippocampus of mice that displayed cognitive impairment at consecutive time points after surgery. The potential functional significance was further investigated using quantitative PCR and immunohistology in our mouse models of PND. Compared with those in the brains of mice without PND, sustained upregulation in Mica, Thpo, Cxcl11, and Ccl2 but downregulation in Ccl28 were still observed in the brains of mice with PND at 30 days after surgery. Given the well-recognized anti-inflammatory and immunomodulatory effect of fucoidan, the influence of perioperative administration of fucoidan on the expression of these genes was evaluated using RNA-seq and quantitative PCR, respectively. Our results showed that fucoidan supplementation partially restored the expression pattern of these genes in PBMCs as well as in mouse brains before and after surgery.
2. Results
2.1. POD-Related Protein Signature Representing Two Key Modules in Preoperative CSF Biomarker Displayed High Performance in Risk Assessments
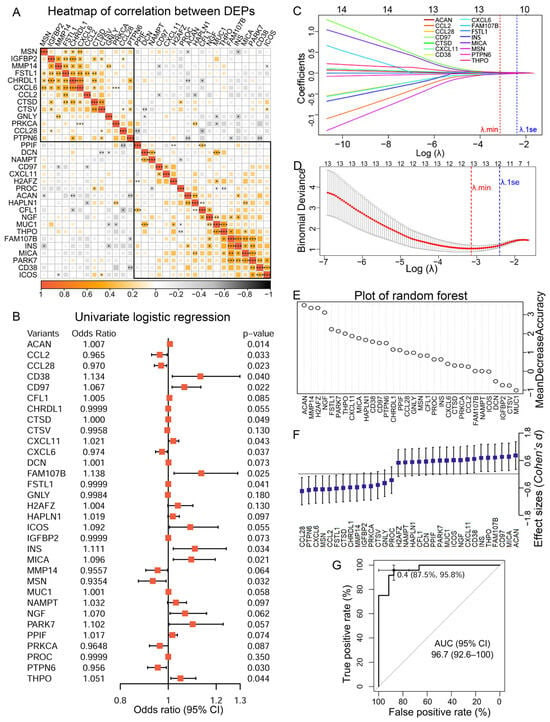
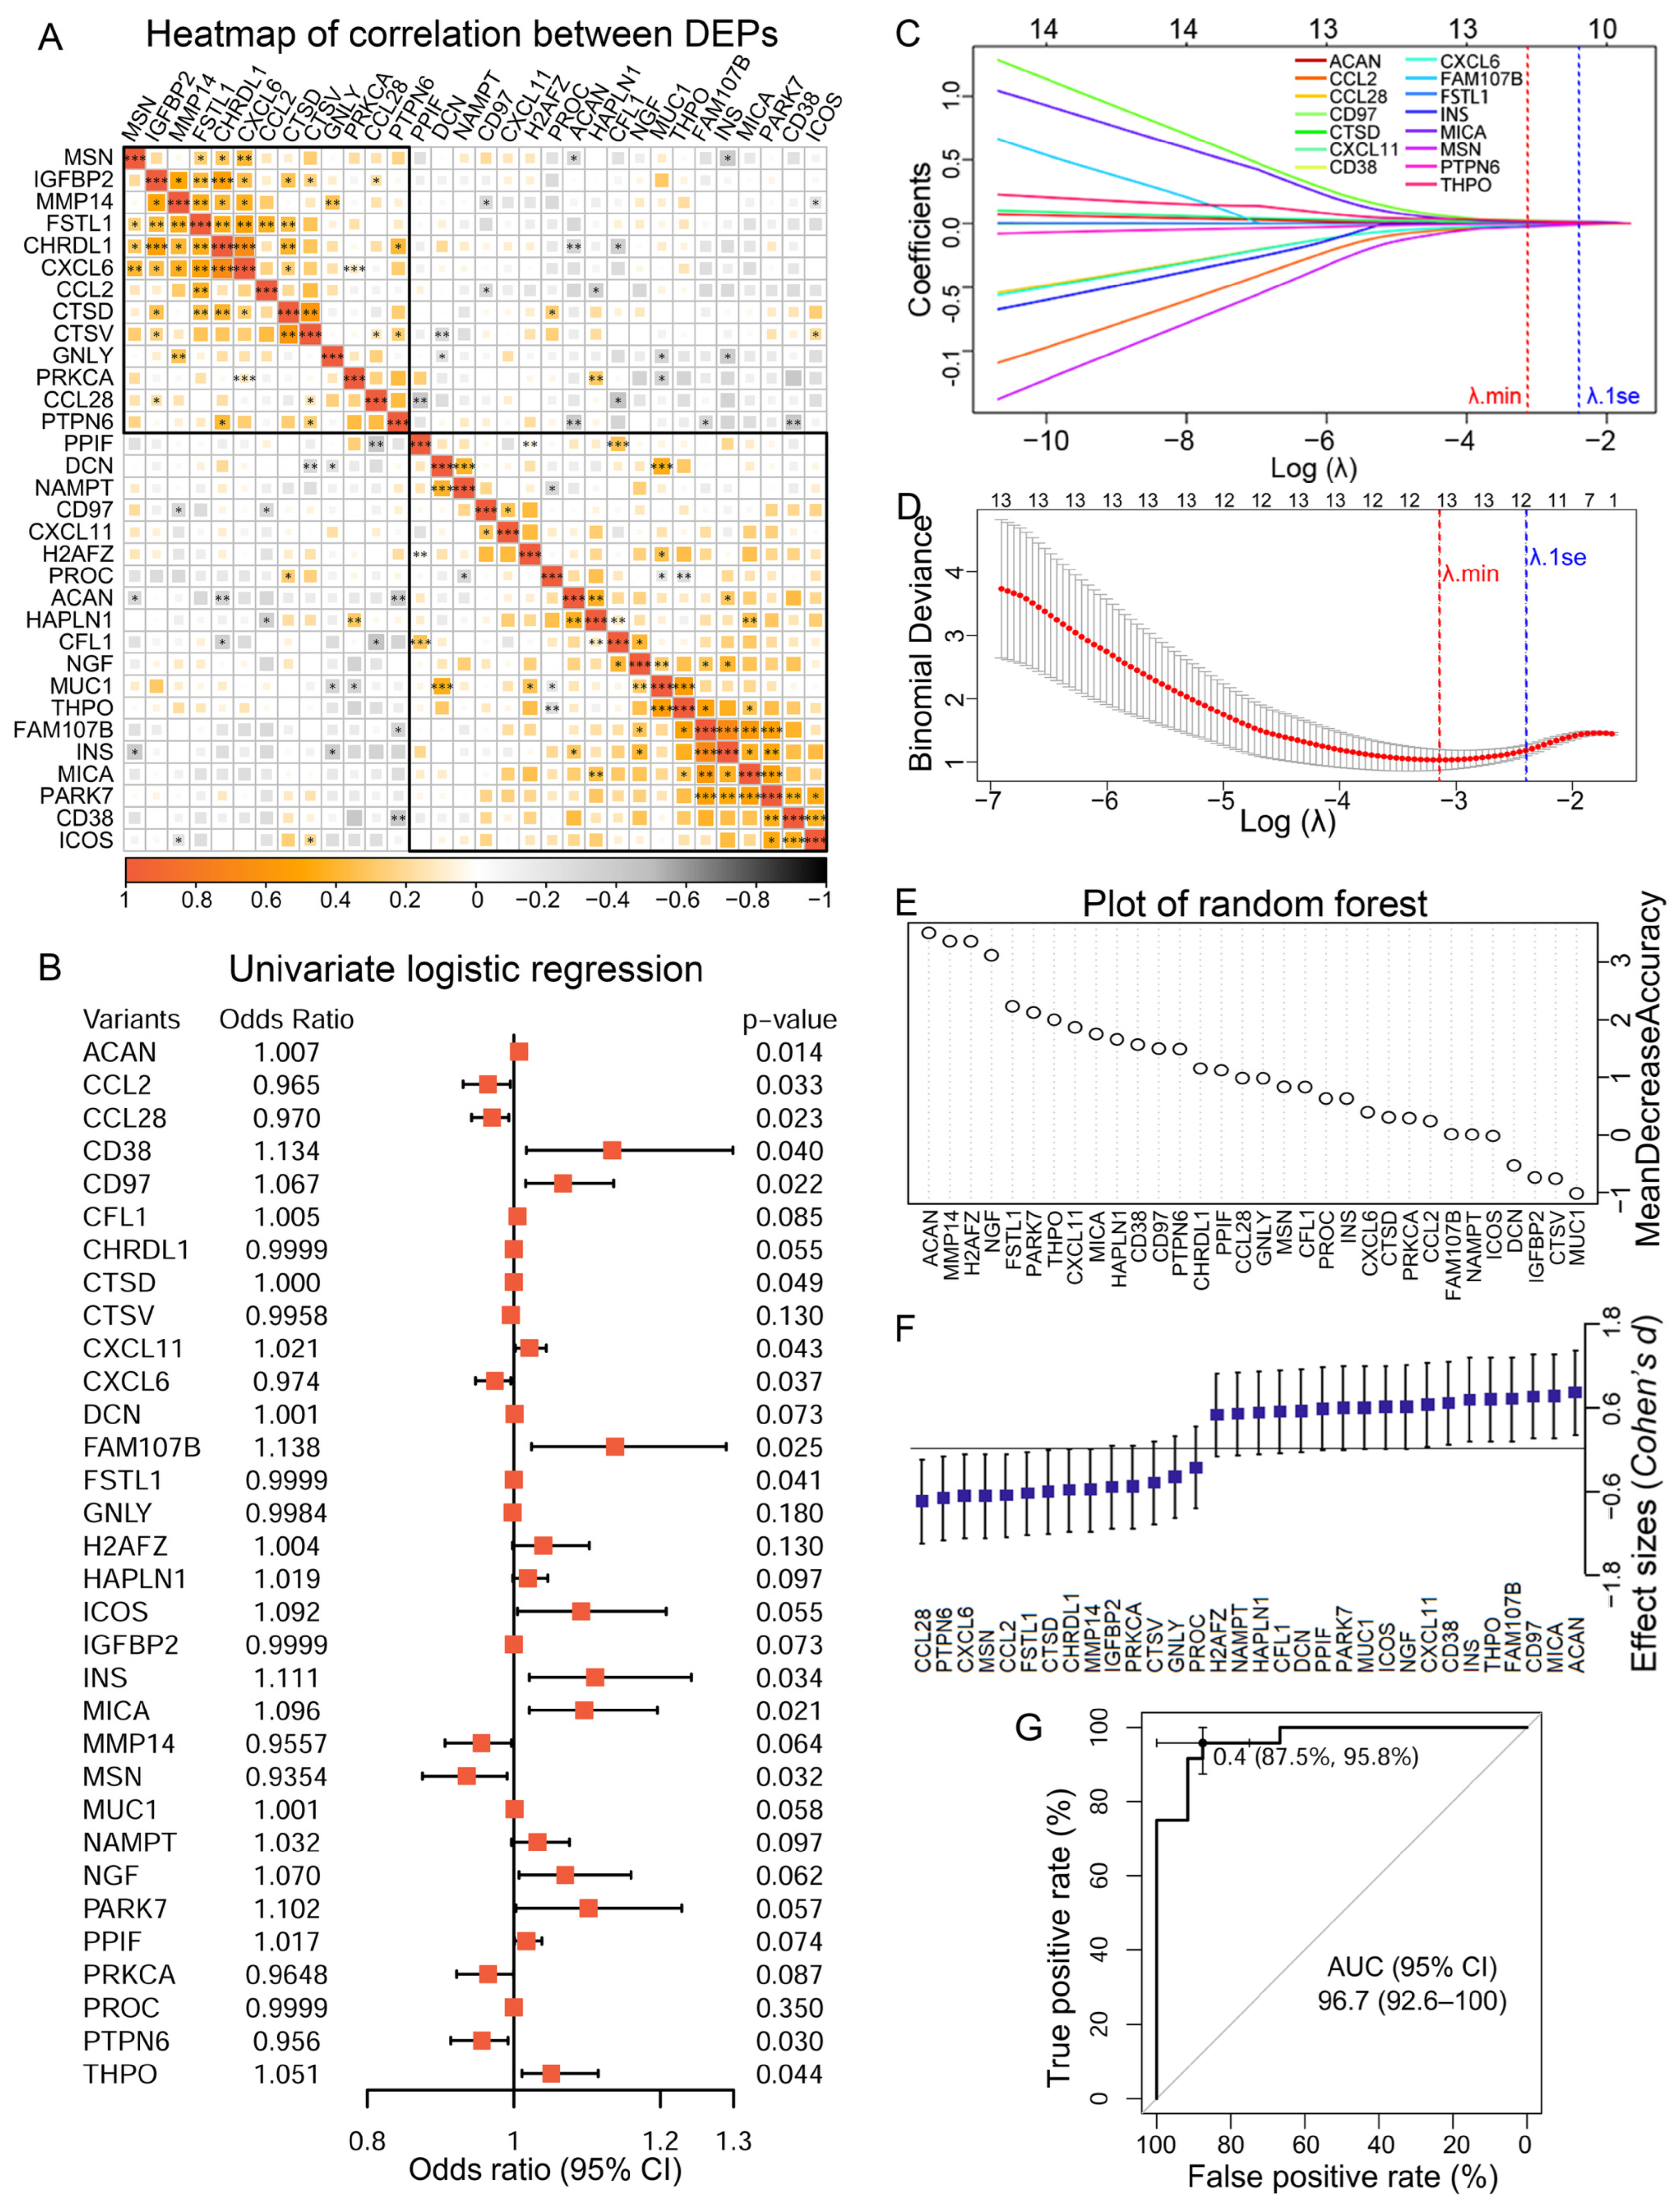
Apartment-based affinity Soma-Scan proteomics analysis revealed 32 differentially expressed proteins (DEPs) in the preoperative CSF of 24 matched -pair patients diagnosed with or without delirium on postoperative day 1–3 in a previous study [15]. The selection criteria and patient-related information were described in the original article [15]. Pearson’s correlation analysis of the measurements of the 32 DEPs revealed two clusters of correlated proteins that were enriched in immune response and oxidative stress, respectively (Figure 1A, Supplementary Table S1). Fifteen POD-related DEPs were selected using the cut-off value of p < 0.05 in univariate logistic regression, implicating the independent predictive abilities of these factors (Figure 1B). Among them, 12 DEPs, assigned to either immune-related (MSN, CXCL6, CCL2, CTSD, CCL28, and PTPN6) or stress-related modules (CXCL11, ACAN, THPO, FAM107B, CD97, and MICA), were identified as the most robust predictive protein markers using LASSO at lamda.min, and the corresponding coefficients were presented (Figure 1C,D). The odds ratios and the 95% confidence intervals (CI) for each of the 12 markers were calculated to estimate the precision of the predictive values (Supplementary Table S2). The variable importance of each of these potential predictive DEPs and their effect sizes were also evaluated using random forest. All 12 protein markers yielded positive values in the permutation-based analysis of mean decreased accuracy and had effect sizes greater than 0.6 (Figure 1E,F). Therefore, these 12 POD-related DEPs in preoperative CSF were included in our final panel, and the predictive performance was estimated using ROC analysis. The area under the curve (AUC) was 96.7% (95% CI: 92.6–100%), demonstrating high predictive accuracy (Figure 1G).
Figure 1.
A POD-related protein signature in preoperative CSF identified using LASSO regression. (A) Correlation matrix showing two gene modules (boxed in black wire frames) defined by gene-to-gene expression correlation analysis of the 32 DEPs. Statistical analyses were performed using Pearson correlation analysis (* p < 0.05, ** p < 0.01, *** p < 0.001). (B) Univariate logistic regression analysis of 32 DEPs to identified genes associated with POD. (C) LASSO coefficient profiles of 15 genes selected by univariate logistic regression analysis. (D) Variable selection in LASSO regression with λmin (minimum cross-validated error). (E) Plot of random forest variable importance based on mean decrease accuracy. (F) Forest plot of Cohen’s effect sizes. (G) ROC curve of the module for predicting POD constructed by 12 DEPs.
2.2. The Prognostic Role of the CSF Predictive Protein Markers
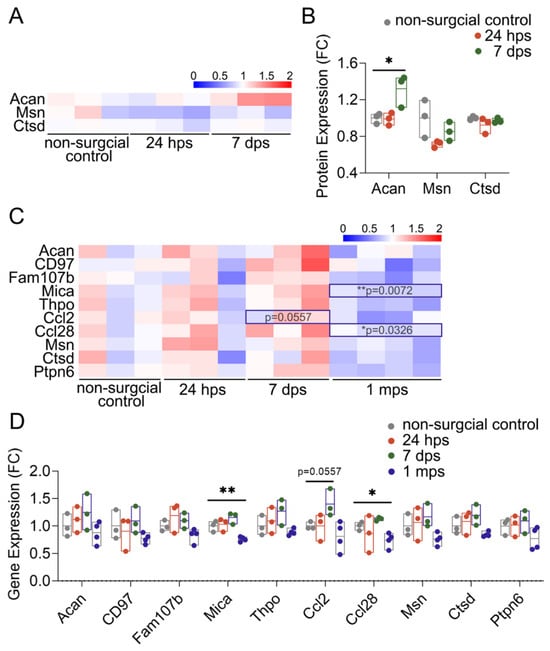
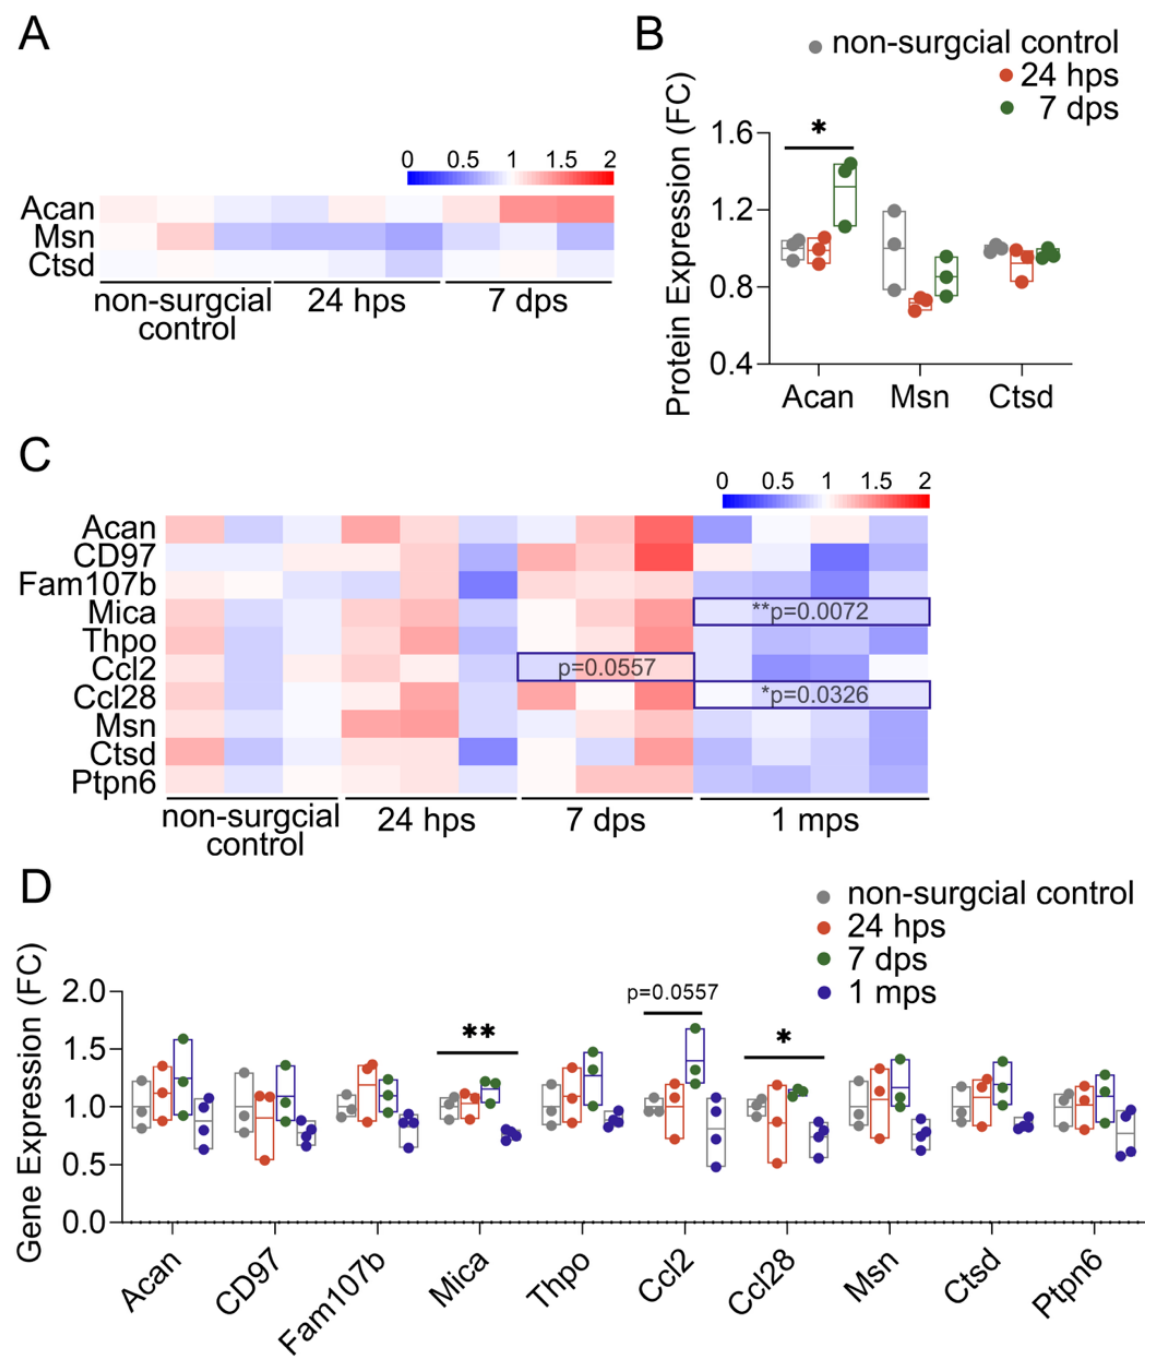
We proposed that these predictive protein factors were likely to have potential prognostic roles for PND, given that the expression levels of CXCL6, CXCL11, CCL2 and CCL28 were found to differ significantly between preoperative and postoperative CSF samples at various time points in a previous study by Danielson et al. [16]. We first revisited the transcriptome and proteome datasets from the hippocampus of the mice that were identified as developing cognitive impairment at different time points after laparotomy in our previous study [17]. Acan, Msn, and Ctsd were identified in the proteome. Compared with the expression in mouse hippocampus before laparotomy, the expression of Acan was significantly increased in the hippocampus of mice that displayed postoperative cognitive impairment at the indicated time points after surgery (Figure 2A,B). Although not statistically significant, the same trend of alteration was also displayed in the expression of Msn and Ctsd in the hippocampus of POCD mice after surgery. The expression of 10 out of the 11 predictive protein markers was identified in the transcriptome of mouse hippocampus. The expressions of Ccl2, Ccl28, and Mica were significantly altered at least at one time point after surgery (Figure 2C,D). These results strongly indicated potential prognostic roles of altered expression of these gene expressions in the pathogenesis of postoperative neurocognitive disorders.
Figure 2.
Time-series change in expression of the biomarkers in the transcriptome and proteome of the CNS of mice with neurocognitive impairment after surgery. (A) Heatmap showing color-coded fold change in the proteins identified in the proteome of PND mouse brains. (B) Significantly increased Acan expression and a trend of decreased expression of Msn in PND mouse brains. (C) Heatmap showing color-coded fold changes in RNA expression of genes encoding the biomarker in the transcriptome of PND mouse brains. (D) Significantly upregulated Ccl2 and downregulated Mica and Ccl28 at least at one postoperative time point in the CNS of PND mouse brains. * p < 0.05, ** p < 0.01. hps (hours post-surgery), dps (days post-surgery), mps (months post-surgery).
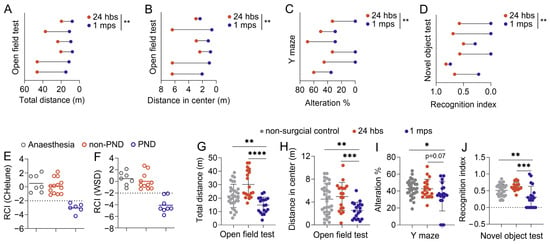
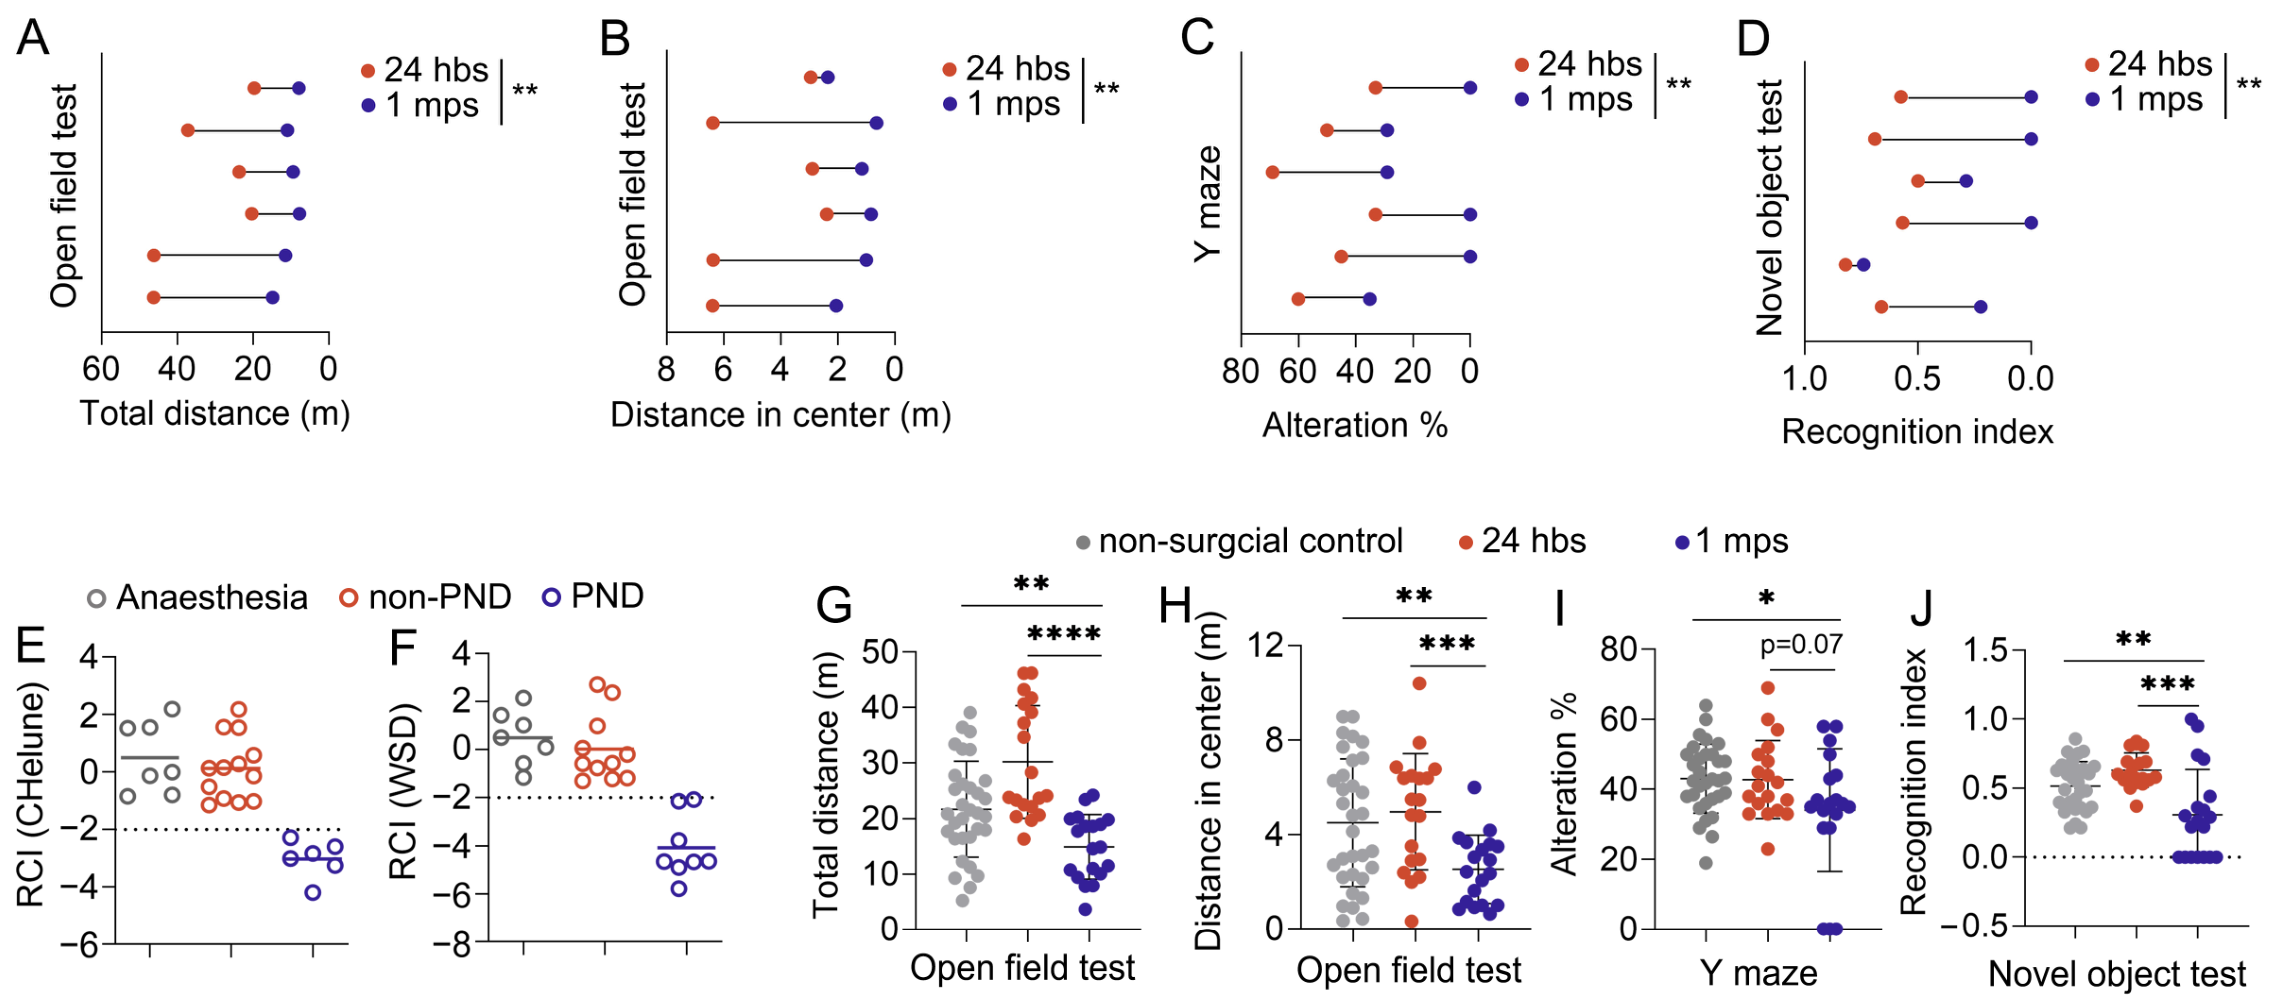
We further performed laparotomy in 19 wild-type C57BL/6J mice and identified 6 mice with cognitive impairment at one month after surgery using a test battery consisting of the open field test, the novel object recognition test, and a modified Y maze (as described in our previous publication) [17]. By calculating the reliable change index (RCI) using the standard errors of the results of the control non-surgery mice to control for errors associated with repeated behavioral assessments and within-subject standard deviation, the same six individual mice were identified as having cognitive decline at one month after surgery using RCIChelune and RCIWSD, respectively (Figure 3A–F). Compared with that of the control non-surgery mice, significantly reduced pre- to postoperative performance in behavioral tests, including reduced distance traveled in the center area in the OFT, spontaneous alternations, and discrimination indices, was observed in mice that underwent laparotomy (Figure 3G–J).
Figure 3.
Mice recognized with postoperative NCD at one month after laparotomy using combined Z score of RCIs. (A) Pre- and post-operative total travel distance in OFT of each individual PND mouse. (B) Pre- and post-operative travel distance in the center zone in OFT of each individual PND mouse. (C) Pre- and post-operative alternations in Y maze of each individual PND mouse. (D) Pre- and post-operative RI in NOR test of each individual PND mouse. (E,F) RCIs calculated using two different methods for all the mice tested. (G,H) Open field test of non-surgical control mice as well as mice 24 h before surgery and at 1 month after surgery, showing total distance (G) and distance traveled in center zone (H) of each mouse. (I) Percentage of alternations in Y maze test of non-surgical control mice as well as mice 24 h before surgery and at 1 month after surgery. (J) Recognition index of novel object test in non-surgical control mice as well as mice 24 h before surgery and at 1 month after surgery. (* p < 0.05, ** p < 0.01, *** p < 0.001, **** p < 0.0001).
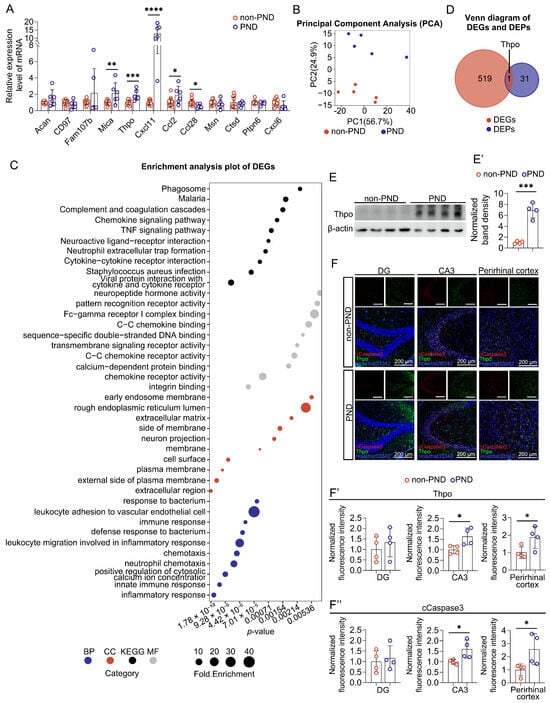
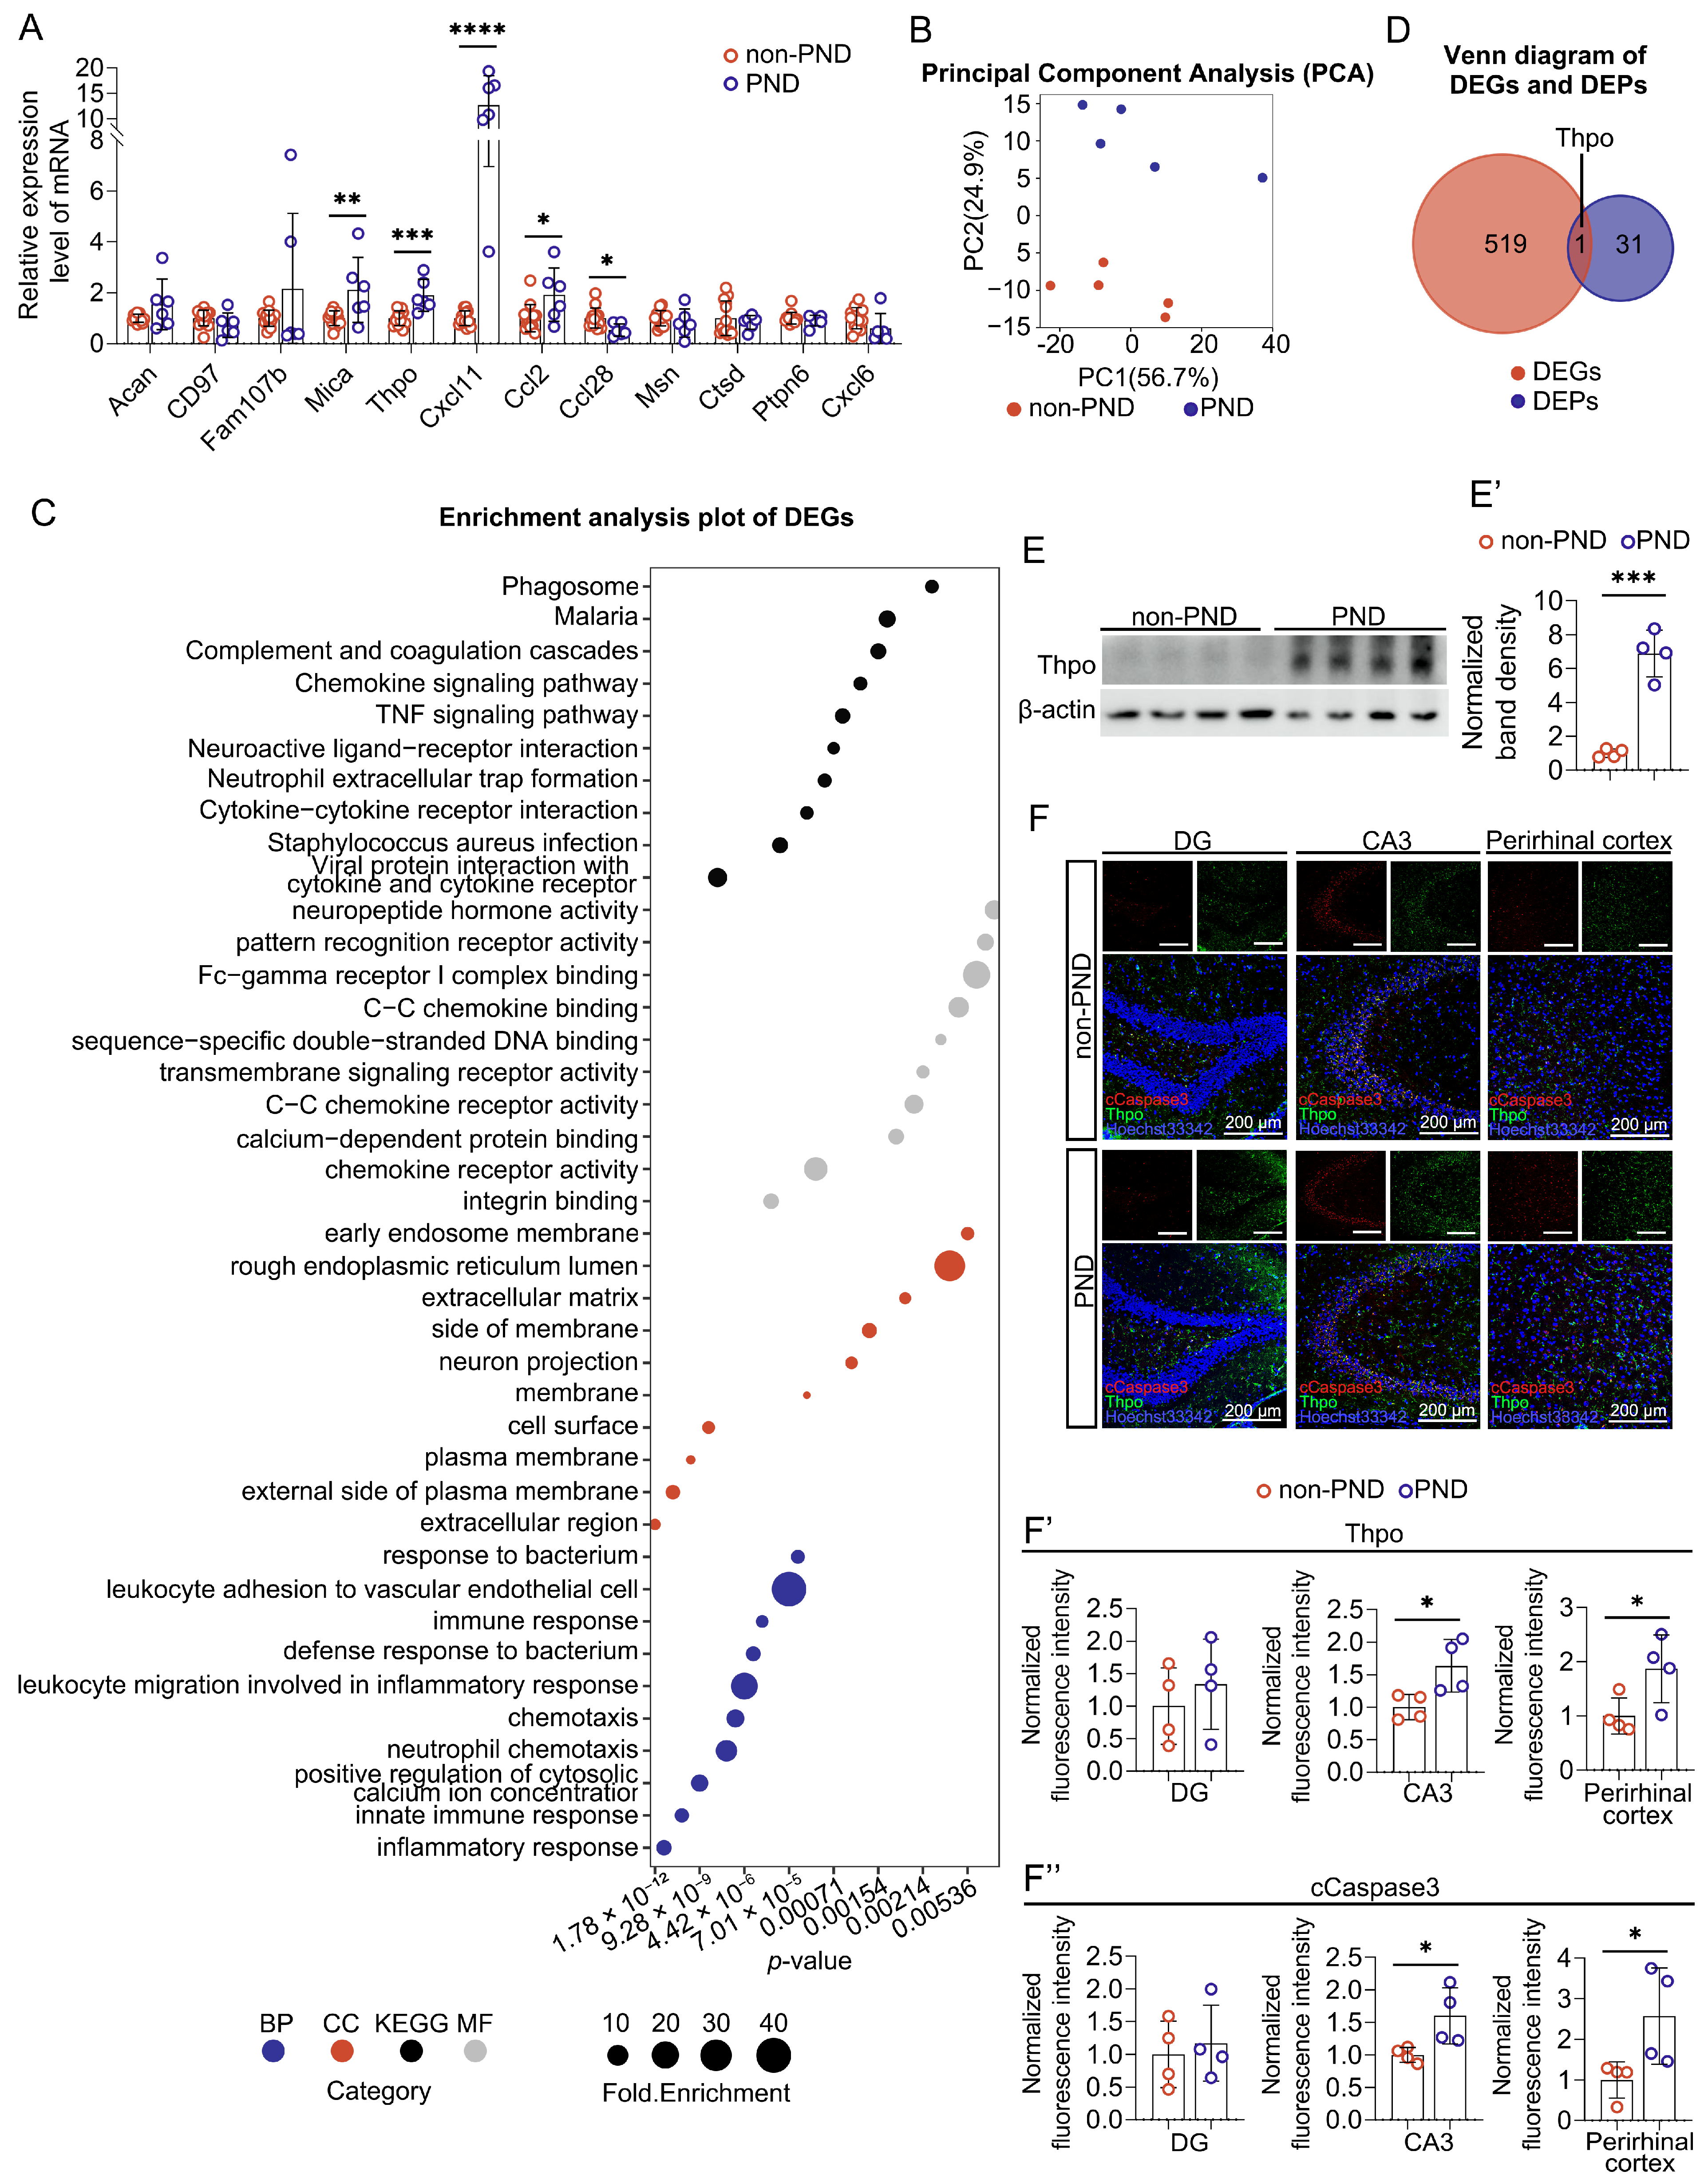
The expression of the genes encoding the 12 protein markers was further evaluated in the mouse brains using quantitative PCR (Figure 4A). Significantly increased expression of Mica, Thpo, Cxcl11, and Ccl2, whereas significantly decreased expression of Ccl28 were observed in the brains of mice that developed postoperative NCD, compared with those of the mice without PND. Subsequent RNA-seq analysis revealed differences in the global gene expression profile in the brains of PND and non-PND mice, manifested by separation of samples along the 2nd principal axis (Figure 4B). Functional and pathway enrichment analysis of the differentially expressed genes (|log2FC|, p < 0.05) identified enriched terms related to immune regulation, and Thpo was recognized as the only gene persistently upregulated in PND mouse brains at POD 30 (Figure 4C,D, Table S3). Thpo, highly expressed in hematopoietic tissues, has also been found to be expressed in the neurons and to exert pro-apoptotic effects [18]. The expression of Thpo was verified using immunohistochemistry as well as Western blot analysis. Significantly upregulated expression of Thpo was found in PND mouse brains (Figure 4E,E′) (the original Western blot images for Figure 4E are shown in Supplementary Figure S1). The results of immunohistochemical analysis further demonstrated a trend of increasing Thpo and cleaved caspase-3 in the DG regions and significant upregulation of Thpo and cleaved caspase-3 in the CA3 regions of the PND mouse hippocampus as well as in the adjacent perirhinal cortex (Figure 4F–F″). In addition, immunofluorescence scanning images of mouse hemispheres showed an overall elevation of Thpo and caspase-3 in the brains of mice with PND, compared with those in the brains of mice without PND (Supplementary Figure S2).
Figure 4.
The expression analysis of the POD-related biomarkers in the brains of mice with PND. (A) Quantitative PCR analysis of the expression of genes encoding the 12 biomarkers in mouse brains. (B) PCA plots for the transcriptome datasets (GSE339210) from mouse brains at POD 30. (C) Enriched GO and KEGG terms for DEGs with |fold change| > 1.5. Dot size indicates fold enrichment, and dot colors indicate ontologies. (D) Venn analysis of DEGs from the mouse brains at POD 30 and DEPs in GSE242736. Western blot analysis (E) and densitometry analysis (E′) showing significantly increased Thpo in the brains of mice with PND. (F–F′′) Immunohistochemical analysis showing increased expression of Thpo and cleaved caspase3 in the CA3, DG and perirhinal cortex regions of PND mice. Scale bar = 200 μm. * p < 0.05, ** p < 0.01, *** p < 0.001, **** p < 0.0001.
2.3. Perioperative Administration of Fucoidan Restored the Pattern of Expression of the Immune-Related Gene Signature in Mouse Brains and PBMCs
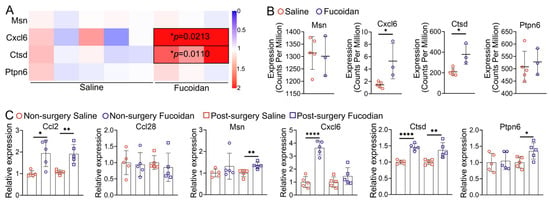
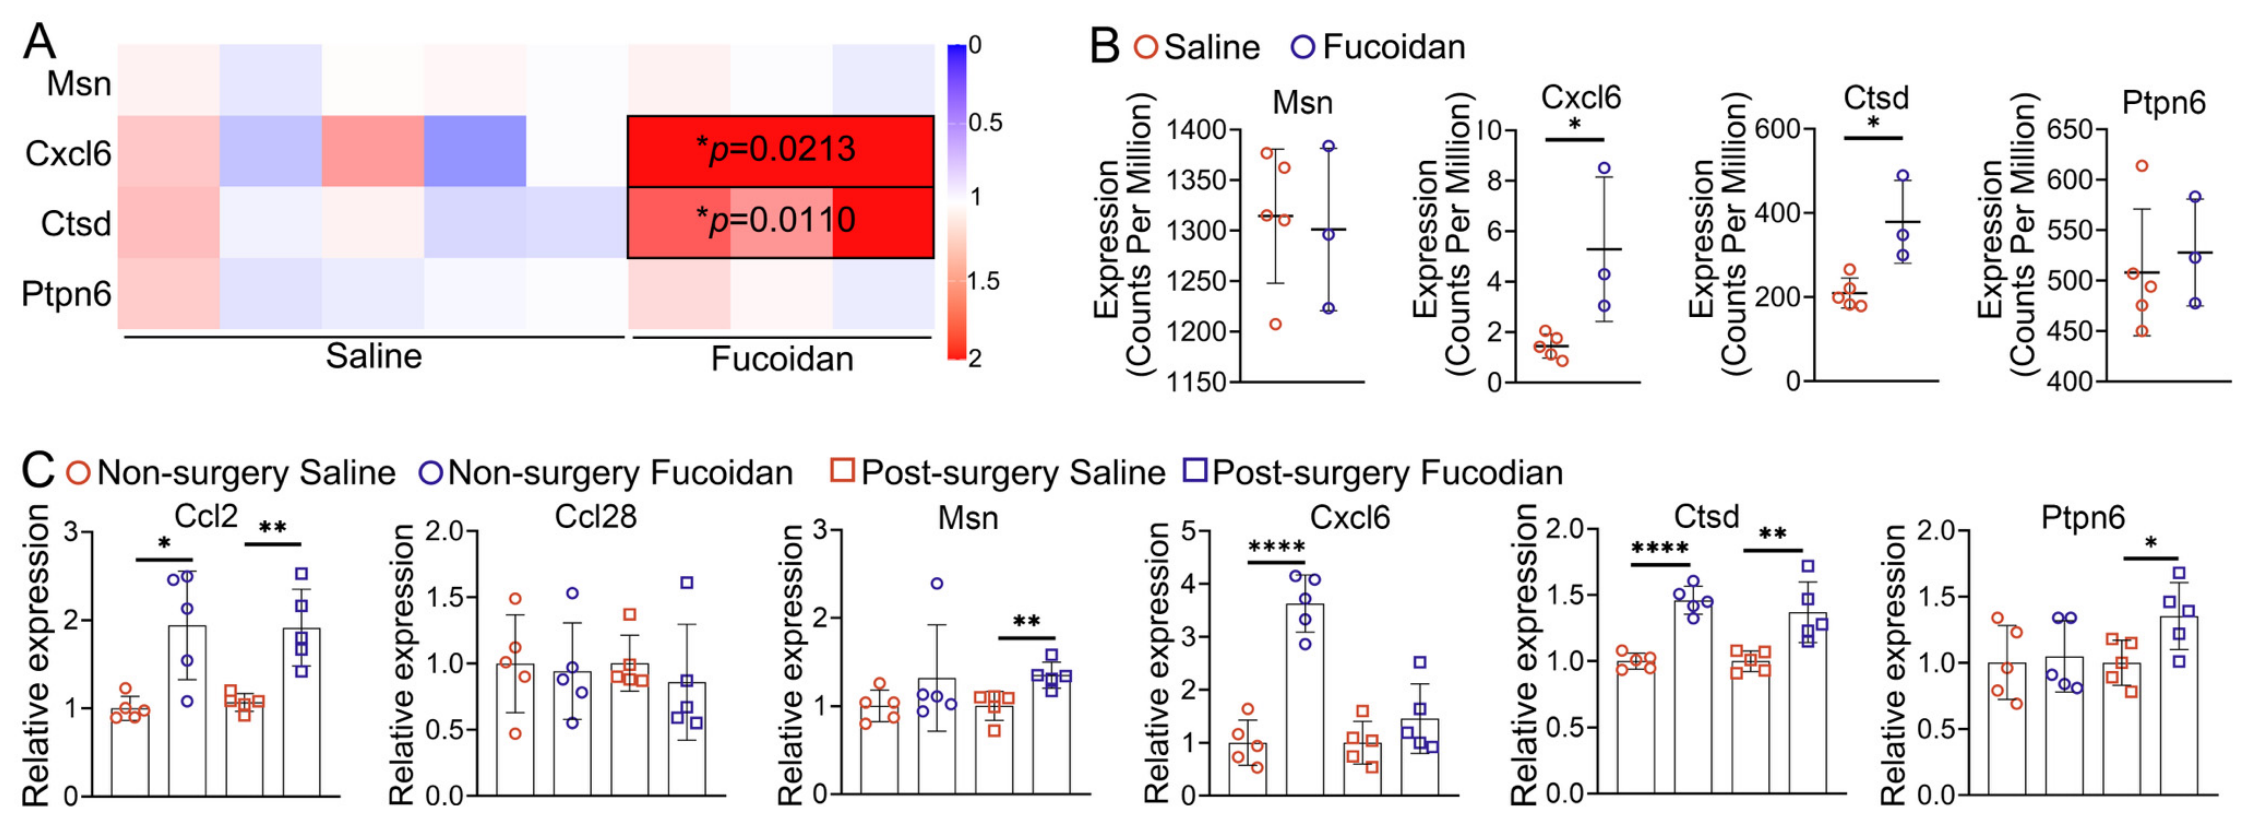
Given the well-recognized immunomodulatory effect of polysaccharides, the influence of perioperative administration of fucoidan on the expression of the six immune-related genes that were found to be downregulated in preoperative patient CSF was evaluated in mouse brains as well as in PBMCs. Results of RNA-seq (GSE316433) revealed a trend of elevation in the expression of Ptpn6 and significant increases in the expression of Cxcl6 and Ctsd in the PBMCs of mice with perioperative fucoidan supplementation, compared with those of control mice (Figure 5A,B). The expression of Ccl2 and Ccl28 was too low to be detected in the mouse PBMC transcriptome. The expression of these six immune-related genes in mouse brains was further assessed using quantitative PCR. The results demonstrated significantly increased expression of Ctsd and Cxcl6 before surgery, whereas significantly increased expression of Ccl2 and Ptpn6 was observed in the acute phase after surgery (3 days post-surgery, POD3) in the brains of mice with perioperative fucoidan supplementation, compared with that of the control mice supplemented with saline (Figure 5C). The results indicated an immunomodulatory effect of fucoidan and its potential efficacy in restoring the expression of the immune-related genes associated with the risk of PND.
Figure 5.
Perioperative administration of fucoidan restored the pattern of expression of the immune-related genes in mouse brains and PBMCs. (A) Heatmap showing color-coded fold changes in the immune-related genes identified in the transcriptome of PBMCs from mice with or without fucoidan supplementation. (B) The abundance (log Counts Per Million) of the immune-related genes in the transcriptome of PBMCs from mice with or without fucoidan supplementation. (C) Quantitative PCR analysis of the expression of the immune-related genes in the brains of mice with or without fucoidan supplementation. (n = 5, two-tailed unpaired Student’s t-test, * p < 0.05, ** p < 0.01, **** p < 0.0001).
3. Discussion
A retrospective cohort study revealed 32 proteins in preoperative CSF that significantly differed between patients diagnosed with or without delirium from day one to day three after knee and hip replacement [15]. LASSO and logistic regression identified 12 differentially expressed proteins, summarized into an immune-related module and a stress-related module, respectively, as the robust predictive protein signature. Alterations in chemokines, lower preoperative baseline levels of CXCL6/CCL2/CCL28 and higher preoperative baseline levels of CXCL11 in CSF were identified in this research as the risk factors for POD. In previous research, significantly higher levels of CXCL6 and CCL2, while significantly lower levels of CXCL11 and CCL28 in the postoperative CSF at least at one time point within 48 h after joint replacement surgery were found to be associated with poor long-term cognitive outcomes, although transient increases in all these chemokines in CSF were observed in these patients immediately after surgery, as shown by Mattias Danielson et al. in their attempt to screen for inflammatory markers of POCD [16]. The correlations between preexisting differences in baseline levels of these cytokines in CSF before surgery and the trajectories of changes in their expression after surgery in patients who developed postoperative neurocognitive disorder should not be assumed, given the obscure nature of the function (neuroprotective vs. neurodestructive) of these cytokines. Other protein markers, including cathepsin D (CTSD), aggrecan (ACAN), thrombopoietin (THPO), and moesin (MSN), have also been implicated in various neurological disorders. For instance, CTSD is a key enzyme involved in α-synuclein degradation, and its downregulation has been found to be associated with the progression of Parkinson’s disease [19]. Dysfunction of ACAN, a major component in perineuronal nets that limit neuronal plasticity, has also been found in various neurological disorders such as Alzheimer’s disease and schizophrenia [20,21]. MSN, a member of the Ezrin–Radixin–Moesin (ERM) family, contributes to cytoskeletal processes to maintain plasma membrane structures and has been intensively investigated in cancer research as well as in CNS development [22,23,24]. It was recently shown to be involved in C1q-dependent synaptic pruning in microglia using knockout mice [25]. THPO, a cytokine that promotes hematopoietic proliferation, was found to be pro-apoptotic in the CNS in early studies [18,26]. The protein levels of THPO were shown to be increased in both serum and CSF in patients with neuromyelitis optica spectrum disorders and in patients with multiple sclerosis in recent research [27]. However, their potential predictive roles in postoperative neurocognitive dysfunction have not been previously reported.
Given that the occurrence of POD is associated with an increased incidence of delayed neurocognitive recovery after surgery [28,29], the potential prognostic role of these biomarkers was further investigated using mouse models. In general, surgery-induced cognitive impairment in animal models was assessed on a group basis or individual-basis by comparing animals’ pre- and postoperative performance in behavioral test batteries. However, within-subject fluctuations in repeated behavioral tests would be expected. We included a control group of non-surgical mice to control for systematic error and the errors arising from repeated testing. The RCIs of the changes in the performance of individual mice before and after surgery in the open field test, Y maze and novel object recognition were calculated as a function of the standard error of differences between two tests in the control group using RCIChelune and RCIWSD, respectively. A slightly increased incidence of mice with cognitive impairments was recognized using RCIWSD. This could be partly explained by the fact that only random errors from fluctuations in the results of two consecutive tests were considered in RCIWSD, whereas both random errors and the association between the results of two consecutive tests were considered in RCIChelune. The six mice identified with a combined Z score ≤ −2 by both methods were defined as mice that had developed PND at one month after surgery. The expression of genes encoding these 12 biomarkers was analyzed in the brains of these mice. Significant differences in the expression of Cxcl11/Ccl2/Ccl28 and a non-significant trend of decreased expression of Cxcl6 were observed between mice with and without PND, indicating that aberrant regulation of inflammatory responses was involved in determining neurocognitive outcomes after surgery. Given the well-known anti-inflammatory and immunomodulatory activities of fucoidan, we further investigated the potential influence of perioperative fucoidan administration on the expression of these genes. Our results showed that the expression of these genes was partially restored in the PBMCs as well as in the brains of mice with perioperative fucoidan supplementation, with significantly increased baseline expression levels of Cxcl6/Ctsd in PBMCs and significantly increased expression of Cxcl6/Ctsd/Ccl2/Ptpn6 in mouse brains before and after surgery. However, we also noticed that the gap between translating this RNA expression information obtained from mouse PBMCs and brains to the human CSF findings was obvious. Because of its low toxicity and high bioactivities, fucoidan has been widely used as a dietary supplement in the food industry. However, the bioactivities of fucoidan are strongly affected by its structure, including the chemical composition and molecular weight. In addition, a broad range of fucoidan dosages, ranging from 50 to 400 mg/kg body weight, has been used in various mouse models [30]. No significant toxicity was observed with oral administration of Undaria pinnatifida fucoidan at 400 mg/kg body weight for up to 10 weeks [31]. In this study, a single daily dosage of 200 mg/kg body weight of high-molecular-weight fucoidan, mainly composed of monosulfated-fucose, was assessed in a PND mouse model involving only male aged mice. Therefore, the structure–activity relationship as well as the dosage, safety, and efficacy of fucoidan used in the prevention and treatment of PND need to be thoroughly evaluated in future preclinical and clinical trial studies. Our results provided preliminary evidence for the potential prognostic roles of these biomarkers in PND and presented a reliable mouse model that could be used to study the pathogenesis of postoperative neurocognitive dysfunction.
4. Materials and Methods
4.1. Animals
Twenty male C57BL/6J mice (18 months old, 30–35 g) were purchased from the Experimental Animal Center of Guangdong (Guangzhou, China) and were housed under controlled conditions (temperature: 22 ± 2 °C; light/dark cycle: 12 h/12 h). Sample size calculation was based on binomial distribution probability, with the reported incidence of PND (approximately 0.3) in the majority of studies; a minimum of 19 animals is needed to ensure that at least 3 animals would develop PND with 95% confidence. A maximum of five mice per cage were housed with free access to food and water. All experimental procedures involving animals were approved by the Animal Research Committee of Jinan University, Guangdong Province (Approval No. 20250222-03). The animal experiments were performed in accordance with the Animals in Research Reporting In Vivo Experiments 2.0 (ARRIVE 2.0) guidelines. For fucoidan treatment, 20 male C57BL/6J mice (2 months old) were purchased from the Experimental Animal Center of Guangdong (Guangzhou, China) and were housed under controlled conditions (temperature: 22 ± 2 °C; light/dark cycle: 12 h/12 h). These mice were randomized into two groups of 10 mice each and assigned to fucoidan treatment and saline treatment, respectively. Dietary supplementation with fucoidan (F885876, Macklin Biochemical Technology Co., Ltd., Shanghai, China) was performed by oral gavaging of 200 μg/g body weight fucoidan (10 g/L fucoidan solution, dissolved in saline) daily for 1 month before laparotomy, with control mice receiving 20 μL/g body weight saline daily for 1 month before laparotomy. Given an average body weight of 30 g, each mouse received approximately 600 μL of fucoidan solution or saline by oral gavage, with a maximum volume of 10 mL/kg for a single administration and a 30 min interval between administrations.
4.2. Surgery
Laparotomy was performed after mice were anesthetized with 2% isoflurane (Cat. No. R510-22-8, RWD Life Science Co., Ltd., Shenzhen, China). The surgical regions were shaved and thoroughly cleaned with Iodophor. A 1 cm longitudinal incision was made along the midline of the abdomen with scissors. Laparotomy began with 5 min internal exploration, followed by exteriorization of 10 cm of the small intestine, which was wrapped with moist gauze and gently massaged for approximately 3 min. After the small intestine was returned to the peritoneal cavity, the incision was closed with sterile 6-0 absorbable sutures. Finally, 5% lidocaine cream was applied to the wound for analgesia. Anesthesia and the surgical procedure were maintained for 70 min. The animals were moved to a warm environment for approximately 30 min and returned to their cage after regaining consciousness. Behavioral assessments were conducted at 24 h before surgery (24 hbs) and 1 month (1 mps) after surgery, and testing order was randomized daily. One-hour acclimation to the experimental environment was allowed, and 75% ethanol was used for deodorization between tests for each individual. For euthanasia, mice were first deeply anesthetized via intraperitoneal injection of pentobarbital sodium (60 mg/kg, Cat. No. P3761, Sigma-Aldrich, St. Louis, MO, USA). The absence of pedal and corneal reflexes was verified to ensure a surgical plane of anesthesia. Subsequently, euthanasia was confirmed by transcardial perfusion with ice-cold 1× PBS, and brain tissues were rapidly collected. Then, the mouse brains were bisected, with left halves fixed in 4% paraformaldehyde and the other halves flash-frozen in liquid nitrogen and stored at −80°C before use. All experimental methods, including euthanasia and anesthesia, were in accordance with the ARRIVE guidelines.
4.3. Y Maze Test
A Y maze consisting of three arms (35 cm × 5 cm × 15 cm, L × W × H) diverging at 120° from the central point was used to evaluate spatial memory in the spontaneous alternation test. Each mouse was placed in one designated arm (labeled A, B, or C) and allowed to explore freely for 8 min. Total arm entries and alternation sequences were quantified using ANY-maze (Stoelting Co., Wood Dale, IL, USA, version 6.23). Spontaneous alternation percentage was calculated as: % Alternation = [Number of Alternations/(Total Arm Entries − 2)] × 100.
4.4. Open Field Test
The open field test was conducted in an open field arena (50 cm × 50 cm × 50 cm). Each mouse was initially placed in the center of the chamber floor and allowed 10 min of free exploration, which was recorded with a video camera. The center zone of the open arena was defined as the square that was 10 cm away from the walls, and the movement trajectories were analyzed using ANY-maze (Stoelting Co., Wood Dale, IL, USA, version 6.23).
4.5. Novel Object Recognition Experiment
The novel object recognition experiment was performed in the open field arena with two identical objects placed in opposite, symmetrical corners (5 cm away from the wall on the same side of the experimental box). One object was replaced with a novel object during the test. Mice were allowed 5 min of free exploration during the phase of familiarization. 24 hours later, mice were returned to the arena with one object replaced by a novel object and were again allowed 5 min of free exploration. Mouse behavior was recorded. The number of activities and the time spent around the new and old objects were calculated using ANY-maze (Stoelting Co., Wood Dale, IL, USA, version 6.23) video analysis software. The recognition index (RI) was calculated as the time spent around the new objects/ (time spent around new objects + time spent around old objects) × 100%.
4.6. Calculation of RCIs and Identification of Mice with Postoperative NCD
Changes in parameters of each behavioral test for each individual mouse were calculated by subtracting preoperative performance from postoperative performance. For control mice that had no surgery, changes were calculated as the differences between two consecutive behavioral tests. The average change in the control group was then subtracted from the change in each individual in the surgery group to obtain the net change after surgery. Subsequently, the reliable change index (RCI) for each individual mouse was calculated using two different methods. RCIChelune: The value of net change was divided by the S.E. difference, calculated using the standard deviation of baseline performance in the control group (s1) and the test–retest reliability (rxx) with the formula √2(s1√ (1 − rxx))2. RCIWSD: The value of net change was divided by the within-subject standard deviation of the differences between the two consecutive behavioral tests in the control group. The combined Z-scores for each mouse in the surgery group were calculated by dividing the sum of RCIs of each behavioral test by the within-group standard deviations of the sum of RCIs in the control group. The animal with a combined Z score ≤ −2 was recognized as having developed postoperative NCD (PND).
4.7. Peripheral Blood Mononuclear Cell (PBMC) Isolation and RNA Extraction
Peripheral blood (0.6–0.8 mL) was collected by cardiac puncture and diluted at a 2:1 ratio with saline, followed by mixing with 4 mL of TBD-LTS1092 (Yuanyang Biotech Co., Ltd., Tianjin, China) in 15 mL conical tubes. The mixture was centrifuged at 450× g for 30 min at room temperature, and the plasma was collected and stored at −80 °C. The PBMCs were washed in 15 mL of phosphate-buffered saline (PBS) and then centrifuged at 250× g for 10 min at room temperature (RT). The supernatant was discarded, and the cell pellet was resuspended in 5 mL of RBC lysis buffer (Cat. No. 00-4333-57, Thermo Fisher Scientific, Waltham, MA, USA). Red blood cells were lysed after 5 min of incubation at 4 °C. 10 mL of PBS was then added, followed by centrifugation at 250× g for 5 min. The supernatants were again discarded, and the cell pellets were lysed in TRIzol reagent (Cat. No. 15596018cn, Invitrogen, Carlsbad, CA, USA).
4.8. Protein Extraction and Western Blot Analysis
Mouse hemisphere brain tissue samples were lysed with T-PER™ Tissue Protein Extraction Reagent (Cat. No. 78510, Thermo Fisher Scientific, Waltham, MA, USA) containing 1% protease inhibitor (Cat. No. PIC0002, Sigma-Aldrich, St. Louis, MO, USA) and 1% phosphatase inhibitor cocktail (Cat. No. DI201-01, TransGen Biotech, Beijing, China). After homogenization, samples were incubated on ice for 30 min. The supernatant of each sample was collected after centrifugation at 12,000× g for 30 min at 4 °C. Protein concentration was determined using a BCA Protein Assay Kit (Cat. No. 23227, Thermo Fisher Scientific, Waltham, MA, USA). For Western blotting, samples were denatured with 5 × loading buffer (Cat. No. P0015L, Beyotime Biotechnology, Shanghai, China) and boiled for 15 min. A total of 20 µg of total protein from each tissue sample was separated by 12% Tris-Glycine SDS-PAGE gel electrophoresis and transferred to PVDF membranes (Cat. No. IPVH00010, pore size: 0.45 μm; Merck Millipore, Darmstadt, Germany) using a wet transfer apparatus (Cat. No. 1658033, Bio-Rad, Richmond, CA, USA). The membranes were then incubated in 5% nonfat milk/TBST for 2 hours at room temperature prior to overnight incubation with the specified primary antibodies at 4 °C. Following three 5-min washes in TBST, the membranes were incubated with HRP-conjugated secondary antibodies for two hours at 4 °C. After additional TBST washes (3 × 5 min), immunoreactive proteins were detected by chemiluminescence (Immobilon horseradish peroxidase; Millipore, Billerica, MA, USA) and imaged with an Amersham Imager 680 (GE Healthcare Bio-Sciences Corp, Piscataway, NJ, USA). Protein expression levels were quantified by densitometry using ImageJ (v1.8.0) and normalized to β-actin. The primary antibodies used were mouse polyclonal anti-β-actin (1:10,000, 10494-1-AP, Proteintech, Rosemont, IL, USA), mouse monoclonal anti-TPO (F-3) (1:500, sc-374045, Santa Cruz, TX, USA).
4.9. Reverse Transcription and Quantitative Real-Time PCR (qRT-PCR)
Total RNA was extracted from mouse hemibrains using the PARISTM kit. RNA quantity and quality were assessed using a NanoDrop 1000 spectrophotometer (Thermo Fisher Scientific, Waltham, MA, USA). For cDNA synthesis, 1 μg of total RNA was reverse transcribed with the PrimeScript™ RT Reagent Kit with gDNA Eraser (Cat. No. RR047A, Takara, Kusatsu, Japan). Quantitative real-time polymerase chain reaction (qRT-PCR) was performed on a QuantStudio3 (Applied Biosystems, Thermo Fisher Scientific, Waltham, MA, USA) using TB GreenTM Premix Ex TaqII (Tli RNaseH Plus) (Cat. No. RR820A, Takara, Kusatsu, Japan). Primer sequences listed in Table S4 were synthesized by Sangon Biotech (Shanghai, China). Relative levels of gene expression were calculated using the 2−ΔΔCt method, with GAPDH as the internal reference gene. Normalized gene expression values from triplicate samples were plotted as bar graphs using GraphPad Prism 9.4.
4.10. Immunofluorescence
Mouse brains were fixed overnight in 4% paraformaldehyde at 4 °C, dehydrated through graded sucrose solutions (10%, 20%, 30% in PBS), embedded in O.C.T. compound, and stored at −80 °C. Coronal sections (15 µm thick) were cut using a freezing microtome, air-dried, washed with PBS, and processed for immunostaining. Sections were permeabilized with 0.3% Triton X-100/PBS (15 min) and blocked in PBS containing 1% BSA and 0.3% Triton X-100 for 2 hours at room temperature (RT). Sections were incubated overnight at 4 °C with primary antibodies diluted in blocking buffer: mouse anti-TPO (1:200, Santa, sc-374045) and rabbit anti-Cleaved Caspase3 (Cat. No. 9664s, 1:1000, Cell Signaling Technology, Danvers, MA, USA). Following three washes (5 min each) in TBST (0.1% Triton X-100) or PBS (0.3% Triton X-100), sections were incubated for 2 hours at RT in the dark with appropriate secondary antibodies: Alexa Fluor-488 goat anti-mouse IgG (Cat. No. 111-545-003, 1:500, Jackson ImmunoResearch Laboratories, Inc., West Grove, PA, USA) and Cy3-conjugated goat anti-rabbit IgG (Cat. No. 111-166-144, 1:500, Jackson, West Grove, PA, USA). Nuclei were counterstained with Hoechst 33342 (1:10,000 or 1 µg/mL, Sigma-Aldrich, St. Louis, MO, USA) for 15 min at RT. Sections were then mounted in Fluoromount™ Aqueous Mounting Medium (Sigma-Aldrich, St. Louis, MO, USA). Imaging was conducted using either an Olympus FV3000 or EVOS FL Auto cell imaging system (Invitrogen, Carlsbad, CA, USA). Fluorescent images of unilateral hippocampal fields (CA3 and DG) and perirhinal cortex were captured at 20× magnification (FV3000) from three consecutive coronal sections (corresponding to bregma −1.82 mm to −2.46 mm) and processed with FV31S-SW Viewer. Quantitative analysis of fluorescence intensity within defined ROIs was performed using ImageJ (v1.8.0). At least three independent experiments were performed. The scanning images of the hemisphere sections stained with anti-TPO and anti-Cleaved Caspase3 were captured using EVOS FL Auto cell imaging system (Invitrogen, Carlsbad, CA, USA) with a 10× objected lens.
4.11. Identification of the POD-Related Protein Signature in Preoperative CSF
Proteomics data were downloaded from the Gene Expression Omnibus (GEO) public database (accession number GSE242736) [15]. This dataset measured 1,305 proteins in preoperative CSF from all 24 matched delirium cases and non-delirium control pairs by high-multiplex, aptamer-based affinity SomaScan proteomics analysis. Univariate Logistic regression analysis was performed using the relative abundance of the 32 DEPs annotated in the original study with the ‘glm’ function of the ‘stats’ package (version 4.2.1) in R. The probability threshold was set to 0.05 to select the protein markers with a high likelihood of association with POD, followed by LASSO regression analyses to select key markers using “glmnet” in R (v4.4.0). The optimal λ value was selected through 10-fold cross-validation, and the key POD-related protein signatures were recognized as the variables with the nonzero coefficient at λ.1se. Random forest (RF) regression was also performed using “randomforest” package in R (version 4.7-1.1) with the following parameters: ntree (254), mtry (3), and nodesize (5). The importance of the characteristic variables (32 DEPs) in the model was ranked by the decrease in MeanDecreaseAccuracy in descending order. Finally, the receiver operating characteristic (ROC) curves were plotted using “pROC” package (version 1.18.5) to evaluate diagnostic performance.
4.12. mRNA Sequencing, Data Processing and Analysis
Total RNA from mouse PBMCs and mouse brain tissues was extracted using the Illumina TruSeq RNA Sample Prep V2 Kit (Cat. No. RS-122-2001, Illumina, San Diego, CA, USA) and was used to construct RNA-seq libraries with the VAHTS Universal V6 RNA-seq Library Prep Kit (Cat. No. NR604-02, Vazyme, Nanjing, China). The libraries were quantified with Qubit 2.0 fluorometer (Thermo Fisher Scientific, Waltham, MA, USA) and assessed for size distribution on an Agilent 2100 Bioanalyzer (Agilent Technologies, Inc., Santa Clara, CA, USA), then sequenced on the Illumina NovaSeq 6000 platform in paired-end mode (2 × 150 bp). Raw reads were trimmed for adapters and low-quality bases, then aligned to the reference genome (GRCm39/mm39) using HISAT2 (v2.2.1). Low-expressed genes (containing a count value of zero in at least one sample) were filtered out using the dplyr package (v1.1.4) in R. Principal component analysis (PCA) was performed with the prcomp function. Differential expression analysis was carried out with DESeq2 (v1.40.0), applying thresholds of p < 0.05 and |fold change| > 1.5. The expression of genes was normalized using edgeR (v4.0.16), and the fold changes in postoperative versus preoperative gene expression were used to construct the heatmap and plotted using “pheatmap” in R (v4.4.0). Relative changes in expression of the POD-related biomarkers at each indicated time point after surgery were compared with those in the control non-surgery group. Statistical significance was assessed using unpaired two-tailed t-tests, with p < 0.05 considered significant. Gene Ontology (GO) enrichment analysis and KEGG pathway enrichment analysis were performed using DAVID (https://david.ncifcrf.gov/tools.jsp, accessed on 20 May 2026). All results and Venn diagrams were visualized using ggplot2 (v3.4.4).
4.13. Statistical Analysis
At least three independent experiments were performed for each assay, with the results of individual experiments presented in corresponding figures. Behavioral assessment parameters and expression data were tested for normality. Data are presented as mean ± standard deviation (SD). Comparisons between two groups were performed with an unpaired, two-tailed Student’s t-test. Comparisons involving more than two groups were analyzed using one-way analysis of variance (ANOVA) followed by Tukey’s post hoc test. All statistical analyses and graphing were conducted using GraphPad Prism version 9.4.1 (GraphPad Software, San Diego, CA, USA). A threshold of p < 0.05 was considered statistically significant. The person performing data analysis knew which data had been grouped together for comparisons without knowing the specific treatment each group received.
Supplementary Materials
The following supporting information can be downloaded at: https://www.mdpi.com/article/10.3390/md24110412/s1, Figure S1: Original blot. Original blots for Figure 4E; Figure S2: Immunohistochemical analysis of the expression of Thpo and cleaved caspase3; Table S1: Functional enrichment analysis of related gene modules; Table S2: Results of univariate logistic analysis of DEPs; Table S3: DEPs and DEGs list; Table S4: QPCR primer sequences.
Author Contributions
Conceptualization, Y.Z.; validation, C.S., W.W. and Z.C.; formal analysis, C.S. and L.L.; investigation, W.W. and Z.C.; resources, Y.Z.; data curation, Y.Z.; writing—original draft preparation, Y.Z.; writing—review and editing, Y.Z., C.S., W.W., Z.C. and L.L.; visualization, C.S. and L.L.; supervision, S.L.; project administration, Y.Z. and S.L.; funding acquisition, Y.Z. and C.S. All authors have read and agreed to the published version of the manuscript.
Funding
The research leading to these results received funding from the Guangdong Provincial Key R&D Program of Department of Natural Resources of Guangdong Province (#2023B1111050011), the Natural Science Foundation of Guangdong (#2023A1515010293) and the China Postdoctoral Science Foundation (Certificate Number: 2025M782638).
Institutional Review Board Statement
All experimental procedures involving animals were approved by the Animal Research Committee of Jinan University, Guangdong Province (Approval No. 20250222-03) (approval date: 22 February 2025). The animal experiments were performed in accordance with the Guide for the Care and Use of Laboratory Animals issued by the National Institutes of Health (NIH).
Data Availability Statement
All data generated and analyzed during this study are included in this published article [and its Supplementary Information Files]. The datasets analyzed during the current study are available in the GEO repository, [https://www.ncbi.nlm.nih.gov/geo/query/acc.cgi?acc=GSE242736, accessed on 22 February 2024]. The datasets generated during the current study are available in the GEO repository [https://www.ncbi.nlm.nih.gov/geo/query/acc.cgi?&acc=GSE339210, accessed on 8 May 2026, https://www.ncbi.nlm.nih.gov/geo/query/acc.cgi?acc=GSE316433, accessed on 22 August 2026].
Conflicts of Interest
The authors declare no conflicts of interest.
Abbreviations
The following abbreviations are used in this manuscript:
| NCD | Postoperative neurocognitive disorder |
| POD | Postoperative delirium |
| POCD | Postoperative NCD |
| CNS | Central nervous system |
| CSF | Cerebrospinal fluid |
| NSE | Neuron-specific enolase |
| RI | Recognition index |
| RCI | Reliable change index |
| PND | Postoperative NCD |
| DEPs | Differentially expressed proteins |
| RF | Random forest |
| ROC | Receiver operating characteristic |
| AUC | Area under the curve |
References
- Evered, L.; Silbert, B.; Knopman, D.S.; Scott, D.A.; DeKosky, S.T.; Rasmussen, L.S.; Oh, E.S.; Crosby, G.; Berger, M.; Eckenhoff, R.G. Recommendations for the Nomenclature of Cognitive Change Associated with Anaesthesia and Surgery—2018. Anesthesiology 2018, 129, 872–879. [Google Scholar] [CrossRef] [Scilit] [PubMed]
- Brattinga, B.; Plas, M.; Spikman, J.M.; Rutgers, A.; de Haan, J.J.; van der Wal-Huisman, H.; Absalom, A.R.; Nieuwenhuijs-Moeke, G.J.; van Munster, B.C.; de Bock, G.H. The link between the early surgery-induced inflammatory response and postoperative cognitive dysfunction in older patients. J. Am. Geriatr. Soc. 2024, 72, 1360–1372. [Google Scholar] [CrossRef] [Scilit] [PubMed]
- Peng, W.; Lu, W.; Jiang, X.; Xiong, C.; Chai, H.; Cai, L.; Lan, Z. Current progress on neuroinflammation-mediated postoperative cognitive dysfunction: An update. Curr. Mol. Med. 2023, 23, 1077–1086. [Google Scholar] [CrossRef] [Scilit] [PubMed]
- Fournier, A.; Krause, R.; Winterer, G.; Schneider, R. Biomarkers of postoperative delirium and cognitive dysfunction. Front. Aging Neurosci. 2015, 7, 112. [Google Scholar] [CrossRef] [Scilit] [PubMed]
- Schaefer, S.T.; Koenigsperger, S.; Olotu, C.; Saller, T. Biomarkers and postoperative cognitive function: Could it be that easy? Curr. Opin. Anesthesiol. 2019, 32, 92–100. [Google Scholar] [CrossRef] [Scilit] [PubMed]
- Geng, J.; Zhang, Y.; Chen, H.; Shi, H.; Wu, Z.; Chen, J.; Luo, F. Associations between Alzheimer’s disease biomarkers and postoperative delirium or cognitive dysfunction: A meta-analysis and trial sequential analysis of prospective clinical trials. Eur. J. Anaesthesiol. 2024, 41, 234–244. [Google Scholar] [PubMed]
- Hall, R.J.; Watne, L.O.; Cunningham, E.; Zetterberg, H.; Shenkin, S.D.; Wyller, T.B.; MacLullich, A.M. CSF biomarkers in delirium: A systematic review. Int. J. Geriatr. Psychiatry 2018, 33, 1479–1500. [Google Scholar] [CrossRef] [Scilit] [PubMed]
- Hirsch, J.; Vacas, S.; Terrando, N.; Yuan, M.; Sands, L.P.; Kramer, J.; Bozic, K.; Maze, M.M.; Leung, J.M. Perioperative cerebrospinal fluid and plasma inflammatory markers after orthopedic surgery. J. Neuroinflammation 2016, 13, 211. [Google Scholar] [CrossRef] [Scilit] [PubMed]
- Majewski, P.; Zegan-Barańska, M.; Karolak, I.; Kaim, K.; Żukowski, M.; Kotfis, K. Current evidence regarding biomarkers used to aid postoperative delirium diagnosis in the field of cardiac surgery. Medicina 2020, 56, 493. [Google Scholar] [CrossRef] [Scilit] [PubMed]
- Sim, M.A.; Tan, E.S.; Chan, S.P.; Cai, Y.; Chai, Y.L.; Chong, J.R.; Chong, E.J.Y.; Robert, C.; Venketasubramanian, N.; Tan, B.Y. Associations of circulating platelet endothelial cell adhesion molecule-1 levels with progression of cerebral small-vessel disease, cognitive decline, and incident dementia. J. Am. Heart Assoc. 2024, 13, e035133. [Google Scholar] [CrossRef] [Scilit] [PubMed]
- Jones, E.L.; Gauge, N.; Nilsen, O.B.; Lowery, D.; Wesnes, K.; Katsaiti, E.; Arden, J.; Amoako, D.; Prophet, N.; Purushothaman, B. Analysis of neuron-specific enolase and S100B as biomarkers of cognitive decline following surgery in older people. Dement. Geriatr. Cogn. Disord. 2013, 34, 307–311. [Google Scholar] [CrossRef] [Scilit] [PubMed]
- Beishuizen, S.J.; Scholtens, R.M.; van Munster, B.C.; de Rooij, S.E. Unraveling the relationship between delirium, brain damage, and subsequent cognitive decline in a cohort of individuals undergoing surgery for hip fracture. J. Am. Geriatr. Soc. 2017, 65, 130–136. [Google Scholar] [CrossRef] [Scilit] [PubMed]
- Evered, L.; Silbert, B.; Scott, D.A.; Ames, D.; Maruff, P.; Blennow, K. Cerebrospinal fluid biomarker for Alzheimer disease predicts postoperative cognitive dysfunction. Surv. Anesthesiol. 2016, 60, 195–196. [Google Scholar] [CrossRef] [Scilit]
- Wu, Z.; Zhang, M.; Zhang, Z.; Dong, W.; Wang, Q.; Ren, J. Ratio of β-amyloid protein (Aβ) and Tau predicts the postoperative cognitive dysfunction on patients undergoing total hip/knee replacement surgery. Exp. Ther. Med. 2018, 15, 878–884. [Google Scholar] [CrossRef] [Scilit] [PubMed]
- Dillon, S.T.; Vasunilashorn, S.M.; Otu, H.H.; Ngo, L.; Fong, T.; Gu, X.; Cavallari, M.; Touroutoglou, A.; Shafi, M.; Inouye, S.K. Aptamer-based proteomics measuring preoperative cerebrospinal fluid protein alterations associated with postoperative delirium. Biomolecules 2023, 13, 1395. [Google Scholar] [CrossRef] [Scilit] [PubMed]
- Danielson, M.; Wiklund, A.; Granath, F.; Blennow, K.; Mkrtchian, S.; Nellgård, B.; Oras, J.; Jonsson Fagerlund, M.; Granström, A.; Schening, A. Neuroinflammatory markers associate with cognitive decline after major surgery: Findings of an explorative study. Ann. Neurol. 2020, 87, 370–382. [Google Scholar] [CrossRef] [Scilit] [PubMed]
- Liang, X.; Song, C.; Lin, J.; Li, S.; Li, L.; Dai, G.; Zhang, R.; Zou, O.M.; Yao, H.; Zhou, L. Transthyretin, a novel prognostic marker of POCD revealed by time-series RNA-sequencing analysis. Mol. Psychiatry 2025, 30, 3103–3119. [Google Scholar] [CrossRef] [Scilit] [PubMed]
- Ivanova, A.; Wuerfel, J.; Zhang, J.; Hoffmann, O.; Ballmaier, M.; Dame, C. Expression pattern of the thrombopoietin receptor (Mpl) in the murine central nervous system. BMC Dev. Biol. 2010, 10, 77. [Google Scholar] [CrossRef] [Scilit] [PubMed]
- Yang, S.Y.; Gegg, M.; Chau, D.; Schapira, A. Glucocerebrosidase activity, cathepsin D and monomeric alpha-synuclein interactions in a stem cell derived neuronal model of a PD associated GBA1 mutation. Neurobiol. Dis. 2020, 134, 104620. [Google Scholar] [CrossRef] [Scilit] [PubMed]
- Rowlands, D.; Lensjo, K.K.; Dinh, T.; Yang, S.; Andrews, M.R.; Hafting, T.; Fyhn, M.; Fawcett, J.W.; Dick, G. Aggrecan Directs Extracellular Matrix-Mediated Neuronal Plasticity. J. Neurosci. 2018, 38, 10102–10113. [Google Scholar] [CrossRef] [Scilit] [PubMed]
- Barahona, R.A.; Kwang, N.E.; Kono-Soosaipillai, A.R.; Rubio Salgado, G.; Tran, K.M.; Lu, Y.H.; Reddy, S.; da Cunha, C.; Velazquez-Rivera, E.; Crapser, J.D.; et al. Aggrecan protects against plaque accumulation and is essential for proper microglial responses to plaques. Cell Rep. 2025, 44, 116064. [Google Scholar] [CrossRef] [Scilit] [PubMed]
- Senju, Y.; Tsai, F.C. A biophysical perspective of the regulatory mechanisms of ezrin/radixin/moesin proteins. Biophys. Rev. 2022, 14, 199–208. [Google Scholar] [CrossRef] [Scilit] [PubMed]
- Chong, Z.Z.; Souayah, N. Radixin: Roles in the Nervous System and Beyond. Biomedicines 2024, 12, 2341. [Google Scholar] [CrossRef] [Scilit] [PubMed]
- Aakriti, J.; Vithalkar, M.P.; Maity, S.; Baby, K.; Nagareddy, P.R.; Nayak, Y. Focal adhesion kinase (FAK): Emerging target for drug-resistant malignant tumors. Mol. Biol. Rep. 2025, 52, 248. [Google Scholar] [CrossRef] [Scilit] [PubMed]
- Lai, W.; Chen, J.; Zhu, H.; Jiang, Y.; Niu, Y.; Chen, Q.; Luo, Z.; Hu, Y.; Fang, L.; Wang, Y.; et al. The knockout of Moesin leads to excess microglia-mediated synaptic pruning and impairs social novelty in a mouse model. Cell Rep. 2025, 44, 116012. [Google Scholar] [CrossRef] [Scilit] [PubMed]
- Ehrenreich, H.; Hasselblatt, M.; Knerlich, F.; von Ahsen, N.; Jacob, S.; Sperling, S.; Woldt, H.; Vehmeyer, K.; Nave, K.A.; Siren, A.L. A hematopoietic growth factor, thrombopoietin, has a proapoptotic role in the brain. Proc. Natl. Acad. Sci. USA 2005, 102, 862–867. [Google Scholar] [CrossRef] [Scilit] [PubMed]
- Du, L.; Chang, H.; Wei, Y.; Zhang, X.; Yin, L. Different roles of soluble CD40 ligand in central nervous system damage. Neurol. Res. 2020, 42, 372–378. [Google Scholar] [CrossRef] [Scilit] [PubMed]
- Saczynski, J.S.; Marcantonio, E.R.; Quach, L.; Fong, T.G.; Gross, A.; Inouye, S.K.; Jones, R.N. Cognitive trajectories after postoperative delirium. N. Engl. J. Med. 2012, 367, 30–39. [Google Scholar] [CrossRef] [Scilit] [PubMed]
- Sauër, A.; Veldhuijzen, D.S.; Ottens, T.H.; Slooter, A.J.; Kalkman, C.J.; van Dijk, D. Association between delirium and cognitive change after cardiac surgery. BJA Br. J. Anaesth. 2017, 119, 308–315. [Google Scholar] [CrossRef] [Scilit] [PubMed]
- Wei, H.; Gao, Z.; Zheng, L.; Zhang, C.; Liu, Z.; Yang, Y.; Teng, H.; Hou, L.; Yin, Y.; Zou, X. Protective effects of fucoidan on Aβ25–35 and d-Gal-induced neurotoxicity in PC12 cells and d-Gal-induced cognitive dysfunction in mice. Mar. Drugs 2017, 15, 77. [Google Scholar] [CrossRef] [Scilit] [PubMed]
- Yang, C.; Dwan, C.; Wimmer, B.C.; Ronci, M.; Wilson, R.; Johnson, L.; Caruso, V. Neuroprotective and anti-inflammatory activity of Undaria pinnatifida fucoidan in vivo—A proteomic investigation. Mar. Drugs 2025, 23, 189. [Google Scholar] [CrossRef] [Scilit] [PubMed]
Disclaimer/Publisher’s Note: The statements, opinions and data contained in all publications are solely those of the individual author(s) and contributor(s) and not of MDPI and/or the editor(s). MDPI and/or the editor(s) disclaim responsibility for any injury to people or property resulting from any ideas, methods, instructions or products referred to in the content. |
© 2026 by the authors. Licensee MDPI, Basel, Switzerland. This article is an open access article distributed under the terms and conditions of the Creative Commons Attribution (CC BY) license.