


Abstract
LY104 (previously designated as B7) is a marine-derived, non-halogenated small molecule that acts as a highly selective phosphodiesterase-4 (PDE4) inhibitor and is currently under preclinical development for the treatment of chronic obstructive pulmonary disease (COPD). Following intravenous infusion, LY104 undergoes rapid biotransformation to its active metabolite M1. Both the parent drug and its metabolite exhibit potent anti-COPD activity and favorable safety profiles. We previously reported the comprehensive pharmacokinetic profiles of LY104 and M1 in rats. In the present study, we extended our investigation to a non-rodent species by developing and re-validating an LC-MS/MS method for the simultaneous quantification of LY104 and M1 in beagle dog plasma according to ICH M10 guidelines. Calibration curves showed excellent linearity over 20–2000 ng/mL (R2 > 0.99) for both analytes. The validated method was successfully applied to characterize the pharmacokinetics of LY104 and M1 in beagle dogs following single (0.2, 1, and 5 mg/kg) and multiple (1 mg/kg once daily for 7 days) intravenous infusions. Following a single dose, LY104 was rapidly cleared with elimination half-lives of 0.14–2.51 h, while M1 exhibited much longer half-lives of 12.37–44.95 h, indicating sustained exposure of the active metabolite. Dose-normalized AUC and Cmax did not increase proportionally with dose over the 0.2–5 mg/kg range, indicating non-linear pharmacokinetics for both analytes. No clinically relevant accumulation was observed after repeated dosing. The blood-to-plasma partition ratio of LY104 was 0.58, confirming predominant plasma distribution. These findings provide the first comprehensive pharmacokinetic characterization of LY104 and M1 in a non-rodent species, filling a critical translational gap between rodent studies and first-in-human trials, and providing essential data to support physiologically based pharmacokinetic (PBPK) modeling and clinical dose selection.
1. Introduction
Chronic obstructive pulmonary disease (COPD) remains a leading cause of morbidity and mortality worldwide, with its global burden projected to increase substantially in the coming decades [1,2,3]. Current clinical management mainly alleviates symptoms, slows lung function decline, and reduces acute exacerbations but does not adequately control the persistent airway inflammation that drives disease progression, representing a major unmet need. The disease arises from complex interactions among genetic predisposition, environmental exposures, oxidative stress, and chronic inflammatory responses [4,5,6,7]. Among these factors, cigarette smoke, airborne pollutants, protease-antiprotease imbalance, and persistent airway inflammation are recognized as core drivers of disease onset and progression [8,9,10]. Both the 2023 GOLD guidelines and the 2021 Chinese COPD guidelines recommend pharmacological and non-pharmacological interventions, with the latter including smoking cessation, vaccination, pulmonary rehabilitation, oxygen therapy, and surgical or bronchoscopic lung volume reduction [4,11]. Nevertheless, pharmacotherapy remains the cornerstone of COPD management due to its efficacy in preserving lung function and reducing mortality. Despite continuous therapeutic advances over the past two decades, current clinical practice still relies heavily on combinations of bronchodilators (β2-adrenergic agonists or muscarinic antagonists) and anti-inflammatory agents (primarily inhaled corticosteroids) [12]. For patients with moderate-to-severe disease, triple therapy combining an inhaled corticosteroid (ICS), a long-acting β2-adrenergic agonist (LABA), and a long-acting muscarinic antagonist (LAMA) is frequently used as maintenance treatment, but it is not universally indicated as first-line therapy; according to GOLD 2023, triple therapy is generally considered for patients with a history of exacerbations and elevated blood eosinophils, whereas LABA/LAMA dual bronchodilation is preferred for most patients without a clear ICS indication [4,13]. Long-term ICS exposure within triple therapy is associated with an increased risk of pneumonia, oral candidiasis, dysphonia, and potential systemic adverse effects [4,12,13]. However, these regimens mainly alleviate symptoms and reduce exacerbations rather than reversing the underlying inflammatory cascade, underscoring the need for new pharmacotherapies that target persistent airway inflammation.
Progressive neutrophilic airway inflammation and impaired cAMP homeostasis are central to COPD pathogenesis, positioning phosphodiesterase-4 (PDE4) as a validated non-steroidal anti-inflammatory target [14]. The PDE4 family comprises four isoforms (PDE4A-D) with distinct tissue distribution and physiological functions. PDE4B is predominantly expressed in immune cells and mediates pro-inflammatory cytokine release, through cAMP/PKA-dependent regulation of NF-κB p65 phosphorylation; its inhibition reduces TNF-α, IL-6, and IL-1β production and neutrophil recruitment [15,16], whereas PDE4D is widely distributed in the central nervous system, including the area postrema and other brainstem nuclei of the emetic reflex, where its inhibition is associated with dose-limiting toxicities such as nausea and vomiting [17]. Because these emetic effects are mechanism-based and not readily separated from PDE4D inhibition, non-selective PDE4 inhibitors have a narrow therapeutic window [17,18]. Thus, an ideal PDE4 inhibitor should achieve high selectivity for PDE4B over PDE4D.
Currently approved PDE4 inhibitors, roflumilast and cilomilast, exhibit significant limitations. They provide only modest improvements in lung function and are hampered by dose-limiting gastrointestinal adverse effects, including vomiting, diarrhea, and weight loss, resulting in a narrow therapeutic index [15]. Ensifentrine, a dual PDE3/4 inhibitor administered via nebulization, offers improved tolerability but requires twice-daily dosing and exhibits non-linear systemic exposure above 6 mg [19,20,21]. Consequently, a next-generation PDE4 inhibitor that combines high selectivity and a broad therapeutic index is urgently needed.
LY104 (formerly designated as B7 [22]) is a non-halogenated small molecule derived from the marine natural alkaloid MBZ, which was isolated from marine bryozoans and hydroids and used as the lead compound for structure-guided optimization [22]. It displays subnanomolar potency against human PDE4B2 and over 120-fold selectivity over PDE4D and other off-target isoforms. Following oral administration, LY104 undergoes rapid and nearly complete first-pass conversion to its sole active metabolite, M1, which retains PDE4 affinity [23]. In a rat COPD model co-induced by lipopolysaccharide and cigarette smoke exposure, LY104 significantly attenuated airway inflammation, reduced expiratory resistance and mucus secretion, and improved pulmonary function through dual modulation of the cAMP-PKA-CREB and NF-κB signaling pathways [22,24,25]. Tissue distribution studies revealed preferential pulmonary accumulation with minimal brain penetration [22].
Prior to first-in-human (FIH) studies, regulatory guidelines, including ICH M3(R2) and S3A, mandate comprehensive preclinical pharmacokinetic (PK) evaluation, including assessment of dose-exposure proportionality and steady-state accumulation [26,27]. For drugs whose pharmacological activity resides partly in their metabolites, simultaneous quantification of the parent compound and its active metabolite is essential to avoid misinterpretation of exposure and to enable reliable PBPK modeling for human dose projection. Furthermore, the blood-to-plasma partition ratio (Bp), a key parameter reflecting drug distribution between blood cells and plasma, directly influences the calculation of apparent volume of distribution (Vd) and the conversion of plasma concentrations to whole blood exposure. Bp also serves as a critical input parameter for PBPK models used in human dose extrapolation [28,29,30].
Our group has previously published a comprehensive preclinical pharmacokinetic evaluation of LY104 and M1 in rats, covering single- and multiple-dose profiles, tissue distribution, plasma protein binding, metabolic stability, and excretion [31]. However, species differences in plasma esterase activity and drug-metabolizing enzymes mean that rodent data alone are insufficient for predicting human exposure, particularly for LY104, which contains a labile ester bond [32,33]. Beagle dogs are the preferred non-rodent species for preclinical pharmacokinetic assessment due to their well-characterized metabolic profiles and the availability of extensive historical data for translational scaling [34].
In the present study, we adapted our previously validated LC-MS/MS method to beagle dog plasma, expanding the calibration range to cover the higher concentrations anticipated in dogs. Following re-validation under ICH M10 [35], the method was applied to characterize the pharmacokinetics, dose proportionality, and accumulation potential of LY104 and M1 in beagle dogs after single and multiple intravenous infusions.
2. Results and Discussion
2.1. LC-MS/MS Method Development
2.1.1. Optimization of Mass Spectrometry Conditions
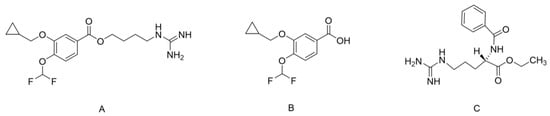
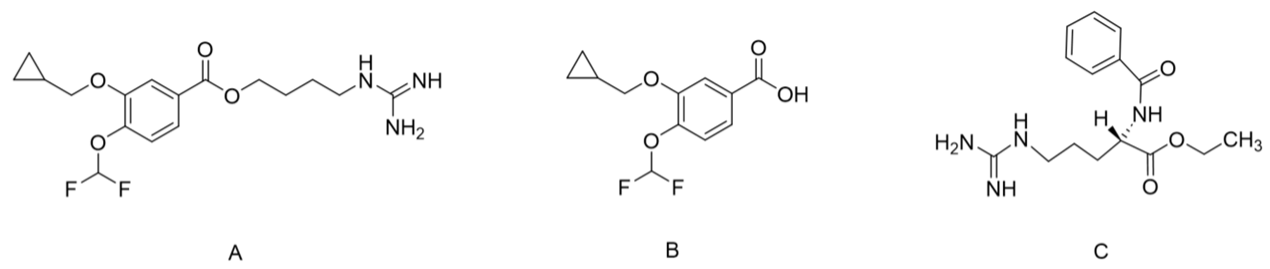
The chemical structures of LY104, M1, and BAEE (IS) are shown in Figure 1. BAEE was selected as the IS because its chromatographic behavior and structural features (guanidine group, benzene ring, and ester bond) resemble those of LY104 [31]. In addition, BAEE exhibited recovery and ionization efficiency comparable to those of LY104 and M1, with no matrix interference or cross-interference. Under the optimized chromatographic conditions, LY104, M1, and BAEE eluted at approximately 2.85, 3.22, and 2.11 min, respectively; no cross-interference among the three channels was observed (Figure 2).
Figure 1.
Chemical structures of LY104 (A), M1 (B), and BAEE (C).
Figure 2.
Representative MRM chromatograms of LY104, M1, and BAEE in beagle dog plasma: (A) blank plasma; (B) blank plasma spiked at LLOQ; (C) plasma sample collected at 1 h after intravenous administration of LY104 (1 mg/kg).
Both positive and negative electrospray ionization (ESI) modes were evaluated. LY104 and the IS (BAEE) gave much stronger [M + H]+ signals in positive mode, whereas M1 showed a stronger [M − H]− response in negative mode. Therefore, polarity switching was used for simultaneous quantification. Representative full-scan mass spectra of LY104, M1, and BAEE in positive and negative ESI modes are provided in Figure S1.
The precursor-to-product ion transitions were m/z 372.3 → 187.1 (LY104), m/z 257.1 → 213.1 (M1), and m/z 307.3 → 105.1 (IS). Key MS parameters (fragmentor voltage and collision energy) were optimized to maximize responses, with optimal settings listed in Table 1.
Table 1.
Mass spectrometry parameters for LY104, M1, and BAEE (IS).
2.1.2. Optimization of Sample Pretreatment Conditions
Proper sample preparation is essential for the analysis of complex biological matrices, as it allows for the enrichment of trace analytes to achieve the desired sensitivity while minimizing matrix-related interferences [36]. Common techniques include protein precipitation (PPT), liquid–liquid extraction (LLE), and solid-phase extraction (SPE). Given the instability of LY104 at room temperature and the demand for high-throughput processing, a rapid low-temperature procedure was necessary. PPT was chosen for its simplicity and speed [37,38]. Protein precipitation (PPT), liquid–liquid extraction (LLE), and solid-phase extraction (SPE) were all considered. LLE and SPE were not pursued because they require longer sample handling, which is unfavorable for the room-temperature instability of LY104, and because preliminary trials indicated less consistent recovery of M1. A formal side-by-side recovery comparison across the three techniques was therefore not performed.
Acetonitrile and methanol were compared as precipitation solvents. Acetonitrile yielded more than twice the analyte signal intensity of methanol. The precipitant-to-plasma volume ratio was then optimized. When acetonitrile was added at two volumes (i.e., a 1:2 plasma-to-precipitant ratio, v/v), plasma proteins were almost completely precipitated [39], and the resulting supernatant gave good analyte response, acceptable peak shape, and minimal matrix interference. Hence, acetonitrile at a 1:2 ratio was adopted as the optimal precipitant for all subsequent preparations.
2.2. Selectivity
Method selectivity was assessed using blank plasma from six individual beagle dogs. Representative chromatograms are presented in Figure 2. In blank plasma samples, a small endogenous peak was observed at the retention time of LY104, with peak areas ranging from 39.24 to 57.85 across six individual dog plasma lots. This interference corresponded to 2.01–2.96% of the LLOQ peak area, which is well below the ICH M10 acceptance criterion (≤20% of LLOQ) [35]. In blank samples, peak areas at M1 retention times were below 14.61% of the corresponding LLOQ value, while the IS peak area was ≤0.08% of the LLOQ value. These results confirm that the endogenous interference does not compromise the selectivity or accuracy of the method.
Hemolyzed selectivity was evaluated using six sources of hemolyzed plasma. To simulate severe hemolysis, 2% hemolyzed beagle dog whole blood was added to non-hemolyzed blank plasma. Under these conditions, interference at the retention times of LY104, M1, and the IS was below 4.12%, 14.07%, and 0.04%, respectively. All values fell within ICH M10 limits (≤20% of LLOQ for analytes, ≤5% for the IS) [35], demonstrating that hemolysis does not compromise the selectivity or accuracy of the method for quantifying LY104 and M1 in beagle dog plasma.
2.3. Linearity and Sensitivity
Calibration curves for LY104 and M1 were constructed over the concentration range of 20–2000 ng/mL. Peak area ratios (analyte/IS) were plotted against nominal concentrations, and weighted (1/x2) least-squares regression was applied. Representative regression equations and correlation coefficients (R2) are shown in Table 2. All curves exhibited good linearity, with R2 values exceeding 0.99. Notably, this range (20–2000 ng/mL) represents a substantial extension compared with our previously reported method in rat plasma (20–1200 ng/mL) [31], enabling accurate quantification at the higher concentrations encountered in the dog pharmacokinetic studies.
Table 2.
Regression parameters for typical calibration curves of LY104 and M1 in beagle dog plasma.
The LLOQ was set at 20 ng/mL for both analytes, where the signal-to-noise ratio (S/N) consistently exceeded 10. At this level, six replicate analyses gave the intra-day and inter-day accuracy deviations of −4.90% for LY104 and 11.80% for M1, with corresponding precision (RSD) values of 6.26% and 9.11%, respectively. All results fell within the acceptance limits of ±20% for accuracy and ≤20% for precision (RSD). These findings confirm that the method is sufficiently sensitive for reliable quantification of LY104 and M1 at low concentrations.
2.4. Accuracy and Precision
The intra-day and inter-day accuracy and precision for LY104 and M1 are summarized in Table 3. Individual batch-level accuracy and precision data for LY104 and M1 are provided in Tables S1 and S2. For four quality control (LLOQ, LQC, MQC, and HQC) samples, the intra-day and inter-day relative standard deviations (RSDs) ranged from 2.19% to 14.02% for both analytes. The relative errors (REs) for accuracy at all QC levels ranged from −11.58% to 11.80%. All measured values met the ICH M10 acceptance criteria [35]. These findings confirm that the developed method offers satisfactory accuracy, precision, and reproducibility for quantifying LY104 and M1 in beagle dog plasma.
Table 3.
Intra- and inter-day precision and accuracy for LY104 and M1 in beagle dog plasma.
2.5. Stability
The stability of LY104 and M1 in beagle dog plasma was evaluated at LQC and HQC levels under various conditions (Table 4). Both analytes remained stable under the following conditions: three freeze–thaw cycles, 2 h at room temperature, 174 days at −80 °C, and 12 h in the autosampler at 20 °C. Across all tested conditions, RSD values did not exceed 8.67%, and RE values ranged from −12.04% to 13.89%. These results indicate that LY104 and M1 maintain adequate stability throughout sample storage, processing, and analysis, with no appreciable degradation.
Table 4.
Stability of LY104 and M1 in beagle dog plasma under various storage conditions (n = 3).
For stock solutions kept at room temperature for 12 h, stability values for LY104, M1, and the IS were −1.98%, −0.80%, and 12.56%, respectively. After 7 days at −20 °C, values were −0.1% (LY104), −0.43% (M1), and 11.49% (IS). For working solutions held at room temperature for 12 h, ULOQ and LLOQ stability values ranged from −2.92% to 3.54% for LY104, and from −1.23% to 3.71% for M1; the IS working solution showed a value of 7.05%. After 7 days at 2–8 °C, ULOQ and LLOQ stability values were 2.49% and 3.51% for LY104, and 1.16% and 4.19% for M1; the IS working solution gave 10.98% under the same conditions. All measured values met predefined acceptance criteria, confirming that stock and working solutions remained stable. The detailed results are summarized in Table S3.
2.6. Reproducibility
Injection reproducibility was evaluated by storing calibration curves and processed QC samples (LQC and HQC) in the autosampler at 20 °C for 24 h prior to reinjection. As summarized in Table S4, the RSD for both LY104 and M1 was ≤7.64%, and RE values remained within ±6.15%. These results were acceptable, indicating that no correction was required.
2.7. Recovery and Matrix Effect
Extraction recovery of LY104 and M1 was determined by comparing peak areas of extracted QC samples with unextracted standards at matching concentrations (Table 5). Mean recoveries for LY104 at low, medium, and high concentrations were 102.18 ± 1.86%, 101.63 ± 0.95%, and 101.31 ± 0.75%, respectively, while corresponding values for M1 were 105.56 ± 1.54%, 98.30 ± 1.63%, and 97.73 ± 0.72%. The IS showed a recovery of 108.94 ± 2.02% (Table S5). These results indicate that recoveries for all analytes were consistent and concentration-independent, falling within acceptable limits.
Table 5.
Recovery and matrix effect of LY104 and M1 in beagle dog plasma.
Matrix effects were assessed using low, medium, and high QC samples prepared with plasma from at least six individual beagle dogs. Across these six batches, RSD values were below 3.22% for LY104 and below 5.59% for M1 (Table 5). These findings confirm that there was no significant matrix-related enhancement or suppression, demonstrating method reliability for quantitative analysis.
Hemolyzed matrix effects were evaluated by spiking 2% hemolyzed beagle dog whole blood into non-hemolyzed blank plasma to simulate severe hemolysis. Hemolyzed matrix effects were assessed using low and high QC samples. As shown in Table 5, neither LY104 nor M1 exhibited significant hemolytic matrix effects, confirming that hemolysis does not interfere with the accurate quantification.
2.8. Dilution Integrity and Carry-Over
Dilution integrity was assessed using plasma samples spiked at 10,000 ng/mL (above the ULOQ), which were diluted 100-fold with blank plasma. RSD values for LY104 and M1 were 1.39% and 2.15%, respectively, with corresponding RE values of 3.61% and –1.87%. All measured values fell within the acceptable limit of ±15%, confirming that samples above the ULOQ can be reliably quantified after appropriate dilution.
Carry-over was evaluated by injecting a blank plasma sample immediately after the ULOQ standard. Residual peaks at the retention times of LY104, M1, and the IS corresponded to 10.91%, 16.51%, and 0.04% of their respective LLOQ peak areas, all below the acceptance criteria (20% for analytes, 5% for the IS). These results demonstrate that carry-over does not compromise the accuracy of sample analysis.
2.9. Whole Blood-to-Plasma Partition Ratio (Bp)
The Bp of LY104 was measured in beagle dog blood at 200, 1000, and 5000 ng/mL. These concentrations were selected to span the plasma concentration range observed in the dog pharmacokinetic studies, from a low level representative of the late elimination phase to a level approximating the upper end of the observed Cmax, with an intermediate concentration covering the mid-range, so that the concentration dependence of Bp could be assessed across the relevant exposure range [40]. The blood-to-plasma partition coefficient (Bp) of LY104 was calculated using Equation 2, where H is the hematocrit (0.46 for dogs) and Ce/Cp is the measured red blood cell-to-plasma concentration ratio. The mean Bp was 0.58 ± 0.01, showing no concentration dependence (Table 6). The directly measured whole-blood-to-plasma concentration ratio (Cb/Cp) was 0.42–0.47, and the red blood cell-to-plasma concentration ratio was 0.07–0.10, indicating that LY104 distributes predominantly in plasma with minimal uptake into red blood cells. Individual whole-blood, red-blood-cell, and plasma concentrations used for Bp calculation are provided in Table S6. The calculated Bp and the directly measured Cb/Cp are reported together as complementary estimates; small numerical differences between them are attributable to the different calculation pathways, including residual plasma trapped in the red-cell pellet. These findings demonstrate that plasma concentration is a reliable surrogate for systemic exposure of LY104, which supports the use of plasma rather than whole blood for pharmacokinetic analysis and human exposure prediction.
Table 6.
Distribution of LY104 in whole blood, plasma, and blood cells of beagle dogs (Mean ± SD, n = 3).
The blood-to-plasma partition ratio for M1 was not determined because M1 is predominantly distributed in plasma due to its physicochemical properties (higher polarity and lower lipophilicity compared with LY104). Moreover, the plasma concentration of M1 is directly correlated with its pharmacological activity, and its elimination is primarily via renal excretion. Therefore, the Bp value for LY104, which reflects the parent drug’s distribution and clearance pathways, is sufficient for the purpose of supporting PBPK modeling and FIH dose selection. Future studies may investigate the Bp of M1 if its blood cell distribution becomes a concern.
2.10. Pharmacokinetic Studies
The validated LC-MS/MS method was successfully applied to characterize the pharmacokinetics of LY104 and its active metabolite M1 in beagle dog plasma following single and multiple intravenous infusions.
2.10.1. Single-Dose Administration
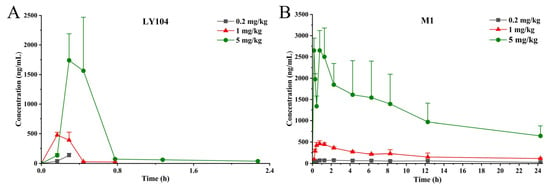
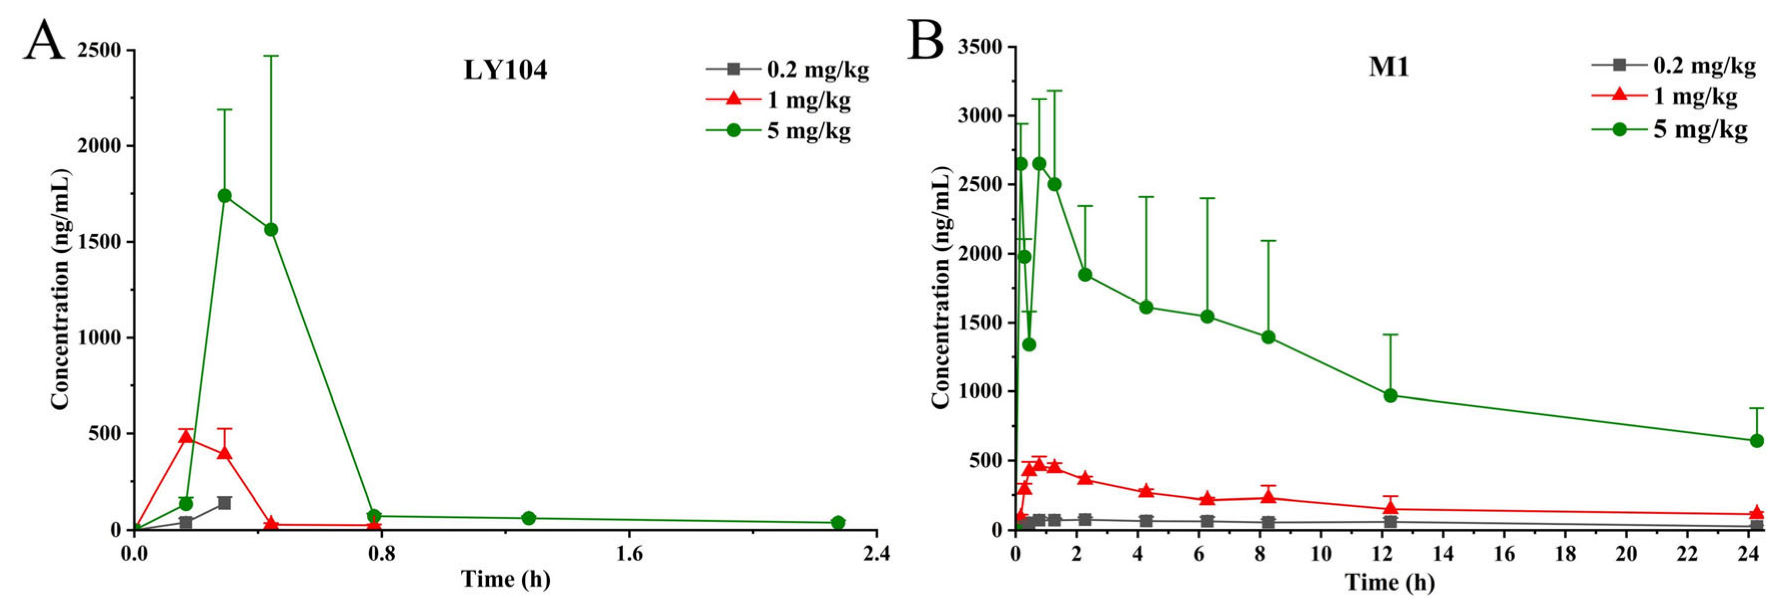
Following single intravenous infusion of LY104 at 0.2, 1, and 5 mg/kg, mean plasma concentration-time profiles are shown in Figure 3.
Figure 3.
Mean plasma concentration-time profiles of LY104 (A) and M1 (B) in beagle dog after a single intravenous infusion of LY104 at 0.2, 1, and 5 mg/kg. Blood samples were collected at pre-dose (0), at 10 min after infusion initiation (during infusion), immediately after infusion completion (within 1 min), and at 10 min, 30 min, 1 h, 2 h, 4 h, 6 h, 8 h, 12 h, and 24 h after the end of infusion. For graphical presentation, a representative infusion duration of 17.5 min (the mean of the observed infusion durations) was used to construct the time axis. The absolute time points shown represent 17.5 min plus the corresponding post-infusion time. Mean and SD at each time point were calculated by aligning individual animal data to their actual post-infusion time across all animals in each dose group. BLOQ (below the limit of quantification) data points were omitted from the profile when fewer than three animals had quantifiable concentrations at a given time point. Data are presented as mean ± SD (n = 6, equal males and females).
Pharmacokinetic parameters were calculated by non-compartmental analysis using DAS 3.0 software (Table 7). Individual-animal PK parameters for the 0.2–5 mg/kg dose are provided in Tables S7–S9. LY104 was rapidly cleared, with t1/2 values ranging from 0.14 to 2.51 h. In contrast, M1 exhibited much longer t1/2 values (12.37–44.95 h), indicating sustained exposure of the active metabolite. Cmax values increased dose-dependently: from 137.34 μg/L to 2152.99 μg/L for LY104, and from 92.40 μg/L to 2812.70 μg/L for M1. LY104 reached peak concentrations rapidly (Tmax = 0.22–0.41 h), while M1 Tmax ranged from 0.56 to 3.71 h, confirming rapid formation from the parent drug. AUC0–t increased from 15.96 to 783.18 h·μg/L for LY104 and from 1013.08 h·μg/L to 29,208.51 h·μg/L for M1, reflecting total systemic exposure across the dose range.
Table 7.
Pharmacokinetic parameters of LY104 and M1 after single intravenous infusion of LY104 in beagle dogs (Mean ± SD, n = 6).
The most striking finding of the single-dose study was the extremely rapid clearance of LY104. Plasma concentrations fell below the LLOQ (20 ng/mL) within 1–4 h post-dose depending on the dose level; at 1 mg/kg, most animals were already below the LLOQ by 1 h post-dose, and even at 5 mg/kg, detectable concentrations persisted only up to 4 h in some animals. The reported t1/2 values (0.14–2.51 h) were therefore calculated from the early elimination phase and should be interpreted with caution. A likely biological basis for this rapid clearance is the presence of a labile ester bond in LY104, which is susceptible to hydrolysis by plasma and tissue esterases; LY104 therefore behaves in part like a prodrug, with a short systemic residence time, being rapidly converted to M1, which retains PDE4 affinity and provides the sustained exposure observed in the M1 concentration-time profiles. This interpretation is consistent with the marked species differences in plasma esterase activity, since dog plasma has substantially lower esterase activity than rat or human plasma [32,33], so clearance in dogs may be slower than would be expected in humans, a difference that is directly relevant to allometric scaling and FIH dose projection. The apparent dose-dependent prolongation of half-life may be consistent with, but does not establish, saturation of clearance pathways at higher doses.
The terminal-phase estimates should be interpreted with caution. Because sampling extended only to 24 h, M1 concentrations at 5 mg/kg remained measurable to 24 h, but the terminal decline was variable among animals, and the half-life estimate should therefore be regarded as apparent. The reported M1 t1/2 at 5 mg/kg (44.95 ± 70.58 h) is an apparent value strongly influenced by individual animals with a slow terminal decline and requires confirmation with longer sampling. Consistent with this, the percentage of AUC extrapolated beyond the last measurable concentration was low at 0.2 and 1 mg/kg but increased at 5 mg/kg; accordingly, AUC0–t rather than AUC0–∞ is considered the more reliable exposure measure for M1 at this dose. Individual-animal concentration-time data are provided in Tables S10–S17.
The variability in M1 exposure and half-life at the highest dose level (5 mg/kg) deserves comment. The relatively high standard deviations observed for M1 t1/2 (44.95 ± 70.58 h) and AUC (29,208.51 ± 10,381.50 h·μg/L) at this dose may be attributed to several factors. First, inter-individual differences in esterase activity could lead to variable rates of LY104 conversion to M1, particularly when enzyme systems approach saturation at higher doses. Second, variations in the distribution volume of M1, which, as carboxylic acid metabolite of LY104, would be expected to be more polar and less lipophilic than the parent drug on the basis of its structure, may contribute to the observed differences in terminal half-life among individual animals. Third, the small sample size (n = 6) per group increases the sensitivity of summary statistics to individual outliers, which may have influenced the mean values. Despite this variability, the dose-normalized AUC and Cmax values for M1 across the three dose groups did not show statistically significant differences (ANOVA, p > 0.05), indicating that the dose-proportionality assessment remains reliable. Nevertheless, the higher variability at the top dose warrants cautious interpretation and should be confirmed in future clinical studies with larger sample sizes.
2.10.2. Dose Proportionality
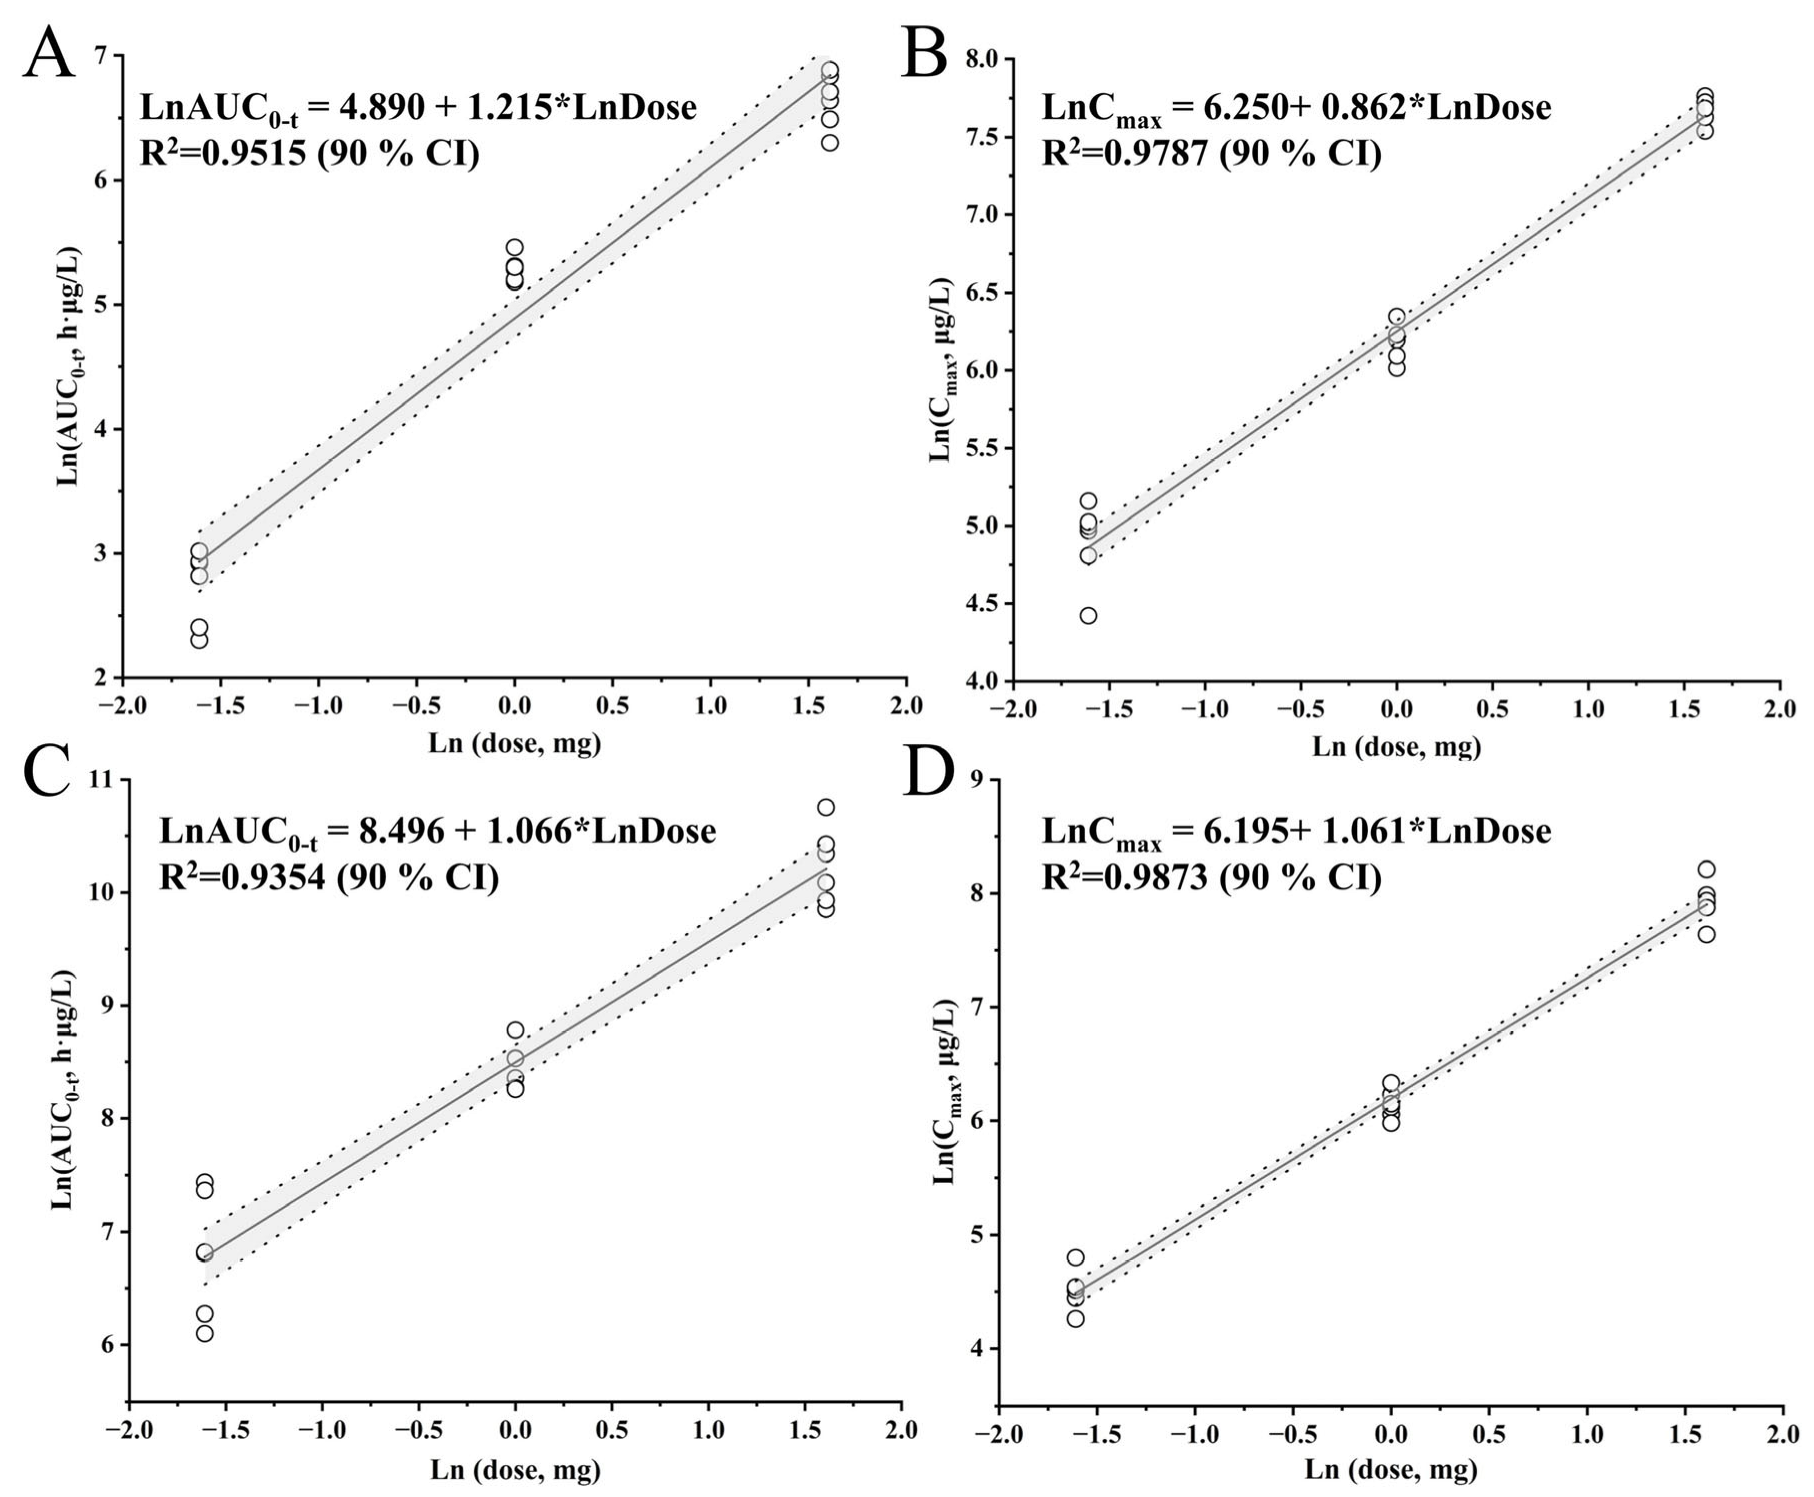
Dose proportionality was evaluated using the power model: ln(PK) = β0 + β1·ln(dose), where PK represents AUC0–t or Cmax, and β1 is the dose proportionality coefficient [41]. The 90% confidence interval (CI) of β1 was compared with the acceptance interval [1 + ln(θL)/ln(r), 1 + ln(θH)/ln(r)], where θL = 0.80 and θH = 1.25 (FDA guidelines [41,42,43]), and r is the maximum dose ratio (r = 25), yielding an acceptance interval of (0.931, 1.069). Dose proportionality was considered established if the 90% CI of β1 fell entirely within this range [44,45,46,47]. Dose-proportionality analysis was based on AUC0–t, which is the more reliable exposure measure at the highest dose given the limited terminal-phase sampling described above.
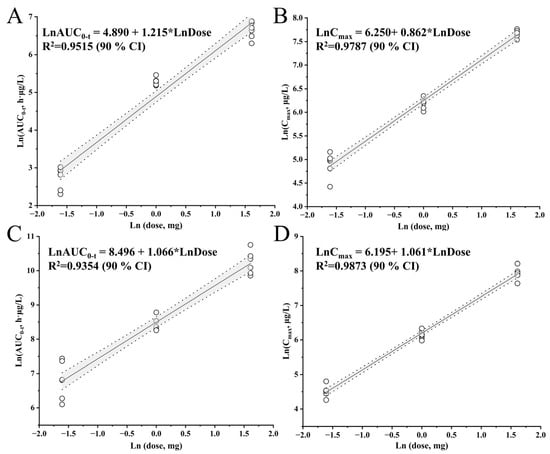
For LY104, the estimated β1 (90% CI) for Cmax and AUC0–t were 0.862 (0.808, 0.916) and 1.215 (1.099, 1.331), respectively. For M1, the corresponding values were 1.061 (1.010, 1.112) for Cmax and 1.066 (0.948, 1.185) for AUC0–t (Figure 4 and Table 8). Individual-animal AUC0–t and Cmax values and their ln-transformed values used in the power-model regression are provided in Table S18. These results indicate that neither LY104 nor M1 exhibited dose-proportional pharmacokinetics over the 0.2–5 mg/kg range. Because the 90% confidence intervals of β1 for LY104 Cmax, LY104 AUC0–t, and M1 Cmax fell outside the pre-specified acceptance interval (0.931, 1.069), dose proportionality was not demonstrated over the 0.2–5 mg/kg range. This is an empirical finding and does not, by itself, establish the mechanism responsible for the deviation.
Figure 4.
Dose proportionality of LY104 and M1 in beagle dogs after a single intravenous infusion of LY104 at 0.2, 1, and 5 mg/kg (n = 6; equal males and females). (A) LY104-AUC0–t; (B) LY104-Cmax; (C) M1-AUC0–t; (D) M1-Cmax.
Table 8.
Assessment of dose proportionality of LY104 and M1 based on the power model.
Dose proportionality was not demonstrated for LY104 or M1 over 0.2–5 mg/kg; the mechanism underlying this deviation remains to be established. The observed non-linear pharmacokinetics of LY104 and M1 warrant consideration of potential underlying mechanisms. For LY104, the deviation from dose proportionality could potentially reflect saturation of metabolic enzymes involved in its rapid biotransformation to M1 at higher doses. This is particularly relevant for LY104, as esterase-mediated hydrolysis is known to exhibit marked species differences, with dog plasma showing substantially lower esterase activity than rat or human plasma [32,33]. The slower metabolism of LY104 in dogs compared with rats may contribute to the different pharmacokinetic profiles observed between species. Since LY104 undergoes extensive first-pass metabolism via esterase-mediated hydrolysis (most likely by plasma esterases, although the specific enzymes remain to be identified), the metabolic capacity may become saturated when plasma concentrations exceed a certain threshold, leading to a disproportionate increase in exposure.
Additionally, the high plasma protein binding (>99%) of LY104 raises the possibility that saturation of binding sites at higher concentrations could contribute to non-linear disposition. For M1, the non-linear profile could hypothetically reflect saturation of its formation pathway, as M1 is produced from LY104, or saturation of subsequent elimination processes such as renal clearance or further metabolism. It is also plausible that the formation of other minor, unquantified metabolites becomes more prominent at higher doses, contributing to the observed deviation.
These hypotheses are not mutually exclusive, and the present data do not allow them to be distinguished. Confirmation would require in vitro enzyme kinetic studies (for example, determination of Km and Vmax in dog plasma and liver preparations) and comprehensive metabolite profiling, which are outside the scope of this study. Given the high variability observed in M1 half-life at the highest dose, these interpretations should be regarded as preliminary. These findings provide a basis for designing the mechanistic studies needed to test these hypotheses.
2.10.3. Multiple-Dose Administration
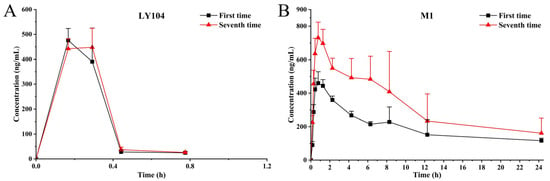
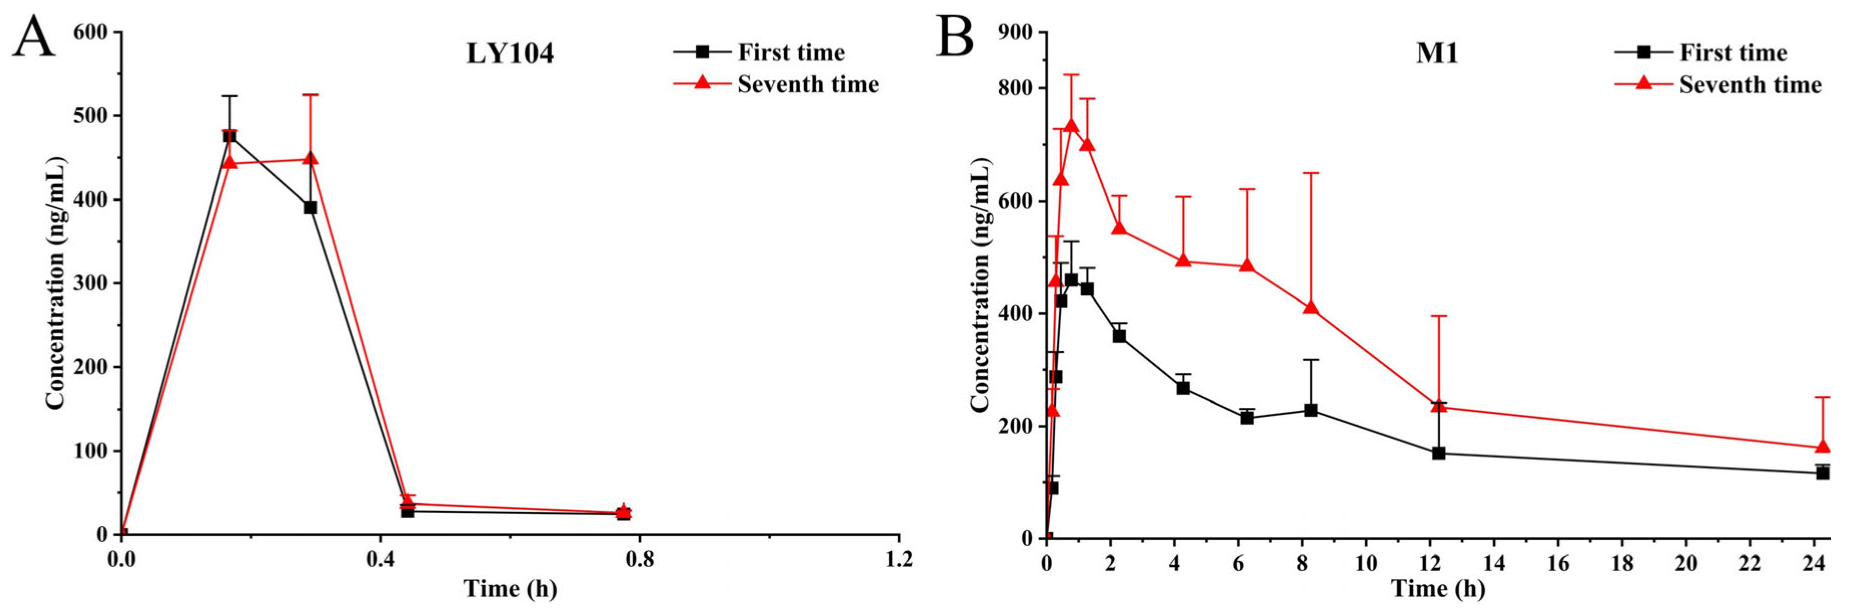
After once-daily intravenous infusion of LY104 at 1 mg/kg for seven consecutive days, plasma concentration-time profiles on Days 1 and 7 are presented in Figure 5, with corresponding parameters in Table 9. Individual-animal PK parameters for 1 mg/kg on Day 1 and Day 7 are provided in Table S8.
Figure 5.
Mean plasma concentration-time profiles of LY104 and M1 in beagle dogs after once-daily intravenous infusion of LY104 (1 mg/kg) for seven consecutive days. Data are presented as mean ± SD (n = 6, equal males and females). (A) Comparative profiles of LY104 on Day 1 vs. Day 7; (B) Comparative profiles of M1 on Day 1 vs. Day 7. BLOQ data points were omitted from the profile when fewer than three animals had quantifiable concentrations at a given time point.
Table 9.
Pharmacokinetic parameters of LY104 and M1 in beagle dogs following multiple-dose intravenous administration of LY104 (1 mg/kg once daily) on Day 7 (Mean ± SD, n = 6).
For LY104, AUC0–t and Cmax on Day 1 were 199.23 ± 20.26 h·μg/L and 486.32 ± 55.83 μg/L, respectively, comparable to Day 7 values (187.33 ± 11.99 h·μg/L and 483.48 ± 36.51 μg/L). For M1, AUC0–t and Cmax increased slightly from Day 1 (4781.76 ± 1009.23 h·μg/L and 469.31 ± 58.99 μg/L) to Day 7 (7938.44 ± 3057.94 h·μg/L and 783.44 ± 92.70 μg/L). The accumulation factor based on AUC0–t was 0.95 ± 0.10 for LY104 and 1.64 ± 0.40 for M1 (Table 9). These findings demonstrate that LY104 does not accumulate after repeated dosing, while M1 shows mild accumulation. The moderate increase in M1 exposure should be considered in repeated-dose settings.
The accumulation factor (R) for M1 was 1.64, indicating mild accumulation after seven daily doses. This value is below the 2-fold threshold commonly applied in repeated-dose toxicokinetic assessment (ICH M3(R2)) [26]. Steady-state concentrations of M1 were reached by Day 7, with no evidence of a continuing upward trend. However, the clinical relevance of this accumulation cannot be established from the accumulation ratio alone and will require exposure-response and exposure-toxicity data from toxicology studies and clinical trials. For LY104, the accumulation factor of 0.95 confirms no accumulation. DF was calculated for each animal as (Css,max − Css,min)/Css,av × 100%, with Css,av = AUC0–τ/τ(τ=24h). Group means and SDs were calculated from the six individual values. Individual-animal parameters and calculations are provided in Table S19.
2.11. Incurred Sample Reanalysis (ISR)
For both LY104 and M1, 92.86% of the reanalyzed samples had concentration differences within ±20% of the mean of the initial and repeat values. This result meets the ICH M10 acceptance criteria [35]. These findings confirm that the established method is reproducible and reliable for analyzing actual biological samples.
2.12. Translational Implications for PBPK Modeling and FIH Selection
The pharmacokinetic data from this study provide specific inputs for PBPK modeling. CLz and Vz for LY104 and M1 provide the clearance and distribution inputs for allometric scaling and for constructing a perfusion-limited PBPK model; the dose-dependent AUC and Cmax, together with the failure to demonstrate dose proportionality, indicate that saturable clearance terms should be incorporated rather than assuming linear kinetics; the Bp value provides the plasma-to-whole-blood conversion factor for the blood compartment; and the accumulation data for M1 (R = 1.64) inform the choice of dosing interval when simulating repeated-dose scenarios. The non-linear exposure observed at higher doses indicates that saturable processes should be considered when constructing PBPK models. Additionally, M1 showed mild accumulation (R = 1.64) that was below the 2-fold threshold commonly applied in repeated-dose toxicokinetic assessment; however, the clinical relevance of this accumulation cannot be established from the accumulation ratio alone and requires exposure-response and exposure-toxicity data. Plasma protein binding of LY104 in beagle dog plasma was >99% [31], consistent with its predominantly plasma distribution (Bp = 0.58) and its relatively small volume of distribution. The pharmacokinetic parameters reported here are total plasma concentrations; free concentrations were not measured. Given the high protein binding of LY104 (>99%), free exposure should be interpreted with caution, and protein binding of M1 was not determined in this study.
The designation of M1 as the predominant metabolite is supported by our previously published study [31], in which M1 was the only metabolite detected in plasma, and by the present observation that M1 accounted for the great majority of total exposure after intravenous dosing in dogs, with no other metabolite quantified. Untargeted metabolomics and comprehensive metabolite profiling in dogs were not performed in the present study and remain to be addressed in future work.
Several data requirements for robust PBPK modelling remain outside the scope of the present study. LogP, pKa, and comprehensive metabolite profiling, and definitive identification of the enzyme(s) responsible for the hydrolysis of LY104 to M1 were not determined here and remain to be addressed in future work. In contrast, human plasma protein binding and liver microsomal stability have already been generated and reported [31]. The present study provides non-rodent PK parameters, the Bp value, and assessments of dose proportionality and accumulation that are suitable for subsequent PBPK modelling and FIH dose projection. These data do not, by themselves, establish a specific human dosing regimen.
3. Materials and Methods
3.1. Chemicals and Reagents
LY104 and M1 (>99% purity) were synthesized and purified by Marine Biomedical Research Institute of Qingdao. N-Benzoyl-L-arginine ethyl ester hydrochloride (BAEE; purity ≥ 98%) was selected as the internal standard (IS) due to its comparable chromatographic behavior and similar structural features with LY104 (guanidine group, benzene ring, ester bond) and was obtained from Aladdin Biochemical Technology Co., Ltd. (Shanghai, China). HPLC-grade methanol and acetonitrile were purchased from Suerida Biotechnology Co., Ltd. (Shanghai, China)., while HPLC-grade isopropanol was supplied by Macklin Biochemical Technology Co., Ltd. (Shanghai, China). Formic acid was acquired from Thermo Fisher Scientific Co., Ltd. (Shanghai, China). and distilled water was sourced from Guangzhou Watson Food & Beverage Co., Ltd. (Guangzhou, China). All other chemicals and reagents were of analytical grade and used without further purification.
3.2. Chromatographic and Mass Spectrometric Conditions
An Agilent 1290 Infinity series LC system (Agilent Technologies, Waldbronn, Germany), comprising a G7120A pump, a G7167B autosampler, and a G7116B column thermostat, was used for chromatographic separation. Mass spectrometric detection was conducted on an Agilent G6460C triple quadrupole mass spectrometer (Agilent Technologies, Waldbronn, Germany) equipped with an electrospray ionization (ESI) source. The instrument was operated with a polarity-switching time of 30 ms. MRM transitions were acquired in two time segments: LY104 (m/z 372.3 → 187.1) and BAEE (m/z 307.3 → 105.1) were monitored in positive mode, while M1 (m/z 257.1 → 213.1) was monitored in negative mode. The 30 ms switching time allowed acquisition of sufficient data points across each chromatographic peak without distortion or loss of area repeatability. Under these conditions, the instrument operated stably throughout method validation and sample analysis, with no corona discharge observed and no drift in retention time or response. System suitability and carry-over were verified within each analytical batch.
Separation was carried out on a CAPCELL PAK C18 column (2.0 × 50 mm, 5 μm; Osaka Soda, Osaka, Japan) thermostated at 30 °C. The mobile phase consisted of water (phase A) and acetonitrile (phase B), each supplemented with 0.1% (v/v) formic acid, delivered at a flow rate of 0.4 mL/min. The gradient program was set as follows: 0–0.5 min, 5% B; 0.5–2.0 min, 5–35% B; 2.0–3.0 min, 35–95% B; 3.0–3.5 min, 95% B; 3.5–3.8 min, 95–5% B; followed by 1.2 min re-equilibrium at 5% B. The total run time was 5.0 min. The injection volume was 5 μL, and the autosampler temperature was maintained at 20 °C.
3.3. Preparation of Stock and Working Solutions
Accurately weighed reference standards of LY104 and M1 were each dissolved in dimethyl sulfoxide (DMSO) to obtain individual stock solutions at a concentration of 10 mg/mL. Equal volumes of these two stock solutions were then mixed and vortexed for 1 min to generate a combined stock solution containing both analytes at 5 mg/mL. This combined solution was serially diluted with 60% acetonitrile in water to produce working solutions for calibration curves, with final concentrations ranging from 2 to 20 μg/mL. Quality control (QC) working solutions were prepared in the same manner at four concentration levels: lower limit of quantification (LLOQ), low QC (LQC), medium QC (MQC), and high QC (HQC). A separate stock solution of the IS was prepared in DMSO at 10 mg/mL, which was subsequently diluted with acetonitrile to obtain an IS working solution at a concentration of 50 ng/mL. All stock solutions were stored at −20 °C, while working solutions were kept at 4 °C until further use.
3.4. Preparation of Calibration Standards and Quality Control (QC) Samples
To prepare calibration standards, 5 μL of each corresponding working solution was added to 50 μL of blank beagle dog plasma, yielding final concentrations of 20, 40, 100, 200, 500, 1000, and 2000 ng/mL for both LY104 and M1. Each sample was briefly vortexed (30 s) before adding 100 μL of acetonitrile containing the IS (BAEE, 50 ng/mL) for protein precipitation. After vortexing for 1 min, the mixture was centrifuged at 14,000 rpm for 10 min at 4 °C. A 120 μL portion of the supernatant was then transferred to a fresh tube and re-centrifuged under the same conditions. Following this second centrifugation, 100 μL of the supernatant was transferred to an autosampler vial, and a 5 μL aliquot was injected onto the LC-MS/MS column for analysis.
Quality control (QC) samples were prepared at four concentration levels: LLOQ (20 ng/mL), LQC (40 ng/mL), MQC (800 ng/mL), and HQC (1800 ng/mL), using the same procedure described for the calibration standards.
3.5. Method Validation
The analytical method was re-validated in beagle dog plasma in accordance with ICH M10 [35]. Validation parameters included selectivity, linearity, accuracy, precision, recovery, matrix effect, carry-over, dilution integrity, stability, and ISR. Acceptance criteria were identical to those used for the rat plasma method [31]. The acceptance criteria applied to each validation parameter are summarized in Table S20.
3.5.1. Selectivity
Selectivity was examined using blank plasma from six different beagle dogs. Hemolyzed plasma samples were prepared by adding 2% (v/v) hemolyzed whole blood to blank plasma to mimic severe hemolysis. Six such hemolyzed blank samples were processed and analyzed. Per ICH M10 [35], selectivity is deemed acceptable when the endogenous signal at each analyte’s retention time is below 20% of the LLOQ peak area and the IS signal is below 5% of the LLOQ peak area.
3.5.2. Calibration Curve and Sensitivity
For the dog plasma re-validation, calibration curves were constructed by plotting analyte/IS peak area ratios versus nominal concentrations and fitting with weighted (1/x2) linear regression. Both analytes displayed linear behavior from 20 to 2000 ng/mL (R2 > 0.99). This range extends the 20–1200 ng/mL interval previously validated in rat plasma [31]. The LLOQ, defined as the lowest level meeting accuracy and precision criteria, was 20 ng/mL for LY104 and M1. At this level, the signal-to-noise ratio (S/N) consistently exceeded 10, and six replicate analyses produced accuracy within ±20% and relative standard deviation (RSD) ≤ 20%.
3.5.3. Accuracy and Precision
Accuracy and precision were determined both within a single day and across days by measuring six replicates of QC samples at four levels (LLOQ, LQC, MQC, HQC) in three independent validation batches. Accuracy was calculated as relative error (RE, %), and precision as relative standard deviation (RSD, %). Per ICH M10 [35], LLOQ samples required RE within ±20% and RSD ≤ 20%, while LQC, MQC, and HQC samples needed RE within ±15% and RSD ≤ 15%.
3.5.4. Stability
Stability of LY104 and M1 in dog plasma was tested at LQC and HQC concentrations under multiple storage scenarios. Short-term stability was measured after 2 h at ambient temperature. Post-preparative stability was assessed by keeping processed samples at room temperature for 6 h and in the autosampler at 20 °C for 12 h. Long-term stability was examined after 174 days at −80 °C. Freeze–thaw stability was evaluated over three full cycles of freezing at −80 °C and thawing at room temperature. Stability was assessed by comparing stored samples with freshly prepared samples, with acceptance set at ±15% deviation from nominal concentrations at each QC level.
The stability of stock and working solutions was also verified. The percent stability between stored and freshly prepared samples was calculated using the following Equation (1).
The acceptance criterion for stability was defined as a deviation within ±15%.
3.5.5. Recovery and Matrix Effect
Extraction recovery of LY104 and M1 from dog plasma was determined by comparing analyte/IS peak area ratios of extracted QC samples (LQC, MQC, HQC; n = 6 per level) with those of blank plasma samples spiked after extraction at the same concentrations. Matrix effects were evaluated at least using low and high QC samples (n ≥ 3 per level) prepared in plasma from six different lots. For each matrix source, the relative error (RE) was required to remain within ±15% of the nominal concentration, and the RSD was not to exceed 15%. Hemolyzed matrix effects were evaluated using LQC and HQC samples (n = 3 per level) prepared in hemolyzed plasma.
The recovery and matrix effect of the IS were evaluated following the same experimental protocol. All assessments complied with the ICH M10 guidelines [35].
3.5.6. Dilution Integrity and Carry-Over
Dilution integrity was tested by diluting 10,000 ng/mL QC samples 100-fold with blank plasma; accuracy and precision had to be within ±15% of the nominal concentration. Carry-over was assessed by injecting a blank plasma sample right after the ULOQ standard. Residual peak areas at the LY104 and M1 retention times were compared with the LLOQ peak area. Per ICH M10 [35], carry-over must not exceed 20% of the LLOQ signal for analytes and 5% for the IS.
3.5.7. Reproducibility
Reinjection reproducibility was assessed by re-injecting processed calibration curves and QC samples (LQC, HQC; n = 3 per level) after 24 h in the autosampler at 20 °C. RE remained within ±15% and RSD ≤ 15%, meeting ICH M10 acceptance criteria [35].
3.6. Blood-to-Plasma Partitioning in Beagle Dogs
Freshly collected heparinized whole blood from beagle dogs was pre-cooled on ice for 5 min. LY104 working solution was then spiked into the blood to reach final concentrations of 200, 1000, and 5000 ng/mL. The mixtures were gently shaken at 750 rpm and incubated on ice for 30 min. After incubation, a 200 μL aliquot was taken as the whole blood sample, and the remaining blood was centrifuged at 8000 rpm for 10 min at 4 °C to separate plasma from red blood cells.
For analysis, 50 μL of each sample type (whole blood, plasma, or red blood cells) was mixed with 5 μL of acetonitrile-water (6:4, v/v) and 100 μL of acetonitrile containing the IS (BAEE, 50 ng/mL). The resulting mixture was vortexed for 30 s and then centrifuged at 14,000 rpm for 10 min at 4 °C. A 120 μL portion of the supernatant was re-centrifuged and transferred to an autosampler vial for LC-MS/MS analysis.
The whole blood-to-plasma partition ratio (Bp) was calculated using the following Equation (2):
where H is the hematocrit value (0.46 for dog) [48], Ce is the concentration of LY104 in red blood cells, and Cp is the concentration of LY104 in plasma. Bp is therefore a hematocrit-based estimate of whole-blood-to-plasma partitioning; the directly measured whole-blood/plasma ratio is reported separately in Table 6 for comparison. All experiments were performed in triplicate.
3.7. Pharmacokinetics
The validated LC-MS/MS method was successfully employed to determine LY104 and M1 concentrations in beagle dog plasma samples collected from single-dose (low, medium, and high) and multiple-dose pharmacokinetic studies. All animal experiments were carried out in accordance with the Institutional Animal Care and Use Committee (IACUC) of the Shandong Academy of Pharmaceutical Sciences (Protocol No. IACUC-2024-397). Healthy beagle dogs (6–10 kg, 6–10 months old, both sexes) were obtained from Weifang Shengnuo Experimental Animal Breeding Co., Ltd. (Weifang, China; Production License No. SCXK (Lu) 2023-0001) and housed individually under controlled environmental conditions (22 ± 2 °C, 50 ± 10% relative humidity, 12 h light/dark cycle) with free access to food and water. After a 7-day acclimatization period, eighteen healthy beagle dogs (6–10 kg, equally divided by sex) were assigned to three groups (n = 6 per group, 3 males and 3 females) by body weight ranking to ensure homogeneous distribution. The sample size (n = 6 per group) was based on the minimum requirement for pharmacokinetic parameter estimation in large animals, consistent with ICH M3(R2) and previous preclinical studies. Animals were randomly assigned to dose groups using a computer-generated randomization list stratified by body weight and sex, with randomization performed by an independent person not involved in dosing or sample analysis. The test compound was dissolved in 0.9% sodium chloride injection and administered intravenously via a microinfusion pump at a flow rate of 2 mL/min. The dosing volume was 5 mL/kg for all groups; therefore, the infusion duration varied according to individual body weight (approximately 15–25 min). For the single-dose study, animals received LY104 at doses of 0.2, 1, and 5 mg/kg (corresponding to concentrations of 0.04, 0.2, and 1 mg/mL, respectively). For the multiple-dose study, LY104 was administered at 1 mg/kg once daily for seven consecutive days. No blinding was applied because the pharmacokinetic endpoints were objective and measured instrumentally by LC-MS/MS.
For the single-dose pharmacokinetic study (0.2, 1, and 5 mg/kg), approximately 0.5 mL of blood was collected from the peripheral veins at each time point. Samples were drawn into heparinized tubes at the following time points: pre-dose (0), at 10 min after infusion initiation (i.e., during infusion), immediately after completion of the infusion (within 1 min), and at 10 min, 30 min, 1 h, 2 h, 4 h, 6 h, 8 h, 12 h, and 24 h post-infusion. All post-infusion time points were defined relative to the completion of infusion for each individual animal. For the construction of the mean concentration-time profiles in Figure 3, a representative infusion duration of 17.5 min (the mean of the observed infusion durations) was used for the time axis, with individual animal data aligned to their actual post-infusion time points for mean and SD calculations.
In the multiple-dose study, LY104 was administered at 1 mg/kg once daily for seven consecutive days. Blood sampling on Days 1 and 7 followed the same schedule as described above. In addition, trough concentration samples were collected just prior to dosing (within 15 min before infusion) on Days 2, 3, 4, 5, and 6.
All blood samples were immediately centrifuged at 8000 rpm for 10 min at 4 °C and the resulting plasma was stored at −80 °C until analysis.
3.8. Incurred Sample Reanalysis (ISR)
ISR was performed to confirm method reproducibility on authentic study samples. Incurred samples were chosen from low-, medium-, and high-dose groups, covering LLOQ to near-ULOQ concentrations with roughly balanced peak and elimination phase sampling, and re-assayed in an independent run within the established stability window. The percent difference between the initial and repeat concentration measurements was calculated using the following Formula (3):
The acceptance criterion for ISR was considered satisfied if at least two-thirds (≥66.7%) of the reanalyzed samples showed a percent difference within ±20%.
3.9. Data Analysis
Plasma concentrations of LY104 and M1 were determined using calibration curves. Data acquired from LC-MS/MS analysis were processed with Agilent Quantitative Analysis B.07.00 software. Pharmacokinetic parameters were calculated using DAS 3.0 software (Drug and Statistics, Shanghai, China) based on a non-compartmental model, and were independently verified by re-analysis of the original concentration-time data. For pharmacokinetic parameter calculation, concentrations below the lower limit of quantitation were treated as zero for descriptive statistics and AUC calculation when occurring before Tmax. The terminal elimination phase was estimated from the post-peak concentrations above the LLOQ, with concentrations below the LLOQ after Tmax excluded from the calculation. Because sampling extended only to 24 h and LY104 was rapidly cleared, the number of post-peak points available for LY104 was limited (two to six points per animal), and the resulting half-life estimates for LY104 reflect the early elimination phase. For M1 at 5 mg/kg, although concentrations remained measurable to 24 h, the terminal decline was variable among animals, and the half-life estimate should therefore be regarded as apparent. We used one-way analysis of variance (ANOVA) to assess differences in pharmacokinetic parameters across multiple groups. A p value of less than 0.05 was considered statistically significant. Additional data processing and graphical plotting were performed using Microsoft Excel and Origin 8.0 (OriginLab, Northampton, MA, USA). Individual-animal concentration-time data, steady-state calculations, and the data-handling conventions used in this study are provided in the Supplementary Materials (Tables S10–S19).
4. Conclusions
A validated LC-MS/MS method for the simultaneous quantification of LY104 and M1 in beagle dog plasma was successfully applied to characterize their pharmacokinetics after single and multiple intravenous infusions. Neither analyte showed dose-proportional PK across 0.2–5 mg/kg after a single dose. With repeated dosing (1 mg/kg once daily for 7 days), LY104 showed no accumulation (R = 0.95), whereas M1 showed mild accumulation (R = 1.64); the clinical relevance of the latter remains to be established from exposure-response and exposure-toxicity data. The method provides a reliable analytical tool for preclinical ADME evaluation in beagle dogs. These data provide a basis for future PBPK modelling and FIH dose selection; they do not establish a specific human dosing regimen, and confirmation of the terminal-phase estimates for M1 will require studies with longer sampling. Although the LC-MS/MS method was originally established in rats, its extension to beagle dogs provided novel and essential PK data for a non-rodent species, filling a critical gap in the translational development of LY104.
Supplementary Materials
The following supporting information can be downloaded at https://www.mdpi.com/article/10.3390/md24110411/s1, Figure S1: Representative full-scan mass spectra of LY104, BAEE, and M1 in positive (+ESI) and negative (−ESI) electrospray ionization modes; Table S1: Inter- and intra-batch precision and accuracy for LY104; Table S2: Inter- and intra-batch precision and accuracy for M1; Table S3: Stability of LY104, M1, and IS stock and working solutions under various storage conditions (n = 3); Table S4: Reinjection reproducibility of samples stored in the autosampler for 24 h (n = 3); Table S5: Extraction recovery of the IS in beagle dog plasma (n = 9); Table S6: Individual whole blood, blood cell and plasma concentrations of LY104 in beagle dogs; Table S7: Pharmacokinetic parameters of LY104 and M1 in beagle dogs after single intravenous injections of LY104 (0.2 mg/kg, n = 6); Table S8: Pharmacokinetic parameters of LY104 and M1 in beagle dogs after the first and seventh intravenous injections of LY104 (1 mg/kg, n = 6); Table S9: Pharmacokinetic parameters of LY104 and M1 in beagle dogs after single intravenous injections of LY104 (5 mg/kg, n = 6); Table S10: The concentration of LY104 in beagle dogs after a single intravenous injection of LY104 (0.2 mg/kg) (ng/mL) (n = 6); Table S11: The concentration of M1 in beagle dogs after a single intravenous injection of LY104 (0.2 mg/kg) (ng/mL) (n = 6); Table S12: The concentration of LY104 in beagle dogs after a single intravenous injection of LY104 (1 mg/kg) (ng/mL) (n = 6); Table S13: The concentration of M1 in beagle dogs after a single intravenous injection of LY104 (1 mg/kg) (ng/mL) (n = 6); Table S14: The concentration of LY104 in beagle dogs after a single intravenous injection of LY104 (5 mg/kg) (ng/mL) (n = 6); Table S15: The concentration of M1 in beagle dogs after a single intravenous injection of LY104 (5 mg/kg) (ng/mL) (n = 6); Table S16: The concentration of LY104 in beagle dogs after the seventh intravenous injection of LY104 (1 mg/kg) (ng/mL) (n = 6); Table S17: The concentration of M1 in beagle dogs after the seventh intravenous injection of LY104 (1 mg/kg) (ng/mL) (n = 6); Table S18: Individual-animal PK values and ln-transformed values used in the power-model dose-proportionality analysis for LY104 and M1; Table S19: Steady-state pharmacokinetic parameters of LY104 and M1 in beagle dogs after seven consecutive intravenous injections of LY104 (1 mg/kg) (n = 6); Table S20: ICH M10 acceptance criteria applied in the validation of LY104 and M1 in beagle dog plasma.
Author Contributions
Conceptualization, J.Z. (Jianchun Zhao); Methodology, D.D., W.H., Y.Y.; Investigation, W.H., Y.Y., J.Z. (Jianchun Zhao); Validation, D.D., W.H., Y.Y., X.N., J.Z. (Jun Zhao), J.Z. (Jianchun Zhao); Formal Analysis, Y.Y., X.N., J.Z. (Jun Zhao); Writing—Original Draft, D.D., W.H.; Visualization, D.D.; Supervision, G.D., J.Z. (Jianchun Zhao); Resources, J.H.; Funding Acquisition, J.H.; Data Curation, J.Z. (Jianchun Zhao); Writing—Review and Editing, J.Z. (Jianchun Zhao); Project Administration, J.Z. (Jianchun Zhao). All authors have read and agreed to the published version of the manuscript.
Funding
This work was supported by National Natural Science Foundation of China (No. 82574314), Shandong Provincial Key Research and Development Program (2023CXPT092).
Institutional Review Board Statement
The animal study protocol was approved by the Institutional Animal Care and Use Committee (IACUC) of the Shandong Academy of Pharmaceutical Sciences (Protocol No. IACUC-2024-397, 2 September 2024, Jinan, China). The study was conducted in accordance with the principles of the Declaration of Helsinki and relevant institutional guidelines for the care and use of laboratory animals.
Data Availability Statement
The original contributions presented in this study are included in the article/Supplementary Materials. Further inquiries can be directed to the corresponding authors.
Conflicts of Interest
The authors declare no conflict of interest.
Abbreviations
The following abbreviations are used in this manuscript:
| AUC | Area under the drug-time curve |
| ANOVA | Analysis of variance |
| Bp | Blood-to-plasma partition ratio |
| BAEE | N-benzoyl-L-arginine ethyl ester hydrochloride |
| BLOQ | Below the limit of quantification |
| COPD | Chronic obstructive pulmonary disease |
| cAMP | Cyclic adenosine monophosphate |
| CI | Confidence interval |
| DMSO | Dimethyl sulfoxide |
| ESI | Electrospray ionization |
| FIH | First-in-human |
| HQC | High-concentration quality control |
| ICS | Inhaled corticosteroids |
| IS | Internal standard |
| ISR | Incurred sample reanalysis |
| LC-MS/MS | Liquid chromatography-tandem mass spectrometry |
| LLE | Liquid–liquid extraction |
| LLOQ | Lower limit of quantitation |
| LQC | Low-concentration quality control |
| MRM | Multiple reaction monitoring |
| MQC | Medium-concentration quality control |
| PDE4 | Phosphodiesterase 4 |
| PBPK | Physiologically based pharmacokinetic |
| PPT | Protein precipitation |
| QC | Quality control |
| RSD | Relative standard deviation |
| RE | Relative error |
| R | Accumulation factor |
| SPE | Solid-phase extraction |
| S/N | Signal-to-noise ratio |
| SD | Standard deviation |
| ULOQ | Upper limit of quantification |
| Vd | Volume of distribution |
References
- Adeloye, D.; Chua, S.; Lee, C.W.; Basquill, C.; Papana, A.; Theodoratou, E.; Nair, H.; Gasevic, D.; Sridhar, D.; Campbell, H.; et al. Global and regional estimates of COPD prevalence: Systematic review and meta-analysis. J. Glob. Health 2015, 5, 186–202. [Google Scholar] [CrossRef] [Scilit] [PubMed]
- Guarascio, A.J.; Ray, S.M.; Finch, C.K.; Self, T.H. The clinical and economic burden of chronic obstructive pulmonary disease in the USA. Clin. Outcomes Res. 2013, 5, 235–245. [Google Scholar] [CrossRef] [Scilit] [PubMed]
- Cruz, A.A.; Mortimer, K.J.; Sepulveda-Pachon, I.T.; Vroling, H.; Williams, C. Global herpes zoster burden in adults with COPD: A systematic review and meta-analysis. Eur. Respir. Rev. 2026, 35, 250167. [Google Scholar] [CrossRef] [Scilit] [PubMed]
- Agusti, A.; Celli, B.R.; Criner, G.J.; Halpin, D.; Anzueto, A.; Barnes, P.; Bourbeau, J.; Han, M.K.; Martinez, F.J.; Montes de Oca, M.; et al. Global Initiative for Chronic Obstructive Lung Disease 2023 Report: GOLD Executive Summary. Am. J. Respir. Crit. Care Med. 2023, 207, 819–837. [Google Scholar] [CrossRef] [Scilit] [PubMed]
- Ritchie, A.I.; Wedzicha, J.A. Definition, Causes, Pathogenesis, and Consequences of Chronic Obstructive Pulmonary Disease Exacerbations. Clin. Chest Med. 2020, 41, 421–438. [Google Scholar] [CrossRef] [Scilit] [PubMed]
- Yu, S.; Jia, J.; Zheng, J.; Zhou, Y.; Jia, D.; Wang, J. Recent Progress of Ferroptosis in Lung Diseases. Front. Cell Dev. Biol. 2021, 9, 789517. [Google Scholar] [CrossRef] [Scilit] [PubMed]
- Zeng, Z.; Li, T.; Liu, X.; Ma, Y.; Luo, L.; Wang, Z.; Zhao, Z.; Li, H.; He, X.; Zeng, H.; et al. DNA dioxygenases TET2 deficiency promotes cigarette smoke induced chronic obstructive pulmonary disease by inducing ferroptosis of lung epithelial cell. Redox Biol. 2023, 67, 102916. [Google Scholar] [CrossRef] [Scilit] [PubMed]
- Zeng, Q.; Zeng, J. Inhibition of miR-494-3p alleviates oxidative stress-induced cell senescence and inflammation in the primary epithelial cells of COPD patients. Int. Immunopharmacol. 2021, 92, 107044. [Google Scholar] [CrossRef] [Scilit] [PubMed]
- Zhu, J.; Kovacs, L.; Han, W.; Liu, G.; Huo, Y.; Lucas, R.; Fulton, D.; Greer, P.A.; Su, Y. Reactive Oxygen Species-Dependent Calpain Activation Contributes to Airway and Pulmonary Vascular Remodeling in Chronic Obstructive Pulmonary Disease. Antioxid. Redox Signal. 2019, 31, 804–818. [Google Scholar] [CrossRef] [Scilit] [PubMed]
- Garudadri, S.; Woodruff, P.G.; Han, M.K.; Curtis, J.L.; Barr, R.G.; Bleecker, E.R.; Bowler, R.P.; Comellas, A.; Cooper, C.B.; Criner, G.; et al. Systemic Markers of Inflammation in Smokers with Symptoms Despite Preserved Spirometry in SPIROMICS. Chest 2019, 155, 908–917. [Google Scholar] [CrossRef] [Scilit] [PubMed]
- Sharma, M.; Joshi, S.; Banjade, P.; Ghamande, S.A.; Surani, S. Global Initiative for Chronic Obstructive Lung Disease (GOLD) 2023 Guidelines Reviewed. Open Respir. Med. J. 2024, 18, e18743064279064. [Google Scholar] [CrossRef] [Scilit] [PubMed]
- Cazzola, M.; Rogliani, P.; Stolz, D.; Matera, M.G. Pharmacological treatment and current controversies in COPD. F1000Res 2019, 8, 1533. [Google Scholar] [CrossRef] [Scilit] [PubMed]
- Shaikh, A.; Ritz, J.; Casciano, J.; Palli, S.R.; Clark, B.; Dotiwala, Z.; Quint, J.K. Clinical and Economic Evaluation of Fluticasone Furoate/Umeclidinium/Vilanterol Versus Tiotropium/Olodaterol Therapy in Maintenance Treatment-Naive Patients with COPD in the US. Int. J. Chron. Obstruct. Pulmon. Dis. 2025, 20, 335–348. [Google Scholar] [CrossRef] [Scilit] [PubMed]
- Vestbo, J.; Hurd, S.S.; Agusti, A.G.; Jones, P.W.; Vogelmeier, C.; Anzueto, A.; Barnes, P.J.; Fabbri, L.M.; Martinez, F.J.; Nishimura, M.; et al. Global strategy for the diagnosis, management, and prevention of chronic obstructive pulmonary disease: GOLD executive summary. Am. J. Respir. Crit. Care Med. 2013, 187, 347–365. [Google Scholar] [CrossRef] [Scilit] [PubMed]
- Houslay, M.D.; Schafer, P.; Zhang, K.Y. Keynote review: Phosphodiesterase-4 as a therapeutic target. Drug Discov. Today 2005, 10, 1503–1519. [Google Scholar] [CrossRef] [Scilit] [PubMed]
- Spina, D. PDE4 inhibitors: Current status. Br. J. Pharmacol. 2008, 155, 308–315. [Google Scholar] [CrossRef] [Scilit] [PubMed]
- Huang, Z.; Mancini, J.A. Phosphodiesterase 4 inhibitors for the treatment of asthma and COPD. Curr. Med. Chem. 2006, 13, 3253–3262. [Google Scholar] [CrossRef] [Scilit] [PubMed]
- Shakya, A.; Liu, Q.; Lai, C.; Baker, S.; Greene, S.; Erdman, P.; Rathnayake, A.; Schoolmeesters, A.; Blair, C.M.; Kyurkchieva, E.; et al. Discovery of a PDE4B and PDE4D selective bifunctional degrader for management of chronic inflammatory disorders. J. Transl. Autoimmun. 2025, 11, 100329. [Google Scholar] [CrossRef] [Scilit] [PubMed]
- Lusardi, M.; Rapetti, F.; Spallarossa, A.; Brullo, C. PDE4D: A Multipurpose Pharmacological Target. Int. J. Mol. Sci. 2024, 25, 8052. [Google Scholar] [CrossRef] [Scilit] [PubMed]
- Halbert, R.J.; Isonaka, S.; George, D.; Iqbal, A. Interpreting COPD prevalence estimates: What is the true burden of disease? Chest 2003, 123, 1684–1692. [Google Scholar] [CrossRef] [Scilit] [PubMed]
- Anzueto, A.; Barjaktarevic, I.Z.; Siler, T.M.; Rheault, T.; Bengtsson, T.; Rickard, K.; Sciurba, F. Ensifentrine, a Novel Phosphodiesterase 3 and 4 Inhibitor for the Treatment of Chronic Obstructive Pulmonary Disease: Randomized, Double-Blind, Placebo-controlled, Multicenter Phase III Trials (the ENHANCE Trials). Am. J. Respir. Crit. Care Med. 2023, 208, 406–416. [Google Scholar] [CrossRef] [Scilit] [PubMed]
- Dai, X.; Hao, J.; Zhang, Y.; Yang, Y.; Meng, W.; Lu, F.; Zhao, J.; Du, G.; Wan, S.; Hao, J. Discovery of Marine-Inspired Guanidine-Based PDE4 Inhibitors for the Treatment of Chronic Obstructive Pulmonary Disease. Mar. Drugs 2026, 24, 90. [Google Scholar] [CrossRef] [Scilit] [PubMed]
- Hao, J.; Sun, T.; Lu, F.; Xia, X.; Zhao, J.; Guan, H.; Du, G. Application of 3-(Cyclopropylmethoxy)-4-(Difluoromethoxy)Benzoic Acid in the Preparation of a Medicament for the Treatment of Pulmonary Diseases. Chinese Patent CN118416039A, 2 August 2024. [Google Scholar]
- Li, H.; Li, J.; Zhang, X.; Feng, C.; Fan, C.; Yang, X.; Zhang, R.; Zhu, F.; Zhou, Y.; Xu, Y.; et al. DC591017, a phosphodiesterase-4 (PDE4) inhibitor with robust anti-inflammation through regulating PKA-CREB signaling. Biochem. Pharmacol. 2020, 177, 113958. [Google Scholar] [CrossRef] [Scilit] [PubMed]
- Zou, Z.Q.; Chen, J.J.; Feng, H.F.; Cheng, Y.F.; Wang, H.T.; Zhou, Z.Z.; Guo, H.B.; Zheng, W.; Xu, J.P. Novel Phosphodiesterase 4 Inhibitor FCPR03 Alleviates Lipopolysaccharide-Induced Neuroinflammation by Regulation of the cAMP/PKA/CREB Signaling Pathway and NF-kappaB Inhibition. J. Pharmacol. Exp. Ther. 2017, 362, 67–77. [Google Scholar] [CrossRef] [Scilit] [PubMed]
- International Council for Harmonisation of Technical Requirements for Pharmaceuticals for Human Use (ICH). M3(R2): Guidance on Nonclinical Safety Studies for the Conduct of Human Clinical Trials and Marketing Authorization for Pharmaceuticals. Available online: https://database.ich.org/sites/default/files/M3_R2__Guideline.pdf (accessed on 13 September 2026).
- International Council for Harmonisation of Technical Requirements for Pharmaceuticals for Human Use (ICH). S3A: Note for Guidance on Toxicokinetics: The Assessment of Systemic Exposure in Toxicity Studies. Available online: https://database.ich.org/sites/default/files/S3A_Guideline.pdf (accessed on 13 September 2026).
- Jellick, G.; Lohmeyer, K.; Bach, S. Development of an analytical method for the analysis of diflubenzuron in whole blood, plasma, and serum using liquid chromatography tandem mass spectrometry. J. Chromatogr. B Anal. Technol. Biomed. Life Sci. 2025, 1256, 124506. [Google Scholar] [CrossRef] [Scilit] [PubMed]
- Poulin, P.; Nicolas, J.M.; Bouzom, F. A New Version of the Tissue Composition-Based Model for Improving the Mechanism-Based Prediction of Volume of Distribution at Steady-State for Neutral Drugs. J. Pharm. Sci. 2024, 113, 118–130. [Google Scholar] [CrossRef] [Scilit] [PubMed]
- Lincha, V.R.; Hsiao, C.H.; Zhao, J.; Li, C.; Chow, D.S. Sensitive and rapid UHPLC-MS/MS assay for simultaneous quantifications of calcipotriol and paclitaxel in rat whole blood and plasma samples. J. Pharm. Biomed. Anal. 2021, 192, 113685. [Google Scholar] [CrossRef] [Scilit] [PubMed]
- Niu, X.; Zhao, J.; Ding, D.; He, W.; Du, G.; Hao, J.; Zhao, J. Comprehensive Pharmacokinetics of the Marine-Derived PDE4 Inhibitor LY104 and Its Major Metabolite M1 in Rats: A Validated LC-MS/MS Method with Sex Comparison, Multiple-Dose, Protein Binding, Metabolic Stability, and Excretion Studies. Mar. Drugs 2026, 24, 215. [Google Scholar] [CrossRef] [Scilit] [PubMed]
- Bahar, F.G.; Ohura, K.; Ogihara, T.; Imai, T. Species difference of esterase expression and hydrolase activity in plasma. J. Pharm. Sci. 2012, 101, 3979–3988. [Google Scholar] [CrossRef] [Scilit] [PubMed]
- Taketani, M.; Shii, M.; Ohura, K.; Ninomiya, S.; Imai, T. Carboxylesterase in the liver and small intestine of experimental animals and human. Life Sci. 2007, 81, 924–932. [Google Scholar] [CrossRef] [Scilit] [PubMed]
- Martignoni, M.; Groothuis, G.M.; de Kanter, R. Species differences between mouse, rat, dog, monkey and human CYP-mediated drug metabolism, inhibition and induction. Expert Opin. Drug Metab. Toxicol. 2006, 2, 875–894. [Google Scholar] [CrossRef] [Scilit] [PubMed]
- U.S. Food and Drug Administration. M10 Bioanalytical Method Validation and Study Sample Analysis Guidance for Industry. Available online: https://www.fda.gov/regulatory-information/search-fda-guidance-documents/m10-bioanalytical-method-validation-and-study-sample-analysis (accessed on 13 September 2026).
- Liu, W.X.; Song, S.; Ye, M.L.; Zhu, Y.; Zhao, Y.G.; Lu, Y. Nanomaterials with Excellent Adsorption Characteristics for Sample Pretreatment: A Review. Nanomaterials 2022, 12, 1845. [Google Scholar] [CrossRef] [Scilit] [PubMed]
- Chen, H.; Li, J.; Yuan, F.; He, G.; Wu, H.; Yan, H.; Xu, H.; Liu, C.; Sheng, L.; Li, X. Development and validation of a sensitive and rapid UHPLC-MS/MS method for the simultaneous quantification of CG-0255 and its active metabolite in human plasma and its application to Phase I studies. J. Pharm. Biomed. Anal. 2026, 273, 117390. [Google Scholar] [CrossRef] [Scilit] [PubMed]
- Yan, H.; Lu, H.; Huang, S.; Li, Y.; Xia, H.; Huang, W.; Shang, D.; Zhang, M. A rapid 2-minute LC-MS/MS method with simple protein precipitation for simultaneous determination of tryptophan and its two metabolites kynurenine and kynurenic acid in human serum. J. Pharm. Biomed. Anal. 2026, 277, 117448. [Google Scholar] [CrossRef] [Scilit] [PubMed]
- Polson, C.; Sarkar, P.; Incledon, B.; Raguvaran, V.; Grant, R. Optimization of protein precipitation based upon effectiveness of protein removal and ionization effect in liquid chromatography-tandem mass spectrometry. J. Chromatogr. B Anal. Technol. Biomed. Life Sci. 2003, 785, 263–275. [Google Scholar] [CrossRef] [Scilit] [PubMed]
- Uchimura, T.; Kato, M.; Saito, T.; Kinoshita, H. Prediction of human blood-to-plasma drug concentration ratio. Biopharm. Drug Dispos. 2010, 31, 286–297. [Google Scholar] [CrossRef] [Scilit] [PubMed]
- Smith, B.P.; Vandenhende, F.R.; DeSante, K.A.; Farid, N.A.; Welch, P.A.; Callaghan, J.T.; Forgue, S.T. Confidence interval criteria for assessment of dose proportionality. Pharm. Res. 2000, 17, 1278–1283. [Google Scholar] [CrossRef] [Scilit] [PubMed]
- Hummel, J.; McKendrick, S.; Brindley, C.; French, R. Exploratory assessment of dose proportionality: Review of current approaches and proposal for a practical criterion. Pharm. Stat. 2009, 8, 38–49. [Google Scholar] [CrossRef] [Scilit] [PubMed]
- Sun, J.; Zhang, L.; Song, J.; Tian, S.; Huang, C.; Feng, Z.; Lv, Y.; Du, G. Pharmacokinetic study of salvianolic acid A in beagle dog after oral administration by a liquid chromatography-mass spectrometry method: A study on bioavailability and dose proportionality. J. Ethnopharmacol. 2013, 148, 617–623. [Google Scholar] [CrossRef] [Scilit] [PubMed]
- Song, J.; Zhang, W.; Sun, J.; Xu, X.; Zhang, X.; Zhang, L.; Feng, Z.; Du, G.H. Pharmacokinetic study of salvianolic acid D after oral and intravenous administration in rats. Acta Pharm. Sin. B 2015, 5, 246–253. [Google Scholar] [CrossRef] [Scilit] [PubMed]
- Li, C.; Song, X.; Song, J.; Pang, X.; Wang, Z.; Zhao, Y.; Lian, W.; Liu, A.; Du, G. Pharmacokinetic study of gallocatechin-7-gallate from Pithecellobium clypearia Benth. in rats. Acta Pharm. Sin. B 2016, 6, 64–70. [Google Scholar] [CrossRef] [Scilit] [PubMed]
- Niu, X.; Chen, D.; He, W.; Tang, Y.; Zhao, J. Development and Validation of a Novel UHPLC-MS/MS Method for the Quantification of Plinabulin in Plasma and Its Application in a Pharmacokinetic Study with Leukopenic Rats. Pharmaceuticals 2023, 16, 1153. [Google Scholar] [CrossRef] [Scilit] [PubMed]
- Wang, K.; Zhang, X.; Chen, F.; Ni, Y.; Cai, Z.; Ding, J.; Chen, S.; Shu, C.; Ding, L. LC-MS/MS methods for simultaneous determination of youkenafil and its metabolite M1 in human seminal plasma and plasma: Application to evaluate the acute effect of youkenafil on semen quality and its pharmacokinetics in human. J. Chromatogr. B Anal. Technol. Biomed. Life Sci. 2024, 1237, 124105. [Google Scholar] [CrossRef] [Scilit] [PubMed]
- Nemzek, J.A.; Lester, P.A.; Wolfe, A.M.; Dysko, R.C.; Myers, D.D. Biology and Diseases of Dogs. In Laboratory Animal Medicine, 3rd ed.; Fox, J.G., Anderson, L.C., Otto, G.M., Pritchett-Corning, K.R., Whary, M.T., Eds.; Academic Press: Boston, American, 2015; pp. 511–554. [Google Scholar]

Disclaimer/Publisher’s Note: The statements, opinions and data contained in all publications are solely those of the individual author(s) and contributor(s) and not of MDPI and/or the editor(s). MDPI and/or the editor(s) disclaim responsibility for any injury to people or property resulting from any ideas, methods, instructions or products referred to in the content. |
© 2026 by the authors. Licensee MDPI, Basel, Switzerland. This article is an open access article distributed under the terms and conditions of the Creative Commons Attribution (CC BY) license.