


Abstract
Background and Objectives: Left ventricular global longitudinal strain (LV GLS) has prognostic relevance in hypertrophic cardiomyopathy (HCM), but its incremental value for identifying nonsustained ventricular tachycardia (NSVT) documented on ambulatory monitoring is uncertain. We examined whether signed LV GLS was independently associated with documented NSVT and whether it improved a fixed clinical and conventional echocardiographic model. Materials and Methods: This retrospective, single-centre cross-sectional study included 201 patients with HCM. Transthoracic echocardiography was performed on the day that 24-h ambulatory electrocardiographic monitoring was initiated. A reference logistic regression model included age, sex, maximal septal thickness, maximal left ventricular outflow tract (LVOT) gradient, and ejection fraction; signed LV GLS was then added. Discrimination and calibration were internally validated using 2000 bootstrap samples with coefficient refitting. Six secondary mechanical measures were analysed with false discovery rate control. Results: NSVT was documented in 115 patients (57.2%). Median LV GLS was −11.3% [interquartile range, −14.3 to −9.0] with NSVT and −10.9% [−14.3 to −9.2] without NSVT (p = 0.819); the 0.4-percentage-point difference lies within the measurement variability of LV GLS, and the two distributions overlapped almost completely. The adjusted odds ratio (OR) for LV GLS per 1-percentage-point increase was 0.962 (95% confidence interval [CI], 0.884–1.047; p = 0.372). The apparent area under the curve was 0.645 (95% CI, 0.564–0.724) for the reference model and 0.644 (95% CI, 0.564–0.723) after adding LV GLS (paired difference, −0.001; 95% CI, −0.029 to 0.027; likelihood-ratio p = 0.370); optimism-corrected values were 0.606 and 0.598. In exploratory analyses, higher global radial strain was associated with lower odds of NSVT (OR per standard deviation, 0.619; 95% CI, 0.449–0.852; q = 0.020). Conclusions: LV GLS was not independently associated with documented NSVT and did not improve its discrimination beyond conventional clinical and echocardiographic variables. The exploratory radial strain association requires independent confirmation.
1. Introduction
Nonsustained ventricular tachycardia (NSVT) is an important component of the clinical assessment of hypertrophic cardiomyopathy (HCM). Its interpretation nevertheless depends on the broader phenotype rather than on the presence of an isolated imaging abnormality. Current guidelines integrate rhythm findings with clinical history, structural characteristics, and other markers of sudden cardiac death (SCD) risk [1,2]. A practical question is whether a routinely available deformation measurement adds information about NSVT beyond the conventional echocardiographic examination.
Left ventricular global longitudinal strain (LV GLS) can characterize impaired longitudinal shortening despite a preserved left ventricular ejection fraction (LVEF). In HCM, LVEF is typically normal or supranormal (≥50%, and frequently ≥65%), and an LVEF below 50% defines the end-stage phenotype with systolic dysfunction [1,2]; LV GLS can therefore be reduced while LVEF remains within this preserved range [3]. Previous HCM studies have associated LV GLS with appropriate implantable cardioverter-defibrillator (ICD) therapy, longer-term adverse outcomes, and sudden-death-associated events [4,5,6]. Those observations support its biological and prognostic relevance, but they do not establish that it can distinguish patients with and without an intermittent arrhythmia captured during one ambulatory recording. The outcome definition, monitoring strategy, treatment history, and composition of the studied cohort can all influence the relationship being estimated.
Research focused on ventricular arrhythmias has also examined regional dysfunction and the timing of contraction rather than global longitudinal amplitude alone. Di Salvo and colleagues investigated regional strain abnormalities in relation to NSVT, whereas the studies by Haland and Jalanko emphasized mechanical dispersion [7,8,9]. Candan and colleagues evaluated both global longitudinal peak strain and mechanical dispersion in relation to appropriate ICD therapy [10]. More recently, three-dimensional systolic dyssynchrony and nonlongitudinal strain measures have been studied alongside NSVT in HCM [11]. These measurements characterize related but not interchangeable aspects of myocardial mechanics.
We therefore examined whether signed LV GLS was independently associated with documented NSVT and whether it improved a fixed clinical and conventional echocardiographic model. The primary analysis concerned classification of NSVT on 24-h monitoring, not prediction of future malignant ventricular arrhythmia. NSVT was ascertained by 24-h ambulatory electrocardiography and LV GLS by transthoracic echocardiography; the two modalities are independent, and the question was whether a same-day imaging measurement carries information about the arrhythmic substrate detected by the rhythm recording. Additional analyses considered radial, circumferential, and rotational measures and tricuspid annular plane systolic excursion as exploratory features, while accounting for multiple testing and the optimism inherent in evaluating models in their development sample.
2. Materials and Methods
2.1. Study Design and Participants
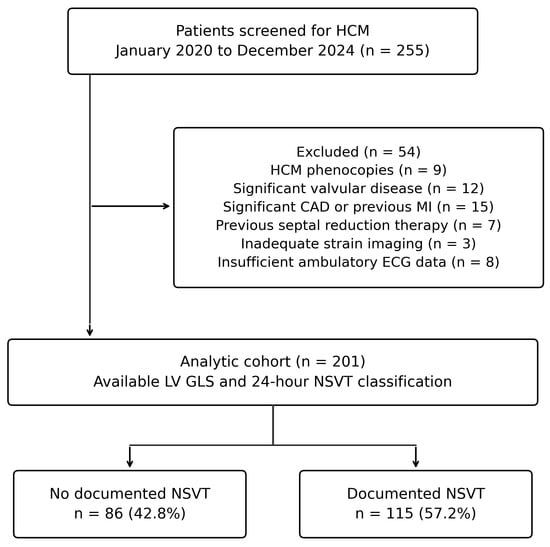
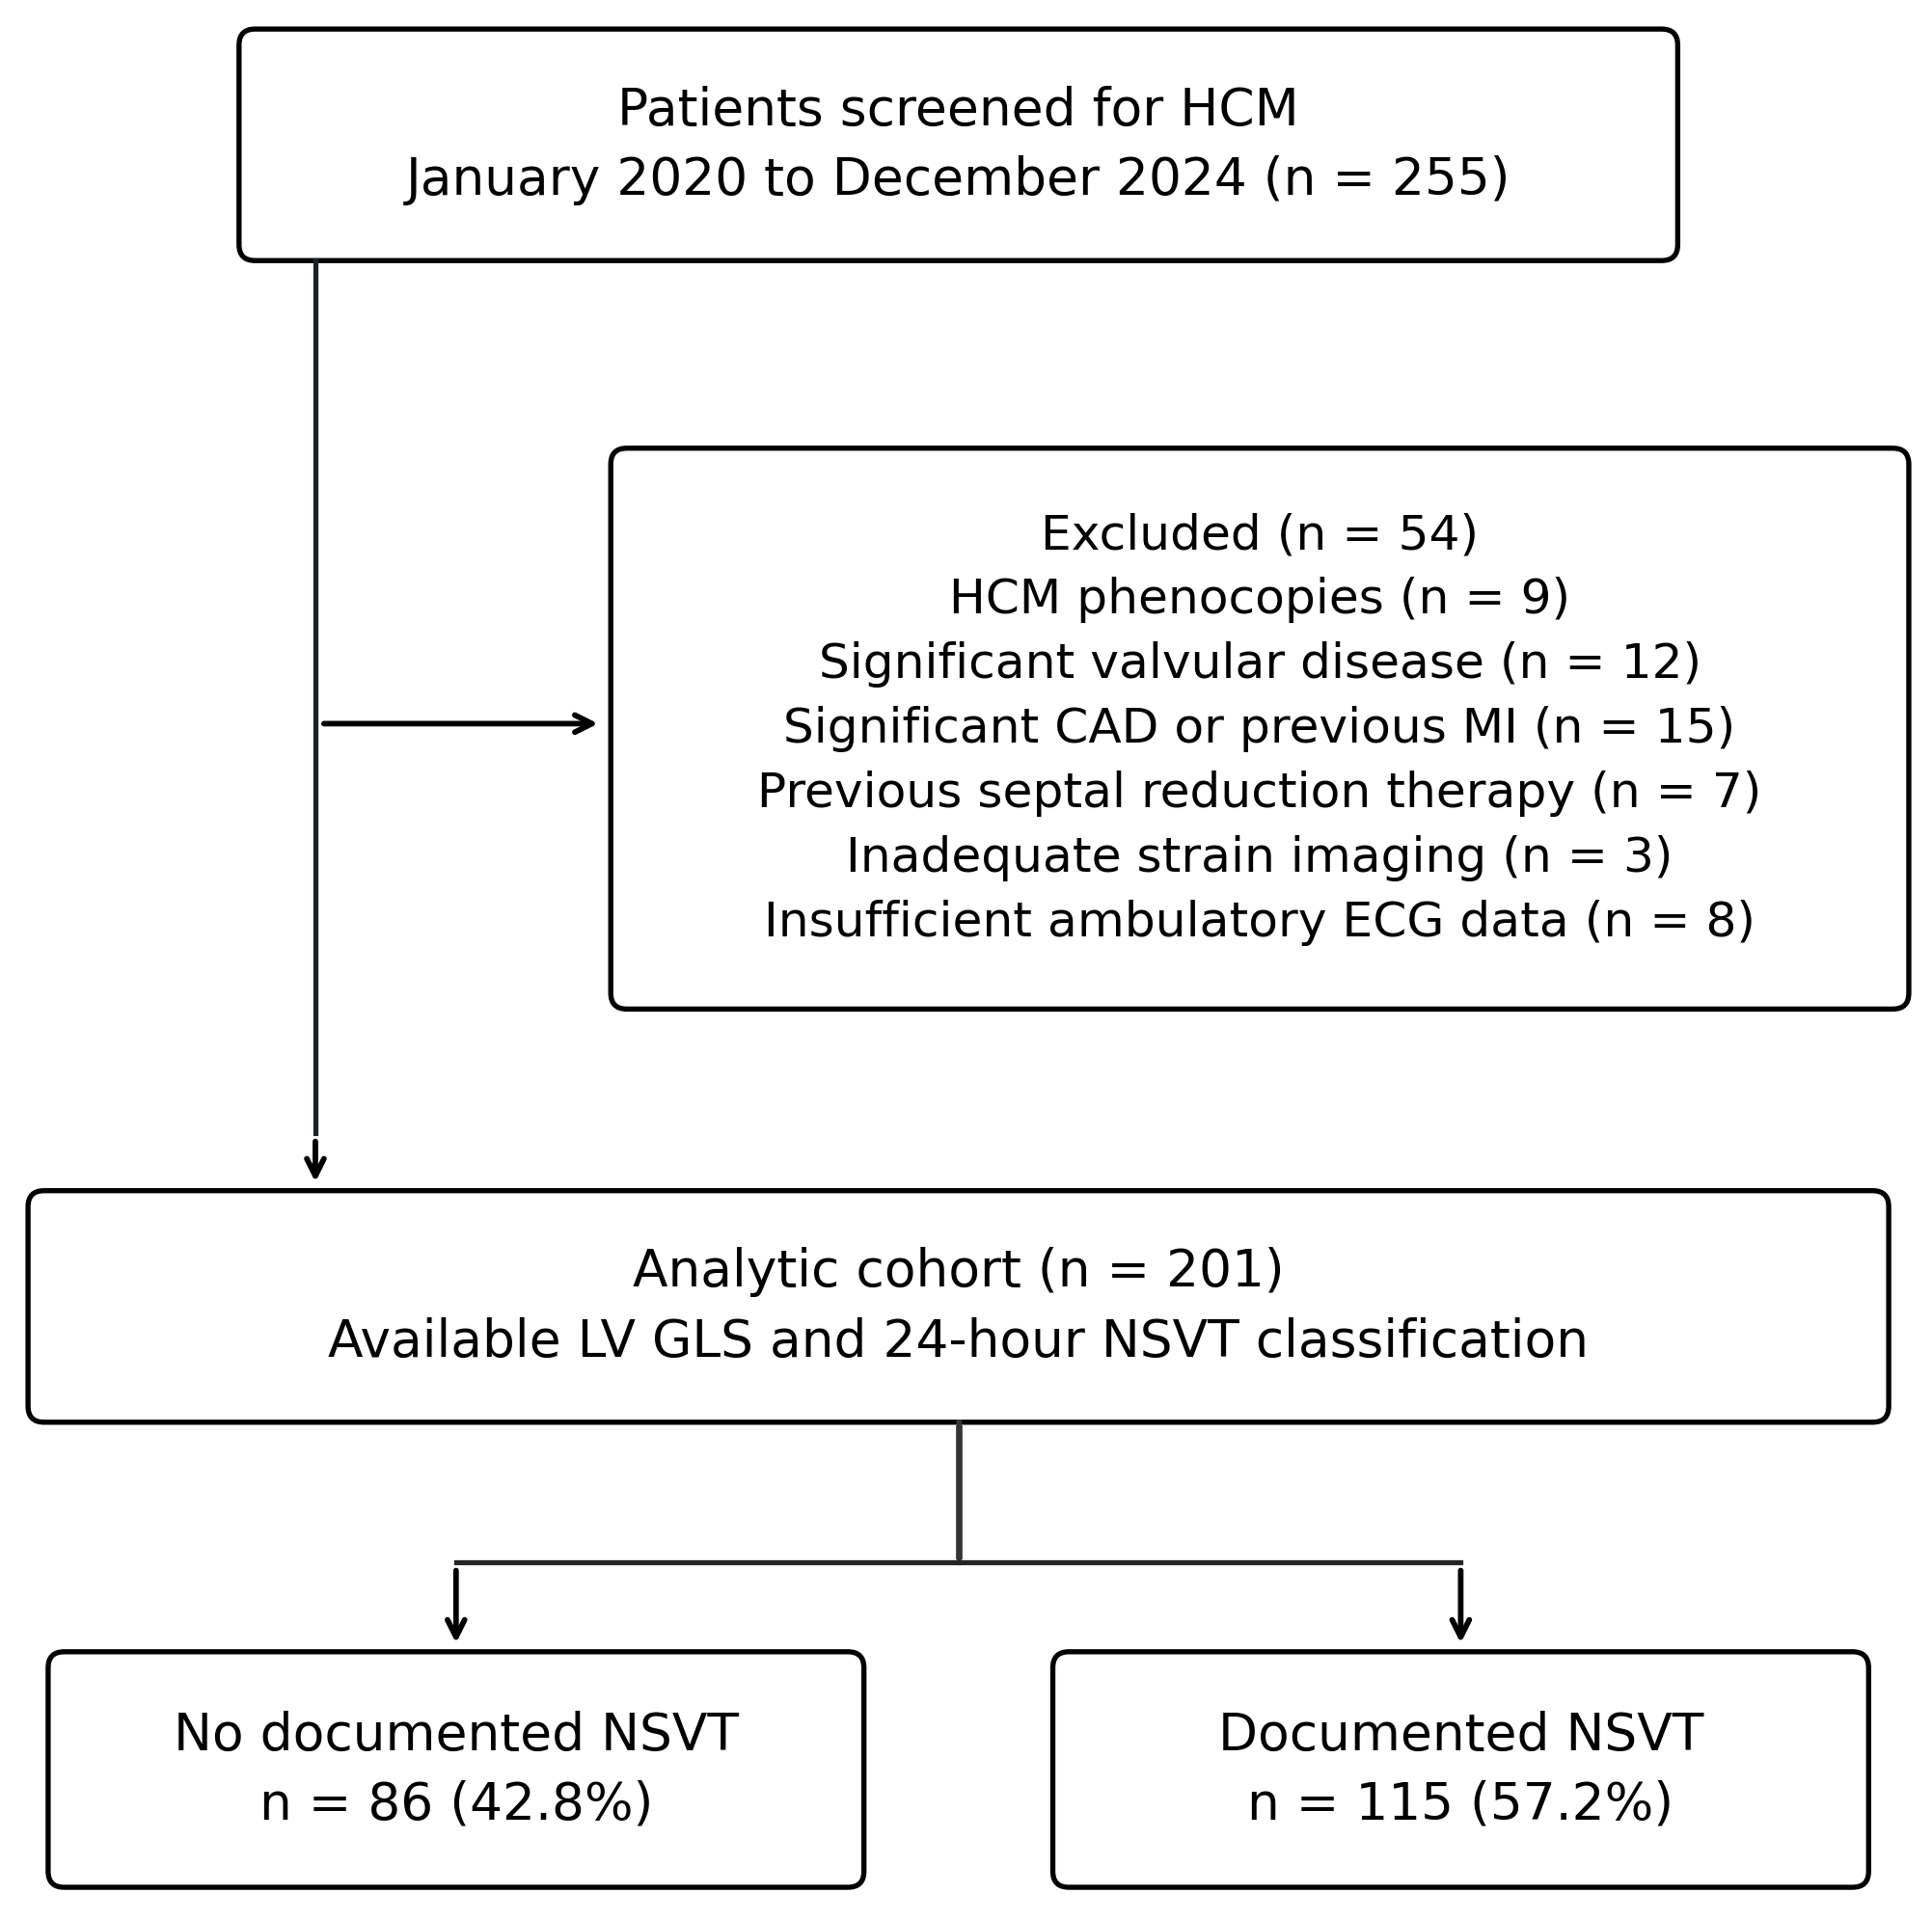
This retrospective observational study was conducted at Kayseri City Training and Research Hospital and included patients evaluated for HCM between January 2020 and December 2024. HCM was defined by otherwise unexplained maximal end-diastolic left ventricular wall thickness of at least 15 mm in one or more segments [1,2]. Of 255 screened patients, 54 were excluded because of HCM phenocopies (n = 9), significant valvular disease (n = 12), significant coronary artery disease or previous myocardial infarction (n = 15), prior septal reduction therapy (n = 7), inadequate images for strain assessment (n = 3), or insufficient 24-h ambulatory electrocardiographic data (n = 8). The final cohort comprised 201 patients (Figure 1). Records of patients evaluated between January 2020 and December 2024 were reviewed retrospectively after ethics approval had been obtained (decision no. 991, 16 June 2026); no study-specific procedure was performed on any patient.
Figure 1.
Participant selection and documented NSVT classification. Of 255 screened patients, 54 were excluded for the listed reasons. The remaining 201 had an available LV GLS measurement and adequate 24-h ambulatory electrocardiography for NSVT classification. CAD, coronary artery disease; ECG, electrocardiography; LV GLS, left ventricular global longitudinal strain; HCM, hypertrophic cardiomyopathy; LV, left ventricular; MI, myocardial infarction; NSVT, nonsustained ventricular tachycardia.
Eligibility required an interpretable echocardiogram with an available LV GLS measurement and adequate ambulatory monitoring for NSVT classification. The study consequently represents a clinically evaluated HCM cohort referred to a tertiary centre rather than an unselected screening population. Transthoracic echocardiography was performed on the day that 24-h ambulatory electrocardiographic monitoring was initiated, as part of the same clinical assessment. All variables used in the primary and specified secondary analyses were available for the 201 included patients. Reporting followed the Strengthening the Reporting of Observational Studies in Epidemiology (STROBE) framework [12].
2.2. Clinical Variables and NSVT Ascertainment
Demographic characteristics, blood pressure, heart rate, functional class, history of syncope, history of atrial fibrillation (AF), and ICD status were obtained from the clinical record. Sex was coded as male versus female. New York Heart Association (NYHA) classes III and IV were combined for the descriptive comparison because of the small number in class IV. AF denoted a clinical history of documented AF at any time before the index assessment rather than the rhythm during strain acquisition. Pharmacological therapy at the time of the index assessment could not be reconstructed: treatment was recorded only in free-text fields that named a drug in fewer than 5% of records and could not be dated relative to the echocardiogram and the ambulatory recording. Medication was therefore not available as a descriptive variable or as a covariate; this is addressed as a limitation (Section 4.5).
NSVT was defined as at least three consecutive ventricular beats at a rate of at least 120 beats/min, lasting less than 30 s [2]. Recordings were obtained with a SEER 1000 digital Holter recorder (GE Healthcare, Chalfont St Giles, UK) and analysed with the manufacturer’s Holter analysis software. Two cardiologists reviewed the ambulatory recordings; classification required physician confirmation, with disagreements resolved by consensus. Initial independent classifications were not archived, so inter-rater agreement (kappa) for NSVT classification could not be calculated retrospectively. NSVT classification was based exclusively on the evaluated 24-h ambulatory electrocardiographic recording, irrespective of ICD status. Episode frequency, maximum run length, and rhythm burden were not used as outcomes. ICD presence was recorded descriptively but was not included as a predictor and was not considered an incident endpoint, because the timing of implantation relative to the study assessment could not be reliably established.
2.3. Echocardiographic and Deformation Measurements
Transthoracic echocardiography was performed using a GE Vivid E95 system (GE Healthcare, Horten, Norway), with offline strain analysis in EchoPAC (GE Healthcare). Conventional measurements included maximal septal and posterior wall thickness, left atrial diameter and maximum volume, LVEF, the highest recorded left ventricular outflow tract (LVOT) gradient, systolic anterior motion, and tricuspid annular plane systolic excursion (TAPSE). Chamber measurements were obtained within the conventional echocardiographic assessment [13]. Maximum left atrial volume was analysed in millilitres without indexing. Linear measurements stored in centimetres were converted to millimetres for presentation.
An LVOT gradient of at least 30 mmHg was used to describe an obstructive haemodynamic phenotype. Because resting and provoked gradients were not consistently distinguished, the maximum available value was entered as a continuous variable in regression models. LVEF values obtained during the conventional echocardiographic assessment were used in the analyses.
LV GLS was assessed from apical four-, three-, and two-chamber views acquired at a frame rate of 50–70 frames/s. After selection of an appropriate cardiac cycle, the endocardial border was delineated and myocardial tracking was performed automatically in EchoPAC. Tracking quality was visually inspected throughout the cardiac cycle, and the region of interest was manually adjusted when necessary. Each apical view was divided into six myocardial segments, yielding 18 left ventricular segments. Global longitudinal strain was calculated automatically by the software from the analysed segments. Signed LV GLS values were retained: a 1-percentage-point increase denotes a less negative value and less longitudinal shortening.
Radial strain was assessed from parasternal short-axis views obtained at the basal, midventricular, and apical levels. At each level, the left ventricular myocardium was divided into six segments. After automated myocardial tracking, tracking quality was visually verified and the region of interest was manually adjusted when necessary. Global radial strain was calculated as the mean of the segmental peak systolic radial strain values and expressed as a positive percentage, with higher values indicating greater systolic radial thickening.
Global circumferential strain was analysed as a positive magnitude. Basal rotation, apical rotation, and twist were analysed as recorded rather than algebraically reconstructed. Right ventricular and right atrial strain were excluded from the analyses because the archived records did not support consistent definitions of the ventricular segments included or the atrial strain phase. Standardized mechanical dispersion was unavailable because the timing reference and peak-selection procedures were insufficiently documented, and an additional four-chamber strain field of uncertain definition was excluded.
Image acquisition took place during routine clinical care and was performed by the staff cardiologists of the echocardiography laboratory; it was therefore not restricted to a single operator. All offline measurements, including the conventional parameters and the strain analyses, were performed jointly by two cardiologists experienced in speckle-tracking echocardiography (M.Z.A. and M.K.T.), who were blinded to NSVT status and recorded a single consensus value for each parameter. Because independent observer-specific readings were not archived, inter-observer and intra-observer agreement statistics (intraclass correlation coefficients for continuous strain measures) could not be calculated retrospectively; this is addressed in the Limitations section.
2.4. Statistical Analysis
Normality was assessed with the Shapiro–Wilk test. Sixteen of the 18 continuous variables departed from a normal distribution (p < 0.05) in the full cohort or in at least one NSVT group; only age and left atrial diameter were compatible with normality. For uniformity of presentation, all continuous variables were therefore summarized as medians with interquartile ranges and compared using Mann–Whitney U tests with tie correction, which do not depend on distributional form. Logistic regression does not require normally distributed predictors; the functional form of continuous predictors was examined with restricted cubic splines, as described below. Categorical variables were presented as counts and percentages, with Pearson chi-square tests or Fisher’s exact tests for sparse two-by-two comparisons. Group comparisons were descriptive and did not determine which covariates entered the primary model. All tests were two-sided. The 95% confidence interval (CI) for each coefficient was calculated using the Wald method, and the primary significance level was 0.05.
Binary logistic regression estimated the association with documented NSVT. The reference model included age, male sex, maximal septal thickness, maximal LVOT gradient, and LVEF. These covariates were specified before modelling according to four criteria: (i) recognition in current HCM guidelines as clinical or structural determinants of arrhythmic risk (age, sex, maximal wall thickness, LVOT obstruction) [1,2]; (ii) LVEF, because LV GLS is interpreted relative to it; (iii) availability in all patients; and (iv) a total of five terms, so that the 115 NSVT cases provided more than 20 events per parameter. Variables were not selected on univariable p values and were retained regardless of their individual significance; the univariable estimates reported in the Results are shown for completeness only. ICD status was not entered because of indication bias and unknown implantation timing (Section 2.2), and medication because treatment fields were unreliable; AF history, syncope, and left atrial volume were examined in sensitivity analyses rather than in the primary model. The extended model added signed LV GLS. Odds ratios (ORs) were scaled per 10 years of age, 5 mm of septal thickness, 10 mmHg of LVOT gradient, 5 percentage points of LVEF, and 1 percentage point of LV GLS. No automated stepwise selection was applied. The HCM Risk-SCD score was excluded because it contains NSVT and would make the predictor partly dependent on the outcome being classified.
Incremental model information was assessed by a nested likelihood-ratio test. Discrimination was quantified by the area under the receiver operating characteristic curve (AUC). Ten thousand paired, outcome-stratified bootstrap samples of the fitted scores provided percentile confidence intervals for apparent AUCs and their paired differences. These intervals describe uncertainty conditional on the fitted scores; they are distinct from internal validation. For LV GLS alone, higher signed values were retained as indicating impaired shortening; the scale was not reversed to obtain an AUC above 0.50. No data-derived clinical cut-off was proposed.
Internal validation used 2000 patient-level bootstrap samples with replacement, refitting all coefficients in each sample. For each model, performance in the bootstrap sample was compared with performance of that refitted model in the original cohort. Mean optimism was removed from the original performance estimate [14]. We reported optimism-corrected AUC, Brier score, and calibration slope. Calibration-in-the-large was also calculated with the prediction coefficient fixed at one. Apparent calibration was displayed with a smooth curve and observed proportions across ten approximately equal-sized groups, with Wilson confidence intervals. A Hosmer–Lemeshow test was supplementary rather than the basis for declaring calibration adequate [15].
Exploratory analyses added six mechanical measures individually to the extended model: TAPSE, global circumferential strain, global radial strain, basal rotation, apical rotation, and twist. Each was standardized using its full-cohort standard deviation. Benjamini–Hochberg correction controlled the false discovery rate (FDR) across these six adjusted coefficient tests; a separate family of six tests covered their unadjusted group comparisons [16]. Two exploratory blocks were also examined beyond the extended model: circumferential plus radial strain, and twist alone. Their two likelihood-ratio tests formed a separate correction family. Basal and apical rotation were not combined with twist in the same block. Because the exploratory set was revised after the initial analyses to exclude inadequately defined measures, the original multiplicity corrections were retained as a sensitivity check.
Sensitivity analyses restricted the cohort to LVEF ≥ 50% or added AF history and syncope together or maximum left atrial volume in separate analyses. Robust modified Poisson regression provided adjusted prevalence ratios as an alternative to odds ratios for this common binary outcome [17]. Influence was examined with Cook’s distance, using 4/n as an exploratory exclusion threshold. Functional form was evaluated with three-knot restricted cubic splines at the 10th, 50th, and 90th percentiles. A sex-by-LV GLS interaction was exploratory. Radial strain follow-up analyses examined adjustment, influence, and rank transformation. Sensitivity, nonlinearity, and interaction p values were nominal and were not interpreted as independent replications or confirmatory subgroup tests.
The study protocol specified an a priori sample size of 68 patients (34 per group) to detect a standardized difference of 0.70 in LV GLS between patients with and without NSVT with 80% power at a two-sided α of 0.05 (G*Power version 3.1.9.4) (Heinrich Heine University Düsseldorf, Düsseldorf, Germany); with the observed standard deviation of 3.5 percentage points, this corresponds to a difference of approximately 2.5 percentage points. All 201 eligible patients were included. The protocol also envisaged a Youden-index cut-off for LV GLS; this was not pursued because LV GLS showed no association with the outcome, and a cut-off for a non-discriminating variable would be uninterpretable. Statistical analyses were performed with IBM SPSS Statistics version 26.0 (IBM Corp., Armonk, NY, USA); restricted cubic spline modelling, bootstrap-based optimism correction, and bootstrap confidence intervals for AUCs were conducted in R (version 4.3.0; R Foundation for Statistical Computing, Vienna, Austria) with the rms and pROC packages. Post hoc power was calculated with G*Power 3.1.9.4. The independent reproduction of the reported estimates described in Section 2.5 used Python 3.11 (Python Software Foundation, Wilmington, DE, USA) (statsmodels 0.15.0, scikit-learn 1.8.0, SciPy 1.17.1).
2.5. Use of Generative Artificial Intelligence
A generative artificial intelligence assistant (Claude Opus 5 (Anthropic, San Francisco, CA, USA)) was used for two purposes. First, it independently re-executed the reported statistical estimates from the analytic dataset as a verification step, reproducing the descriptive comparisons, regression coefficients, likelihood-ratio tests, discrimination measures, and multiplicity-adjusted q values presented here. Second, it assisted with manuscript language, structure, and formatting to journal style. The study design, data collection, the primary statistical analysis, the figures, and the interpretation of the findings were carried out by the authors. The authors reviewed and verified all output and take full responsibility for the content of this manuscript.
3. Results
3.1. Cohort Characteristics
The analytic cohort included 201 patients, with a median age of 50.0 years [39.0–57.0]; 148 (73.6%) were men. NSVT was documented in 115 patients (57.2%), and 86 had no NSVT on the evaluated recording. Median LVEF was 64.0% [61.0–67.0], with a range of 47% to 72%. Six patients (3.0%) had LVEF below 50%. An LVOT gradient of at least 30 mmHg was recorded in 139 patients (69.2%), and a clinical history of AF was present in 117 patients (58.2%), indicating a predominantly obstructive and arrhythmia-enriched referral population. Clinical and conventional echocardiographic characteristics are presented in Table 1.
Table 1.
Clinical and conventional echocardiographic characteristics by documented NSVT status.
Men accounted for 83.5% of the NSVT group and 60.5% of the group without NSVT (p < 0.001). ICD presence was also more frequent among patients with documented NSVT (73.9% versus 57.0%; p = 0.012); this comparison was descriptive. Age, septal thickness, maximal LVOT gradient, LVEF, and maximum left atrial volume did not differ significantly between groups. Median signed LV GLS was −11.3% [−14.3 to −9.0] with NSVT and −10.9% [−14.3 to −9.2] without NSVT (p = 0.819).
3.2. Primary Association and Incremental Discrimination
In the extended model, the adjusted OR for LV GLS was 0.962 per 1-percentage-point increase (95% CI, 0.884–1.047; p = 0.372). Male sex was associated with documented NSVT (adjusted OR, 3.695; 95% CI, 1.850–7.381), whereas the estimates for age, septal thickness, LVOT gradient, and LVEF were not statistically significant (Table 2). Variance inflation factors ranged from 1.02 to 1.08, providing no evidence of substantial collinearity among the primary predictors.
Table 2.
Univariable and multivariable associations with documented NSVT.
Adding LV GLS did not significantly improve model likelihood (likelihood-ratio χ2 = 0.802, 1 degree of freedom; p = 0.370). The apparent AUC was 0.645 (95% CI, 0.564–0.724) for the reference model and 0.644 (95% CI, 0.564–0.723) for the extended model. The paired AUC difference was −0.001 (95% CI, −0.029 to 0.027). LV GLS alone had an AUC of 0.490 (95% CI, 0.411–0.572) in the predefined direction of impaired shortening (Figure 2).
Figure 2.
Apparent discrimination for documented NSVT. The reference model contains age, sex, septal thickness, maximal LVOT gradient, and LVEF; the extended model additionally contains signed LV GLS. The LV GLS-only curve retains the direction of higher signed values indicating impaired shortening. Curves show apparent discrimination in the development cohort. Confidence intervals and optimism-corrected estimates are reported in the text and Table 3. AUC, area under the receiver operating characteristic curve; LV GLS, left ventricular global longitudinal strain; LV, left ventricular; LVEF, left ventricular ejection fraction; LVOT, left ventricular outflow tract; NSVT, nonsustained ventricular tachycardia.
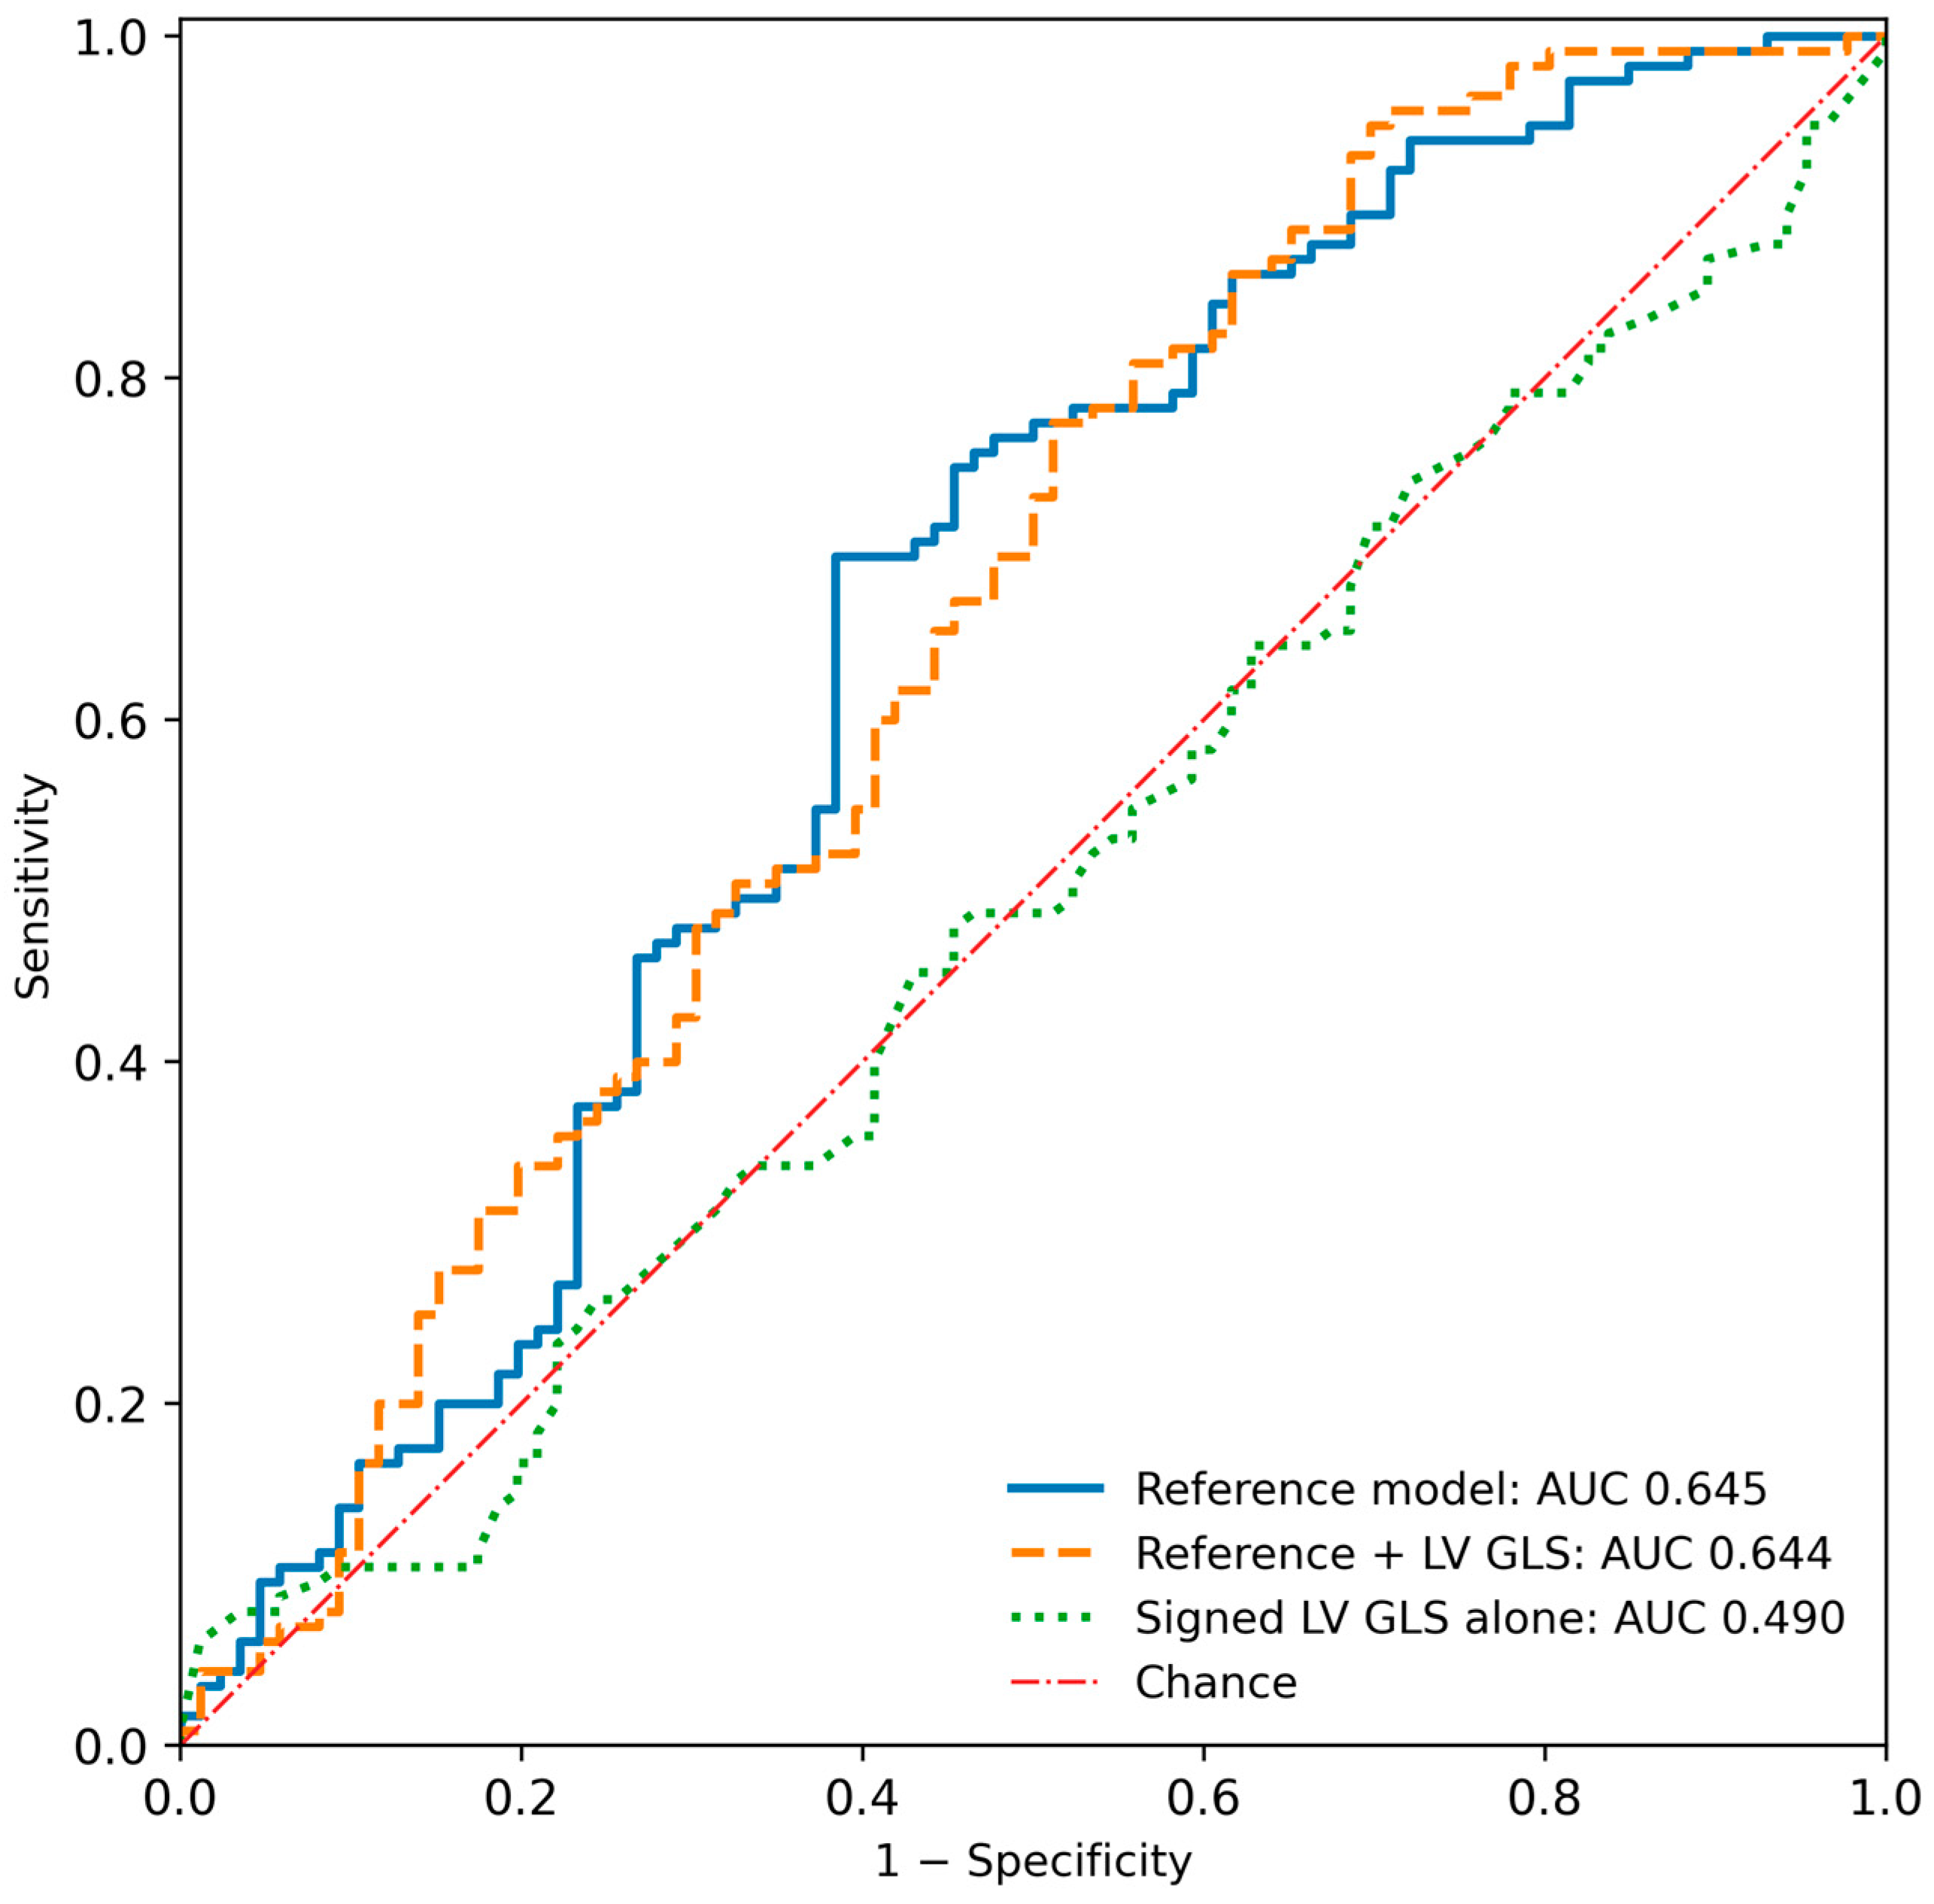
Table 3.
Apparent and internally validated model performance.
3.3. Internal Validation and Calibration
All 2000 bootstrap refits were successful for each validated model. Optimism-corrected AUCs were 0.606 for the reference model and 0.598 after adding LV GLS. Corrected calibration slopes were 0.806 and 0.763, respectively. Corrected Brier scores were 0.239 and 0.240, compared with a prevalence-only Brier score of 0.245. The Hosmer–Lemeshow p values were 0.214 and 0.190. Model performance is summarized in Table 3; apparent calibration in the development cohort is shown in Figure S1.
3.4. Exploratory Mechanical Measures
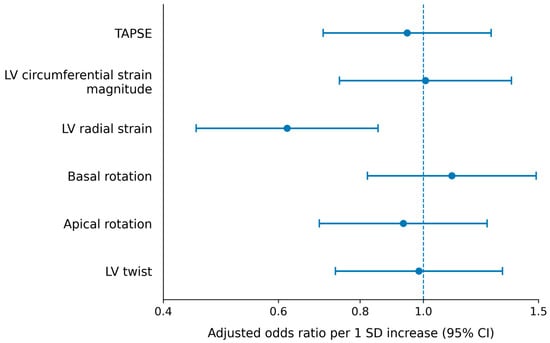
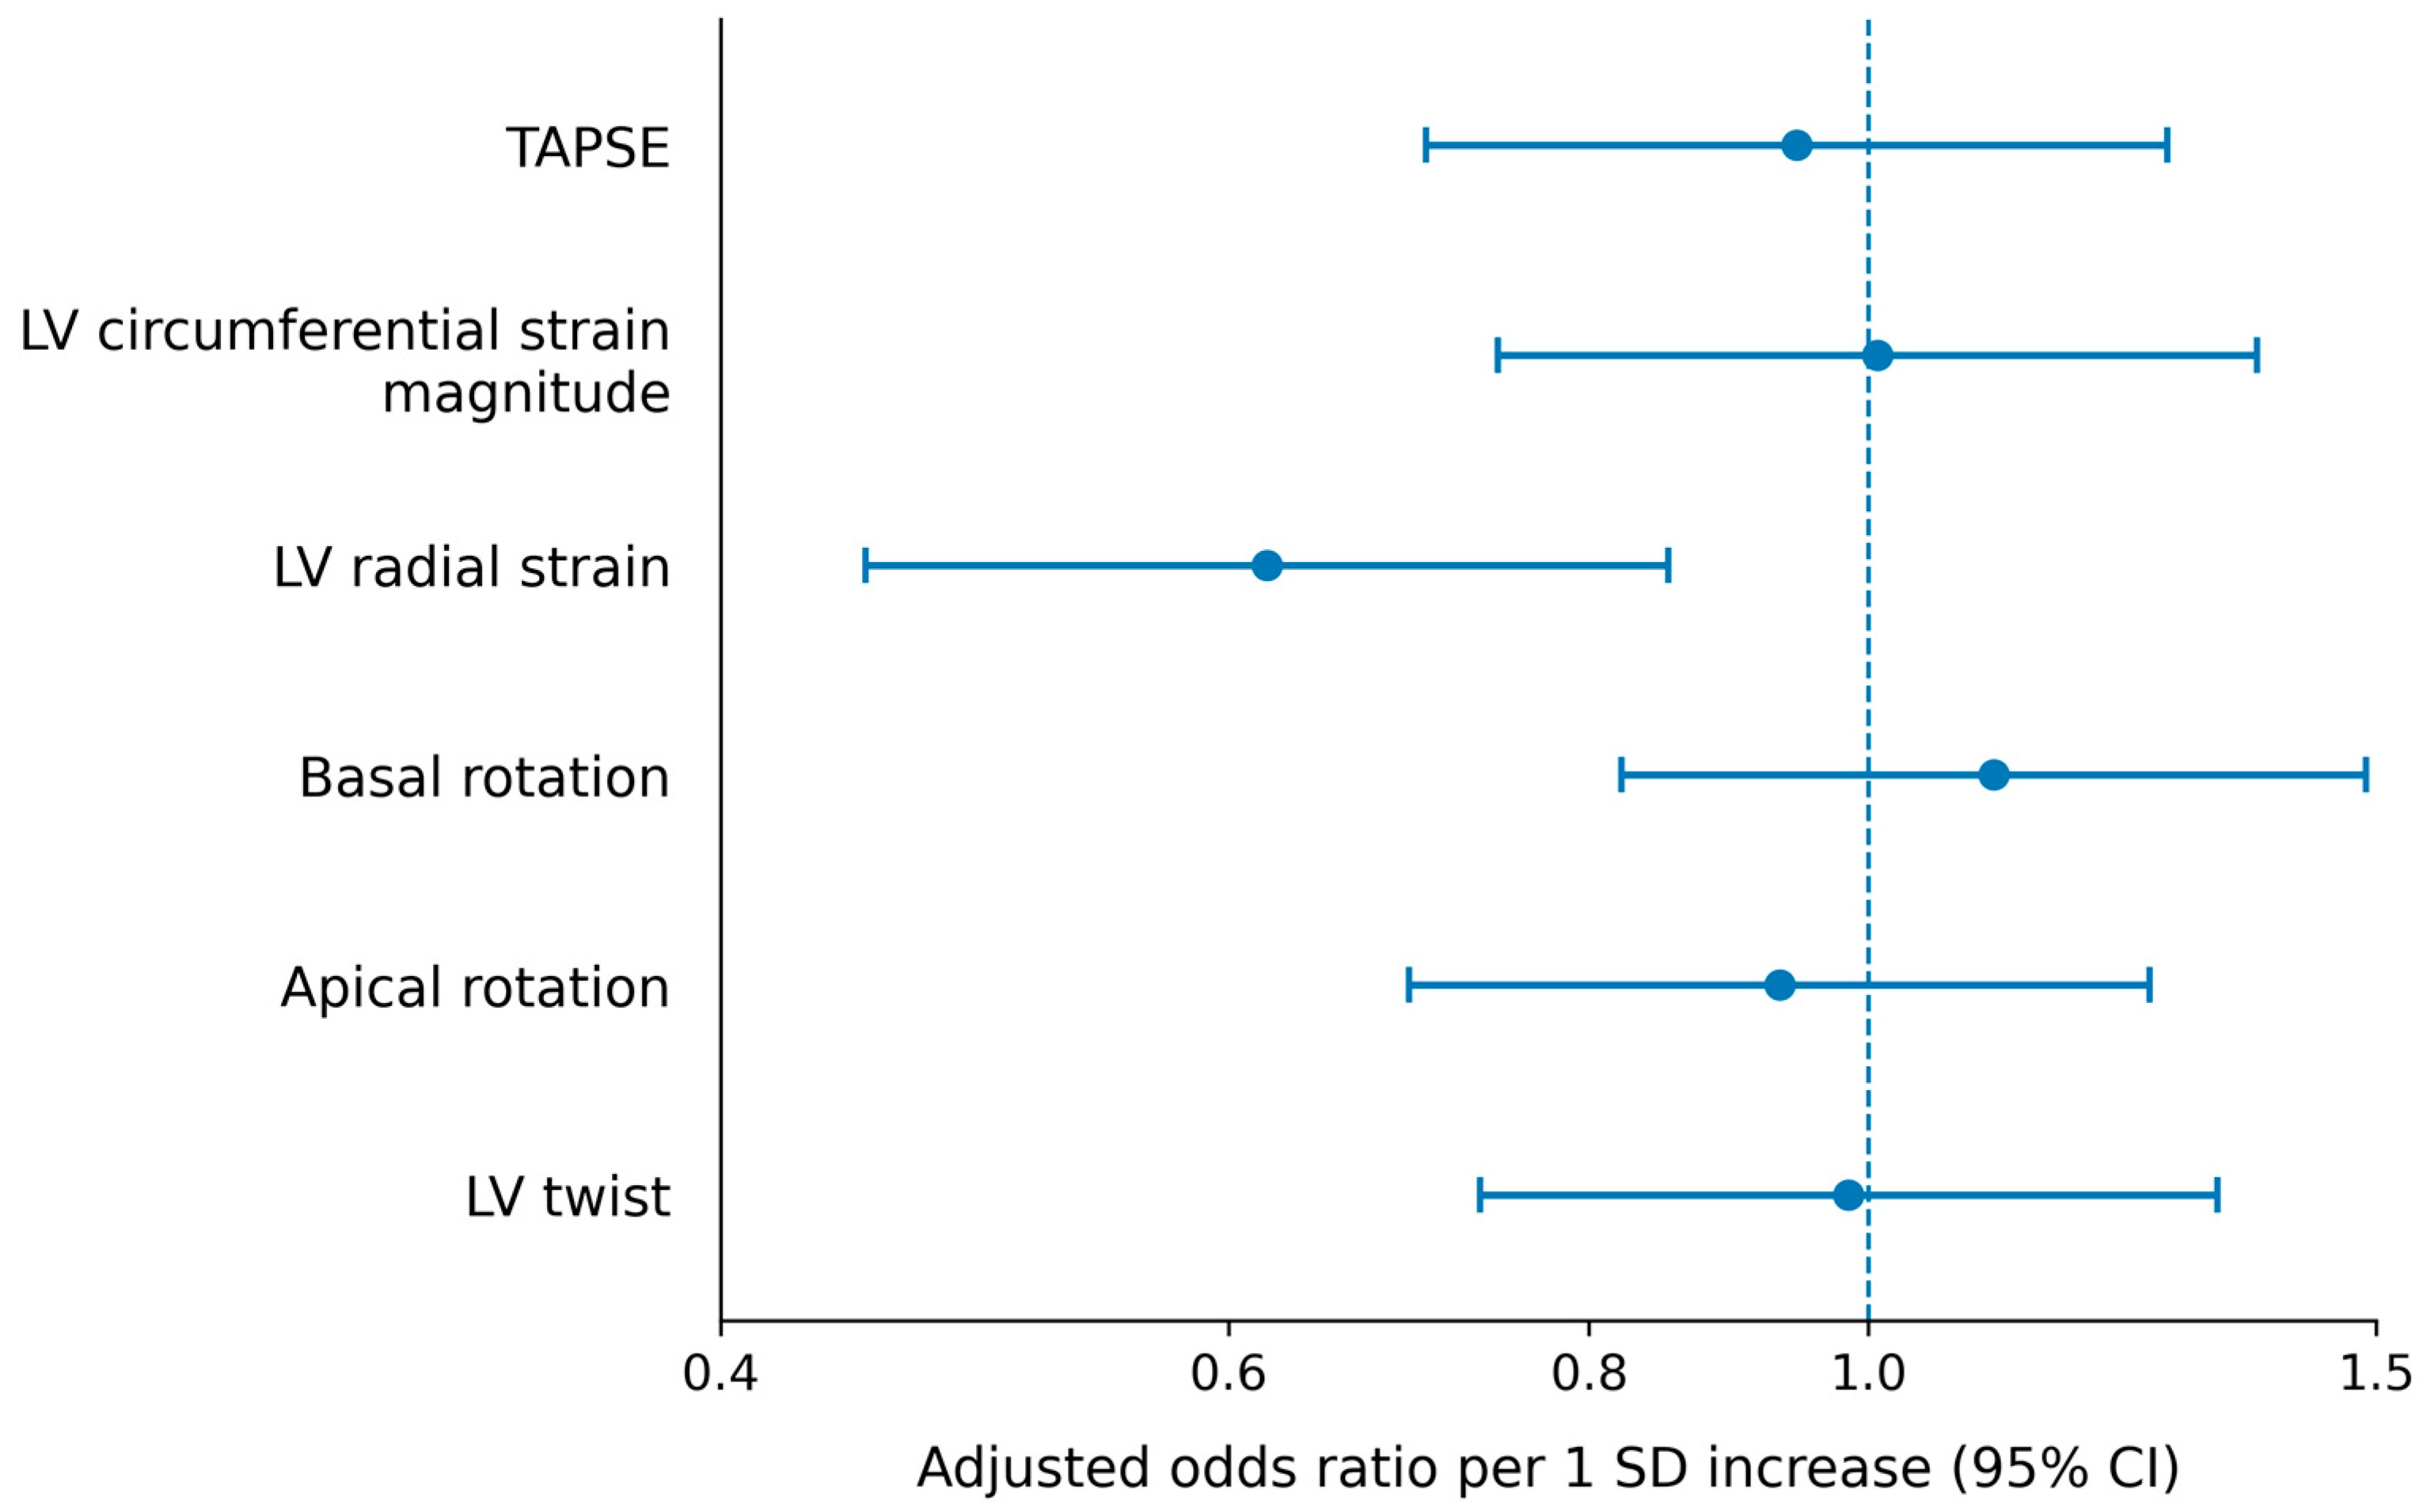
None of the six secondary measures differed between groups after correction of the Mann–Whitney U tests (Table S2). In adjusted analyses, however, higher global radial strain was associated with lower odds of NSVT: the OR per standard deviation was 0.619 (95% CI, 0.449–0.852; p = 0.003; q = 0.020). The corresponding standard deviation was 12.28 percentage points. No other individual secondary measure met the corrected significance threshold (Table 4 and Figure 3).
Table 4.
Exploratory adjusted associations of secondary mechanical measures with documented NSVT.
Figure 3.
Exploratory secondary mechanical associations. Points and horizontal bars show adjusted odds ratios and 95% confidence intervals for an increase of 1 standard deviation in each measure. Each term was added separately to the extended primary model. The vertical line marks an odds ratio of 1. After correction across the six tests, radial strain was the only measure meeting the false discovery rate threshold (q = 0.020). Definitions and sign conventions are detailed in Table 4. CI, confidence interval; LV GLS, left ventricular global longitudinal strain; LV, left ventricular; NSVT, nonsustained ventricular tachycardia; OR, odds ratio; SD, standard deviation; TAPSE, tricuspid annular plane systolic excursion.
The combined circumferential and radial strain block improved model likelihood beyond the extended model (χ2 = 9.233, 2 degrees of freedom; p = 0.010; q = 0.020 across the two block tests). Its apparent AUC was 0.698 and its optimism-corrected AUC was 0.648, with a corrected calibration slope of 0.747. The twist block did not meet the corrected threshold. These block analyses were exploratory.
3.5. Sensitivity and Functional-Form Analyses
The overall LV GLS estimate remained nonsignificant after restricting the analysis to the 195 patients with LVEF ≥ 50%, adding the available clinical or echocardiographic covariates, using robust modified Poisson regression, or excluding four influential observations (Table S1). There was no evidence of LV GLS nonlinearity (p = 0.654), and its overall spline contribution was nonsignificant (p = 0.606). A nominal nonlinear LVOT gradient term was observed (p = 0.048); allowing this term did not materially alter the LV GLS estimate (OR, 0.966; p = 0.433).
A nominal sex-by-LV GLS interaction was observed (likelihood-ratio p = 0.039). This exploratory test was not adjusted for multiplicity and included only 19 NSVT cases among women; conditional estimates are reported in Table S4.
Because ICD carriage was more frequent among patients with documented NSVT, ICD status was added to the models in a further sensitivity analysis despite the indication bias discussed in Section 2.2. Signed LV GLS did not differ by ICD status (median −11.2% [−14.4 to −9.3] with an ICD versus −10.9% [−14.2 to −8.9] without; p = 0.811). With ICD status in the model, the adjusted OR for LV GLS was 0.966 (95% CI, 0.886–1.053; p = 0.426; likelihood-ratio p = 0.424), and ICD carriage itself was associated with NSVT (OR, 2.278; 95% CI, 1.149–4.517). The apparent AUC was 0.691 (95% CI, 0.614–0.764) for the reference model with ICD status and 0.689 (95% CI, 0.613–0.760) after adding LV GLS (paired difference, −0.002; 95% CI, −0.019 to 0.014); optimism-corrected values were 0.652 and 0.644 (Figure S2). The LV GLS estimate was similar in patients without an ICD (n = 67; OR, 0.943; 95% CI, 0.797–1.116) and with an ICD (n = 134; OR, 0.982; 95% CI, 0.885–1.088; interaction p = 0.518). The radial strain association persisted after ICD adjustment (OR per standard deviation, 0.614; 95% CI, 0.443–0.850; Tables S1 and S3).
The radial strain association persisted in the preserved-LVEF subset (OR per standard deviation, 0.633; 95% CI, 0.457–0.876), with additional circumferential strain adjustment, after rank transformation, and in the other reported sensitivity analyses. Robust modified Poisson regression gave a prevalence ratio of 0.830 (95% CI, 0.728–0.945). The full sensitivity results and exploratory block tests are provided in Tables S3 and S4.
4. Discussion
4.1. Principal Findings
In this HCM cohort, signed LV GLS was not independently associated with documented NSVT and did not improve classification beyond age, sex, septal thickness, maximal LVOT gradient, and LVEF. The minimal change in apparent AUC and the absence of an advantage after bootstrap validation support a consistent primary finding. Higher global radial strain was associated with lower odds of NSVT in the exploratory adjusted analyses.
The median LV GLS was numerically less negative in patients without NSVT (−10.9% versus −11.3%). This 0.4-percentage-point difference is smaller than the test–retest variability reported for LV GLS, the interquartile ranges of the two groups were nearly identical (−14.3 to −9.2 versus −14.3 to −9.0), and the adjusted estimate was compatible with effects in either direction. It should therefore be read as the absence of a detectable difference rather than as better contractility among patients with NSVT. A contributing factor may be the uniformly impaired LV GLS of this cohort (median −11.0%, interquartile range −14.3 to −9.0): when nearly all patients have reduced longitudinal shortening, the measure has little range left with which to separate subgroups. Two further observations support this reading. LV GLS is a load- and geometry-dependent deformation index rather than a measure of contractility; in HCM, its reduction tracks the burden of hypertrophy and fibrosis, and in this cohort it correlated weakly with septal thickness (Spearman ρ = 0.13) and not with LVEF (ρ = −0.06). Patients with NSVT had a marginally thicker septum (23.0 versus 22.5 mm), which would predict a less negative LV GLS, yet their median value was marginally more negative; a difference that runs against the expected direction of its own determinants is most plausibly noise.
The 95% confidence interval for the adjusted LV GLS odds ratio (0.884–1.047) excludes associations stronger than approximately 12% per percentage point in either direction. The analysis therefore argues against a moderate or large incremental association in this setting rather than demonstrating the absence of any association. The primary result was consistent across sensitivity analyses and alternative estimators. It indicates a lack of demonstrated incremental discrimination for the recorded global longitudinal amplitude in this cohort, rather than evidence against the broader prognostic relevance of myocardial deformation.
4.2. Relation to Prior Strain and Arrhythmia Studies
The distinction between contemporaneous classification and prognosis helps explain differences across studies. Debonnaire and colleagues related LV GLS and left atrial volume index to appropriate ICD therapy, whereas Hiemstra and colleagues examined longer-term outcomes in a larger HCM cohort [4,5]. Lee and colleagues evaluated myocardial strain within a sudden cardiac death risk framework [6]. These endpoints incorporate subsequent observation and clinical trajectory, while the present binary NSVT outcome concerns arrhythmia captured during a single 24-h recording.
Candan and colleagues studied 63 patients with HCM and ICDs, examining global longitudinal peak strain and mechanical dispersion in relation to appropriate device therapy [10]. Their findings support an association between myocardial mechanics and subsequent ventricular arrhythmias in a selected device population. The present study instead evaluated NSVT documented on ambulatory electrocardiography and did not use ICD therapies as an outcome. Differences in cohort selection and endpoint ascertainment therefore remain important despite similarities in the strain analysis approach.
Studies addressing NSVT more directly have emphasized regional or temporal heterogeneity. Di Salvo and colleagues evaluated regional longitudinal abnormalities during repeated rhythm surveillance [7]. Haland and colleagues linked deformation measurements to fibrosis and ventricular arrhythmias, with mechanical dispersion retaining an adjusted association [8]. Jalanko and colleagues also found an association between mechanical dispersion and NSVT in a genetically defined cohort [9]. Together, these studies suggest that a global amplitude average may not capture the regional and timing abnormalities relevant to arrhythmia.
Wang and colleagues evaluated three-dimensional systolic dyssynchrony alongside several strain components and 24-h NSVT [11]. Differences in imaging dimensionality, measurement definition, and case mix limit direct comparison with the present two-dimensional analysis. Because standardized mechanical dispersion was unavailable here, our findings concern the incremental contribution of global longitudinal amplitude rather than a comparison of amplitude-based and timing-based approaches.
4.3. Interpretation of the Radial Strain Association
Radial strain reflects systolic myocardial thickening and therefore represents a different component of ventricular mechanics from longitudinal shortening [3]. The observed inverse association with documented NSVT may indicate that nonlongitudinal mechanical features provide information not captured by LV GLS alone. The present study was not designed to establish the underlying mechanism.
The unadjusted distributional comparison for radial strain was not significant, whereas its adjusted association with NSVT met the FDR threshold. These analyses address different statistical questions; the secondary finding remains exploratory and requires independent confirmation.
Wang and colleagues included three-dimensional radial and circumferential strain in their arrhythmia assessment [11]. In contrast, the independent strain finding in the cardiac magnetic resonance tissue-tracking study by Pu and colleagues concerned circumferential strain, alongside late gadolinium enhancement [18]. These studies provide context for examining nonlongitudinal mechanics but do not directly validate the present echocardiographic radial association.
The duration of rhythm monitoring bears directly on this finding. NSVT is intermittent, and extended ambulatory monitoring detects ventricular tachyarrhythmias in a substantial proportion of patients in whom a single 24-h recording is negative [19]. Some patients classified here as NSVT-free therefore had undetected NSVT. Because classification did not depend on strain values, this misclassification is expected to be non-differential and to bias associations toward the null, so it is unlikely to have generated the radial strain association; but it also limits what the association can show. The outcome captured is NSVT present on one day rather than the presence of an arrhythmic substrate, the estimate is exploratory and was not significant in the unadjusted comparison, and radial strain is the least reproducible of the strain components (Section 4.5). We therefore regard the association as hypothesis-generating rather than as robust evidence. Establishing it would require prospective enrolment, extended monitoring (multi-day ambulatory recording or an implantable loop recorder) so that the reference standard approaches the true arrhythmic burden, and independent, blinded radial strain measurements with documented reproducibility.
The circumferential and radial strain block improved apparent discrimination, but its optimism-corrected AUC was lower than the apparent estimate and its corrected calibration slope remained below one. The improvement therefore warrants further evaluation rather than a clinical prediction claim.
4.4. Clinical Interpretation
A single 24-h recording may miss intermittent NSVT. Rowin and colleagues demonstrated that extended ambulatory monitoring identifies additional ventricular tachyarrhythmias in HCM [19]. Observation time can therefore influence both measured prevalence and associations with imaging findings. The relatively high NSVT and ICD frequencies in the present cohort should also be considered when applying these findings to other HCM populations.
These findings concern NSVT documented during 24-h ambulatory monitoring and should not be extrapolated to prediction of future sudden cardiac death or used to define clinical strain thresholds. Guideline-based risk assessment remains the appropriate clinical framework [1,2]. The absence of incremental discrimination for LV GLS alone does not exclude the value of combining functional measurements with tissue characterization. Kwak and colleagues evaluated the complementary use of late gadolinium enhancement and LV GLS during longitudinal follow-up, addressing information not uniformly available in the present cohort [20].
The clinical relevance of a null result of this kind lies in what it rules out. LV GLS is now reported routinely in echocardiographic assessments of HCM, and a reduced value is easily read as a marker of arrhythmic propensity. The present data indicate that, in a cohort evaluated with same-day ambulatory monitoring, LV GLS did not identify patients with NSVT beyond what age, sex, wall thickness, outflow gradient, and LVEF already conveyed. An echocardiographic LV GLS value therefore cannot substitute for rhythm monitoring, nor be used to select patients for extended monitoring; ambulatory electrocardiography remains the method by which NSVT is documented [1,2], and imaging parameters that reflect regional heterogeneity or timing of contraction [7,8,9], or tissue characterization [20], are the more promising candidates for complementing it.
Discrimination was modest for all models, including the reference model, and this is consistent with the literature. HCM Risk-SCD, derived for a harder endpoint with five-year follow-up, achieved a C-index of 0.70 (95% CI, 0.68–0.72) in its 3703-patient international validation [21], and the 2020 AHA/ACC and 2023 ESC pathways gave five-year time-dependent AUCs of 0.677 and 0.724 for sudden cardiac death in the cohort of Lee and colleagues [6]. NSVT on a single 24-h recording is a harder target still: it is intermittent, so a proportion of patients classified as NSVT-free carry undetected arrhythmia [19], and this misclassification caps the discrimination that any predictor can reach. The purpose of the present analysis was therefore not to build a clinical classifier but to test whether LV GLS adds information to conventional variables, and that answer does not depend on the absolute level of the reference AUC. Figure 3 displays adjusted odds ratios rather than AUCs; the only block that improved discrimination (circumferential plus radial strain, apparent AUC 0.698, optimism-corrected 0.648) remained modest.
4.5. Limitations
This retrospective, single-centre study included a clinically selected HCM population. The cohort was predominantly obstructive, with a maximal LVOT gradient of at least 30 mmHg in 69.2% of patients, and had high frequencies of documented NSVT (57.2%), ICD carriage (66.7%), and a clinical history of AF (58.2%). These proportions exceed those reported for unselected HCM populations and reflect referral to a tertiary centre with an active device and septal-intervention practice. They limit generalizability to community-based HCM cohorts and may also contribute to the high documented NSVT frequency.
NSVT classification was based on a single 24-h ambulatory recording and may not capture intermittent arrhythmias outside the monitoring period. Device implantation timing was not consistently available. Uniform information on cardiac magnetic resonance fibrosis, genotype, disease duration, and treatment exposure was unavailable. Rhythm status and detailed beat-selection procedures during strain acquisition were not systematically available for retrospective verification.
Because echocardiographic and strain measurements were obtained by joint consensus of two cardiologists rather than by independent observer-specific readings, neither inter-observer nor intra-observer agreement (intraclass correlation coefficients for strain measures, or kappa statistics for NSVT classification) could be calculated, and the reproducibility of strain measurement in this laboratory is therefore undocumented. Published inter-observer and inter-vendor variability for LV GLS is of the order of 1–2 percentage points, which is of the same magnitude as the between-group difference observed here and reinforces the interpretation of the primary result as a null finding. The exact EchoPAC software revision was unavailable. Differences between strain analysis platforms may also affect measurement comparability [22].
Two-thirds of the cohort carried an ICD, and NSVT is itself an indication for device implantation. Because the timing of implantation relative to the index assessment could not be established, part of the association between ICD carriage and documented NSVT may reflect indication bias, with earlier NSVT prompting device therapy and the device population being enriched for recurrent NSVT. ICD status was therefore reported descriptively and was not entered into the models, but this circularity should be kept in mind when interpreting the high NSVT frequency.
The exploratory radial strain finding should also be weighed against the known measurement properties of that parameter. Among speckle-tracking deformation components, radial strain has the lowest reported inter-observer and inter-vendor reproducibility, and its values are more sensitive to region-of-interest placement and frame rate than longitudinal strain. The association was robust across the sensitivity analyses reported here, but its reproducibility in independent data and on other analysis platforms remains to be demonstrated.
No a priori power calculation beyond the protocol specification was performed, because all eligible patients were included. The sample exceeded the prespecified requirement and provided more than 19 events per model parameter, but the observed between-group difference in LV GLS (0.4 percentage points, standardized difference ≈ 0.06) was an order of magnitude smaller than the difference the study was designed to detect. In post hoc power calculations (G*Power 3.1.9.4; large-sample z test for logistic regression with variance correction, R2 of LV GLS on the other covariates = 0.054), power to detect an adjusted OR per standard deviation of LV GLS of 2.0, 1.5, and 1.3 was 99%, 76%, and 41%, respectively; the 95% CI of the observed estimate (OR per standard deviation, 0.87; 0.65–1.18) excludes moderate or large associations but not small ones. The exploratory sex-stratified analysis, with 19 NSVT cases among women, was underpowered.
Pharmacological therapy, an integral part of management in HCM, was not available. Beta-blockers, non-dihydropyridine calcium channel blockers, disopyramide, and amiodarone all reduce ventricular ectopy and NSVT on ambulatory monitoring, and beta-blockers and calcium channel blockers can modestly alter deformation indices through heart rate and loading conditions. In a tertiary cohort with two-thirds device carriage, most patients would be expected to be receiving at least a beta-blocker and a minority amiodarone. Unmeasured treatment therefore acts as a confounder whose direction cannot be established from these data: suppression of NSVT by antiarrhythmic therapy would reclassify some treated patients as NSVT-free and bias associations with any imaging marker toward the null, whereas preferential prescription of antiarrhythmic drugs to patients with previously documented arrhythmia would act in the opposite direction. The absence of medication data is a material limitation of the study and of the exploratory radial strain finding in particular, and should be addressed in prospective work with treatment recorded at the time of monitoring.
Secondary mechanical associations, functional-form analyses, and interaction analyses were exploratory, with multiplicity correction applied within defined test families. Internal bootstrap validation addresses optimism within the present cohort but does not establish performance in an independent population.
5. Conclusions
Signed LV GLS was not independently associated with documented NSVT and did not improve discrimination beyond conventional clinical and echocardiographic variables in this HCM cohort. Higher global radial strain showed an exploratory association with lower odds of documented NSVT and requires independent confirmation with extended rhythm monitoring.
Supplementary Materials
The following supporting information can be downloaded at: https://www.mdpi.com/article/10.3390/medicina62112137/s1. Figure S1: Apparent calibration of the extended primary model; Figure S2: Apparent discrimination for documented NSVT after adjustment for ICD status; Table S1: Sensitivity analyses for signed LV GLS; Table S2: Group distributions of secondary mechanical measures; Table S3: Exploratory sensitivity analyses for global radial strain; Table S4: Functional form, interaction, and exploratory mechanical blocks.
Author Contributions
Conceptualization, M.Z.A. and C.B.A.; methodology, M.Z.A.; software, M.Z.A.; validation, M.Z.A., M.K.T. and C.B.A.; formal analysis, M.Z.A.; investigation, M.Z.A. and M.K.T.; resources, M.K.T.; data curation, M.Z.A. and M.K.T.; writing—original draft preparation, M.Z.A.; writing—review and editing, M.K.T. and C.B.A.; visualization, M.Z.A.; supervision, C.B.A.; project administration, M.Z.A. All authors have read and agreed to the published version of the manuscript.
Funding
This research received no external funding.
Institutional Review Board Statement
The study was conducted in accordance with the Declaration of Helsinki, and approved by the Non-Interventional Clinical Research Ethics Committee of Kayseri City Hospital (decision no. 991, 16 June 2026).
Informed Consent Statement
Patient consent was waived by the ethics committee because the study was a retrospective analysis of de-identified records collected during routine clinical care, with no additional intervention and no identifiable individual patient material reported.
Data Availability Statement
The data presented in this study are available on request from the corresponding author. The data are not publicly available because the source records contain potentially identifying clinical information and the institutional ethics approval does not cover open deposition. A fully de-identified analytic dataset can be shared for academic purposes subject to institutional authorization and applicable privacy requirements.
Acknowledgments
During the preparation of this manuscript, the authors used Claude Opus 5 (Anthropic, San Francisco, CA, USA) for independent verification of the reported statistical estimates and for language and formatting editing. The authors have reviewed and edited the output and take full responsibility for the content of this publication.
Conflicts of Interest
The authors declare no conflicts of interest.
References
- Ommen, S.R.; Ho, C.Y.; Asif, I.M.; Balaji, S.; Burke, M.A.; Day, S.M.; Dearani, J.A.; Epps, K.C.; Evanovich, L.; Ferrari, V.A.; et al. 2024 AHA/ACC/AMSSM/HRS/PACES/SCMR Guideline for the Management of Hypertrophic Cardiomyopathy: A Report of the American Heart Association/American College of Cardiology Joint Committee on Clinical Practice Guidelines. Circulation 2024, 149, e1239–e1311. [Google Scholar] [CrossRef] [Scilit] [PubMed]
- Arbelo, E.; Protonotarios, A.; Gimeno, J.R.; Arbustini, E.; Barriales-Villa, R.; Basso, C.; Bezzina, C.R.; Biagini, E.; Blom, N.A.; de Boer, R.A.; et al. 2023 ESC Guidelines for the Management of Cardiomyopathies. Eur. Heart J. 2023, 44, 3503–3626. [Google Scholar] [CrossRef] [Scilit] [PubMed]
- Smiseth, O.A.; Torp, H.; Opdahl, A.; Haugaa, K.H.; Urheim, S. Myocardial Strain Imaging: How Useful Is It in Clinical Decision Making? Eur. Heart J. 2016, 37, 1196–1207. [Google Scholar] [CrossRef] [Scilit] [PubMed]
- Debonnaire, P.; Thijssen, J.; Leong, D.P.; Joyce, E.; Katsanos, S.; Hoogslag, G.E.; Schalij, M.J.; Atsma, D.E.; Bax, J.J.; Delgado, V.; et al. Global Longitudinal Strain and Left Atrial Volume Index Improve Prediction of Appropriate Implantable Cardioverter Defibrillator Therapy in Hypertrophic Cardiomyopathy Patients. Int. J. Cardiovasc. Imaging 2014, 30, 549–558. [Google Scholar] [CrossRef] [Scilit] [PubMed]
- Hiemstra, Y.L.; Debonnaire, P.; Bootsma, M.; van Zwet, E.W.; Delgado, V.; Schalij, M.J.; Atsma, D.E.; Bax, J.J.; Marsan, N.A. Global Longitudinal Strain and Left Atrial Volume Index Provide Incremental Prognostic Value in Patients with Hypertrophic Cardiomyopathy. Circ. Cardiovasc. Imaging 2017, 10, e005706. [Google Scholar] [CrossRef] [Scilit] [PubMed]
- Lee, H.J.; Kim, H.K.; Lee, S.C.; Kim, J.; Park, J.B.; Lee, S.P.; Kim, Y.J. Performance of 2020 AHA/ACC HCM Guidelines and Incremental Value of Myocardial Strain for Predicting SCD. JACC Asia 2024, 4, 10–22. [Google Scholar] [CrossRef] [Scilit] [PubMed]
- Di Salvo, G.; Pacileo, G.; Limongelli, G.; Baldini, L.; Rea, A.; Verrengia, M.; D’Andrea, A.; Russo, M.G.; Calabrò, R. Non Sustained Ventricular Tachycardia in Hypertrophic Cardiomyopathy and New Ultrasonic Derived Parameters. J. Am. Soc. Echocardiogr. 2010, 23, 581–590. [Google Scholar] [CrossRef] [Scilit] [PubMed]
- Haland, T.F.; Almaas, V.M.; Hasselberg, N.E.; Saberniak, J.; Leren, I.S.; Hopp, E.; Edvardsen, T.; Haugaa, K.H. Strain Echocardiography Is Related to Fibrosis and Ventricular Arrhythmias in Hypertrophic Cardiomyopathy. Eur. Heart J. Cardiovasc. Imaging 2016, 17, 613–621. [Google Scholar] [CrossRef] [Scilit] [PubMed]
- Jalanko, M.; Tarkiainen, M.; Sipola, P.; Jääskeläinen, P.; Lauerma, K.; Laine, M.; Nieminen, M.S.; Laakso, M.; Heliö, T.; Kuusisto, J. Left Ventricular Mechanical Dispersion Is Associated with Nonsustained Ventricular Tachycardia in Hypertrophic Cardiomyopathy. Ann. Med. 2016, 48, 417–427. [Google Scholar] [CrossRef] [Scilit] [PubMed]
- Candan, O.; Gecmen, C.; Bayam, E.; Guner, A.; Celik, M.; Doğan, C. Mechanical Dispersion and Global Longitudinal Strain by Speckle Tracking Echocardiography: Predictors of Appropriate Implantable Cardioverter Defibrillator Therapy in Hypertrophic Cardiomyopathy. Echocardiography 2017, 34, 835–842. [Google Scholar] [CrossRef] [Scilit] [PubMed]
- Wang, R.; Zhuang, H.; Xu, N.; Zhang, L.; Xing, J.; Zhang, T.; Kang, L.; Song, L.; Pang, K. Systolic Dyssynchrony Index in Hypertrophic Cardiomyopathy: Association with Ventricular Arrhythmias and Risk Prediction. JACC Asia 2025, 5, 1050–1061. [Google Scholar] [CrossRef] [Scilit] [PubMed]
- von Elm, E.; Altman, D.G.; Egger, M.; Pocock, S.J.; Gøtzsche, P.C.; Vandenbroucke, J.P. The Strengthening the Reporting of Observational Studies in Epidemiology (STROBE) Statement: Guidelines for Reporting Observational Studies. PLoS Med. 2007, 4, e296. [Google Scholar] [CrossRef] [Scilit] [PubMed]
- Lang, R.M.; Badano, L.P.; Mor-Avi, V.; Afilalo, J.; Armstrong, A.; Ernande, L.; Flachskampf, F.A.; Foster, E.; Goldstein, S.A.; Kuznetsova, T.; et al. Recommendations for Cardiac Chamber Quantification by Echocardiography in Adults: An Update from the American Society of Echocardiography and the European Association of Cardiovascular Imaging. J. Am. Soc. Echocardiogr. 2015, 28, 1–39.e14. [Google Scholar] [CrossRef] [Scilit] [PubMed]
- Steyerberg, E.W.; Harrell, F.E., Jr.; Borsboom, G.J.J.M.; Eijkemans, M.J.C.; Vergouwe, Y.; Habbema, J.D.F. Internal Validation of Predictive Models: Efficiency of Some Procedures for Logistic Regression Analysis. J. Clin. Epidemiol. 2001, 54, 774–781. [Google Scholar] [CrossRef] [Scilit] [PubMed]
- Van Calster, B.; McLernon, D.J.; van Smeden, M.; Wynants, L.; Steyerberg, E.W. Calibration: The Achilles Heel of Predictive Analytics. BMC Med. 2019, 17, 230. [Google Scholar] [CrossRef] [Scilit] [PubMed]
- Benjamini, Y.; Hochberg, Y. Controlling the False Discovery Rate: A Practical and Powerful Approach to Multiple Testing. J. R. Stat. Soc. Ser. B Methodol. 1995, 57, 289–300. [Google Scholar] [CrossRef] [Scilit]
- Zou, G. A Modified Poisson Regression Approach to Prospective Studies with Binary Data. Am. J. Epidemiol. 2004, 159, 702–706. [Google Scholar] [CrossRef] [Scilit] [PubMed]
- Pu, C.; Fei, J.; Lv, S.; Wu, Y.; He, C.; Guo, D.; Mabombo, P.U.; Chooah, O.; Hu, H. Global Circumferential Strain by Cardiac Magnetic Resonance Tissue Tracking Associated with Ventricular Arrhythmias in Hypertrophic Cardiomyopathy Patients. Front. Cardiovasc. Med. 2021, 8, 670361. [Google Scholar] [CrossRef] [Scilit] [PubMed]
- Rowin, E.J.; Das, G.; Madias, C.; Hsu, M.; Crosson, L.; Turakhia, M.P.; Maron, B.J.; Maron, M.S. Extended Ambulatory ECG Monitoring Enhances Identification of Higher-Risk Ventricular Tachyarrhythmias in Patients with Hypertrophic Cardiomyopathy. Heart Rhythm 2025, 22, 1696–1704. [Google Scholar] [CrossRef] [Scilit] [PubMed]
- Kwak, S.; Kim, J.; Jeong, M.H.; Park, C.S.; Lee, H.J.; Park, J.B.; Lee, S.P.; Lee, Y.S.; Park, E.A.; Lee, W.; et al. Integrated Use of Late Gadolinium Enhancement and Left Ventricular Global Longitudinal Strain in Hypertrophic Cardiomyopathy. JACC Asia 2026, 6, 193–205. [Google Scholar] [CrossRef] [Scilit] [PubMed]
- O’Mahony, C.; Jichi, F.; Ommen, S.R.; Christiaans, I.; Arbustini, E.; Garcia-Pavia, P.; Cecchi, F.; Olivotto, I.; Kitaoka, H.; Gotsman, I.; et al. International External Validation Study of the 2014 European Society of Cardiology Guidelines on Sudden Cardiac Death Prevention in Hypertrophic Cardiomyopathy (EVIDENCE-HCM). Circulation 2018, 137, 1015–1023. [Google Scholar] [CrossRef] [Scilit] [PubMed]
- Rhee, T.M.; Kim, H.K.; Choi, Y.J.; Lee, H.J.; Hwang, I.C.; Yoon, Y.E.; Kim, H.L.; Park, J.B.; Lee, S.P.; Kim, Y.J.; et al. Agreement of Two Vendor-Independent Strain Analysis Software Platforms in Assessing Left Ventricular Global Longitudinal Strain. Int. J. Cardiovasc. Imaging 2022, 38, 1939–1950. [Google Scholar] [CrossRef] [Scilit] [PubMed]

Disclaimer/Publisher’s Note: The statements, opinions and data contained in all publications are solely those of the individual author(s) and contributor(s) and not of MDPI and/or the editor(s). MDPI and/or the editor(s) disclaim responsibility for any injury to people or property resulting from any ideas, methods, instructions or products referred to in the content. |
© 2026 by the authors. Published by MDPI on behalf of the Lithuanian University of Health Sciences. Licensee MDPI, Basel, Switzerland. This article is an open access article distributed under the terms and conditions of the Creative Commons Attribution (CC BY) license.