


Abstract
Background: Chronic adenoidal disease and otitis media with effusion are prevalent pediatric conditions frequently associated with localized microbial dysbiosis. This study aimed to characterize the adenoid surface microbiome in children with isolated adenoid hypertrophy (AH) and AH with concurrent middle ear effusion, comparing them against a healthy pediatric nasopharyngeal baseline to elucidate the specific ecological shifts driving these interrelated pathologies. Methods: High-throughput 16S rRNA gene sequencing was performed on clinical samples from three distinct pediatric cohorts: isolated AH, AH with OME, and healthy controls. Microbial community architecture was evaluated using comprehensive alpha- and beta-diversity metrics. Taxonomic shifts and biomarker discovery were determined utilizing robust ANCOM-BC2, DESeq2, and LEfSe methodologies. Results: Alpha-diversity analyses revealed a profound, statistically significant reduction in microbial richness and community evenness across both disease cohorts compared to healthy controls (Observed ASVs p < 0.001; Shannon p < 0.001). Beta-diversity metrics demonstrated distinct, significant structural clustering (p < 0.001) that cleanly separated healthy microbiomes from diseased microbiomes. Differential abundance analyses confirmed this ecological collapse was driven by the severe depletion of health-associated commensals (including Streptococcus, Veillonella, Corynebacterium, and Rothia) and a uniform overgrowth of opportunistic pathogens, most notably Haemophilus, Moraxella, and Fusobacterium. Crucially, stringent ANCOM-BC2 comparative modeling between the isolated AH and AH with OME cohorts revealed highly homologous microbial architectures with no significant differential taxa. Conclusions: Pediatric adenoid hypertrophy is characterized by a profound collapse of the nasopharyngeal microbiome, marked by the depletion of commensals and an overgrowth of opportunistic pathogens such as Haemophilus, Moraxella, and Fusobacterium. Notably, the microbial architectures of isolated adenoid hypertrophy and adenoid hypertrophy with concurrent otitis media with effusion are highly homologous, lacking robust compositional differences.
1. Introduction
The upper respiratory tract serves as the primary gateway for inhaled environmental particles and microorganisms. To manage this continuous exposure, the mucosal surface functions as a highly dynamic, immunologically active junction [1]. Far from being sterile, this niche hosts a complex, resident microbiome that plays a fundamental role in educating the host immune system, maintaining mucosal homeostasis, and providing colonization resistance against opportunistic pathogens [2]. In healthy pediatric populations, the nasopharyngeal microbiota is typically characterized by a stable consortium of commensal genera, which collaboratively maintain a balanced microenvironment.
Within the architecture of Waldeyer’s ring, the pharyngeal tonsil (known as the adenoid or adenoids in regard to severely enlarged tissue) occupies a strategic anatomical position at the roof of the nasopharynx. Its reticular epithelium and deep crypts are essential for local immune surveillance and antigen sampling [3]. However, this same highly invaginated topography renders the adenoid highly susceptible to bacterial colonization and biofilm formation. Consequently, the adenoid can transition from a protective lymphoid organ into a chronic reservoir for localized dysbiosis and persistent microorganism-driven inflammation [4,5].
This “adenoid reservoir” is heavily implicated in the pathogenesis of prevalent pediatric otolaryngological conditions, most notably Adenoid Hypertrophy (AH) and Otitis Media with Effusion (OME) [5]. Given the anatomical proximity of the adenoid to the Eustachian tube orifice, a chronically inflamed and dysbiotic adenoid can disrupt middle-ear ventilation through both physical obstruction and the propagation of ascending inflammatory cascades [6]. While traditional clinical management of persistent OME frequently involves tympanostomy tube insertion, adjuvant adenoidectomy is heavily utilized to eradicate this inflammatory source [6,7].
Historically, investigations into the microbiology of AH and OME relied on culture-based methodologies, which often spotlighted classical pathogens such as Haemophilus influenzae, Streptococcus pneumoniae, and Moraxella catarrhalis. However, culture techniques inherently fail to capture the complexity of polymicrobial biofilms, fastidious anaerobes, and the broader ecological shifts that dictate disease chronicity [8]. The advent of culture-independent, high-throughput 16S rRNA gene amplicon sequencing has revolutionized this field, revealing that disease states are driven not merely by the presence of single pathogens, but by a profound collapse in overall microbial diversity and a depletion of protective commensals [9].
Recent evidence suggests that the surface microbiome of the hypertrophic adenoid undergoes a distinct dysbiotic shift compared to healthy baseline cohorts, regardless of whether concurrent middle-ear effusion is present [10]. However, characterizing the pediatric microbiome is inherently complex due to significant inter-individual variability, age-dependent immune maturation, and environmental confounders. To date, many 16S rRNA sequencing studies in this domain have been constrained by modest sample sizes, which limits the statistical power required to definitively establish core dysbiotic signatures across diverse clinical demographics.
To address this gap and validate preliminary ecological patterns, the present study utilizes an expanded clinical cohort to characterize the adenoid surface microbiome. By utilizing 16S rRNA gene V3-V4 sequencing across an enlarged population of pediatric patients—comprising children with isolated adenoid hypertrophy, those with concurrent OME, and a strictly defined healthy control group—we aim to provide a more robust, highly powered analysis of the dysbiotic shifts and commensal depletion driving chronic adenoidal disease.
2. Materials and Methods
2.1. Ethics Statement
The official approval of Riga Stradiņš University Ethics Committee (approval nr. 2-PE K-4/264/2022) was received. Informed consent was provided by all participants and/or their representatives. Procedures were conducted in accordance with the Helsinki declaration on biomedical studies.
2.2. Participant Selection and Inclusion and Exclusion Criteria
Adenoid surface swabs needed for our research were collected from the adenoid tissue for our two study groups and nasopharyngeal swabs in our control group. All swabs were collected for children aged 3 to 9 years. The two researched study groups were divided by the status of their middle ear—our first study group consisted of adenoid surface swabs of children with no middle ear effusion (healthy middle ears) and our second study group consisted of adenoid swabs of children with otitis media with effusion documented by type B tympanogram recorded on at least two separate occasions over a 4-month period.
Adenoid swabs were acquired after the adenoid tissue was removed during adenotomy operations immediately after the tissue itself was taken out. The timeframe of sample collection was 2022 to 2025. All surgical procedures were performed by one surgeon maintaining the same operation technique and instrument set (adenotomy curette) with visualization via laryngeal mirror.
The clinical cohort evaluated in this study represents an expansion of our previously published data [11,12], augmented with 20 additional pediatric samples to provide the increased statistical power necessary for robust microbiome modeling.
2.2.1. Inclusion Criteria for the Study Group That Included Adenoid Swabs of Children with Adenoid Hypertrophy but No Middle Ear Effusion
- Age of participant—3 to 9 years old;
- Clinical criteria—Adenoid hypertrophy grade II, III or IV (proven endoscopically and/or via computed tomography (CT) or magnetic resonance imaging (MRI);
- Tympanometry findings—Bilateral A type tympanogram;
- Ethical compliance—Obtained informed consent from the patients’ parents and/or legal representatives.
2.2.2. Inclusion Criteria for the Study Group That Included Adenoid Swabs of Children with Adenoid Hypertrophy and Middle Ear Effusion
- Age of participant—3 to 9 years old;
- Clinical criteria—Adenoid hypertrophy grade II, III or IV (proven endoscopically and/or via computed tomography (CT) or magnetic resonance imaging (MRI);
- Tympanometry findings—Bilateral or unilateral type B tympanogram recorded at least twice over a 4-month period;
- Ethical compliance—Obtained informed consent from the patients’ parents and/or legal representatives.
2.2.3. Inclusion Criteria for the Control Group
- Age of participant—3 to 9 years old;
- Clinical criteria—No endoscopic evidence of adenoid tissue enlargement greater than Grade II;
- No prior adenoid or middle ear surgeries;
- Type A tympanogram bilaterally;
- Relative health—No history or respiratory infections within the preceding 2 weeks.
2.2.4. Exclusion Criteria for Both Study Groups and Control Group
- Participants outside of the required age gap;
- Refusal of the patients, his/her parents or the legal representative to participate in the study;
- Patients from outside of Latvia to negate geography associated microbiome variations;
- Signs of acute upper and lower respiratory tract infections (acute rhinosinusitis, acute tonsillopharyngitis, acute pneumonia or bronchitis) and acute middle ear infections;
- Patients with severe health conditions that may alter the composition of microbiome due to immune system dysfunction, including AIDS, viral hepatitis, malignancies and malignancy-associated chemotherapy or radiotherapy, diabetes mellitus, and autoimmune diseases (sarcoidosis, granulomatosis with polyangiitis);
- Congenital cranial malformations, including cleft lip/palate;
- Participants receiving currently or who have received systemic or topical antibiotic medications or other microbiome-altering substances and probiotics within two weeks of sample acquisition.
2.3. Sample Acquisition for Both Study Groups
Surface swabs of adenoid tissue were collected immediately following surgical excision during an adenotomy performed under general anesthesia. To ensure procedural consistency, all surgeries were standardized and performed by a single surgeon utilizing a uniform technique. Following endotracheal intubation, the perioral region, gums, and inner buccal mucosa were prepped three times with a chlorhexidine-based solution to minimize the risk of contamination from oropharyngeal microflora. The antiseptic was applied strictly using targeted sponges, avoiding any pooling or aerosolization, preventing the solution from reaching into the nasopharyngeal space.
The adenoid tissue was excised using a curette under visual guidance with a laryngeal mirror. To prevent cross-contamination, the tissue was carefully extracted through the oral cavity, strictly avoiding contact with the inner mucosal surfaces, teeth, and gums. The excised adenoid was immediately placed on a sterile field facing upward. A sterile swab was applied to the tissue’s surface invaginations and rotated several times across multiple locations. Samples were promptly secured in a COPAN eNat® transport system (Copan, Brescia, Lombardy, Italy) and transported to the Latvian Biomedical Research and Study Centre for preservation and subsequent sequencing.
2.4. Sample Acquisition for Control Group
For our control group we collected nasopharyngeal swabs from children of the designated age with no symptoms of acute upper respiratory disease at the moment of collection and prior two weeks.
The tongue of the participants was pressed downward to create an unobstructed path for the inspection of the tip of the swab. The tip was introduced into the nasopharynx and rotated once and then immediately removed without touching the inner buccal surface, the tongue or the soft and hard palate. The swab was placed into COPAN eNat® transport system (Copan, Brescia, Lombardy, Italy) and transported to the National Institute of Research and Innovation for preservation and subsequent sequencing.
Collecting direct samples from the surface of the removed adenoid tissue for the control group was unfeasible for multiple reasons (legal, clinical and ethical)—healthy tissue cannot and should not be removed from healthy participants in a surgical way, especially in children; thus we were limited to transoral nasopharyngeal swabs.
2.5. Sample Sequencing and Processing
Genomic DNA was isolated from the collected samples utilizing the FastDNA Spin Kit for Soil (MP Biomedicals, Santa Ana, CA, USA) in accordance with the manufacturer’s guidelines, with sample homogenization performed on a FastPrep-24™ Instrument (MP Biomedicals). To profile the microbial communities, the V3–V4 hypervariable regions of the 16S rRNA gene were targeted for amplification using the 341F/805R primer pair. Library preparation employed a two-stage PCR strategy, with unique dual-index barcodes introduced during the secondary amplification step. Procedural integrity was monitored by incorporating two negative controls during the PCR phase, which were validated via agarose gel electrophoresis; subsequently, one negative control was sequenced alongside each of the three sample batches. Following amplification, the amplicon libraries were purified utilizing a magnetic bead-based clean-up protocol (Macherey-Nagel, Düren, Germany). Nucleic acid concentrations and library quality were evaluated using a Qubit Fluorometer (Thermo Fisher Scientific, Waltham, MA, USA) and an Agilent 2100 Bioanalyzer (Agilent, Santa Clara, CA, USA), respectively. Finally, sequencing was executed on an Illumina MiSeq platform (Illumina, San Diego, CA, USA) deploying the MiSeq Reagent Kit v2 (500-cycles), securing a sequencing depth of at least 100,000 paired-end reads per sample.
2.6. Data Analysis—16S rRNA Gene Amplicon Sequence Processing
Raw-read quality was assessed using FastQC v0.12.1 [13] and summarized with MultiQC v1.34 [14]. Primers were removed using Cutadapt v5.2 [15], allowing a maximum error rate of 0.1; reads without the expected primers were discarded. Quality filtering, denoising, paired-read merging, chimera removal, and amplicon sequence variant (ASV) inference were performed using DADA2 v1.38.0 [16]. Forward and reverse reads were truncated to 225 and 215 nucleotides, respectively, with maximum expected errors of 3. Potential contaminant ASVs were identified using the prevalence-based method implemented in Decontam version 3.24 [17]. Technical negative controls and biological specimens were designated as controls and samples, respectively. ASVs classified as contaminants using a threshold of 0.1 were removed before subsequent filtering and taxonomic analysis. ASVs were screened for bacterial and archaeal small-subunit rRNA sequences using Barrnap v0.9 and Biostrings v2.58.0. Taxonomy was assigned against SILVA release 138.2 [18] using the DADA2 naïve Bayesian classifier with a minimum bootstrap confidence of 50. Mitochondrial and chloroplast sequences were removed. QIIME 2 v2026.4.0 [19] was used to generate the filtered abundance table, taxonomic outputs, diversity measures, and phylogenetic tree. The resulting data were combined with the sample metadata in a phyloseq object for downstream analysis.
2.7. Data Analysis—Statistics
Analyses were conducted in R v4.6.0 using phyloseq v1.56.0 [20]. Samples were classified as “Control”, “Adenoid”, or “Adenoid_ear”. Alpha diversity was evaluated using observed ASV richness and the Shannon and inverse Simpson indices. Beta diversity was assessed using Bray–Curtis dissimilarity and weighted and unweighted UniFrac distances and visualized by principal coordinate analysis. Taxonomic composition was summarized at the phylum, family, and genus levels using relative abundances. The 12 most abundant taxa at each rank were displayed, with the remainder grouped as “Other.” Genus-level heatmaps included up to 30 genera detected in at least 10% of samples. Relative abundances were log10-transformed with a pseudocount of 10−6 and standardized as row-wise z-scores.
Overall differences in alpha diversity were tested using Kruskal–Wallis tests. Differences in community composition were assessed by global and pairwise permutational multivariate analysis of variance (PERMANOVA) using adonis2 in vegan v2.7-3 with 9999 permutations. Homogeneity of multivariate dispersion was evaluated using PERMDISP. Models were adjusted for sex when estimable. Pairwise comparisons included Control versus Adenoid, Control versus Adenoid ear, and Adenoid versus Adenoid ear. Genus-level differential abundance was evaluated primarily using ANCOM-BC2 in ANCOMBC v2.14.0 [21], including genera detected in at least 10% of samples. Models included clinical group and sex when estimable, and structural-zero detection and pseudocount sensitivity analysis were enabled. DESeq2 v1.52.0 [22] was used as a complementary count-based sensitivity analysis. LEfSe [23], implemented in microbiomeMarker v1.13.2 [24], was used as an exploratory analysis with a Kruskal–Wallis threshold of p < 0.05 and a minimum linear discriminant analysis score of 2.0. LEfSe findings were considered supportive because this method did not adjust for sex. Unless otherwise specified, p values were adjusted using the Benjamini–Hochberg method, and an adjusted p value (q) < 0.05 was considered statistically significant.
3. Results
3.1. Overall Population Statistics
A total of 78 adenoid swab samples from 78 pediatric participants were included in the study. The cohort was evenly divided into three groups, with each group consisting of 26 samples.
The study population comprised 43 males and 35 females. Because the age distribution was non-normal (Shapiro–Wilk test, p < 0.001), demographic data are reported as medians and ranges (Table 1). The median age of the entire cohort was 5.0 years (range: 3.0–9.0 years).
Table 1.
Descriptive statistics.
3.2. Alpha Diversity
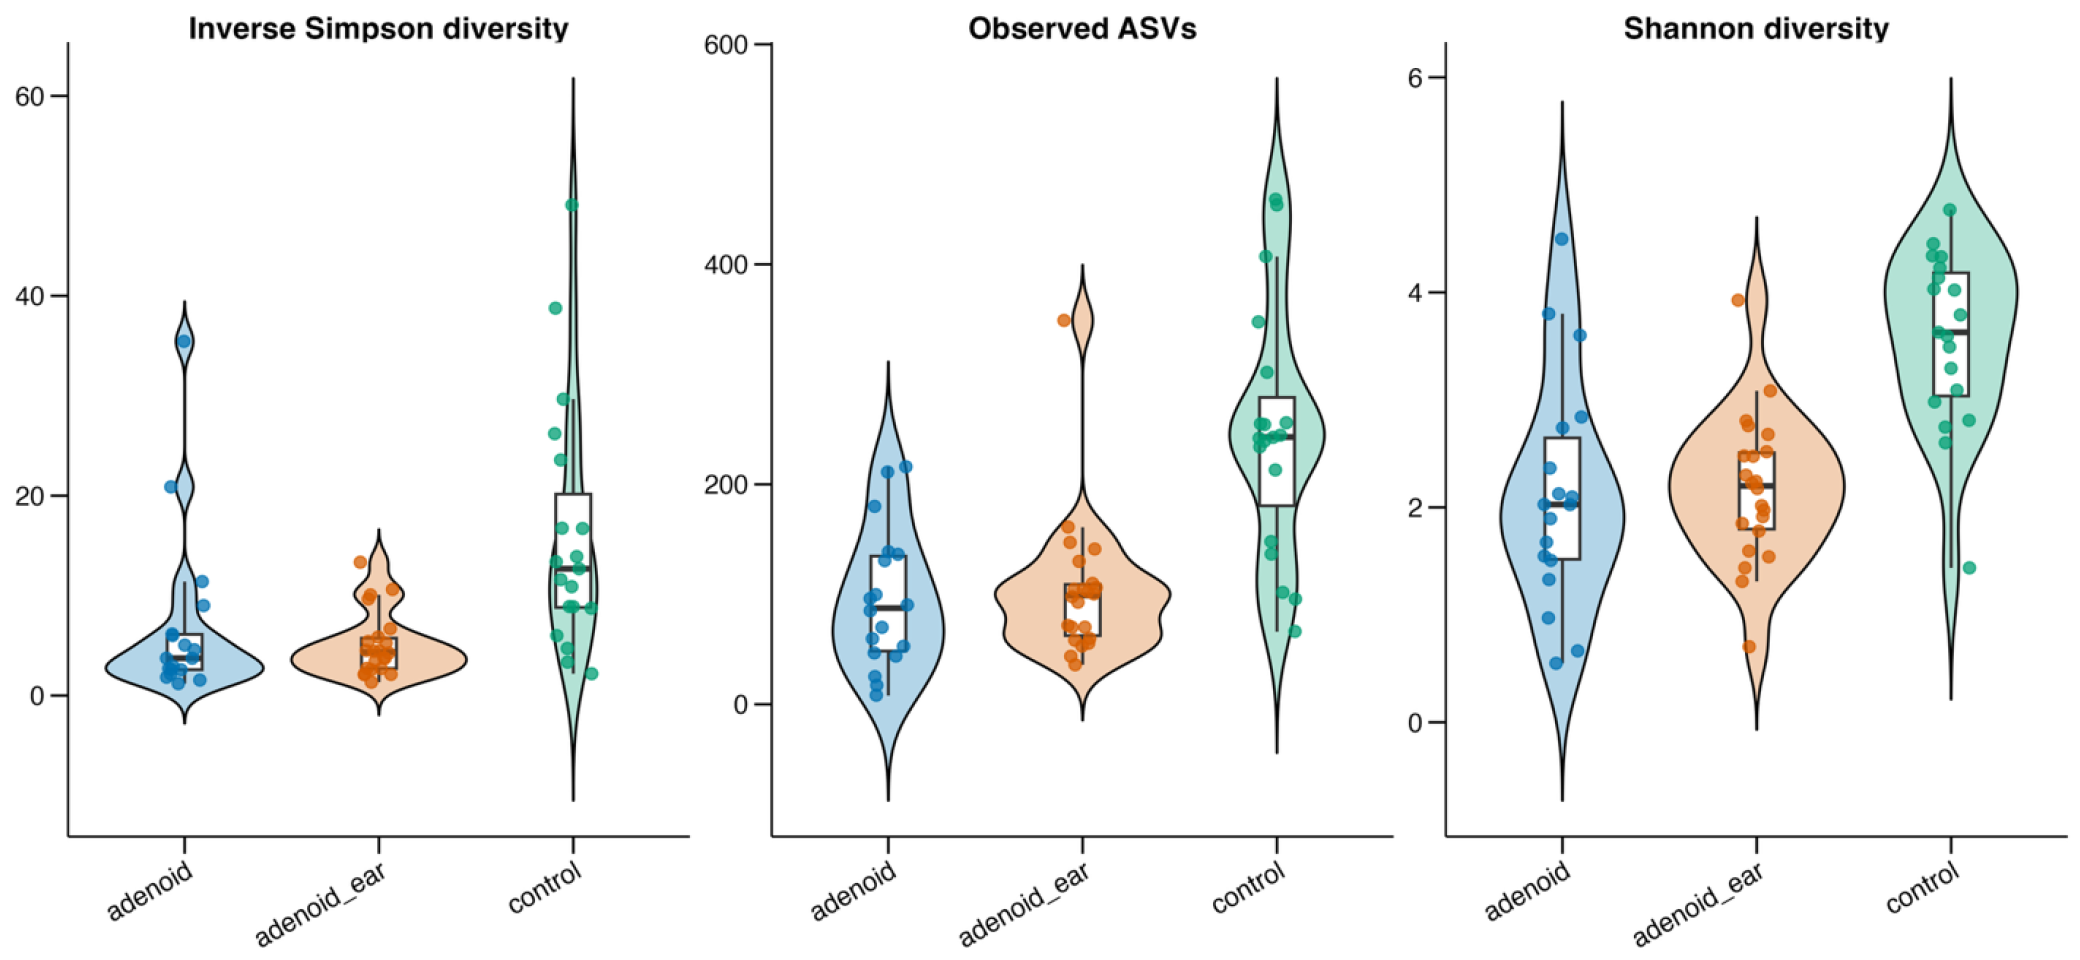
To evaluate the structural complexity and within-sample ecological richness of the nasopharyngeal microbiome, alpha-diversity metrics were calculated and compared across the three clinical cohorts (Figure 1). Global comparisons utilizing Kruskal–Wallis testing revealed highly significant differences among the biological groups across all measured alpha-diversity indices: Observed ASVs (p = 0.000011, adjusted q = 0.000025), Shannon diversity (p = 0.000017, adjusted q = 0.000025), and Inverse Simpson diversity (p = 0.000235, adjusted q = 0.000235).
The healthy control group exhibited a highly diverse microbial ecosystem, demonstrating the highest taxonomic richness (median Observed ASVs: 243.0) and community evenness (median Shannon index: 3.63; median Inverse Simpson index: 12.69).
In contrast, both adenoidal disease cohorts demonstrated a microbiome shift characterized by a massive reduction in overall microbial diversity. The isolated Adenoid Hypertrophy group (median Observed ASVs: 87.5; median Shannon index: 2.03; median Inverse Simpson index: 3.74) and the Adenoid Hypertrophy with OME group (median Observed ASVs: 99.0; median Shannon index: 2.20; median Inverse Simpson index: 4.35) presented severely constrained, virtually identical diversity profiles.
Figure 1.
Alpha-diversity measures across biological groups. Comparison of observed ASV richness, Shannon diversity and inverse Simpson diversity among biological groups. Points represent individual samples, violin plots show the overall distributions and boxplots indicate the median and interquartile range. Separate versions of the three metrics report Wilcoxon rank-sum or Kruskal–Wallis test results, as appropriate, together with Benjamini–Hochberg-adjusted q-values.
3.3. Beta Diversity
To determine if the overall microbial community structure differed significantly between the clinical cohorts, beta diversity was evaluated using Principal Coordinates Analysis (PCoA) based on Bray–Curtis dissimilarity (accounting for bacterial abundance) and Unweighted UniFrac distances (accounting for phylogenetic presence/absence).
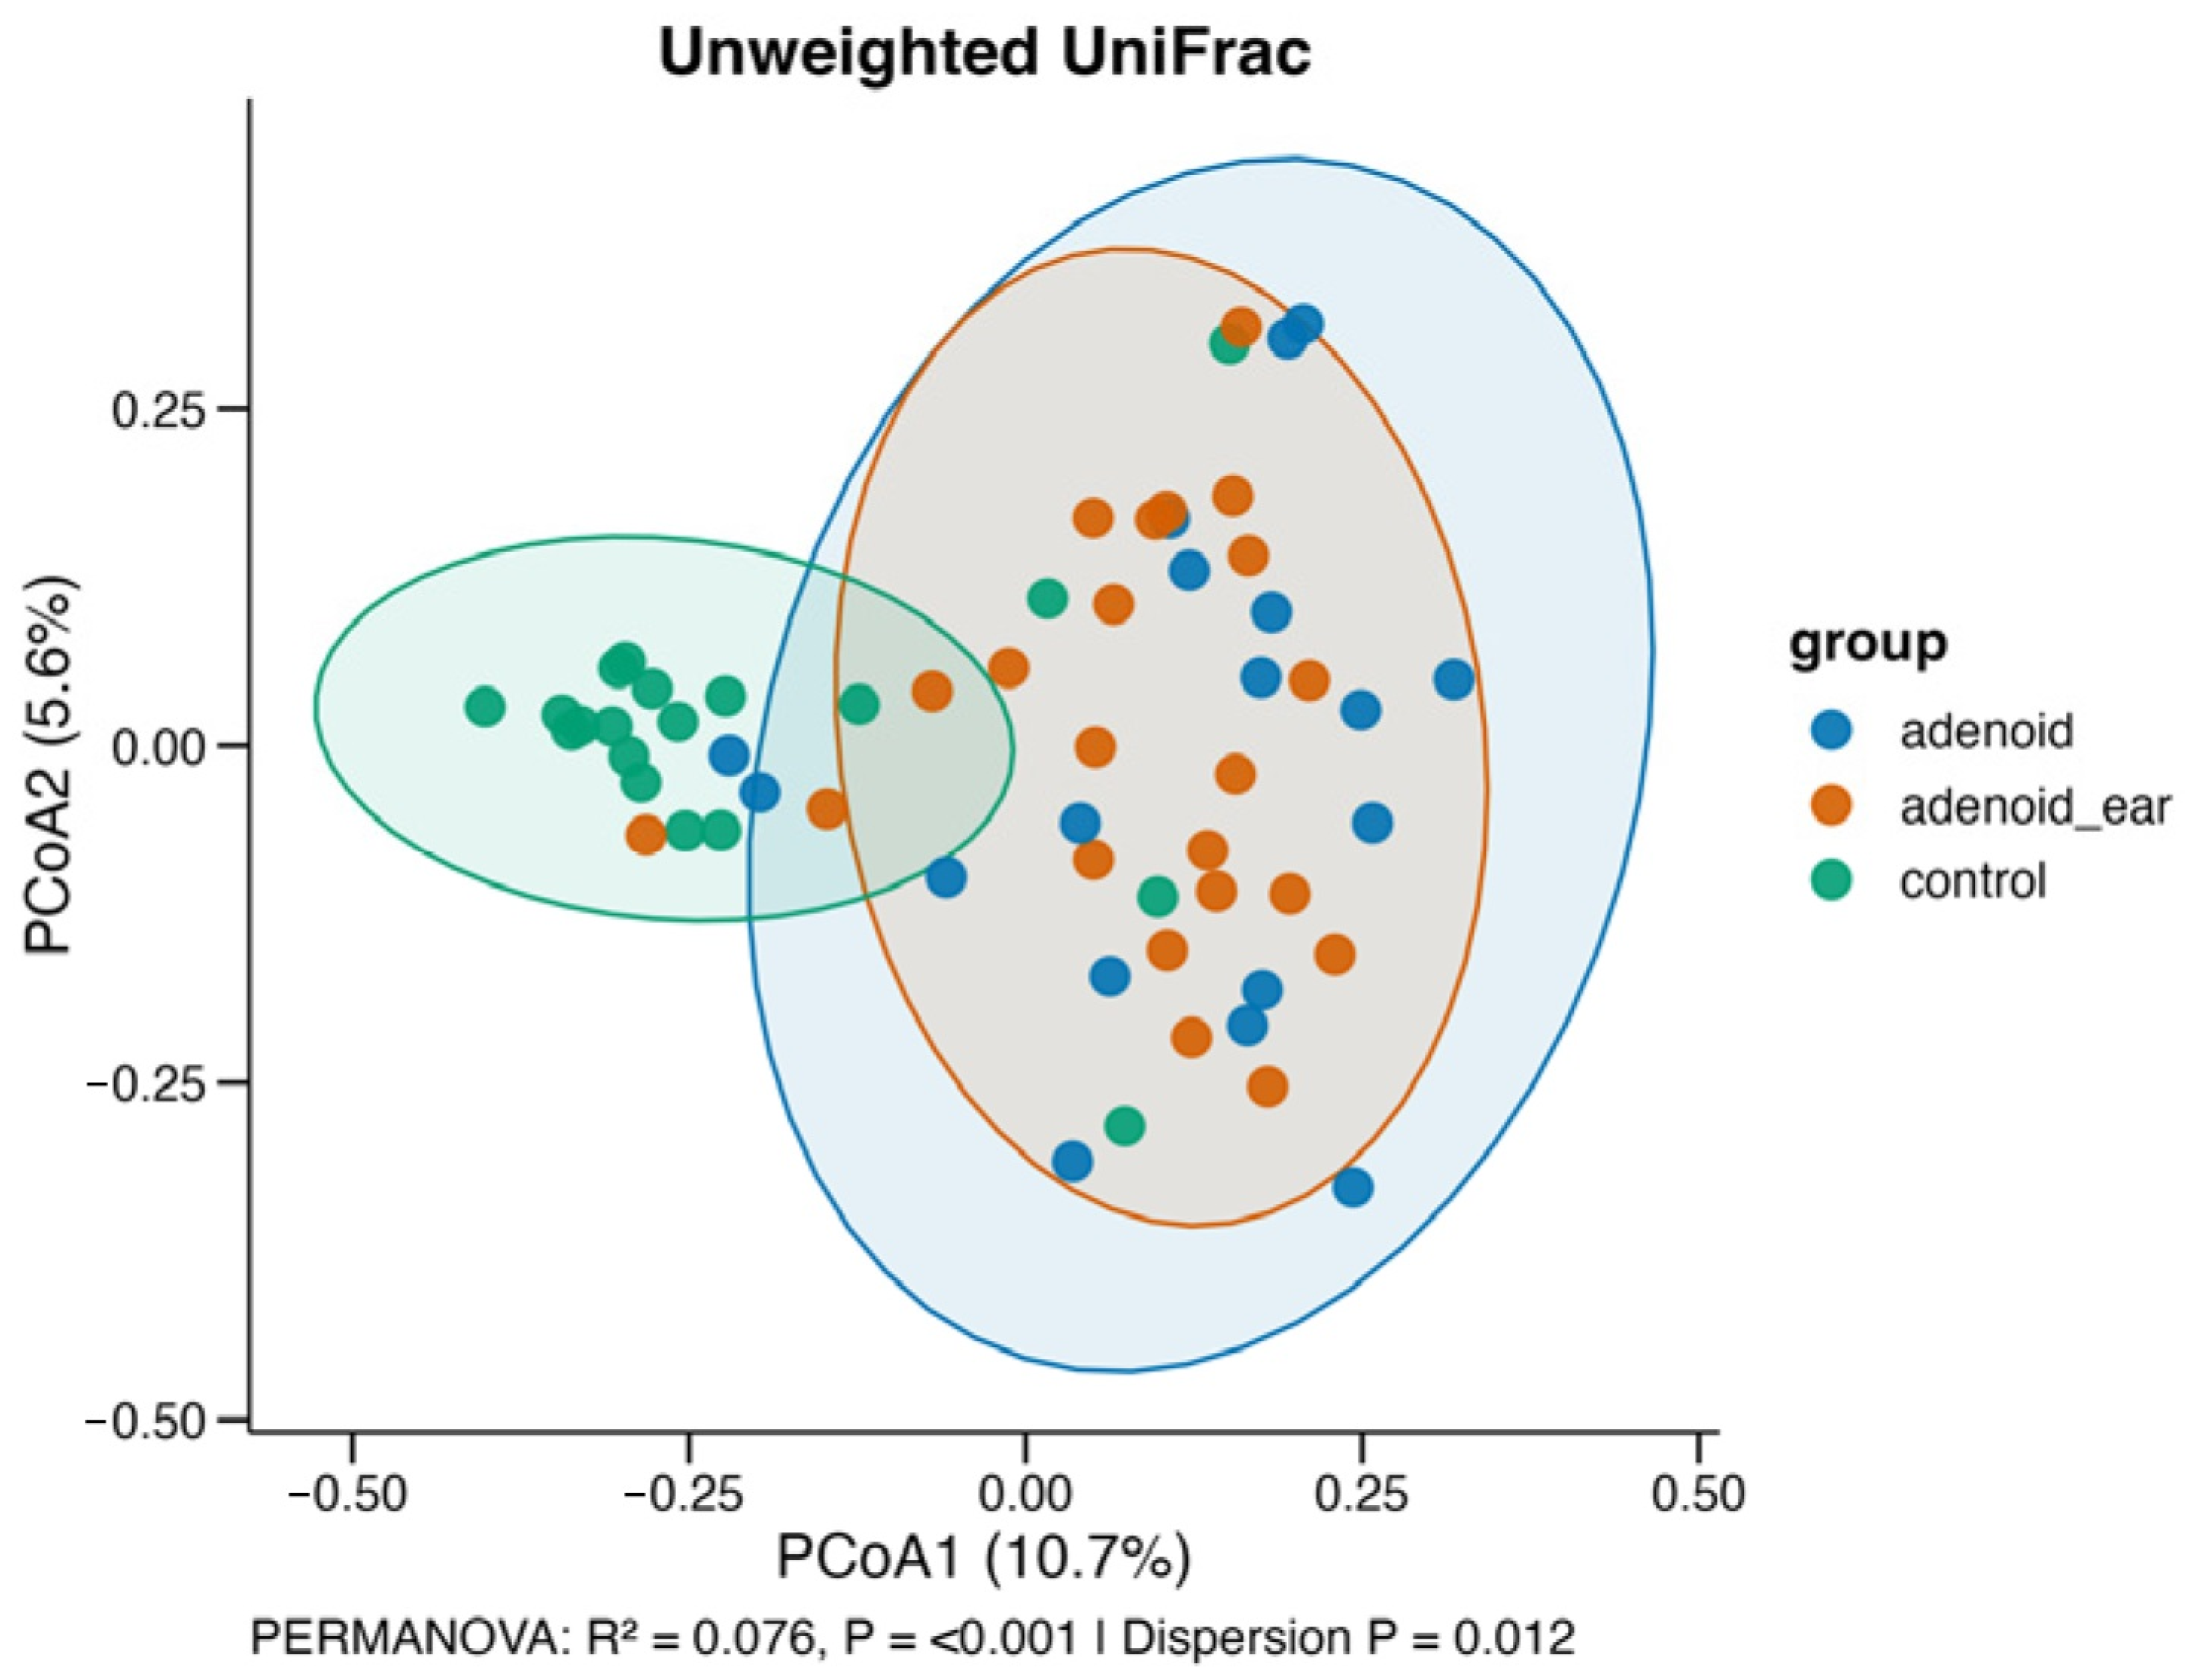
Visual assessment of the PCoA plots demonstrated a distinct clustering pattern, with the healthy Control group visually separating from the two disease groups. This structural shift in the microbiome was statistically confirmed via PERMANOVA. The microbial composition of the nasopharynx was significantly driven by the clinical group status when evaluated by both Bray–Curtis dissimilarity (R2 = 0.072, p < 0.001) (Figure 2) and Unweighted UniFrac distances (R2 = 0.076, p < 0.001) (Figure 3).
Importantly, while the Control cohort formed a distinct ecological cluster, the 95% confidence ellipses for the isolated Adenoid Hypertrophy group and the Adenoid Hypertrophy with OME group exhibited near-complete spatial overlap. This compositional convergence further highlights that the adenoid mucosal biofilm undergoes a standardized structural shift during hypertrophy, establishing a shared dysbiotic profile that is not significantly altered by the presence of middle-ear effusion.
Figure 2.
Principal coordinates analysis of microbial community composition. Principal coordinates analysis based on Bray-Curtis dissimilarity. Each point represents one sample and is colored according to biological group. Shaded polygons show 95% group confidence ellipses when each group contains at least three samples. Axis labels indicate the proportion of variation represented by each coordinate. PERMANOVA results report the association among biological groups; the multivariate dispersion test evaluates whether within-group variability differs among groups.
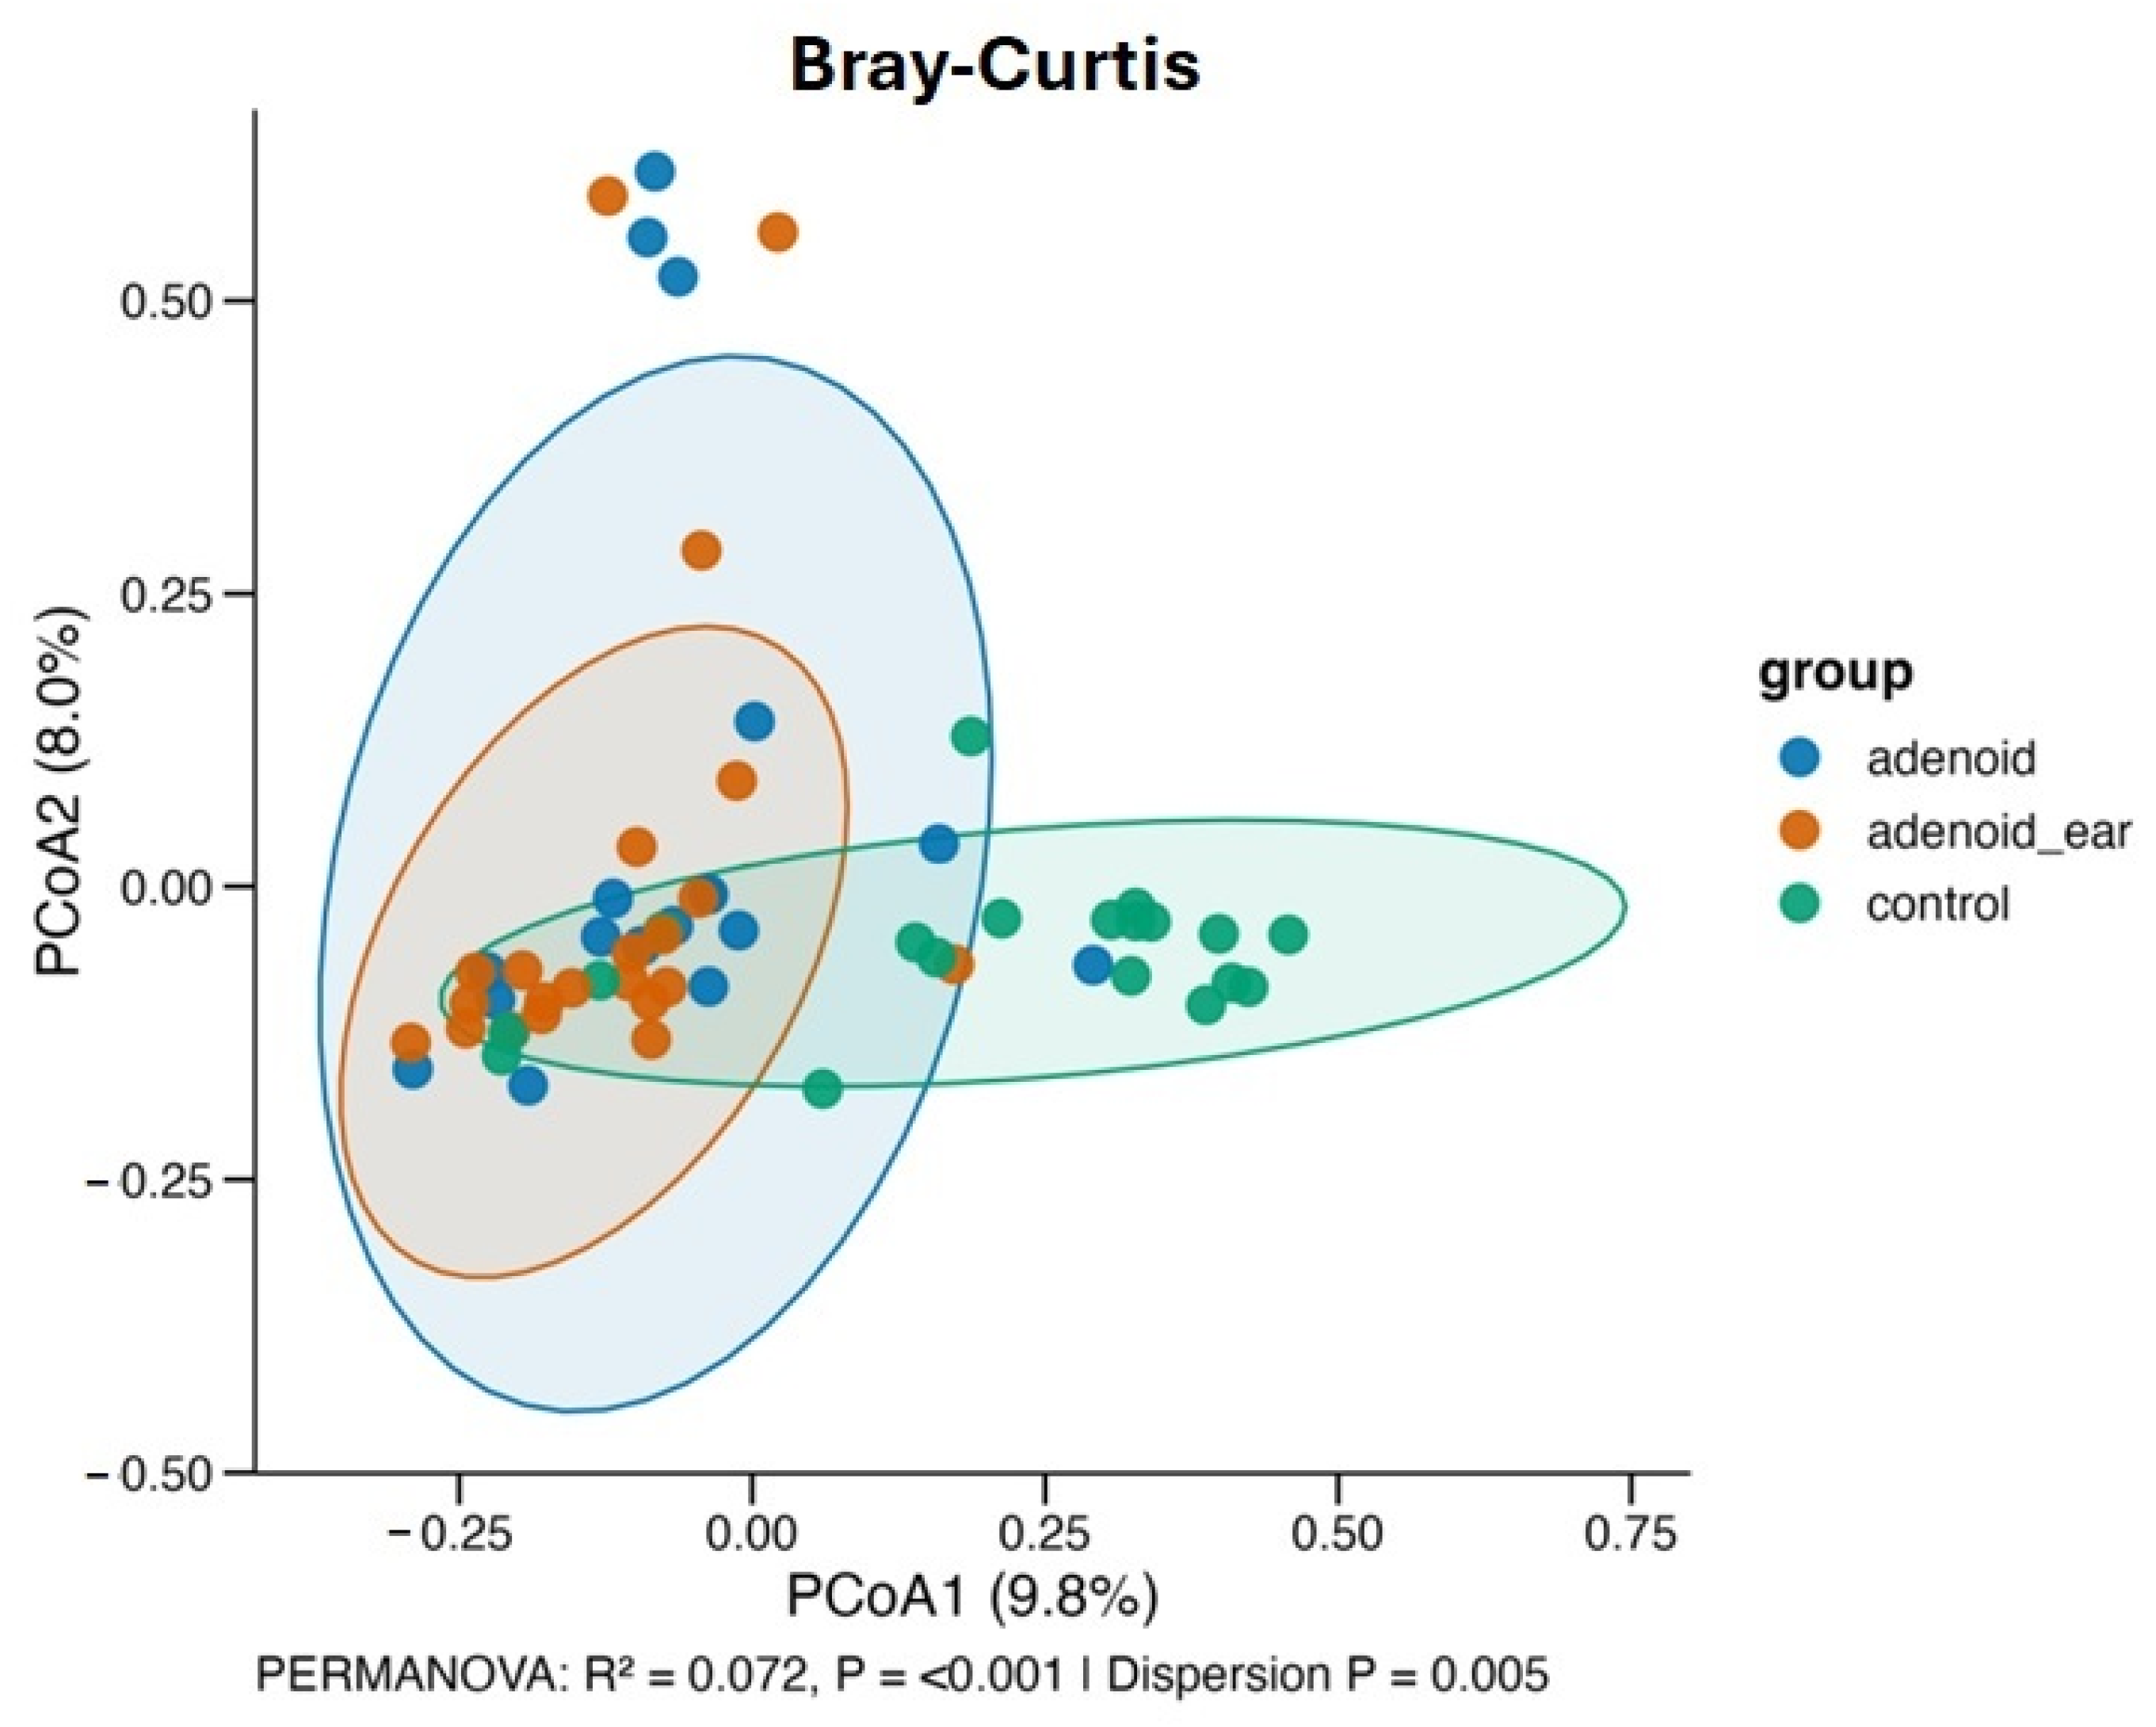
Figure 3.
Principal coordinates analysis of microbial community composition based on Unweighted UniFrac distances. Each point represents an individual sample, colored according to biological group (blue: adenoid; orange: adenoid ear; green: control). Shaded polygons indicate 95% group confidence ellipses. Axis labels denote the proportion of variation explained by each coordinate. PERMANOVA results evaluate the association among biological groups while adjusting for sex as a covariate (R2 = 0.076, p < 0.001), and the multivariate dispersion test assesses within-group variability (p = 0.012).
3.4. Taxonomic Data
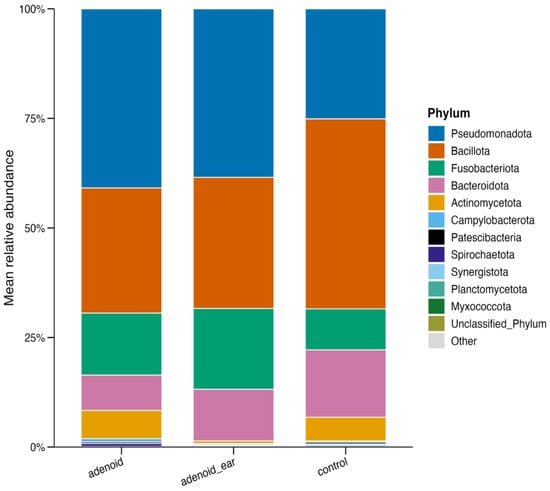
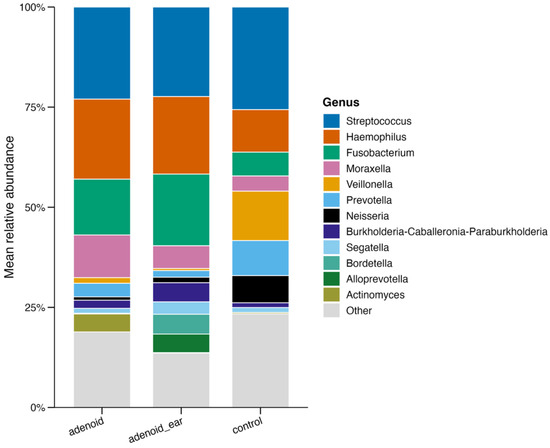
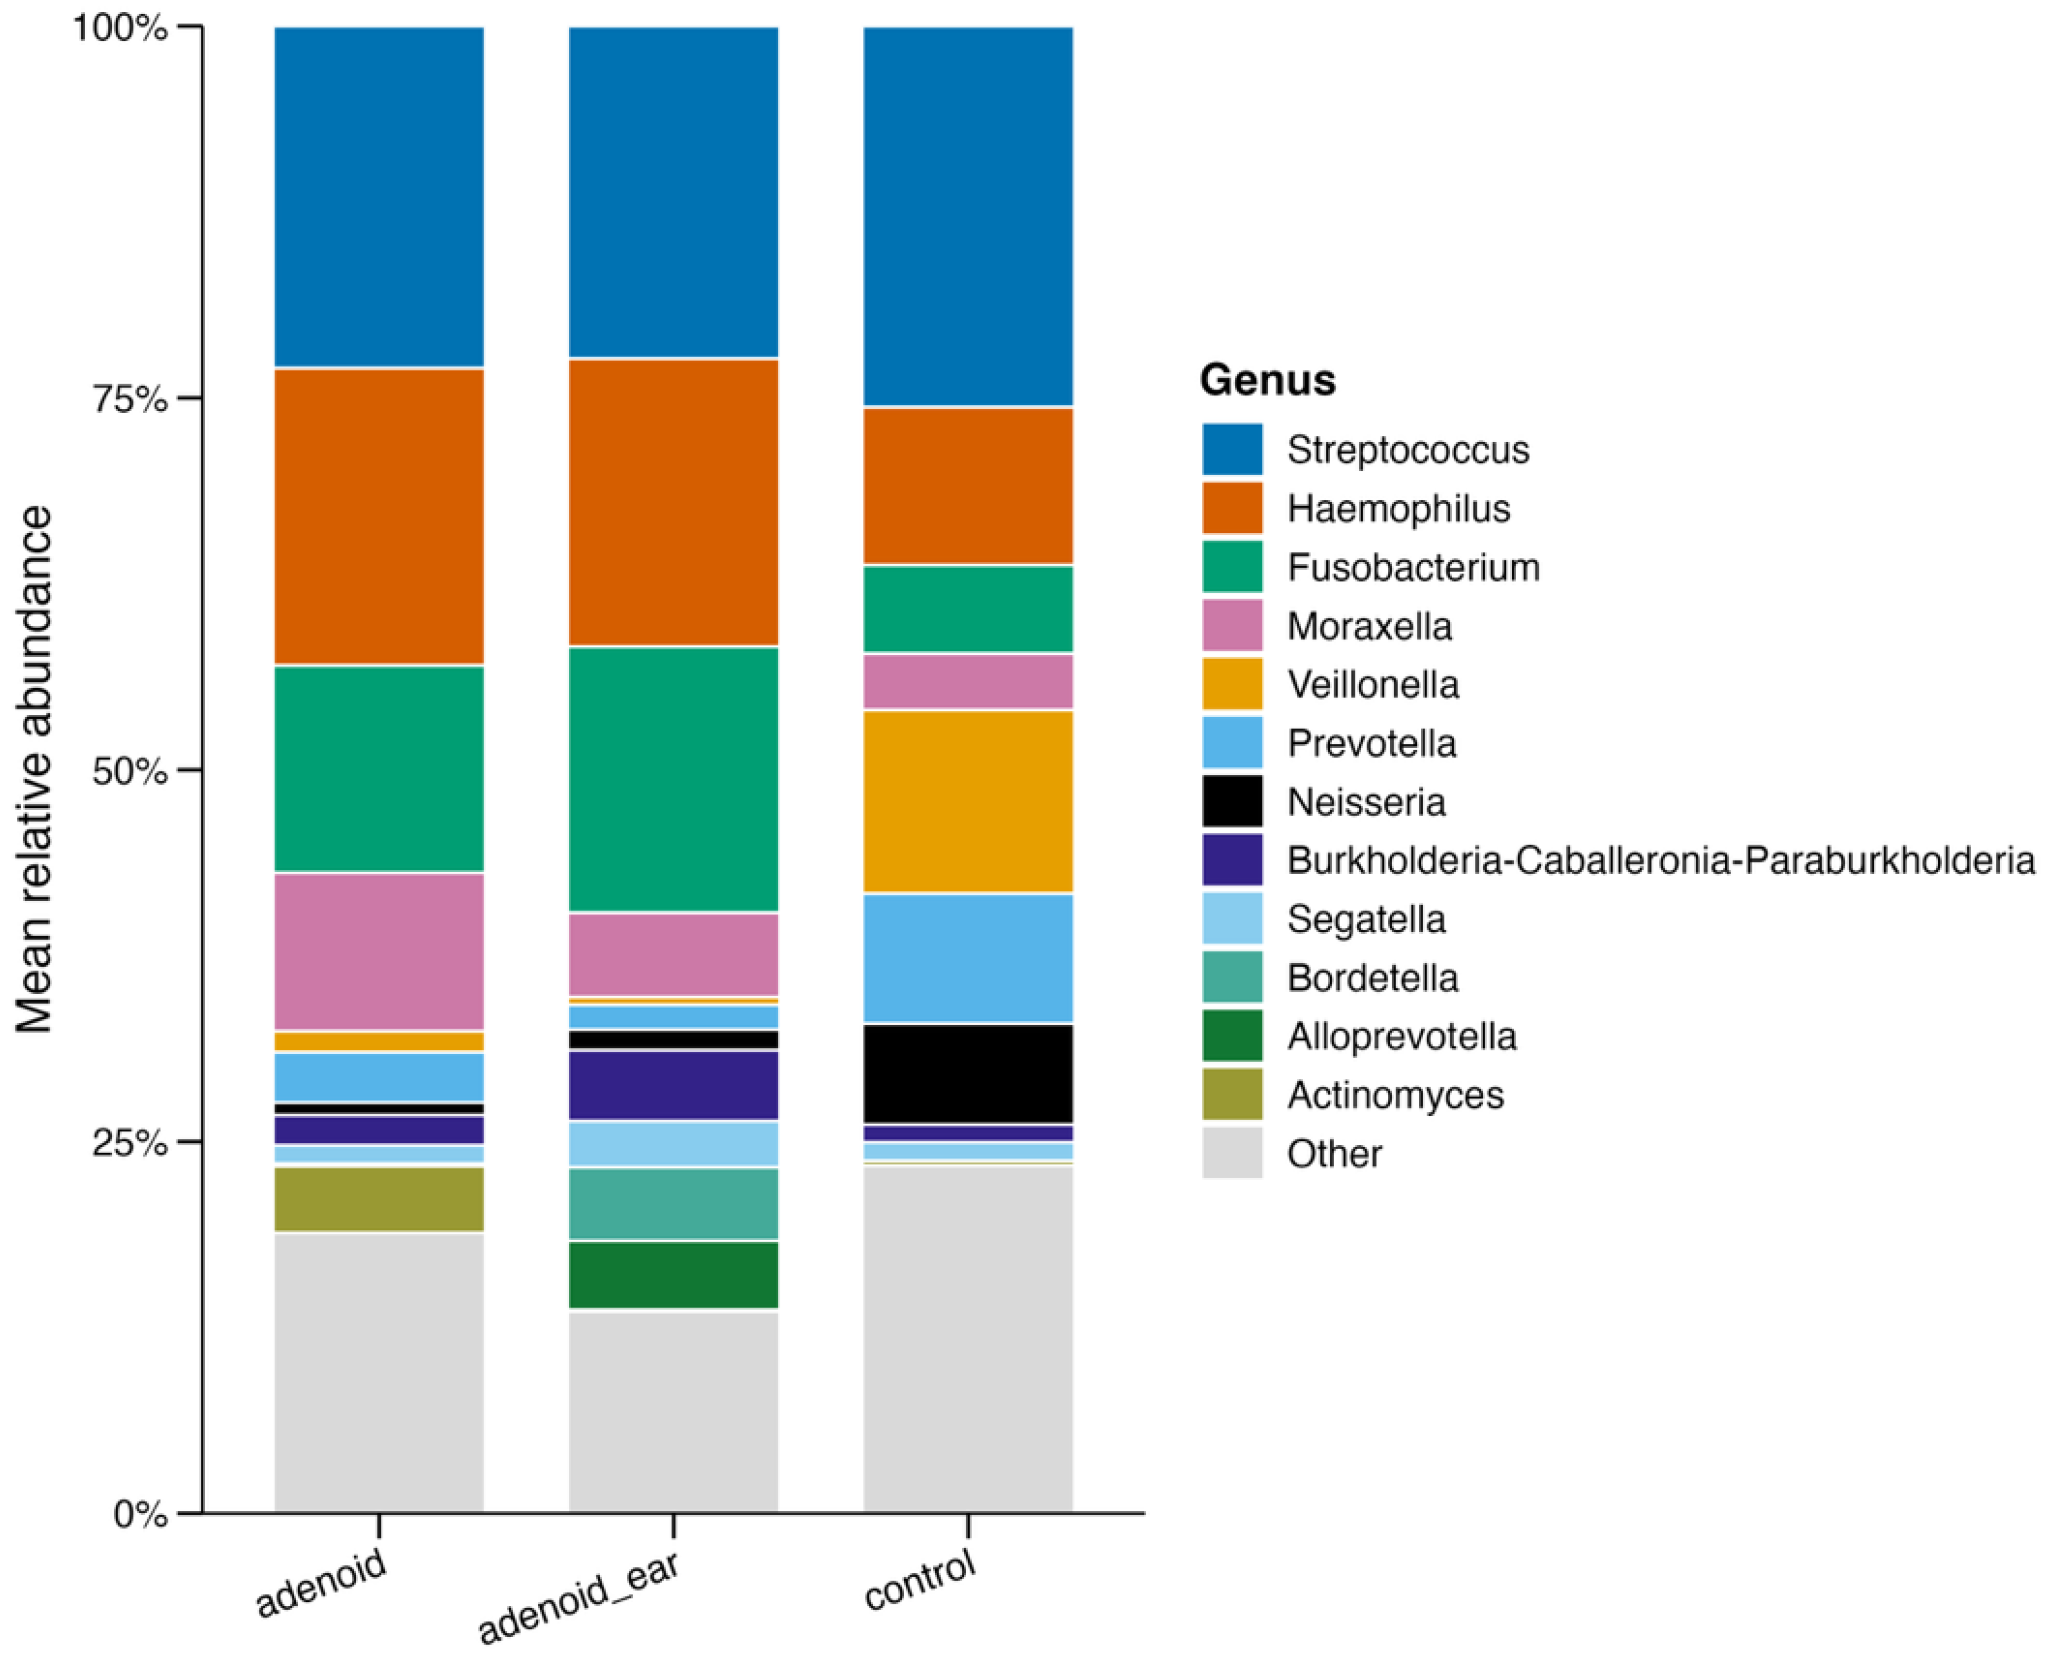
To identify the specific bacterial lineages driving the structural shifts observed in the diversity analyses, taxonomic composition was evaluated at both the phylum and genus levels across the three study cohorts (Figure 4 and Figure 5).
Figure 4.
Phylum-level relative abundance of the nasopharyngeal microbiome. Each bar represents the mean relative contribution of major bacterial phyla across the three clinical study cohorts (Control, Adenoid, and Adenoid with OME). The profiles demonstrate a shift in community composition, characterized by an expansion of Proteobacteria and a concurrent contraction of commensal-associated phyla in the adenoidal disease groups relative to healthy controls.
Figure 5.
Genus-level relative abundance and taxonomic composition of the nasopharyngeal microbiome. Each bar illustrates the mean relative abundance of predominant bacterial genera across the Control, Adenoid, and Adenoid Ear cohorts. Healthy controls exhibit a balanced distribution of core commensal taxa (such as Streptococcus, Veillonella, Corynebacterium, and Rothia), whereas the adenoid hypertrophy groups show a marked overgrowth of opportunistic pathogens (such as Haemophilus, Moraxella, and Fusobacterium). Both disease cohorts display near-identical taxonomic profiles regardless of concurrent middle-ear effusion.
At the phylum level, the nasopharyngeal microbiomes across all groups were predominantly composed of standard upper-respiratory bacterial phyla—mostly Pseudomonadota (Proteobacteria), Bacillota (Firmicutes), Actinomycetota, and Bacteroidota—though their relative proportions shifted notably between control and disease groups. Healthy controls maintained a balanced equilibrium among these core phyla, whereas the adenoidal disease groups exhibited a pronounced expansion of Pseudomonadota at the expense of commensal-associated phyla.
At the genus level, this pattern became even more distinct. The healthy Control group exhibited a characteristic commensal-rich profile, maintaining a balanced distribution of core taxa such as Streptococcus, Veillonella, Corynebacterium, and Rothia. In contrast, the microbial composition of both the isolated Adenoid Hypertrophy and Adenoid Hypertrophy with OME groups demonstrated a notable loss of commensal diversity accompanied by a pronounced overgrowth of specific pathogenic and opportunistic genera, prominently including Haemophilus, Moraxella, and Fusobacterium.
Consistent with the beta-diversity findings, the mean taxonomic profiles of the isolated Adenoid Hypertrophy group and the Adenoid Hypertrophy with OME group showed striking concordance. Both disease cohorts were dominated by identical pathogenic signatures and similar relative abundances of key taxa, further corroborating that the adenoid mucosal surface fosters a uniform dysbiotic microbial community regardless of concurrent middle-ear effusion.
To pinpoint the specific microbial taxa responsible for the dysbiosis associated with adenoidal disease, differential abundance testing was performed using both the robust ANCOM-BC2 model and DESeq2 to compare cohorts.
Both models confirmed that the ecological collapse observed in the adenoid tissue was driven by the significant overrepresentation of specific opportunistic pathogens. Compared to the healthy Control group, both the isolated Adenoid Hypertrophy and Adenoid Hypertrophy with OME groups demonstrated statistically significant enrichments in genera traditionally associated with upper respiratory tract infections, prominently including Haemophilus, Moraxella, and Fusobacterium. Conversely, the healthy control group was characterized by a significant enrichment of health-associated commensal taxa, including Streptococcus, Veillonella, Corynebacterium, and Rothia.
When evaluating the microbial differences directly between the two disease cohorts (Adenoid vs. Adenoid and middle ear effusion), the overall taxonomic profiles proved to be highly conserved. Under the robust significance criteria of the ANCOM-BC2 model, no taxa were found to be significantly differentially abundant between the simple adenoid hypertrophy group and the OME grouup. However, a sensitivity analysis utilizing the DESeq2 negative binomial model did identify four taxa with significant fold changes: Segatella and Fusobacterium demonstrated slight enrichment in the Adenoid Ear group, whereas Lautropia and Dialister were more abundant in the isolated Adenoid group (Figure 6, Figure 7 and Figure 8). Despite these minor localized variations, the overarching pathogenic signature remained highly consistent across both disease states.
Figure 6.
Differential abundance identified by DESeq2 comparing adenoid hyptrophy group with control group. Horizontal bar plots show the estimated log2 fold changes for the most strongly differentially abundant genera identified using the DESeq2 negative binomial model. Positive and negative values indicate enrichment in the respective comparison groups, with taxa ranked according to absolute effect size. Statistical significance was determined using Benjamini–Hochberg adjusted p-values.
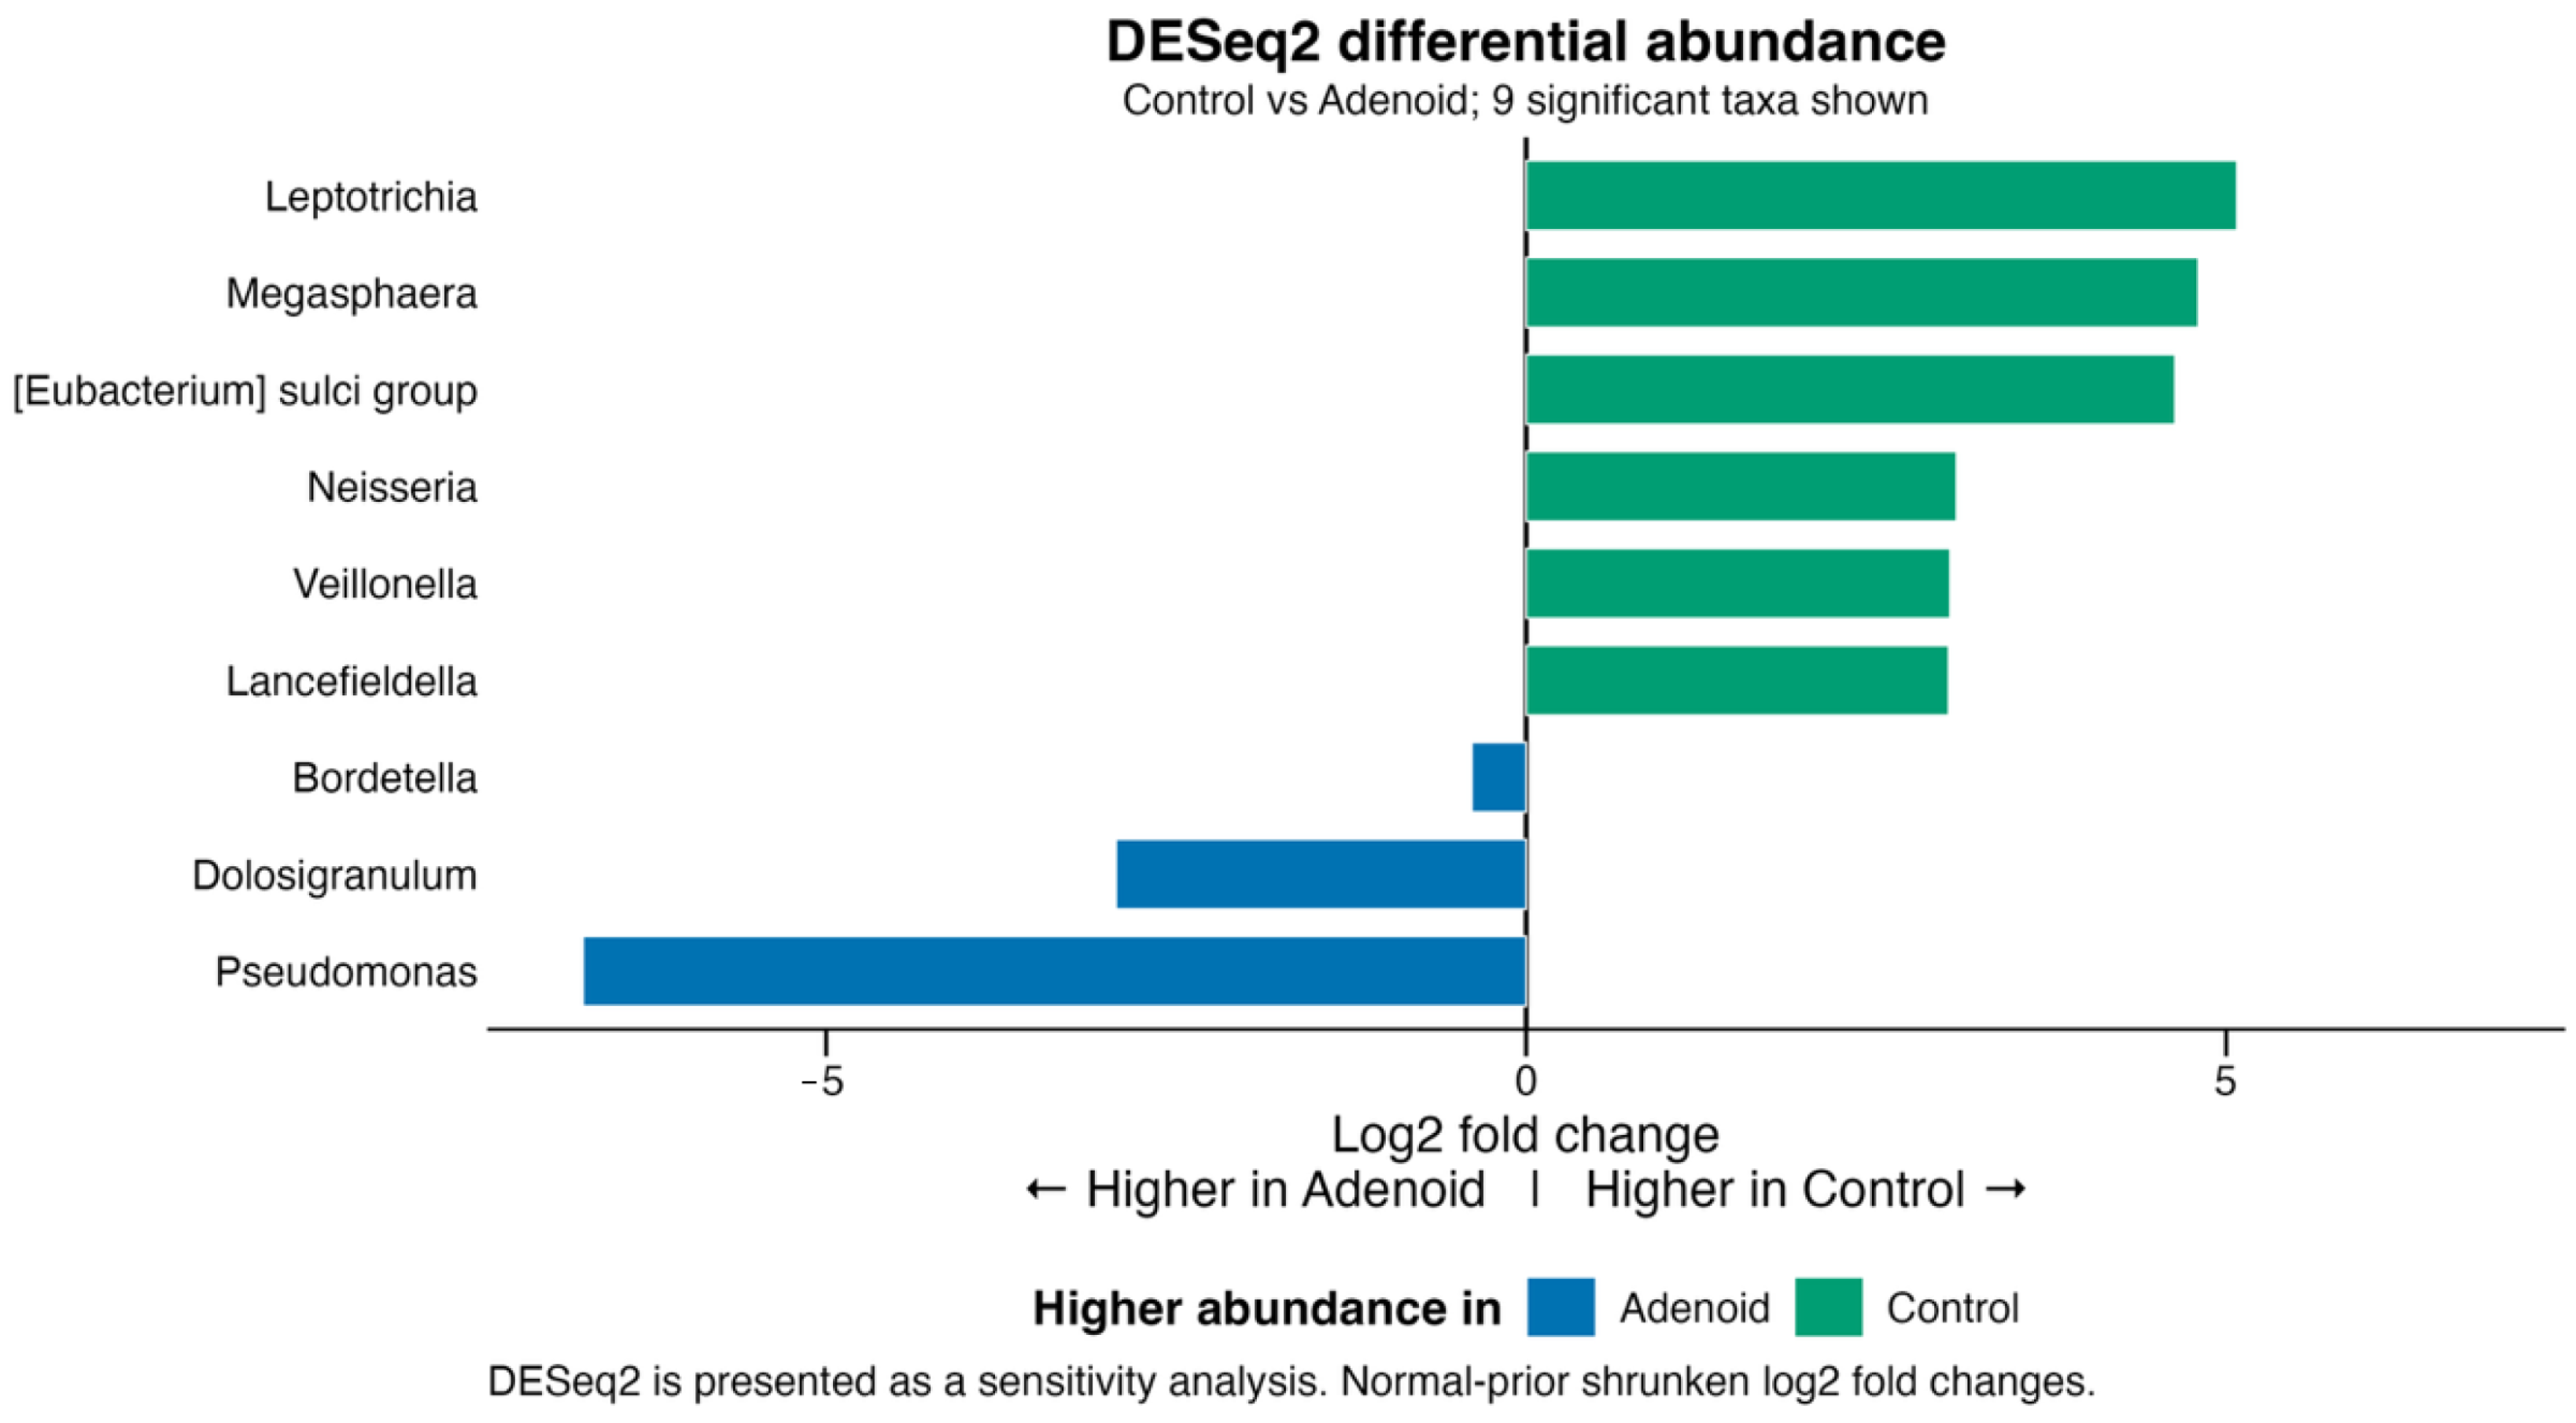
Figure 7.
ANCOM-BC2 differential abundance analysis. Differentially abundant taxa identified by ANCOM-BC2. Differential abundance analysis was performed using ANCOM-BC2 at the genus level while adjusting for “sex” as the covariate. Horizontal bars represent the estimated log fold change (LFC) for each taxon between the indicated biological groups. Positive and negative LFC values indicate enrichment in one comparison group relative to the other, with colours corresponding to the group exhibiting the higher relative abundance. When no taxa met the robust significance criteria after multiple-testing correction and sensitivity analysis, the taxa with the largest absolute effect sizes are displayed for descriptive purposes.
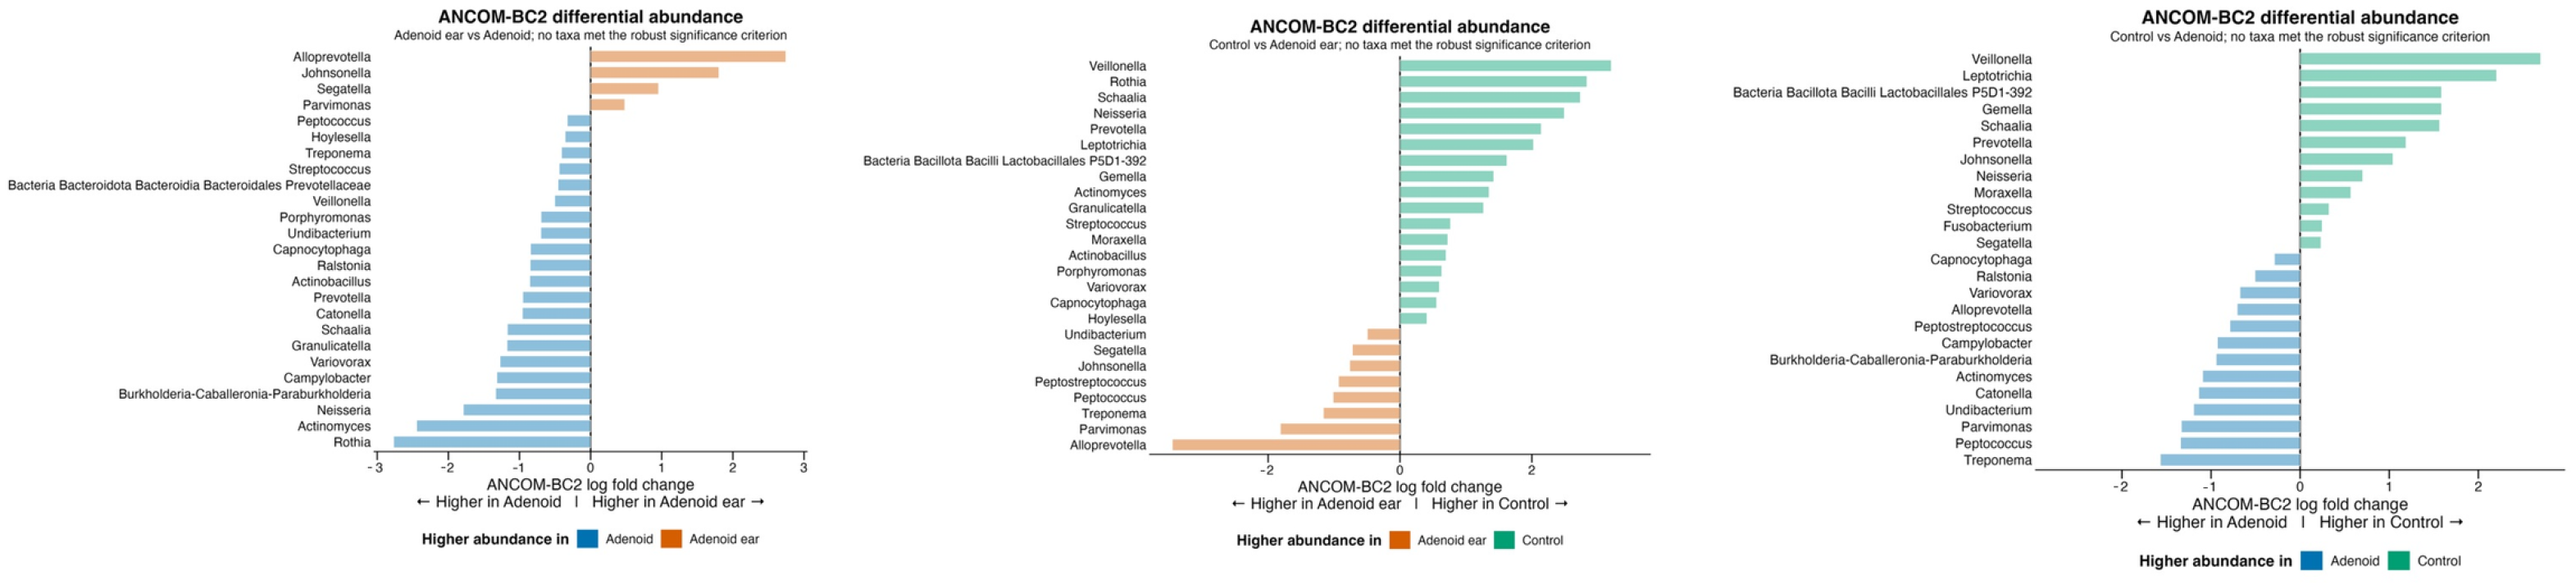
Figure 8.
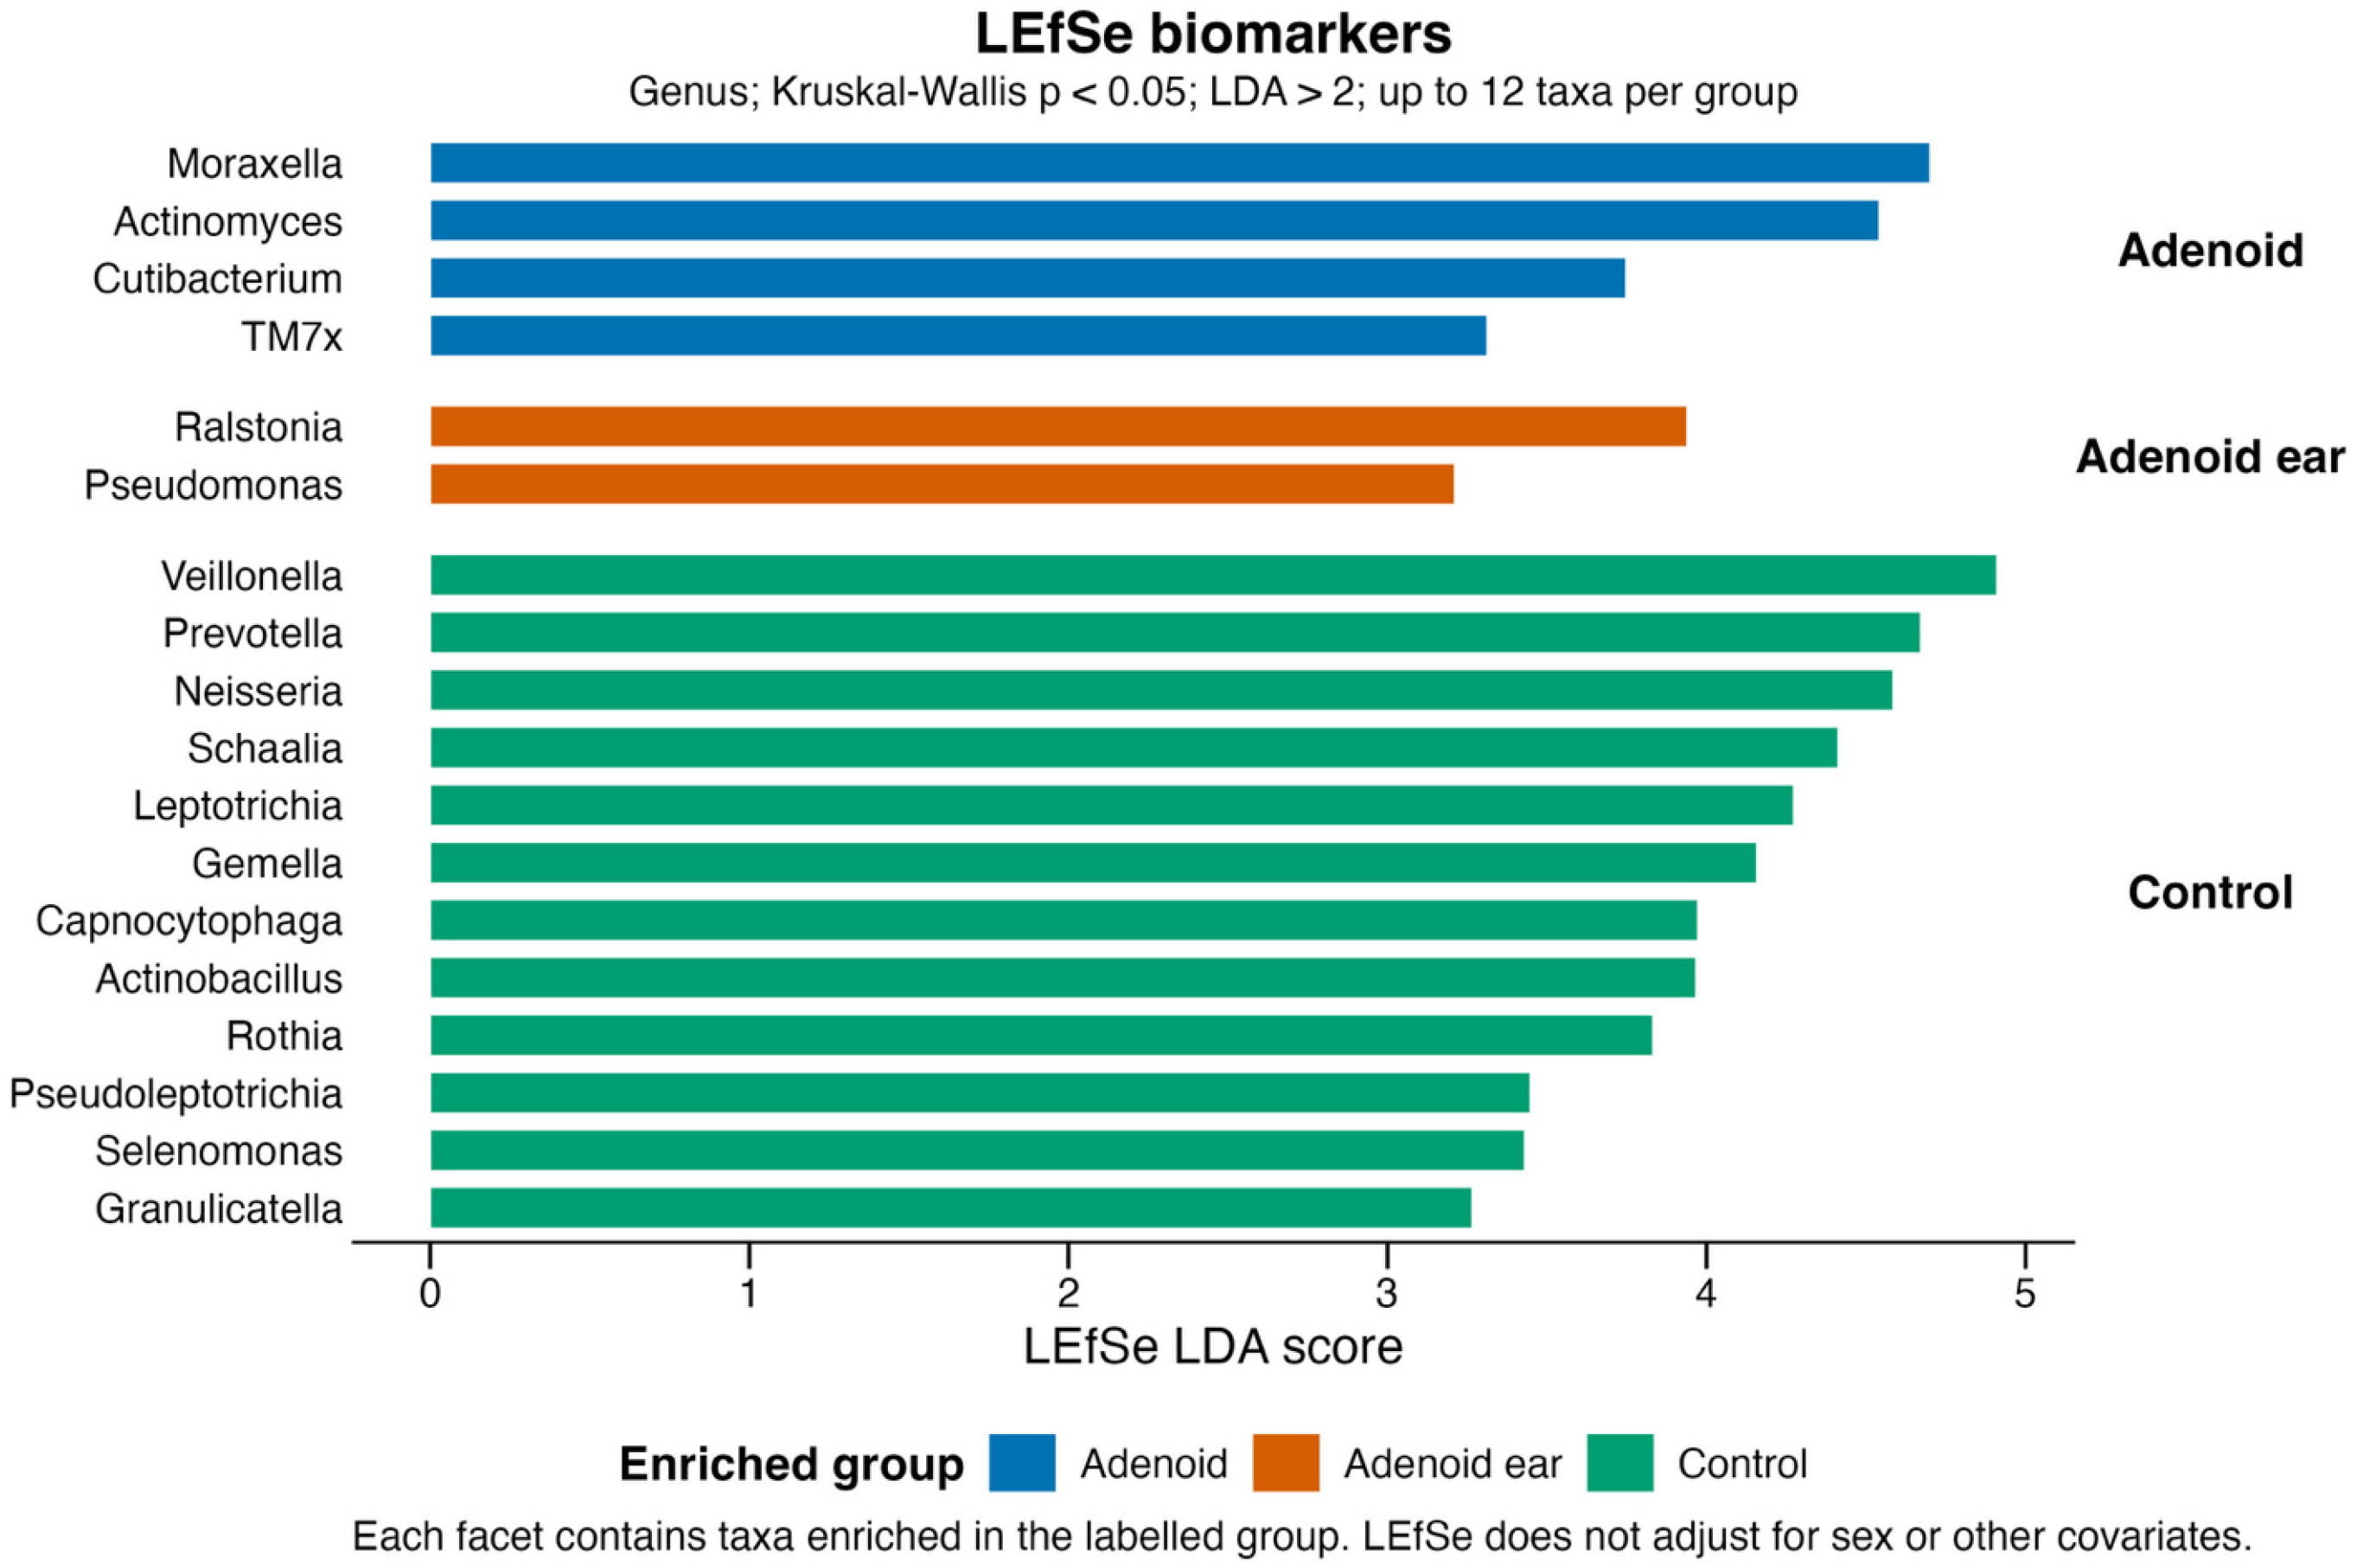
Biomarkers identified using LEfSe. Linear discriminant analysis effect size (LEfSe) was used to identify taxa that consistently discriminate between biological groups. Horizontal bars represent Linear Discriminant Analysis (LDA) scores, which quantify the contribution of each taxon to group separation. Taxa are coloured according to the group in which they are enriched, with higher LDA scores indicating greater discriminatory power. Only taxa satisfying the specified Kruskal–Wallis significance threshold and LDA score cutoff are shown.
4. Discussion
Our study is focused on characterizing the adenoid surface microbiome in children with adenoid hypertrophy (with and without otitis media with effusion) and comparing it to the nasopharyngeal microflora of healthy children. The primary findings reveal that adenoid hypertrophy is associated with noticeable shifts in microbial community structure, consistent with observations of dysbiosis in chronic adenoidal disease. We observed a distinct change in beta diversity and a significant depletion of health-associated commensal taxa, accompanied by an expansion of specific opportunistic pathogens.
Specifically, healthy control subjects exhibited a highly diverse microbial ecosystem characterized by a stable equilibrium of core upper-respiratory commensals (such as Streptococcus, Veillonella, Corynebacterium, and Rothia). Conversely, both the isolated adenoid hypertrophy and adenoid hypertrophy with concurrent otitis media with effusion groups demonstrated a notable reduction in community richness and an overall structural collapse of the microbiome. This loss of ecological diversity aligns with the established “Anna Karenina principle” in microbiome research—whereby healthy states maintain diverse, individualized configurations, while pathological conditions constrain the ecosystem into a restricted, uniform dysbiotic bottleneck, also observed in our previous studies [11,12].
Furthermore, our beta-diversity metrics (Bray–Curtis dissimilarity and Unweighted UniFrac distances) revealed distinct, statistically significant clustering (p < 0.001) that cleanly separated healthy controls from the disease groups. This confirms that the transition from a healthy nasopharyngeal state to chronic adenoidal disease involves a reorganization of the microbial communities, inviting distinct opportunistic pathogens to take root on the mucosal surface.
Our differential abundance testing utilizing both DESeq2 and LEfSe provided a detailed “map” of these microbial shifts. DESeq2 pairwise comparisons confirmed that the dysbiosis associated with adenoidal disease is driven by the significant overrepresentation of Haemophilus, Moraxella, and Fusobacterium (adjusted q < 0.05). This directly mirrors recent cross-sectional analyses of the pediatric nasopharyngeal microbiome, which demonstrate that pathological adenoid hypertrophy is uniquely defined by the presence of inflammation-associated taxa such as Fusobacterium, which are characteristically absent or severely suppressed in healthy cohorts [25]. Similarly, metagenomic evaluations of pediatric upper airway microbiota consistently identify Moraxella and Haemophilus species as primary disease biomarkers enriched in hypertrophic tissues as per our previous data [10].
Interestingly, in our prior investigations into the adenoid microbiome using the same 16S rRNA sequencing, Fusobacterium nucleatum and Veillonella atypica were consistently identified as dominant taxa comprising a massive portion of the detected genetic material on hypertrophied tissues [11,26]. The current study validates this earlier finding by confirming Fusobacterium’s status as a core driver of bacterial overgrowth in adenoidal disease when compared against a healthy baseline.
Our LEfSe biomarker analysis corroborated that the healthy pediatric nasopharynx is actively dominated by a network of commensals, including Streptococcus, Veillonella, Corynebacterium, and Rothia. The protective role of these taxa—particularly Corynebacterium and Rothia—is well-documented in early-life eubiotic models, where they function to competitively exclude opportunistic pathogens and maintain mucosal homeostasis [27]. Their significant depletion in both of our disease cohorts underscores a fundamental breakdown in colonization resistance, facilitating the polymicrobial overgrowth that clinically manifests as chronic adenoid hypertrophy.
A notable finding in our dataset is the highly conserved taxonomic and functional profile between the isolated adenoid hypertrophy group and the OME group. While the classical literature often isolates specific otopathogens (such as Haemophilus influenzae or Moraxella catarrhalis) as independent drivers of middle-ear effusion, our data does not support the necessity of a massive, unique “otopathogenic shift” for the development of middle ear fluid.
When directly compared using the ANCOM-BC2 analysis model, simple adenoid hypertrophy and adenoid hypertrophy with middle ear effusion exhibited nearly identical microbial profiles, with no taxa meeting the robust significance criterion for differential abundance. While our DESeq2 sensitivity analysis did detect minor fluctuations in a small subset of taxa (such as a slight enrichment of Fusobacterium and Segatella in the OME cohort, and Lautropia and Dialister in the isolated adenoid cohort), the core structural dysbiosis remained uniformly present across both groups.
Our findings suggest viewing the adenoid surface as a centralized, relatively stable reservoir of dysbiosis, the foundational composition of which is established regardless of the presence of middle ear effusion at that time. Rather than requiring the introduction of new bacterial genera, the baseline pathogenic biofilm on the hypertrophic adenoid appears functionally sufficient to sustain the localized inflammation and Eustachian tube dysfunction necessary to drive otitis media. The minor taxonomic variations detected by DESeq2 may represent transient changes in the local microenvironment rather than primary drivers of the effusion itself [1,8].
The change in the microbiome from the commensal-dominated, healthy nasopharyngeal state to a pathogenic, dysbiotic environment is basically linked to the breakdown of competitive exclusionary mechanisms and the subsequent formation of bacterial biofilms. Commensal keystone species play an active role in maintaining mucosal integrity. Mechanically, these health-associated taxa prevent the colonization and overgrowth of opportunistic pathogens through competitive exclusion for epithelial binding sites, the localized production of inhibitory metabolites (such as lactic acid), and the modulation of host mucosal immune responses [28].
Our differential abundance findings highlight that the depletion of protective commensals coincides with a massive overgrowth of biofilm-forming bacteria in the adenoidal disease cohorts both healthy middle ears and middle ears with effusion. Biofilm formation provides opportunistic bacteria with a distinct survival advantage, offering enhanced evasion from host immune responses, altering localized microenvironments, and significantly increasing tolerance to standard antibiotic therapies [29]. This supports our finding that the adenoid microbiome acts as a uniform source of dysbiosis, perpetuating a state of chronic local inflammation that can continuously seed the middle ear, thereby sustaining conditions like OME.
While our study provides high-resolution insights into the structural shifts of the pediatric adenoid microbiome, several limitations must be acknowledged. First, our microbial profiling relied exclusively on 16S rRNA gene sequencing. While this methodology is the standard for determining taxonomic composition and relative abundance, it is fundamentally limited in its ability to resolve species- and strain-level variations, and it cannot provide direct functional or transcriptomic data. Future investigations utilizing whole-genome shotgun metagenomics and metatranscriptomics are required to elucidate the specific metabolic pathways and active virulence factors deployed by the identified pathogenic taxa in vivo.
Second, the cross-sectional nature of this study captures only a singular snapshot of the nasopharyngeal microbiome at the time of surgical intervention or clinical evaluation. The pediatric microbiome is highly dynamic and subject to longitudinal fluctuations influenced by viral upper respiratory infections, seasonal variations, and external environmental exposures. Longitudinal cohort studies tracking the temporal evolution of the nasopharyngeal microbiome—from a healthy baseline through to the onset and chronicity of adenoid hypertrophy and OME—are necessary to definitively establish causality versus correlation.
Third, we acknowledge that extracting swabs ex vivo (excised tissue) vs. in vivo (healthy controls) could hypothetically impact spatial biomass yield, though the immediate swabbing preserves the biofilm architecture. We are limited in our techniques of acquiring nasopharyngeal swabs for our control group from healthy participants, especially children. It is both technically, medically and legally challenging to remove adenoidal tissue from healthy pediatric participants.
Finally, while our stringent DESeq2 and LEfSe methodologies powerfully controlled for biological variance, our sample size, particularly within specific clinical subgroups, may limit the generalizability of our findings across diverse geographic populations. The local immunomodulatory effects of the host (such as localized IgA production or specific inflammatory cytokine profiles in the adenoid tissue) were not concurrently evaluated in this study. Exploring the direct crosstalk between the localized dysbiotic microbiome and host immune responses will be a critical next step in understanding the comprehensive pathophysiology of pediatric adenoidal disease.
5. Conclusions
Pediatric adenoid hypertrophy is characterized by a profound collapse of the nasopharyngeal microbiome, marked by the depletion of commensals and an overgrowth of opportunistic pathogens such as Haemophilus, Moraxella, and Fusobacterium. Notably, the microbial architectures of isolated adenoid hypertrophy and adenoid hypertrophy with concurrent otitis media with effusion are highly homologous, lacking robust compositional differences.
Future studies on clinical management of adenoidal disease should investigate microbiome-preserving interventions and antibiofilm strategies aimed at restoring upper respiratory homeostasis.
Author Contributions
Conceptualization, O.S.-K. and A.K.; methodology, A.K. and G.S.; software, M.B., A.A.Z. and R.B.G.; validation, M.B., M.R. A.A.Z. and R.B.G.; formal analysis, R.B.G.; investigation, R.B.G., A.A.Z. and M.B.; resources, O.S.-K. and J.O.; data curation, R.B.G.; writing—original draft preparation, O.S.-K., M.B. and R.B.G.; writing—review and editing, O.S.-K., G.S. and A.K.; visualization R.B.G., supervision, A.K., A.R. and G.S.; project administration, O.S.-K., A.K. and G.S.; funding acquisition, O.S.-K. and J.O. All authors have read and agreed to the published version of the manuscript.
Funding
Research made possible with the help of a Riga Stradiņš University doctoral studies grant.
Institutional Review Board Statement
This study was conducted in accordance with the Declaration of Helsinki and approved by Riga Stradiņš University Ethics Committee Nr2-PE K-4/264/2022 (2 May 2022).
Informed Consent Statement
Informed consent was obtained from all subjects involved in this study.
Data Availability Statement
All data are available upon reasonable request from the corresponding author.
Acknowledgments
During the preparation of this work, the authors used Google Gemini PRO to assist with text formatting and structural editing. After using this tool/service, the authors reviewed and edited the content as needed and take full responsibility for the content of the publication.
Conflicts of Interest
The authors declare no conflicts of interest.
References
- Schenck, L.P.; Surette, M.G.; Bowdish, D.M. Composition and immunological significance of the upper respiratory tract microbiota. FEBS Lett. 2016, 590, 3705–3720. [Google Scholar] [CrossRef] [Scilit]
- Teo, S.M.; Mok, D.; Pham, K.; Kusel, M.; Serralha, M.; Troy, N.; Holt, B.J.; Hales, B.J.; Walker, M.L.; Hollams, E.; et al. The infant nasopharyngeal microbiome impacts severity of lower respiratory infection and risk of asthma development. Cell Host Microbe 2015, 17, 704–715. [Google Scholar] [CrossRef] [Scilit]
- Niedzielski, A.; Chmielik, L.P.; Mielnik-Niedzielska, G.; Kasprzyk, A.; Bogusławska, J. Adenoid hypertrophy in children: A narrative review of pathogenesis and clinical relevance. BMJ Paediatr. Open 2023, 7, e001710. [Google Scholar] [CrossRef] [Scilit]
- Sakki, A.; Mäkinen, L.K.; Roine, R.P.; Nokso-Koivisto, J. Changing trends in pediatric tonsil surgery. Int. J. Pediatr. Otorhinolaryngol. 2019, 118, 84–89. [Google Scholar] [CrossRef] [Scilit]
- Nistico, L.; Kreft, R.; Gieseke, A.; Coticchia, J.M.; Burrows, A.; Khampang, P.; Liu, Y.; Kerschner, J.E.; Post, J.C.; Lonergan, S.; et al. Adenoid Reservoir for Pathogenic Biofilm Bacteria. J. Clin. Microbiol. 2011, 49, 1411–1420. [Google Scholar] [CrossRef] [Scilit]
- MacKeith, S.; Mulvaney, C.A.; Galbraith, K.; Webster, K.E.; Paing, A.; Connolly, R.; Marom, T.; Daniel, M.; Venekamp, R.P.; Schilder, A.G. Adenoidectomy for otitis media with effusion (OME) in children. Cochrane Database Syst. Rev. 2023, 10, Cd015252. [Google Scholar] [CrossRef] [Scilit]
- Simon, F.; Haggard, M.; Rosenfeld, R.M.; Jia, H.; Peer, S.; Calmels, M.N.; Couloigner, V.; Teissier, N. International consensus (ICON) on management of otitis media with effusion in children. Eur. Ann. Otorhinolaryngol. Head Neck Dis. 2018, 135, S33–S39. [Google Scholar] [CrossRef] [Scilit]
- Saylam, G.; Tatar, E.C.; Tatar, I.; Ozdek, A.; Korkmaz, H. Association of adenoid surface biofilm formation and chronic otitis media with effusion. Arch. Otolaryngol. Head Neck Surg. 2010, 136, 550–555. [Google Scholar] [CrossRef] [Scilit]
- Ren, T.; Glatt, D.U.; Nguyen, T.N.; Allen, E.K.; Early, S.V.; Sale, M.; Winther, B.; Wu, M. 16S rRNA survey revealed complex bacterial communities and evidence of bacterial interference on human adenoids. Environ. Microbiol. 2013, 15, 535–547. [Google Scholar] [CrossRef] [Scilit]
- Sokolovs-Karijs, O.; Brīvība, M.; Gudrā, D.; Saksis, R.; Zodāne, A.A.; Rozenberga, M.; Bunka, L.; Frigotto, A.; Osīte, J.; Reinis, A.; et al. The Clinical Role of the Adenoid Microbiome in the Development of Adenoid Hypertrophy and Otitis Media with Effusion. J. Clin. Med. 2026, 15, 2187. [Google Scholar] [CrossRef] [Scilit]
- Sokolovs-Karijs, O.; Brīvība, M.; Saksis, R.; Rozenberga, M.; Girotto, F.; Osīte, J.; Reinis, A.; Sumeraga, G.; Krūmiņa, A. Identifying the Microbiome of the Adenoid Surface of Children Suffering from Otitis Media with Effusion and Children without Middle Ear Effusion Using 16S rRNA Genetic Sequencing. Microorganisms 2023, 11, 1955. [Google Scholar] [CrossRef] [Scilit]
- Sokolovs-Karijs, O.; Brīvība, M.; Saksis, R.; Rozenberga, M.; Bunka, L.; Girotto, F.; Osīte, J.; Reinis, A.; Sumeraga, G.; Krūmiņa, A. Comparing the Microbiome of the Adenoids in Children with Secretory Otitis Media and Children without Middle Ear Effusion. Microorganisms 2024, 12, 1523. [Google Scholar] [CrossRef] [Scilit]
- Wingett, S.; Andrews, S. FastQ Screen: A tool for multi-genome mapping and quality control. F1000Research 2018, 7, 1338. [Google Scholar] [CrossRef] [Scilit]
- Ewels, P.; Magnusson, M.; Lundin, S.; Käller, M. MultiQC: Summarize analysis results for multiple tools and samples in a single report. Bioinformatics 2016, 32, 3047–3048. [Google Scholar] [CrossRef] [Scilit]
- Martin, M. Cutadapt removes adapter sequences from high-throughput sequencing reads. EMBnet J. 2011, 17, 10. [Google Scholar] [CrossRef] [Scilit]
- Callahan, B.J.; McMurdie, P.J.; Rosen, M.J.; Han, A.W.; Johnson, A.J.; Holmes, S.P. DADA2: High-resolution sample inference from Illumina amplicon data. Nat. Methods 2016, 13, 581–583. [Google Scholar] [CrossRef] [Scilit]
- Davis, N.; Proctor, D.; Holmes, S.; Relman, D.; Callahan, B. Simple statistical identification and removal of contaminant sequences in marker-gene and metagenomics data. Microbiome 2018, 6, 226. [Google Scholar] [CrossRef] [Scilit]
- Chuvochina, M.; Gerken, J.; Frentrup, M.; Sandikci, Y.; Goldmann, R.; Freese, H.M.; Göker, M.; Sikorski, J.; Yarza, P.; Quast, C.; et al. SILVA in 2026: A global core biodata resource for rRNA within the DSMZ digital diversity. Nucleic Acids Res. 2026, 54, D334–D341. [Google Scholar] [CrossRef] [Scilit]
- Bolyen, E.; Rideout, J.R.; Dillon, M.R.; Bokulich, N.A.; Abnet, C.C.; Al-Ghalith, G.A.; Alexander, H.; Alm, E.J.; Arumugam, M.; Asnicar, F.; et al. Reproducible, interactive, scalable and extensible microbiome data science using QIIME 2. Nat. Biotechnol. 2019, 37, 852–857. [Google Scholar] [CrossRef] [Scilit]
- McMurdie, P.J.; Holmes, S. phyloseq: An R package for reproducible interactive analysis and graphics of microbiome census data. PLoS ONE 2013, 8, e61217. [Google Scholar] [CrossRef] [Scilit]
- Lin, H.; Peddada, S.D. Multigroup analysis of compositions of microbiomes with covariate adjustments and repeated measures. Nat. Methods 2024, 21, 83–91. [Google Scholar] [CrossRef] [Scilit]
- Love, M.I.; Huber, W.; Anders, S. Moderated estimation of fold change and dispersion for RNA-seq data with DESeq2. Genome Biol. 2014, 15, 550. [Google Scholar] [CrossRef] [Scilit]
- Segata, N.; Izard, J.; Waldron, L.; Gevers, D.; Miropolsky, L.; Garrett, W.S.; Huttenhower, C. Metagenomic biomarker discovery and explanation. Genome Biol. 2011, 12, R60. [Google Scholar] [CrossRef] [Scilit]
- Cao, Y.; Dong, Q.; Wang, D.; Zhang, P.; Liu, Y.; Niu, C. microbiomeMarker: An R/Bioconductor package for microbiome marker identification and visualization. Bioinformatics 2022, 38, 4027–4029. [Google Scholar] [CrossRef] [Scilit]
- Moser, U.; Hirsch, T.; Obermüller, B.; Singer, G.; Wolfschluckner, V.; Thurnher, D.; Andrianakis, A. Nasopharyngeal Microbiome Differences Between Children with Hypertrophic Adenoids and Healthy Controls. Biology 2026, 15, 1219. [Google Scholar] [CrossRef] [Scilit]
- Teng, Z.-p.; Zhang, J.-y.; Huang, Q. Oropharyngeal microbiome in children with adenotonsillar hypertrophy and after adenotonsillectomy. Acta Oto-Laryngol. 2023, 143, 507–513. [Google Scholar] [CrossRef] [Scilit]
- Drigot, Z.G.; Clark, S.E. Insights into the role of the respiratory tract microbiome in defense against bacterial pneumonia. Curr. Opin. Microbiol. 2024, 77, 102428. [Google Scholar] [CrossRef] [Scilit]
- Zemanick, E.T.; Rosas-Salazar, C. The Role of the Microbiome in Pediatric Respiratory Diseases. Clin. Chest Med. 2024, 45, 587–597. [Google Scholar] [CrossRef] [Scilit]
- Johnston, J.; Hoggard, M.; Biswas, K.; Astudillo-García, C.; Radcliff, F.J.; Mahadevan, M.; Douglas, R.G. Paired analysis of the microbiota between surface tissue swabs and biopsies from pediatric patients undergoing adenotonsillectomy. Int. J. Pediatr. Otorhinolaryngol. 2018, 113, 51–57. [Google Scholar] [CrossRef] [Scilit]

Disclaimer/Publisher’s Note: The statements, opinions and data contained in all publications are solely those of the individual author(s) and contributor(s) and not of MDPI and/or the editor(s). MDPI and/or the editor(s) disclaim responsibility for any injury to people or property resulting from any ideas, methods, instructions or products referred to in the content. |
© 2026 by the authors. Published by MDPI on behalf of the Lithuanian University of Health Sciences. Licensee MDPI, Basel, Switzerland. This article is an open access article distributed under the terms and conditions of the Creative Commons Attribution (CC BY) license.