


Abstract
Background and Objectives: Urinary bacterial ecology and antimicrobial resistance may change over time and vary across clinical settings. This study compared urinary bacterial isolate distributions and resistance patterns in a tertiary Romanian urology department in 2013 and 2023. Materials and Methods: This retrospective, single-center, laboratory-based study compared two cross-sectional snapshots from 2013 and 2023, comprising 642 bacterial isolate records from urine specimens (265 in 2013 and 377 in 2023). Organisms were harmonized into comparable taxonomic groups. Escherichia coli (E. coli) resistance was compared for antimicrobial agents with at least 30 interpretable results in each year using Fisher’s exact test with false discovery rate correction. Sensitivity analyses excluded exact duplicate records and intermediate susceptibility results. Results: The overall organism distribution differed significantly between years (p < 0.001). The proportion of Enterococcus spp. increased from 9.1% to 56.8%, whereas the proportion of Klebsiella spp. decreased from 91/265 (34.3%) to 2/377 (0.5%). The relative proportion of E. coli was similar in both years (30.9% versus 31.0%). Among E. coli isolates, the proportions reported as resistant were lower in 2023 for cefepime (20.8% to 0.9%), ceftazidime (24.6% to 1.8%), and gentamicin (25.0% to 3.3%). For piperacillin–tazobactam, the proportion reported as resistant was 4.6% in 2013 and 21.6% in 2023; however, counting the 11 intermediate 2013 results as resistant yielded 14/65 (21.5%), similar to the 2023 proportion. No significant differences were detected for cefuroxime, ciprofloxacin, levofloxacin, or meropenem. The overall organism-distribution difference persisted in the conservative profile-collapse analysis, whereas none of the E. coli antimicrobial resistance (AMR) comparisons remained statistically significant after FDR correction in that analysis, although resistance breakpoints could not be harmonized retrospectively. Conclusions: The two study years differed in urinary bacterial isolate composition and selected laboratory-reported E. coli resistance proportions. These findings support continued local surveillance, but changes in laboratory methods and susceptibility standards limit attribution of the observed differences to biological changes in resistance.
1. Introduction
Antimicrobial resistance (AMR) has become one of the major threats to contemporary medical care, compromising the effectiveness of antimicrobial therapy and increasing the clinical burden associated with otherwise treatable bacterial infections [1,2]. The global systematic assessment of bacterial AMR estimated that 4.95 million deaths were associated with resistance in 2019, including 1.27 million deaths directly attributable to resistant bacterial infections [1]. The burden is also substantial within the WHO European Region, where an estimated 541,000 deaths were associated with bacterial AMR and 133,000 were attributable to resistance in the same year [2]. Against this background, urinary tract infections (UTIs) are particularly relevant because they are among the most common bacterial infections requiring antimicrobial treatment, while increasing resistance among uropathogens progressively restricts the reliability of empirical therapy [3,4,5].
Antimicrobial resistance among uropathogens can limit treatment options, and resistance patterns may differ by bacterial species and antimicrobial agent [6,7,8]. Organism-specific surveillance can therefore help characterize local resistance patterns. In this study, we compared the distribution of urinary bacterial isolate records between 2013 and 2023 and evaluated selected agent-specific resistance proportions in E. coli; multidrug resistance itself was not a study outcome. The microbiological landscape of urinary infections is heterogeneous and is particularly complex in urological practice. Although Escherichia coli remains the predominant urinary pathogen in most settings, complicated and healthcare-associated urinary infections involve a broader spectrum of organisms, including Enterococcus spp., Klebsiella spp., Proteus spp., and Pseudomonas aeruginosa [3,9]. Patients managed in urology departments may additionally be exposed to factors that alter both bacterial ecology and antimicrobial susceptibility, including urinary tract obstruction or structural abnormalities, catheterization, endourological procedures, recurrent infection, hospitalization, and repeated antimicrobial exposure [3,10]. Data from the Global Prevalence Study on Infections in Urology (GPIU), which included urological centers from multiple geographical regions, demonstrated substantial pathogen diversity and high antimicrobial resistance among healthcare-associated urinary infections and urosepsis, emphasizing the importance of surveillance specifically within urological populations [11,12].
Importantly, neither uropathogen distribution nor antimicrobial resistance is static. Both may vary according to geographical region, healthcare setting, patient population, antimicrobial exposure, and calendar period, and changes in bacterial composition may occur simultaneously with changes in drug-specific resistance [13,14,15,16]. Long-term surveillance studies have demonstrated shifts in the relative frequency of urinary pathogens as well as substantial variation in antimicrobial susceptibility over time [13,14,15,16]. Similarly, contemporary department-specific investigations have shown that resistance profiles can differ markedly between individual organisms and antimicrobial agents within the same urological setting [17]. Consequently, aggregate measures of resistance may obscure clinically relevant organism–drug patterns, whereas local surveillance based on specific pathogens and antimicrobial agents can support surveillance and antimicrobial stewardship planning [11,12,17]. This issue is particularly relevant in Romania and other Eastern European healthcare settings, where the burden of antimicrobial resistance remains an important clinical concern [2]. Recent Romanian surveillance studies of positive urine cultures have confirmed substantial resistance among major uropathogens while also demonstrating considerable variation in bacterial distribution and susceptibility according to study population and setting [18,19]. In a five-year tertiary-care cohort from Bucharest, E. coli remained the predominant urinary isolate, followed by Klebsiella spp. and Enterococcus spp., with pronounced organism- and antimicrobial-specific resistance patterns [18]. More recent Romanian tertiary-center data have further illustrated the heterogeneity of contemporary urinary isolates and their resistance phenotypes [19]. However, published Romanian evidence has predominantly characterized contemporary or relatively short multi-year cohorts, while long-horizon comparisons performed within the same clinical department and restricted to a consistent specimen type remain relatively scarce.
To address this gap, the present study performed a retrospective, laboratory-based comparison of urinary bacterial isolates obtained from the same tertiary Urology Department in western Romania in 2013 and 2023. By restricting the analysis to urinary specimens from a single clinical department and harmonizing bacterial classifications across the two surveillance periods, we aimed to evaluate decade-apart changes in bacterial isolate distribution while limiting major sources of case-mix and specimen-type heterogeneity. The primary antimicrobial resistance analysis focused on E. coli because it was explicitly identified at species level in both years and eight antimicrobial agents had at least 30 interpretable results in each year. Testing coverage nevertheless differed between years, and identical panel selection could not be established. Resistance profiles of other major urinary bacterial groups were described for 2023. The study was therefore designed as a two-point surveillance comparison of bacterial ecology and organism-specific antimicrobial resistance rather than as an assessment of a continuous temporal trend.
2. Materials and Methods
2.1. Study Design and Setting
This retrospective, single-center, laboratory-based observational study was conducted at the “Pius Brînzeu” County Clinical Emergency Hospital, Timișoara, Romania, a tertiary university hospital serving western Romania. The study compared urinary bacterial isolates obtained from the Urology Department during two calendar years separated by a ten-year interval: 2013 and 2023.
The study was designed as a two-point, decade-apart surveillance comparison. Accordingly, the two study years were treated as distinct cross-sectional laboratory surveillance periods rather than as components of a continuous longitudinal time series. The analysis was intended to characterize differences in urinary bacterial isolate distribution and antimicrobial resistance patterns between the two available surveillance years and was not designed to establish a continuous temporal trend or attribute observed changes to a specific intervening event.
The primary analytical objectives were to compare the relative distribution of urinary bacterial isolate records between 2013 and 2023 and the laboratory-reported resistance proportions for E. coli–antimicrobial combinations with at least 30 interpretable results in each year. Contemporary resistance profiles of other major urinary bacterial taxa identified in 2023 were additionally described.
Reporting was guided by the STROBE(STrengthening the Reporting of OBservational studies in Epidemiology) recommendations for observational studies [20]. A completed checklist adapted to the record-based, two-period comparison is provided in Supplementary Table S8.
2.2. Data Source and Study Population
Data were obtained retrospectively from the microbiology laboratory database of the “Pius Brînzeu” County Clinical Emergency Hospital for the calendar years 2013 and 2023. For the present analysis, the study population was restricted to microbiological records originating from the Urology Department and corresponding to urine or urine-culture specimens.
The source records differed in structure between years. The 2013 records included urine entries without an identified bacterial organism or an interpretable antimicrobial susceptibility testing (AST) result, whereas the corresponding 2023 entries were predominantly labelled as urine-culture antibiograms. The same analytical eligibility criteria were applied to both years; however, the completeness and equivalence of the original record extraction procedures could not be established.
Eligible records were required to represent a bacterial isolate with an identifiable organism and sufficient microbiological information for classification. Negative cultures, non-bacterial findings, records without an identifiable bacterial organism, specimens other than urine or urine culture, and records originating outside the Urology Department were excluded from the study cohort. Antimicrobial resistance analyses were further restricted to isolates with interpretable antimicrobial susceptibility testing (AST) results for the antimicrobial agent under evaluation. Inclusion additionally required at least one interpretable AST result and recorded sex. For reporting the selection flow, exclusion reasons were assigned sequentially: absence of interpretable AST, non-bacterial identification among the remaining records, and missing sex among otherwise eligible records.
The analytical dataset was structured at two levels. The isolate-level dataset contained one laboratory record per included bacterial isolate and was used to describe cohort characteristics, Gram classification, taxonomic resolution, and bacterial isolate distribution. A separate AST-level dataset was constructed in long format, with each row representing one isolate–antimicrobial combination with an available susceptibility interpretation.
Reliable patient identifiers and specimen collection dates were unavailable in the source extracts. Consequently, repeated isolates from the same patient could not be identified systematically, and neither a first-isolate-per-patient rule nor deduplication within a defined time window could be applied. The unit of analysis was therefore the laboratory isolate record, rather than the unique patient. Exact matching records were evaluated separately in a sensitivity analysis; this procedure did not establish patient-level independence.
Study size was determined by the number of eligible records available in the two source extracts. All records meeting the eligibility criteria were included; no formal sample-size calculation was performed.
2.3. Microbiological Sample Collection and Processing
Urine specimens were collected during routine clinical care and processed in the hospital Microbiology Laboratory according to the laboratory procedures applicable during the respective study year. Urinary specimens were processed using quantitative or semi-quantitative culture methods, with inoculation on appropriate bacteriological media and evaluation of bacterial growth according to colony morphology, colony count, Gram staining where applicable, biochemical characteristics, and automated identification procedures.
For this retrospective study, an eligible bacterial isolate was defined as an organism identified and reported by the microbiology laboratory as part of the final result of a urinary specimen. The analysis relied on the microbiological identification recorded in the original laboratory database. Clinical adjudication of symptomatic infection versus asymptomatic bacteriuria or colonization was not possible from the available laboratory data.
Colony-count notation was embedded in organism labels in the 2013 source extract but was absent from the 2023 labels. Among the 265 included 2013 records, 207 (78.1%) were labelled at or above 105 CFU/mL, 44 (16.6%) below 105 CFU/mL, and 14 (5.3%) had no numeric colony-count notation. Compact source strings such as ‘105’ and ‘106’ were interpreted as 105 and 106 CFU/mL, respectively, for this descriptive categorization. The source extracts did not document the significant-growth thresholds applied in either year or provide comparable colony-count data for 2023. They also did not permit reliable classification of cultures as monomicrobial or polymicrobial or reconstruction of how individual organisms from mixed cultures were recorded. The analysis therefore used the reported bacterial isolate records without assuming one record per urine specimen. Assignment to the Urology Department was based on the recorded department field; inpatient versus outpatient status could not be determined reliably. The specific culture media and year-specific specimen acceptance and positive-culture reporting protocols were not documented in the available study materials; consequently, their comparability between 2013 and 2023 could not be verified.
2.4. Bacterial Identification and Antimicrobial Susceptibility Testing
Bacterial identification and antimicrobial susceptibility testing were performed using the laboratory procedures implemented during each surveillance year. In 2013, bacterial identification and AST were performed using the Vitek 2 automated system (bioMérieux, Marcy-l’Étoile, France). Antimicrobial susceptibility was assessed using automated minimum inhibitory concentration determination and, when required by the laboratory workflow, the Kirby–Bauer disk diffusion method. Susceptibility interpretations were based on the Clinical and Laboratory Standards Institute (CLSI) criteria implemented by the laboratory at that time [21].
In 2023, bacterial identification was performed using the VITEK® 2 Compact system (bioMérieux, Marcy-l’Étoile, France) and matrix-assisted laser desorption/ionization time-of-flight mass spectrometry using the MALDI Biotyper system (Bruker, Bremen, Germany). AST was performed using the VITEK® 2 Compact system with minimum inhibitory concentration determination and, where applicable, disk diffusion. Susceptibility interpretations followed the European Committee on Antimicrobial Susceptibility Testing (EUCAST) breakpoint framework implemented by the laboratory in 2023 [22].
The retrospective hospital dataset provided for this study contained categorical susceptibility interpretations but no isolate-specific minimum inhibitory concentration(MIC) values or inhibition-zone diameters for any record from either year, including 2013. Therefore, no isolate could be retrospectively reclassified using its MIC or inhibition-zone measurement. Susceptibility categories were therefore analyzed as originally reported by the laboratory during the corresponding study period rather than retrospectively reinterpreted using a single contemporary breakpoint system. The available records did not document the exact date of transition between interpretive standards, the breakpoint-table version applied to each result, the automated-system software configuration, or the indication-specific breakpoint row selected. Consequently, the period-specific frameworks described above could not be verified at the individual isolate–antimicrobial level. Published breakpoint tables were used to contextualize potential differences in categorical interpretation, rather than to retrospectively reclassify the study results.
Published resistance MIC breakpoints applicable to E. coli were compared for the eight antimicrobial agents included in the primary analysis to contextualize potential differences in categorical interpretation [21,22] (Table S6). This comparison did not establish which breakpoints were implemented for individual records and was not used to reclassify susceptibility results.
AST results were classified as susceptible (S), intermediate or susceptible at increased exposure (I), or resistant (R), according to the period-specific interpretation recorded in the laboratory database. For the primary binary resistance analyses, resistance was defined strictly as category R, whereas S and I were grouped as non-resistant. Because the interpretation and clinical meaning of category I differed between historical CLSI (Clinical and Laboratory Standards Institute)-based reporting and contemporary EUCAST(European Committee on Antimicrobial Susceptibility Testing) terminology [21,22,23], a sensitivity analysis was performed after excluding I results and recalculating resistance as R/(R + S). Excluding I results addresses sensitivity to the inclusion of that category in the denominator, but does not harmonize the resistant breakpoints or other differences in susceptibility testing and interpretation [21,22,24,25].
The source extracts contained reported susceptibility categories but did not document isolate-specific panel selection or selective/cascade reporting policies. We therefore could not distinguish results unavailable because an agent was not tested from those potentially omitted during reporting or extraction. Testing coverage was calculated from the interpretable results available in the dataset and is presented for each primary agent in Table 1.
Table 1.
Testing coverage and laboratory-reported antimicrobial resistance among E. coli urinary isolate records in 2013 and 2023.
2.5. Data Harmonization and Quality Control
The 2013 and 2023 datasets were harmonized before statistical analysis. Variable names, sex categories, specimen labels, organism names, antimicrobial names, and AST interpretations were standardized across the two surveillance years. Antimicrobial names recorded using abbreviations, local terminology, or alternative spellings were mapped to common standardized names.
Because taxonomic resolution differed substantially between the two surveillance periods, bacterial distribution analyses were performed using harmonized organism groups that could be compared reliably across years. The principal categories were Enterococcus spp., E. coli, Klebsiella spp., Proteus spp., Pseudomonas spp., and other bacteria. Species-level identification was retained for descriptive analyses when reliably available but was not imposed retrospectively on isolates originally identified only to genus level. The mapping of original organism labels to standardized labels and harmonized analytical groups is provided in Supplementary Table S4.
The “other bacteria” category comprised organisms outside the five named analytical groups. In 2013 (n = 27), it included Acinetobacter baumannii, Acinetobacter lwoffii, Citrobacter farmeri, Enterobacter cloacae, Enterobacter gergoviae, Flavimonas oryzihabitans, Myroides spp. with unresolved species identification, Pantoea agglomerans, Providencia stuartii, Staphylococcus aureus, coagulase-negative staphylococci, Stenotrophomonas maltophilia, Streptococcus agalactiae, and group B beta-haemolytic streptococci without an explicit species designation. In 2023 (n = 18), it comprised Morganella morganii (n = 14) and Streptococcus agalactiae (n = 4). Record counts and original labels are detailed in Supplementary Table S4.
All 642 included records were checked against the original source spreadsheets to verify organism labels and reported S/I/R categories. Organism labels were also reviewed to confirm their assignment to the harmonized analytical groups. Verification confirmed concordance of organism labels and reported S/I/R categories with the source records and supported the assignment of organisms to the six harmonized analytical groups. Genus-only labels were retained without inferring species identity. This verification assessed consistency with the source records and did not constitute independent microbiological confirmation. The hospital-derived dataset contained categorical S/I/R results but no linked original instrument output, MIC values, or archived species-level identification records for further retrospective verification.
Gram-positive or Gram-negative classification and taxonomic resolution were retained as descriptive characteristics of the surveillance cohorts. Taxonomic resolution reflected the identification explicitly recorded in the source files. Genus-only identifications, coagulase-negative staphylococci, group B beta-haemolytic streptococci without an explicit species designation, and unresolved species labels were classified as genus/group-level or unresolved. Species identities were not inferred from these records.
AST records were checked for internally conflicting susceptibility classifications. Isolate–antimicrobial records containing incompatible simultaneous susceptibility categories were excluded from AST analyses rather than resolved by assumption. Each remaining isolate–antimicrobial combination contributed a maximum of one interpretable AST result.
Potential exact duplicate records were identified when all available source-level microbiological fields were identical. Because the available data did not permit confirmation that such records represented true biological duplicates rather than separate laboratory observations, they were retained in the primary analysis. Their influence was examined in a sensitivity analysis in which only one observation from each exact duplicate group was retained.
2.6. Outcomes and Analytical Framework
The primary study outcome was the distribution of harmonized urinary bacterial organism groups in 2013 and 2023.
The principal antimicrobial resistance analysis focused on E. coli. To reduce instability arising from sparse and uneven antimicrobial testing, primary between-year comparisons were restricted to antimicrobial agents with at least 30 interpretable E. coli AST results in each surveillance year. Eight agents met this criterion: cefepime, ceftazidime, cefuroxime, ciprofloxacin, gentamicin, levofloxacin, meropenem, and piperacillin–tazobactam. Trimethoprim–sulfamethoxazole and nitrofurantoin were not eligible for between-year E. coli comparisons because only five and one interpretable results, respectively, were available in 2013. Ceftriaxone was also ineligible because interpretable results were available for only 8/82 E. coli records (9.8%) in 2013, compared with 109/117 (93.2%) in 2023. Available 2023 results for trimethoprim–sulfamethoxazole and nitrofurantoin were retained for descriptive reporting in Supplementary Table S1. Organism–antimicrobial comparisons with at least 20 interpretable tests in both surveillance years but fewer than 30 tests in at least one year were considered exploratory rather than primary. Amoxicillin–clavulanate met this criterion and was therefore analyzed separately as an exploratory E. coli comparison.
A descriptive analysis was additionally performed to characterize the contemporary 2023 antimicrobial resistance landscape. This analysis focused on major bacterial taxa represented by at least 10 isolates and on clinically interpretable organism–antimicrobial combinations with at least 10 AST results and at least 50% testing coverage within the corresponding organism group. The taxonomically heterogeneous “other bacteria” category was not treated as a single entity for organism-specific AMR interpretation. A concise selection of clinically relevant resistance markers was presented in the main manuscript, whereas the broader eligible 2023 resistance matrix was reported in Supplementary Table S1. These analyses were descriptive and were not intended to represent a formal cumulative antibiogram.
2.7. Statistical Analysis
Categorical variables were summarized as frequencies and percentages. Cohort characteristics, including sex, Gram classification, and taxonomic resolution, were primarily described to characterize differences in the composition and laboratory reporting of the two surveillance cohorts.
The overall distribution of harmonized bacterial organism groups between 2013 and 2023 was compared using Pearson’s chi-square test. The magnitude of the association between surveillance year and organism distribution was quantified using Cramér’s V. Organism-specific post-hoc comparisons contrasted each organism group against all other isolates using Fisher’s exact test. For each group, absolute differences in proportions were expressed as 2023 minus 2013 in percentage points, and odds ratios (ORs) with 95% confidence intervals (CIs) were calculated. Post-hoc p-values were adjusted for multiple comparisons using the Benjamini–Hochberg false discovery rate (FDR) procedure.
For the primary E. coli AMR analysis, resistance proportions were calculated as the number of resistant isolates divided by the number of isolates with an interpretable AST result for the corresponding antimicrobial agent. Each antimicrobial agent was compared between 2013 and 2023 using Fisher’s exact test. ORs with 95% CIs were estimated from the corresponding 2 × 2 resistance tables. Absolute differences in resistance proportions were calculated as 2023 minus 2013 and are reported in percentage points with 95% Newcombe–Wilson confidence intervals. The eight primary antimicrobial comparisons constituted a single family of tests, and their p-values were adjusted using the Benjamini–Hochberg FDR procedure. The exploratory amoxicillin–clavulanate comparison was analyzed separately and was not included in the primary multiplicity adjustment.
Contemporary 2023 resistance profiles of non-E. coli organisms were summarized descriptively as resistant/tested isolates and percentages. No hypothesis testing was performed for these contemporary descriptive profiles because of the limited number of isolates for several bacterial taxa.
Two sensitivity analyses were performed. First, the principal organism-distribution and E. coli AMR analyses were repeated after retaining only one observation from each group of exact duplicate records. Second, the primary E. coli AMR comparisons were repeated after excluding all AST results categorized as I, thereby defining resistance as R/(R + S). The same statistical procedures and FDR adjustment used in the corresponding primary analyses were applied to the sensitivity analyses. Detailed sensitivity results are reported in Supplementary Table S2.
Third, a conservative profile-collapse bound was constructed separately for each year by retaining one record for each unique combination of harmonized organism group, recorded sex, and the complete vector of available interpretable AST categories. An antimicrobial result that was unavailable or internally conflicting was treated as unavailable, not as susceptible. This procedure was intended to assess the effect of repeated identical organism–sex–antibiogram profiles; it was not a patient-level deduplication method, because distinct patients may share an identical profile and one patient may contribute records with different profiles. Detailed results are reported in Supplementary Table S10.
An additional sensitivity analysis compared organism distributions between years separately within female and male records to assess whether the principal compositional differences persisted within each sex. Each organism group was contrasted with all remaining records using Fisher’s exact test, with Benjamini–Hochberg FDR correction across the 12 comparisons. Percentages were calculated within each sex and year, and absolute differences were expressed as 2023 minus 2013 in percentage points. No formal interaction analysis was performed.
An additional sensitivity analysis compared ciprofloxacin and levofloxacin resistance between years using only E. coli isolate records with interpretable results for both agents. Resistance was defined as R/(S + I + R), and the same within-year subset was used for both drugs. Fisher’s exact tests and Newcombe–Wilson confidence intervals were calculated, with Benjamini–Hochberg adjustment across the two supplementary comparisons.
Missing values were not imputed. Records lacking sex or any usable AST result were excluded according to the eligibility criteria. For each antimicrobial comparison, only available interpretable results were analyzed; unavailable or internally conflicting results were not classified as susceptible or resistant. Agent-specific denominators and testing coverage are reported in Table 1.
Statistical tests and confidence intervals were calculated treating isolate records as independent observations. Because patient-level clustering could not be assessed or accounted for, repeated sampling may have affected both the estimated proportions and their uncertainty. Accordingly, p-values and confidence intervals should be interpreted cautiously and do not represent inference from a confirmed cohort of independent patients.
All statistical tests were two-sided. An FDR-adjusted p-value < 0.05 was considered statistically significant for analyses involving multiple comparisons; otherwise, a two-sided p-value < 0.05 was used. Statistical analyses were performed using R (R 4.5.0 (2025-04-11 ucrt)) (R Foundation for Statistical Computing, Vienna, Austria).
2.8. Ethical Considerations
The study was based exclusively on retrospective microbiological laboratory data collected during routine clinical care. No intervention was performed and no direct patient contact was involved. The dataset used for statistical analysis contained no direct patient identifiers. No re-identification key was used in the analysis, and no linkage to patient-level clinical records was performed. Whether the hospital retained a separate linkage key was not established.
The study was conducted in accordance with institutional requirements for retrospective observational research and was approved by the Ethics Committee of the “Pius Brînzeu” County Clinical Emergency Hospital, Timișoara, Romania (approval no. 519/30.12.2024).
3. Results
3.1. Cohort Characteristics and Data Quality
Among the available Urology urine/urine-culture records, 576 entries from 2013 and 378 from 2023 were screened. In 2013, 308 records were excluded because no interpretable AST result was available; among the remaining records, one non-bacterial record and two records with missing sex were excluded. In 2023, one record was excluded because no interpretable AST result was available. The primary analysis therefore included 642 bacterial isolate records: 265 from 2013 and 377 from 2023 (Table 2; Figure S1).
Among the 308 records excluded in 2013 because no interpretable AST result was available, two (0.6%) had an explicitly identified bacterium: one Staphylococcus aureus and one coagulase-negative staphylococcus. Both were assigned to the harmonized ‘other bacteria’ group. Forty records were labelled mixed bacterial flora without taxon-level identification, 265 contained colony-count notation without a named organism, and one had no organism entry (Supplementary Table S9).
Females accounted for 47.5% of isolates in 2013 and 54.9% in 2023. The composition by Gram classification differed substantially between surveillance years: Gram-negative organisms represented 86.8% of isolates in 2013 compared with 42.2% in 2023, whereas Gram-positive organisms increased from 13.2% to 57.8%.
The taxonomic detail retained in the source records differed between the two surveillance periods. Explicit species-level identification was available for 232/265 isolates (87.5%) in 2013 and 167/377 (44.3%) in 2023, while genus/group-level or unresolved identification accounted for 12.5% and 55.7%, respectively (Table 2).
The organism-specific breakdown showed that 196 of the 210 genus/group-level or unresolved records in 2023 belonged to Enterococcus spp.; the remaining records comprised Pseudomonas spp. (n = 12) and Klebsiella spp. (n = 2). Among the 214 Enterococcus records in 2023, 17 explicitly identified E. faecalis and one identified E. avium, whereas 196 contained genus-only labels. All E. coli records in both years retained species-level identification (Supplementary Table S3).
All included isolates had at least one usable antimicrobial susceptibility testing (AST) result. Following data-quality assessment, seven internally conflicting AST entries were excluded from the test-level analyses, leaving 5970 usable AST results. Thirty-one records from 2023 were identified as belonging to 13 exact duplicate groups; these records were retained in the primary analysis, with their potential influence subsequently evaluated in sensitivity analyses.
Table 2.
Characteristics of urinary bacterial isolates included in the 2013 and 2023 surveillance cohorts.
3.2. Differences in Urinary Bacterial Isolate Distribution Between 2013 and 2023
The overall distribution of urinary bacterial isolates differed markedly between 2013 and 2023 (Pearson χ2 = 236.77, df = 5, p < 0.001), with a large effect size (Cramér’s V = 0.607) (Table 3; Figure 1).
Figure 1.
Distribution of urinary bacterial isolates in the Urology Department in 2013 and 2023. Bars show the relative distribution of harmonized bacterial organism groups among all eligible urinary bacterial isolates in each surveillance year (2013, n = 265; 2023, n = 377). Percentages were calculated separately within each year. The marked shift in overall organism distribution was statistically significant (Pearson χ2 = 236.77, df = 5, p < 0.001; Cramér’s V = 0.607).
The largest change involved Enterococcus spp., which increased from 24/265 isolates (9.1%) in 2013 to 214/377 (56.8%) in 2023, corresponding to an absolute increase of 47.7 percentage points (95% CI 41.6 to 53.8) and substantially higher odds of representation in 2023 (OR 13.13, 95% CI 8.15 to 21.91; FDR-adjusted p < 0.001). Conversely, Klebsiella spp. decreased from 91/265 isolates (34.3%) to 2/377 (0.5%), an absolute reduction of 33.8 percentage points (95% CI −39.6 to −28.0; OR 0.010, 95% CI 0.001 to 0.039; FDR-adjusted p < 0.001).
Smaller but statistically significant reductions were observed for the heterogeneous “other bacteria” group, from 10.2% to 4.8% (difference −5.4 percentage points, 95% CI −9.6 to −1.2; FDR-adjusted p = 0.017), and for Pseudomonas spp., from 9.1% to 3.2% (difference −5.9 percentage points, 95% CI −9.8 to −2.0; FDR-adjusted p = 0.005). In contrast, the relative representation of E. coli was essentially unchanged between the two surveillance years (30.9% vs. 31.0%; difference 0.1 percentage points, 95% CI −7.2 to 7.4; FDR-adjusted p = 1.000). The decrease in Proteus spp. from 6.4% to 3.7% was not statistically significant after multiple-testing correction (FDR-adjusted p = 0.163). The magnitude and direction of these compositional changes are illustrated in Figure 1.
In the conservative profile-collapse analysis, 261 unique organism–sex–antibiogram profiles were retained from 265 records in 2013, compared with 48 from 377 records in 2023. The overall organism distribution remained different between years (χ2 = 48.71, df = 5, p < 0.001; Cramér’s V = 0.397). Enterococcus spp. represented 9.2% (24/261) of retained profiles in 2013 and 43.8% (21/48) in 2023, whereas Klebsiella spp. represented 34.5% (90/261) and 4.2% (2/48), respectively; these two organism-specific comparisons remained significant after FDR correction. The other organism-specific comparisons were not statistically significant after correction (Supplementary Table S10).
In a sensitivity analysis restricted to the 207/265 2013 records labelled at or above 105 CFU/mL, the organism distribution remained different from that of the full 2023 cohort (n = 377; Pearson χ2 = 233.10, df = 5, p < 0.001; Cramér’s V = 0.632). In this 2013 subset, Enterococcus spp. accounted for 14/207 records (6.8%), Klebsiella spp. for 79/207 (38.2%), and E. coli for 68/207 (32.9%), compared with 214/377 (56.8%), 2/377 (0.5%), and 117/377 (31.0%), respectively, in 2023. This comparison was not threshold-matched because colony-count notation was unavailable in the 2023 records (Supplementary Table S2, Panel D).
Table 3.
Distribution of urinary bacterial isolates in the Urology Department in 2013 and 2023.
3.3. Differences in Laboratory-Reported E. coli Antimicrobial Resistance Between 2013 and 2023
Among the eight antimicrobial agents meeting the predefined requirement of at least 30 interpretable E. coli AST results in each surveillance year, four showed statistically significant changes in resistance after correction for multiple comparisons (Table 1; Figure 2).
Figure 2.
Absolute changes in antimicrobial resistance among E. coli urinary isolates between 2013 and 2023. Points represent absolute differences in resistance proportions between 2023 and 2013, expressed in percentage points, with horizontal lines indicating 95% Newcombe–Wilson confidence intervals. Negative values indicate lower resistance in 2023 and positive values indicate higher resistance in 2023. Primary comparisons included antimicrobial agents with at least 30 interpretable AST results in each surveillance year. Statistical significance for primary comparisons was assessed using Fisher’s exact test with Benjamini–Hochberg FDR correction. † Amoxicillin–clavulanate was evaluated exploratorily because only 23 E. coli isolates were tested in 2023 and was therefore not included among the eight primary comparisons. For each antimicrobial, the row label reports the number of resistant isolates divided by the number with an interpretable susceptibility result in 2013 and 2023, respectively. AST, antimicrobial susceptibility testing; and FDR, false discovery rate.
Resistance to cefepime decreased from 11/53 isolates (20.8%) in 2013 to 1/117 (0.9%) in 2023, corresponding to an absolute reduction of 19.9 percentage points (95% CI −32.6 to −10.3; OR 0.034, 95% CI 0.001 to 0.244; FDR-adjusted p < 0.001). A similarly pronounced reduction was observed for ceftazidime, from 16/65 (24.6%) to 2/109 (1.8%), with an absolute difference of −22.8 percentage points (95% CI −34.5 to −12.8; OR 0.058, 95% CI 0.006 to 0.262; FDR-adjusted p < 0.001). Gentamicin resistance also declined substantially, from 8/32 (25.0%) in 2013 to 3/91 (3.3%) in 2023 (difference −21.7 percentage points, 95% CI −38.9 to −8.5; OR 0.105, 95% CI 0.017 to 0.478; FDR-adjusted p = 0.002).
Under the primary analysis, which classified category R as resistant and categories S and I as non-resistant, piperacillin–tazobactam resistance was reported in 3/65 isolates (4.6%) in 2013 and 25/116 (21.6%) in 2023. The difference in laboratory-reported R proportions was 16.9 percentage points (95% CI 6.5 to 25.8; OR 5.63, 95% CI 1.61 to 30.42; FDR-adjusted p = 0.005). However, 11/65 results (16.9%) were categorized as I in 2013, compared with none in 2023. In an illustrative scenario counting all 11 intermediate 2013 results as resistant, the 2013 proportion would be 14/65 (21.5%), similar to the 2023 proportion of 25/116 (21.6%). This scenario is descriptive and does not represent retrospective breakpoint harmonization. No statistically significant between-year differences were detected for cefuroxime (32.6% vs. 30.8%; FDR-adjusted p = 0.970), ciprofloxacin (57.1% vs. 59.4%; FDR-adjusted p = 0.970), or levofloxacin (36.2% vs. 39.4%; FDR-adjusted p = 0.970). No meropenem-resistant E. coli isolates were observed in either surveillance year among the tested isolates (0/62 in 2013 and 0/117 in 2023).
Under the conservative profile-collapse bound, none of the eight E. coli antimicrobial resistance comparisons remained statistically significant after FDR correction. The numerical directions for cefepime, ceftazidime, and piperacillin–tazobactam were retained, but the 2023 tested denominators were substantially reduced, and estimates were therefore imprecise (Supplementary Table S10).
An additional exploratory comparison was performed for amoxicillin–clavulanate, which did not meet the predefined primary-analysis threshold because only 23 isolates were tested in 2023. Resistance decreased from 27/58 isolates (46.6%) in 2013 to 2/23 (8.7%) in 2023, corresponding to an absolute reduction of 37.9 percentage points (95% CI −52.0 to −16.0; Fisher’s exact p = 0.002). This exploratory estimate is displayed separately from the primary comparisons in Figure 2.
For urinary agents not eligible for between-year comparison, the available 2023 E. coli results showed trimethoprim–sulfamethoxazole resistance in 5/83 tested isolates (6.0%) and no nitrofurantoin resistance among 59 tested isolates (0/59, 0.0%). Interpretable ceftriaxone results were available for 8/82 E. coli isolates (9.8%) in 2013, compared with 109/117 (93.2%) in 2023; ceftriaxone was therefore not compared between years. These results are descriptive and are also presented in Supplementary Table S1.
3.4. Contemporary Antimicrobial Resistance Profiles of Major Non-E. coli Urinary Bacterial Isolates in 2023
Selected resistance profiles of the major non-E. coli organisms isolated in 2023 are summarized in Table 4, while the complete organism–antimicrobial susceptibility matrix is provided in Supplementary Table S1. Given the limited number of isolates for several organisms, these estimates were considered descriptive.
Among the 214 Enterococcus spp. isolates, resistance was highest for ciprofloxacin, affecting 75/122 tested isolates (61.5%), and for high-level gentamicin, affecting 63/119 (52.9%). Lower resistance proportions were observed for vancomycin (28/194, 14.4%), ampicillin (20/189, 10.6%), and linezolid (19/194, 9.8%) (Table 4). Of the 214 Enterococcus records, 196 were reported at genus level, 17 as E. faecalis, and one as E. avium; no record was explicitly identified as E. faecium (Table S3). No linked species-level identification records were available in the retrospective hospital database extract to resolve the genus-only labels further. The absence of an explicit E. faecium label does not establish its absence among the genus-level records. Resistance estimates were therefore reported for Enterococcus spp. collectively.
Distinct resistance patterns were observed among the less frequent Gram-negative organisms. Among 14 Proteus mirabilis isolates, all tested isolates were resistant to levofloxacin and trimethoprim–sulfamethoxazole (14/14, 100% for each), whereas resistance to amoxicillin–clavulanate and cefepime was detected in 1/14 isolates (7.1%) for each agent, and no meropenem resistance was observed. Among 12 Pseudomonas spp. isolates, 8/12 (66.7%) were resistant to each of amikacin, ceftazidime, levofloxacin, and meropenem, while none was classified as resistant to piperacillin–tazobactam. For Morganella morganii (n = 14), resistance was observed in all tested isolates for ceftazidime and ciprofloxacin (14/14, 100%), whereas no resistance was observed to cefepime, meropenem, or piperacillin–tazobactam. Complete denominators and results for additional antimicrobial agents are reported in Supplementary Table S1.
The reported susceptibility categories were checked against the original source spreadsheets, including the Pseudomonas, M. morganii, and Enterococcus results highlighted above. This confirmed concordance with the recorded data, but isolate-level MICs, inhibition-zone diameters, and documentation of confirmatory testing were unavailable. These unusual profiles therefore remain unconfirmed by an independent laboratory method and should be interpreted as descriptive laboratory-reported findings.
Table 4.
Selected antimicrobial resistance profiles of major non-E. coli urinary bacterial isolates in 2023.
3.5. Sensitivity Analyses
The direction and statistical significance of the principal comparisons were preserved in the sensitivity analyses excluding exact duplicate records and intermediate AST results (Supplementary Table S2). First, removal of redundant exact duplicate records resulted in the exclusion of 18 observations from the 2023 cohort, reducing the number of 2023 isolates from 377 to 359. The overall difference in bacterial isolate distribution remained highly significant after duplicate exclusion (Pearson χ2 = 230.11, df = 5, p < 0.001), and the effect size was essentially unchanged (Cramér’s V = 0.607). The direction and statistical interpretation of all organism-specific post-hoc comparisons were also preserved.
Exact matching groups were detected only in the 2023 extract. Their absence in 2013 does not establish the absence of repeated patient sampling in that year, because the detection of matching records depends on the structure and detail of the available fields. This sensitivity analysis evaluated exact record matches and could not identify repeat isolates with differences in organism reporting, testing panels, or susceptibility results.
The E. coli resistance findings were similarly stable after duplicate exclusion. The absolute differences remained −19.9 percentage points for cefepime, −22.7 for ceftazidime, −21.6 for gentamicin, and +17.0 for piperacillin–tazobactam, with all four comparisons remaining statistically significant after FDR correction. No previously non-significant primary comparison became significant.
In the second sensitivity analysis, intermediate AST results were excluded and resistance proportions were recalculated using only resistant and susceptible results [R/(R + S)]. The principal findings were again preserved: cefepime resistance remained lower in 2023 by 19.9 percentage points (95% CI −32.6 to −10.3; FDR-adjusted p < 0.001), ceftazidime by 23.2 percentage points (95% CI −35.1 to −13.1; FDR-adjusted p < 0.001), and gentamicin by 23.4 percentage points (95% CI −41.3 to −9.5; FDR-adjusted p = 0.002). Piperacillin–tazobactam resistance remained higher in 2023, with an absolute difference of 16.0 percentage points (95% CI 4.4 to 25.1; FDR-adjusted p = 0.016). Cefuroxime, ciprofloxacin, levofloxacin, and meropenem remained non-significant. Neither exact duplicate exclusion nor exclusion of intermediate AST results changed the direction or statistical significance of the principal comparisons (Supplementary Table S2). However, these analyses did not harmonize resistance breakpoints or account for other differences in laboratory methods between years.
In the sex-stratified analysis, the higher Enterococcus proportion and lower Klebsiella proportion in 2023 were observed in both female and male records (all four FDR-adjusted p-values < 0.001; Supplementary Table S5). Enterococcus increased from 11.9% to 50.7% among female records and from 6.5% to 64.1% among male records; Klebsiella decreased from 21.4% to 0.5% and from 46.0% to 0.6%, respectively. E. coli proportions were lower in 2023 among female records (46.8% versus 36.7%) and higher among male records (16.5% versus 24.1%), although neither comparison was statistically significant after FDR correction.
Results for both ciprofloxacin and levofloxacin were available for 36/82 E. coli records (43.9%) in 2013 and only 4/117 (3.4%) in 2023. Within these subsets, ciprofloxacin resistance was 19/36 (52.8%) versus 2/4 (50.0%), and levofloxacin resistance was 13/36 (36.1%) versus 2/4 (50.0%). Neither between-year comparison was statistically significant after adjustment, but confidence intervals were wide (Table S7). The limited overlap in 2023 precludes firm conclusions from this sensitivity analysis.
4. Discussion
The present study identified substantial decade-apart differences in both the composition of urinary bacterial isolates and selected antimicrobial resistance patterns within the same tertiary Urology Department. The proportion of Enterococcus spp. was higher and that of Klebsiella spp. was lower in 2023 than in 2013, whereas E. coli accounted for approximately 31% of records in both surveillance years. Within E. coli, the proportions reported as resistant were lower in 2023 for cefepime, ceftazidime, and gentamicin and higher for piperacillin–tazobactam; no statistically significant between-year differences were detected for cefuroxime, ciprofloxacin, levofloxacin, or meropenem. Importantly, these principal findings were preserved after removing exact duplicate records and after restricting susceptibility comparisons to unequivocal R and S categories. These findings describe organism- and antimicrobial-specific differences between the two available study years; they do not establish the trajectory of change during the intervening decade.
The magnitude of the change in bacterial composition was one of the strongest findings of the study. Comparable urology-specific surveillance studies confirm that the microbial spectrum in this setting is broader than that typically reported for uncomplicated community-acquired UTIs [3,11,12]. In a Central European tertiary Urology Department, Hrbáček et al. reported E. coli, Enterococcus spp., Klebsiella spp., P. aeruginosa, and Proteus spp. as the predominant organisms, accounting for 26.0%, 22.4%, 11.3%, 7.3%, and 6.2% of positive urinary cultures, respectively [26]. More recently, a 12-year surveillance study from the Urology Department of the University of Szeged found that E. coli remained the leading organism but decreased from 53% to 40%, while the relative frequency of several other uropathogens also changed over time [27]. These studies demonstrate that bacterial composition in urological populations is dynamic and locally dependent rather than fixed [26,27].
The lower proportion of species-level records in 2023 requires distinction between laboratory identification and the taxonomic detail retained in the available data. Of the 210 genus/group-level or unresolved records in 2023, 196 were labelled as Enterococcus spp., 12 as Pseudomonas spp., and two as Klebsiella spp. These genus-only labels were present in the original records and were not introduced by analytical aggregation. The available data could not establish whether they reflected the original identification result or reduced detail during reporting or extraction. Accordingly, the lower recorded species-level resolution should not be interpreted as evidence of reduced laboratory identification capability. Changes in identification platforms and reporting workflows may have contributed to differences between the datasets, but the available records did not allow their effects to be separated or quantified. Cross-year comparisons were performed using harmonized taxonomic groups, while species-specific interpretation was restricted to explicitly identified records. The higher Enterococcus and lower Klebsiella proportions also persisted within both sex strata, indicating that the difference in sex composition alone did not account for these contrasts. This analysis could not address other unmeasured differences in patient characteristics, sampling, or record capture.
A relevant local comparator is the hospital-wide study by Olariu et al., which analyzed 1186 positive urine cultures from adults in 2021 at the same hospital and reported Enterococcus spp. and Klebsiella spp. proportions of 17.3% and 15.7%, respectively [28]. These differ markedly from the corresponding proportions in our 2023 Urology records (56.8% and 0.5%). However, the 2021 study included both inpatients and outpatients, retained only the first positive urine culture per patient, and included only single-organism cultures [28]. Our dataset was department-specific and lacked the patient identifiers required for equivalent deduplication. The discrepancy therefore warrants caution but cannot establish a hospital-wide temporal change. Verification against the original spreadsheets confirmed the recorded organism labels and their group assignments; it could not establish the completeness or representativeness of the source extracts.
Colony-count information was recorded differently in the two source extracts. In 2013, colony-count notation was embedded in the organism labels for 251 of 265 included records, while 14 records had no explicit numeric notation; the 2023 labels contained no colony-count values. Restricting the 2013 analysis to records labelled at or above 105 CFU/mL did not eliminate the difference in organism distribution compared with the full 2023 cohort. However, this was not a threshold-matched comparison, and the significant-growth thresholds applied in either year were unavailable. In addition, lower colony counts may be clinically meaningful in some urological settings. The sensitivity analysis therefore shows how the 2013 distribution changes after excluding records labelled below 105 CFU/mL or lacking an explicit count, but it cannot establish comparability of culture positivity between years.
Enterococcus spp. accounted for 56.8% of the included records in 2023, but most lacked species-level identification. This genus-level proportion cannot be compared directly with proportions reported specifically for E. faecalis in other cohorts. Nevertheless, the prominence of enterococci in hospitalized and urological populations is biologically plausible [29,30]. Long-term Hungarian surveillance of Gram-positive urinary isolates found Enterococcus spp. to dominate Gram-positive urinary pathogens, particularly among hospitalized patients [29], while contemporary reviews emphasize their importance in healthcare-associated and catheter-associated UTIs, their ability to form biofilms, and their adaptation to hospital environments [8,30]. The present dataset, however, did not contain sufficiently detailed information on catheterization, urinary diversion, instrumentation, hospitalization duration, or other device-related exposures.
The higher proportion of Enterococcus spp. records in 2023 therefore cannot be attributed to a specific clinical mechanism, and the predominance of genus-only labels precludes determining which Enterococcus species accounted for this difference.
The reciprocal decrease in Klebsiella spp., from 34.3% in 2013 to 0.5% in 2023, was similarly large and requires cautious interpretation. Comparisons should distinguish Klebsiella spp. from K. pneumoniae, because species-specific proportions are not directly equivalent to the genus-level share analyzed here. The hospital-wide 2021 comparator provides a genus-level comparison, but differences in population and record selection prevent direct temporal inference [28]. The difference may reflect genuine changes in the local population, but changes in sampling, referral pathways, laboratory reporting, organism identification, or data capture over the decade may also have contributed.
This concern is reinforced by the substantial difference in taxonomic detail retained in the source records, with explicit species-level identification available for 87.5% of isolates in 2013 but only 44.3% in 2023. Verification against the original source records confirmed the Enterococcus and Klebsiella group counts, indicating that the contrast was not introduced by transcription or assignment to the harmonized analytical groups. Nevertheless, this verification could not exclude differences in the completeness or selection of the underlying records.
Selection according to AST availability may also have influenced the 2013 cohort composition. Of the 308 screened records excluded in 2013 because no interpretable AST result was available, only two contained an explicitly identified taxon, and both were assigned to the ‘other bacteria’ group (Supplementary Table S9). The excluded records therefore do not represent 308 identified but untested bacterial isolates. Nevertheless, the 2013 distribution describes only records meeting the AST-based eligibility criteria; if AST availability was associated with organism identification or laboratory reporting practices, the composition of all positive cultures could have differed.
Accordingly, the higher Enterococcus spp. and lower Klebsiella spp. proportions demonstrate a difference in relative organism representation between the two analyzed laboratory datasets, but do not establish population-level epidemiological replacement or corresponding changes in infection incidence. K. pneumoniae nevertheless remains an important healthcare-associated pathogen because of its capacity to accumulate antimicrobial resistance and spread within hospital environments [6].
E. coli represented a similar share of the included isolate records in the two study years. Despite the major redistribution of other bacterial groups, E. coli accounted for 30.9% of isolates in 2013 and 31.0% in 2023. The absolute proportion was lower than in broader Romanian urine-culture cohorts, where E. coli represented approximately 40–56% of isolates [18,19], but was close to the 26% reported in a tertiary Urology Department in Prague [26]. This distinction is clinically relevant because department-specific cohorts contain a higher proportion of complicated infections, instrumentation-related samples, recurrent infections, and healthcare-associated organisms than community-dominated urine-culture datasets [3,10,11,12]. This similarity does not establish stable E. coli infection frequency, because the proportions depend on the distribution of all included organism groups and comparable denominators for submitted cultures or patients were unavailable. E. coli was selected for the primary AMR analysis on the basis of explicit species-level identification and sufficient agent-specific testing denominators in both years, rather than similarity in its relative share.
The E. coli findings demonstrate why changes in antimicrobial resistance should not be summarized using a single pooled measure. Resistance to cefepime, ceftazidime, and gentamicin was substantially lower in 2023, while cefuroxime and both examined fluoroquinolones showed no statistically significant difference. Similar non-uniform patterns have been reported in other longitudinal urological surveillance studies [26,27]. In Szeged, E. coli resistance decreased significantly over time for amoxicillin–clavulanate, cefuroxime, and gentamicin [27]. Conversely, the Prague cohort demonstrated both increasing and decreasing resistance patterns depending on the antimicrobial examined [26]. Such observations reinforce the concept that AMR evolution is drug-specific and locally contingent, and that an apparent improvement for one antimicrobial class cannot be extrapolated to the overall susceptibility profile of an organism [26,27].
The reduction in resistance to cefepime and ceftazidime in our cohort was particularly marked, whereas no statistically significant between-year difference was detected for cefuroxime. The confidence intervals for cefuroxime (−18.6 to 13.6 percentage points), ciprofloxacin (−15.5 to 20.0), and levofloxacin (−16.4 to 23.5) encompass potentially clinically meaningful differences in either direction. Non-significant results therefore do not establish equivalence or temporal stability. This divergence among β-lactams again argues against interpreting antimicrobial resistance as a unidirectional phenomenon. Importantly, the study did not include molecular characterization of β-lactamases or systematic ESBL phenotyping across both periods; therefore, the observed cephalosporin patterns cannot be used to infer changes in specific resistance mechanisms. Longitudinal studies from neighboring Central European settings have likewise documented reductions in resistance to selected cephalosporins without equivalent changes across all β-lactam agents [26,27]. The exploratory decrease observed for amoxicillin–clavulanate in our study is directionally consistent with some of these reports but should remain hypothesis-generating because only 23 E. coli isolates were tested against this agent in 2023. Multiple acquired mechanisms can contribute to β-lactam resistance in uropathogenic E. coli [7], further limiting mechanistic interpretation based exclusively on phenotypic susceptibility patterns.
The difference between the laboratory-reported R proportions for piperacillin–tazobactam requires particular caution. Historical CLSI criteria classified Enterobacterales as susceptible at MICs ≤ 16/4 mg/L, intermediate at 32/4–64/4 mg/L, and resistant at ≥128/4 mg/L, whereas EUCAST used a resistant threshold of >8/4 mg/L [21,22]. Thus, an MIC of 16/4 mg/L would be susceptible under CLSI criteria but resistant under EUCAST criteria [21,22]; MICs in the historical CLSI intermediate range would also be resistant under the EUCAST threshold. The dataset contained categorical S/I/R results but no isolate-level MIC values, so we could not determine whether any 2013 isolate had an MIC of 16/4 mg/L or how many intermediate results would have been classified as resistant under EUCAST. In an illustrative scenario counting the 11 intermediate 2013 results as resistant, the proportion would be 14/65 (21.5%), similar to 25/116 (21.6%) in 2023. This scenario is not a formal reclassification and does not establish that the original MIC distributions were comparable. Therefore, the difference in R-only proportions should not be interpreted as evidence of an increase in biological resistance.
The lower reported resistance proportions for cefepime, ceftazidime, and gentamicin require a different interpretation. Under the published breakpoint frameworks, the lower thresholds for classification as R in EUCAST would tend to increase, rather than decrease, resistance proportions for an unchanged MIC distribution [21,22]. The observed decreases therefore run counter to the direction expected from these threshold differences alone. This directional comparison does not establish the magnitude of a biological decline, however, because the breakpoints actually applied to individual results, testing methods, panel coverage, and characteristics of the tested isolates could not be fully reconstructed.
Laboratory-reported E. coli resistance proportions were approximately 57–59% for ciprofloxacin and 36–39% for levofloxacin, with no statistically significant between-year differences. These estimates were based on different tested subsets and should not be interpreted as evidence of greater activity of levofloxacin. Only four E. coli records in 2023 had results for both agents, making the analysis restricted to jointly tested isolates too imprecise to resolve the discrepancy. More generally, differences in testing coverage, panel selection, or selective reporting may affect the composition of agent-specific subsets. The available data therefore establish neither temporal stability nor comparative clinical effectiveness of the two fluoroquinolones. The present findings are not sufficient to guide empirical treatment. Trimethoprim–sulfamethoxazole and nitrofurantoin could not be compared between years because only five and one interpretable E. coli results, respectively, were available in 2013; their 2023 results are descriptive only. Fosfomycin was not evaluated in this dataset. Empirical treatment recommendations would require current, clinically contextualized susceptibility data. Selective testing may also have affected the between-year resistance comparisons. If testing in 2013 was triggered by resistance to other agents or by earlier screening results, the tested 2013 subset could have been enriched for resistant isolates, potentially inflating the 2013 proportions and exaggerating apparent reductions in 2023. The available data do not permit this possibility to be assessed because isolate-specific testing panels and cascade-reporting rules were not documented.
In contrast, no meropenem-resistant E. coli isolates were detected in either surveillance year. Preserved carbapenem activity against E. coli has also been observed in other Central European urological datasets: the Prague surveillance study identified virtually no carbapenem resistance among E. coli [26], while the recent Romanian cohort reported very low carbapenem resistance in E. coli despite a substantially greater burden among K. pneumoniae and P. aeruginosa isolates [19]. Our result should therefore be interpreted as evidence of preserved meropenem activity within the tested E. coli isolates rather than as evidence of an absence of carbapenem resistance within the wider hospital ecosystem [19,26].
The descriptive 2023 profiles included several findings requiring particular caution: Pseudomonas spp. showed resistance to multiple agents despite no reported piperacillin–tazobactam resistance, M. morganii showed universal ceftazidime resistance despite no reported ceftriaxone or cefepime resistance, and Enterococcus spp. had reported vancomycin and linezolid resistance proportions of 14.4% and 9.8%, respectively. The reported categories were confirmed in the hospital-derived dataset; however, no original instrument output, MIC values, or archived confirmatory-test records were available for retrospective re-evaluation. The biological basis of these profiles therefore cannot be established. They should not be used to infer specific resistance mechanisms or to select treatment. Without quantitative susceptibility measurements or documented confirmatory testing, their biological basis cannot be established. Moreover, most Enterococcus records lacked species-level identification, preventing reliable interpretation of the aggregate resistance estimates in terms of species composition. These findings warrant laboratory verification in future surveillance and should not be used to infer specific resistance mechanisms or select treatment.
These non-E. coli estimates require restraint because they were based on only 12–14 isolates for several organisms. Percentages such as 8/12 or 14/14 can appear epidemiologically dramatic but have substantial sampling uncertainty and should not be interpreted as stable institutional resistance rates. For this reason, these data are best viewed as a contemporary descriptive snapshot identifying potentially important organism–drug combinations for continued surveillance rather than as a formal cumulative antibiogram. Their main contribution to the present study is to reinforce the broader observation that the local AMR landscape is highly heterogeneous across bacterial taxa.
An important methodological consideration is that the two surveillance years were separated not only by time but also by changes in antimicrobial susceptibility standards. The 2013 data were interpreted using the CLSI framework implemented by the laboratory at that time, whereas the 2023 data reflected contemporary EUCAST interpretation. Clinical breakpoints evolve as pharmacokinetic/pharmacodynamic evidence, dosing strategies, microbiological distributions, and clinical outcome data are updated; consequently, categorical susceptibility results generated under different standards cannot be assumed to be fully interchangeable [21,22,24,25]. EUCAST also redefined the I category in 2019 as “Susceptible, increased exposure,” rather than the traditional intermediate category, with important implications for surveillance and clinical interpretation [23]. The hospital-wide 2021 study by Olariu et al. reported AST interpretation according to CLSI [28]. This provides relevant local context but does not establish when EUCAST was introduced or which criteria were applied to individual records in our 2023 extract. The transition date and record-specific implementation therefore remain unverified.
The primary analysis compared laboratory-reported R categories, with S and I included in the non-R denominator. The sensitivity analysis excluding I preserved the direction and statistical significance of the four principal E. coli comparisons. However, this analysis only assessed sensitivity to removing I results from the denominator; it did not address differences in the thresholds defining R. The findings therefore represent differences in reported categorical resistance under period-specific laboratory practices, rather than estimates standardized to a common breakpoint framework. Neither the magnitude of breakpoint-related reclassification nor its contribution to the observed differences could be quantified without the original MIC or inhibition-zone measurements.
Several features strengthen the interpretability of the present study. The analysis was restricted to urinary bacterial isolates originating from a single tertiary Urology Department, thereby maintaining a consistent clinical setting and specimen type across the two surveillance years. Organism classifications and antimicrobial names were harmonized before analysis, and bacterial distribution was evaluated using taxonomic groupings that could be compared reliably across both periods. The primary between-year antimicrobial resistance analysis was restricted to E. coli and to antimicrobial agents with adequate testing denominators in both years, reducing the instability associated with sparse or highly unbalanced susceptibility data. In addition to odds ratios and hypothesis tests, absolute differences in resistance proportions with confidence intervals were reported, and multiple comparisons were addressed using false discovery rate correction. Finally, two sensitivity analyses were performed to assess the influence of exact duplicate records and alternative handling of intermediate susceptibility results; neither materially altered the principal findings.
Several limitations should nevertheless be considered. First, only two calendar years were available for comparison. The study therefore identifies differences between two surveillance points separated by a decade but cannot determine whether these changes occurred progressively, abruptly, or non-linearly during the intervening period. The findings should consequently not be interpreted as evidence of a continuous temporal trend.
Second, patient identifiers and specimen collection dates were unavailable, preventing a first-isolate-per-patient analysis, time-window deduplication, or adjustment for within-patient clustering. Repeated sampling may therefore have overrepresented some patients or resistance phenotypes and may have produced confidence intervals that are too narrow and p-values that are too small [31]. Excluding 18 additional records from exact matching groups in 2023 preserved the principal comparisons, but this only assessed the influence of exact record matches and did not resolve possible biological repetition. Likewise, identical susceptibility profiles among some less frequent organisms could reflect repeated sampling, common phenotypes in different patients, or clonal relatedness; the available data cannot distinguish these explanations. The findings should therefore be interpreted as comparisons of laboratory isolate records, with uncertainty regarding patient-level independence.
Third, the database did not contain sufficiently detailed clinical information on age, comorbidities, inpatient versus outpatient status, urinary catheterization, nephrostomy or urinary diversion, recent urological interventions, recurrent infection, prior antimicrobial exposure, or antimicrobial consumption. Similarly, laboratory data alone did not allow reliable differentiation between symptomatic urinary tract infection, asymptomatic bacteriuria, and colonization. The mechanisms underlying the observed microbiological differences therefore cannot be determined from the present study.
Fourth, denominators describing the overall clinical and microbiological activity of the Urology Department were unavailable. The total number of urine specimens submitted, the number of patients treated, admission volume, procedural activity, and culture positivity rates could not be established. Complete year-specific counts of negative cultures, contaminated or mixed cultures, and rejected specimens were also unavailable. Whether specimen acceptance criteria, mixed-culture handling, or positive-culture reporting practices changed between the two periods could not be established. The source records also differed in structure: the 2013 data included urine entries without interpretable AST results, whereas the 2023 data predominantly contained urine-culture antibiogram entries. Consequently, equivalent capture of all eligible bacterial isolates across years could not be confirmed. Differences in sampling or record capture may therefore have contributed to the observed organism distribution. The findings describe relative organism representation within the included laboratory records and should not be interpreted as changes in infection incidence. Unrecorded differences in significant-growth thresholds, handling of mixed cultures, urine-collection methods, or inpatient/outpatient composition could also have influenced the observed organism shares, particularly that of Enterococcus spp. The sex-stratified analysis showed higher Enterococcus and lower Klebsiella shares in 2023 in both sexes, but could not account for these other potential differences in case mix and laboratory reporting. Finally, the decade separating the two surveillance periods encompassed changes in bacterial identification methods, antimicrobial susceptibility testing platforms, antimicrobial panels, taxonomic reporting, and susceptibility interpretation standards. In particular, the 2013 and 2023 results were generated under different breakpoint frameworks, limiting perfect categorical comparability across years [21,22,24,25]. Although the sensitivity analysis excluding intermediate results reduced the potential influence of changes in the interpretation of category I, retrospective harmonization cannot fully account for breakpoint revisions or other laboratory-method changes [23,24,25].
These limitations are especially relevant to the large differences in the recorded shares of Enterococcus spp. and Klebsiella spp., for which differences in the sampled population, laboratory reporting, and data capture cannot be separated from possible ecological differences. The relative E. coli frequency was similar in the primary datasets, but this remained a comparison of isolate-record proportions. Under the conservative profile-collapse bound, the overall organism-distribution difference persisted, whereas none of the E. coli AMR comparisons remained statistically significant after FDR correction. The reduction from 377 records to 48 profiles in 2023 also shows that identical organism–sex–antibiogram patterns were common in the extract. This bound cannot establish the number of unique patients because identical profiles may belong to different patients, and a patient may contribute records with different profiles.
5. Conclusions
This decade-apart comparison identified a marked change in the distribution of urinary bacterial isolates within the same tertiary Urology Department between 2013 and 2023. The shift was characterized predominantly by a substantial increase in Enterococcus spp. and a pronounced decrease in Klebsiella spp., while the relative contribution of E. coli was similar at approximately one-third of isolates in both surveillance years.
Despite the similar relative contribution of E. coli, the proportions of isolates reported as resistant differed between the two study years for selected antimicrobial agents. The proportions reported as resistant to cefepime, ceftazidime, and gentamicin were lower in 2023. For piperacillin–tazobactam, the R-only proportion reported by the laboratory was higher in 2023; however, counting the 2013 intermediate results as resistant yielded similar proportions in the two years. Because isolate-level MIC data were unavailable and breakpoint criteria differed, the observed R-only difference cannot be interpreted as evidence of an increase in biological resistance. No statistically significant differences were detected for cefuroxime, ciprofloxacin, levofloxacin, or meropenem. The principal organism-distribution contrast persisted under a conservative profile-collapse bound, but none of the E. coli AMR comparisons remained statistically significant after FDR correction in that analysis; this bound does not identify unique patients. However, these sensitivity analyses did not harmonize resistance breakpoints across years. The observed differences therefore reflect laboratory-reported categories under different susceptibility standards and cannot be attributed solely to biological changes in resistance, particularly for piperacillin–tazobactam.
The 2023 data further demonstrated substantial heterogeneity in resistance patterns among non-E. coli urinary bacterial isolates, although estimates for less frequent organisms should be interpreted cautiously because of limited isolate numbers. The differences observed between these two study years were organism- and drug-specific and should be interpreted in the context of changes in laboratory methods, susceptibility standards, and potentially the sampled patient population. Continued local, organism-specific surveillance using consistent susceptibility criteria and patient-linked data is needed to clarify these differences and support antimicrobial stewardship.
Supplementary Materials
The following supporting information can be downloaded at: https://www.mdpi.com/article/10.3390/medicina62112087/s1, Supplementary Table S1. Complete antimicrobial resistance profiles of major urinary bacterial isolates in the Urology Department in 2023. Supplementary Table S2. Sensitivity analyses of urinary bacterial isolate distribution and Escherichia coli antimicrobial resistance findings. Supplementary Table S3. Taxonomic resolution of urinary bacterial records by harmonized organism group and surveillance year. Supplementary Table S4. Mapping of original organism labels to standardized labels and harmonized analytical groups. Supplementary Table S5. Sex-stratified comparisons of urinary bacterial record distributions between 2013 and 2023. Supplementary Table S6. Comparison of published resistance MIC breakpoints applicable to Escherichia coli for the eight antimicrobial agents included in the primary between-year analysis. Supplementary Table S7. Between-year comparisons of laboratory-reported Escherichia coli resistance restricted to isolate records with interpretable results for both ciprofloxacin and levofloxacin. Supplementary Table S8. STROBE reporting checklist for the retrospective comparison of urinary bacterial isolate records from 2013 and 2023. Supplementary Table S9. Organism information recorded for 2013 entries excluded because no interpretable AST result was available (n = 308). Supplementary Table S10. Sensitivity analysis based on collapsing identical organism–sex–antibiogram profiles. Supplementary Figure S1. Selection of urinary bacterial records from the Urology Department in 2013 and 2023. Counts refer to records available in the source data, rather than verified totals of all urine specimens processed in each year. Exclusion reasons were assigned sequentially and are mutually exclusive. Included records required bacterial identification, at least one interpretable antimicrobial susceptibility testing (AST) result, and recorded sex. Exact duplicate records were retained in the primary analysis and assessed separately in a sensitivity analysis.
Author Contributions
Conceptualization, R.-L.E., D.C.V., I.M.C. and P.S.; methodology, R.-L.E., D.C.V., A.E.C., I.-A.E., I.M.C. and P.S.; software, R.-L.E., A.E.C., D.P., I.-A.E., D.C.V., I.M.C. and P.S.; validation, R.-L.E., R.P., A.E.C., D.P., I.-A.E., D.C.V., I.M.C. and P.S.; formal analysis, R.-L.E., R.P., A.E.C., I.-A.E., D.C.V., I.M.C. and P.S.; investigation, R.-L.E. and I.-A.E.; resources, R.-L.E., R.P. and I.-A.E.; data curation, R.P., D.C.V.; writing—original draft, R.-L.E., R.P., A.E.C., D.P., I.-A.E., D.C.V., I.M.C. and P.S.; writing—review & editing, R.-L.E., R.P., A.E.C., I.M.C. and P.S.; visualization, R.-L.E., R.P., A.E.C., D.P., I.-A.E., D.C.V., I.M.C. and P.S.; supervision, D.C.V.; project administration, R.-L.E., D.C.V. and R.P. All authors have read and agreed to the published version of the manuscript.
Funding
This research received no external funding. We would like to acknowledge Victor Babes University of Medicine and Pharmacy Timisoara for their support in covering the costs of publication for this research paper.
Institutional Review Board Statement
This study was approved by the Ethics Committee of the “Pius Brînzeu” County Clinical Emergency Hospital, Timișoara, Romania, approval number: 519/30.12.2024.
Informed Consent Statement
Not applicable. This study involved retrospective analysis of laboratory records without direct patient identifiers in the analytical dataset and without patient contact.
Data Availability Statement
The original contributions presented in this study are included in the article/Supplementary Materials. Further inquiries can be directed to the corresponding authors. The anonymized analysis dataset and R analysis script are provided confidentially to the editor and reviewers for verification during peer review. These files are not deposited in a public repository.
Acknowledgments
The authors used ChatGPT (OpenAI, GPT-5.2 version) as an artificial intelligence–based language model to support the writing process. The tool was employed for linguistic assistance, including improving clarity, grammar, and academic style, as well as for refining phrasing in English. AI-assisted tools were also used to support the visual refinement and adjustment of selected figures. The underlying data, numerical values, statistical analyses, and initial data visualizations were generated and verified by the authors using R in the RStudio (2025.05.0+496) environment. The AI-assisted modifications were reviewed and adjusted by the authors and did not independently determine or alter the study data, statistical results, scientific interpretation, or conclusions. The authors take full responsibility for the accuracy, integrity, and content of the manuscript and all associated figures.
Conflicts of Interest
The authors declare no conflicts of interest.
Abbreviations
The following abbreviations are used in this manuscript:
| AMC | amoxicillin–clavulanate |
| AMR | antimicrobial resistance |
| AST | antimicrobial susceptibility testing |
| CI | confidence interval |
| CLSI | Clinical and Laboratory Standards Institute |
| df | degrees of freedom |
| E. coli | Escherichia coli |
| E. faecalis | Enterococcus faecalis |
| ESBL | extended-spectrum β-lactamase |
| EUCAST | European Committee on Antimicrobial Susceptibility Testing |
| FDR | false discovery rate |
| GPIU | Global Prevalence Study on Infections in Urology |
| HL | high-level |
| I | intermediate or susceptible at increased exposure |
| K. pneumoniae | Klebsiella pneumoniae |
| MALDI | matrix-assisted laser desorption/ionization |
| M. morganii | Morganella morganii |
| MIC | minimum inhibitory concentration |
| OR | odds ratio |
| P. aeruginosa | Pseudomonas aeruginosa |
| P. mirabilis | Proteus mirabilis |
| Pip-tazo | piperacillin–tazobactam |
| pp | percentage points |
| R | resistant |
| S | susceptible |
| spp. | multiple species within a genus |
| TMP-SMX | trimethoprim–sulfamethoxazole |
| UK | United Kingdom |
| UTIs | urinary tract infections |
| WHO | World Health Organization |
References
- Murray, C.J.; Ikuta, K.S.; Sharara, F.; Swetschinski, L.; Robles Aguilar, G.; Gray, A.; Han, C.; Bisignano, C.; Rao, P.; Wool, E.; et al. Global burden of bacterial antimicrobial resistance in 2019: A systematic analysis. Lancet 2022, 399, 629–655. [Google Scholar] [CrossRef] [Scilit]
- Mestrovic, T.; Robles Aguilar, G.; Swetschinski, L.R.; Ikuta, K.S.; Gray, A.P.; Davis Weaver, N.; Han, C.; Wool, E.E.; Hayoon, A.G.; Hay, S.I.; et al. The burden of bacterial antimicrobial resistance in the WHO European region in 2019: A cross-country systematic analysis. Lancet Public Health 2022, 7, e897–e913. [Google Scholar] [CrossRef] [Scilit]
- Flores-Mireles, A.L.; Walker, J.N.; Caparon, M.; Hultgren, S.J. Urinary tract infections: Epidemiology, mechanisms of infection and treatment options. Nat. Rev. Microbiol. 2015, 13, 269–284. [Google Scholar] [CrossRef] [Scilit]
- Medina, M.; Castillo-Pino, E. An introduction to the epidemiology and burden of urinary tract infections. Ther. Adv. Urol. 2019, 11, 3–7. [Google Scholar] [CrossRef] [Scilit]
- Mancuso, G.; Midiri, A.; Gerace, E.; Marra, M.; Zummo, S.; Biondo, C. Urinary Tract Infections: The Current Scenario and Future Prospects. Pathogens 2023, 12, 623. [Google Scholar] [CrossRef] [Scilit]
- Effah, C.Y.; Sun, T.; Liu, S.; Wu, Y. Klebsiella pneumoniae: An increasing threat to public health. Ann. Clin. Microbiol. Antimicrob. 2020, 19, 1. [Google Scholar] [CrossRef] [Scilit]
- Kot, B. Antibiotic Resistance among Uropathogenic Escherichia coli. Pol. J. Microbiol. 2019, 68, 403–415. [Google Scholar] [CrossRef] [Scilit]
- García-Solache, M.; Rice, L.B. The Enterococcus: A model of adaptability to its environment. Clin. Microbiol. Rev. 2019, 32, e00058-18. [Google Scholar] [CrossRef] [Scilit]
- Kline, K.A.; Lewis, A.L. Gram-Positive Uropathogens, Polymicrobial Urinary Tract Infection, and the Emerging Microbiota of the Urinary Tract. Microbiol. Spectr. 2016, 4, 459–502. [Google Scholar] [CrossRef] [Scilit]
- Werneburg, G.T. Catheter-Associated Urinary Tract Infections: Current Challenges and Future Prospects. Res. Rep. Urol. 2022, 14, 109–133. [Google Scholar] [CrossRef] [Scilit]
- Wagenlehner, F.; Tandogdu, Z.; Bartoletti, R.; Cai, T.; Cek, M.; Kulchavenya, E.; Köves, B.; Naber, K.; Perepanova, T.; Tenke, P.; et al. The global prevalence of infections in urology study: A long-term, worldwide surveillance study on urological infections. Pathogens 2016, 5, 10. [Google Scholar] [CrossRef] [Scilit]
- Tandoğdu, Z.; Bartoletti, R.; Cai, T.; Çek, M.; Grabe, M.; Kulchavenya, E.; Köves, B.; Menon, V.; Naber, K.; Perepanova, T.; et al. Antimicrobial resistance in urosepsis: Outcomes from the multinational, multicenter global prevalence of infections in urology (GPIU) study 2003–2013. World J. Urol. 2016, 34, 1193–1200. [Google Scholar] [CrossRef] [Scilit]
- Linhares, I.; Raposo, T.; Rodrigues, A.; Almeida, A. Frequency and antimicrobial resistance patterns of bacteria implicated in community urinary tract infections: A ten-year surveillance study (2000–2009). BMC Infect. Dis. 2013, 13, 19. [Google Scholar] [CrossRef] [Scilit]
- Fasugba, O.; Mitchell, B.G.; Mnatzaganian, G.; Das, A.; Collignon, P.; Gardner, A. Five-year antimicrobial resistance patterns of urinary Escherichia coli at an Australian tertiary hospital: Time series analyses of prevalence data. PLoS ONE 2016, 11, e0164306. [Google Scholar] [CrossRef] [Scilit]
- Kaye, K.S.; Gupta, V.; Mulgirigama, A.; Joshi, A.V.; Scangarella-Oman, N.E.; Yu, K.; Ye, G.; Mitrani-Gold, F.S. Antimicrobial Resistance Trends in Urine Escherichia coli Isolates From Adult and Adolescent Females in the United States From 2011 to 2019: Rising ESBL Strains and Impact on Patient Management. Clin. Infect. Dis. 2021, 73, 1992–1999. [Google Scholar] [CrossRef] [Scilit]
- Smit, C.C.H.; Keighley, C.; Rogers, K.; Miyakis, S.; Taxis, K.; Robertson, H.; Pont, L.G. Temporal Trends of Escherichia coli Antimicrobial Resistance and Antibiotic Utilization in Australian Long-Term Care Facilities. Antibiotics 2025, 14, 208. [Google Scholar] [CrossRef] [Scilit]
- Manolitsis, I.; Feretzakis, G.; Katsimperis, S.; Angelopoulos, P.; Loupelis, E.; Skarmoutsou, N.; Tzelves, L.; Skolarikos, A. A 2-Year Audit on Antibiotic Resistance Patterns from a Urology Department in Greece. J. Clin. Med. 2023, 12, 3180. [Google Scholar] [CrossRef] [Scilit]
- Borcan, A.M.; Radu, G.; Simoiu, M.; Costea, E.L.; Rafila, A. A Five-Year Analysis of Antibiotic Resistance Trends among Bacteria Identified in Positive Urine Samples in a Tertiary Care Hospital from Bucharest, Romania. Antibiotics 2024, 13, 160. [Google Scholar] [CrossRef] [Scilit]
- Nicu-Canareica, O.; Manolescu, L.S.C.; Băean, M.L.; Medar, C.; Nicu, C.; Ivan, G.-C.; Tanasă, Ș.-G.; Badea, T.-G.; Nedelea, G.-F.; Berza, A.G.; et al. The Resistance Landscape of Uropathogens in a Romanian Tertiary Center: A 13-Month Single-Center Study with Focus on Klebsiella and Urease-Positive Organisms. Microorganisms 2026, 14, 1491. [Google Scholar] [CrossRef] [Scilit]
- von Elm, E.; Altman, D.G.; Egger, M.; Pocock, S.J.; Gøtzsche, P.C.; Vandenbroucke, J.P.; STROBE Initiative. The Strengthening the Reporting of Observational Studies in Epidemiology (STROBE) statement: Guidelines for reporting observational studies. PLoS Med. 2007, 4, e296. [Google Scholar] [CrossRef] [Scilit]
- CLSI document M100-S22; Performance Standards for Antimicrobial Susceptibility Testing; Twenty-Second Informational Supplement. Clinical and Laboratory Standards Institute: Wayne, PA, USA, 2012.
- European Committee on Antimicrobial Susceptibility Testing. Breakpoint Tables for Interpretation of MICs and Zone Diameters; Version 13.1; EUCAST: Växjö, Sweden, 2023. [Google Scholar] [CrossRef] [Scilit]
- Nabal Díaz, S.G.; Robles, O.A.; García-Lechuz Moya, J.M. New definitions of susceptibility categories EUCAST 2019: Clinic application. Rev. Española De Quimioter. 2022, 35, 84–88. [Google Scholar] [CrossRef] [Scilit]
- Kassim, A.; Omuse, G.; Premji, Z.; Revathi, G. Comparison of Clinical Laboratory Standards Institute and European Committee on Antimicrobial Susceptibility Testing guidelines for the interpretation of antibiotic susceptibility at a University teaching hospital in Nairobi, Kenya: A cross-sectional study. Ann. Clin. Microbiol. Antimicrob. 2016, 15, 21. [Google Scholar] [CrossRef] [Scilit]
- Gaur, P.; Hada, V.; Rath, R.S.; Mohanty, A.; Singh, P.; Rukadikar, A. Interpretation of Antimicrobial Susceptibility Testing Using European Committee on Antimicrobial Susceptibility Testing (EUCAST) and Clinical and Laboratory Standards Institute (CLSI) Breakpoints: Analysis of Agreement. Cureus 2023, 15, e36977. [Google Scholar] [CrossRef] [Scilit]
- Hrbacek, J.; Cermak, P.; Zachoval, R. Current antibiotic resistance trends of uropathogens in central Europe: Survey from a tertiary hospital urology department 2011–2019. Antibiotics 2020, 9, 630. [Google Scholar] [CrossRef] [Scilit]
- Fehér, Á.M.; Safikhani, M.; Bajory, Z.; Lázár, A.; Burián, K.; Rárosi, F.; Köves, B. Urinary bacterial spectrum and antibiotic resistance trends at a Urology Clinic in Hungary between 2012 and 2023. Int. Urol. Nephrol. 2026, 58, 517–525. [Google Scholar] [CrossRef] [Scilit]
- Olariu, N.; Licker, M.; Chisavu, L.; Chisavu, F.; Schiller, A.; Marc, L.; Albai, O.; Paunescu, A.; Tucicovschi, V.; Mihaescu, A.; et al. In and Outpatients Bacteria Antibiotic Resistances in Positive Urine Cultures from a Tertiary Care Hospital in the Western Part of Romania—A Cross-Sectional Study. Diseases 2025, 13, 74. [Google Scholar] [CrossRef] [Scilit]
- Gajdács, M.; Ábrók, M.; Lázár, A.; Burián, K. Increasing relevance of Gram-positive cocci in urinary tract infections: A 10-year analysis of their prevalence and resistance trends. Sci. Rep. 2020, 10, 17658. [Google Scholar] [CrossRef] [Scilit]
- Codelia-Anjum, A.; Lerner, L.B.; Elterman, D.; Zorn, K.C.; Bhojani, N.; Chughtai, B. Enterococcal Urinary Tract Infections: A Review of the Pathogenicity, Epidemiology, and Treatment. Antibiotics 2023, 12, 778. [Google Scholar] [CrossRef] [Scilit]
- Rempel, O.; Pitout, J.D.D.; Laupland, K.B. Antimicrobial resistance surveillance systems: Are potential biases taken into account? Can. J. Infect. Dis. Med. Microbiol. 2011, 22, e24–e28. [Google Scholar] [CrossRef] [Scilit]
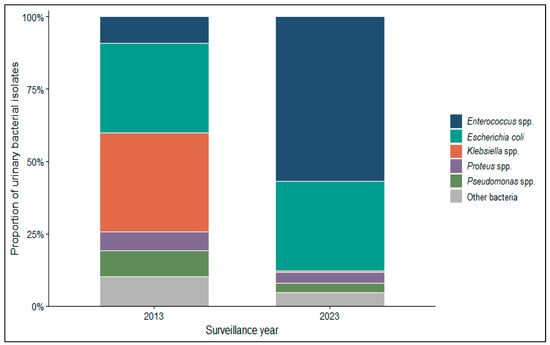
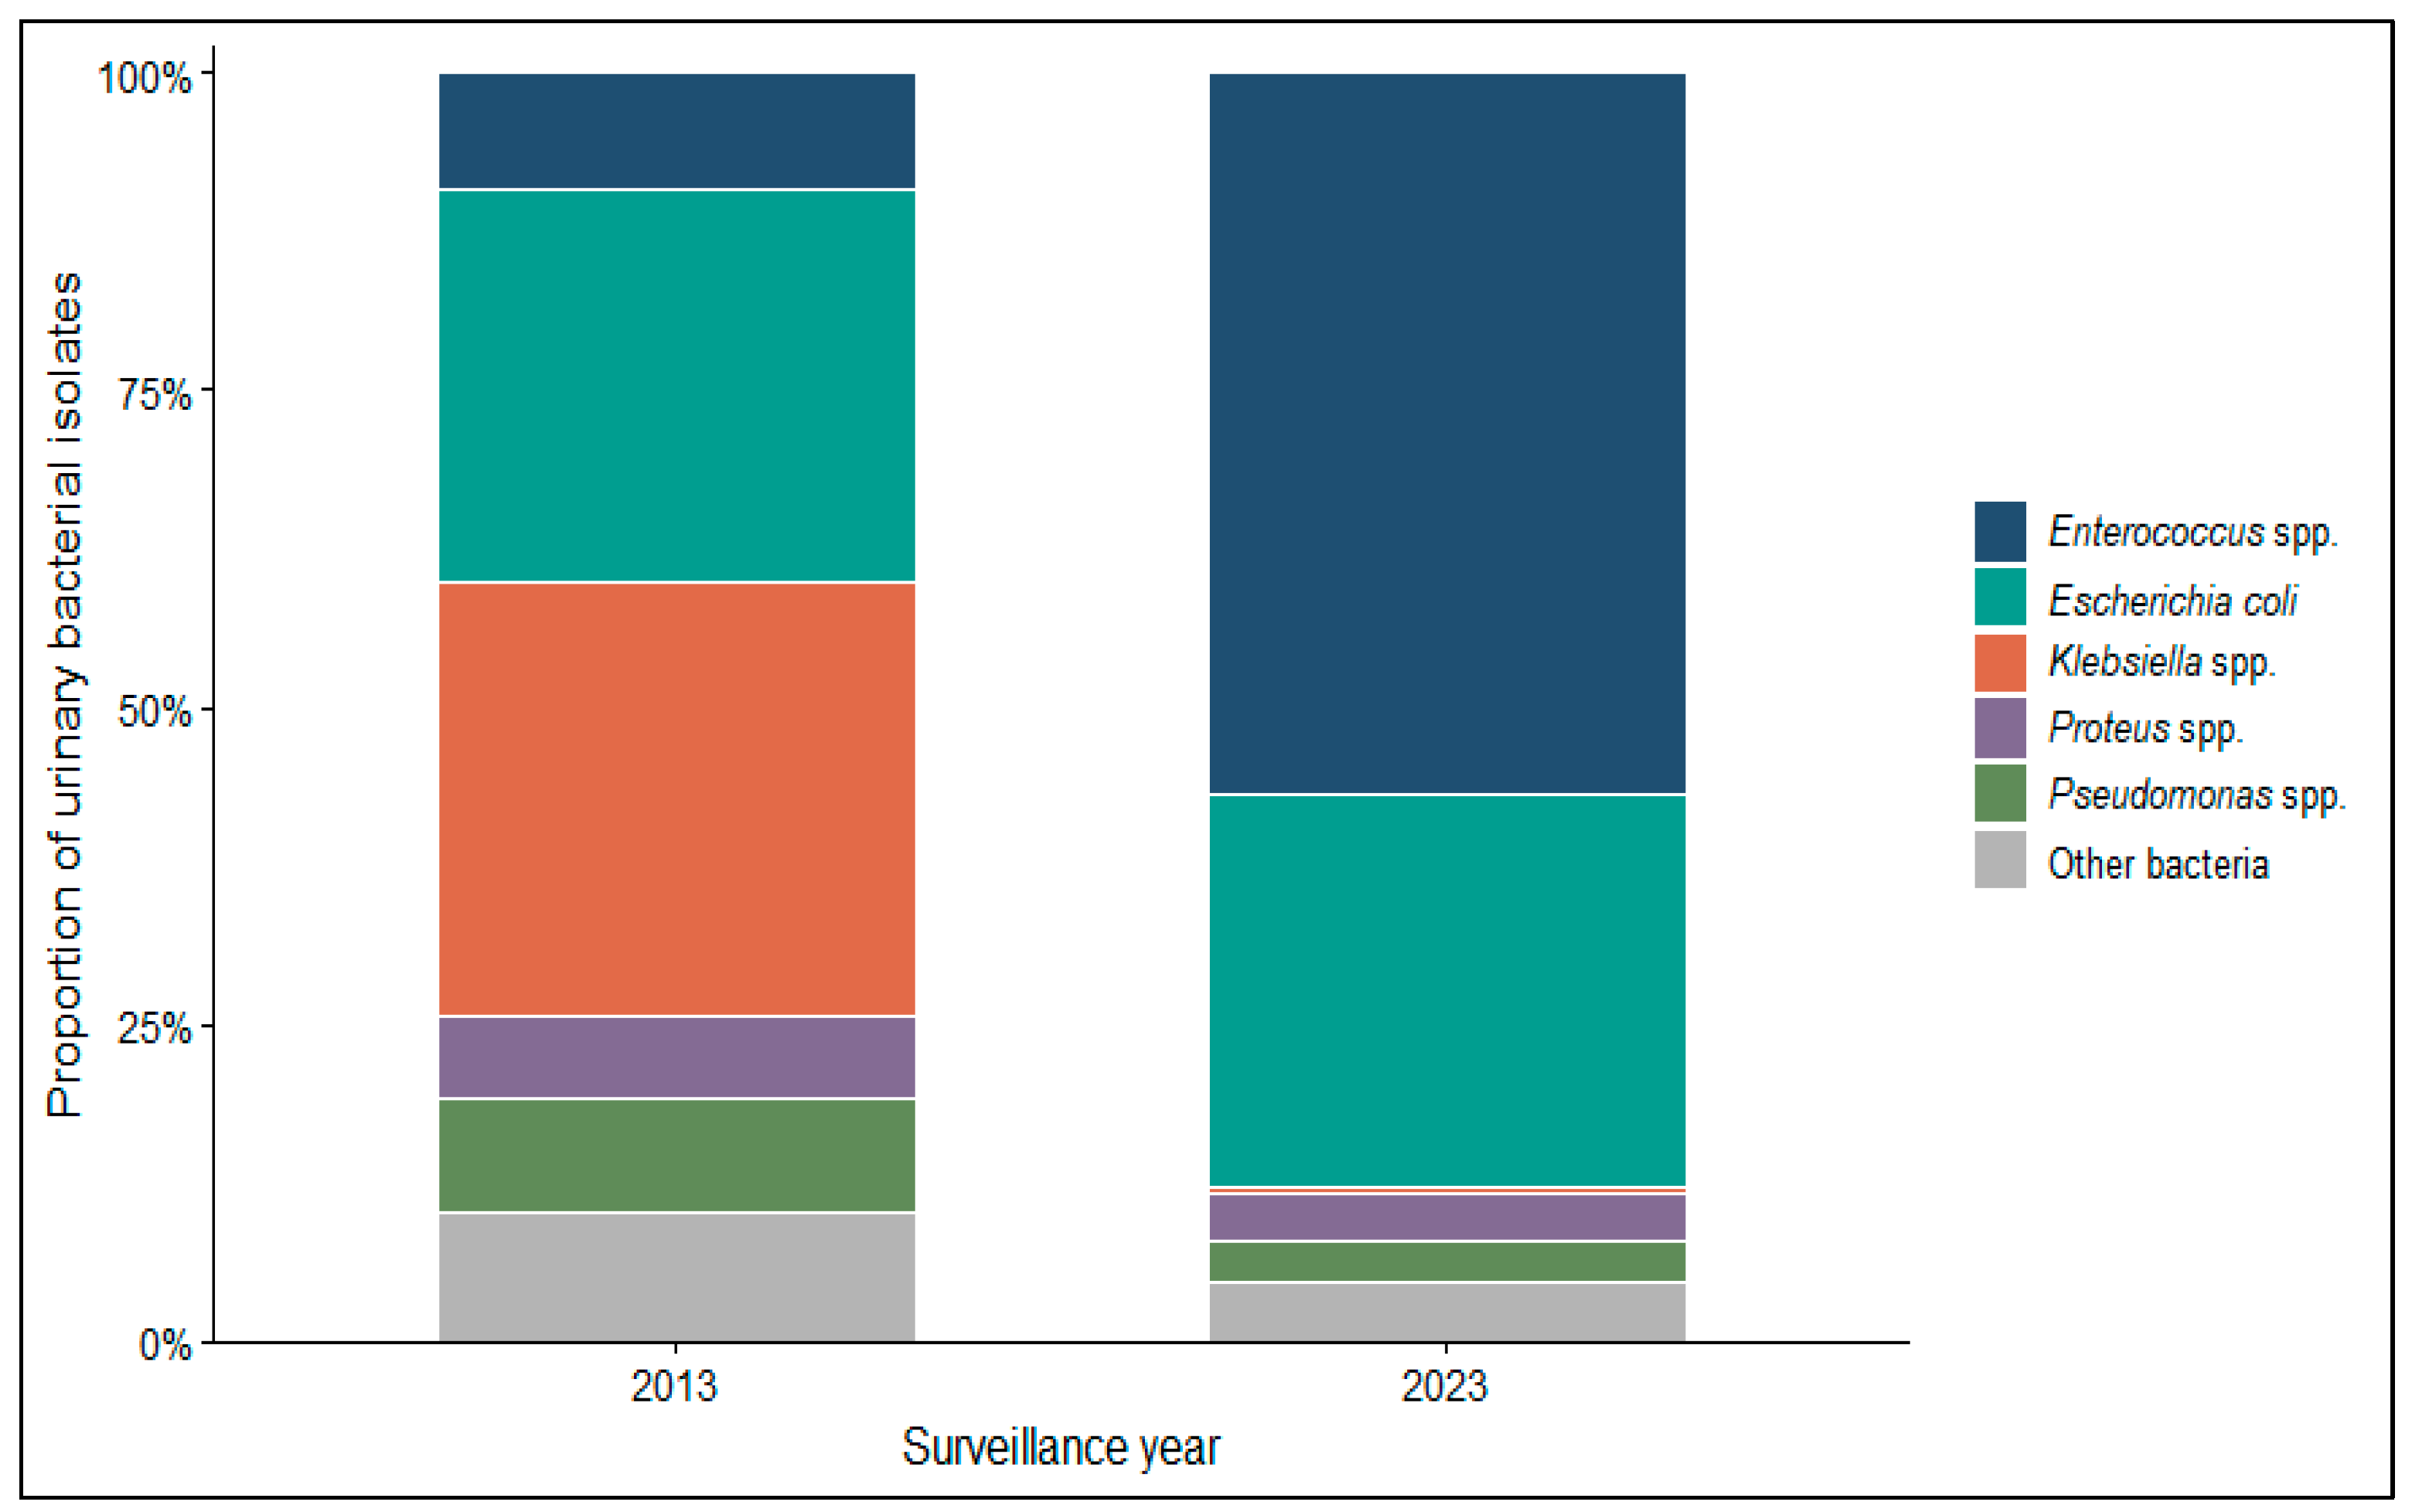
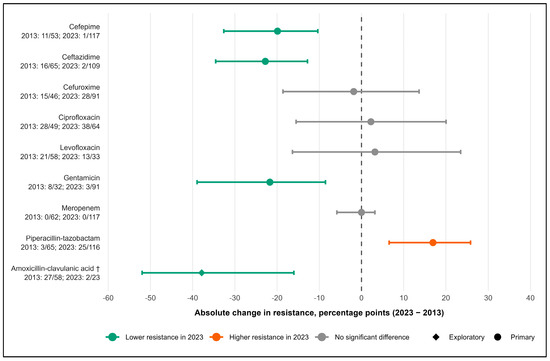
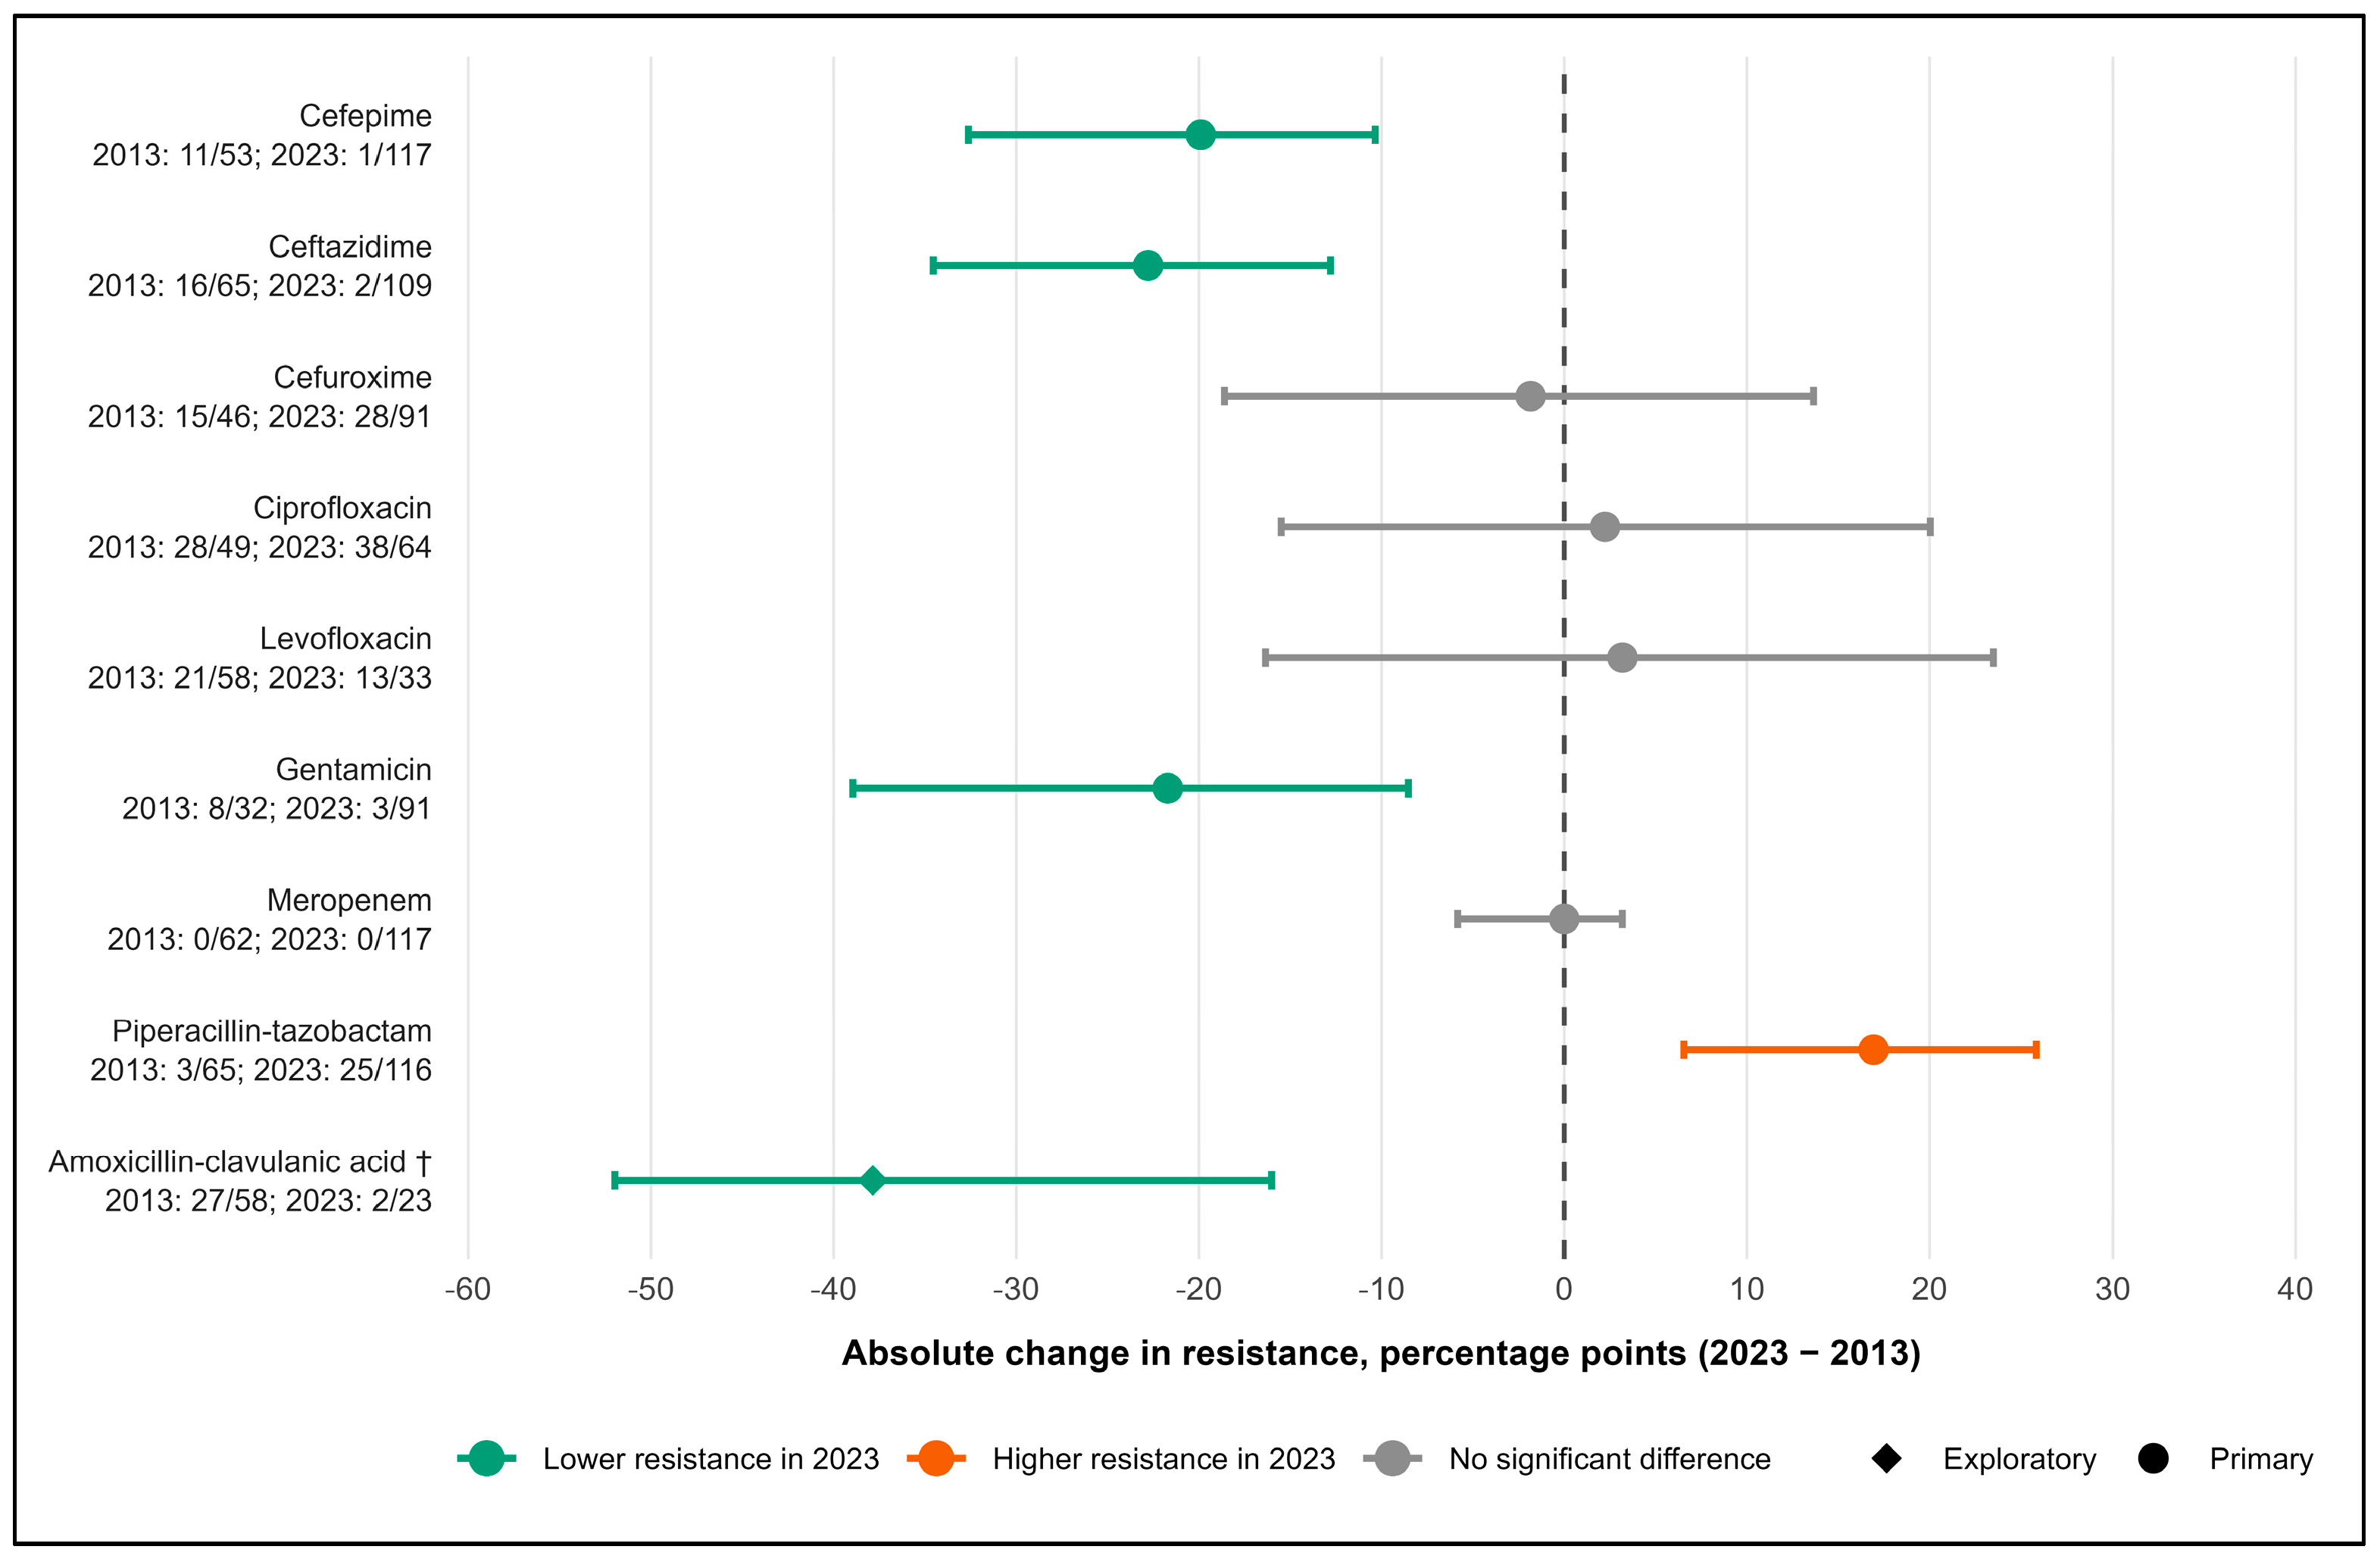
Disclaimer/Publisher’s Note: The statements, opinions and data contained in all publications are solely those of the individual author(s) and contributor(s) and not of MDPI and/or the editor(s). MDPI and/or the editor(s) disclaim responsibility for any injury to people or property resulting from any ideas, methods, instructions or products referred to in the content. |
© 2026 by the authors. Published by MDPI on behalf of the Lithuanian University of Health Sciences. Licensee MDPI, Basel, Switzerland. This article is an open access article distributed under the terms and conditions of the Creative Commons Attribution (CC BY) license.