


Abstract
Background and Objectives: Postoperative alignment after medial open-wedge high tibial osteotomy (MOWHTO) reflects both osseous correction and load-dependent joint response. We evaluated the internal radiographic performance of a prespecified threshold-based latent medial laxity (LML) adjustment and explored alternative deduction models. Materials and Methods: Seventy-two consecutive eligible knees were retrospectively analyzed. LML, defined operationally as the difference between joint-line convergence angles on supine valgus-stress and standing radiographs, was treated as a composite load-and-stress response. One-third of LML was deducted from the target correction angle when LML was ≤5°, and one-half when LML was >5°. The primary outcome was 1-year hip–knee–ankle (HKA) error within ±1.0°. Change in mechanical medial proximal tibial angle (ΔmMPTA) served as a radiographic proxy for executed osseous correction. Alternative deduction rules were compared by internal counterfactual analysis with leave-one-out cross-validation for fitted models. Results: Fifty-two knees (72.2%; 95% CI, 60.4–82.1%) were within ±1.0° of target. Mean signed error was −0.38 ± 0.95° (p = 0.001), with Bland–Altman limits of agreement from −2.25° to 1.49°. Mean ΔmMPTA was 6.03 ± 2.59°, versus a planned osseous correction of 6.81 ± 1.41°; the execution proxy averaged −0.78 ± 2.13° (p = 0.003). The residual planning component averaged +0.40 ± 2.04° (p = 0.098). In the internal comparison, the threshold rule yielded an MAE of 0.76° and 72.2% within ±1.0°, versus 1.79° and 41.7% with no adjustment. An exploratory continuous model (deduction = −1.77 + 0.736 × LML) yielded an MAE of 0.66° and 79.2% within ±1.0° (leave-one-out MAE, 0.68°). Conclusions: Threshold-based LML adjustment reproduced the individualized 1-year HKA target within ±1.0° in 72.2% of knees. This simple method appears feasible for preoperative planning; however, the small target-relative undercorrection bias warrants further refinement and prospective comparative validation.
1. Introduction
Medial open-wedge high tibial osteotomy (MOWHTO) is an established joint-preserving procedure for active patients with symptomatic medial compartment knee osteoarthritis and varus malalignment [1,2,3,4]. By shifting the mechanical axis laterally, the procedure aims to unload the diseased medial compartment, improve symptoms, and it has become widely preferred over the lateral closing-wedge technique for single-compartment varus arthrosis [5]. These benefits, however, depend strongly on the postoperative lower-limb alignment. Residual varus may result in insufficient medial unloading, whereas excessive valgus overcorrection may overload the lateral compartment, increase joint-line obliquity (JLO), alter gait, and compromise patient-reported outcomes [6,7,8,9]. Achieving the intended correction without clinically important under- or overcorrection therefore remains a central objective of MOWHTO [10].
Considerable effort has been devoted to improving correction accuracy. During surgery, fluoroscopic cable or alignment-rod methods, computer navigation, and patient-specific instrumentation can improve reproduction of the correction plan and reduce technical outliers [11,12,13,14]. Nevertheless, discrepancies between planned and achieved weight-bearing alignment continue to occur even when the osteotomy is performed as intended. This suggests that the final standing alignment cannot be explained by bony correction and technical execution alone.
One contributor is the load-dependent soft-tissue and intra-articular component of coronal alignment [15]. In this study, latent medial laxity (LML) is an operational radiographic construct calculated as the difference between the JLCA on a supine valgus-stress image and that on a standing image [16,17]. Because these images differ in both external load and applied valgus stress, LML should be interpreted as a composite load-and-stress response rather than a pure material measure of ligament laxity. When the proximal tibia is valgized, redistribution of loading and re-tensioning of periarticular structures can reduce the JLCA, adding a non-osseous component to the achieved correction [15,17,18]. Greater preoperative laxity and larger postoperative JLCA changes have been associated with unexpected overcorrection [19,20,21].
Correction accuracy should not be equated with bringing every patient to the same postoperative valgus value. Patients differ in constitutional alignment, cartilage loss, meniscal status, and femoral and tibial morphology [22]. In particular, a large increase in the mechanical medial proximal tibial angle (mMPTA) may create excessive tibial-plateau inclination and nonphysiologic joint-line obliquity angle (JLOA) despite an acceptable global HKA [2,6,8]. We therefore assessed agreement with each prespecified individualized target and separately reported postoperative mMPTA, JLOA, and weight-bearing-line (WBL) ratio.
Our previous study quantified LML as the difference between the JLCA on valgus-stress and standing radiographs and proposed subtracting a proportion of this value from the target correction angle [16]. In our current practice, one-third of LML is subtracted when the measured laxity is ≤5°, whereas one-half is subtracted when it exceeds 5°, based on the premise that knees with greater medial laxity undergo a larger soft-tissue contribution to total correction. The primary aim of this study was to evaluate the internal radiographic performance of that rule. Secondary aims were to separate radiographic execution and planning components using ΔmMPTA and to compare the rule with no adjustment, fixed-coefficient, and continuous models. No claim of external validation or clinical superiority was prespecified.
2. Materials and Methods
2.1. Study Design and Patient Selection
This single-center radiographic evaluation study was conducted at Inha University Hospital, Incheon, Republic of Korea. The institutional review board approved the study protocol (approval number: 2025-09-005; approval date: 17 September 2025) and waived the requirement for individual informed consent because of the retrospective design. The study was conducted in accordance with the Declaration of Helsinki.
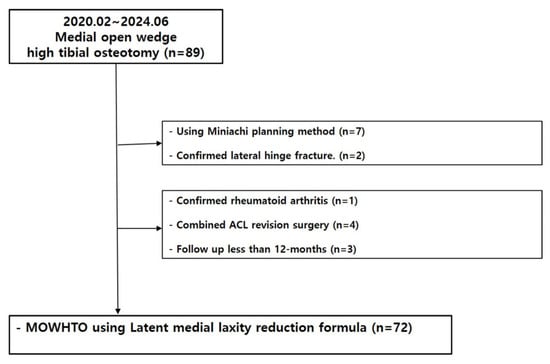
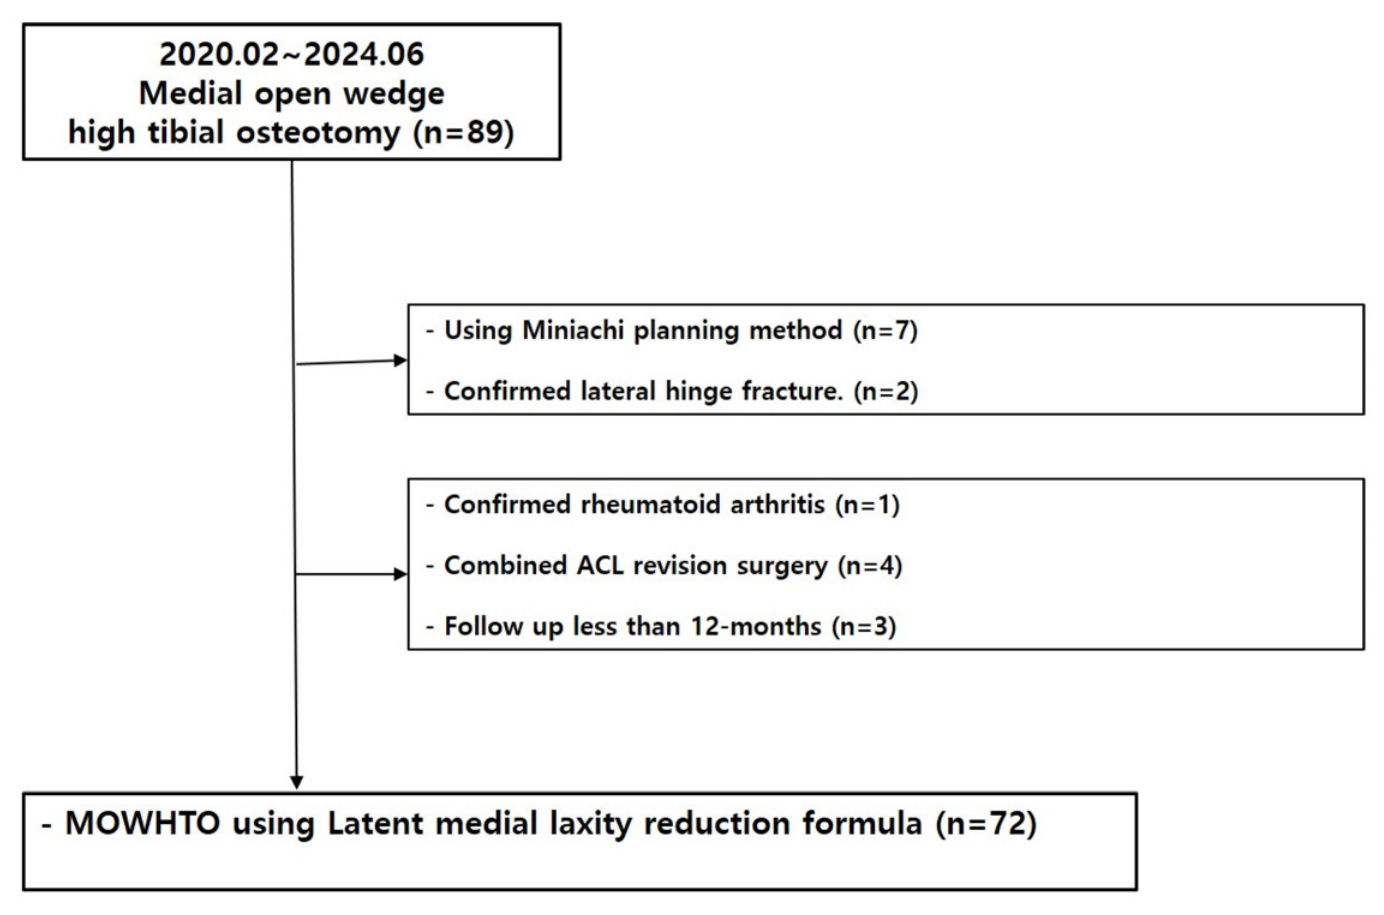
We reviewed consecutive patients who underwent primary MOWHTO by a single orthopedic surgeon (D.J.R.) between February 2020 and June 2024. The inclusion criteria were: (1) symptomatic medial compartment osteoarthritis with varus malalignment; (2) MOWHTO planned using the threshold-based LML adjustment method; (3) available preoperative standing full-length and valgus-stress radiographs; and (4) available standardized standing full-length radiographs at 1 year (± 1 month) postoperatively. The exclusion criteria were: (1) previous osteotomy or fracture deformity affecting lower-limb alignment; (2) concomitant ligament reconstruction that could substantially alter coronal laxity; (3) inflammatory arthritis; (4) severe flexion contracture preventing reliable standing alignment measurement; (5) inadequate or rotationally mal-positioned radiographs; (6) lateral hinge fracture; and (7) follow-up of less than 12 months. When both knees were eligible, only the first operated knee was included. A flow diagram of patient selection is presented in (Figure 1). No a priori sample-size calculation or success-rate benchmark was used; all eligible cases were analyzed.
Figure 1.
Flow chart of this study.
2.2. Radiographic Acquisition and Measurements
Standing full-length anteroposterior radiographs of both lower extremities were obtained preoperatively, at 6 months postoperatively (±3 weeks) and at 1 year (±1 month) after surgery. Patients stood with both knees in full extension, the patellae facing forward, and weight distributed evenly between both limbs. A standardized source-to-image distance of 200 cm was used. Full-length rather than standard anteroposterior radiographs were used throughout, because true mechanical alignment is reliably assessed only on whole-limb images [23]. Radiographs with clinically meaningful limb rotation or knee flexion were repeated or excluded according to the prespecified quality criteria.
The HKA angle was defined as the angle between the mechanical axes of the femur and tibia. Varus alignment was recorded as a negative value and valgus alignment as a positive value. The JLCA was defined as the angle formed by a line tangent to the distal femoral condyles and a line tangent to the tibial plateau. A JLCA with a medial apex was recorded as negative (varus), and a JLCA with a lateral apex was recorded as positive (valgus). Valgus-stress radiographs were obtained in full extension and the supine position using a Telos stress device (Metax GmbH, Hungen, Germany) with a standardized valgus load of 15 kgf applied at the joint-line level [16,24,25].
Additional radiographic measurements included the mMPTA, JLOA, and weight-bearing line ratio (WBL ratio). The WBL ratio was expressed as the percentage location at which the mechanical axis crossed the tibial plateau, with the medial edge defined as 0% and the lateral edge as 100%.
2.3. Calculation of Latent Medial Laxity (LML) and Planned Correction Angle
LML was calculated as follows:
LML (°) = JLCAvalgus stress − JLCAstanding
The target correction angle (TCA) represented the total correction required to change the preoperative HKA to the individualized postoperative target:
TCA (°) = Target postoperative HKA (°) − Preoperative HKA (°)
The postoperative target was individualized before surgery rather than fixed at the same valgus angle for all patients. The individualized postoperative HKA was the primary planning target. A WBL ratio of approximately 55–65% served as a general reference range rather than a mandatory target for every knee. When the correction required to reach this WBL range was expected to result in a postoperative mMPTA greater than 95° or excessive JLOA, the HKA target was shifted medially to preserve proximal tibial and joint-line geometry.
Competing considerations were resolved by prioritizing avoidance of an mMPTA >95° and excessive JLOA, then selecting the least valgus HKA expected to unload the medial compartment. The observed target-HKA range was −1° to +3°. A target of approximately 3° valgus was generally selected when medial meniscus pathology (including MMPH root injury) and a chondral defect coexisted. A target of approximately 1.5° valgus was generally selected when preoperative varus exceeded 10°, the meniscus was relatively preserved, and a medial femoral condyle chondral defect was present. In two patients with advanced Kellgren–Lawrence grade IV disease, approximately 14° varus, and concomitant lateral-compartment osteoarthritis, a target of 1° varus was selected to avoid excessive valgus. The LML deduction was then applied to determine the planned osseous correction:
Planned bony correction = TCA − (1/3 × latent medial laxity), when laxity ≤ 5°
Planned bony correction = TCA − (1/2 × latent medial laxity), when laxity > 5°
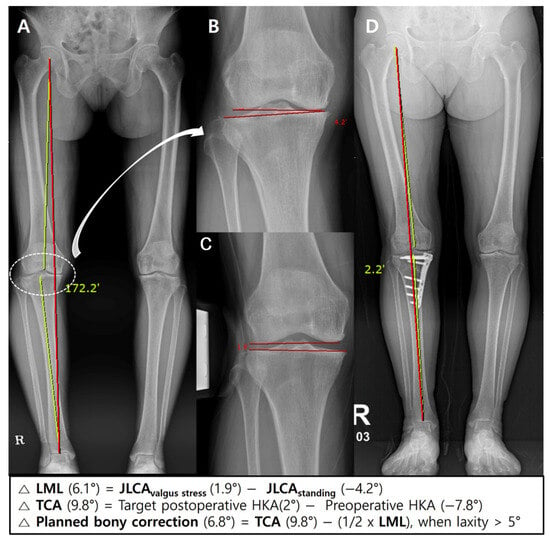
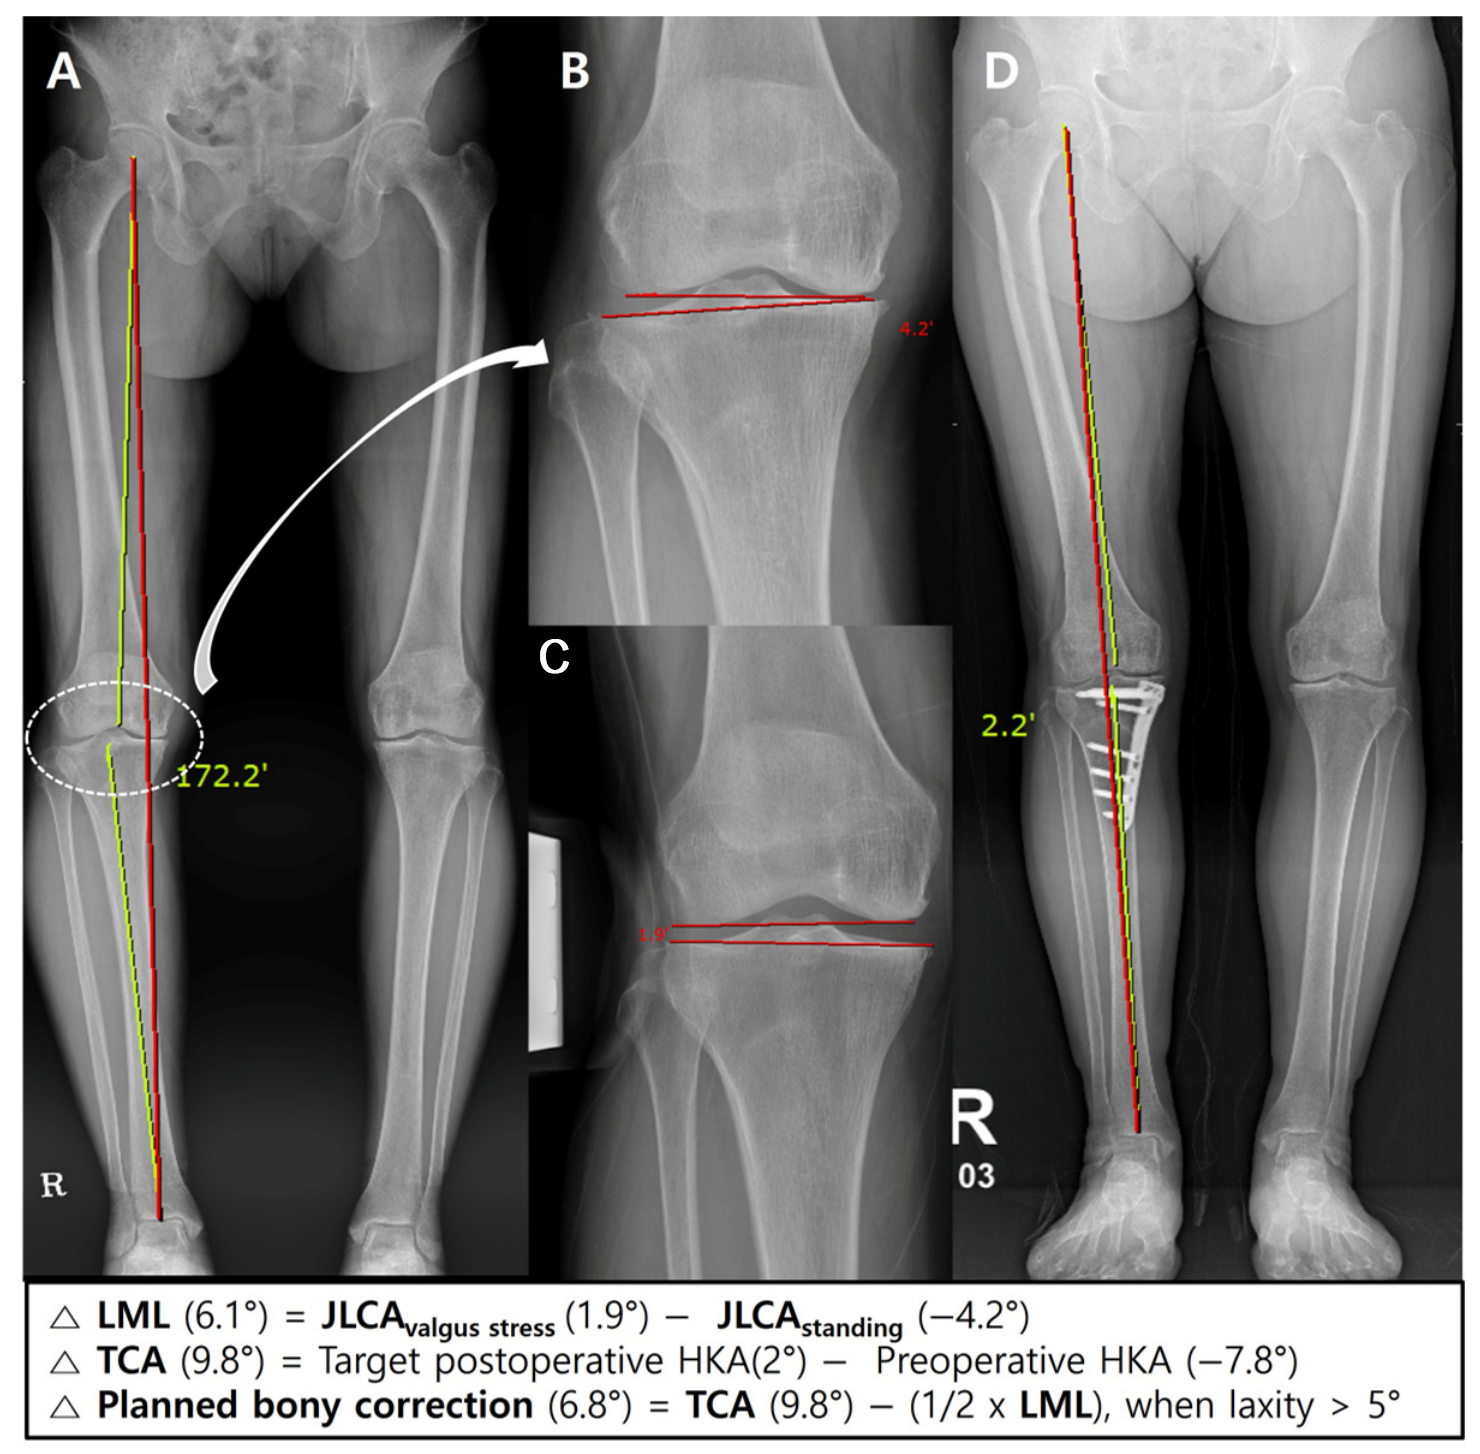
For example, if the preoperative HKA was −7.3° and the intended target postoperative HKA was +1.5°, the TCA was 8.8°. If LML was 2.7°, one-third (0.9°) was subtracted, resulting in a planned bony correction angle of 7.9°. The 5° threshold and fractions were applied before surgery and were not selected after observing postoperative alignment (Figure 2).
Figure 2.
Clinical application of the latent medial laxity (LML) adjustment formula in a 62-year-old woman with medial compartment osteoarthritis of the right knee. LML was calculated as the difference in the joint-line convergence angle between the standing whole-leg anteroposterior radiograph (A,B) and the valgus-stress radiograph (C). The target correction angle (TCA) was defined as the intended postoperative hip–knee–ankle (HKA) angle minus the preoperative HKA angle. Because the measured LML exceeded 5°, the planned bony correction angle was calculated by subtracting one-half of the LML from the TCA. At 1-year postoperatively, the HKA angle was 2.2° of varus, indicating that the achieved alignment closely matched the planned correction based on the TCA (D). Redline: weight bearing line, Green line: HKA axis.
2.4. Surgical Technique and Postoperative Rehabilitation
All procedures were performed by a single surgeon using a standardized biplanar medial open-wedge technique. The superficial MCL was managed by subperiosteal release, an approach that has not been associated with progressive valgus instability after HTO [26]. Two guidewires were inserted toward the intended lateral hinge, and the osteotomy was completed under fluoroscopic guidance while preserving the lateral cortex. The osteotomy gap was gradually opened until the planned correction was achieved. Coronal alignment was assessed using the alignment rod, with the knee in full extension and with ankle dorsiflexion force to mimic ground reaction force [27]. Fixation was performed using an OhtoFix (Ohtomedical Co., Ltd., Goyang, Republic of Korea), and the osteotomy was filled with freeze-dried allogenic cancellous bone chips (HansBiomed Corp., Seoul, Republic of Korea) for corrections exceeding 9°, whereas no graft was used for corrections less than 9°. Concomitant procedures were classified into four mutually exclusive categories: meniscal posterior-horn repair, including medial meniscus posterior root repair, without cartilage restoration in 22 knees; CARTISTEM® implantation (MEDIPOST Co., Ltd., Seongnam, Republic of Korea) without meniscal repair in 20 knees; both meniscal repair and CARTISTEM implantation in 13 knees; and neither procedure in 17 knees. These categories accounted for all 72 knees. Because MCL release, fixation, graft policy, intraoperative loading, concomitant procedures, and rehabilitation can affect alignment, the fitted coefficients should be considered specific to this technique until externally tested.
Postoperatively, range-of-motion exercises were initiated on postoperative day 2. In patients without a concomitant procedure (n = 17), non-weight bearing was applied and full weight-bearing was allowed at 6 weeks. After meniscal posterior-horn/root repair or cartilage regeneration procedure, full weight-bearing was delayed until 8 weeks [28].
2.5. Outcomes and Radiographic Error Decomposition
The primary outcome was the proportion of knees with 1-year HKA within ±1.0° of the prespecified target. The ±1.0° margin was selected as a stringent planning-accuracy criterion used in prior alignment literature, not as a validated threshold for patient benefit. Results were therefore also reported at ±1.5° and ±2.0°, and interpreted alongside the limits of agreement. Alignment error was calculated as:
Alignment error = 1-year postoperative HKA − Target postoperative HKA
An error below −1.0° was classified as undercorrection, an error from −1.0° to +1.0° as accurate correction, and an error above +1.0° as overcorrection. A negative error therefore indicated a more varus result than intended, whereas a positive error indicated a more valgus result.
Secondary outcomes were signed error, mean absolute error (MAE), root mean square error (RMSE), and accuracy within ±1.5° and ±2.0°. We also reported postoperative mMPTA, JLOA, and WBL ratio and change in HKA from 6 months to 1 year.
To address surgical execution, change in mMPTA from preoperative to 1 year (ΔmMPTA) was used as a radiographic proxy for executed osseous correction. Execution error was ΔmMPTA minus planned osseous correction. Residual non-osseous contribution was achieved total HKA correction minus ΔmMPTA, and planning error was residual non-osseous contribution minus the planned LML deduction. By definition, total HKA error equals execution error plus planning error. This decomposition is descriptive: ΔmMPTA is not a direct intraoperative wedge-angle measurement, and postoperative adaptation may influence it.
2.6. Measurement of X-Ray Parameters Related to High Tibial Osteotomy (HTO)
All measurements on preoperative standing, valgus-stress, and postoperative standing full-length anteroposterior radiographs were performed using CONNEVO RUO Cloud, an automated lower-extremity long-leg radiographic measurement platform (Connecteve Co., Ltd., Seoul, Republic of Korea) [29]. The software automatically identified anatomical landmarks and calculated the radiographic parameters required for this study, including the HKA angle, JLCA, mMPTA, and WBL ratio. The same image-acquisition and automated analysis workflow was applied at all time points. All automatically generated landmark positions and measurement outputs were reviewed for image-quality or landmark-recognition errors before inclusion in the final analysis. To evaluate repeat-measurement reliability, two observers independently measured valgus-stress JLCA in all 72 knees and repeated the measurements after a 4-week interval. LML was derived for each reading as the corresponding valgus-stress JLCA minus the standing JLCA. Intraobserver reliability compared the two readings of each observer. Interobserver reliability was assessed primarily using the first reading from each observer to avoid inflation from averaging repeated measurements. Repeat standing or stress radiographs were not acquired; therefore, these analyses assess measurement repeatability on the same images rather than repeat-acquisition reliability.
2.7. Statistical Analysis
All 72 eligible knees were analyzed; no a priori sample-size calculation was performed. Continuous variables were summarized by mean ± standard deviation or median (interquartile range) as appropriate, and categorical variables by count and percentage.
The primary proportion was reported with an exact binomial 95% confidence interval. Signed error was tested against zero; MAE and RMSE described error magnitude. Bland–Altman analysis reported bias and 95% limits of agreement, and regression of differences on pairwise means assessed proportional bias. The supportive target-versus-achieved ICC and the intra- and interobserver reliability analyses used two-way random-effects, absolute-agreement, single-measure intraclass correlation coefficients [ICC(2,1), equivalent to ICC(A,1)]. Subject-level bootstrap resampling with 20,000 iterations was used to obtain 95% confidence intervals. ICC values of <0.50, 0.50–0.75, 0.75–0.90, and >0.90 were interpreted as poor, moderate, good, and excellent reliability, respectively. Restricted between-subject variation in individualized targets was recognized as a limitation of the target-versus-achieved ICC.
Outcomes were compared between LML ≤5° and >5°. Spearman correlation and a scatterplot with LOWESS and separate within-stratum linear fits examined the relationship between LML and signed error. A segmented regression containing an indicator jump at 5° and a slope-change term tested whether the data supported a discontinuity at the threshold.
For internal counterfactual model comparison, the deduction required to yield zero target error under the observed execution and non-osseous response was defined as the applied deduction plus observed signed error. We compared no adjustment, fixed one-third, fixed one-half, an optimized fixed coefficient constrained through zero, the prespecified threshold rule, and an exploratory linear model with intercept. MAE, RMSE, bias, and proportions within ±1.0°, ±1.5°, and ±2.0° were calculated. Leave-one-out cross-validation was used for the two fitted models. This analysis assumes that execution error and non-osseous response would remain unchanged under an alternative plan and therefore does not substitute for a concurrent control group. Two-sided p < 0.05 was considered significant.
3. Results
3.1. Patient Selection and Baseline Characteristics
A total of 72 knees with complete preoperative, 6-month, and 1-year radiographic data were included. The mean age was 59.4 ± 5.2 years, mean BMI was 27.7 ± 4.3 kg/m2, and 19 knees (26.4%) were in male patients. Baseline demographic and radiographic characteristics are summarized in Table 1. Mean preoperative HKA was −7.39 ± 1.60°, the target HKA was 1.42 ± 0.80° (range, −1° to +3°), TCA was 8.80 ± 1.48°, and planned osseous correction was 6.81 ± 1.41°. Mean LML was 4.60 ± 1.86° (range, 0.8–9.3°); 40 knees had LML ≤5° and 32 had LML >5°.
Table 1.
Baseline demographic and radiographic characteristics of the overall cohort.
3.2. Measurement Reliability
Both valgus-stress JLCA and derived LML demonstrated excellent repeat-measurement reliability. For valgus-stress JLCA, intraobserver ICCs were 0.969 (95% CI, 0.952–0.978) for Observer 1 and 0.955 (95% CI, 0.933–0.968) for Observer 2; the interobserver ICC was 0.976 (95% CI, 0.962–0.984). For derived LML, intraobserver ICCs were 0.981 (95% CI, 0.970–0.988) and 0.974 (95% CI, 0.961–0.982), respectively; the interobserver ICC was 0.986 (95% CI, 0.978–0.991).
3.3. Primary Alignment Accuracy
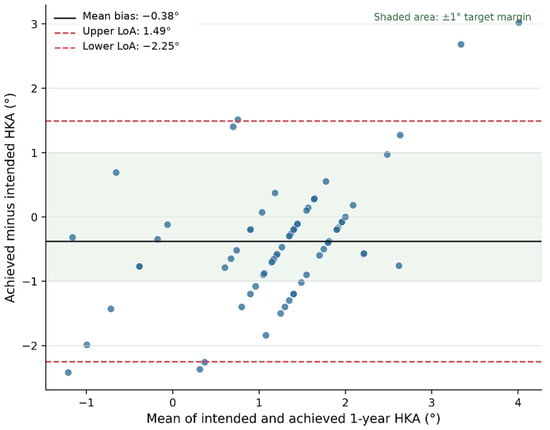
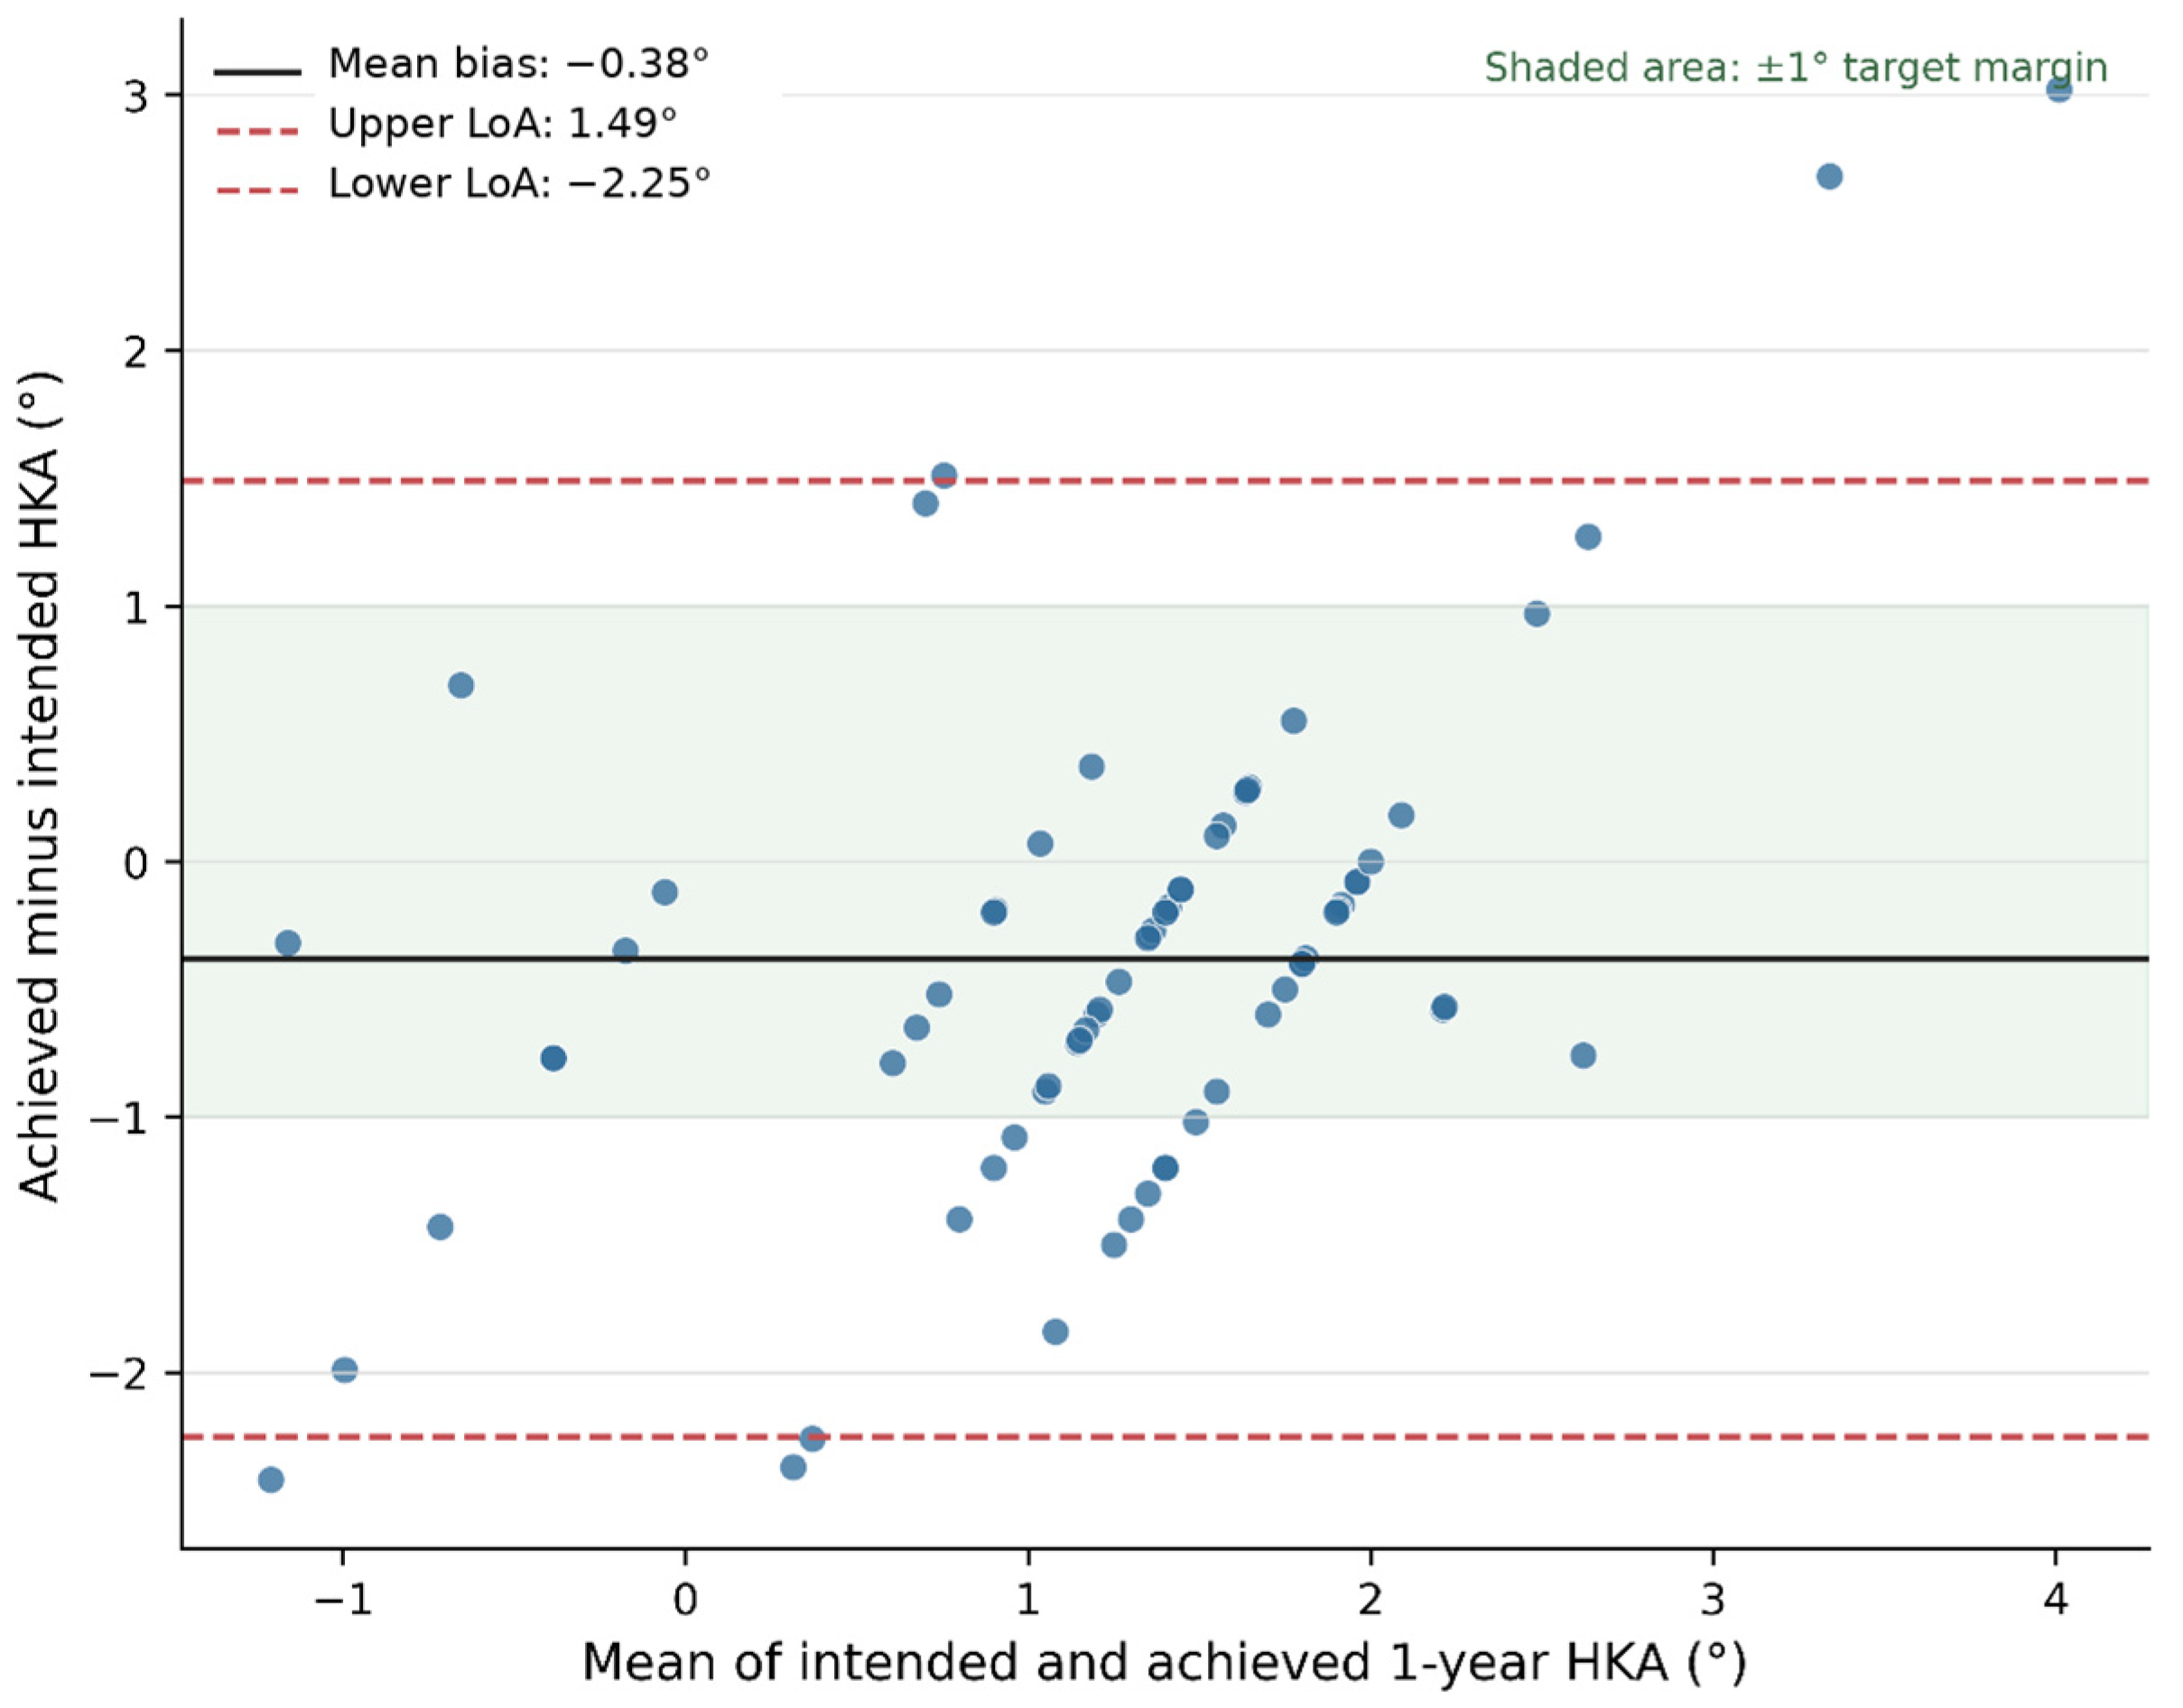
At 1 year, mean achieved HKA was 1.04 ± 1.26°. Fifty-two knees were within ±1.0° of target (72.2%; exact 95% CI, 60.4–82.1%); 15 (20.8%) were >1.0° more varus than target and five (6.9%) were >1.0° more valgus. Mean signed error was −0.38 ± 0.95° (95% CI, −0.61 to −0.16°; p = 0.001), MAE was 0.76 ± 0.68°, and RMSE was 1.02° (Table 2). Bland–Altman bias was −0.38°, with wide 95% limits of agreement from −2.25° to 1.49° (Figure 3). Differences increased with pairwise mean HKA (slope, 0.54; p < 0.001), indicating proportional bias. The target-versus-achieved ICC(A,1) was 0.558 (bootstrap 95% CI, 0.420–0.667), interpreted cautiously because the target range was restricted.
Figure 3.
Bland–Altman plot comparing intended and achieved 1-year HKA. The solid horizontal line indicates the mean bias (−0.38°), and dashed lines indicate the 95% limits of agreement (−2.25° to 1.49°). The shaded band represents the prespecified ±1.0° target margin. Negative differences indicate a more varus result than intended.
Although 52 knees (72.2%) achieved the individualized HKA target within ±1.0°, only 16 knees (22.2%) had a WBL ratio between 55% and 65%. These percentages represent different outcome constructs because HKA accuracy was assessed relative to each patient’s prespecified individualized angular target, whereas the WBL range was a general reference and was not a mandatory target for every knee.
Table 2.
Primary alignment outcomes, radiographic error decomposition, and postoperative alignment.
3.4. Radiographic Decomposition of Planning and Execution
Mean ΔmMPTA was 6.03 ± 2.59°, compared with planned osseous correction of 6.81 ± 1.41°. The execution-error proxy (ΔmMPTA minus planned correction) was −0.78 ± 2.13° (p = 0.003). Residual non-osseous contribution averaged 2.40 ± 2.30°, versus a planned LML deduction of 1.99 ± 1.13°; the resulting planning component was +0.40 ± 2.04° (p = 0.098). The total mean error of −0.38° therefore reflected partial cancelation between a negative execution component and a positive planning component. These quantities are an algebraic decomposition of the primary error and are not independent outcomes.
3.5. Relationship Between LML, the 5° Threshold, and Alignment Error
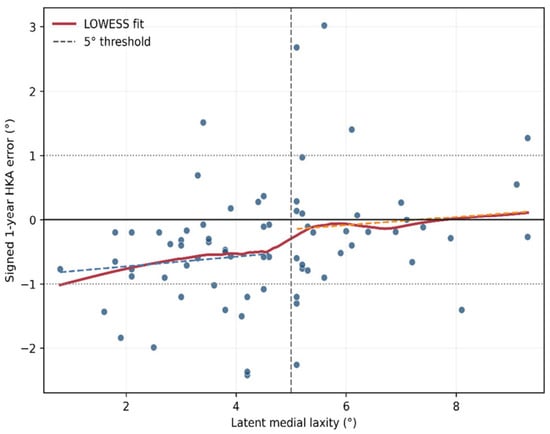
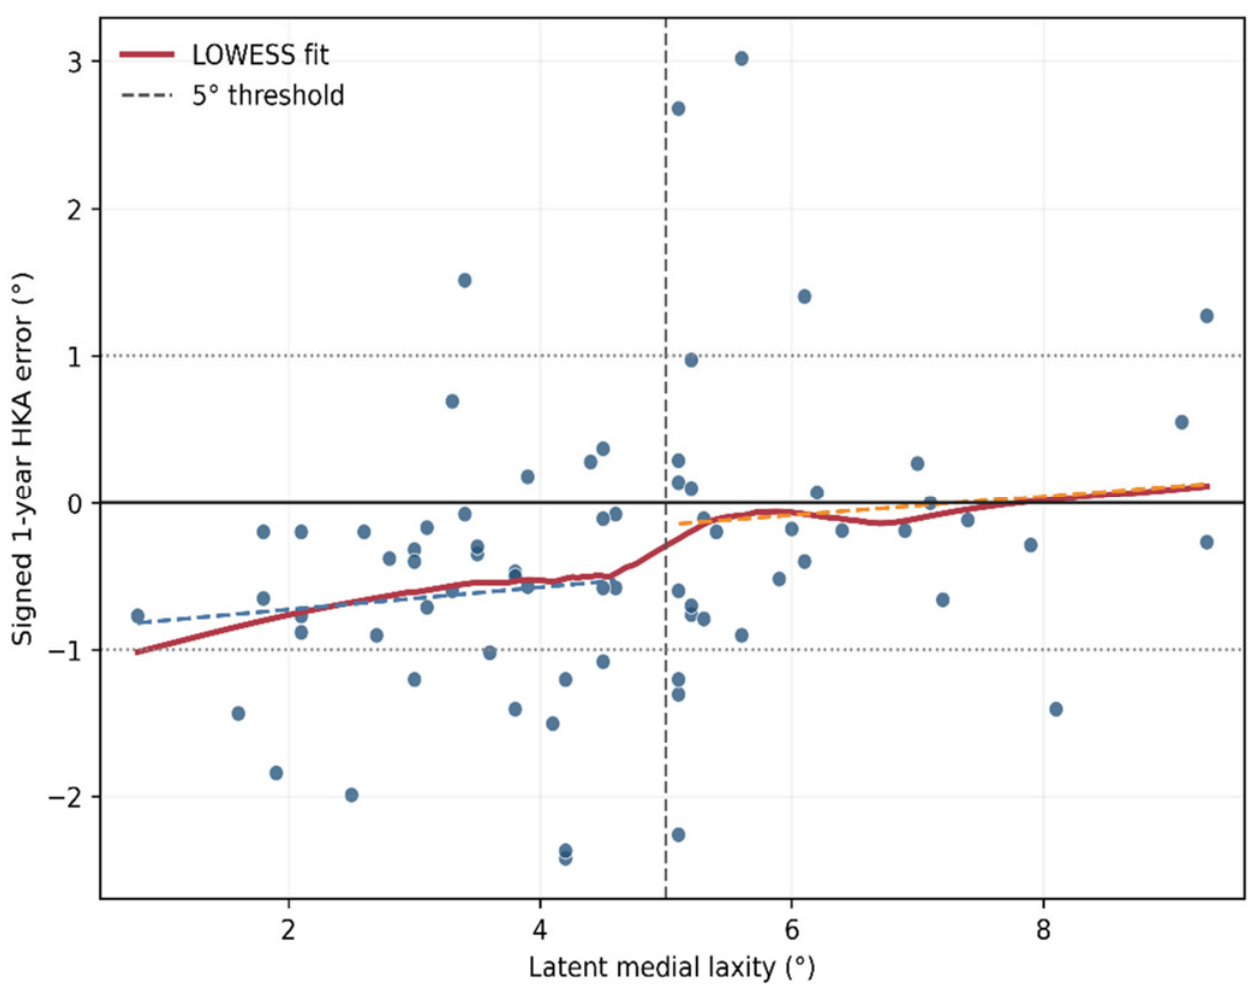
Accuracy within ±1.0° was 70.0% (28/40) for LML ≤5° and 75.0% (24/32) for LML >5° (p = 0.792). Mean signed error was −0.63 ± 0.78° and −0.07 ± 1.07°, respectively (p = 0.016), whereas absolute error was similar (0.78 ± 0.62° vs. 0.74 ± 0.76°; p = 0.822) (Table 3). LML correlated with more positive residual error (Spearman ρ = 0.334; p = 0.004). Segmented regression found neither a significant jump at 5° (+0.35°, p = 0.357) nor a slope change (−0.01°/°, p = 0.960), providing no evidence of a biological discontinuity at the chosen threshold (Figure 4).
Table 3.
Alignment accuracy stratified by latent medial laxity.
Figure 4.
Association between LML and signed 1-year HKA error. The red curve is a LOWESS fit; dashed colored lines are separate linear fits below and above the prespecified 5° threshold. The vertical dashed line marks 5°, the solid horizontal line marks zero error, and dotted horizontal lines mark ±1°. The plot and segmented regression do not show a clear discontinuity at 5°.
3.6. Internal Counterfactual Comparison of Deduction Models
Under the counterfactual assumption that the observed execution error and non-osseous response would remain unchanged, no adjustment yielded an estimated MAE of 1.79°, RMSE of 2.32°, and 41.7% within ±1.0°. The threshold rule yielded 0.76°, 1.02°, and 72.2%, respectively. An optimized fixed coefficient was 0.404 × LML (MAE, 0.90°; 70.8% within ±1.0°). The exploratory continuous model was deduction = −1.77 + 0.736 × LML and yielded an apparent MAE of 0.66° and 79.2% within ±1.0°. Leave-one-out values were similar (continuous-model MAE, 0.68°; RMSE, 0.99°; 79.2% within ±1.0°). Because the continuous equation gives negative deductions at low LML and was fitted in the same small cohort, it is not proposed for clinical use without prospective external validation (Table 4).
Table 4.
Internal counterfactual comparison of alternative LML-deduction models.
3.7. Postoperative Alignment and Sensitivity Analyses
At 1 year, mean mMPTA was 90.15 ± 2.62°; one knee (1.4%) exceeded 95°. Mean WBL ratio was 53.00 ± 6.00%, with 16 knees (22.2%) between 55% and 65%. Mean JLOA was 1.25 ± 2.75°, and 60 knees (83.3%) had |JLOA| ≤4°. Mean HKA changed by +0.20 ± 0.68° from 6 months to 1 year (p = 0.013). Accuracy was 88.9% within ±1.5° and 93.1% within ±2.0°. These radiographic outcomes describe alignment only; patient-reported outcomes, reoperations, cartilage status, and survivorship were not assessed.
4. Discussion
The principal finding was that the prespecified threshold rule reproduced the individualized 1-year HKA target within ±1.0° in 72.2% of knees, but with a small systematic varus bias (−0.38°) and wide limits of agreement (−2.25° to 1.49°). Proportional bias indicates that agreement was not constant across the alignment range. Accordingly, these findings demonstrate radiographic target reproduction within the present cohort but do not constitute external validation of the planning rule.
The apparent discrepancy between individualized HKA target attainment and the proportion of knees within the 55–65% WBL range reflects the different purposes of these measures. HKA accuracy was evaluated relative to each patient’s prespecified individualized target, which ranged from 1° varus to 3° valgus, whereas the WBL range represented a general population-level reference rather than a mandatory target for every knee. Moreover, HKA and WBL location are related but not interchangeable because the WBL ratio is also influenced by individual limb and proximal tibial geometry. In knees requiring larger corrections, the target was intentionally shifted medially when necessary to avoid an excessive postoperative mMPTA or JLOA. Therefore, accurate reproduction of an individualized HKA target did not necessarily result in a WBL ratio between 55% and 65%.
Radiographic decomposition suggested that both execution and planning contributed to the observed alignment error. ΔmMPTA, used as a proxy for executed osseous correction, averaged 0.78° less than planned, whereas the residual non-osseous contribution averaged 0.40° more than the planned deduction. Their partial cancelation resulted in the observed mean HKA error of −0.38°. Therefore, the alignment error should not be attributed solely to the non-osseous response; both technical execution and the planning model should be considered. The large dispersion of ΔmMPTA further emphasizes the importance of verifying technical execution when evaluating a planning formula.
The internal model comparison suggests that incorporating LML contains useful information relative to a no-adjustment counterfactual, but it cannot establish superiority because no patients were actually treated with the alternative plans. The continuous model modestly improved apparent MAE and the ±1° rate, and leave-one-out estimates were similar. However, its negative intercept produces implausible negative deductions at low LML, and changing the planned osteotomy could itself change the non-osseous response. The equation is therefore hypothesis-generating, not a clinical recommendation.
The subgroup and segmented analyses do not support a distinct biological transition at 5°. High-LML knees had signed error closer to zero, LML was continuously associated with residual error, and no significant jump or slope change occurred at the threshold. The 5° cut-off and one-third/one-half fractions should be understood as a pragmatic implementation derived from earlier work and clinical refinement [16], not as coefficients validated by the present data.
Published conventional, navigation, and patient-specific instrumentation series provide useful context; however, direct comparisons of accuracy are inappropriate because target definitions, loading conditions, surgical techniques, follow-up timing, and outlier definitions differ among studies [30,31,32,33,34]. Therefore, the present findings should not be interpreted as demonstrating comparable or superior accuracy relative to these techniques. The present study evaluates radiographic target reproduction only, and it remains unknown whether achieving an HKA within ±1.0° of the individualized target improves symptoms, patient-reported outcomes, reoperation risk, cartilage preservation, or survivorship [35,36].
LML itself is a composite construct. Standing and supine valgus-stress images differ in weight-bearing, applied stress, rotation, and potential muscle guarding. A supine non-stress radiograph was unavailable to isolate ordinary load-dependent JLCA change [19,37,38,39]. The Telos protocol standardized force at 15 kgf but not patient-specific valgus moment [25]. Although intra- and interobserver reliability was excellent for both valgus-stress JLCA and derived LML, the ICCs were based on repeated measurements of the same radiographs and do not account for variability in image acquisition. Moreover, the same standing JLCA value was used to derive all repeated LML measurements for each knee; therefore, the LML ICCs primarily reflect repeatability of the stress-JLCA measurement and do not incorporate variability from repeated standing-radiograph acquisition. Muscle guarding, limb rotation, device positioning, and differences in effective valgus moment may still affect stress JLCA and LML, and measurement noise may reclassify knees near the 5° threshold. The modest target-versus-achieved ICC is not a measurement-reliability statistic and was likely attenuated by the restricted target range; Bland–Altman analysis is more informative for agreement.
Transferability is limited by a single surgeon, routine superficial-MCL release, one plate, a correction-dependent graft policy, one intraoperative alignment method, and one rehabilitation protocol. These choices directly affect the same periarticular response that the coefficients attempt to model. Other limitations include the retrospective design, absence of a concurrent control, lack of direct wedge-angle or opening-height measurement, use of ΔmMPTA as a surrogate for executed correction, possible postoperative adaptation, fitted-model optimism, and unavailable repeat-radiograph acquisition reliability. The target-selection algorithm also includes clinical judgment and requires external standardization. Furthermore, most knees underwent concomitant meniscal repair, cartilage restoration, or both, and full weight-bearing was delayed from 6 to 8 weeks in these patients. These differences may have influenced postoperative loading and standing alignment. Because the concomitant procedures were selected according to underlying pathology and the isolated-MOWHTO group was small, the independent effects of the procedure type and rehabilitation protocol could not be determined. Prospective multicenter studies should prespecify success criteria, randomize or otherwise compare planning rules, record actual wedge execution and concomitant procedures, standardize stress moments, and include patient-reported and survivorship outcomes.
5. Conclusions
Threshold-based LML adjustment reproduced the individualized 1-year HKA target within ±1.0° in 72.2% of knees. This simple method appears feasible for preoperative planning; however, the small target-relative undercorrection bias warrants further refinement and prospective comparative validation.
Author Contributions
Conceptualization, S.J.W. and D.-J.R.; methodology, Y.S.J. and J.S.K.; software, J.S.P.; validation, J.H. and Y.G.N.; formal analysis, J.S.P. and D.-J.R.; investigation, S.J.W. and J.H.; resources, J.S.K.; data curation, Y.S.J.; writing—original draft preparation, S.J.W.; writing—review and editing, Y.S.J. and D.-J.R.; visualization, J.H.; supervision, D.-J.R.; project administration, S.J.W.; funding acquisition, D.-J.R. All authors have read and agreed to the published version of the manuscript.
Funding
This research was supported by a grant of the Inha University.
Institutional Review Board Statement
This protocol was approved by the investigational review board of INHA UNIV. Hospital institution (Inha Univ Hospital IRB 2025-09-005, 17 September 2025).
Informed Consent Statement
Patient consent was waived due to retrospective image analysis study design by investigational review board.
Data Availability Statement
The data that support the findings of this study are available upon reasonable request.
Conflicts of Interest
The authors declare no conflicts of interest.
Abbreviations
The following abbreviations are used in this manuscript:
| ATCA | achieved total correction angle |
| CAS | computer-assisted surgery |
| CI | confidence interval |
| HKA | hip–knee–ankle angle |
| JLCA | joint-line convergence angle |
| JLOA | joint-line obliquity angle |
| LML | latent medial laxity |
| MAE | mean absolute error |
| MCL | medial collateral ligament |
| mMPTA | mechanical medial proximal tibial angle |
| MOWHTO | medial open-wedge high tibial osteotomy |
| OR | odds ratio |
| PSI | patient-specific instrumentation |
| RMSE | root mean square error |
| TCA | target correction angle |
| WBL | weight-bearing line |
References
- LaPrade, R.F.; Spiridonov, S.I.; Nystrom, L.M.; Jansson, K.S. Prospective Outcomes of Young and Middle-Aged Adults with Medial Compartment Osteoarthritis Treated with a Proximal Tibial Opening Wedge Osteotomy. Arthrosc. J. Arthrosc. Relat. Surg. 2012, 28, 354–364. [Google Scholar] [CrossRef] [Scilit] [PubMed]
- Kang, B.Y.; Lee, D.K.; Kim, H.S.; Wang, J.H. How to achieve an optimal alignment in medial opening wedge high tibial osteotomy? Knee Surg. Relat. Res. 2022, 34, 3. [Google Scholar] [CrossRef] [Scilit] [PubMed]
- Jung, W.-H.; Katkar, M.; Seo, M.-S.; Kim, D.-H.; Takeuchi, R. MRI-based classification of lateral hinge fractures in medial opening wedge high tibial osteotomy. Knee Surg. Relat. Res. 2026, 38, 13. [Google Scholar] [CrossRef] [Scilit] [PubMed]
- Ryu, D.J.; Park, S.J.; Lee, D.H.; Kwon, K.B.; Choi, G.H.; Kim, I.S.; Wang, J.H. Does the anteromedial plate position affect proximal screw length and worsen the clinical outcomes in medial opening wedge high tibial osteotomy? BMC Musculoskelet. Disord. 2023, 24, 14. [Google Scholar] [CrossRef] [Scilit] [PubMed]
- Choi, K.Y.; Kim, M.S.; In, Y. The Effectiveness and Safety of Tibial-Sided Osteotomy for Fibula Untethering in Lateral Close-Wedge High Tibial Osteotomy: A Novel Technique with Video Illustration. Medicina 2025, 61, 91. [Google Scholar] [CrossRef] [Scilit] [PubMed]
- Kim, J.S.; Lim, J.K.; Choi, H.G.; Jeong, H.W.; Park, S.B.; Shim, S.J.; Lee, Y.S. Excessively Increased Joint-Line Obliquity After Medial Opening-Wedge High Tibial Osteotomy Is Associated with Inferior Radiologic and Clinical Outcomes: What Is Permissible Joint-Line Obliquity. Arthroscopy 2022, 38, 1904–1915. [Google Scholar] [CrossRef] [Scilit] [PubMed]
- Dowd, G.S.E.; Somayaji, H.S.; Uthukuri, M. High tibial osteotomy for medial compartment osteoarthritis. Knee 2006, 13, 87–92. [Google Scholar] [CrossRef] [Scilit] [PubMed]
- Nakayama, H.; Schröter, S.; Yamamoto, C.; Iseki, T.; Kanto, R.; Kurosaka, K.; Kambara, S.; Yoshiya, S.; Higa, M. Large correction in opening wedge high tibial osteotomy with resultant joint-line obliquity induces excessive shear stress on the articular cartilage. Knee Surg. Sports Traumatol. Arthrosc. 2018, 26, 1873–1878. [Google Scholar] [CrossRef] [Scilit] [PubMed]
- Kim, Y.M.; Joo, Y.B.; Park, Y.C.; Lee, S.-H.; Song, J.-H. Postoperative change in the joint-line convergence angle is associated with inaccurate correction in open-wedge high tibial osteotomy. J. Orthop. Surg. Res. 2023, 18, 773. [Google Scholar] [CrossRef] [Scilit] [PubMed]
- Lee, S.-S.; Lee, Y.K.; Kim, I.S.; Ryu, D.J.; Jung, E.Y.; Lee, D.K.; Wang, J.H. Preoperative Medial Tightness and Narrow Medial Joint Space Are Predictive Factors for Lower Extremity Alignment Change Toward Varus After Opening-Wedge High Tibial Osteotomy. Orthop. J. Sports Med. 2022, 10, 23259671221119152. [Google Scholar] [CrossRef] [Scilit] [PubMed]
- Han, S.-B.; Kim, H.J.; Lee, D.-H. Effect of Computer Navigation on Accuracy and Reliability of Limb Alignment Correction following Open-Wedge High Tibial Osteotomy: A Meta-Analysis. BioMed Res. Int. 2017, 2017, 3803457. [Google Scholar] [CrossRef] [Scilit] [PubMed]
- Kyung, B.S.; Kim, J.G.; Jang, K.-M.; Chang, M.; Moon, Y.-W.; Ahn, J.H.; Wang, J.H. Are navigation systems accurate enough to predict the correction angle during high tibial osteotomy? Comparison of navigation systems with 3-dimensional computed tomography and standing radiographs. Am. J. Sports Med. 2013, 41, 2368–2374. [Google Scholar] [CrossRef] [Scilit] [PubMed]
- Van den Bempt, M.; Van Genechten, W.; Claes, T.; Claes, S. How accurately does high tibial osteotomy correct the mechanical axis of an arthritic varus knee? A systematic review. Knee 2016, 23, 925–935. [Google Scholar] [CrossRef] [Scilit] [PubMed]
- Akamatsu, Y.; Mitsugi, N.; Mochida, Y.; Taki, N.; Kobayashi, H.; Takeuchi, R.; Saito, T. Navigated opening wedge high tibial osteotomy improves intraoperative correction angle compared with conventional method. Knee Surg. Sports Traumatol. Arthrosc. 2012, 20, 586–593. [Google Scholar] [CrossRef] [Scilit] [PubMed]
- Lee, D.-H.; Park, S.-C.; Park, H.-J.; Han, S.-B. Effect of soft tissue laxity of the knee joint on limb alignment correction in open-wedge high tibial osteotomy. Knee Surg. Sports Traumatol. Arthrosc. 2016, 24, 3704–3712. [Google Scholar] [CrossRef] [Scilit] [PubMed]
- Ryu, D.J.; Lee, S.-S.; Jung, E.Y.; Kim, J.H.; Shin, T.S.; Wang, J.H. Reliability of Preoperative Planning Method That Considers Latent Medial Joint Laxity in Medial Open-Wedge Proximal Tibial Osteotomy. Orthop. J. Sports Med. 2021, 9, 23259671211034151. [Google Scholar] [CrossRef] [Scilit] [PubMed]
- Lee, D.K.; Wang, J.H.; Won, Y.; Min, Y.K.; Jaiswal, S.; Lee, B.H.; Kim, J.Y. Preoperative latent medial laxity and correction angle are crucial factors for overcorrection in medial open-wedge high tibial osteotomy. Knee Surg. Sports Traumatol. Arthrosc. 2020, 28, 1411–1418. [Google Scholar] [CrossRef] [Scilit] [PubMed]
- Heijens, E.; Kornherr, P.; Meister, C. The coronal hypomochlion: A tipping point of clinical relevance when planning valgus producing high tibial osteotomies. Bone Jt. J. 2016, 98-B, 628–633. [Google Scholar] [CrossRef] [Scilit] [PubMed]
- So, S.-Y.; Lee, S.-S.; Jung, E.Y.; Kim, J.H.; Wang, J.H. Difference in joint line convergence angle between the supine and standing positions is the most important predictive factor of coronal correction error after medial opening wedge high tibial osteotomy. Knee Surg. Sports Traumatol. Arthrosc. 2020, 28, 1516–1525. [Google Scholar] [CrossRef] [Scilit] [PubMed]
- Park, J.-G.; Kim, J.-M.; Lee, B.-S.; Lee, S.-M.; Kwon, O.-J.; Bin, S.-I. Increased preoperative medial and lateral laxity is a predictor of overcorrection in open wedge high tibial osteotomy. Knee Surg. Sports Traumatol. Arthrosc. 2020, 28, 3164–3172. [Google Scholar] [CrossRef] [Scilit] [PubMed]
- Gimm, G.; Ra, H.; Yang, S.G.; Choi, B.S.; Ro, D.H.; Han, H.-S. Complementary roles of standing, supine, and valgus-stress whole-leg radiographs in medial open-wedge high tibial osteotomy planning: Supine minimizes bias, whereas standing and valgus-stress reduce outliers. Knee Surg. Relat. Res. 2026, 38, 38. [Google Scholar] [CrossRef] [Scilit] [PubMed]
- Horita, K.; Ikeda, Y.; Kamiya, T.; Hamaoka, K.; Takahashi, K.; Okada, Y.; Emori, M.; Teramoto, A. High tibial osteotomy with individualised alignment and meniscal centralisation improves KOOS sports and recreation and cartilage status compared to conventional Fujisawa-point alignment without centralisation: A propensity score matching study. J. Exp. Orthop. 2025, 12, e70594. [Google Scholar] [CrossRef] [Scilit] [PubMed]
- Graden, N.R.; Dean, R.S.; Kahat, D.H.; DePhillipo, N.N.; LaPrade, R.F. True Mechanical Alignment is Found Only on Full-Limb and not on Standard Anteroposterior Radiographs. Arthrosc. Sports Med. Rehabil. 2020, 2, e753–9. [Google Scholar] [CrossRef] [Scilit] [PubMed]
- Laprade, R.F.; Bernhardson, A.S.; Griffith, C.J.; Macalena, J.A.; Wijdicks, C.A. Correlation of valgus stress radiographs with medial knee ligament injuries: An in vitro biomechanical study. Am. J. Sports Med. 2010, 38, 330–338. [Google Scholar] [CrossRef] [Scilit] [PubMed]
- DePhillipo, N.N.; Kane, P.W.; Engebretsen, L. Stress Radiographs for Ligamentous Knee Injuries. Arthroscopy 2021, 37, 15–16. [Google Scholar] [CrossRef] [Scilit] [PubMed]
- Kim, J.-H.; Ryu, D.J.; Lee, S.-S.; Jang, S.P.; Park, J.S.; Kim, W.J.; Kim, I.S.; Wang, J.H. Does Transection of the Superficial MCL During HTO Result in Progressive Valgus Instability? Am. J. Sports Med. 2022, 50, 142–151. [Google Scholar] [CrossRef] [Scilit] [PubMed]
- Kim, M.S.; Son, J.M.; Koh, I.J.; Bahk, J.H.; In, Y. Intraoperative adjustment of alignment under valgus stress reduces outliers in patients undergoing medial opening-wedge high tibial osteotomy. Arch. Orthop. Trauma Surg. 2017, 137, 1035–1045. [Google Scholar] [CrossRef] [Scilit] [PubMed]
- Jung, S.-H.; Jung, M.; Chung, K.; Moon, H.-S.; Jeon, B.-H.; Kim, S.-H. Combined Cartilage Procedures After High Tibial Osteotomy: Cartilage Status, Early Functional Recovery, and Short-term Clinical Outcomes. Orthop. J. Sports Med. 2026, 14, 23259671261445954. [Google Scholar] [CrossRef] [Scilit] [PubMed]
- Kim, S.E.; Nam, J.W.; Kim, J.I.; Kim, J.-K.; Ro, D.H. Enhanced deep learning model enables accurate alignment measurement across diverse institutional imaging protocols. Knee Surg. Relat. Res. 2024, 36, 4. [Google Scholar] [CrossRef] [Scilit] [PubMed]
- Cerciello, S.; Ollivier, M.; Corona, K.; Kaocoglu, B.; Seil, R. CAS and PSI increase coronal alignment accuracy and reduce outliers when compared to traditional technique of medial open wedge high tibial osteotomy: A meta-analysis. Knee Surg. Sports Traumatol. Arthrosc. 2022, 30, 555–566. [Google Scholar] [CrossRef] [Scilit] [PubMed]
- Schröter, S.; Ihle, C.; Elson, D.W.; Döbele, S.; Stöckle, U.; Ateschrang, A. Surgical accuracy in high tibial osteotomy: Coronal equivalence of computer navigation and gap measurement. Knee Surg. Sports Traumatol. Arthrosc. 2016, 24, 3410–3417. [Google Scholar] [CrossRef] [Scilit] [PubMed]
- Zhu, X.; Qian, Y.; Liu, A.; Xu, P.; Guo, J.J. Comparative outcomes of patient-specific instrumentation, the conventional method and navigation assistance in open-wedge high tibial osteotomy: A prospective comparative study with a two-year follow up. Knee 2022, 39, 18–28. [Google Scholar] [CrossRef] [Scilit] [PubMed]
- Delaigue, F.; Wardani, H.; Descamps, J.; Ollivier, M.; Nizard, R.; Bouché, P.-A. A network meta-analysis evaluating valgization high tibial osteotomy cutting guides: Improving surgical precision through navigation and PSI. Knee Surg. Relat. Res. 2025, 37, 28. [Google Scholar] [CrossRef] [Scilit] [PubMed]
- Han, J.H.; Jung, M.; Chung, K.; Kim, S.; Lee, M.H.; Choi, C.-H.; Kim, S.H. Comparison of a patient-specific instrument and conventional high tibial Osteotomy: Accuracy of correction target and prevention of posterior tibial slope change. Asia Pac. J. Sports Med. Arthrosc. Rehabil. Technol. 2025, 42, 28–35. [Google Scholar] [CrossRef] [Scilit] [PubMed]
- Yoon, S.-D.; Zhang, G.; Kim, H.-J.; Lee, B.-J.; Kyung, H.-S. Comparison of Cable Method and Miniaci Method Using Picture Archiving and Communication System in Preoperative Planning for Open Wedge High Tibial Osteotomy. Knee Surg. Relat. Res. 2016, 28, 283–288. [Google Scholar] [CrossRef] [Scilit] [PubMed]
- Jiang, X.; Xie, K.; Han, X.; Ai, S.; Wu, H.; Wang, L.; Yan, M. HKA Angle-A Reliable Planning Parameter for High Tibial Osteotomy: A Theoretical Analysis Using Standing Whole-Leg Radiographs. J. Knee Surg. 2022, 35, 54–60. [Google Scholar] [CrossRef] [Scilit] [PubMed]
- Kumagai, K.; Yamada, S.; Nejima, S.; Choe, H.; Ike, H.; Kobayashi, N.; Inaba, Y. Adjusted planning based on the joint line convergence angle improves correction accuracy in the standing position after opening wedge high tibial osteotomy. J. Orthop. Surg. Res. 2024, 19, 598. [Google Scholar] [CrossRef] [Scilit] [PubMed]
- Kim, M.S.; Kim, J.J.; Kang, K.H.; Sin, K.J.; In, Y. Does Generalized Joint Laxity Affect Postoperative Alignment and Clinical Outcomes Following Medial Opening-Wedge High Tibial Osteotomy? J. Arthroplast. 2023, 38, 662–667. [Google Scholar] [CrossRef] [Scilit] [PubMed]
- Sukha, K.; Thremthakanpon, W.; Sutthapakti, B.; Benjawongsathien, K.; Hirunthanawiwat, T.; Wanitcharoenporn, W.; Inta-Ngam, T.; Laoruengthana, A. Prediction model for abnormal joint line obliquity after open wedge high tibial osteotomy using knee radiographic parameters. Knee Surg. Relat. Res. 2026, 38, 37. [Google Scholar] [CrossRef] [Scilit] [PubMed]

Disclaimer/Publisher’s Note: The statements, opinions and data contained in all publications are solely those of the individual author(s) and contributor(s) and not of MDPI and/or the editor(s). MDPI and/or the editor(s) disclaim responsibility for any injury to people or property resulting from any ideas, methods, instructions or products referred to in the content. |
© 2026 by the authors. Published by MDPI on behalf of the Lithuanian University of Health Sciences. Licensee MDPI, Basel, Switzerland. This article is an open access article distributed under the terms and conditions of the Creative Commons Attribution (CC BY) license.