


Abstract
Alzheimer’s disease (AD) presents a critical global health challenge requiring reliable candidate predictive features and molecular signatures. In this study, we established a leakage-controlled, transcriptomics-guided in silico machine learning framework using post-mortem brain RNA sequencing datasets. The GSE125583 dataset (N = 288) was partitioned into training (n = 231) and internal testing (n = 57) sets via a subject-aware split, while an independent external validation cohort, GSE153873 (RNA-seq, N = 30), served exclusively for external model validation. To directly evaluate classifier capacity and feature-space sensitivity, we also validated on microarray data from GSE109887 (N = 78), benchmarking models across candidate gene dimensions (top 30 and 300 DEGs). Differential expression analysis performed strictly within the training data of each outer cross-validation fold identified a compact 30-gene candidate signature. Six machine learning algorithms—GLMNET, Support Vector Machines (SVM), Partial Least Squares (PLS), Random Forest (RF), Gradient Boosting Machine (GBM), and Neural Networks (NNET)—were trained using subject-grouped 10-fold outer/5-fold inner nested cross-validation. On the primary external RNA-seq cohort, GLMNET achieved high discrimination (AUC = 0.954), while an equal-weighted GLMNET + GBM ensemble demonstrated consistent cross-cohort performance (AUC = 0.954) using frozen, out-of-fold Youden J-based decision thresholds. Cross-platform validation on the microarray cohort revealed that while regularized linear models and neural networks generalized robustly (AUC = 0.826–0.895), tree-based ensembles exhibited severe sensitivity to expanded feature spaces. Feature importance analysis consistently prioritized key candidate predictive features, including RIPOR3, PPEF1, PPARGC1A-AS1, GABRR2, and LOC100129316. Functional enrichment linked upregulated genes to extracellular matrix remodeling and focal adhesion, whereas downregulated genes mapped to mitochondrial ATP production, oxidative phosphorylation, and GABAergic neurotransmission. Overall, this leakage-controlled, biologically informed in silico framework provides a reproducible strategy for evaluating transcriptomic features for AD classification and identifies candidate predictive features that warrant validation in larger independent cohorts.
1. Introduction
Alzheimer’s disease (AD) stands as the leading cause of dementia globally and is characterized by a progressive neurodegenerative process that gradually impairs memory, cognition, and daily functioning [1,2]. As global life expectancy continues to rise, AD has emerged as a major public health challenge with considerable social, medical, and financial burdens for patients, their families, and healthcare systems [3]. The number of people living with AD is estimated to reach approximately 78 million by 2030, mainly due to the aging global population [4]. After decades of intense research, early and accurate diagnosis as well as effective disease-modifying pharmacotherapies remain challenging due to the complex molecular mechanisms underlying disease development and progression, as well as substantial biological and clinical heterogeneity.
Currently, the diagnosis of AD has historically relied on clinical symptoms and neuropsychological testing. According to the 1985 National Institute of Neurological Disorders and Stroke-Alzheimer’s Disease and Related Disorders Association (NINCDS-ADRDA) criteria, a diagnosis of probable AD was primarily based on clinical evaluation and the exclusion of other causes of dementia [5]. The diagnostic framework has subsequently evolved from a predominantly clinical approach toward a biological characterization of AD, supported by advances in fluid biomarkers and neuroimaging. Cerebrospinal fluid (CSF) biomarkers reflecting amyloid-β deposition and tau pathology, including amyloid-β and phosphorylated tau measurements, together with positron emission tomography (PET), structural magnetic resonance imaging (MRI), and other measures of neurodegeneration, have substantially improved the ability to detect AD-related pathological changes [6]. More recently, blood-based biomarkers, particularly plasma amyloid-β and phosphorylated tau, have emerged as less invasive approaches for detecting AD-related pathology and may facilitate broader clinical implementation. Nevertheless, these approaches primarily provide information on established pathological processes and may not fully capture the broader molecular changes associated with disease progression and biological heterogeneity. In addition, CSF sampling and advanced neuroimaging can remain costly, invasive, or dependent on specialized clinical infrastructure, while the performance and clinical implementation of blood-based biomarkers continue to be evaluated across diverse populations and clinical settings [7]. These considerations highlight the value of complementary molecular approaches that can capture broader disease-associated biological alterations.
Transcriptomic profiling provides such a complementary approach by measuring coordinated changes in gene expression across thousands of genes simultaneously. High-throughput RNA sequencing (RNA-seq) has emerged as a promising approach for characterizing transcriptomic changes associated with AD and provides an opportunity to identify disease-specific molecular signatures and candidate predictive features. Unlike individual pathological biomarkers, transcriptomic profiles can reflect alterations across multiple biological processes and cellular pathways, potentially capturing molecular heterogeneity that is not represented by a single pathological measure [8,9]. However, the heterogeneous cellular composition of brain tissue, together with technical variation arising from sample processing, sequencing protocols, and laboratory-specific procedures, can result in a low signal-to-noise ratio and hinder the identification of reproducible disease-associated signatures [8,9,10]. Moreover, conventional differential expression analyses typically evaluate genes individually and may identify numerous statistically significant transcripts without determining whether combinations of genes provide consistent discriminatory information across independent cohorts. Therefore, traditional differential expression analyses often identify a large number of candidate genes but may have limited ability to distinguish robust disease-related signals from technical variation and cohort-specific effects, and to identify reproducible disease-associated signatures [10,11]. Moreover, conventional differential expression analyses typically evaluate genes individually and may identify numerous statistically significant transcripts without determining whether combinations of genes provide consistent discriminatory information across independent cohorts.
Machine-learning approaches can combine information from multiple transcriptomic features to evaluate disease-associated expression patterns and their potential discriminatory value. However, the predictive performance and biological interpretability of such models depend on the selection of appropriate features, the control of overfitting, and evaluation in independent datasets [12]. However, many published transcriptomic classification models remain prone to overfitting because feature selection, data normalization, or model optimization are often performed before an appropriate separation of training and validation datasets [13,14]. We therefore established a leakage-controlled, transcriptomics-guided machine learning framework utilizing three independent human brain transcriptomic cohorts sourced from the Gene Expression Omnibus (GEO) database [15]: a primary discovery cohort (GSE125583, N = 288) and one independent external validation cohort—GSE153873 (RNA-seq, N = 30). To directly evaluate classifier capacity and feature-space sensitivity, we also validated on microarray data from GSE109887 (N = 78), where model development was benchmarked across candidate feature sets of the top 30 and 300 differentially expressed genes (DEGs). Model development, including feature selection, normalization, and hyperparameter tuning, was conducted using subject-grouped nested cross-validation within the training set to prevent information from the held-out test or external cohorts from influencing model development. To prevent information leakage, all model development procedures—including differential expression analysis, feature selection, data normalization, hyperparameter optimization, and probability threshold determination—were performed exclusively on the training data before evaluation on the internal test and external validation cohorts. Six supervised machine learning algorithms were evaluated: Elastic Net logistic regression (GLMNET), Support Vector Machine with a radial basis function kernel (SVM), Partial Least Squares (PLS), Random Forest (RF), Gradient Boosting Machine (GBM), and a single-hidden-layer Neural Network (NNET). Decision thresholds were determined from out-of-fold predictions within the training data and subsequently frozen for evaluation. Model prediction performance was subsequently evaluated across the internal test set and both independent external cohorts. Decision thresholds were determined from out-of-fold predictions within the training data and subsequently frozen for evaluation. Model prediction performance was subsequently evaluated on both the internal test set and the independent external dataset.
Finally, functional enrichment and machine-learning-based feature importance analyses were integrated to provide biological context for the identified transcriptomic signature and to prioritize candidate predictive features for further investigation. The analytical framework was designed to evaluate whether a compact transcriptomic signature could support robust and reproducible classification of Alzheimer’s disease while also providing insight into the biological processes underlying the predictive features. By integrating transcriptomic feature selection, machine-learning classification, functional enrichment, and feature-importance analyses, this study aimed not only to develop a reproducible predictive framework for Alzheimer’s disease but also to identify biologically relevant candidate genes and pathways that may warrant further mechanistic and translational investigation.
2. Materials and Methods
2.1. Data and Analytic Framework
We leveraged three independent human brain transcriptomic datasets from the Gene Expression Omnibus (GEO). GSE125583 [] was used for model development and internal evaluation, GSE153873 served as the primary independent external RNA-sequencing validation cohort, and GSE109887 was incorporated into an exploratory cross-platform evaluation using microarray data. The anatomical regions, sample distributions, and demographic characteristics of these cohorts are summarized in Table 1.
Table 1.
The datasets utilized for model training, internal testing, external model, and exploratory analyses.
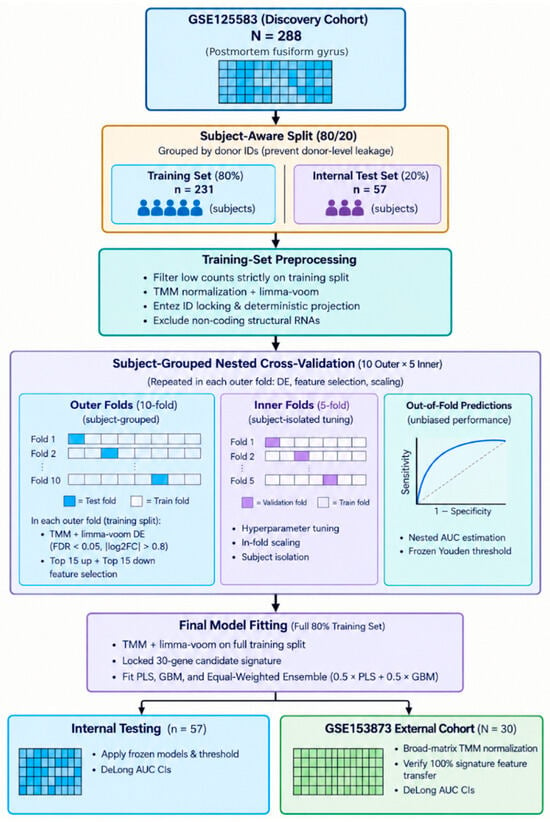
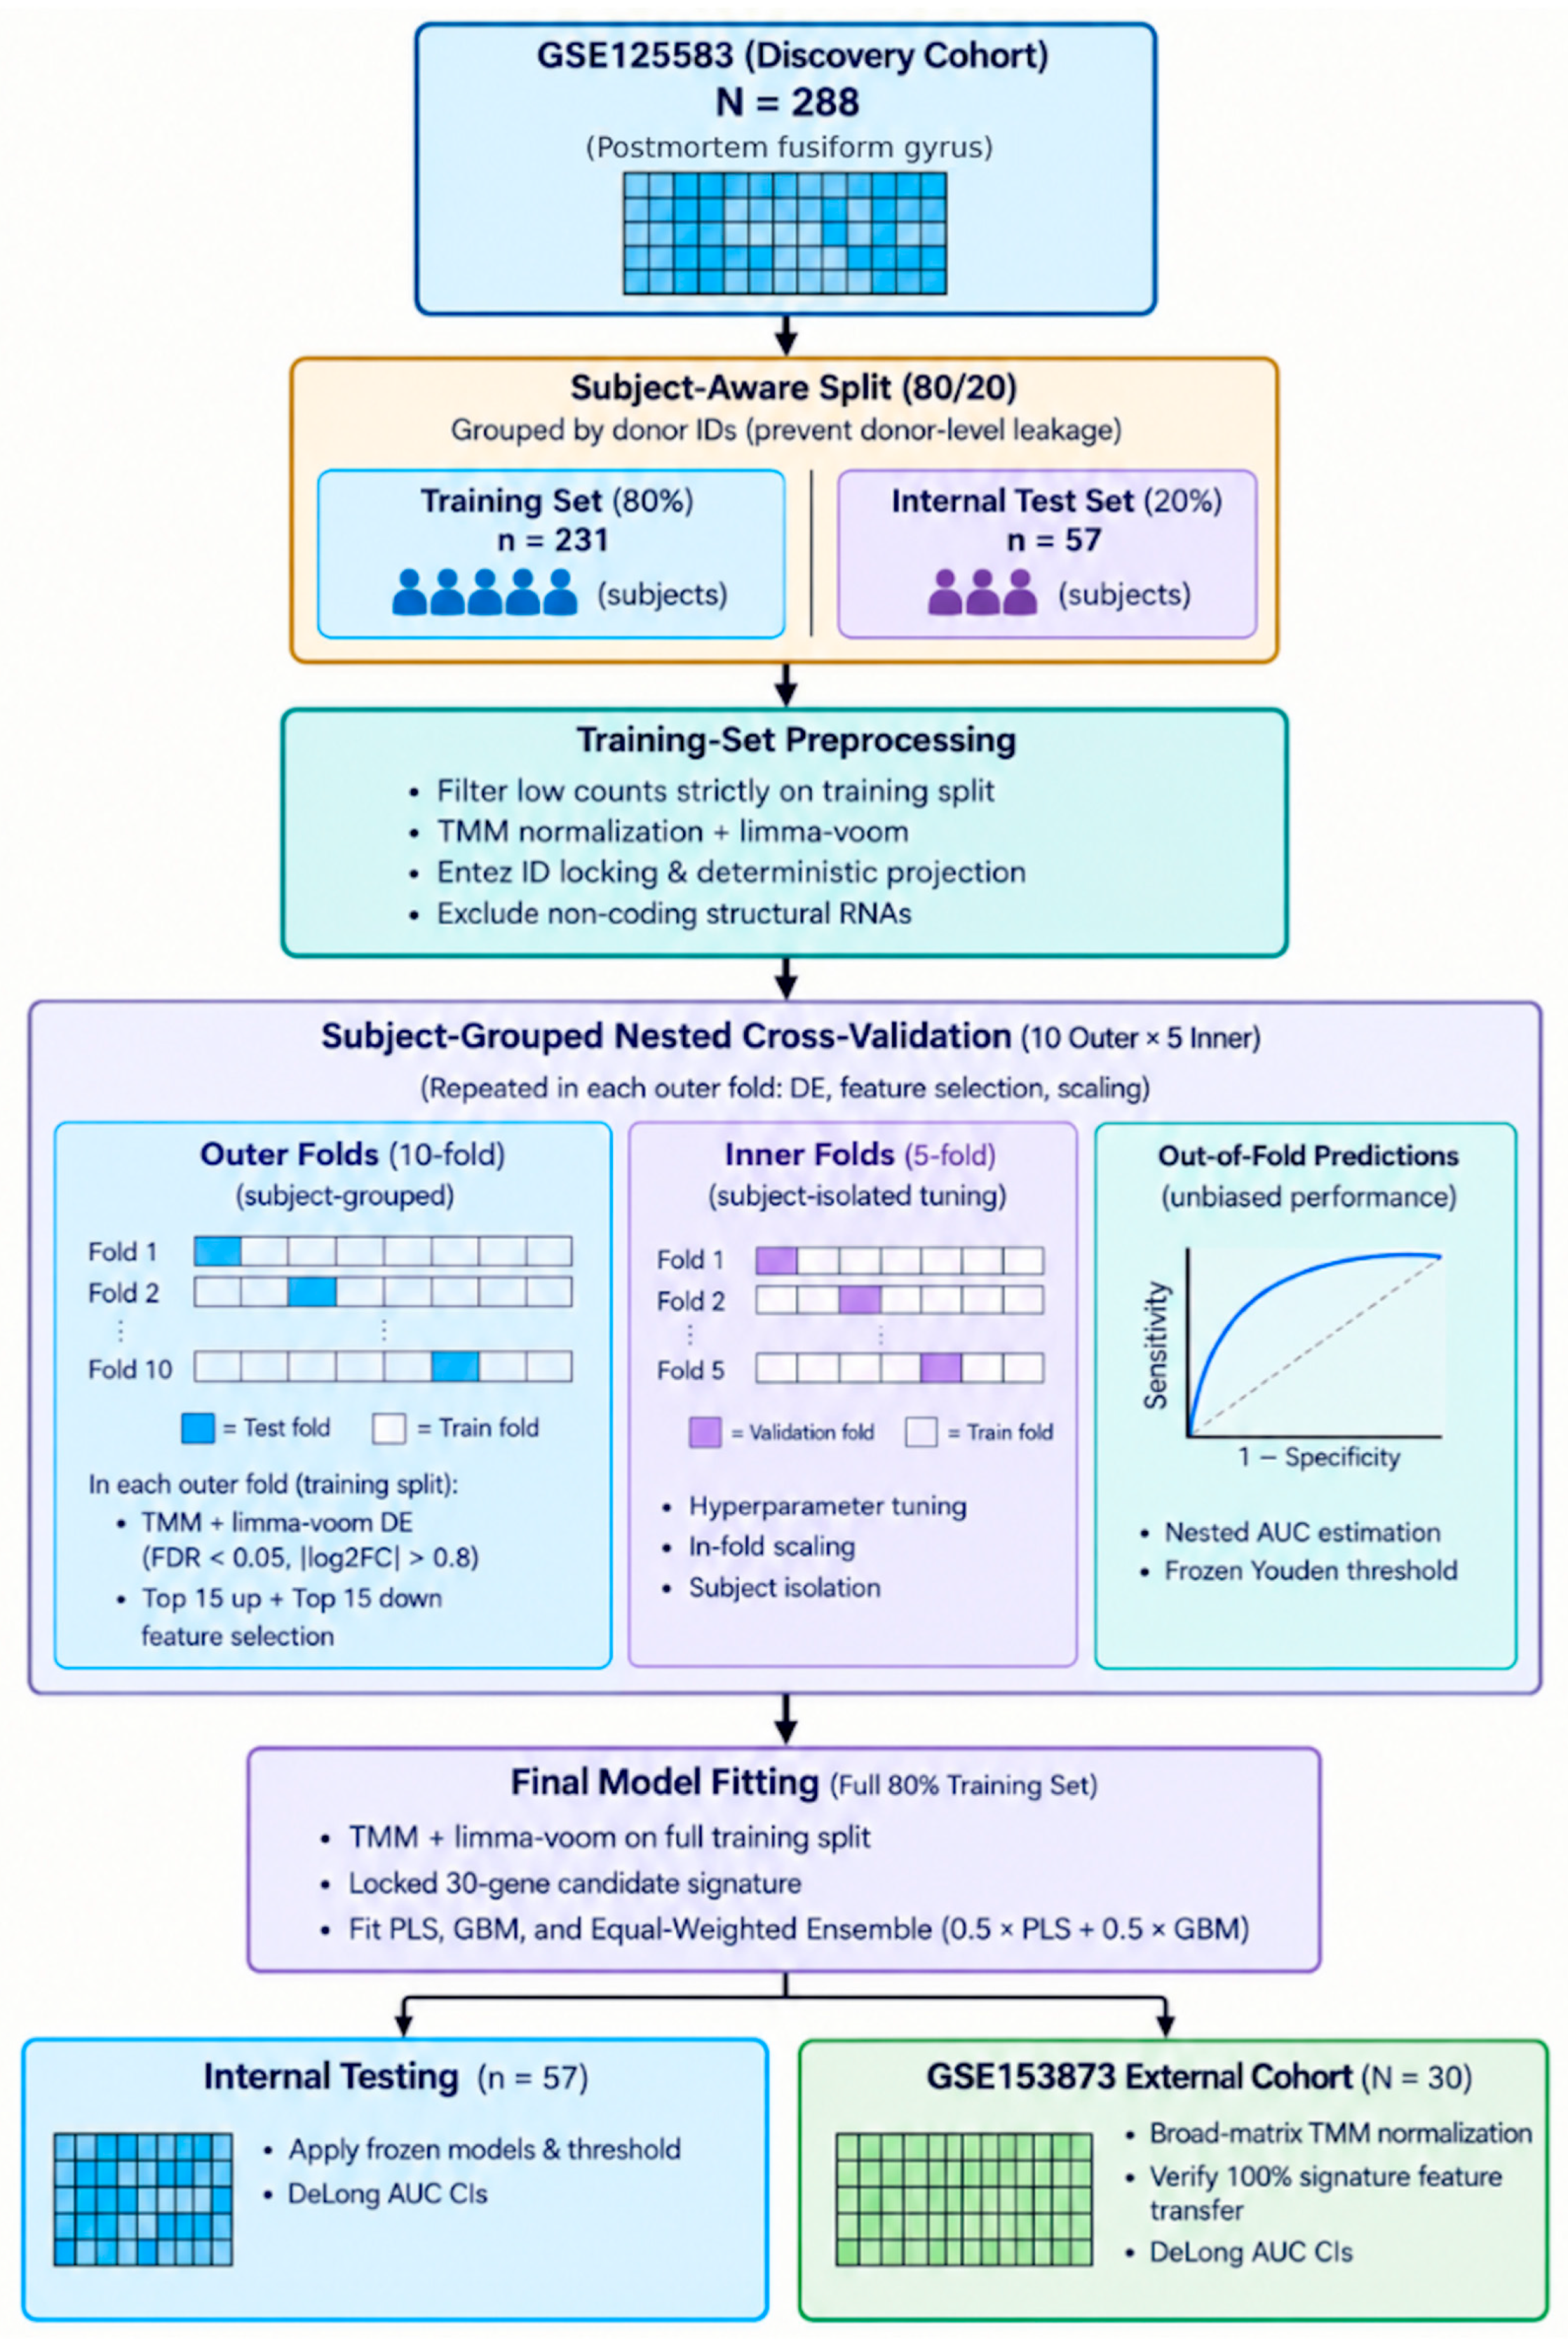
GSE125583 included 288 samples from the fusiform gyrus, following the removal of one sample due to flags identified by the data platform. Our study examined the available sample and donor metadata for GSE153873 and found that the final cohort comprised 30 samples representing individual subjects, with no evidence of repeated sampling from the same donor. To directly evaluate classifier capacity and feature-space sensitivity across technologies, we also validated on microarray data from GSE109887 (N = 78) (Figure 1). Accordingly, performance estimates were calculated at the subject level. We extracted the raw count data matrices and associated sample phenotype metadata using the GEOquery package (v2.80.0) [16] from the Gene Expression Omnibus (GEO). We dichotomized the samples into Alzheimer’s disease (AD) and control categories based on the disease categorization attributes available in the GEO datasets. The overall analytical approach is summarized in Figure 1.
Figure 1.
Methodological Workflow for AD Biomarker Discovery and Classification. Created with Gemini 3.8 Flash/3.5 Flash-Lite.
2.2. Data Processing
We performed quality-based feature selection on the raw count data prior to further analysis. We first included in feature selection all genes with a minimum of 10 raw counts in at least 10% of samples in the associated training dataset (with a minimum of two samples for smaller training datasets). Notably, for GSE125583, we performed feature filtering solely on the data from the development training subset and did not include data from the internal test set samples in this process.
We first converted feature names from Entrez IDs to standard human gene symbols using the org.Hs.eg.db package (v3.23.21) annotation database [17]. For each gene symbol, we selected the feature with the largest mean expression. We removed all mitochondrial genes, as well as features encoding ribosomal proteins (RPL and RPS) and selected small non-coding RNA genes (SNORD, SNORA, RNU, and RNA), in order to minimize the contribution of highly abundant structural and non-coding RNAs.
During model development, TMM normalization was performed separately within each training dataset used for model fitting using the edgeR package [18]. In the nested cross-validation procedure, TMM normalization was therefore repeated within each outer training fold using only the samples available in that fold, and the corresponding outer validation samples were not used to determine the normalization parameters or the feature-selection procedure. The resulting log-transformed counts per million (log-CPM) values were used for both model development and differential expression analysis. A prior count of 1 was used for log-CPM calculation to stabilize estimates for less abundantly transcribed genes.
For the final model development, the complete GSE125583 training cohort was processed using the same procedure, and the resulting locked candidate feature set was subsequently applied to the independent internal test cohort. The GSE153873 external validation cohort was processed independently using TMM normalization based solely on its own expression data and was then restricted to the predefined candidate features identified from the GSE125583 training data. Finally, as part of our extended exploratory analyses, feature-space benchmarking across candidate sets (top 30 and 300 DEGs) and cross-platform validation were evaluated on the secondary microarray cohort (GSE109887, N = 78). No gene filtering, gene intersection, feature ranking, feature selection, model tuning, or threshold optimization was performed using the external validation cohort. The external cohort was processed independently and restricted to the predefined candidate features identified exclusively from the discovery training data.
2.3. Training, Internal Test, and External Validation
The development training set and independent internal test set were composed of GSE125583 samples using a subject-aware split. Subject-aware splitting was implemented using unique donor/subject identifiers as grouping information to ensure that samples from the same donor/subject could not end up in both the training and test sets. A total of 80% of subjects contributed samples to the development training set (N = 231 samples), while the remaining 20% were held out as the independent internal test set (N = 57 samples). Subject overlap between the two sets was explicitly checked. Supervised feature selection and model development were entirely performed on the development training set. The internal test set was reserved and was not used for feature selection, hyperparameter tuning, threshold calculation, or model building.
2.4. Training-Set Differentially Expressed Gene Analysis and Candidate Signature Definition
Differentially expressed gene analysis was conducted only on the GSE125583 development training set. Differentially expressed gene analyses within the limma framework [19] were performed on the normalized expression data for each outer cross-validation training fold, with donor age and sex included as covariates. Variance estimates were stabilized using empirical Bayes moderation.
Differentially expressed genes were defined as those satisfying both a Benjamini–Hochberg false discovery rate (FDR) < 0.05 and a |log2(fold change)| > 0.8. After defining the differentially expressed genes for each outer cross-validation fold, the genes were ranked according to the differential-expression statistics, and the 15 top upregulated genes and 15 top downregulated genes were extracted, forming a compact 30-gene candidate panel.
This process of feature selection was repeated for each outer fold within the nested cross-validation scheme to avoid any contamination of gene selection by information from the validation folds. After the nested cross-validation process was completed, differentially expressed gene analyses were repeated on the 80% development training set, and a final 30-gene candidate signature consisting of 15 upregulated and 15 downregulated genes was frozen for final modeling and subsequent independent evaluation. The selection of 30 candidate features was intended to provide a compact and computationally manageable feature set for evaluating transcriptomic classification, rather than to identify all genes involved in AD pathogenesis. Selecting equal numbers of upregulated and downregulated genes allowed the candidate panel to represent both directions of disease-associated transcriptional change. The ranking procedure prioritized genes showing relatively strong differential-expression evidence within the discovery training data; however, differential-expression magnitude does not necessarily correspond to biological importance, causal involvement, or independent predictive value. Accordingly, the selected genes were treated as candidate predictive features rather than a definitive representation of the molecular complexity of AD. The effect of feature-set dimensionality was further examined through the exploratory comparison of 30- and 300-DEG feature sets.
2.5. Functional Analysis of Candidate Signature
The functional properties of the selected transcriptomic features were studied using over-representation analyses of the upregulated and downregulated gene sets separately. Gene Ontology (GO) terms corresponding to Biological Process, Molecular Function, and Cellular Component, as well as Kyoto Encyclopedia of Genes and Genomes (KEGG) pathways, were assessed with the clusterProfiler package (v4.20.3) [20]. Human gene symbols were converted using org.Hs.eg.db [17]. Benjamini–Hochberg false discovery rate correction was applied for multiple testing, and terms with an adjusted p value < 0.05 were considered enriched. The enriched functional categories and pathways were visually summarized.
2.6. Subject-Grouped Cross-Validation and Machine Learning Model Development
For each outer fold, all data-dependent preprocessing steps required for model development, including feature filtering, TMM normalization, differential expression analysis, and candidate feature selection, were performed using only the corresponding outer training samples. The 30-gene candidate feature panel was used in the development of supervised machine learning models based on the caret framework [21]. The modeling process utilized 10-fold outer and 5-fold inner subject-grouped cross-validation to ensure leakage-controlled performance estimation and hyperparameter optimization.
For each outer fold, the differentially expressed gene analysis and candidate feature selection process were repeated using only the corresponding outer training data. Thus, TMM normalization and limma–voom modeling were conducted without access to data from the outer validation fold. The 30-gene panel was extracted and used for classifier training within the outer training data.
Six classifiers were initially benchmarked within the nested cross-validation framework. GLMNET and GBM were subsequently retained as complementary final learners based on their cross-validation performance and complementary linear and nonlinear modeling characteristics; the external validation cohort was not used for model selection. For both supervised learning algorithms, hyperparameter optimization was conducted using 5-fold subject-grouped cross-validation, and ROC-AUC was used as the optimization metric. Predictors were centered and scaled using the caret preprocessing framework. Preprocessing parameters were estimated within each training fold and applied to the corresponding validation data.
For GLMNET, the mixing percentage which balances L1 and L2 penalties and the regularization strength parameter were optimized [22]. For GBM, model complexity was optimized based on the number of boosting iterations, interaction depth, learning rate, and the minimum number of observations in terminal nodes [23]. The hyperparameter search space and final optimized parameters are listed in Table S1.
The integrated prediction was achieved by forming an equal-weighted probability ensemble that combined the predicted AD probability estimates from GLMNET and GBM as an average:
Ensemble probability = 0.5 × GLMNET probability + 0.5 × GBM probability.
2.7. Nested Cross-Validation and Determination of Classification Thresholds
Overall nested cross-validation ROC-AUC estimates and classification thresholds were estimated, and overall out-of-fold predictions for the full development data were obtained from the predictions for 10 outer-fold held-out samples. This approach allowed estimates of overall model performance to be obtained after all 10-fold cross-validation cycles for each model by averaging the per-fold ROC-AUC estimates [24].
Classification thresholds were determined for each model from the overall out-of-fold ROC estimates by identifying the probability threshold corresponding to the maximum Youden’s J index (J = sensitivity + specificity − 1) [25,26]. Classification thresholds obtained in this way were then fixed and subsequently applied unchanged to the independent internal test dataset and to the external validation dataset. The threshold selection process used neither the independent internal test dataset nor the external validation data. To improve the reproducibility of the process, a fixed random seed was used during the analysis.
2.8. Final Model Fitting and Independent Model Evaluation
After completing the nested cross-validation process, candidate GLMNET and GBM models were fit using the full 80% GSE125583 development dataset with the fixed (locked) set of 30 genes for both the GLMNET and GBM models. The final equal-weighted GLMNET–GBM ensemble was then computed from the GLMNET and GBM predicted probabilities.
The fixed final GLMNET and GBM models, as well as the corresponding predefined classification thresholds, were evaluated on the independent 20% GSE125583 internal test dataset (n = 57) and in the fully independent GSE153873 external validation dataset (N = 30). Neither of the two model-evaluation datasets was used for additional feature selection, model tuning, threshold optimization, or model refitting.
Classification performance was summarized using accuracy, precision (positive predictive value), recall (sensitivity), F1-score, and ROC-AUC for classification. Confidence intervals for classification accuracy and ROC-AUC estimates were calculated at the 95% level. Confidence intervals for ROC-AUC estimates were obtained using the DeLong algorithm as implemented in the pROC package [27].
2.9. Feature-Selection Stability and Variable Importance
A measure of the stability of candidate feature selection was obtained as the frequency of selection of each gene across the 10 outer folds of cross-validation. The frequency of feature selection across these sets of resampled training data was used to characterize the repeatability of feature selection rather than as an experimental validation of the candidate features/candidate biomarkers.
For the final GLMNET and GBM models, variable importance was examined. Variable importance for the GLMNET models was based on the variable-importance function of caret. In the case of GBMs, GBM-based variable importance reflects the contribution of individual features to overall error reduction through the boosted-tree ensemble. For both GLMNET and GBM models, the variables were ranked from most important to least important based on their variable importance.
Features with relatively high variable importance for both GLMNET and GBM models (i.e., features that were consistently highly ranked across the two complementary modeling approaches) were defined as candidate predictive features. Their biological significance was interpreted in the context of their differential expression and functional enrichment analysis.
2.10. Feature-Space Sensitivity and Cross-Platform Validation Analysis
To evaluate classifier sensitivity to feature space dimensionality, model training was benchmarked using both compact (30 DEGs) and expanded (300 DEGs) candidate gene panels derived strictly within training folds. Furthermore, to assess cross-platform model transfer, microarray data from GSE109887 (N = 78, Illumina HumanHT-12 V4.0, GPL10904) was processed independently. Probe IDs were mapped to gene symbols, resolving duplicates by selecting the probe with maximum mean signal intensity. Non-finite values were excluded, and log2-transformed expression intensities were feature-scaled (centered and scaled) using scaling parameters derived exclusively from the training set. The primary 30-gene panel was evaluated on GSE109887 without model refitting or threshold re-optimization.
2.11. Statistical Analysis
All analyses were performed using R version 4.5.2. The analyses were performed using the statistical and visualization functions of edgeR (v4.10.3) [18], limma (v3.68.5) [19], caret (v7.0.1) [21], pROC (v1.19.0.1) [27], ggplot2 (v4.0.3) [28], tidyr (v1.3.2) [29], and gridExtra (v2.3.1) [30] associated R packages as appropriate. Statistical significance was, unless otherwise indicated, defined as a two-sided Benjamini–Hochberg-adjusted p-value < 0.05. Differential expression analysis was performed using the limma-voom framework, with age and sex included as covariates. Differentially expressed genes were defined using an adjusted p-value < 0.05 and an absolute log2 fold-change > 0.8. The supervised machine-learning analyses used a subject-level nested cross-validation framework with 10 outer folds and 5 inner folds. Hyperparameter tuning was performed within the inner cross-validation folds, whereas the outer folds were used to generate out-of-fold predictions for unbiased model evaluation. ROC curves and ROC-AUC were used to assess model discrimination, with 95% confidence intervals for AUC calculated using the DeLong method. Accuracy, sensitivity, specificity, positive predictive value, negative predictive value, and F1 score were calculated from confusion matrices. Model-specific classification thresholds were determined from pooled outer-fold out-of-fold predictions using Youden’s index and subsequently fixed for evaluation of the internal test and independent external validation datasets. The full analytical workflow was conducted with minimization of information leakage by restricting supervised feature selection, model tuning, and threshold setting to the appropriate training data. The data were subdivided by subject during the initial training/test split, and the same subject grouping was maintained during nested cross-validation. The internal test and independent external validation datasets were kept independent from each other until the final stage of model performance evaluation.
3. Results
3.1. Transcriptomic Datasets and Study Cohorts
To construct and validate transcriptome-based classifiers for Alzheimer’s disease (AD), brain RNA-sequencing datasets from two independent studies archived in the Gene Expression Omnibus (GEO) were analyzed. The demographic characteristics and sample distributions of both cohorts are summarized in Table 1. The discovery cohort comprised the GSE125583 dataset, which contains transcriptomic profiles generated from the fusiform gyrus. One sample lacking demographic information (age and sex) was excluded prior to analysis, yielding a total of 288 samples. To establish a leakage-free analytical framework, the cohort was divided according to disease status and randomly divided into a training set (80%, n = 231) and an internal test set (20%, n = 57), preserving the proportion of AD and non-AD samples in each subset.
The training cohort comprised 231 samples, including 175 AD samples (75.8%). The cohort had a mean age of 84.18 ± 7.94 years (60–103 years), and 56.28% (n = 130) of the participants were male. The internal test cohort comprised 57 samples, including 43 AD samples (75.4%), with an average age of 84.58 ± 7.62 years (60–99 years); 28 participants (49.23%) were male. External validation relied on the GSE153873 dataset to determine whether the prediction models remained applicable in an independent population representing different brain regions. This validation cohort consisted of 30 transcriptomic brain samples obtained from the frontal cortex and striatum, of which 12 (40%) corresponded to AD cases. The average participant age was 63.6 ± 9.4 years (42–79 years), and 90.3% (n = 27) were male. Compared with the discovery cohort, the external validation cohort was younger and had a substantially higher proportion of male participants, indicating differences in demographic composition between the two cohorts. In addition, the external cohort comprised transcriptomic samples from the frontal cortex and striatum rather than the fusiform gyrus represented in GSE125583, introducing an anatomical source difference that may contribute to variation in observed classification performance.
3.2. Differential Expression and Functional Characterization of Alzheimer’s Disease-Associated Genes
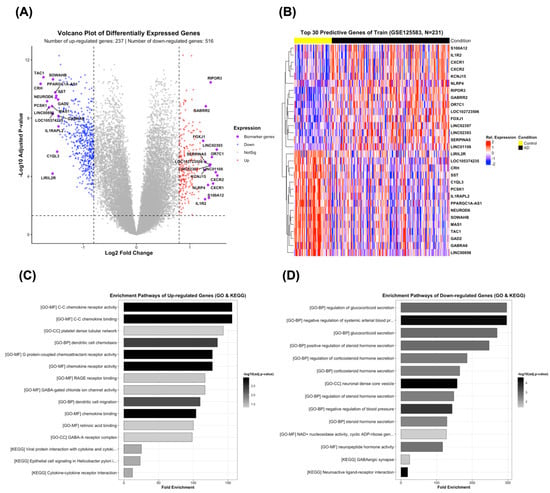
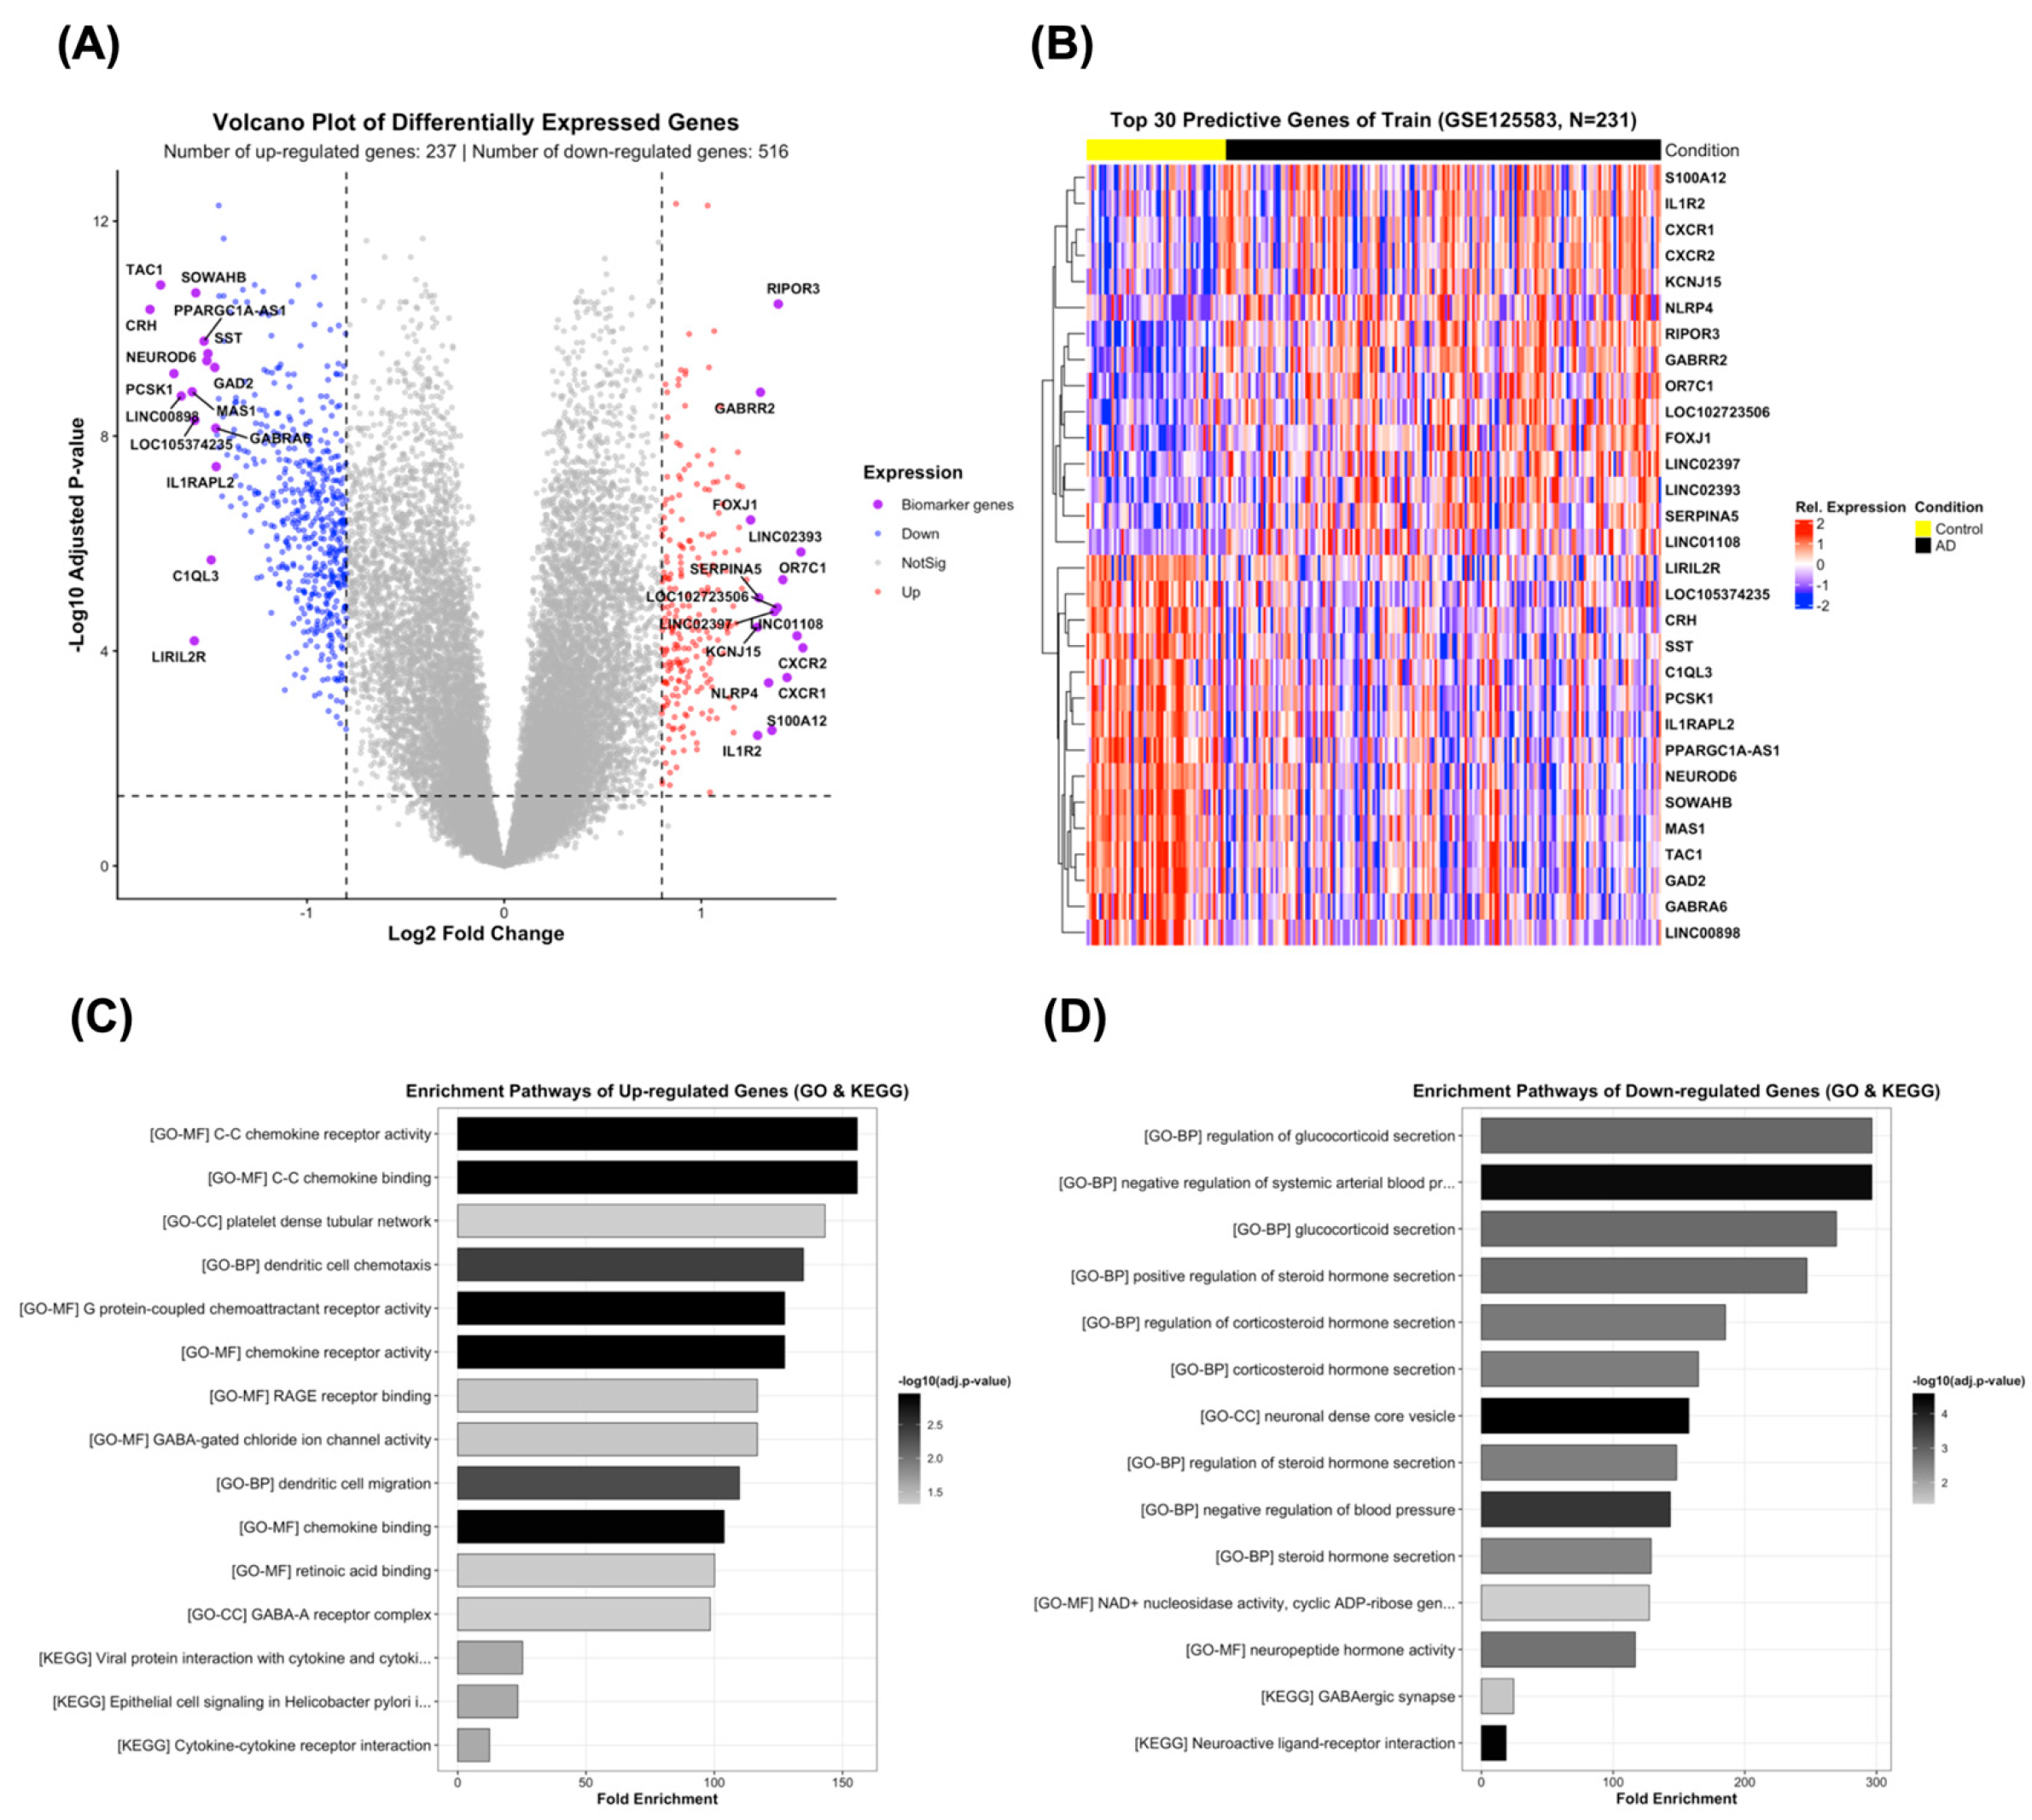
Differential expression analysis was performed using the training cohort (GSE125583; N = 231) to identify transcriptional alterations associated with Alzheimer’s disease (AD). Compared with control samples, 237 genes were significantly upregulated and 516 genes were significantly downregulated in AD, yielding a total of 753 differentially expressed genes (DEGs) (Figure 2A). The volcano plot illustrates the distribution of genes according to their log2 fold change and Benjamini–Hochberg-adjusted p-values, highlighting substantial transcriptional differences between AD and control samples.
Figure 2.
Differential expression analysis, predictive gene selection, and functional enrichment of the training dataset (GSE125583). (A) Volcano plot of differentially expressed genes (DEGs) between Alzheimer’s disease (AD) and control samples within the training cohort consists of 237 upregulated and 516 downregulated genes. (B) The heatmap of the selected top 30 predictive genes from the identified DEGs, which represents their expression patterns in the 231 training samples. (C) Gene Ontology (GO) and KEGG pathway enrichment analysis of the top 15 upregulated DEGs. (D) Gene Ontology (GO) and KEGG pathway enrichment of the top 15 downregulated DEGs.
Among the identified DEGs, a 30-gene predictive signature was constructed by selecting the top 15 upregulated and top 15 downregulated genes according to DEG ranking. These 30 genes were subsequently evaluated within the machine-learning framework as candidate predictive features for distinguishing AD from control samples (Figure 2B). The heatmap demonstrates distinct expression patterns of these genes across the training samples, supporting their potential discriminatory capacity. The selected genes included immune- and inflammatory-associated genes, as well as genes involved in neuronal signaling, neurotransmission, and neuropeptide biology, indicating that the compact signature captures multiple aspects of AD-associated transcriptional dysregulation.
To characterize the biological functions represented by the predictive signature, GO and KEGG enrichment analyses were performed separately for the top 15 upregulated and top 15 downregulated genes (Figure 2C,D). The enrichment analysis of the top 15 upregulated genes predominantly identified immune- and chemokine-related functions. GO terms included C–C chemokine receptor activity, C–C chemokine binding, platelet-derived growth factor receptor binding, dendritic cell chemotaxis and migration, G-protein-coupled chemoattractant receptor activity, chemokine receptor activity, RAGE receptor binding, and GABA-gated chloride channel activity. KEGG analysis additionally identified viral protein interaction with cytokine and cytokine receptor, epithelial cell signaling in Helicobacter pylori infection, and cytokine–cytokine receptor interaction (Figure 2C). Collectively, these findings indicate that the most strongly upregulated genes within the predictive signature are predominantly associated with immune, chemokine, and receptor-mediated signaling processes.
In contrast, enrichment analysis of the top 15 downregulated genes revealed a predominance of neuronal, endocrine, neuropeptide, and synaptic functions. GO analysis identified terms related to regulation of glucocorticoid secretion, regulation of steroid and corticosteroid hormone secretion, neuronal dense-core vesicle function, regulation of neuropeptide hormone secretion, NAD+-nucleosidase activity, and neuropeptide hormone activity. KEGG analysis further highlighted the GABAergic synapse and neuroactive ligand–receptor interaction pathways (Figure 2D). These findings indicate that the most strongly downregulated genes within the predictive signature are predominantly associated with neuronal communication, neuropeptide signaling, endocrine regulation, and synaptic function.
Overall, functional characterization of the top 15 upregulated and top 15 downregulated predictive genes revealed two complementary biological patterns: enrichment of immune- and chemokine-associated signaling among upregulated genes and disruption of neuronal, neuropeptide, endocrine, and synaptic signaling among downregulated genes. These findings provide biological context for the candidate features used in the machine-learning framework and suggest that the compact 30-gene signature captures both neuroinflammatory and neuronal/synaptic components of AD-associated transcriptional dysregulation. However, these genes should be considered candidate predictive biomarkers, and their biological and clinical utility requires independent experimental and clinical validation.
3.3. Cross-Validation Performance of Machine Learning Models
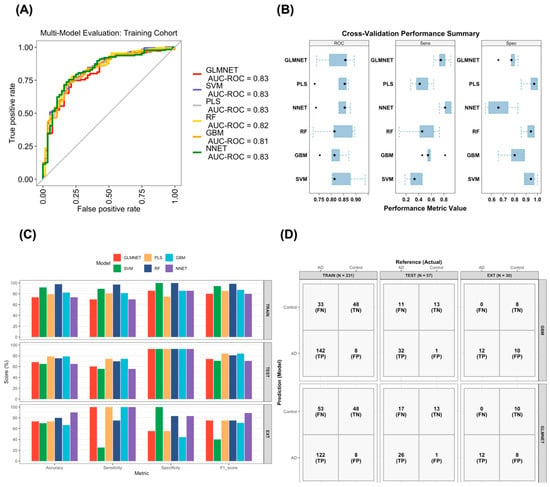
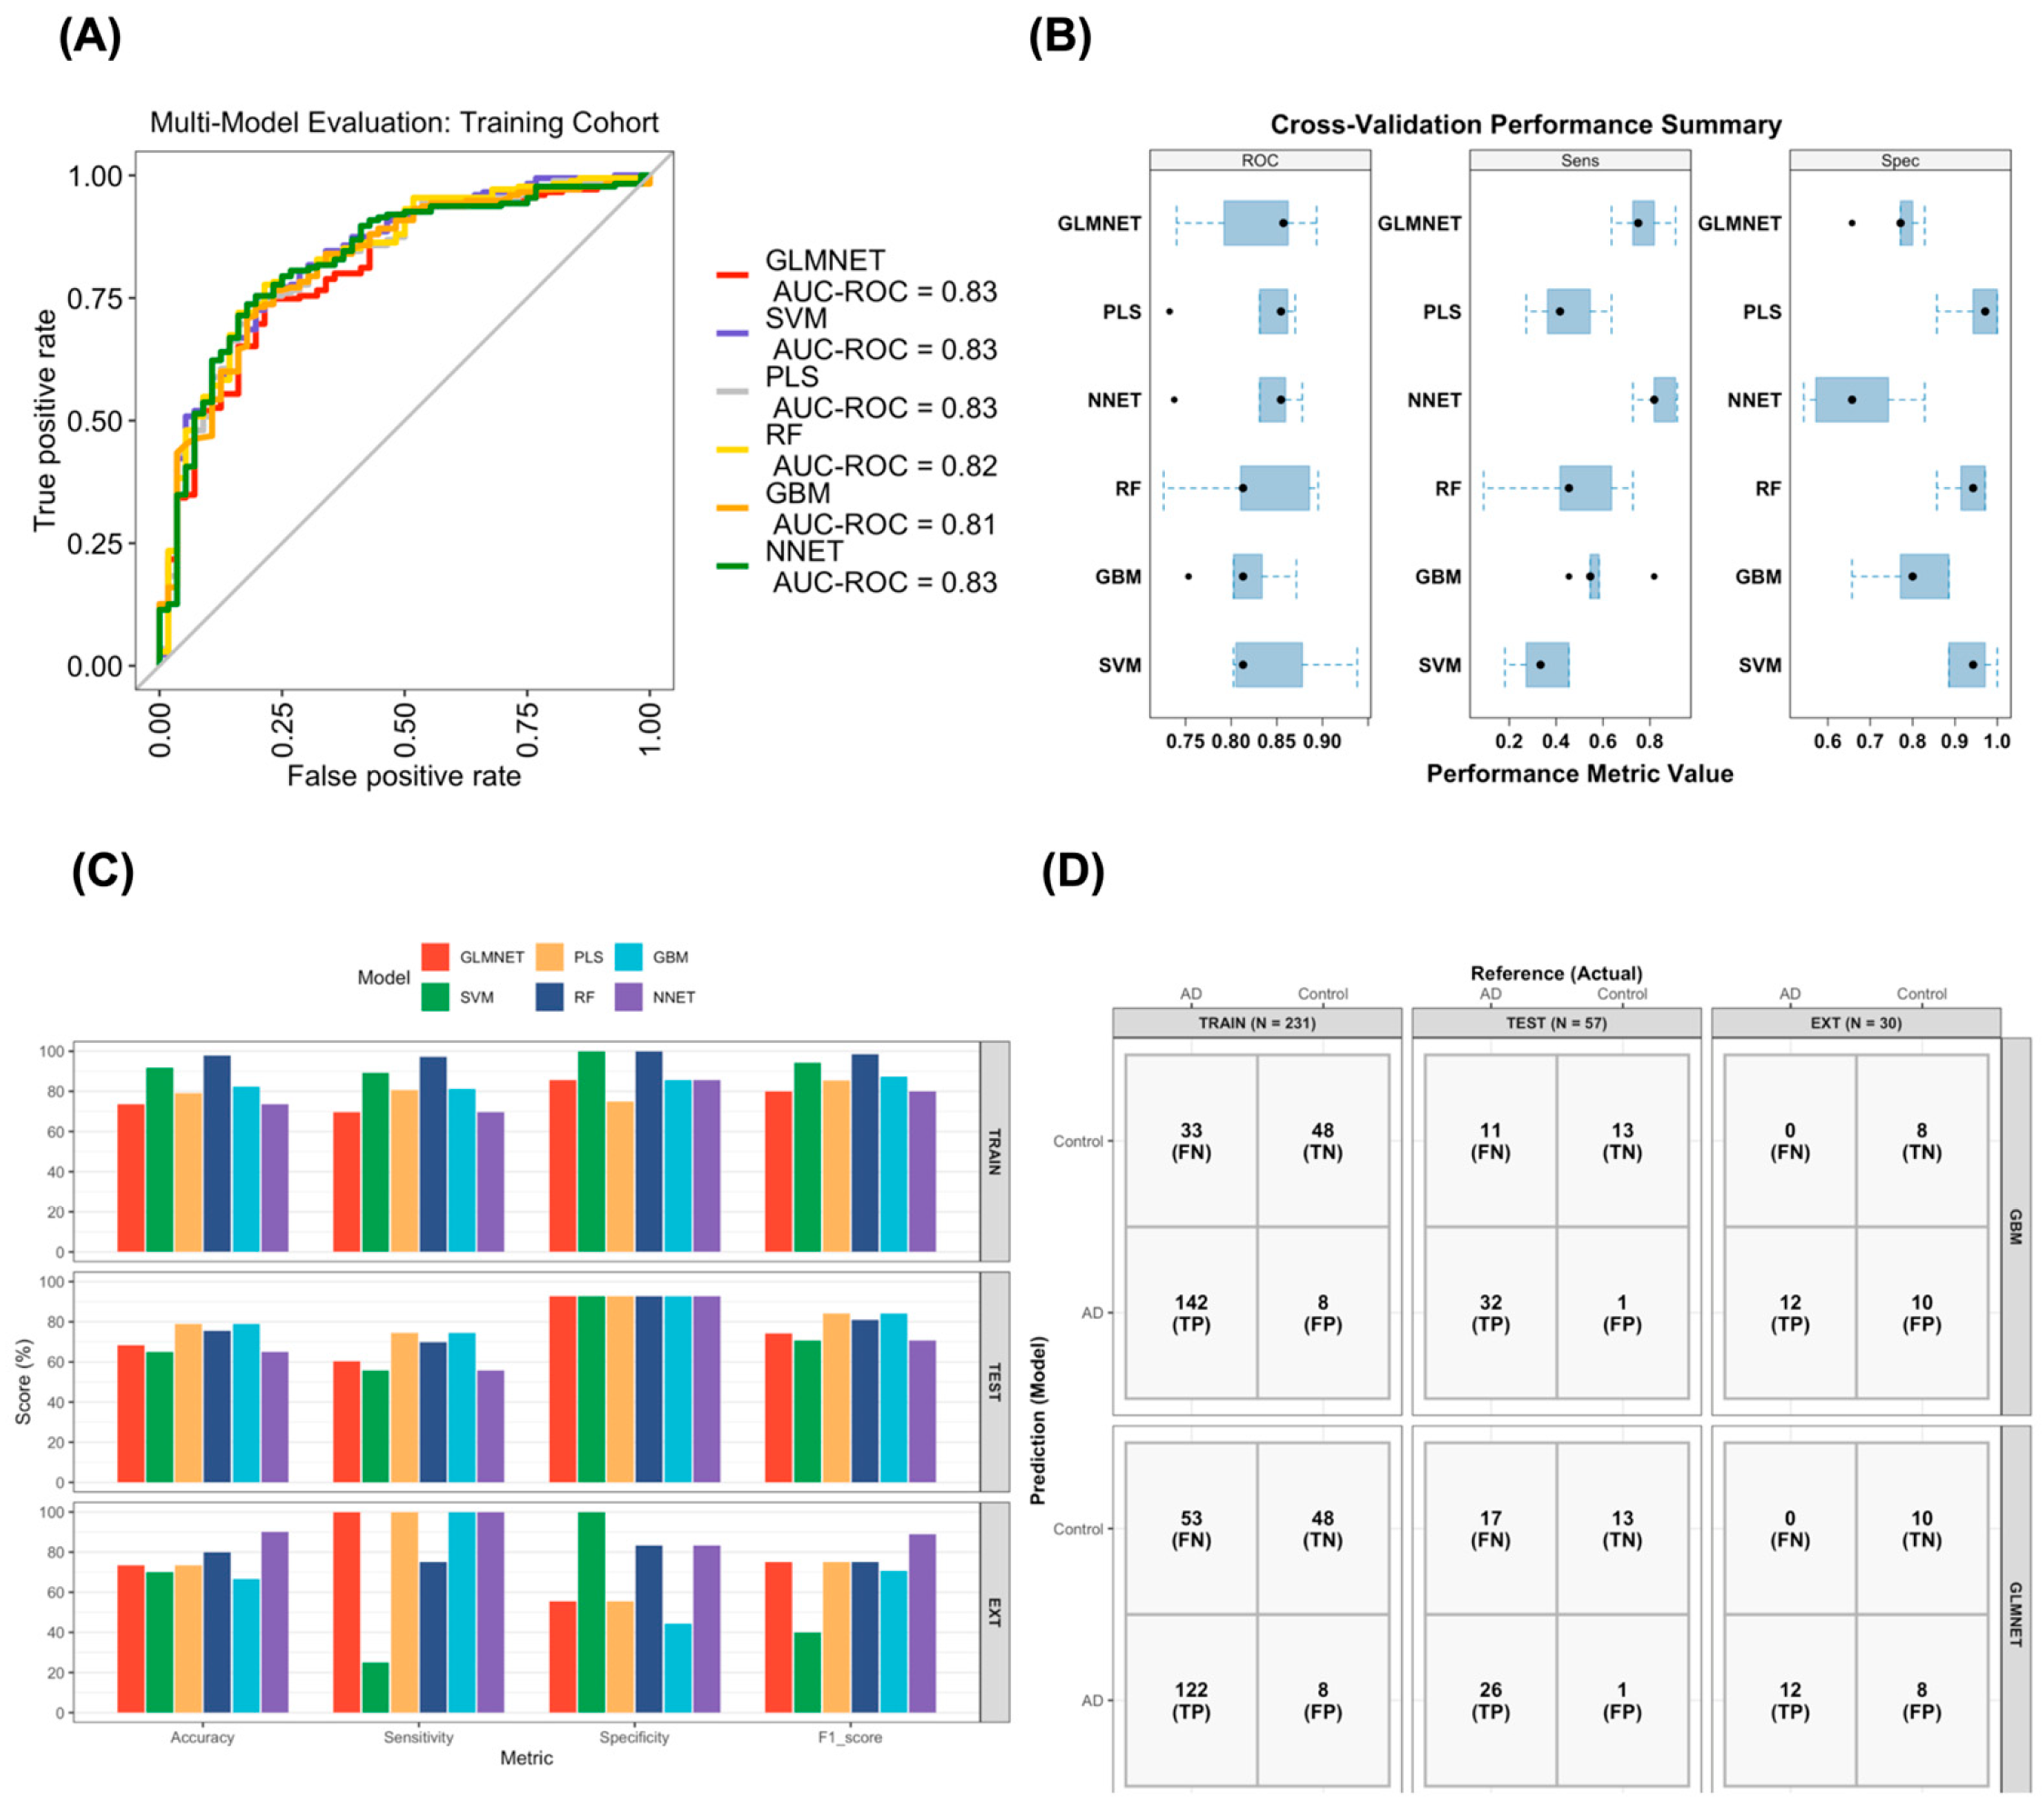
To identify the performance characteristics of six supervised machine learning algorithms for Alzheimer’s disease classification, GLMNET, SVM, PLS, RF, GBM, and NNET were trained and evaluated using the 30-gene transcriptomic signature. Initial model performance was assessed using the MLeval package with resampling-based evaluation and ROC analysis (Figure 3A). All classifiers showed good discriminative performance, with resampling-based AUC-ROC estimates ranging from 0.81 to 0.83. The highest AUC-ROC estimate (0.83) was observed for GLMNET, SVM, PLS, and NNET. The corresponding resampling distributions of classifier performance are shown in Figure 3B. These distributions indicated differences in the sensitivity and specificity profiles of the individual classifiers. Despite generally consistent discriminatory performance across the six models, with median AUC values ranging from 0.81 to 0.86, the classifiers showed distinct performance characteristics. GLMNET and NNET showed comparatively higher sensitivity (median sensitivity: 0.75–0.82), whereas SVM, PLS, and RF showed high specificity (median specificity > 0.90). GBM displayed a more balanced sensitivity–specificity profile across the resampling estimates. These complementary performance characteristics provided a rationale for evaluating an equal-weighted GLMNET–GBM ensemble, combining a regularized linear classifier with a nonlinear tree-based classifier.
Figure 3.
Evaluation of supervised machine-learning classification with a 30-gene transcriptomic signature. The 30-gene expression profiles derived from the development cohort (GSE125583, N = 288) were used as input for six supervised machine-learning models: Elastic Net (GLMNET), Support Vector Machine (SVM), Partial Least Squares (PLS), Random Forest (RF), Gradient Boosting Machine (GBM), and Neural Network (NNET). (A) Receiver operating characteristic (ROC) curves generated using the MLeval package with resampling-based model evaluation. (B) Distribution of classifier performance estimates across the resampling iterations, including AUC, sensitivity, and specificity, generated using the MLeval evaluation framework. (C) Performance of the six classifiers in development, internal test, and external validation cohorts (GSE153873) summarized by accuracy, precision, recall, and F1-score. (D) Confusion matrices showing classification outcomes for the selected models in the internal test and external validation cohorts for selected models. Rows indicate the predicted class label and columns indicate the reference (true) diagnosis.
3.4. Validation Across the Internal Test and External Cohort
To evaluate the predictive performance of the final 30-gene transcriptomic signature, six supervised machine-learning classifiers—Elastic Net (GLMNET), Support Vector Machine (SVM), Partial Least Squares (PLS), Random Forest (RF), Gradient Boosting Machine (GBM), and Neural Network (NNET)—were evaluated using the development cohort, an independent internal test cohort, and an external validation cohort (Figure 3C and Table 2). Model development was performed using 10-fold outer cross-validation with 5-fold inner cross-validation for hyperparameter selection. Decision thresholds were derived exclusively from pooled out-of-fold predictions generated in the outer cross-validation folds using Youden’s J statistic and were subsequently fixed for classification of the internal test and external validation cohorts.
Table 2.
Performance of classification models across the training, internal test, and external validation cohorts.
The classifiers showed different apparent performance on the development cohort (Table 2). RF achieved an accuracy of 97.8% and an F1-score of 98.6%, followed by SVM with an accuracy of 91.8% and an F1-score of 94.3%. GBM achieved an accuracy of 82.3% and an F1-score of 87.4%, whereas PLS achieved an accuracy of 79.2% and an F1-score of 85.5%. GLMNET and NNET both achieved an accuracy of 73.6%, with F1-scores of 80.0%. The pooled outer-fold out-of-fold ROC-AUC values were 79.0% for GLMNET, 78.8% for SVM, 80.0% for PLS, 79.0% for RF, 77.5% for GBM, and 72.3% for NNET (Table 2).
In the independent internal test cohort, PLS achieved an accuracy of 78.9% and an F1-score of 84.2%, with a sensitivity of 74.4% and precision of 97.0% (Table 2). GBM showed the same overall performance, with an accuracy of 78.9%, precision of 97.0%, sensitivity of 74.4%, and F1-score of 84.2%. RF achieved an accuracy of 75.4% and an F1-score of 81.1%, whereas GLMNET achieved an accuracy of 68.4% and an F1-score of 74.3%. SVM and NNET each achieved an accuracy of 64.9% and an F1-score of 70.6%.
In the independent external validation cohort (GSE153873; N = 30), NNET achieved the highest accuracy (90.0%) and F1-score (88.9%), with a precision of 80.0% and a sensitivity of 100.0% (12/12 AD samples correctly classified) (Table 2). RF achieved an accuracy of 80.0% and an F1-score of 75.0%. GLMNET and PLS each achieved an accuracy of 73.3% and an F1-score of 75.0%. GBM achieved an accuracy of 66.7%, with a precision of 54.5%, sensitivity of 100.0%, and an F1-score of 70.6%. SVM achieved an accuracy of 70.0%, a precision of 100.0%, a sensitivity of 25.0%, and an F1-score of 40.0%.
ROC-AUC analysis in the external validation cohort showed an AUC of 0.926 (95% CI: 0.829–1.000) for GLMNET and 0.912 (95% CI: 0.811–1.000) for GBM. The equal-weighted GLMNET–GBM ensemble achieved an AUC of 0.917 (95% CI: 0.815–1.000).
The confusion matrices shown in Figure 3D further summarize the classification results for the internal test and external validation cohorts. In the internal test cohort, GBM correctly classified 45 of 57 samples, including 32 AD samples and 13 control samples, with 11 false-negative and 1 false-positive predictions. In the external cohort, GBM correctly identified all 12 AD samples (TP = 12; FN = 0) and correctly classified 8 of 18 control samples (TN = 8; FP = 10). PLS correctly identified all 12 AD samples (TP = 12; FN = 0) and correctly classified 10 of 18 control samples (TN = 10; FP = 8). These results illustrate differences in the sensitivity and specificity profiles of the classifiers across the independent cohorts.
3.5. Performance of Individual and Ensemble Models
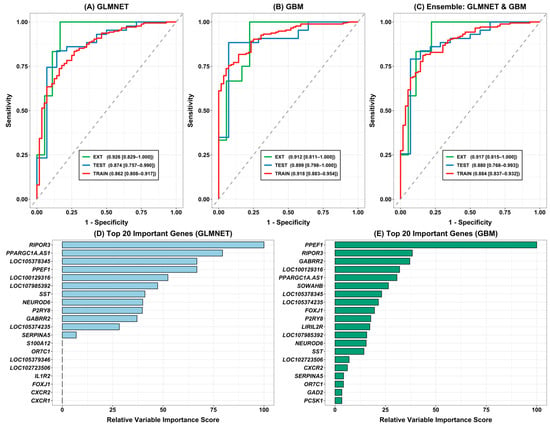
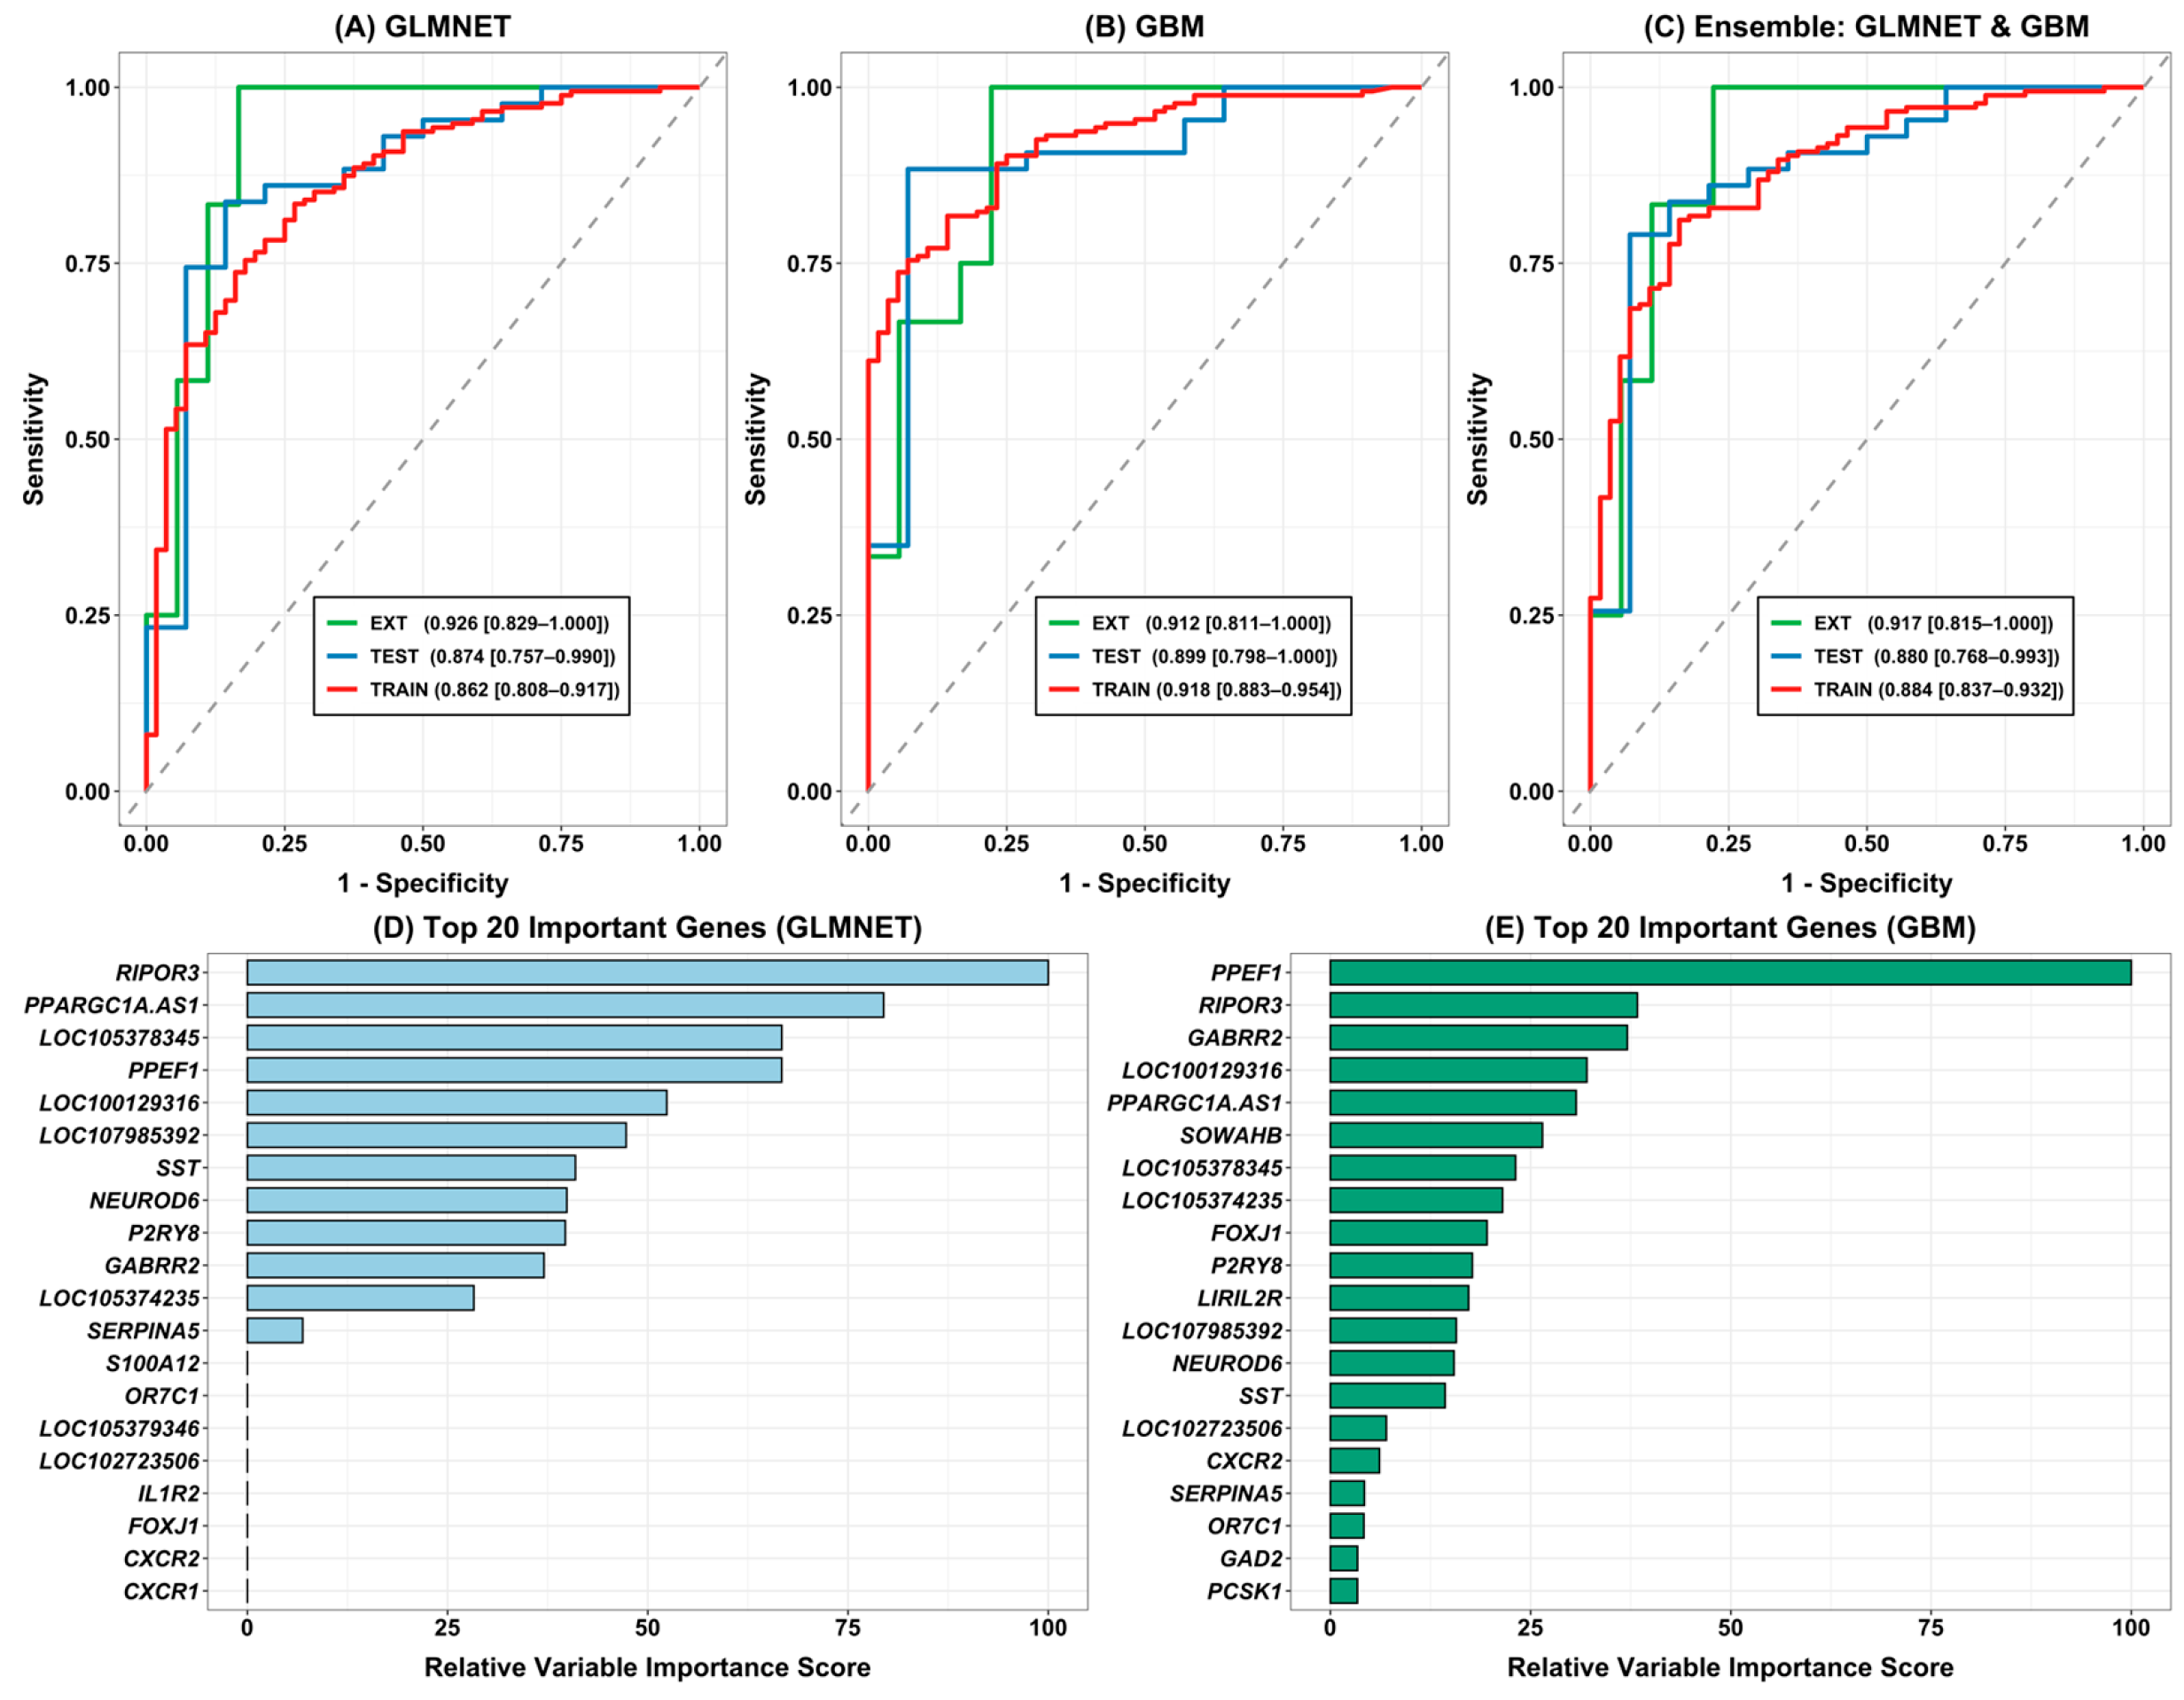
The predictive performance of Generalized Linear Models with Elastic-Net Regularization (GLMNET), Gradient Boosting Machine (GBM), and their composite ensemble (GLMNET + GBM) was systematically evaluated across the training, independent internal test, and external validation datasets (Figure 4). GLMNET and GBM were selected as the final base learners based on their cross-validation performance in the training data and their complementary model structures, with GLMNET representing regularized linear modeling and GBM capturing nonlinear feature interactions. Neither the internal test nor the external validation cohort was used for model selection. The GLMNET model demonstrated discriminatory performance, achieving an AUC of 0.862 (95% CI: 0.808–0.917) in the training cohort, 0.874 (95% CI: 0.757–0.990) in the internal test set, and 0.926 (95% CI: 0.829–1.000) in the external validation cohort (GSE153873), indicating reproducible classification performance in an independent cohort, although the external estimate was based on a relatively small sample. (Figure 4A). The GBM classifier similarly exhibited strong performance, yielding an AUC of 0.918 (95% CI: 0.883–0.954) in the training set, 0.899 (95% CI: 0.798–1.000) in the internal test set, and 0.912 (95% CI: 0.811–1.000) in the external validation dataset (Figure 4B).
Figure 4.
Predictive performance and relative feature importance of machine-learning models for AD classification. (A) ROC curves of GLMNET on the training and external validation (EXT) datasets. (B) ROC curves of GBM. (C) ROC curves of the heterogeneous GLMNET–GBM ensemble model. (D) Top 20 features ranked according to relative variable importance in the GLMNET model. (E) Top 20 features ranked according to relative variable importance in the GBM model.
To integrate the predictions of these two complementary learning approaches, GLMNET and GBM were combined using a pre-specified equal-weight probability averaging (50:50) ensemble approach. When evaluated across all three evaluation tiers, the equal-weighted ensemble achieved an AUC of 0.884 (95% CI: 0.837–0.932) in the training set, 0.880 (95% CI: 0.768–0.993) in the internal test set, and 0.917 (95% CI: 0.815–1.000) in the external validation cohort (Figure 4C). The equal-weighted GLMNET–GBM ensemble demonstrated comparable discriminatory performance across the internal and external evaluation datasets, although it did not consistently outperform the individual base learners. Thus, the ensemble was considered a complementary prediction strategy rather than a uniformly superior model.
3.6. Biological Characterization of the Selected Features
To further enhance model interpretability, we derived relative variable importance scores for both the GLMNET and GBM classifiers, highlighting the top 20 candidate predictive features (Figure 4D,E). In the GLMNET model, RIPOR3, PPARGC1A-AS1, LOC105378345, PPEF1, LOC100129316, and LOC107985392 emerged as the top predictive contributors (Figure 4D). In the GBM classifier, PPEF1, RIPOR3, GABRR2, LOC100129316, PPARGC1A-AS1, and SOWAHB were among the highest-ranked features (Figure 4E). Several features, including RIPOR3, PPEF1, PPARGC1A-AS1, LOC100129316, and GABRR2, were consistently prioritized across both models.
However, the biological interpretation of these findings requires caution. Although RIPOR3, PPEF1, and GABRR2 have previously been associated with cellular processes relevant to neuronal function, the functional characterization of PPARGC1A-AS1 and several LOC-annotated transcripts remains limited. Their prioritization by the machine-learning models indicates that they carry expression patterns useful for classification within the analyzed datasets but does not establish their specific biological functions or involvement in AD pathogenesis. Similarly, the recurrence of selected features across outer cross-validation folds reflects computational selection stability within the discovery cohort rather than independent biological replication. All prioritized transcripts should therefore be regarded as in-silico candidate predictive features requiring further investigation. Independent replication in additional human biospecimen cohorts, together with experimental validation in appropriate cellular or animal models, will be necessary to establish their biological relevance and potential translational utility.
3.7. Feature-Space Sensitivity Analysis and Cross-Cohort Reproducibility
We compared feature sets containing 30 and 300 differentially expressed genes (DEGs) to assess whether larger gene panels improved classification performance. Models were evaluated in the internal test cohort (GSE125583) and two independent cohorts: the RNA-sequencing dataset GSE153873 and the microarray dataset GSE109887. Although some classifiers showed improved apparent training performance with 300 genes, this advantage was not consistent across external cohorts (Table 3). In GSE109887, GLMNET, PLS, and NNET achieved AUCs of 0.826, 0.854, and 0.849, respectively, with 30 genes, compared with 0.888, 0.876, and 0.895 with 300 genes. In contrast, Random Forest (RF) and Gradient Boosting Machine (GBM) showed poor discrimination with 300 genes, with AUCs of 0.343 and 0.415, respectively. Overall, increasing the number of features did not consistently improve external classification performance, and the effect varied across algorithms.
Table 3.
Classification Performance Across Feature-Set Sizes in Independent RNA-Sequencing and Microarray Cohorts.
We further examined the cross-cohort expression patterns of a separate, platform-compatible 30-gene signature derived by restricting the feature-selection universe to genes represented across all three datasets. This panel shared 19 genes (63.3%) with the original 30-gene signature, indicating partial overlap between the two feature sets. PYHIN1 was the only gene showing an opposing direction of expression in the microarray cohort. However, directional agreement across cohorts did not always correspond to statistically significant differential expression (Table S2). Given the distinct feature-selection universe used to derive this panel, it was considered a separate exploratory signature rather than a direct validation of the original 30-gene panel.
Together, these findings indicate that larger feature sets do not necessarily improve classification across independent cohorts, while the platform-compatible signature shows substantial agreement in expression direction. However, gene-level directional concordance and predictive performance represent distinct forms of evidence. Further independent validation is therefore needed to establish the reproducibility and generalizability of these candidate signatures.
4. Discussion
Herein, we developed a leakage-controlled, transcriptomics-driven machine learning framework for Alzheimer’s disease (AD) classification using RNA sequencing data from post-mortem brain tissue. To minimize optimistic bias and ensure realistic generalizability, critical discovery operations, including differential expression, feature selection, gene mapping, TMM normalization, and hyperparameter tuning, were confined to the training set alone. This analytical pipeline facilitated the identification of a concise candidate 30-gene predictive signature consisting of the top 15 upregulated and top 15 downregulated genes by differential expression in AD. The classification performance of the 30-gene signature was tested on an internal test cohort and an independent external post-mortem brain dataset, GSE153873, comprising distinct subjects and different brain regions and technical parameters, thereby allowing assessment of cross-cohort reproducibility. To systematically address model capacity and feature-space sensitivity, we further benchmarked classifier performance across expanded feature spaces (top 30 and 300 DEGs) and evaluated cross-technology stability on a secondary microarray validation cohort (GSE109887, N = 78).
A primary consideration in interpreting cross-cohort classification performance is the biological and technical heterogeneity across datasets. As shown in Table 1, the discovery cohort (GSE125583, fusiform gyrus) represents late-stage AD pathology in an older demographic (84.58 ± 7.62 years), whereas the primary external RNA-seq cohort (GSE153873, frontal cortex and striatum) represented a younger population (63.6 ± 9.4 years). Furthermore, bulk brain tissue transcriptomes reflect composite cellular signals from neurons, glia, and vasculature. The maintenance of high discrimination (AUC > 0.91) across distinct anatomical regions and age profiles demonstrates that the 30-gene panel captures core transcriptional features of neurodegeneration, rather than region-restricted artifacts.
The secondary microarray cohort (GSE109887) represented the middle temporal gyrus and was generated using a different transcriptomic profiling technology. These differences introduce potential sources of heterogeneity related to anatomical region, age distribution, sex composition, tissue cellular composition, and platform-specific measurement characteristics. Although age and sex were included as covariates in the discovery differential-expression analysis, these adjustments do not eliminate all potential confounding effects or account for region-specific transcriptional differences during cross-cohort model transfer. Furthermore, the absence of harmonized individual-level clinical and pathological covariates across all datasets limits the extent to which these factors can be independently evaluated. Consequently, the observed external classification performance should be interpreted as evidence of predictive discrimination across heterogeneous post-mortem brain cohorts rather than proof that the identified features represent region-independent or demographically invariant AD signatures.
A key methodological feature of our computational pipeline is the independent re-application of feature selection strictly within the scope of each outer fold of a subject-grouped 10-fold outer/5-fold inner nested cross-validation scheme [31,32]. During each outer fold, differential expression screening with limma-voom (Ritchie et al., 2015) [19] generated candidate features with BH-adjusted p < 0.05 and |log2(FC)| > 0.8 with the top 15 upregulated and 15 downregulated genes ranked according to the differential-expression statistics. The stability of feature selection across outer folds revealed that candidate predictive features including RIPOR3, PPEF1, PPARGC1A-AS1, and GABRR2 were repeatedly selected across multiple separate folds, indicating that these features were repeatedly identified across different training subsets rather than being driven by a single data partition. This selection stability supports their computational reproducibility, although it does not by itself establish biological relevance or causality.
Among the examined classifiers on the primary RNA-seq validation dataset, GLMNET achieved the highest external validation AUC (0.926; 95% CI: 0.829–1.000), while Gradient Boosting Machines (GBM) also showed strong performance, with an AUC of 0.912 (95% CI: 0.811–1.000). These complementary performance profiles motivated the evaluation of an equal-weighted (50:50) GLMNET–GBM ensemble based on probability averaging. GLMNET, a regularized linear logistic model, is effective for additive gene-expression trends with monotonic effects while remaining robust to high-dimensional multicollinearity [33]. GBM, on the other hand, is a non-linear tree-based ensemble that models higher-order gene–gene interactions that are not readily captured by linear models [34]. Probability averaging provided a consolidated prediction output integrating the contributions of the two base learners. However, the ensemble did not consistently improve discriminatory performance relative to the individual classifiers across the training, internal test, and external validation datasets. In the external validation cohort, the ensemble AUC (0.917) was slightly lower than that of GLMNET (0.926) but higher than that of GBM (0.912). Similarly, its internal test AUC (0.880) was lower than that of GBM (0.899) but slightly higher than that of GLMNET (0.874). Therefore, the ensemble should be interpreted as an alternative strategy for integrating complementary prediction outputs rather than as a universally superior classifier.
The differential cross-platform behavior of the classification algorithms may be related to their underlying learning mechanisms and their sensitivity to changes in predictor distributions. Tree-based ensembles, including Random Forest and Gradient Boosting Machines, construct decision boundaries through sequential or aggregated feature-specific splitting rules. Consequently, changes in gene-expression distributions arising from platform-specific probe characteristics, hybridization efficiency, dynamic range, and measurement noise may alter the optimal splitting thresholds learned during model development. When the feature space is expanded, the inclusion of additional weakly informative or noisy predictors may further increase the opportunity for unstable feature splits and reduce the transferability of learned decision boundaries. A compact feature panel can theoretically mitigate some of these effects by reducing dimensionality and limiting exposure to irrelevant predictors. However, the present results indicate that dimensionality reduction alone was insufficient to ensure satisfactory cross-platform discrimination for RF and GBM, as both algorithms exhibited low AUC values even with the 30-gene panel.
However, our extended feature-space sensitivity analysis revealed that while larger candidate feature dimensions (300 DEGs) inflated internal training metrics, non-linear tree-based models (RF and GBM) suffered significant performance degradation when migrating across assay technologies to the secondary microarray cohort (EXT1, GSE109887). To further examine cross-cohort reproducibility, we evaluated a separate platform-compatible 30-gene signature derived after restricting the feature-selection universe to genes represented across the three datasets. This panel shared 19 genes (63.3%) with the original signature. Among genes with available expression estimates, all 24 genes in GSE153873 showed directions consistent with the discovery cohort, as did 29 of 30 genes in GSE109887; PYHIN1 was the only gene with an opposing direction in the microarray cohort. However, directional agreement did not consistently correspond to statistically significant differential expression across cohorts (Table S2). These findings provide evidence of substantial cross-cohort consistency in expression direction, but should be interpreted separately from classifier performance. Because the shared-gene restriction resulted in a distinct feature-selection universe, this analysis represents an exploratory assessment of cross-platform reproducibility rather than direct validation of the original signature.
In contrast, regularized linear models (GLMNET, PLS) and shallow neural networks (NNET) trained on the compact 30-gene panel maintained stable cross-platform discrimination (AUC = 0.826–0.849), underscoring the practical utility of concise feature signatures for cross-platform translation. Through these complementary learning paradigms, the ensemble combined the low-variance stability of regularized linear models with the non-linear flexibility of gradient boosting. The ensemble showed comparable discriminatory performance across the training, internal test, and independent external cohorts, although the relatively small external cohort limits the precision with which this performance can be estimated. The training (AUC = 0.884), internal test (AUC = 0.880), and independent external validation cohorts (AUC = 0.917) showed broadly comparable discriminatory performance, supporting the potential of complementary linear and non-linear models to capture reproducible transcriptomic patterns associated with AD classification. There is also notable variation in performance across classifier architectures when evaluated on different datasets. For example, Random Forest (RF) exhibited near-perfect apparent training performance (97.8% accuracy), which dropped markedly on the internal test set (75.4% accuracy). In contrast, regularized linear models like GLMNET yielded a lower apparent training accuracy (73.6%) but achieved an external AUC of 0.926. The findings in this work concur with and build upon existing benchmark results for transcriptomic classification in neurodegenerative studies [35,36]. Although high classification metrics have been reported in past machine learning studies using Gene Expression Omnibus (GEO) repositories, many pipelines employ global gene filters or batch adjustments across the full data pool prior to the train/test split, inadvertently introducing feature leakage across sets and artificially inflating reported performance [37]. Our framework enforces rigorous outer-fold feature isolation and applies a frozen decision boundary based on Youden’s J statistic derived exclusively from out-of-fold predictions, thereby providing a more conservative assessment of classification performance under strict data separation.
On the independent external cohort (GSE153873), the frozen decision boundary achieved 100% sensitivity with moderate specificity (50.0%). This shift in operating conditions reflects potential distributional differences due to anatomical and technical variation across cohorts: the discovery cohort (GSE125583) was derived from the fusiform gyrus, while the external cohort comprised a combination of the frontal cortex and striatum [38], and the secondary external microarray cohort (GSE109887) targeted the middle temporal gyrus. Demographic and platform differences may also contribute to the observed performance across datasets: the primary external RNA-seq cohort was notably younger and had a higher proportion of male participants than the discovery cohort, whereas the secondary microarray cohort exhibited comparable age and sex distributions but differed in platform hybridization technology. Rather than indicating clinical screening utility, this operating point illustrates how a decision boundary derived from one post-mortem brain cohort may behave differently when applied to an independent cohort with distinct anatomical and technical characteristics [39]. These findings underscore the importance of evaluating transcriptomic classifiers across anatomically and technically heterogeneous cohorts and, where appropriate, considering recalibration of decision thresholds in future studies. Several limitations of the current work should be noted. First, while the discovery dataset (GSE125583, N = 288) offers a well-characterized development sample, the sample size in the external validation dataset (GSE153873, N = 30) is modest and the external performance estimates should therefore be interpreted cautiously and evaluated in larger independent cohorts. Second, our analyses were conducted on bulk tissue transcriptomes that integrate expression signatures from neurons, glia, and vascular cells; investigating cell-type-specific contributions via single-nucleus RNA sequencing (snRNA-seq) will be a valuable direction for future studies [35]. Finally, the 30-gene panel, along with individual top-ranked features, represents candidate predictive features and candidate target-prioritization features identified in silico rather than validated biomarkers or therapeutic targets; experimental functional validation in cellular and animal models of AD remains essential prior to any consideration of translational therapeutic applications.
The interpretation of external classification metrics also requires consideration of the class distribution and the relatively small sample size of the validation cohort. In GSE153873, AD cases represented 40% (12/30) of the samples, whereas controls represented 60% (18/30). Although this distribution was less imbalanced than that of the internal test cohort, the limited number of subjects in each diagnostic group resulted in uncertainty in the estimated classification metrics. In particular, accuracy, positive predictive value, and negative predictive value are influenced by the underlying class distribution, whereas ROC-AUC primarily reflects the ability of a model to rank individuals according to their predicted disease probabilities. Furthermore, the classification thresholds were determined exclusively from out-of-fold predictions in the discovery cohort and subsequently applied without modification to the independent validation datasets. This frozen-threshold strategy preserves the independence of external evaluation and prevents validation-driven threshold optimization; however, it does not guarantee an equivalent sensitivity-specificity trade-off across cohorts with different demographic, anatomical, and technical characteristics. Therefore, the external classification metrics should be interpreted as estimates of model performance under a prespecified operating threshold rather than as evidence of an optimized or clinically transferable decision boundary.
Another limitation concerns the use of bulk brain transcriptomic profiles without explicit cell-type deconvolution. Bulk RNA-sequencing measurements represent the combined transcriptional activity of multiple cellular populations, including neurons, astrocytes, microglia, oligodendrocytes, and vascular-associated cells. Consequently, the observed differences in gene expression may reflect both cell-intrinsic transcriptional alterations and changes in cellular composition associated with AD pathology. Because no cell-type deconvolution or cell-type-specific expression analysis was performed in this study, the relative contributions of individual cellular populations to the identified candidate predictive features remain unresolved. Future studies incorporating reference-based deconvolution methods, single-nucleus RNA sequencing, or cell-type-specific transcriptomic datasets may help distinguish cell-composition effects from cell-intrinsic transcriptional changes and provide a more detailed understanding of the biological context of the prioritized features.
5. Conclusions
We have provided a methodologically rigorous, leakage-free in silico benchmarking platform for transcriptomic Alzheimer’s disease classification. Feature universe definition, gene mapping, differential expression ranking, and threshold selection were confined strictly to the outer training folds of subject-grouped nested cross-validation, demonstrating that high discriminatory performance (AUC > 0.91) can be achieved across fully independent post-mortem brain cohorts. Furthermore, our feature-space sensitivity analysis demonstrated that while expanding feature dimensions (top 300 DEGs) inflated internal training metrics, a compact 30-gene panel provided superior low-variance stability, particularly when transferring models to a secondary cross-platform microarray cohort (GSE109887) where non-linear tree-based models degraded under high-dimensional noise. Feature-selection stability analysis identified repeatedly prioritized candidate predictive features, including RIPOR3, PPEF1, PPARGC1A-AS1, and GABRR2. These findings represent computational prioritization within the analyzed datasets rather than biological validation or evidence of causal involvement in AD. The identified transcripts therefore warrant further investigation through independent human cohort studies and experimental validation.
Supplementary Materials
The following supporting information can be downloaded at: https://www.mdpi.com/article/10.3390/cimb48111251/s1.
Author Contributions
Conceptualization, E.G. and M.A.; methodology, E.G., S.A.A. and A.K.; software, E.G., S.A.A. and A.K.; validation, E.G., S.A.A. and A.K.; formal analysis, E.G., S.A.A. and A.K.; investigation, E.G., K.S.A., S.K.A., T.G.A., S.A.A., A.K. and M.A.; resources, E.G., S.A.A. and A.K.; writing—original draft preparation, E.G., K.S.A., S.K.A., T.G.A., S.A.A., A.K. and M.A.; writing—review and editing, E.G., K.S.A., S.K.A., T.G.A., S.A.A., A.K. and M.A.; visualization, E.G., S.A.A. and A.K.; supervision, E.G. All authors have read and agreed to the published version of the manuscript.
Funding
This research received no external funding.
Institutional Review Board Statement
The study was conducted using publicly available, fully de-identified transcriptomic datasets obtained from the National Center for Biotechnology Information (NCBI) Gene Expression Omnibus (GEO). Under Turkish national legislation—specifically Article 28, Section 1, Clause (k) of the Law on the Protection of Personal Data (Law No. 6698, published in the Official Gazette dated 7 April 2016, No. 29677) and Chapter 1, Article 3 of the Regulation on Clinical Trials of Medicinal Products and Biological Products (published in the Official Gazette dated 27 May 2023, No. 32203)—research conducted strictly on secondary, publicly available, and completely anonymized datasets that do not involve new human participant recruitment, physical intervention, or access to identifiable health records is exempt from ethics committee review. Furthermore, according to the Directives of the Turkish Ministry of Health Ethics Committees, non-interventional retrospective analyses of open-access public data repositories fall outside the mandate of local ethics committee approval.
Informed Consent Statement
Patient consent was waived because the study exclusively utilized publicly available, fully de-identified human post-mortem transcriptomic datasets.
Data Availability Statement
The raw and processed RNA-sequencing datasets analyzed in this study are publicly available in the NCBI Gene Expression Omnibus (GEO) under accession numbers GSE125583 and GSE153873. The custom computational R scripts and machine learning workflow supporting the conclusions of this article are hosted in an open-access GitHub repository: https://github.com/guven-code/predictingAD_DEGs_classifiers (accessed on 10 November 2026).
Acknowledgments
During the preparation of this manuscript/study, the authors used Gemini for the templates of the R script code and text. The authors have reviewed and edited the output and take full responsibility for the content of this publication.
Conflicts of Interest
The authors declare no conflicts of interest.
References
- Hermann, P.; Zerr, I. Rapidly Progressive Dementias—Aetiologies, Diagnosis and Management. Nat. Rev. Neurol. 2022, 18, 363–376. [Google Scholar] [CrossRef] [Scilit] [PubMed]
- Tahami Monfared, A.A.; Byrnes, M.J.; White, L.A.; Zhang, Q. Alzheimer’s Disease: Epidemiology and Clinical Progression. Neurol. Ther. 2022, 11, 553–569. [Google Scholar] [CrossRef] [Scilit] [PubMed]
- Castro, D.M.; Dillon, C.; Machnicki, G.; Allegri, R.F. The Economic Cost of Alzheimer’s Disease: Family or Public-Health Burden? Dement. Neuropsychol. 2010, 4, 262–267. [Google Scholar] [CrossRef] [Scilit] [PubMed]
- Wang, Y.; Zhu, T.; Cheng, Q.; Cui, X.; Zhang, P.; Lu, Z. Alzheimer’s Disease Neuroimaging Initiative (ADNI)* Predicting Brain Health in Community-Dwelling Elderly Populations by Integrating Gaussian Mixture Model and Plasma Biomarkers. J. Alzheimers Dis. Rep. 2025, 9, 25424823251331110. [Google Scholar] [PubMed]
- Dubois, B.; Feldman, H.H.; Jacova, C.; DeKosky, S.T.; Barberger-Gateau, P.; Cummings, J.; Delacourte, A.; Galasko, D.; Gauthier, S.; Jicha, G.A.; et al. Research Criteria for the Diagnosis of Alzheimer’s Disease: Revising the NINCDS–ADRDA Criteria. Lancet Neurol. 2007, 6, 734–746. [Google Scholar] [CrossRef] [Scilit] [PubMed]
- Zhang, H.; Wei, W.; Zhao, M.; Ma, L.; Jiang, X.; Pei, H.; Cao, Y.; Li, H. Interaction between Aβ and Tau in the Pathogenesis of Alzheimer’s Disease. Int. J. Biol. Sci. 2021, 17, 2181–2192. [Google Scholar] [CrossRef] [Scilit] [PubMed]
- Sirkis, D.W.; Bonham, L.W.; Johnson, T.P.; La Joie, R.; Yokoyama, J.S. Dissecting the Clinical Heterogeneity of Early-Onset Alzheimer’s Disease. Mol. Psychiatry 2022, 27, 2674–2688. [Google Scholar] [CrossRef] [Scilit] [PubMed]
- Hou, J.; Hess, J.L.; Zhang, C.; van Rooij, J.G.; Hearn, G.C.; Fan, C.C.; Faraone, S.V.; Fennema-Notestine, C.; Lin, S.; Escott-Price, V.; et al. Meta-analysis of Transcriptomic Studies of Blood and Six Brain Regions Identifies a Consensus of 15 Cross-tissue Mechanisms in Alzheimer’s Disease and Suggests an Origin of Cross-study Heterogeneity. Am. J. Med. Genet. B Neuropsychiatr. Genet. 2025, 198, e33019. [Google Scholar] [CrossRef] [Scilit] [PubMed]
- Mathys, H.; Boix, C.A.; Akay, L.A.; Xia, Z.; Davila-Velderrain, J.; Ng, A.P.; Jiang, X.; Abdelhady, G.; Galani, K.; Mantero, J.; et al. Single-Cell Multiregion Dissection of Alzheimer’s Disease. Nature 2024, 632, 858–868. [Google Scholar] [CrossRef] [Scilit] [PubMed]
- Zaman, A.; Drake, S.S.; Fournier, A.E. Extracellular Vesicle-Derived microRNAs as Fluid Biomarkers in Neurodegenerative Diseases: A Systematic Review. J. Neurochem. 2026, 170, e70323. [Google Scholar] [CrossRef] [Scilit] [PubMed]
- Shah, K.C.; Littlestone, E.; Ahmmad, M.R.; Wang, C.; Xu, Y.; Zhang, X. A Cross-Region Meta-Analysis and Machine Learning Identifies a 37-Gene Signature Associated with Alzheimer’s Disease. Biomedicines 2026, 14, 2032. [Google Scholar] [CrossRef] [Scilit] [PubMed]
- Cattelani, L.; Ghosh, A.; Rintala, T.J.; Fortino, V. A Comprehensive Evaluation Framework for Benchmarking Multi-Objective Feature Selection in Omics-Based Biomarker Discovery. IEEE/ACM Trans. Comput. Biol. Bioinform. 2024, 21, 2432–2446. [Google Scholar] [CrossRef] [Scilit] [PubMed]
- Desaire, H. How (Not) to Generate a Highly Predictive Biomarker Panel Using Machine Learning. J. Proteome Res. 2022, 21, 2071. [Google Scholar] [CrossRef] [Scilit] [PubMed]
- Bernett, J.; Blumenthal, D.B.; Grimm, D.G.; Haselbeck, F.; Joeres, R.; Kalinina, O.V.; List, M. Guiding Questions to Avoid Data Leakage in Biological Machine Learning Applications. Nat. Methods 2024, 21, 1444–1453. [Google Scholar] [CrossRef] [Scilit] [PubMed]
- Barrett, T.; Troup, D.B.; Wilhite, S.E.; Ledoux, P.; Evangelista, C.; Kim, I.F.; Tomashevsky, M.; Marshall, K.A.; Phillippy, K.H.; Sherman, P.M.; et al. NCBI GEO: Archive for Functional Genomics Data Sets—10 Years On. Nucleic Acids Res. 2010, 39, D1005–D1010. [Google Scholar] [CrossRef] [Scilit] [PubMed]
- Davis, S.; Meltzer, P.S. GEOquery: A Bridge between the Gene Expression Omnibus (GEO) and BioConductor. Bioinformatics 2007, 23, 1846–1847. [Google Scholar] [CrossRef] [Scilit] [PubMed]
- Carlson, M.; Falcon, S.; Pages, H.; Li, N. Org. Hs. Eg. Db: Genome Wide Annotation for Human. R Package Version 3.23.1. 2019. Available online: https://bioconductor.org/packages/org.Hs.eg.db (accessed on 10 November 2026).
- Robinson, M.D.; McCarthy, D.J.; Smyth, G.K. edgeR: A Bioconductor Package for Differential Expression Analysis of Digital Gene Expression Data. Bioinformatics 2010, 26, 139–140. [Google Scholar] [CrossRef] [Scilit] [PubMed]
- Ritchie, M.E.; Phipson, B.; Wu, D.; Hu, Y.; Law, C.W.; Shi, W.; Smyth, G.K. Limma Powers Differential Expression Analyses for RNA-Sequencing and Microarray Studies. Nucleic Acids Res. 2015, 43, e47. [Google Scholar] [CrossRef] [Scilit] [PubMed]
- Wu, T.; Hu, E.; Xu, S.; Chen, M.; Guo, P.; Dai, Z.; Feng, T.; Zhou, L.; Tang, W.; Zhan, L.; et al. clusterProfiler 4.0: A Universal Enrichment Tool for Interpreting Omics Data. Innovation 2021, 2, 100141. [Google Scholar] [CrossRef] [Scilit] [PubMed]
- Kuhn, M.; Wing, J.; Weston, S.; Williams, A.; Keefer, C.; Engelhardt, A.; Cooper, T.; Mayer, Z.; Kenkel, B.; R Core Team; et al. Package ‘Caret’. 2020. Available online: https://cran.r-project.org/web/packages/caret/index.html (accessed on 10 November 2026).
- Fahira, F.; Sadik, K.; Suhaeni, C.; Soleh, A.M. The Impact of the L1/L2 Ratio on Selection Stability and Solution Sparsity along the Elastic Net Regularization Path in High-Dimensional Genomic Data. J. Appl. Inform. Comput. 2026, 10, 273–283. [Google Scholar] [CrossRef] [Scilit]
- Li, K.; Yao, S.; Zhang, Z.; Cao, B.; Wilson, C.M.; Kalos, D.; Kuan, P.F.; Zhu, R.; Wang, X. Efficient Gradient Boosting for Prognostic Biomarker Discovery. Bioinformatics 2022, 38, 1631–1638. [Google Scholar] [CrossRef] [Scilit] [PubMed]
- Xu, M.; Mei, S.; Huang, S.; Gu, L.; Zhang, Y.; Chen, S.; Tian, Y.; Du, L.; Zhao, H.; Zhang, Z.; et al. A Multimodal Machine Learning Model for Predicting Postoperative Worsening of FOGQ in Parkinson’s Disease Following STN-DBS. Front. Neurol. 2026, 17, 1767807. [Google Scholar] [CrossRef] [Scilit] [PubMed]
- Fatima, S.U.K.; Jabber, A.; Khanam, M.H.; Khan, J.; Talukder, M.M.; Hasnat, M.A. Integrative Machine Learning Reveals Telomere-Associated Gene Modules Reflecting Neuronal Dysregulation in Alzheimer’s Disease. J. Alzheimer’s Dis. 2026, 113, 13872877261476085. [Google Scholar] [CrossRef] [Scilit] [PubMed]
- Christodoulou, R.C.; Vamvouras, G.; Papageorgiou, P.S.; Sarquis, M.D.; Petrou, V.; Rivera, L.; Morales, C.; Rivera, G.; Papageorgiou, S.G.; Vassiliou, E. Interpretable Machine Learning for Risk Stratification of Hippocampal Atrophy in Alzheimer’s Disease Using CSF Erythrocyte Load and Clinical Data. Biomedicines 2025, 13, 2689. [Google Scholar] [CrossRef] [Scilit] [PubMed]
- Robin, X.; Turck, N.; Hainard, A.; Tiberti, N.; Lisacek, F.; Sanchez, J.-C.; Müller, M.; Siegert, S.; Doering, M.; Billings, Z. Package ‘pROC’; CRAN: Wien, Austria, 2021; Available online: https://cran.r-project.org/web/packages/pROC/index.html (accessed on 10 November 2026).
- Wickham, H. Ggplot2. Wiley Interdiscip. Rev. Comput. Stat. 2011, 3, 180–185. [Google Scholar] [CrossRef] [Scilit]
- Wickham, H.; Wickham, M.H. Package ‘Tidyr’. 2017. Available online: https://cran.r-project.org/web/packages/tidyr/index.html (accessed on 10 November 2026).
- Auguie, B.; Antonov, A.; Auguie, M.B. Package ‘Gridextra’. 2017. Available online: https://cran.r-project.org/web/packages/grid/index.html (accessed on 10 November 2026).
- Cawley, G.C.; Talbot, N.L. On Over-Fitting in Model Selection and Subsequent Selection Bias in Performance Evaluation. J. Mach. Learn. Res. 2010, 11, 2079–2107. [Google Scholar]
- Vabalas, A.; Gowen, E.; Poliakoff, E.; Casson, A.J. Machine Learning Algorithm Validation with a Limited Sample Size. PLoS ONE 2019, 14, e0224365. [Google Scholar] [CrossRef] [Scilit] [PubMed]
- Friedman, J.H.; Hastie, T.; Tibshirani, R. Regularization Paths for Generalized Linear Models via Coordinate Descent. J. Stat. Softw. 2010, 33, 1–22. [Google Scholar] [CrossRef] [Scilit]
- Chen, T.; Guestrin, C. Xgboost: A Scalable Tree Boosting System; Association for Computing Machinery (ACM): New York, NY, USA, 2016; pp. 785–794. Available online: https://cran.r-project.org/web/packages/xgboost/index.html (accessed on 10 November 2026).
- Mathys, H.; Davila-Velderrain, J.; Peng, Z.; Gao, F.; Mohammadi, S.; Young, J.Z.; Menon, M.; He, L.; Abdurrob, F.; Jiang, X.; et al. Single-Cell Transcriptomic Analysis of Alzheimer’s Disease. Nature 2019, 570, 332–337, Correction in Nature 2019, 571, E1. https://doi.org/10.1038/s41586-019-1329-6. [Google Scholar] [CrossRef] [Scilit] [PubMed]
- Patel, H.; Thakkar, A.; Pandya, M.; Makwana, K. Neural Network with Deep Learning Architectures. J. Inf. Optim. Sci. 2018, 39, 31–38. [Google Scholar] [CrossRef] [Scilit]
- Kapoor, S.; Narayanan, A. Leakage and the Reproducibility Crisis in Machine-Learning-Based Science. Patterns 2023, 4, 100804. [Google Scholar] [CrossRef] [Scilit] [PubMed]
- Nativio, R.; Lan, Y.; Donahue, G.; Sidoli, S.; Berson, A.; Srinivasan, A.R.; Shcherbakova, O.; Amlie-Wolf, A.; Nie, J.; Cui, X.; et al. Author Correction: An Integrated Multi-Omics Approach Identifies Epigenetic Alterations Associated with Alzheimer’s Disease. Nat. Genet. 2020, 52, 1024–1035, Correction in Nat. Genet. 2020, 52, 1266. https://doi.org/10.1038/s41588-020-00733-7. [Google Scholar] [CrossRef] [Scilit] [PubMed]
- Steyerberg, E.W.; Vickers, A.J.; Cook, N.R.; Gerds, T.; Gonen, M.; Obuchowski, N.; Pencina, M.J.; Kattan, M.W. Assessing the Performance of Prediction Models: A Framework for Some Traditional and Novel Measures. Epidemiol. Camb. Mass 2010, 21, 128. [Google Scholar]

Disclaimer/Publisher’s Note: The statements, opinions and data contained in all publications are solely those of the individual author(s) and contributor(s) and not of MDPI and/or the editor(s). MDPI and/or the editor(s) disclaim responsibility for any injury to people or property resulting from any ideas, methods, instructions or products referred to in the content. |
© 2026 by the authors. Licensee MDPI, Basel, Switzerland. This article is an open access article distributed under the terms and conditions of the Creative Commons Attribution (CC BY) license.