


Abstract
Lactic acid bacteria (LAB) can be processed into structurally and chemically distinct preparations, but their effects on skin cells are rarely compared side by side. We compared non-neutralized spent culture supernatants (SCS-pH4), pH-neutralized supernatants (SCS-pH7), and heat-killed cells from Lactiplantibacillus plantarum TL1, TQ2, and PM195 in UVA-exposed (5 J/cm2) HaCaT keratinocytes under pretreatment and post-treatment schedules, in α-melanocyte-stimulating hormone-stimulated B16F10 cells, and in non-irradiated HaCaT cultures. When applied after UVA exposure, heat-killed cells from all three strains and SCS-pH7 from TQ2 and PM195 increased glutathione readouts relative to the UVA group, and TQ2-derived SCS-pH7 lowered LDH release, whereas SCS-pH4 increased LDH release. All preparations lowered melanin content, and SCS-pH7 from TQ2 and PM195 increased extracellular hyaluronic acid approximately five- and 3.5-fold. Preparation format was, therefore, associated with distinct cellular response patterns, and pH-neutralized supernatants, which showed favorable readouts across several endpoints without the LDH increase seen with SCS-pH4, merit priority in follow-up studies. Because medium and pH-matched controls, quantitative ROS data, and matched viability data were not available, these findings are exploratory and require controlled validation.
1. Introduction
Skin integrates physical barrier functions with environmental sensing and immune responses. Keratinocytes participate in these processes and respond to ultraviolet exposure through changes in redox homeostasis and stress-associated signaling [1,2]. UVA-associated injury has been investigated using cellular endpoints such as reactive oxygen species (ROS), glutathione, membrane injury, and antioxidant- or apoptosis-associated proteins [3,4,5]. These endpoints provide complementary information, but changes in an individual marker do not establish protection of intact skin.
Interest in LAB-derived materials includes both soluble culture products and heat-inactivated cells. These materials should be named according to their preparation rather than treated as interchangeable. The ISAPP consensus definition links postbiotics to inanimate microorganisms and/or their components that confer a host health benefit [6]. Cell-free supernatants do not automatically meet that definition. We, therefore, use the descriptive terms spent culture supernatant and heat-killed cells throughout this study and do not classify all tested preparations as postbiotics. Supernatants can contain bacterial products together with residual medium constituents, whereas washed heat-killed cells retain a different material composition [7,8,9].
Previous research provides several reasons to investigate these preparations in skin-related models. Tsai et al. examined L. rhamnosus supernatant in cell-free antioxidant, mushroom tyrosinase, and water retention assays [10]. Other work investigated LAB-derived supernatants in pigmentation-related or UV exposure models [11,12]. These studies support the investigation of cellular responses, but they do not make distinct preparations or assay systems equivalent. Likewise, HA-related responses are relevant to skin biology [13], while an increase in extracellular HA in cultured cells must be distinguished from demonstrated improvement in skin hydration.
Preparation format, strain, and treatment schedule may all influence observed responses. However, comparing formats introduces differences in composition, pH, and exposure that require appropriate controls, and measuring different times after UVA exposure complicates comparisons between pretreatment and post-treatment schedules. The present study was designed as a cell-based investigation of LAB-derived preparations, with an initial qualitative ROS screen followed by selected biochemical endpoints. It was not designed to establish active compounds or the efficacy of a finished cosmetic formulation.
We evaluated preparations from L. plantarum TL1, TQ2, and PM195 in UVA-exposed HaCaT keratinocytes and examined melanin content in stimulated B16F10 cells and HA concentration in HaCaT culture medium. The objective was to describe the response patterns under the tested conditions and identify questions for controlled follow-up studies. Inferential comparisons are restricted to those supported by the original statistical analysis.
2. Materials and Methods
2.1. Bacterial Strains and Preparation of Lab-Derived Samples
Five LAB strains were included in the initial screen: Lactiplantibacillus plantarum (formerly Lactobacillus plantarum [14]) TL1, TQ2, T23-2, and PM195, and Lactobacillus crispatus RY2. The strains were obtained from the laboratory culture collection of C.-C.T. (Department of Food Science and Technology, Hungkuang University, Taichung, Taiwan). TL1, TQ2, and PM195 were carried forward following the qualitative ROS screen; the screen did not provide a statistically validated strain ranking.
All strains were grown in de Man, Rogosa, and Sharpe (MRS) broth (Difco Laboratories, Detroit, MI, USA) at 37 °C for 18–24 h to reach the stationary phase. The cultures were centrifuged at 8000× g for 10 min at 4 °C to separate the bacterial pellets from the culture medium. One portion of the supernatant was filtered directly through a 0.22 μm membrane and used as the non-neutralized spent culture supernatant (SCS-pH4). The other portion was adjusted to pH 7.0 with 10 N NaOH and then filtered through a 0.22 μm membrane to obtain the pH-neutralized spent culture supernatant (SCS-pH7). For the heat-killed preparation, bacterial pellets were washed with phosphate-buffered saline (PBS) to remove residual medium, resuspended in PBS at 109 CFU/mL, and heated in boiling water for 20 min.
For cell treatments, 100 μL of each preparation was added to 900 μL of culture medium; thus, SCS-pH4 and SCS-pH7 were applied at a final concentration of 10% (v/v), and heat-killed cells at a final concentration equivalent to 108 cells/mL. These are nominal preparation exposures, not chemically equivalent doses. No concentration response series, uninoculated MRS medium control, or separate pH-matched medium control was included. The pH designations refer to the supernatant preparations and should not be taken as measurements of the final cell culture medium pH.
2.2. Cell Culture
HaCaT human keratinocytes, a spontaneously immortalized keratinocyte cell line, were kindly provided by Prof. Cheng-Hung Chuang’s laboratory (Department of Nutrition, Hungkuang University, Taichung, Taiwan) and maintained in Dulbecco’s modified Eagle’s medium (DMEM) supplemented with 10% fetal bovine serum (FBS) at 37 °C in a humidified atmosphere containing 5% CO2. For ROS and GSH experiments, cells were seeded into 24-well plates at 8.5 × 10⁴ cells/mL and grown to confluence. For HA measurement, HaCaT cells were seeded at 1 × 10⁵ cells/mL in DMEM containing 10% FBS.
B16F10 mouse melanoma cells (BCRC 60031) were purchased from the Bioresource Collection and Research Center (BCRC; Food Industry Research and Development Institute, Hsinchu, Taiwan) and cultured in DMEM containing 10% calf serum, 1% penicillin–streptomycin, 0.1 mM MEM non-essential amino acids, and 1 mM sodium pyruvate under the same conditions.
2.3. Uva Irradiation and Treatment Schedules
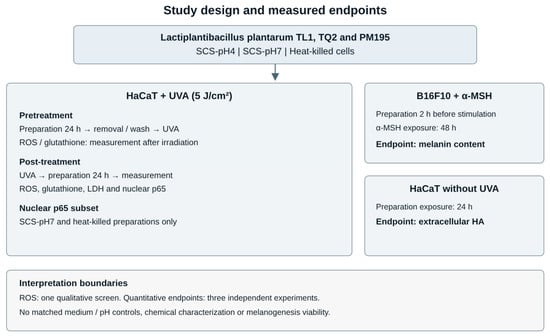
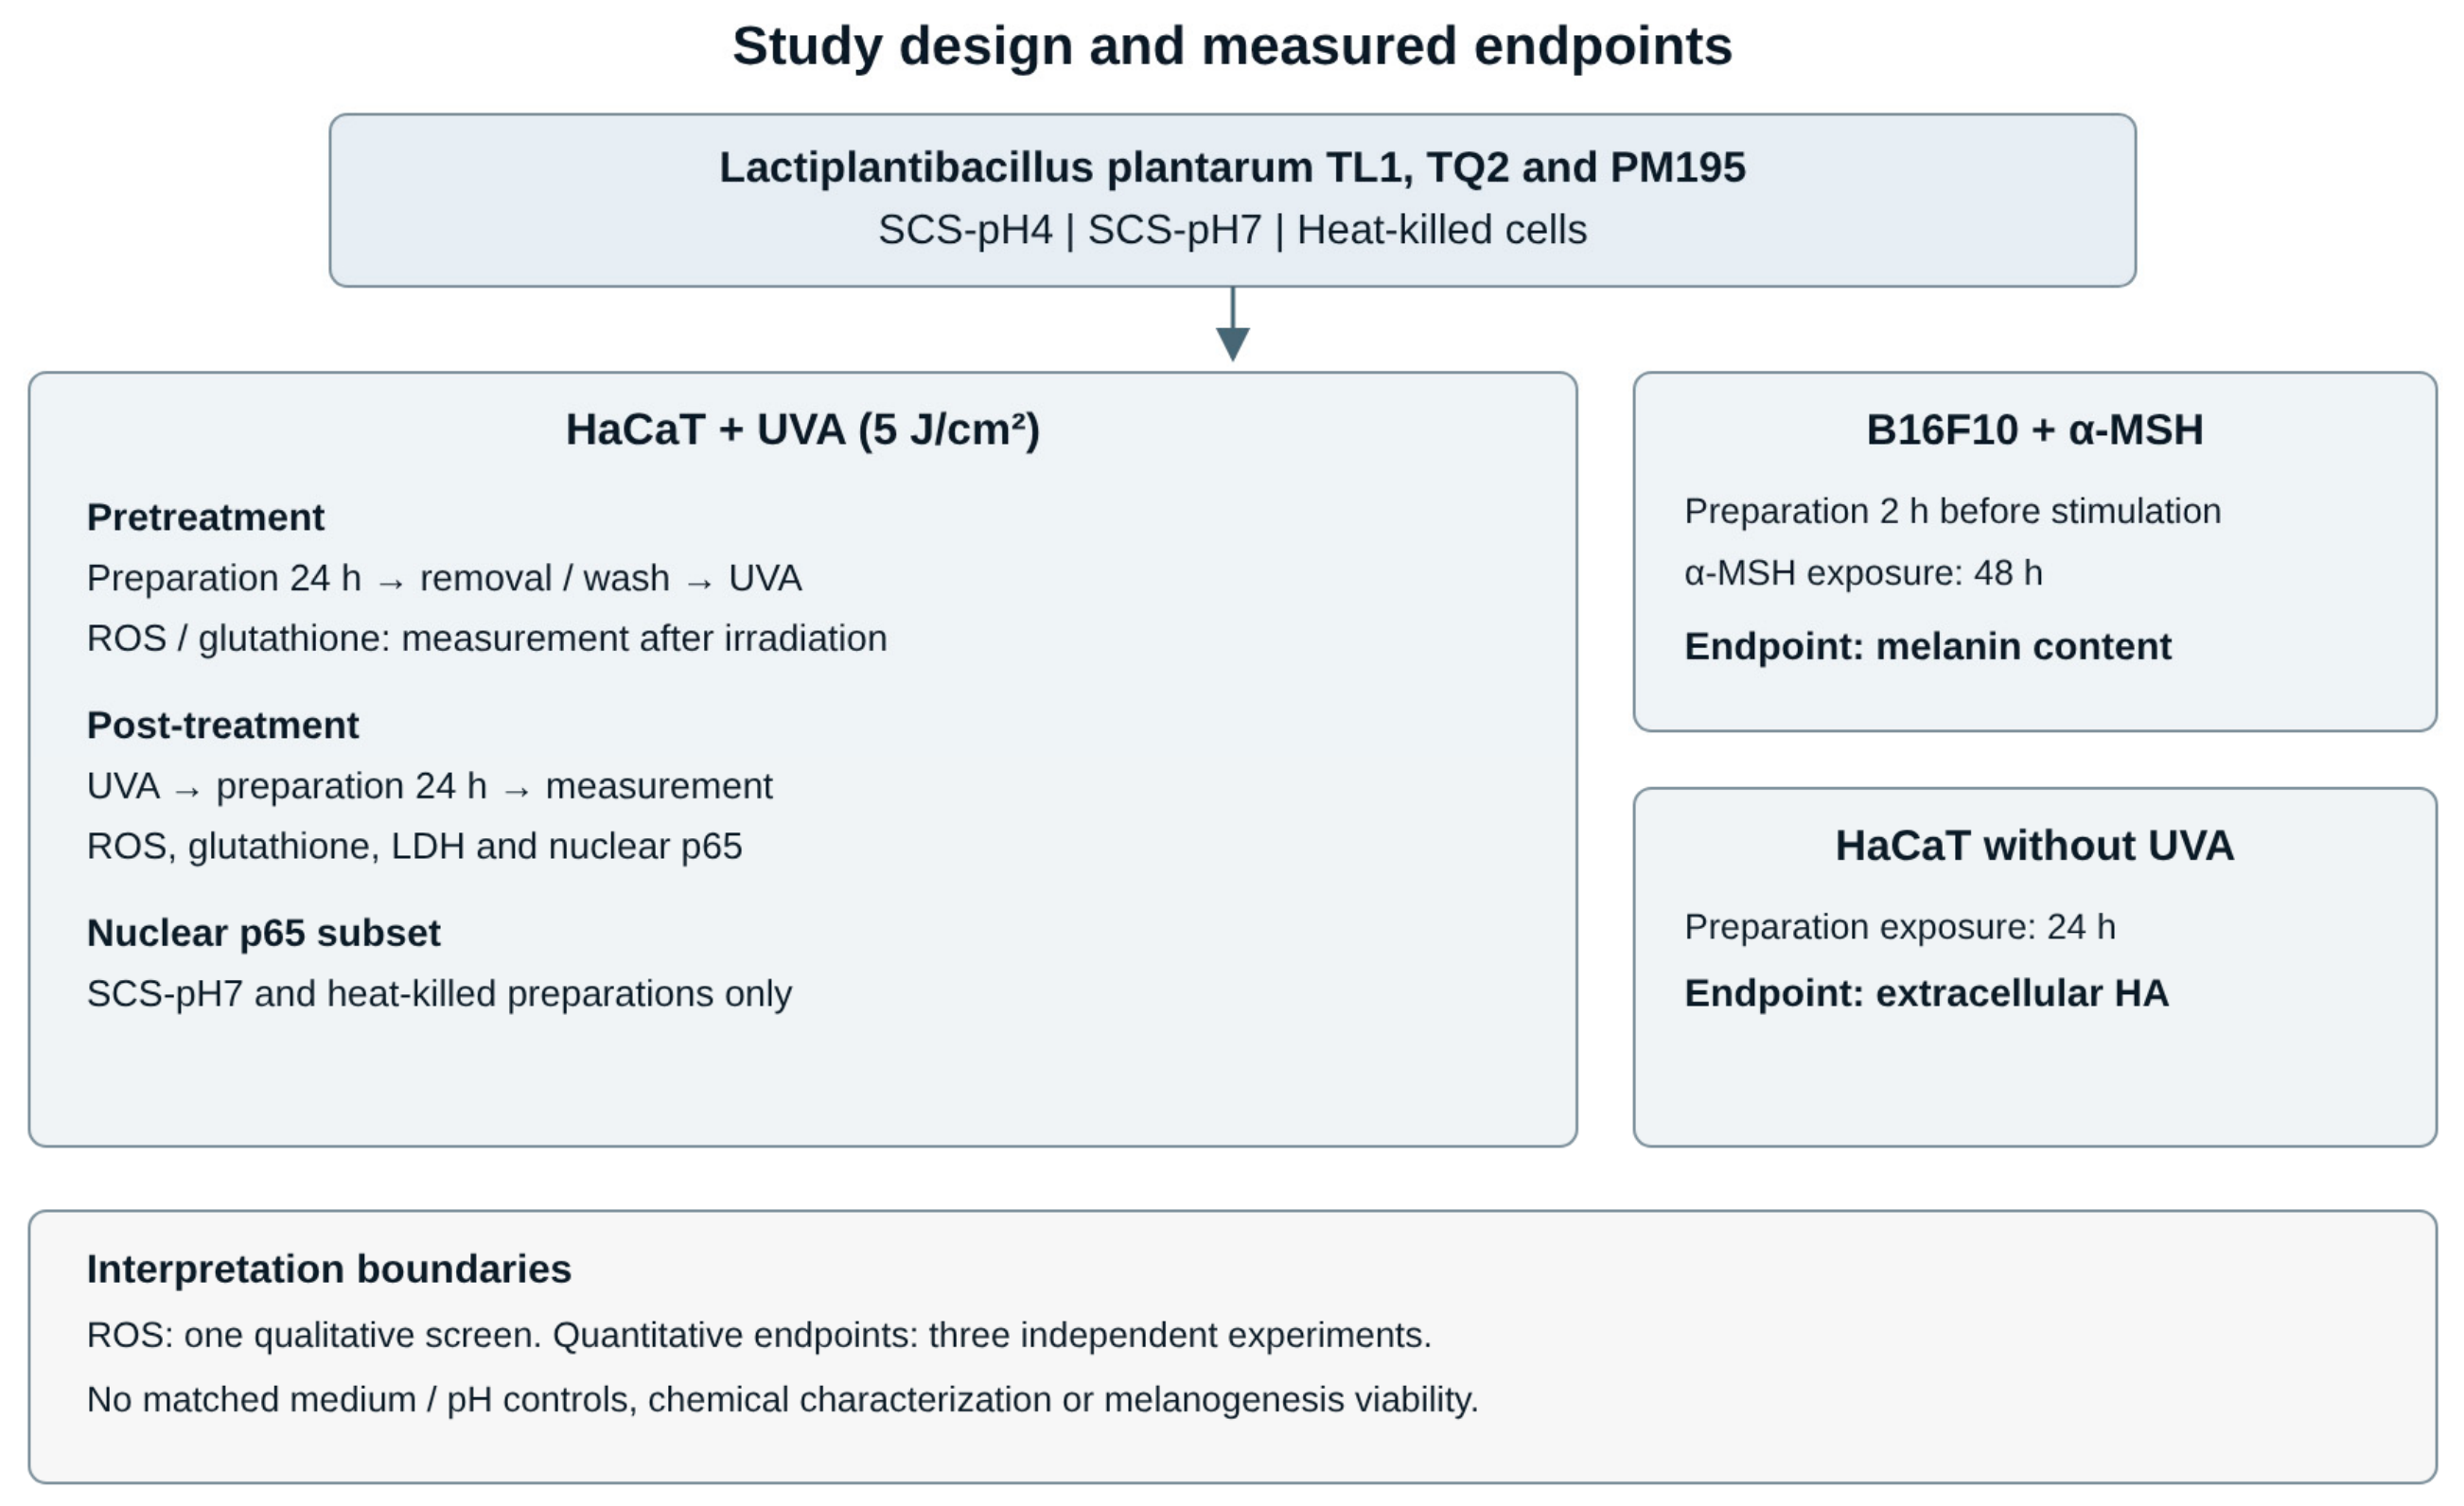
HaCaT cells were irradiated with UVA at 5 J/cm2 using a UVA irradiation system. Two treatment schedules were used (Figure 1). In the pretreatment design, cells were incubated with LAB-derived preparations for 24 h; the preparations were then removed, and the cells were washed once with PBS and irradiated; ROS and GSH were measured immediately after irradiation. In the post-treatment design, cells were irradiated first and then incubated with the corresponding preparations for 24 h; the preparations were removed, and the cells were washed before measurement. Non-irradiated, untreated cells served as the control group, and cells irradiated without LAB-derived treatment served as the UVA group [15,16,17]. The overall experimental design is summarized in Figure 1 and Table S1. Because the two schedules have different post-irradiation sampling times, comparisons between them are descriptive and do not isolate a treatment timing effect.
Figure 1.
Overview of the experimental design. Three preparation formats were evaluated from TL1, TQ2, and PM195. HaCaT pretreatment and post-treatment schedules differ in the time between irradiation and measurement. ROS was a single qualitative screen. Melanin content and extracellular HA were assessed in separate experiments. The diagram does not imply a validated mechanism or product efficacy.
2.4. Qualitative Ros Imaging
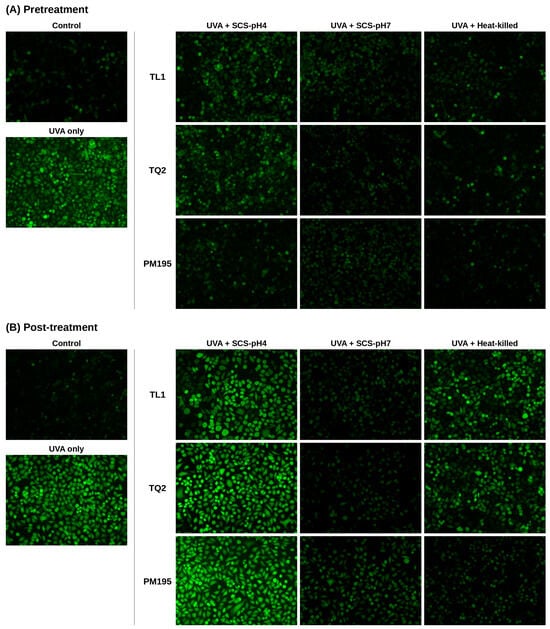
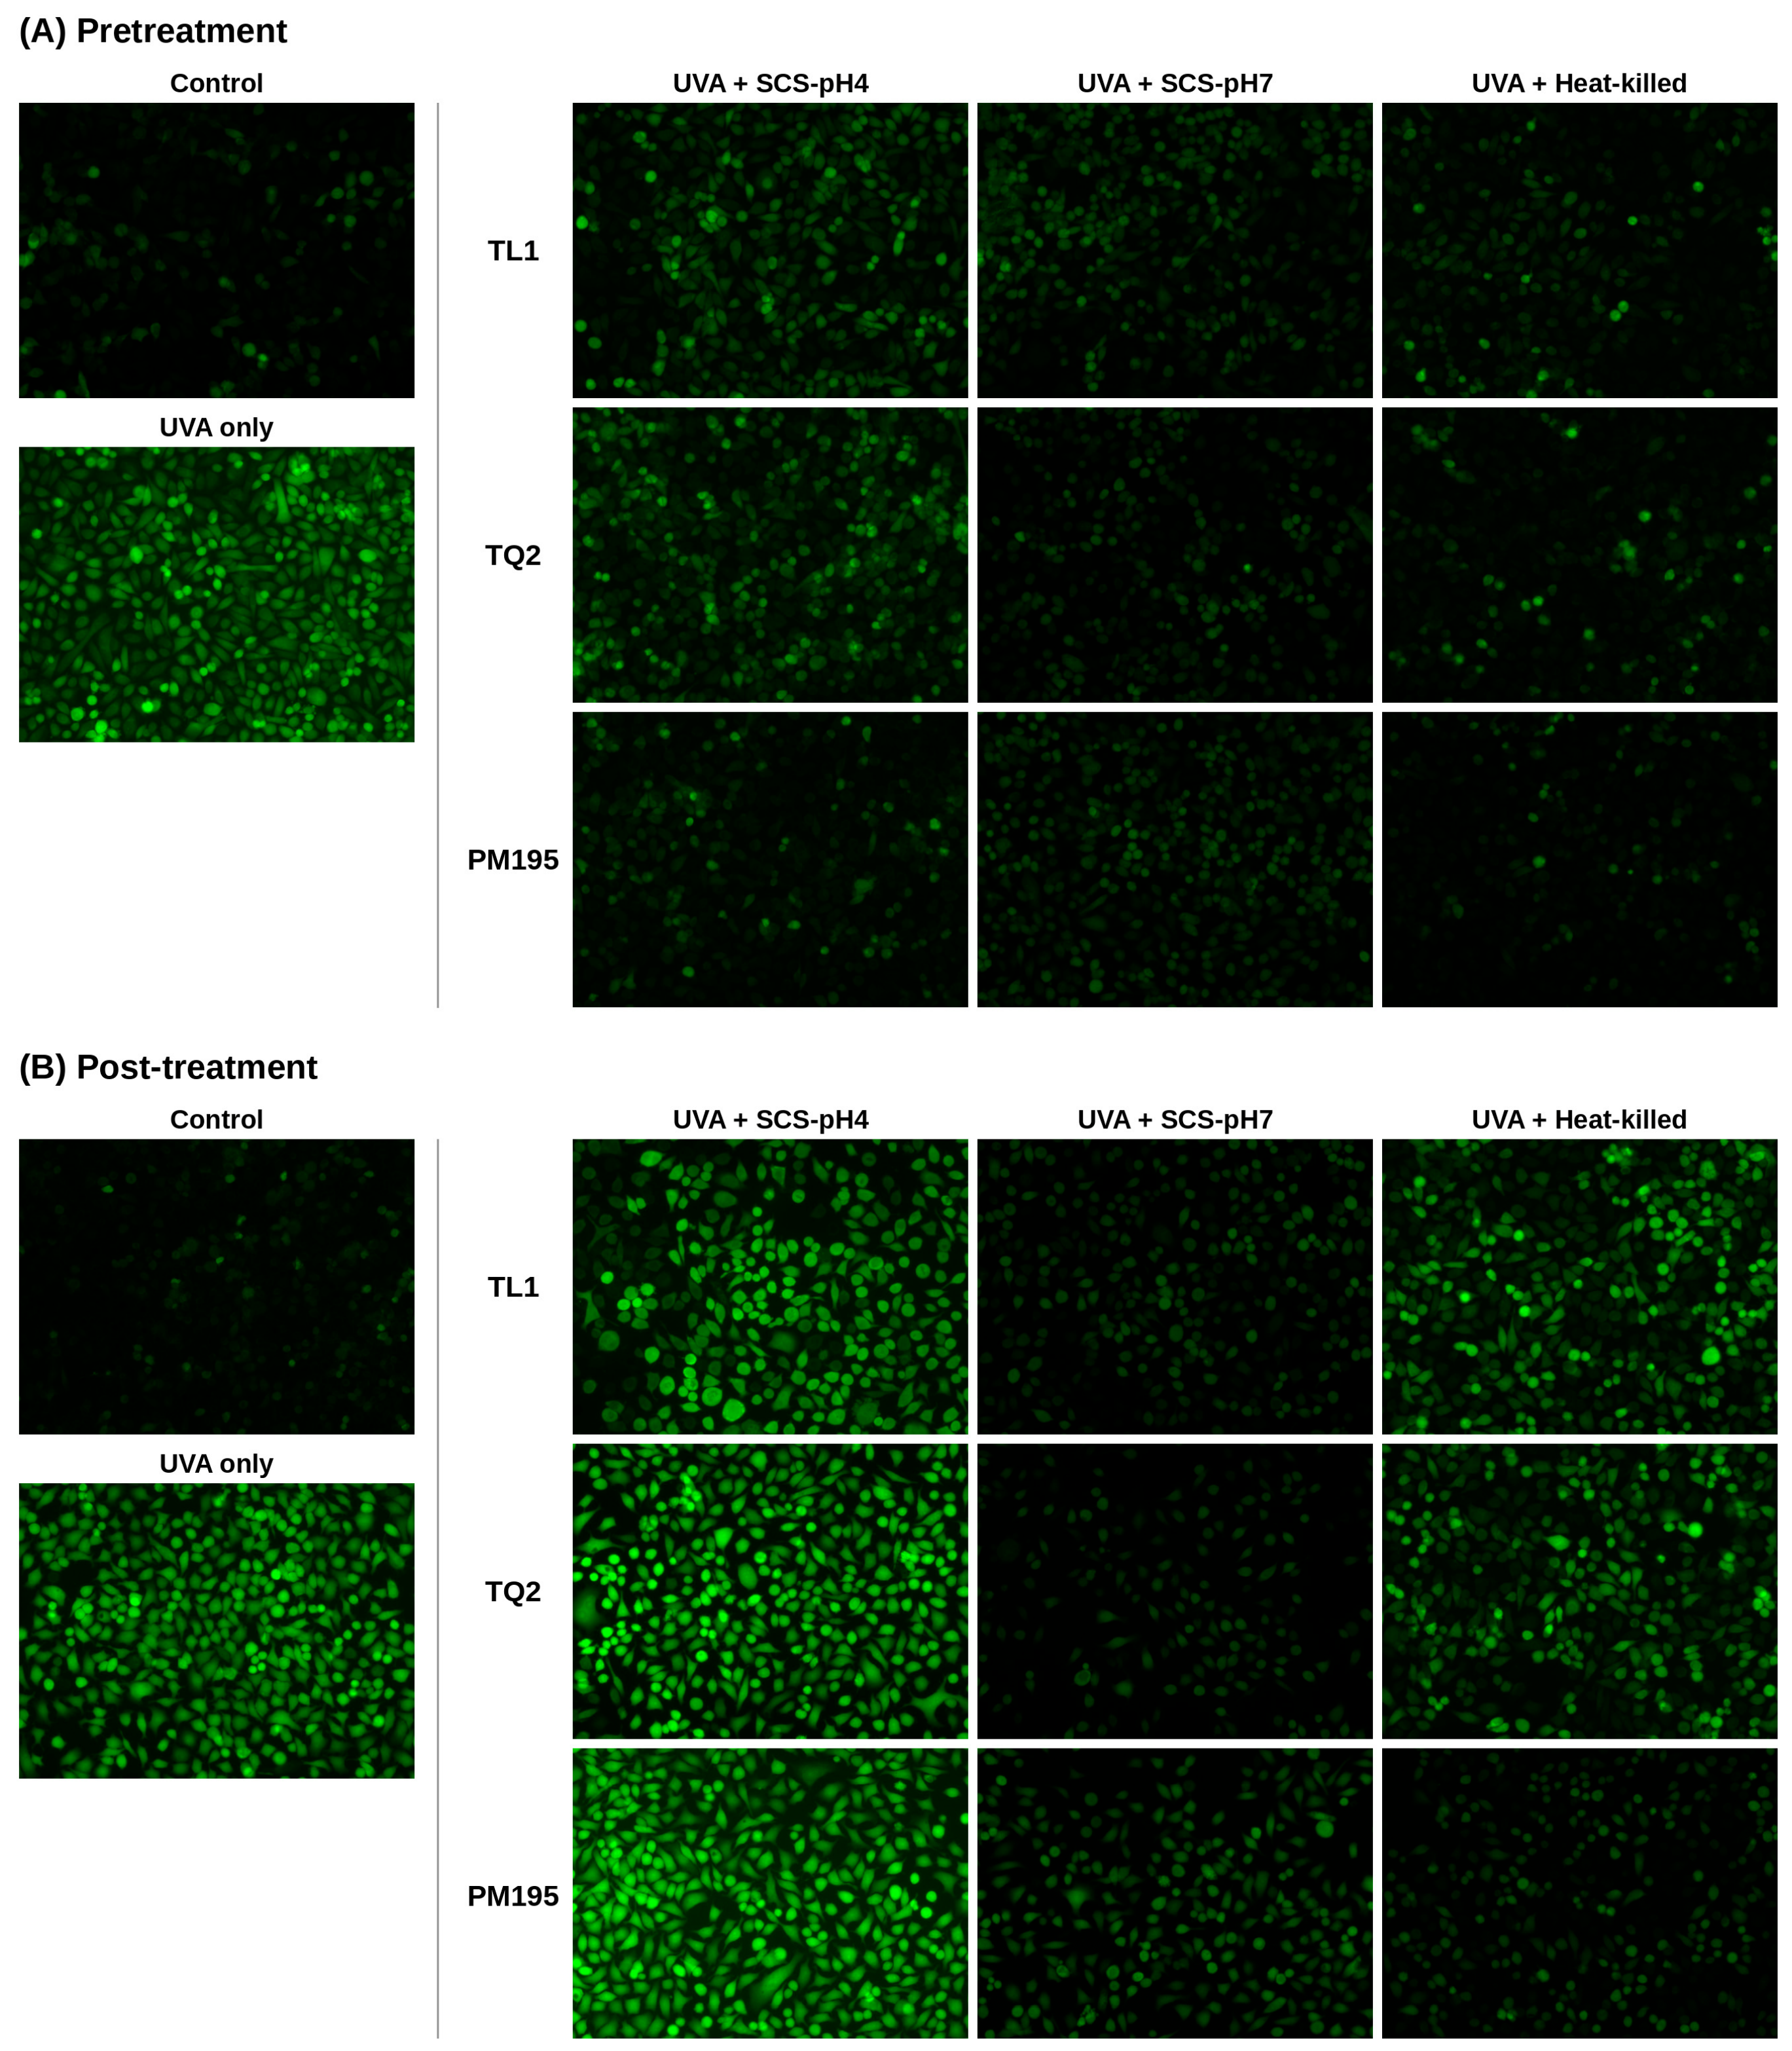
Intracellular ROS levels were assessed using 2′,7′-dichlorodihydrofluorescein diacetate (DCFH2-DA). After the pretreatment or post-treatment protocols described above, cells were incubated with 10 μM DCFH2-DA for 30 min, washed once with buffer, and examined under an inverted fluorescence microscope [4,15]. ROS imaging was performed once as a screening assay, and representative images are shown. No inference of statistical significance or reproducibility between-group differences was made from these images. Because the probe was loaded after irradiation (pretreatment schedule) or after the 24 h post-irradiation incubation (post-treatment schedule), the images reflect oxidative status at those time points rather than the acute oxidative burst during UVA exposure. No nuclear counterstain was used, and fluorescence was not normalized to cell number, so differences in cell density between fields may contribute to apparent differences in fluorescence.
2.5. Glutathione Measurement
Glutathione was assessed in HaCaT cell lysates collected after the pretreatment or post-treatment schedules using a DTNB–glutathione reductase recycling assay in microplate format [18]. The endpoint is referred to as the glutathione readout in the interpretation below. Reduced and oxidized glutathione were not separately reported, and a GSH/GSSG ratio was not established. The assay alone cannot resolve glutathione synthesis, oxidation, reduction, or export.
2.6. Lactate Dehydrogenase Release Assay
Cell injury was evaluated by measuring LDH release into the culture medium using a commercial LDH cytotoxicity assay kit according to the manufacturer’s instructions. Because LDH is measured in the culture supernatant after treatment, this assay was performed under post-treatment conditions only. HaCaT cells grown in 96-well plates were irradiated with UVA and then incubated with LAB-derived samples for 24 h. Aliquots of culture supernatant (50 μL) were transferred to fresh 96-well plates; wells containing 10× lysis buffer were used as maximum-release controls. After adding 50 μL of substrate mix, the plates were incubated in the dark at 37 °C for 20 min; the reaction was terminated with 50 μL of stop solution, and absorbance was read at 490 nm. LDH release was expressed as a percentage of the UVA group (set to 100%). This normalization is relative LDH release and is not a percentage of dead cells. Matched cell-free preparation blanks to assess assay interference were not reported.
2.7. Nuclear Nf-Κb P65 Measurement
Following the initial screening observations, only SCS-pH7 and heat-killed cells were used in this experiment. After the pretreatment or post-treatment protocols, cells were collected by centrifugation (1000 rpm, 5 min, 4 °C) and washed with ice-cold PBS containing PMSF. Cell pellets were resuspended in 500 μL of ice-cold hypotonic buffer for 15 min, 25 μL of 10% detergent solution was added, and the samples were vortexed and centrifuged (1000 rpm, 30 s, 4 °C) to remove the cytoplasmic fraction. The nuclear pellets were resuspended in 60 μL of nuclear lysis buffer, agitated at 4 °C for 30 min, and centrifuged (14,000 rpm, 10 min, 4 °C). Nuclear protein concentrations were adjusted to 1 mg/mL, and NF-κB p65 was quantified using an NF-κB p65 ELISA kit (ab176648; Abcam, Cambridge, UK) according to the manufacturer’s protocol, with absorbance measured at 450 nm. Values were calculated from the kit standard curve and expressed as pg/mg nuclear protein [19]. This endpoint was interpreted as a nuclear extract p65 measurement, not a DNA-binding, phosphorylation, or transcriptional activity assay.
2.8. Melanin Content Measurement
B16F10 cells were seeded into 6-well plates at 8 × 10⁵ cells/mL and grown to confluence. LAB-derived preparations or kojic acid (1 mM; positive control) were added 2 h before stimulation with α-MSH (100 nM) for 48 h. The cells were then lysed with RIPA buffer and centrifuged at 14,000 rpm for 10 min. The pellets were dissolved in 200 μL of 1 N NaOH containing 10% DMSO and incubated at 80 °C for 2 h. Aliquots (100 μL) were transferred to 96-well plates, and melanin content was quantified by absorbance at 405 nm and expressed as a percentage of the α-MSH group. Melanin content was not normalized to a matched viable cell count. Viability under these same preparation, concentration, and exposure conditions was not established.
2.9. Extracellular Hyaluronic Acid Measurement
HaCaT cells were seeded at 1 × 10⁵ cells/mL in DMEM containing 10% FBS and cultured to confluence. Heat-killed cells, SCS-pH4, or SCS-pH7 were added for 24 h, and the culture supernatants were analyzed using an HA ELISA kit (K-4800; Echelon Biosciences, Salt Lake City, UT, USA) according to the manufacturer’s instructions, with absorbance recorded at 450 nm [20]. The HA readout was expressed as the concentration (ng/mL) in the culture supernatant. This assay was conducted without UVA irradiation to assess extracellular HA under non-irradiated conditions. HA concentration was not normalized to cell number, and preparation-only HA background was not established. Accordingly, the readout was not treated as a direct measurement of synthesis rate or skin hydration.
2.10. Statistical Analysis
Quantitative results are presented as mean ± SD of three independent experiments. One-way ANOVA followed by Duncan’s multiple range test was performed in SPSS version 20.0 (IBM Corp., Armonk, NY, USA), with p < 0.05 as the significance threshold. In grouped bar charts, each preparation type was analyzed separately; groups sharing a letter are not significantly different within that comparison set. Letters in different preparation types are not comparable. No factorial model or preparation × strain × schedule interaction analysis was performed. Consequently, differences in significance between separate analyses are not interpreted as significant differences between preparations or schedules. ROS imaging was performed once and is presented without inferential statistics.
3. Results
3.1. Study Scope and Strain Selection
The qualitative screen informed the selection of TL1, TQ2, and PM195 for subsequent endpoints. It did not establish their superiority over the two strains that were not carried forward. The retained experiments are summarized in Figure 1 and Table S1. The results below distinguish observed readouts from biological explanations and restrict significant comparisons to the original comparison sets.
3.2. Qualitative Dcf Fluorescence Observations
The single screening experiment showed higher DCF fluorescence in UVA-exposed cells than in the non-irradiated control (Figure 2). Several treated conditions appeared less fluorescent, including SCS-pH7 under both schedules. These images are exploratory visual observations. They do not establish the size, reproducibility, or statistical significance of an antioxidant effect and were not used to rank preparation efficacy.
Figure 2.
Effects of LAB-derived preparations on UVA-induced intracellular ROS in HaCaT cells. Representative DCF fluorescence images of HaCaT cells under (A) pretreatment and (B) post-treatment conditions. In the pretreatment setting, cells were incubated with TL1-, TQ2-, or PM195-derived SCS-pH4, SCS-pH7, or heat-killed cells for 24 h before UVA exposure (5 J/cm2); in the post-treatment setting, cells were irradiated first and then incubated with the preparations for 24 h. For each treatment schedule, one representative image of non-irradiated control cells (control) and of cells irradiated without LAB-derived treatment (UVA only) is shown. Images are from a single screening experiment. No quantitative between-group analysis was performed.
3.3. Glutathione and Ldh Readouts
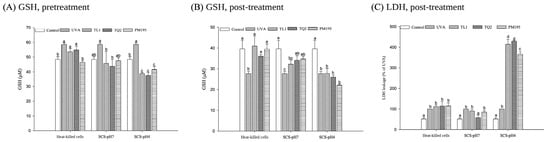
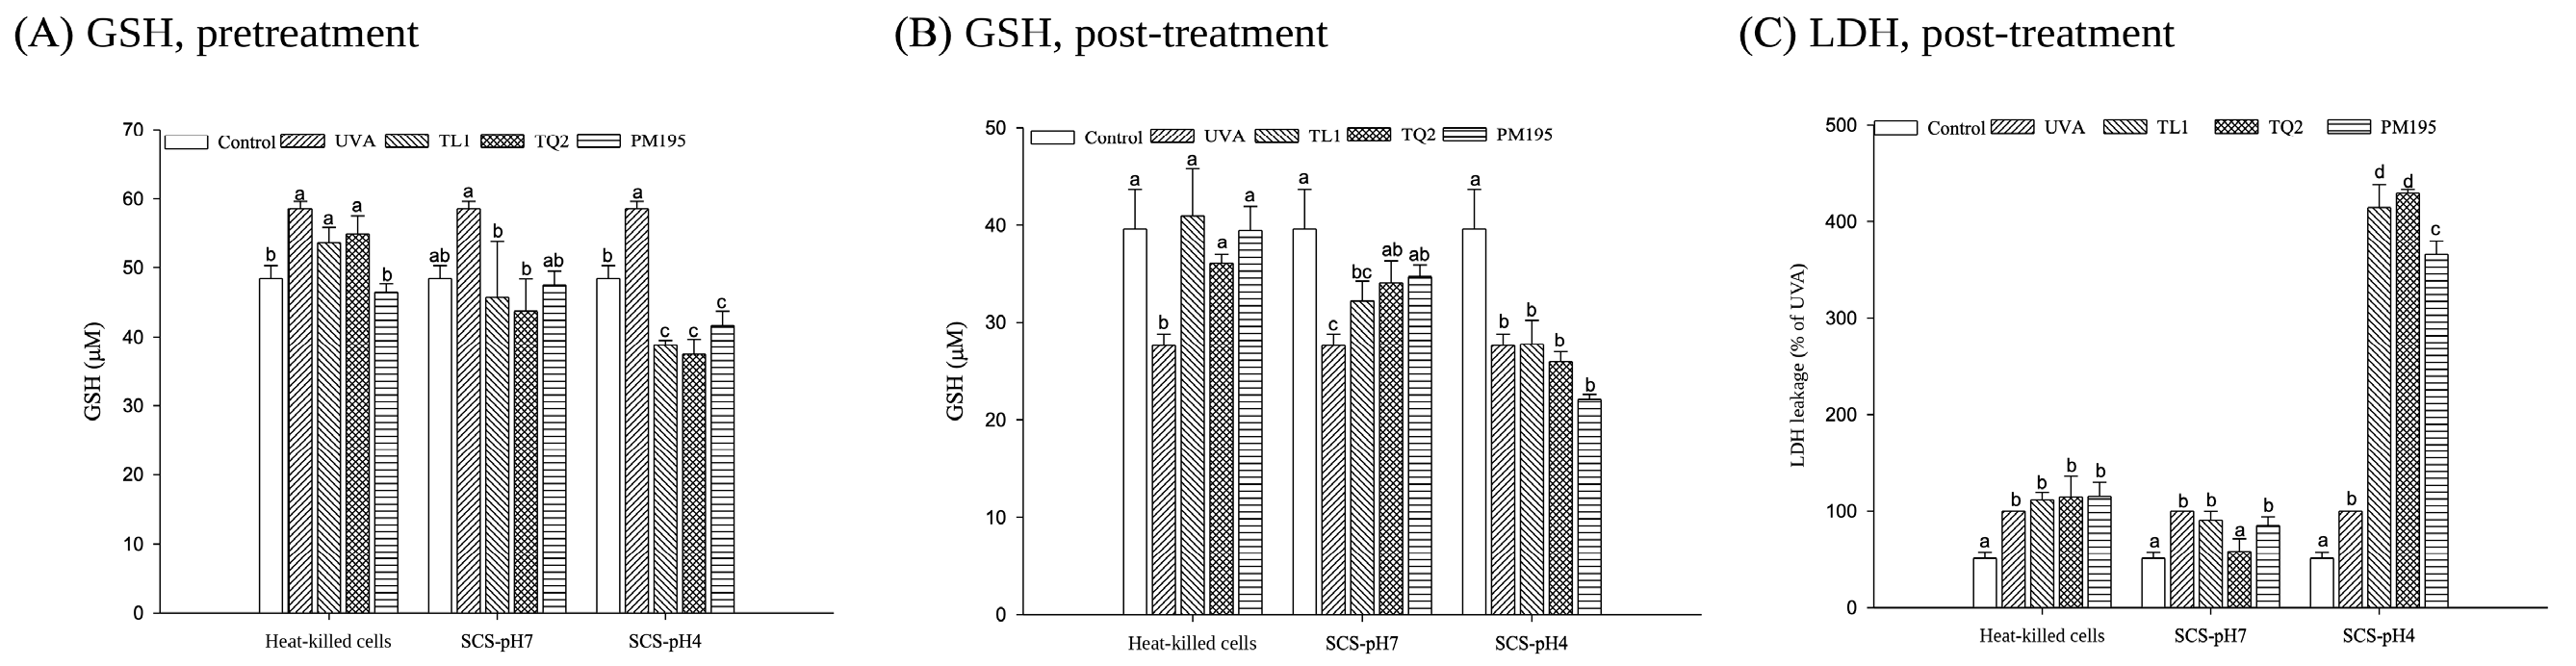
Under the pretreatment schedule, the UVA group had a higher glutathione readout than the non-irradiated control (Figure 3A). SCS-pH4 conditions had lower values than their corresponding UVA comparison groups. For SCS-pH7, the TL1 and TQ2 values were lower than those of the UVA group. This endpoint alone does not identify the processes responsible for the changes.
Figure 3.
Glutathione and LDH readouts in UVA-exposed HaCaT cells. (A) Glutathione under pretreatment and (B) post-treatment conditions. (C) Relative LDH release under post-treatment conditions, with the UVA group set to 100%; this scale is not percent cytotoxicity. Data are mean ± SD of three independent experiments. Within each preparation type, bars that do not share a letter differ significantly (p < 0.05, one-way ANOVA followed by Duncan’s test). Letters do not support comparisons across preparation types.
Under post-treatment conditions, the UVA group had a lower glutathione readout than the non-irradiated control (Figure 3B). Heat-killed preparations from all three strains, and SCS-pH7 from TQ2 and PM195, had significantly higher values than the UVA group within their respective comparison sets. SCS-pH4 did not show a significant increase relative to UVA. The absence of a significant difference from the control is not evidence of equivalence or complete restoration.
The post-treatment LDH readout was higher in the UVA group than in the control (Figure 3C). The SCS-pH4 groups showed signals approximately 3.5–4.5 times that of the UVA group. Within the SCS-pH7 comparison set, TQ2 had lower LDH release than the UVA group; the heat-killed groups did not show a significant decrease relative to UVA. These observations concern the LDH assay signal and do not establish the cause of injury or a quantitative fraction of dead cells.
3.4. Nuclear P65 Readout
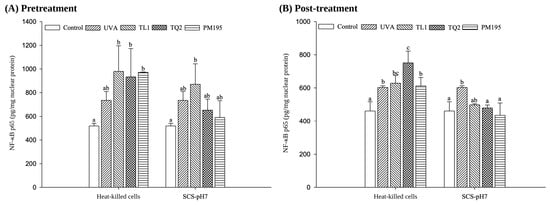
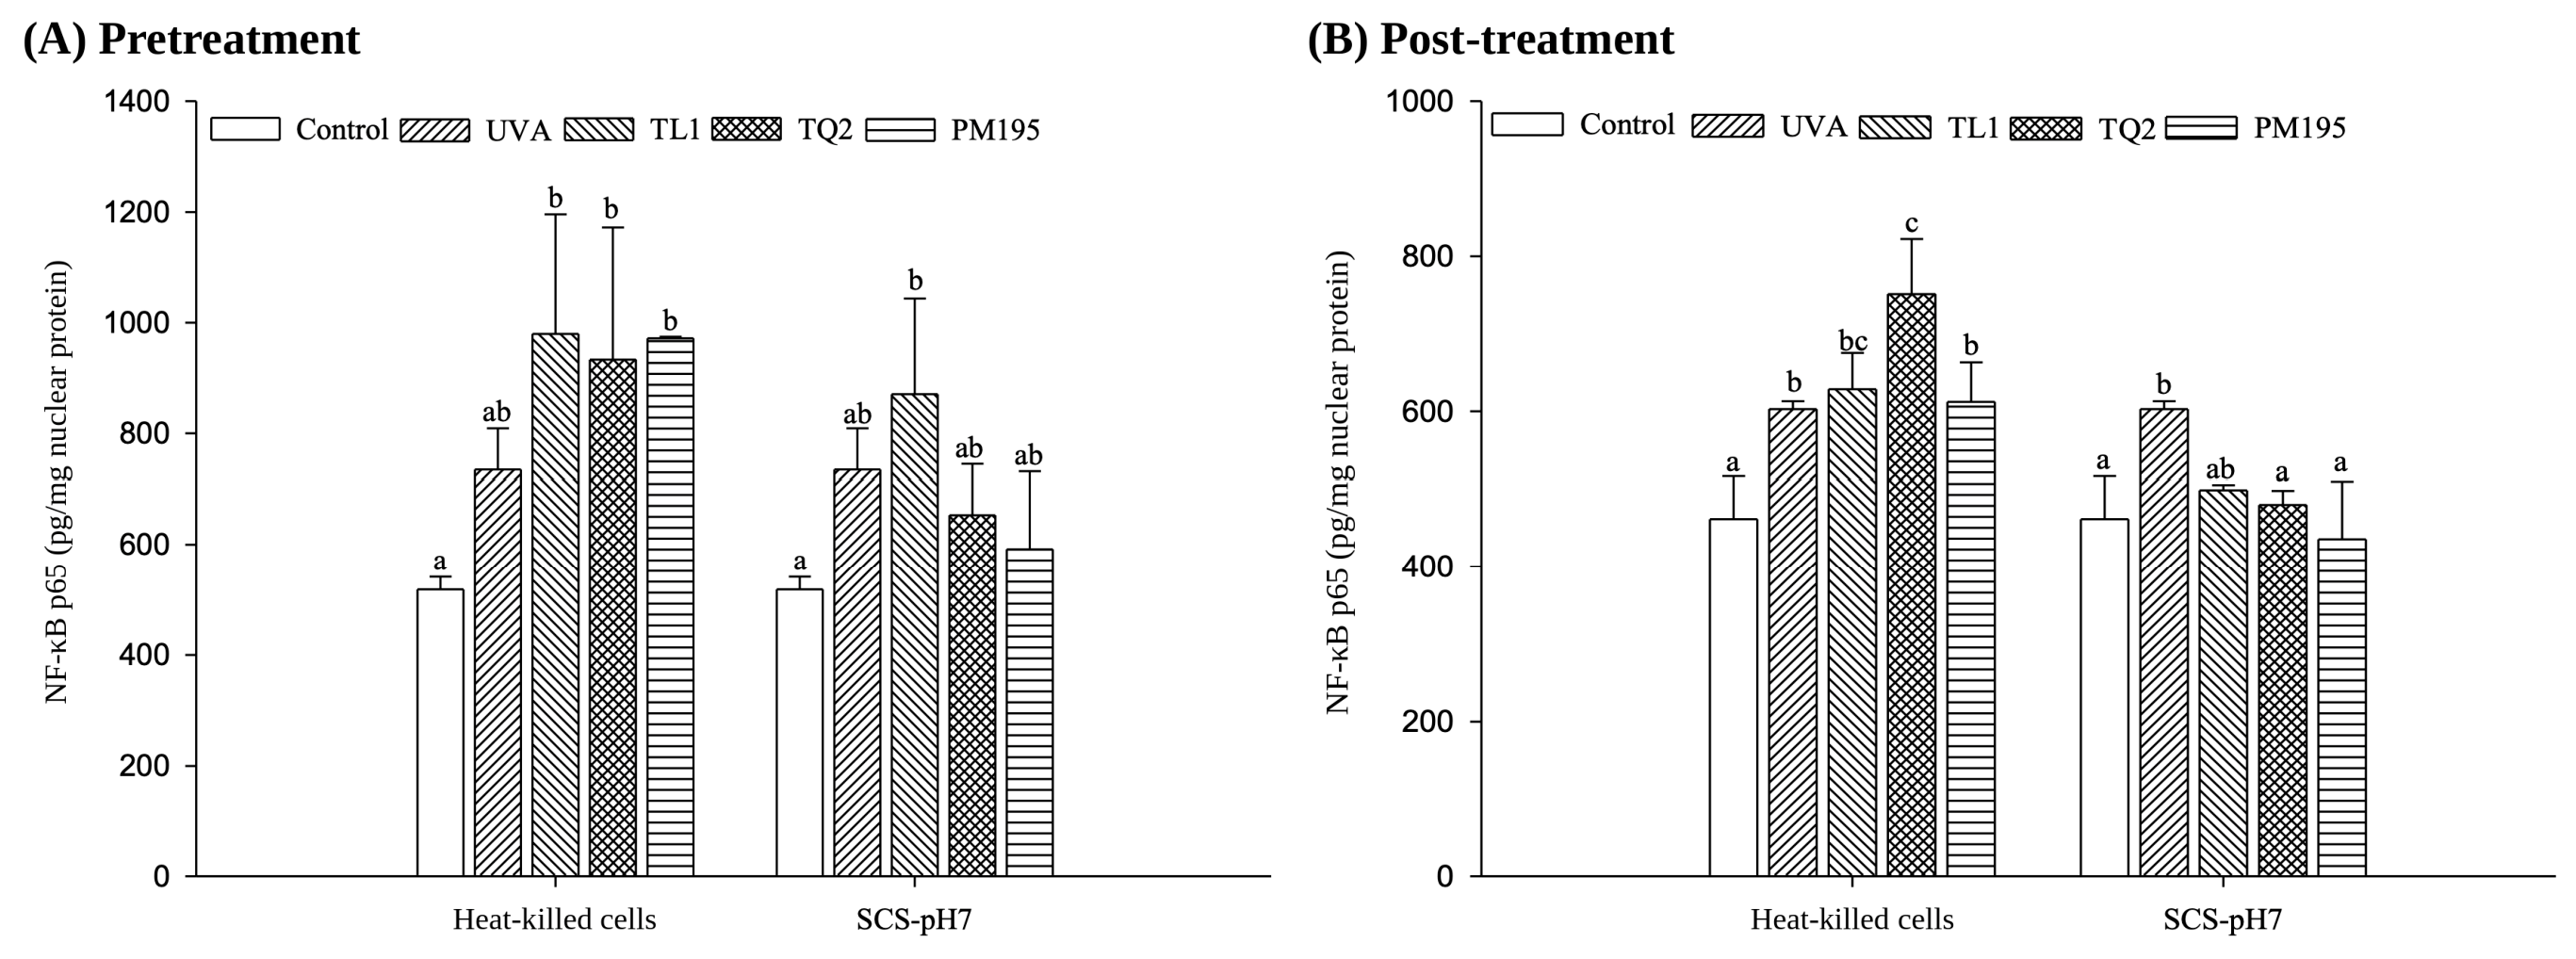
Only SCS-pH7 and heat-killed preparations were included in the p65 experiment (Figure 4). Neither format showed lower nuclear p65 than UVA within its pretreatment comparison set. In the post-treatment SCS-pH7 set, TQ2 and PM195 had lower readouts than UVA, while TL1 did not differ significantly from UVA. Heat-killed TQ2 had a higher readout than UVA after irradiation. These measurements do not directly establish changes in NF-κB transcriptional activity. A significant result in one schedule and a non-significant result in another do not establish a schedule interaction.
Figure 4.
Nuclear-extract p65 readouts under (A) pretreatment and (B) post-treatment schedules. Only SCS-pH7 and heat-killed preparations were evaluated. Values are expressed as pg/mg nuclear protein. Data are mean ± SD of three independent experiments. Within each preparation type, groups that do not share a letter differ significantly (p < 0.05). The assay does not directly measure NF-κB transcriptional activity; letters do not support comparisons across preparation types or schedules.
3.5. Melanin Content in B16f10 Cells
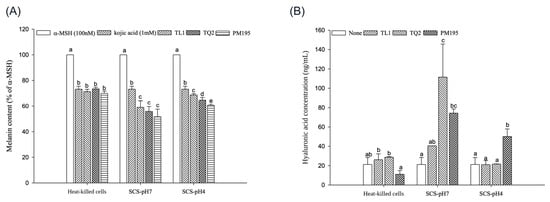
After treatment and α-MSH stimulation, melanin content was lower in all preparation-treated groups than in the corresponding α-MSH group (Figure 5A). Within each supernatant comparison set, the treated groups had lower values than the kojic acid group. These comparisons concern unnormalized melanin content under the tested conditions and do not establish superior depigmenting efficacy. Cell loss or cytotoxicity remains a possible explanation because matched viability measurements were not available.
Figure 5.
Melanin content and extracellular HA concentration. (A) Melanin content in α-MSH-stimulated B16F10 cells, relative to the α-MSH group; kojic acid (1 mM) was a reference treatment. (B) HA concentration in the culture medium of non-irradiated HaCaT cells after 24 h; none, untreated cells. Data are mean ± SD of three independent experiments. Within each preparation type, bars that do not share a letter differ significantly (p < 0.05, one-way ANOVA followed by Duncan’s test). Letters do not support comparisons across preparation types. Melanin content was not corrected for a matched viable cell count, and extracellular HA was not normalized to cell number.
3.6. Extracellular Ha in Hacat Cultures
In non-irradiated HaCaT cultures, SCS-pH7 from TQ2 and PM195 was associated with significantly higher extracellular HA concentration than the untreated group within that comparison set (Figure 5B). The approximate ratios to the untreated value were five-fold and 3.5-fold, respectively. TL1-derived SCS-pH7 did not differ significantly from the untreated group. In the SCS-pH4 set, PM195 had a higher value than the untreated group, while the heat-killed preparations did not show a significant increase. These results do not establish preparation superiority, increased HA synthesis per cell, or improved skin hydration.
4. Discussion
4.1. Interpretation of the Cellular Response Patterns
The main contribution of this study is the documentation of several cellular readouts after exposure to explicitly defined LAB-derived preparations. The quantitative observations include higher post-treatment glutathione readouts in selected conditions and lower LDH release with TQ2-derived SCS-pH7. These endpoints did not move uniformly: heat-killed preparations were associated with higher post-treatment glutathione without a significant LDH decrease, whereas SCS-pH4 showed higher LDH release. This divergence argues against reducing the findings to a single ranking of protective efficacy. It also makes it essential to distinguish a stress response from a beneficial cellular outcome.
4.2. Composition and Neutralization as Possible Contributors
Different material compositions offer a plausible starting point for explaining the response patterns. Washed heat-killed cells and culture supernatants expose cells to different mixtures of structural material, soluble bacterial products, and medium constituents. At the strain level, different patterns could arise from metabolic output, substrate consumption, or preparation batch composition rather than a uniformly stronger strain. Equal supernatant volumes do not establish equal metabolite exposure. Chemical characterization in other studies shows why composition matters. Shin et al. used comparative metabolomics and testing of candidate compounds to identify phenyllactic acid as a tyrosinase inhibitor [21]. Such evidence supports investigation of specific metabolites; it does not establish their presence or contribution in TL1, TQ2, or PM195. Because our preparations were not chemically characterized, compositional explanations remain hypotheses.
The contrast between SCS-pH4 and SCS-pH7 is also compatible with an influence of the preparation environment. Neutralization changes acid–base speciation and adds sodium-containing material; it does not remove organic acids. Consequently, retained activity after neutralization cannot identify a non-lactate active constituent. Usuki et al. reported that lactic acid could inhibit tyrosinase in their experimental system independently of acidity [22]. More recently, Du et al. investigated histone lactylation and tyrp1 regulation after lactic acid exposure in B16 cells [23]. These studies illustrate distinct possible actions of a fermentation-associated compound, but neither mechanism was tested here. In particular, stock supernatant pH does not establish the pH experienced by cells after dilution into buffered medium.
The absence of uninoculated MRS and pH-matched controls limits attribution of the present effects. Residual medium components, acidity, and fermentation products cannot be separated. Similarly, the increased LDH signal with SCS-pH4 is consistent with treatment-associated injury, but the data do not establish acid toxicity as its cause, and preparation-related interference with the assay was not excluded. Neutralization can, therefore, be described as an experimental preparation step associated with a different observed pattern, rather than as a proven requirement for a safe cosmetic ingredient.
4.3. Oxidative Readouts and Treatment Schedule
The glutathione results need to be interpreted with the sampling schedule and assay scope in mind. He et al. demonstrated UVA-associated GSH export in HaCaT cells [16], showing that intracellular glutathione can change through transport as well as metabolic processes. In the present study, a single endpoint does not distinguish synthesis, consumption, reduction, or export, and reduced and oxidized glutathione were not separately resolved in the reported analysis. Thus, a lower pretreatment value cannot be assumed to indicate a smaller oxidative burden, and a higher post-treatment value does not establish full redox recovery. The differing times after UVA also mean that the two schedules cannot establish that preparation acts specifically during prevention or recovery.
Other LAB-derived preparations have produced oxidative stress-related responses in skin cells. Lee et al. reported reduced ROS and changes in antioxidant-related gene expression with Levilactobacillus brevis BK3 in H2O2-exposed HaCaT and HFF-1 cells [24]. The different stressors, strains, and endpoints make this contextual rather than directly confirmatory evidence. Antioxidant-related genes or protein expression was not assessed here, so the present data do not address such mechanisms. The ROS images add only a single qualitative observation and cannot substantiate comparative antioxidant efficacy.
The p65 findings concern the nuclear extract readout and do not directly establish DNA binding or transcriptional output. The heat-killed TQ2 post-treatment result also cautions against assuming that every LAB-derived material is anti-inflammatory. Keratinocytes can respond to microbial ligands through innate recognition pathways [25], but receptor engagement was not assessed here.
4.4. Melanin Content in Relation to Previous Studies
The lower melanin content is relevant to earlier work on LAB-derived materials, but its interpretation is constrained by the viability assessment. Lee et al. examined other strains in α-MSH-stimulated B16F10 cells using melanogenesis-related gene and protein endpoints, including CREB/MITF and MAPK-associated measurements [12]. This provides candidate pathways for future work, not evidence that our preparations use those pathways. Without matched viability and viable cell normalization, lower melanin can reflect altered cell number or injury as well as melanogenic regulation. Melanin content is, therefore, a preliminary observation rather than evidence of established whitening efficacy or superiority to kojic acid.
Cell-free enzyme inhibition, cellular melanin content, and intracellular tyrosinase activity are distinct endpoints. The mushroom tyrosinase assay used by Tsai et al. [10], for example, demonstrates an enzyme reaction result rather than a mechanism within melanocytes. The present melanin content experiment does not identify the enzyme or signaling target responsible for the observation. A validated intracellular assay with appropriate interference controls would be required before assigning a tyrosinase mechanism to these preparations.
4.5. Extracellular Ha and Formulation Relevance
The HA observations can be compared with research that measured HA-related responses in other LAB systems. Chung et al. reported higher HA levels with a culture supernatant complex in bacterially challenged HaCaT cultures [9]. Nakai et al. found that heat-killed L. plantarum L-137 increased HA production in primary epidermal cells and investigated cytokine-associated responses in fibroblasts [26]. Our heat-killed preparations did not show a significant HA increase. The differing strains, cell systems, and treatment conditions prevent a direct efficacy comparison and show why HA-related activity cannot be assigned uniformly to a preparation category.
Our measurement was extracellular HA concentration after 24 h, without HAS expression, synthesis rate measurements, cell number normalization, or preparation-only background assessment. Increased concentration, therefore, does not by itself establish increased synthesis per keratinocyte. Nor does it demonstrate improved barrier function, water retention, or skin hydration. The gravimetric water retention assay in Tsai et al. [10] addresses a different property and is not interchangeable with HA concentration. The present results support further investigation of HA-associated responses, rather than a moisturizing claim.
Translation into a topical formulation would require characterization and standardization of the actual ingredient. Relevant questions include batch composition, stability over storage, compatibility with formulation pH and preservatives, and irritation under realistic exposure conditions. Heat resistance of selected activities in one supernatant [10] does not establish storage stability or formulation compatibility of the preparations studied here. Reconstructed human skin or other suitable skin models, followed by appropriately designed human studies, would be needed before claims of photoprotection, depigmentation, or moisturization. These are subsequent validation requirements, not outcomes demonstrated by the present cell assays.
4.6. Statistical Scope and Remaining Limitations
The original analyses compared groups within preparation types. They do not test a preparation effect, a preparation-by-strain interaction, or a treatment schedule interaction. Accordingly, we do not interpret a significant result in one comparison set and a non-significant result in another as evidence that the two treatments differ. A factorial analysis would require appropriately structured replicate-level data, including the handling of shared controls and experimental batches. No factorial analysis was reconstructed from plotted means or error bars. The study, therefore, reports endpoint-specific findings without claiming an overall superior strain or preparation.
The remaining limitations are substantive. The study used one concentration per preparation, lacked matched medium and pH controls, and did not characterize the supernatant composition. ROS was not replicated quantitatively; mechanism-related measurements were restricted in scope; and viability was not established under the melanogenesis conditions. These constraints prevent causal attribution and broad safety or efficacy conclusions. Within those boundaries, the dataset records testable cellular response patterns and identifies the controls and validation steps required to distinguish bacterial product effects from medium, pH, and cell number effects.
5. Conclusions
This study provides a side-by-side comparison of three LAB-derived preparation formats from three L. plantarum strains in skin-related cell models and shows that preparation format is associated with clearly different cellular response patterns. pH-neutralized supernatants showed favorable readouts across several endpoints: after UVA exposure, SCS-pH7 from TQ2 and PM195 increased glutathione readouts, TQ2-derived SCS-pH7 lowered LDH release, and SCS-pH7 from TQ2 and PM195 increased extracellular HA, without the increase in LDH release observed with non-neutralized supernatants. Heat-killed cells increased post-UVA glutathione readouts for all three strains. These observations do not yet establish active constituents, mechanisms, or cosmetic efficacy, but they provide a defined starting point and support prioritizing pH-neutralized supernatants for controlled validation, including medium- and pH-matched controls, quantitative ROS assays, and skin model testing.
Supplementary Materials
The following supporting information can be downloaded at: https://www.mdpi.com/article/10.3390/cimb48111244/s1, Table S1: preparation formats and retained experiments; Table S2: observations and interpretation boundaries.
Author Contributions
Conceptualization, H.W. and C.-C.T.; methodology, H.W. and L.-C.C.; investigation, L.-C.C.; formal analysis, L.-C.C. and H.W.; data curation, L.-C.C.; writing—original draft preparation, H.W.; writing—review and editing, H.W. and C.-C.T.; supervision, H.W. and C.-C.T.; project administration, H.W.; funding acquisition, C.-C.T. All authors have read and agreed to the published version of the manuscript.
Funding
This research was funded by the National Science and Technology Council (formerly the Ministry of Science and Technology), Taiwan, grant number MOST 105-2320-B-241-003-MY3.
Institutional Review Board Statement
Not applicable.
Informed Consent Statement
Not applicable.
Data Availability Statement
The original contributions presented in this study are included in the article/Supplementary Material. Further inquiries can be directed to the corresponding author(s).
Acknowledgments
During the preparation of this manuscript, the authors used Claude (Claude Opus 5.5; Anthropic, San Francisco, CA, USA) to assist in preparing the experimental design schematic (Figure 1) and the graphical abstract and for language editing. During revision, the authors also used ChatGPT (GPT-5; OpenAI, San Francisco, CA, USA) for literature organization, language editing, and preparation of revised text and diagrams. The authors have reviewed and edited the output and take full responsibility for the content of this publication.
Conflicts of Interest
The authors declare no conflicts of interest.
References
- Nestle, F.O.; Di Meglio, P.; Qin, J.Z.; Nickoloff, B.J. Skin immune sentinels in health and disease. Nat. Rev. Immunol. 2009, 9, 679–691. [Google Scholar] [CrossRef] [Scilit] [PubMed]
- Jeong, J.H.; Lee, C.Y.; Chung, D.K. Probiotic lactic acid bacteria and skin health. Crit. Rev. Food Sci. Nutr. 2016, 56, 2331–2337. [Google Scholar] [CrossRef] [Scilit] [PubMed]
- Ichihashi, M.; Ueda, M.; Budiyanto, A.; Bito, T.; Oka, M.; Fukunaga, M.; Tsuru, K.; Horikawa, T. UV-induced skin damage. Toxicology 2003, 189, 21–39. [Google Scholar] [CrossRef] [Scilit] [PubMed]
- Svobodova, A.; Zdarilova, A.; Maliskova, J.; Mikulkova, H.; Walterova, D.; Vostalova, J. Attenuation of UVA-induced damage to human keratinocytes by silymarin. J. Dermatol. Sci. 2007, 46, 21–30. [Google Scholar] [CrossRef] [Scilit] [PubMed]
- Hseu, Y.C.; Chou, C.W.; Senthil Kumar, K.J.; Fu, K.T.; Wang, H.M.; Hsu, L.S.; Kuo, Y.H.; Wu, C.R.; Chen, S.C.; Yang, H.L. Ellagic acid protects human keratinocyte (HaCaT) cells against UVA-induced oxidative stress and apoptosis through the upregulation of the HO-1 and Nrf-2 antioxidant genes. Food Chem. Toxicol. 2012, 50, 1245–1255. [Google Scholar] [CrossRef] [Scilit] [PubMed]
- Salminen, S.; Collado, M.C.; Endo, A.; Hill, C.; Lebeer, S.; Quigley, E.M.M.; Sanders, M.E.; Shamir, R.; Swann, J.R.; Szajewska, H.; et al. The International Scientific Association of Probiotics and Prebiotics (ISAPP) consensus statement on the definition and scope of postbiotics. Nat. Rev. Gastroenterol. Hepatol. 2021, 18, 649–667, Correction in Nat. Rev. Gastroenterol. Hepatol. 2022, 19, 551. [Google Scholar] [CrossRef] [Scilit] [PubMed]
- Wells, J.M. Immunomodulatory mechanisms of lactobacilli. Microb. Cell Fact. 2011, 10, S17. [Google Scholar] [CrossRef] [Scilit] [PubMed]
- Lew, L.C.; Liong, M.T. Bioactives from probiotics for dermal health: Functions and benefits. J. Appl. Microbiol. 2013, 114, 1241–1253. [Google Scholar] [CrossRef] [Scilit] [PubMed]
- Chung, H.J.; Lee, H.; Kim, M.; Lee, J.W.; Saeed, M.; Lee, H.; Jung, S.H.; Shim, J.J.; Lee, J.L.; Heo, K.; et al. Development and metabolic profiling of a postbiotic complex exhibiting antibacterial activity against skin microorganisms and anti-inflammatory effect on human keratinocytes. Food Sci. Biotechnol. 2022, 31, 1325–1334. [Google Scholar] [CrossRef] [Scilit] [PubMed]
- Tsai, C.C.; Chan, C.F.; Huang, W.Y.; Lin, J.S.; Chan, P.; Liu, H.Y.; Lin, Y.S. Applications of Lactobacillus rhamnosus spent culture supernatant in cosmetic antioxidation, whitening and moisture retention applications. Molecules 2013, 18, 14161–14171. [Google Scholar] [CrossRef] [Scilit] [PubMed]
- Rong, J.; Shan, C.; Liu, S.; Zheng, H.; Liu, C.; Liu, M.; Jin, F.; Wang, L. Skin resistance to UVB-induced oxidative stress and hyperpigmentation by the topical use of Lactobacillus helveticus NS8-fermented milk supernatant. J. Appl. Microbiol. 2017, 123, 511–523. [Google Scholar] [CrossRef] [Scilit] [PubMed]
- Lee, H.W.; Lee, Y.R.; Park, K.M.; Lee, N.K.; Paik, H.D. Antimelanogenic and antioxidant effects of postbiotics of Lactobacillus strains in α-MSH-induced B16F10 melanoma cells via CREB/MITF and MAPKs signaling pathway. J. Microbiol. Biotechnol. 2024, 34, 2279–2289. [Google Scholar] [CrossRef] [Scilit] [PubMed]
- Papakonstantinou, E.; Roth, M.; Karakiulakis, G. Hyaluronic acid: A key molecule in skin aging. Dermatoendocrinol 2012, 4, 253–258. [Google Scholar] [CrossRef] [Scilit] [PubMed]
- Zheng, J.; Wittouck, S.; Salvetti, E.; Franz, C.M.A.P.; Harris, H.M.B.; Mattarelli, P.; O’Toole, P.W.; Pot, B.; Vandamme, P.; Walter, J.; et al. A taxonomic note on the genus Lactobacillus: Description of 23 novel genera, emended description of the genus Lactobacillus Beijerinck 1901, and union of Lactobacillaceae and Leuconostocaceae. Int. J. Syst. Evol. Microbiol. 2020, 70, 2782–2858. [Google Scholar] [CrossRef] [Scilit] [PubMed]
- Shorrocks, J.; Paul, N.D.; McMillan, T.J. The dose rate of UVA treatment influences the cellular response of HaCaT keratinocytes. J. Investig. Dermatol. 2008, 128, 685–693. [Google Scholar] [CrossRef] [Scilit] [PubMed]
- He, Y.Y.; Huang, J.L.; Ramirez, D.C.; Chignell, C.F. Role of reduced glutathione efflux in apoptosis of immortalized human keratinocytes induced by UVA. J. Biol. Chem. 2003, 278, 8058–8064. [Google Scholar] [CrossRef] [Scilit] [PubMed]
- Yu, L.; Venkataraman, S.; Coleman, M.C.; Spitz, D.R.; Wertz, P.W.; Domann, F.E. Glutathione peroxidase-1 inhibits UVA-induced AP-2α expression in human keratinocytes. Biochem. Biophys. Res. Commun. 2006, 351, 1066–1071. [Google Scholar] [CrossRef] [Scilit] [PubMed]
- Vandeputte, C.; Guizon, I.; Genestie-Denis, I.; Vannier, B.; Lorenzon, G. A microtiter plate assay for total glutathione and glutathione disulfide contents in cultured/isolated cells: Performance study of a new miniaturized protocol. Cell Biol. Toxicol. 1994, 10, 415–421. [Google Scholar] [CrossRef] [Scilit] [PubMed]
- Wang, M.L.; Zhong, Q.Y.; Lin, B.Q.; Liu, Y.H.; Huang, Y.F.; Chen, Y.; Yuan, J.; Su, Z.R.; Zhan, J.Y. Andrographolide sodium bisulfate attenuates UV-induced photo-damage by activating the keap1/Nrf2 pathway and downregulating the NF-κB pathway in HaCaT keratinocytes. Int. J. Mol. Med. 2020, 45, 343–352. [Google Scholar] [CrossRef] [Scilit] [PubMed]
- Lee, J.E.; Kim, Y.A.; Yu, S.; Park, S.Y.; Kim, K.H.; Kang, N.J. 3,6-Anhydro-L-galactose increases hyaluronic acid production via the EGFR and AMPKα signaling pathway in HaCaT keratinocytes. J. Dermatol. Sci. 2019, 96, 90–98. [Google Scholar] [CrossRef] [Scilit] [PubMed]
- Shin, M.; Truong, V.-L.; Lee, M.; Kim, D.; Kim, M.S.; Cho, H.; Jung, Y.H.; Yang, J.; Jeong, W.S.; Kim, Y. Investigation of phenyllactic acid as a potent tyrosinase inhibitor produced by probiotics. Curr. Res. Food Sci. 2023, 6, 100413. [Google Scholar] [CrossRef] [Scilit] [PubMed]
- Usuki, A.; Ohashi, A.; Sato, H.; Ochiai, Y.; Ichihashi, M.; Funasaka, Y. The inhibitory effect of glycolic acid and lactic acid on melanin synthesis in melanoma cells. Exp. Dermatol. 2003, 12, 43–50. [Google Scholar] [CrossRef] [Scilit] [PubMed]
- Du, B.; Xiao, M.; Gao, L. Lactic acid inhibits melanin synthesis by regulating histone H3 lactylation and suppressing tyrp1 transcription in B16 melanoma cells. Sci. Rep. 2025, 15, 25816. [Google Scholar] [CrossRef] [Scilit] [PubMed]
- Lee, Y.-S.; Lee, S.-J.; Jang, W.J.; Lee, E.-W. Protective effects of the postbiotic Levilactobacillus brevis BK3 against H2O2-induced oxidative damage in skin cells. J. Microbiol. Biotechnol. 2024, 34, 1401–1409. [Google Scholar] [CrossRef] [PubMed]
- Kobayashi, M.; Yoshiki, R.; Sakabe, J.; Kabashima, K.; Nakamura, M.; Tokura, Y. Expression of toll-like receptor 2, NOD2 and dectin-1 and stimulatory effects of their ligands and histamine in normal human keratinocytes. Br. J. Dermatol. 2009, 160, 297–304. [Google Scholar] [CrossRef] [Scilit] [PubMed]
- Nakai, H.; Hirose, Y.; Murosaki, S.; Yoshikai, Y. Lactobacillus plantarum L-137 upregulates hyaluronic acid production in epidermal cells and fibroblasts in mice. Microbiol. Immunol. 2019, 63, 367–378. [Google Scholar] [CrossRef] [Scilit] [PubMed]
Disclaimer/Publisher’s Note: The statements, opinions and data contained in all publications are solely those of the individual author(s) and contributor(s) and not of MDPI and/or the editor(s). MDPI and/or the editor(s) disclaim responsibility for any injury to people or property resulting from any ideas, methods, instructions or products referred to in the content. |
© 2026 by the authors. Licensee MDPI, Basel, Switzerland. This article is an open access article distributed under the terms and conditions of the Creative Commons Attribution (CC BY) license.