


Abstract
Functional annotation with eggNOG-mapper has become a routine step in bacterial genome analysis, yet its output, a wide table that assigns orthologous groups, COG categories, Gene Ontology terms, enzyme numbers, KEGG orthologs, transporter and carbohydrate-active enzyme families and protein domains to every protein, remains difficult to read and interpret. Existing downstream tools concentrate on KEGG pathway and module completeness and leave most of the other annotation layers unexplored. Here, we present Eggsplorer, a Galaxy platform tool that turns a single eggNOG-mapper annotation file into a self-contained, interactive HTML report. The report brings together visualisations for annotation coverage, the taxonomic level of annotation transfer, COG and GO profiles, enzyme and transporter hierarchies, carbohydrate-active enzymes grouped by substrate, and Pfam domains. Furthermore, the tool provides completeness scores for 178 metabolic functions with gene-level evidence, a schematic cell overview, nitrogen, sulfur and carbon cycle diagrams and a searchable gene table. A report is produced within seconds per genome, needs no network access or external database, and can be downloaded and shared as one file, while the optional output tables can feed directly into downstream Galaxy workflows. Eggsplorer is freely available from the Galaxy Tool Shed, runs on the public Galaxy EU (usegalaxy.eu) server and is accompanied by a Galaxy Training Network tutorial.
1. Introduction
Sequencing a bacterial genome now takes days or even hours; understanding what it encodes and its functional potential still does not. Orthology-based annotation with eggNOG-mapper [1] against the eggNOG database [2,3] has become a widely used solution, being fast, phylogenetically informed and applicable to isolates, metagenome-assembled genomes and metagenomes alike. A single run assigns to every protein orthologous groups at several taxonomic levels; a COG category [4]; Gene Ontology (GO) terms [5]; Enzyme Commission (EC) numbers; KEGG orthologs, pathways and modules [6]; Transporter Classification (TC) identifiers [7]; carbohydrate-active enzyme (CAZy) families [8]; and Pfam domains [9]. The outcome of this richness is a table with more than twenty columns and thousands of rows, most of them lists of unnamed identifiers. Turning it into biological insight requires scripting and familiarity with half a dozen classification systems, a real barrier for microbiologists who simply want to know what their bacterium can do.
Most of the existing downstream tools address only part of this gap. KEGG Mapper reconstructs pathways from KEGG orthologs [10]; DRAM [11], METABOLIC [12] and MicrobeAnnotator [13] summarise metabolic potential; and KEGGaNOG profiles KEGG module completeness directly from eggNOG-mapper output [14]. All of them centre on KEGG: they either re-annotate proteins against their own databases or read only the KEGG columns. The COG and GO profiles, enzyme classes, transporters, CAZymes and protein domains already present in the same file are left to the user, although they tell much of a bacterium’s story: which polysaccharides it can degrade, which nutrients it takes up and how its functional fingerprint compares with that of its relatives.
Galaxy [15] provides a graphical environment for accessible and reproducible bioinformatics analysis, with tools distributed through the Galaxy Tool Shed [16]. It gives researchers without programming experience a graphical interface to thousands of tools, records the provenance of every analysis and turns any series of steps into a reusable workflow. As eggNOG-mapper is itself available in Galaxy, a visualisation step placed directly after it lets annotation and interpretation run in one reproducible workflow. Here, we present Eggsplorer, a Galaxy tool that converts the complete eggNOG-mapper output of a bacterial genome into one interactive report and a set of reusable tables, showing what the annotation contains, organised and named, including charts and visualisations.
2. Materials and Methods
Eggsplorer is written in Python 3 and needs only the standard library for parsing and computation; interactive charts use Plotly.js [17]. The input is the standard .emapper.annotations file of eggNOG-mapper v2 [1]; the examples in this study were annotated with eggNOG-mapper 2.1.13 and eggNOG database 5.0.2 on usegalaxy.eu. Optional filters on the e-value and bit score of the seed ortholog remove weak assignments. KEGG ortholog (KO) assignments are taken from eggNOG-mapper; KofamScan [18] as a second source of KO assignments is planned for a future version.
Each annotation layer is summarised independently, counting proteins rather than identifiers: a protein is counted once per category but can fall into several (multi-letter COG, several EC, TC, CAZy or Pfam assignments, GO ancestors), so category totals can exceed the number of proteins. The Sankey diagrams use the same protein counts for the width of each link. COG letters are mapped to the 26 functional categories [4], and GO terms are updated to current identifiers and propagated to all ancestors (is_a, part_of) of a bundled GO release [5]. Root terms, terms not meant for annotation, terms fewer than three levels below the root and terms covered to at least 90% by a more specific descendant are hidden from the charts, because they are too general to be informative or would show the same proteins twice. EC numbers are arranged in their four-level hierarchy and named from ENZYME [19]; TC identifiers are grouped into TCDB subclasses and families [7]; and CAZy families are grouped into classes [8] and into putative substrates using the family–substrate associations of dbCAN-sub [20]. No KEGG content is bundled, and KO identifiers link to the KEGG website [6].
Completeness of 178 metabolic functions, from central carbon metabolism, fermentation and respiration to nitrogen and sulfur metabolism, transport, secretion and motility, is scored from KO assignments with the function definitions and scoring scheme of Graham et al. [21]. The scoring functions of KEGG-Decoder v1.3 [21] are run unchanged from the original source; automated tests on random sets of KOs confirm that the default scores are identical to those of the published script. A corrected score is reported alongside: it counts alcohol dehydrogenases in mixed-acid fermentation, which a coding error in the original excludes; Sec–SRP genes without the original requirement for SecD/SecF; and the fused nuoCD and nuoBCD genes as their separate subunits. It leaves unscored two functions for which no KO is defined (reported as NA, not as absent), and it rescales every function to its achievable maximum, so that a complete pathway weighted, for example, 3 × 0.33 is shown as 1.00 instead of 0.99. Table S2 lists each change and its effect on the 20 reference genomes. For every function, the report lists the genes that were found and the KOs of the definition that are missing. Scores measure how much of a definition is matched by KO assignments, not whether a complex is functional. The cell overview and the element cycle diagrams are drawn from these scores by fixed and documented rules, which cannot be changed by the user, so that the same input always gives the same report: a cell component is drawn only when at least half of its definition is present (1.00 when all defined KOs are found), and partial systems are listed as fragments. In the cycle diagrams every step keeps its place, and the arrow is shaded by completeness (pale and thin below 0.50, dashed grey when no gene is found). A step whose catalytic subunit (for example, narG, nifD, dsrA or soxB) is missing is drawn pale whatever its score. Sulfate assimilation, which these definitions cover only in part, is read directly from the KOs of KEGG module M00176 and drawn beside the dissimilatory pathway, and steps that rest on the same proteins are flagged. Shared KOs can still make a step appear without independent evidence; the known cases are listed in Table S3.
The Galaxy wrapper installs Eggsplorer from Bioconda (package eggsplorer) and returns the report as an HTML dataset and the optional tables as a list collection. All scripts, data and fonts are embedded, so the report makes no network requests. Continuous integration on GitHub compares report numbers with an independent computation, checks the reproduction of the original metabolic scores, verifies the layout of the diagrams in a headless browser and runs Planemo tests of the wrapper in Galaxy on a synthetic genome. To check the cell overview and element-cycle diagrams against known biology, Eggsplorer was run on eggNOG-mapper annotations of 20 reference genomes from 12 bacterial phyla (Table S1). Components and cycle steps expected to be present or absent in each genome were encoded as 257 automated checks that run with every code change. These are regression checks of the drawing rules, several of which were refined on the same genomes, not an independent accuracy benchmark. The expected traits, sources and known limitations are given in Table S1, and the KO assignments of the 20 genomes and the checks are included in the GitHub repository, so that users can rerun them.
3. Results
3.1. From One Table to One Report
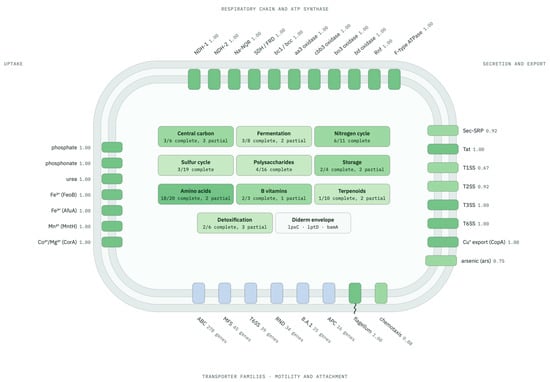
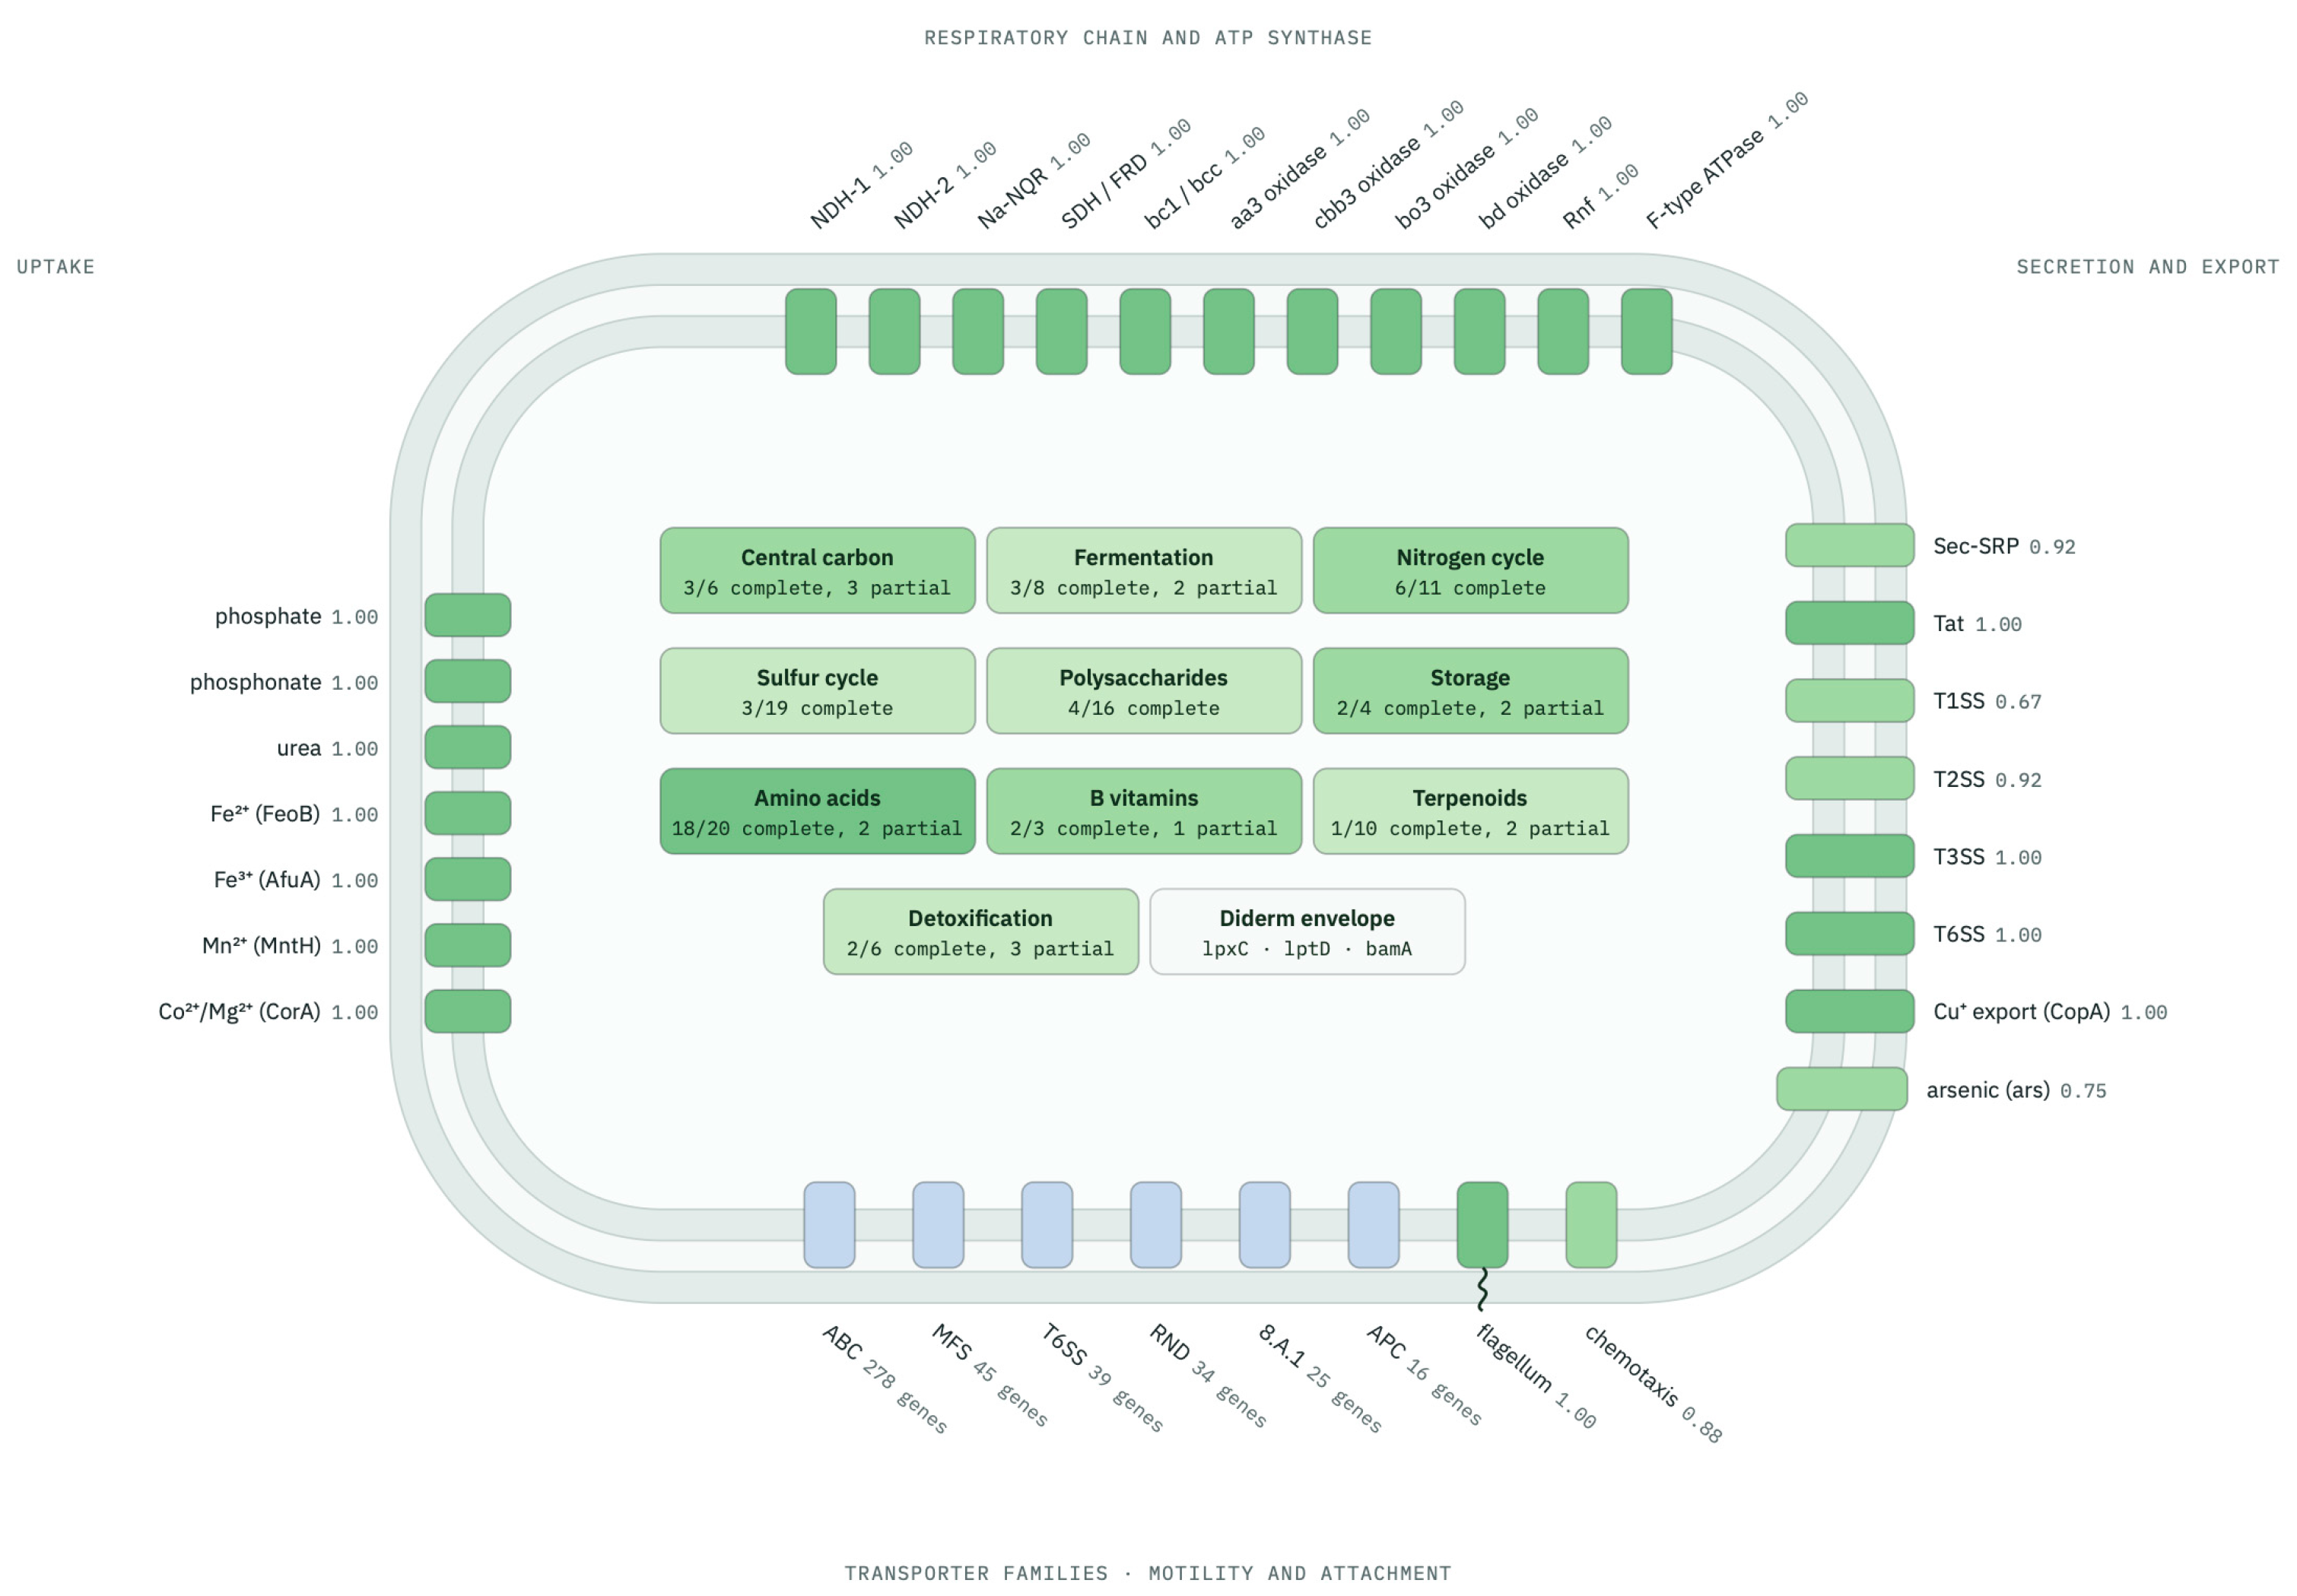
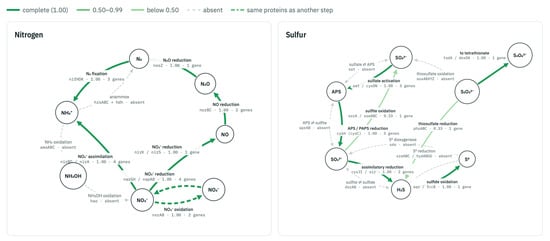
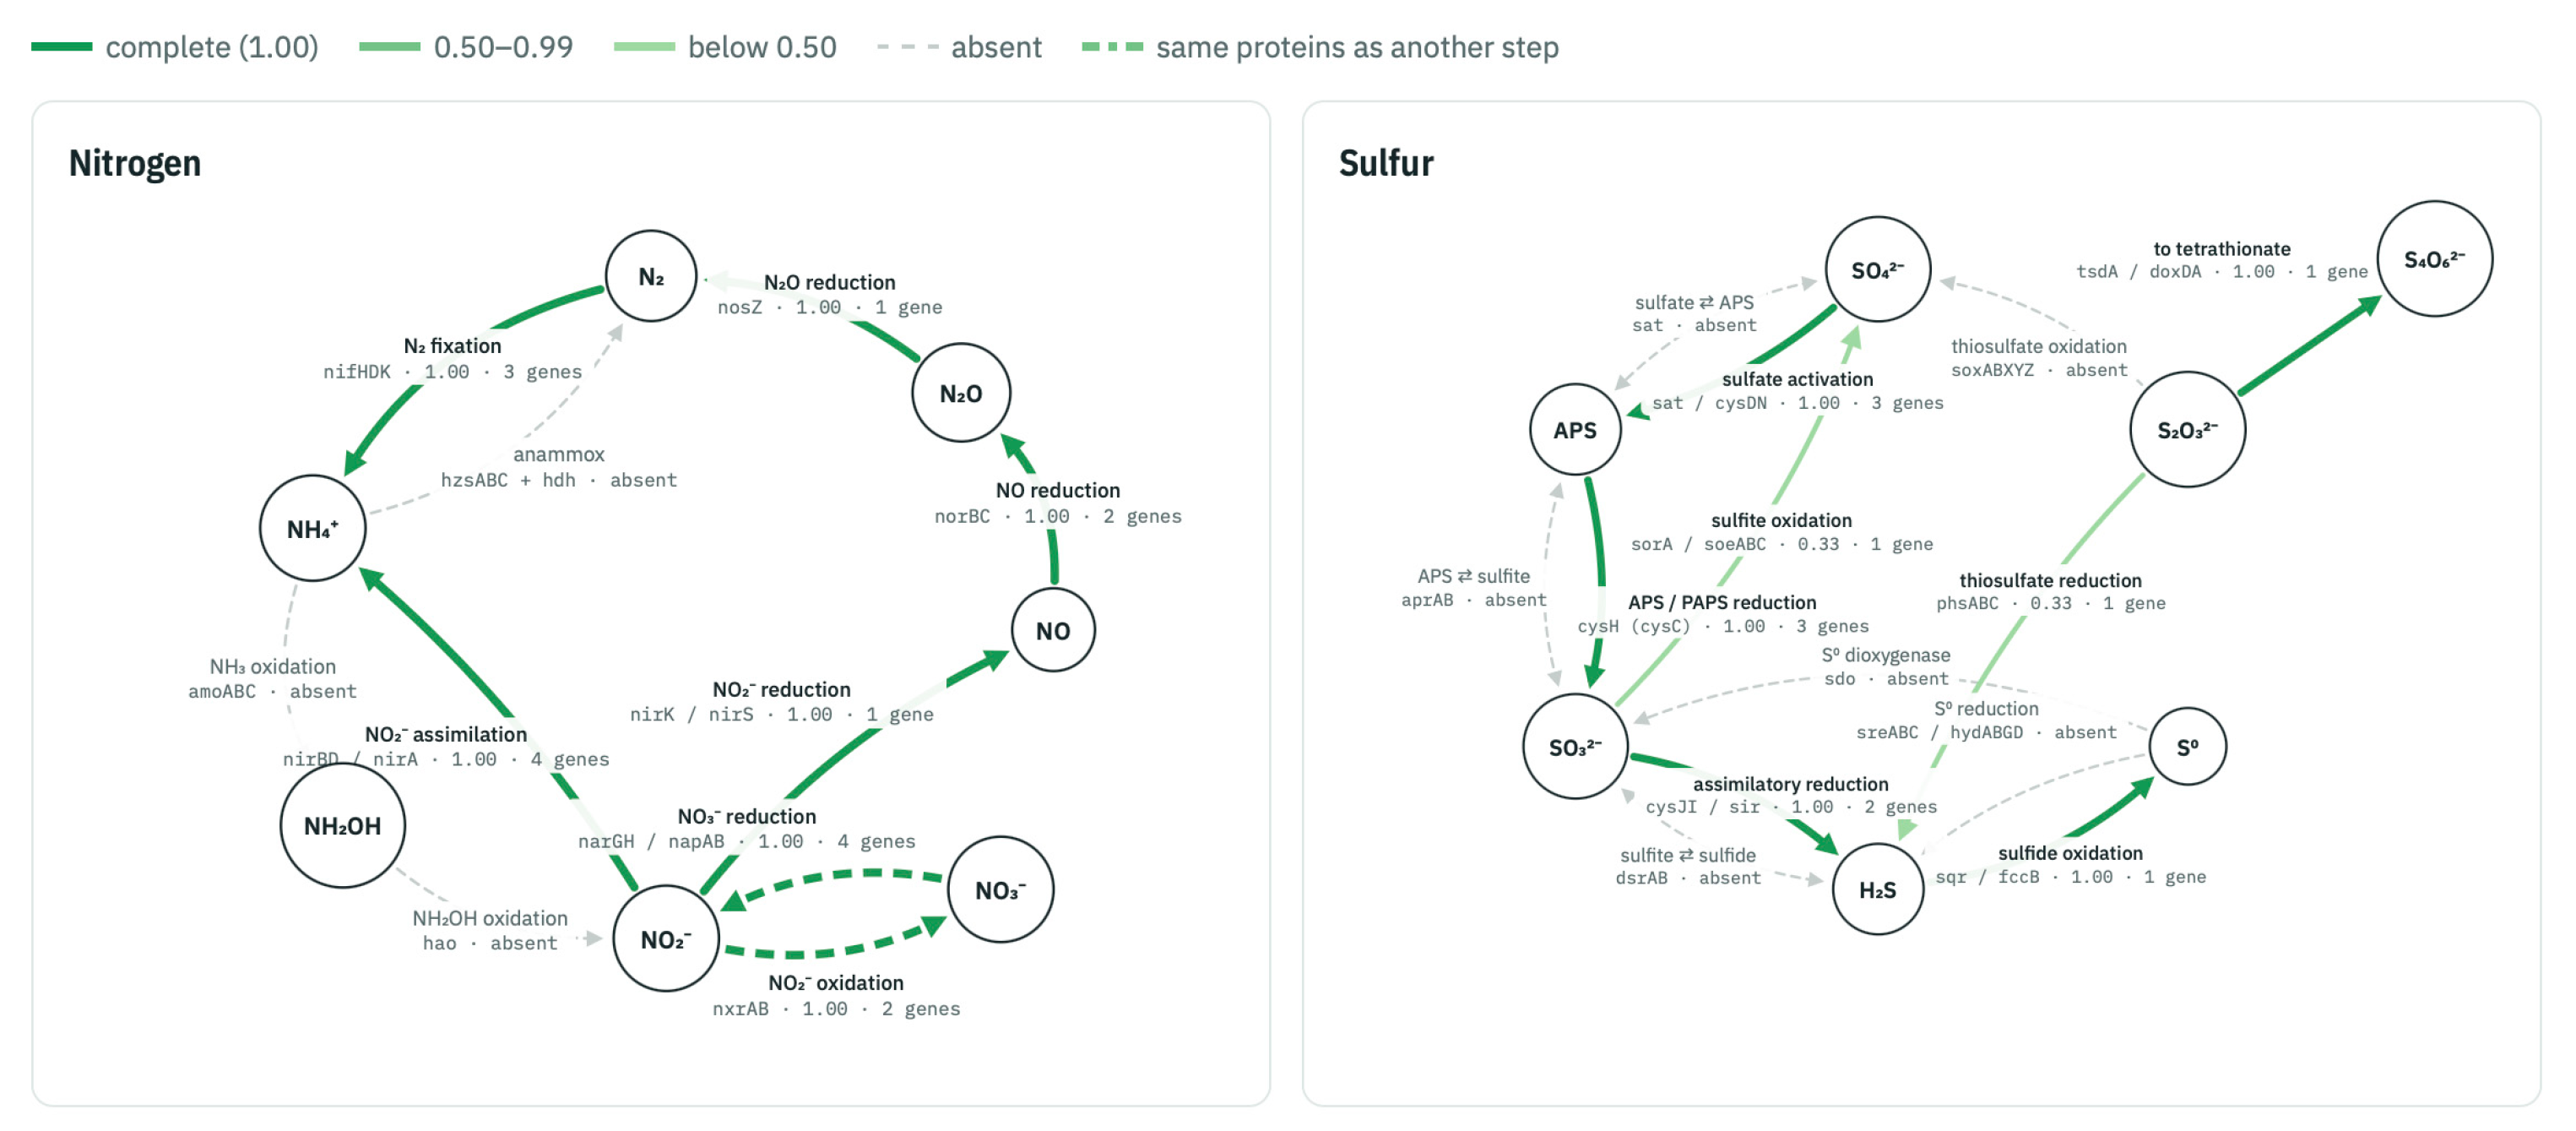
Eggsplorer reorganises the eggNOG-mapper table into eleven linked sections, each answering a distinct question about the genome (Table 1). The overview reports annotation coverage and the distribution of taxonomic levels at which annotations were transferred, which gives context for the annotation but does not measure its accuracy. COG and GO profiles follow, with names and protein counts on hover. The cell overview (Figure 1) places the detected respiratory complexes, ATP synthase, uptake and secretion systems, transporters, flagellum and metabolic function groups on a fixed bacterial cell, so that genomes can be compared at a glance, and the element cycle diagrams (Figure 2) highlight the transformations the genome can potentially perform. Sankey diagrams lead from transporter and enzyme classes down to individual families, CAZymes are shown by family and by substrate, and a searchable gene table links every summary back to individual proteins. As examples, Figure 1 shows the cell overview of Pseudomonas aeruginosa PAO1 [22], whose branched respiratory chain is well characterised [23], and Figure 2 the nitrogen and sulfur cycles of the root-associated, nitrogen-fixing and denitrifying Pseudomonas stutzeri A1501 [24], two well-described genomes against which the diagrams can be checked. The full Eggsplorer 1.1.0 report for P. aeruginosa PAO1 is provided as Supplementary Material.
Table 1.
Sections of the Eggsplorer report, the eggNOG-mapper fields they use and their typical use.
Figure 1.
Cell overview of Pseudomonas aeruginosa PAO1 [22], a functional schematic rather than a map of subcellular location, drawn by Eggsplorer 1.1.0 from the eggNOG-mapper annotation [1] of its RefSeq proteome (assembly GCF_000006765.1; 5163 of the 5479 proteins in the eggNOG-mapper output have a description, KO or COG category). Components are grouped by function: respiratory chain and ATP synthase on top, uptake systems on the left, secretion and export on the right, and the largest transporter families and motility at the bottom; green shades give completeness (dark, 1.00; light, 0.50–0.99), uptake labels name the marker found, blue blocks give the number of proteins in the largest TC families (8.A.1, membrane fusion proteins), and the central tiles give how many curated functions of each group are complete or partial. Genes for lipid A synthesis and outer-membrane biogenesis (lpxC, lptD, bamA; the rule requires bamA and one of lpxA, lpxC, lpxD or lptD) are consistent with the diderm envelope of this Gram-negative bacterium. All displayed respiratory complexes score 1.00: complex I (NDH-1), NDH-2, the NQR complex (labelled Na+-NQR after its KEGG name; the ion it translocates cannot be inferred from KOs), the bc1 complex and the aa3, cbb3, bo3 and bd-type terminal oxidases, consistent with the oxidase classes described for P. aeruginosa [23]; two ccoNO pairs match its two cbb3 oxidases. Rnf rests on six proteins (NP_252179.1–NP_252184.1) that are distinct from those of NQR. Type I, II, III and VI secretion systems, the flagellum, and chemotaxis are also drawn. Components scoring below 0.50 are listed under the drawing in the reportinstead of being drawn.
Figure 2.
Nitrogen (left) and sulfur (right) cycle diagrams of Pseudomonas stutzeri A1501, a root-associated, nitrogen-fixing and denitrifying bacterium [24], from the Eggsplorer 1.1.0 report of its RefSeq proteome (assembly GCF_000013785.1; 3805 of the 4054 proteins in the eggNOG-mapper output have a description, KO or COG category). Arrows are coloured by completeness (dark green, 1.00; light green, 0.50–0.99; pale green, below 0.50; dashed grey, no gene found), dashed green arrows rest on the same proteins as another step, and labels name the genes and the number of proteins. Arrows show genomic potential inferred from gene presence, not confirmed biochemical activity. The nitrogen cycle shows nitrogen fixation (nifHDK) together with all selected markers of denitrification from nitrate to N2 (narGH/napAB, nirS, norBC, nosZ), in agreement with the nif island and denitrification genes described for this strain [24]. Nitrite oxidation and nitrate reduction are dashed because NxrAB and NarGH share KEGG orthologs, and nitrite reduction to ammonium by NirBD is shown as nitrite assimilation because the respiratory nitrite reductase NrfA is not found. In the sulfur cycle all genes of the inner assimilatory route are found (cysDN, cysC, cysH, cysJI; APS and PAPS share one node), whereas no genes for the outer dissimilatory pathway (sat, aprAB, dsrAB) or the Sox system were found in this annotation. A putative thiosulfate dehydrogenase (TsdA, K19713; WP_011913946.1) supports the thiosulfate-to-tetrathionate step, a trait reported for the P. stutzeri group [25]. The two pale arrows (sulfite oxidation and thiosulfate reduction, 0.33) rest on one molybdopterin oxidoreductase (WP_011914708.1, assigned both K21307 and K08352), so they are not independent evidence; the report flags them as shared.
3.2. Tool Outputs
The main output is a single HTML file of about 5–6 MB that contains all data, scripts and fonts. It opens offline in any modern browser, keeps its interactivity (hover details, zoom, search, sorting) and can be downloaded, sent to collaborators or deposited as Supplementary Material without loss. Optionally, Eggsplorer also returns ten tab-separated tables as a Galaxy collection (COG categories, top GO terms, EC hierarchy, TC families, CAZy families, CAZy substrates, Pfam domains, KEGG pathways, KEGG modules as assigned by eggNOG-mapper rather than module completeness, and metabolic function scores with their genes, with NA for functions that are not scored). These are ordinary Galaxy datasets that can be joined, filtered, plotted or compared across genomes with other Galaxy tools, so the report becomes the start of a workflow rather than its end point. For example, the metabolic function tables of several genomes can be merged into one matrix with the Galaxy tool Column join and plotted as a heatmap; Eggsplorer itself does not yet offer a built-in visual comparison of several genomes. Reports for bacterial genomes with 3000–7000 annotated proteins were produced in less than ten seconds each on a two-core virtual machine. In Galaxy, the tool can be run on a collection of genomes, giving one report per genome; a pooled input of 62,118 proteins from the 20 reference genomes was processed in under two seconds and gave a 15 MB report, and the gene table is shown in pages of 25 rows, so large reports stay responsive in the browser. A step-by-step Galaxy Training Network tutorial [26] leads from protein sequences to the report (https://training.galaxyproject.org/training-material/topics/genome-annotation/tutorials/eggsplorer/tutorial.html, accessed on 10 November 2026).
4. Conclusions
Eggsplorer makes the content of eggNOG-mapper annotations user-friendly and easily readable. It uses all major annotation layers rather than KEGG alone, delivers them as one report that can be shared as easily as a PDF, returns the underlying summaries as tables ready for further analysis and, as a Galaxy tool, requires no installation or programming from its users and fits directly into existing annotation workflows. All visual elements follow fixed, documented rules, so the same input always gives the same report.
The report is, however, only as good as its input. Every gene, function and diagram is derived from the eggNOG-mapper annotation, which Eggsplorer does not revise: genes missed or misannotated by orthology transfer will be missing or misplaced. Eggsplorer is designed and tested for genomes of single isolates; in incomplete draft or metagenome-assembled genomes, missing genes lower completeness scores, so components that are not drawn should be read as not detected rather than absent. The diagrams have not been benchmarked quantitatively against measured phenotypes or other tools; they display the annotation through published definitions and should be read as hypotheses for experimental testing. Gene presence indicates genomic potential, not activity, and functions absent from the definitions or encoded by divergent proteins cannot be detected. Future versions may add new features, including a built-in multi-genome comparison, KofamScan as a second source of KO assignments, user-adjustable thresholds and further annotation layers.
Supplementary Materials
The following supporting information can be downloaded at https://www.mdpi.com/article/10.3390/cimb48111239/s1.
Funding
This work was funded by the project FP25-BF-004, University of Plovdiv, Bulgaria.
Institutional Review Board Statement
Not applicable.
Informed Consent Statement
Not applicable.
Data Availability Statement
Eggsplorer is published in the main Galaxy Tool Shed (https://toolshed.g2.bx.psu.edu/view/galaxyp/eggsplorer) and in Bioconda (package eggsplorer), can be installed on any Galaxy server and is available on the public server https://usegalaxy.eu. Source code, documentation, and the KO assignments of the 20 reference genomes are available on GitHub (https://github.com/vebaev/eggsplorer). A Galaxy Training Network tutorial is available at https://training.galaxyproject.org/training-material/topics/genome-annotation/tutorials/eggsplorer/tutorial.html.
Acknowledgments
During the preparation of this study, the authors used the Claude Opus 5.5 model (Anthropic), through Claude Code, to assist with code review, and improve the English language of the text. The authors edited the output and take full responsibility for the content of this publication.
Conflicts of Interest
The author declares no conflict of interest.
References
- Cantalapiedra, C.P.; Hernández-Plaza, A.; Letunic, I.; Bork, P.; Huerta-Cepas, J. eggNOG-mapper v2: Functional Annotation, Orthology Assignments, and Domain Prediction at the Metagenomic Scale. Mol. Biol. Evol. 2021, 38, 5825–5829. [Google Scholar] [CrossRef] [Scilit] [PubMed]
- Huerta-Cepas, J.; Szklarczyk, D.; Heller, D.; Hernández-Plaza, A.; Forslund, S.K.; Cook, H.; Mende, D.R.; Letunic, I.; Rattei, T.; Jensen, L.J.; et al. eggNOG 5.0: A Hierarchical, Functionally and Phylogenetically Annotated Orthology Resource Based on 5090 Organisms and 2502 Viruses. Nucleic Acids Res. 2019, 47, D309–D314. [Google Scholar] [CrossRef] [Scilit] [PubMed]
- Hernández-Plaza, A.; Szklarczyk, D.; Botas, J.; Cantalapiedra, C.P.; Giner-Lamia, J.; Mende, D.R.; Kirsch, R.; Rattei, T.; Letunic, I.; Jensen, L.J.; et al. eggNOG 6.0: Enabling Comparative Genomics across 12 535 Organisms. Nucleic Acids Res. 2023, 51, D389–D394. [Google Scholar] [CrossRef] [Scilit] [PubMed]
- Galperin, M.Y.; Wolf, Y.I.; Makarova, K.S.; Vera Alvarez, R.; Landsman, D.; Koonin, E.V. COG Database Update: Focus on Microbial Diversity, Model Organisms, and Widespread Pathogens. Nucleic Acids Res. 2021, 49, D274–D281. [Google Scholar] [CrossRef] [Scilit] [PubMed]
- Gene Ontology Consortium; Aleksander, S.A.; Balhoff, J.; Carbon, S.; Cherry, J.M.; Drabkin, H.J.; Ebert, D.; Feuermann, M.; Gaudet, P.; Harris, N.L.; et al. The Gene Ontology Knowledgebase in 2023. Genetics 2023, 224, iyad031. [Google Scholar] [CrossRef] [Scilit] [PubMed]
- Kanehisa, M.; Goto, S. KEGG: Kyoto Encyclopedia of Genes and Genomes. Nucleic Acids Res. 2000, 28, 27–30. [Google Scholar] [CrossRef] [Scilit] [PubMed]
- Saier, M.H.; Reddy, V.S.; Moreno-Hagelsieb, G.; Hendargo, K.J.; Zhang, Y.; Iddamsetty, V.; Lam, K.J.K.; Tian, N.; Russum, S.; Wang, J.; et al. The Transporter Classification Database (TCDB): 2021 Update. Nucleic Acids Res. 2021, 49, D461–D467. [Google Scholar] [CrossRef] [Scilit] [PubMed]
- Drula, E.; Garron, M.L.; Dogan, S.; Lombard, V.; Henrissat, B.; Terrapon, N. The Carbohydrate-Active Enzyme Database: Functions and Literature. Nucleic Acids Res. 2022, 50, D571–D577. [Google Scholar] [CrossRef] [Scilit] [PubMed]
- Mistry, J.; Chuguransky, S.; Williams, L.; Qureshi, M.; Salazar, G.A.; Sonnhammer, E.L.L.; Tosatto, S.C.E.; Paladin, L.; Raj, S.; Richardson, L.J.; et al. Pfam: The Protein Families Database in 2021. Nucleic Acids Res. 2021, 49, D412–D419. [Google Scholar] [CrossRef] [Scilit] [PubMed]
- Kanehisa, M.; Sato, Y. KEGG Mapper for Inferring Cellular Functions from Protein Sequences. Protein Sci. 2020, 29, 28–35. [Google Scholar] [CrossRef] [Scilit] [PubMed]
- Shaffer, M.; Borton, M.A.; McGivern, B.B.; Zayed, A.A.; La Rosa, S.L.; Solden, L.M.; Liu, P.; Narrowe, A.B.; Rodríguez-Ramos, J.; Bolduc, B.; et al. DRAM for Distilling Microbial Metabolism to Automate the Curation of Microbiome Function. Nucleic Acids Res. 2020, 48, 8883–8900. [Google Scholar] [CrossRef] [Scilit] [PubMed]
- Zhou, Z.; Tran, P.Q.; Breister, A.M.; Liu, Y.; Kieft, K.; Cowley, E.S.; Karaoz, U.; Anantharaman, K. METABOLIC: High-Throughput Profiling of Microbial Genomes for Functional Traits, Metabolism, Biogeochemistry, and Community-Scale Functional Networks. Microbiome 2022, 10, 33. [Google Scholar] [CrossRef] [Scilit] [PubMed]
- Ruiz-Perez, C.A.; Conrad, R.E.; Konstantinidis, K.T. MicrobeAnnotator: A User-Friendly, Comprehensive Functional Annotation Pipeline for Microbial Genomes. BMC Bioinform. 2021, 22, 11. [Google Scholar] [CrossRef] [Scilit] [PubMed]
- Popov, I.V.; Chikindas, M.L.; Venema, K.; Ermakov, A.M.; Popov, I.V. KEGGaNOG: A Lightweight Tool for KEGG Module Profiling from Orthology-Based Annotations. Mol. Nutr. Food Res. 2026, 70, e70269. [Google Scholar] [CrossRef] [Scilit] [PubMed]
- The Galaxy Community. The Galaxy Platform for Accessible, Reproducible, and Collaborative Data Analyses: 2024 Update. Nucleic Acids Res. 2024, 52, W83–W94. [Google Scholar] [CrossRef] [Scilit] [PubMed]
- Blankenberg, D.; Von Kuster, G.; Bouvier, E.; Baker, D.; Afgan, E.; Stoler, N.; Galaxy Team; Taylor, J.; Nekrutenko, A. Dissemination of Scientific Software with Galaxy ToolShed. Genome Biol. 2014, 15, 403. [Google Scholar] [CrossRef] [Scilit] [PubMed]
- Plotly Technologies Inc. Collaborative Data Science. Available online: https://plot.ly (accessed on 22 October 2026).
- Aramaki, T.; Blanc-Mathieu, R.; Endo, H.; Ohkubo, K.; Kanehisa, M.; Goto, S.; Ogata, H. KofamKOALA: KEGG Ortholog Assignment Based on Profile HMM and Adaptive Score Threshold. Bioinformatics 2020, 36, 2251–2252. [Google Scholar] [CrossRef] [Scilit] [PubMed]
- Bairoch, A. The ENZYME Database in 2000. Nucleic Acids Res. 2000, 28, 304–305. [Google Scholar] [CrossRef] [Scilit] [PubMed]
- Zheng, J.; Ge, Q.; Yan, Y.; Zhang, X.; Huang, L.; Yin, Y. dbCAN3: Automated Carbohydrate-Active Enzyme and Substrate Annotation. Nucleic Acids Res. 2023, 51, W115–W121. [Google Scholar] [CrossRef] [Scilit] [PubMed]
- Graham, E.D.; Heidelberg, J.F.; Tully, B.J. Potential for Primary Productivity in a Globally-Distributed Bacterial Phototroph. ISME J. 2018, 12, 1861–1866. [Google Scholar] [CrossRef] [Scilit] [PubMed]
- Stover, C.K.; Pham, X.Q.; Erwin, A.L.; Mizoguchi, S.D.; Warrener, P.; Hickey, M.J.; Brinkman, F.S.; Hufnagle, W.O.; Kowalik, D.J.; Lagrou, M.; et al. Complete Genome Sequence of Pseudomonas aeruginosa PAO1, an Opportunistic Pathogen. Nature 2000, 406, 959–964. [Google Scholar] [CrossRef] [Scilit] [PubMed]
- Arai, H. Regulation and Function of Versatile Aerobic and Anaerobic Respiratory Metabolism in Pseudomonas aeruginosa. Front. Microbiol. 2011, 2, 103. [Google Scholar] [CrossRef] [Scilit] [PubMed]
- Yan, Y.; Yang, J.; Dou, Y.; Chen, M.; Ping, S.; Peng, J.; Lu, W.; Zhang, W.; Yao, Z.; Li, H.; et al. Nitrogen Fixation Island and Rhizosphere Competence Traits in the Genome of Root-Associated Pseudomonas stutzeri A1501. Proc. Natl. Acad. Sci. USA 2008, 105, 7564–7569. [Google Scholar] [CrossRef] [Scilit] [PubMed]
- Sorokin, D.Y.; Teske, A.; Robertson, L.A.; Kuenen, J.G. Anaerobic Oxidation of Thiosulfate to Tetrathionate by Obligately Heterotrophic Bacteria, Belonging to the Pseudomonas stutzeri Group. FEMS Microbiol. Ecol. 1999, 30, 113–123. [Google Scholar] [CrossRef] [PubMed]
- Hiltemann, S.; Rasche, H.; Gladman, S.; Hotz, H.-R.; Larivière, D.; Blankenberg, D.; Jagtap, P.D.; Wollmann, T.; Bretaudeau, A.; Goué, N.; et al. Galaxy Training: A Powerful Framework for Teaching! PLoS Comput. Biol. 2023, 19, e1010752. [Google Scholar] [CrossRef] [Scilit] [PubMed]

Disclaimer/Publisher’s Note: The statements, opinions and data contained in all publications are solely those of the individual author(s) and contributor(s) and not of MDPI and/or the editor(s). MDPI and/or the editor(s) disclaim responsibility for any injury to people or property resulting from any ideas, methods, instructions or products referred to in the content. |
© 2026 by the author. Licensee MDPI, Basel, Switzerland. This article is an open access article distributed under the terms and conditions of the Creative Commons Attribution (CC BY) license.