


Abstract
Persistent hyperglycemia is associated with oxidative modification of endogenous cellular components, but the temporal and tissue-specific development of these alterations remains insufficiently characterized. This study aimed to characterize temporal and tissue-specific patterns of oxidative modification of chemically distinct endogenous targets during persistent STZ-induced hyperglycemia. Sixteen male Wistar rats were divided into one control and three STZ-treated groups examined 1, 2, or 4 weeks after STZ administration. TBARSs, conjugated dienes, protein carbonyls (prot-DNPH), non-protein thiols (NPSHs), and o- and m-tyrosine were determined in the small intestine, liver, and kidney. Oxidative modifications showed distinct temporal and tissue-specific patterns. The small intestine and kidney exhibited the most pronounced overall alterations. In the small intestine, protein carbonyl (80.1–89.5%) and conjugated diene levels (55.3–160.5%) were significantly elevated at all time points, whereas several oxidative markers increased progressively in the kidney. At 4 weeks, all investigated markers except NPSH were elevated in the small intestine and kidney. In contrast, o-Tyr + m-Tyr increased predominantly at later time points (159.1–302.3%), particularly in the liver. Distinct temporal and tissue-specific patterns of oxidative modifications of endogenous cellular components were observed in STZ-treated rats with persistent hyperglycemia. These findings provide a biochemical context for altered xenobiotic disposition previously observed in the same experimental model and support further investigation of the molecular links between oxidative modification and xenobiotic metabolism and transport.
1. Introduction
Diabetes mellitus is a complex endocrine metabolic disorder that affects a large proportion of the world’s population and is on an ever-increasing trend. It is a group of metabolic diseases characterized by hyperglycemia resulting from defects in insulin secretion, insulin action, or both. Characterized by elevated blood glucose levels, diabetes mellitus is divided into multiple categories based on pathogenesis, including type 1 diabetes mellitus (T1DM), type 2 diabetes mellitus (T2DM), gestational diabetes, and other specific forms [1,2,3].
Hyperglycemia can induce oxidative stress through several interconnected mechanisms, including glucose autoxidation, the polyol pathway, advanced glycation end product (AGE) formation, and activation of PKCβ1/2 [4]. Together, these pathways, along with hyperglycemia-induced mitochondrial dysfunction (electron and proton leaks) and endoplasmic reticulum (ER) stress, reflect hyperglycemia-induced superoxide radical overproduction by the mitochondrial electron-transport chain [5]. Accumulation of reactive oxygen species (ROS) promotes cellular damage and contributes to the development and progression of diabetic complications [6,7]. Carbohydrates, lipids, proteins, and DNA are targets of oxidative stress modification, and stable products of ROS-derived macromolecular damage may serve as oxidative stress markers.
Hyperglycemia can also alter the pharmacokinetics and pharmacodynamics of drugs through multiple pathophysiological changes, including delayed gastric emptying, altered plasma protein binding associated with protein glycation, and changes in drug transporter expression and cytochrome P450 (CYP) enzyme activity [8,9,10]. In addition to enzyme-catalyzed biotransformation, reactive oxygen species, particularly hydroxyl radicals, can mediate the nonenzymatic oxidation of drugs and generate oxidized products that are not formed through conventional metabolic pathways. Such oxidative reactions may modify the metabolic fate and pharmacological properties of the parent compound and may also provide information about the oxidative environment of biological systems [10,11,12,13,14].
The streptozotocin (STZ)-induced hyperglycaemic rat is a frequently used experimental model for investigating diabetes and its associated metabolic and pathological alterations. When administered intravenously, STZ is a highly effective and selective cytotoxic agent for pancreatic B cells and can induce persistent hyperglycemia. Selecting an appropriate treatment for animals and the STZ dose are critical issues [15]. A single high-dose injection of STZ can produce type 1 diabetes phenotype in adult rats [15]. Because of strain differences, diabetogenic STZ doses range from 45 to 70 mg/kg [16]. On the other hand, there are several other STZ-treatments to mimic type 2 diabetes [15]. In our experiment, after an intravenous (i.v.) STZ dose of 65 mg/kg, stable diabetes with persistent hyperglycemia (plasma glucose > 20 mM) was maintained throughout the 4-week experimental period.
Our previous studies have reported alterations in xenobiotic disposition under hyperglycemic conditions, including changes in the activities of drug-metabolizing enzymes and transporters [17,18,19,20]. Oxidative modifications of endogenous proteins and lipids may provide relevant biochemical context for investigating these alterations. However, the extent to which oxidative modification of endogenous cellular components is associated with changes in xenobiotic metabolism or transport remains unclear. Characterizing tissue-specific patterns of oxidative modification may therefore help identify questions for future studies investigating the relationship between oxidative stress and xenobiotic disposition under persistent hyperglycemic conditions.
This question was further prompted by our previous observation that a nonenzymatically formed oxidation product of ibuprofen was detectable in the small intestinal perfusate and bile of STZ-treated hyperglycemic rats [20]. The characteristics of this product were consistent with hydroxyl radical-mediated oxidation, suggesting that reactive oxidative processes may contribute to the altered chemical environment under experimental hyperglycemia. Our earlier studies, however, did not demonstrate increased formation of nonenzymatically oxidized or hydroxylated aromatic xenobiotics under the 1-week experimental conditions [17,18,19]. This raised the possibility that oxidative modification may develop in a time- and tissue-dependent manner and that different classes of endogenous cellular targets may exhibit different temporal responses.
Accordingly, the present study was designed to characterize tissue-specific patterns of oxidative modification in the liver, small intestine, and kidney of STZ-treated rats examined at 1, 2, and 4 weeks after STZ administration. We assessed complementary markers representing different types of oxidative modification. Lipid oxidation was evaluated using conjugated dienes and TBARS, protein oxidation using protein carbonyls (prot-DNPH), and changes in non-protein thiol status using DTNB-reactive thiols. Oxidative hydroxylation of phenylalanine was assessed by measuring o- and m-tyrosine (o-Tyr + m-Tyr), established markers of hydroxyl radical-mediated aromatic hydroxylation. This approach enabled the comparison of oxidative modification markers across tissues and experimental time points, using the week-1 control group as a common reference.
The study was not intended to introduce new oxidative stress biomarkers or a new analytical methodology. Rather, it was designed to characterize the tissue-specific patterns of oxidative modification observed in STZ-treated rats with persistent hyperglycemia and to establish a biochemical context for the altered xenobiotic disposition previously observed in this model. By examining three organs and several classes of endogenous targets at different time points after STZ administration, the study provides a tissue-resolved description of oxidative modification that may guide subsequent investigations into the molecular mechanisms linking hyperglycemia, oxidative damage, and altered xenobiotic metabolism and transport. Because time-matched control groups were not included at weeks 2 and 4, differences observed across the experimental time points cannot be attributed exclusively to the duration of hyperglycemia.
2. Materials and Methods
2.1. Chemicals
Guanidine hydrochloride, glacial acetic acid (CH3COOH), and thiobarbituric acid (TBA) were purchased from M.P. Biomedicals (Illkirch, France), Scharlau (Barcelona, Spain), and AppliChem (Darmstadt, Germany), respectively. Glutathione (GSH), butylated hydroxytoluene (BHT), Trizma, 5,5′-dithiobis-(2-nitrobenzoic acid) (DTNB), phenylalanine (Phe), o-tyrosine (o-Tyr), m-tyrosine (m-Tyr), and p-tyrosine (p-Tyr) were from Sigma-Aldrich (Budapest, Hungary). All other chemicals and reagents were analytical or HPLC grade.
2.2. Animals and Experimental Design
Male Wistar-Hanover rats (9–11 weeks old; 250–300 g; TOXI-COOP, Budapest, Hungary) were randomly allocated to four experimental groups (n = 4 per group). Group I consisted of citrate-buffer-treated reference animals and was analyzed after 1 week. Groups II–IV consisted of STZ-treated animals and were analyzed after 1, 2, and 4 weeks, respectively (Table 1).
Table 1.
Treatment of the Groups II, III and IV of the experimental animals.
No formal a priori statistical sample-size calculation was performed. Three animals per group were considered the minimum required to conduct the planned experiments. One additional animal was included to allow for a potential loss during the experimental period and to ensure that the planned experiments could still be completed with the minimum required number of animals. All four animals in each group were ultimately included in the analyses.
Hyperglycemia was defined as a blood glucose concentration exceeding 20 mmol/L and was assessed by blood glucose measurement. The experimental groups were examined at 1, 2, or 4 weeks after STZ administration, as described above.
Experimental diabetes was induced by intravenous injection of streptozotocin (STZ) (65 mg/kg bw, i.v.) freshly dissolved in 0.1 M pH 4.0 citrate buffer (2 mL/kg). Intravenous administration of STZ is an established approach for inducing persistent hyperglycemia in rats [15,16]. The experimental animals were provided standard chow (Safe D40, Scientific Diets, Rosenberg, Germany) and water ad libitum. Food was withdrawn the day before the experiments (at 4 p.m.). Hyperglycemia was defined as a blood glucose concentration exceeding 20 mmol/L and was assessed by blood glucose measurement. The experimental groups were examined at 1, 2, or 4 weeks after STZ administration, as described above.
The animals were anesthetized with an intraperitoneal injection of urethane (1.2 g/kg bw, i.p.). The abdomen was opened by a midline incision, and the selected organs (liver, small intestine, and kidney) were collected. The collected samples were stored in a deep freezer (−70 °C) until analysis. Blinding was not performed during the experimental procedures or outcome assessment.
The study was designed as a time-course experiment to characterize the evolution of the investigated biochemical alterations following STZ-induced hyperglycemia [21]. The use of defined experimental intervals is consistent with the established application of chemically induced diabetes models to investigate the consequences of persistent hyperglycemia over time [22,23]. Because the study was designed to follow the temporal evolution of the biochemical changes rather than to perform independent diabetic-versus-age-matched control comparisons at every time point, citrate-buffer-treated reference animals were included at the initial 1-week time point.
2.3. Ethical Approval and Consent to Participate
The study was designed and conducted according to European legislation (Directive 2010/63/E.U.) [24] and Hungarian Government regulation (40/2013., II. 14.) [25] on the protection of animals used for scientific purposes. The project was approved by the Animal Welfare Committee of the University of Pécs and by the Government Office of Baranya County (license No. BAI35/51-61/2016 and license supplement (supplement No. BAI35/90-5/2019).
2.4. Animal Welfare and Humane Endpoints
The animals were monitored daily in accordance with the approved animal experimentation protocol. If an animal’s physical condition deteriorated significantly or signs of pain, suffering, or neurological impairment were observed, the experiment was to be terminated for that animal and euthanasia performed. The specified warning signs included a hunched back, retracted abdomen, lowered head, apathy, and hypokinesia. The protocol also specified assessment using the Grimace Scale, with a score of 2 defined as a humane endpoint. Increased water consumption, weight loss, and polyuria were recognized as common consequences of STZ administration, and particular attention was paid to meeting the animals’ needs under these conditions.
2.5. Sample Preparation
Samples were taken from the freezer (−70 °C) and incubated on ice for 5 min to defrost and become ready. The organ sample was weighed, then homogenized with the homogenizing buffer (pH 7.4) at a 1:3 ratio. The buffer was composed of KCl (0.154 M), Trizma (50 mM), and EDTA (5 mM). The matrix was completed with BHT (50 mg/mL in MeOH). The mixture was homogenized on ice by Witeg® homogenizer (HG-15A) (Witeg GmbH, Wertheim, Germany) for 90 s (50 speed rate). The homogenate was diluted with the buffer to reach the final mass/volume, in a proportion (1:4), for sample preparation (homogenate 25%). The prepared samples were dispensed into Eppendorf vials and stored in a deep freezer (−70 °C) until the time of the experiments.
2.6. UV-Vis Determination of Protein Content (Biuret Protein Assay)
To 0.1 mL of organ homogenate (25%) in a 10 mL test tube, 1.0 mL of SDS (8.1%), 0.9 mL of NaCl (0.9%), and 8.0 mL of biuret reagent (CuSO4•5H2O, KNaC4H4O6•4H2O, KI, and NaOH in distilled water) were added. The mixture was incubated at room temperature for 10 min. The absorbance of the sample was then measured at 550 nm against the blank. The protein concentration of the samples was determined by the equation of the calibration curve of bovine serum albumin (BSA) [26].
2.7. UV-Vis Determination of Protein Carbonyl Content (DNPH-Protein Adducts)
To 0.2 mL of organ homogenate (25%), 1.0 mL of 0.1 M phosphate buffer pH 7.2, 0.8 mL of distilled water, and 2.0 mL of 5 mM 2,4-DNPH (in 2 M hydrochloric acid) were added. The mixture was incubated in the dark at room temperature for 1 h, vortexing every 15 min. Then, 2.0 mL of 50% trichloroacetic acid was added, and the mixture was incubated for another hour under the same conditions. After that, the mixture was centrifuged at 5000 rpm for 15 min. The supernatant was discarded, and the residue was washed with 1.0 mL of EtOH/EtOAc (1:1). The sample was vortexed and centrifuged for 15 min (5000 rpm), and the supernatant was discarded. This washing step was repeated three times, and the final residue was dissolved in 1.0 mL of 8 M guanidine hydrochloride. After the sample had completely dissolved. 0.1 mL of the solution was diluted with 0.9 mL of 8 M guanidine hydrochloride, and the absorbance was measured at 375 nm against 8 M guanidine hydrochloride [27,28].
2.8. UV-Vis Determination of Diene Conjugates
To 1.0 mL of organ homogenate (25%) in a conical flask with a ground glass joint, 20 mL of chloroform: methanol (2:1 v/v) mixture was added. The mixture was incubated for 20 min in a water bath (50 °C) with mechanical shaking. After that, it was washed into a separatory funnel with a 10 mL chloroform:methanol (2:1 v/v) mixture and 5 mL of distilled water. The mixture was allowed to stand for 20 min to allow separation. Then, the bottom phase was filtered into an Erlenmeyer flask and dried over anhydrous sodium sulfate. It was filtered into a weighted round-bottomed flask and evaporated at 30 °C. After evaporation, the flask was weighed, and the residue was dissolved in MeOH to obtain a 1 mg/mL solution. The absorbance of the obtained solution was measured over 200–400 nm against MeOH. After that, the solution was diluted with MeOH ten times, and the measurement was repeated [29].
2.9. UV-Vis Determination of Malondialdehyde (MDA) (TBARS Assay)
To 0.1 mL of organ homogenate (25%), in a well-sealed ground-glass stoppered test tube, 0.2 mL of SDS (8.1%) and 1.5 mL of CH3COOH (20%; pH 3.5) were added. After that, 1.5 mL of thiobarbituric acid (0.8%) and 0.7 mL of distilled water were pipetted into the mixture. The mixture was incubated in boiling water (95 °C) for 1 h to initiate the color reaction (TBARS). The sample was cooled down on ice (5 min) and centrifuged (5 min, 3000 rpm). The absorbance of 1 mL of the clear supernatant was measured at 532 nm against distilled water [30].
2.10. UV-Vis Determination of Non-Protein Thiols (NPSH)
To 1.0 mL of organ homogenate (25%), 0.25 mL of BHT (50 mg/mL in methanol) and 0.25 mL of trichloroacetic acid (25%) were added. The mixture was vortexed then centrifuged at 5000 rpm for 5 min. Then 0.1 mL of the collected supernatant was combined with 2.8 mL of Trizma buffer, pH 8.9. The reaction was started after pipetting 0.1 mL of Ellman’s reagent (DTNB) (0.01 M in MeOH). The sample was incubated at room temperature for 30 min, allowed to react for the maximum reaction time (optimized incubation time), and then measured at 412 nm against the blank. [31,32]. The NPSH content of the cell homogenates was determined using a calibration curve constructed using glutathione (GSH) standard.
2.11. HPLC Determination of Tyrosine Isomers
2.11.1. Sample Preparation
To a 50 mg organ sample, 400 μL of 6N hydrochloric acid, 40 μL of 500 mM BHT in methanol, and 4 μL of 400 mM desferrioxamine solution were added. The sample was vortexed for 1 min, then hydrolyzed at 120 °C for 18 h. The sample was then allowed to cool, centrifuged at 3000 rpm for 10 min, and filtered through a syringe filter (0.2 μm) before analysis [33].
2.11.2. HPLC-FLD Measurements
HPLC-FLD analyses were performed on a Shimadzu Class 10 HPLC system equipped with an RF-10 AXL fluorescent detector (Shimadzu, Canby, OR USA). Separation of compounds was performed on a LiChrospher 100 C18 (5 µm) LiChroCART® 250-4 column (Merck Millipore, Darmstadt, Geramny) at ambient temperature. The mobile phase consisted of 1% (m/v) sodium acetate and 1% (v/v) acetic acid in water (isocratic run). Flow rate: 1.0 mL/min. For Phe: excitation: 258 nm, emission: 305 nm. For Tyr: excitation: 275 nm, emission: 305 nm. Concentrations were determined using external calibration [34].
2.12. Statistics
Protein content of homogenate samples was measured by the Biuret assay using a calibration curve of known BSA concentrations. TBARS (nmol TBARS/mg protein/g tissue) and GSH (μmol GSH/mg protein/g tissue) amounts represent the mean ± S.D. of four animal samples in each group. The values of protein carbonyl content (μmol prot-DNPH/mg protein/g tissue) and diene conjugates (E1cm1%/mg protein/g tissue) are the mean ± S.D. for animal groups (n = 4). HPLC-UV integrated peak areas of tyrosine derivatives (nmol\mmol) represent the mean ± S.D. of animal groups (n = 2).
For endpoints with four animals per group, differences among groups were analyzed using one-way analysis of variance (ANOVA), followed by Tukey’s honestly significant difference (HSD) post hoc test for pairwise comparisons. Tukey’s procedure was used to control the family-wise error rate. Because only two independent animal samples were available per group for the tyrosine derivative measurements, these data were evaluated descriptively and were not used to draw confirmatory statistical conclusions. Statistical analyses were performed using SPSS 30.0.0.0 (171). For endpoints subjected to inferential statistical testing, differences were considered statistically significant at p < 0.05. Comparisons with the control group are indicated as follows: p < 0.05, p < 0.01, and p < 0.001.
3. Results
3.1. Blood Glucose Level
Diabetes was induced with a single i.v. dose of 65 mg/kg STZ [17,19]. Hyperglycemia (over 20 mM of plasma glucose level) was confirmed after one week of STZ treatment. Blood glucose levels differed significantly between control and STZ-treated rats (∗∗∗ p < 0.001). The average blood glucose levels were 6.7 ± 1.5 mM in control rats, while that of the STZ-treated rats was 23.4 ± 2.8 mM (1st week), 26.1 ± 1.62 mM (2nd week), and 28.13 ± 2 mM (4th week), respectively.
3.2. Protein Content
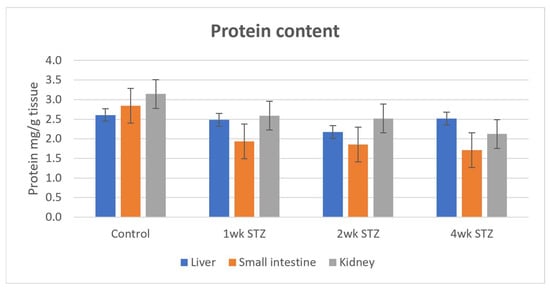
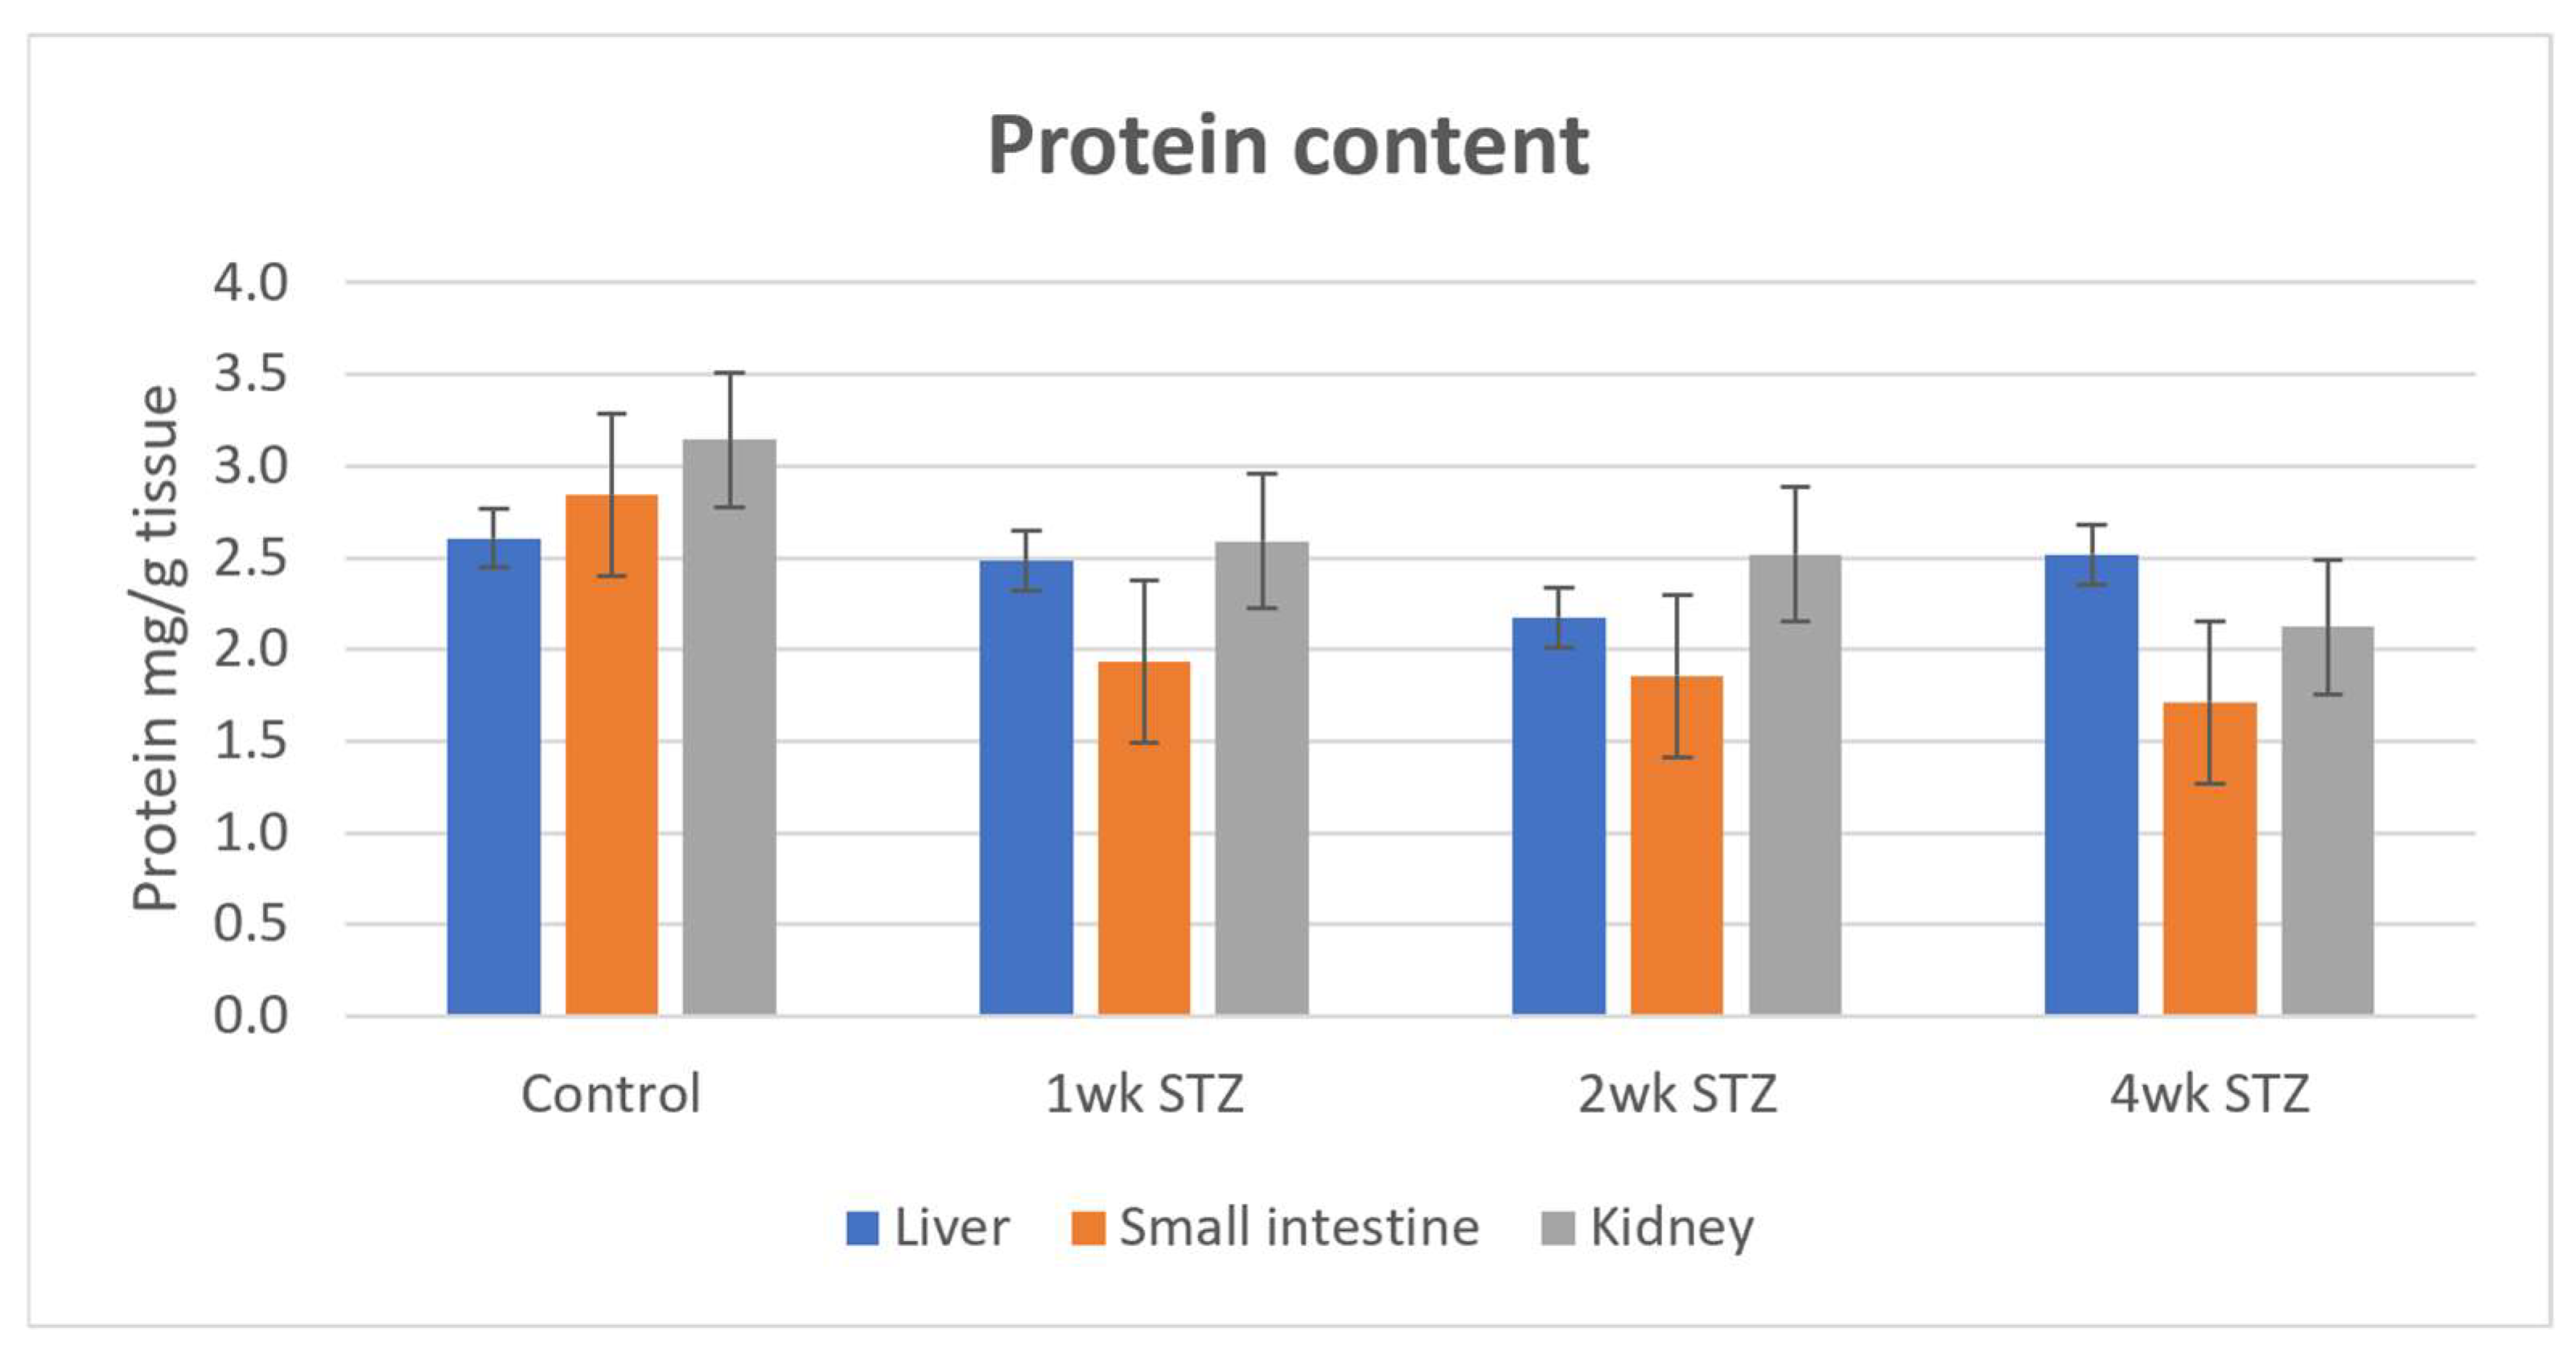
The protein content (mg/g wet tissue) of the liver, small intestine, and kidney was determined using the calibration curve (y = 0.2583x + 0.1124, r2 = 0.9997) obtained by BSA. The protein content of the small intestine was reduced in all groups, with a similar degree of reduction over the four weeks. In the kidney, the values decreased continuously. The liver protein content showed the smallest reduction, with the two-week STZ-treated samples having the lowest values. However, none of the changes can be assessed statistically (Figure 1).
Figure 1.
Comparison of protein content (mg protein/g wet tissue) in control, 1-week, 2-week, and 4-week STZ-treated rats.
3.3. Protein Carbonyl (Prot-DNPH) Content
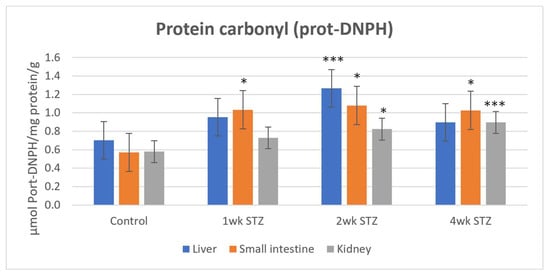
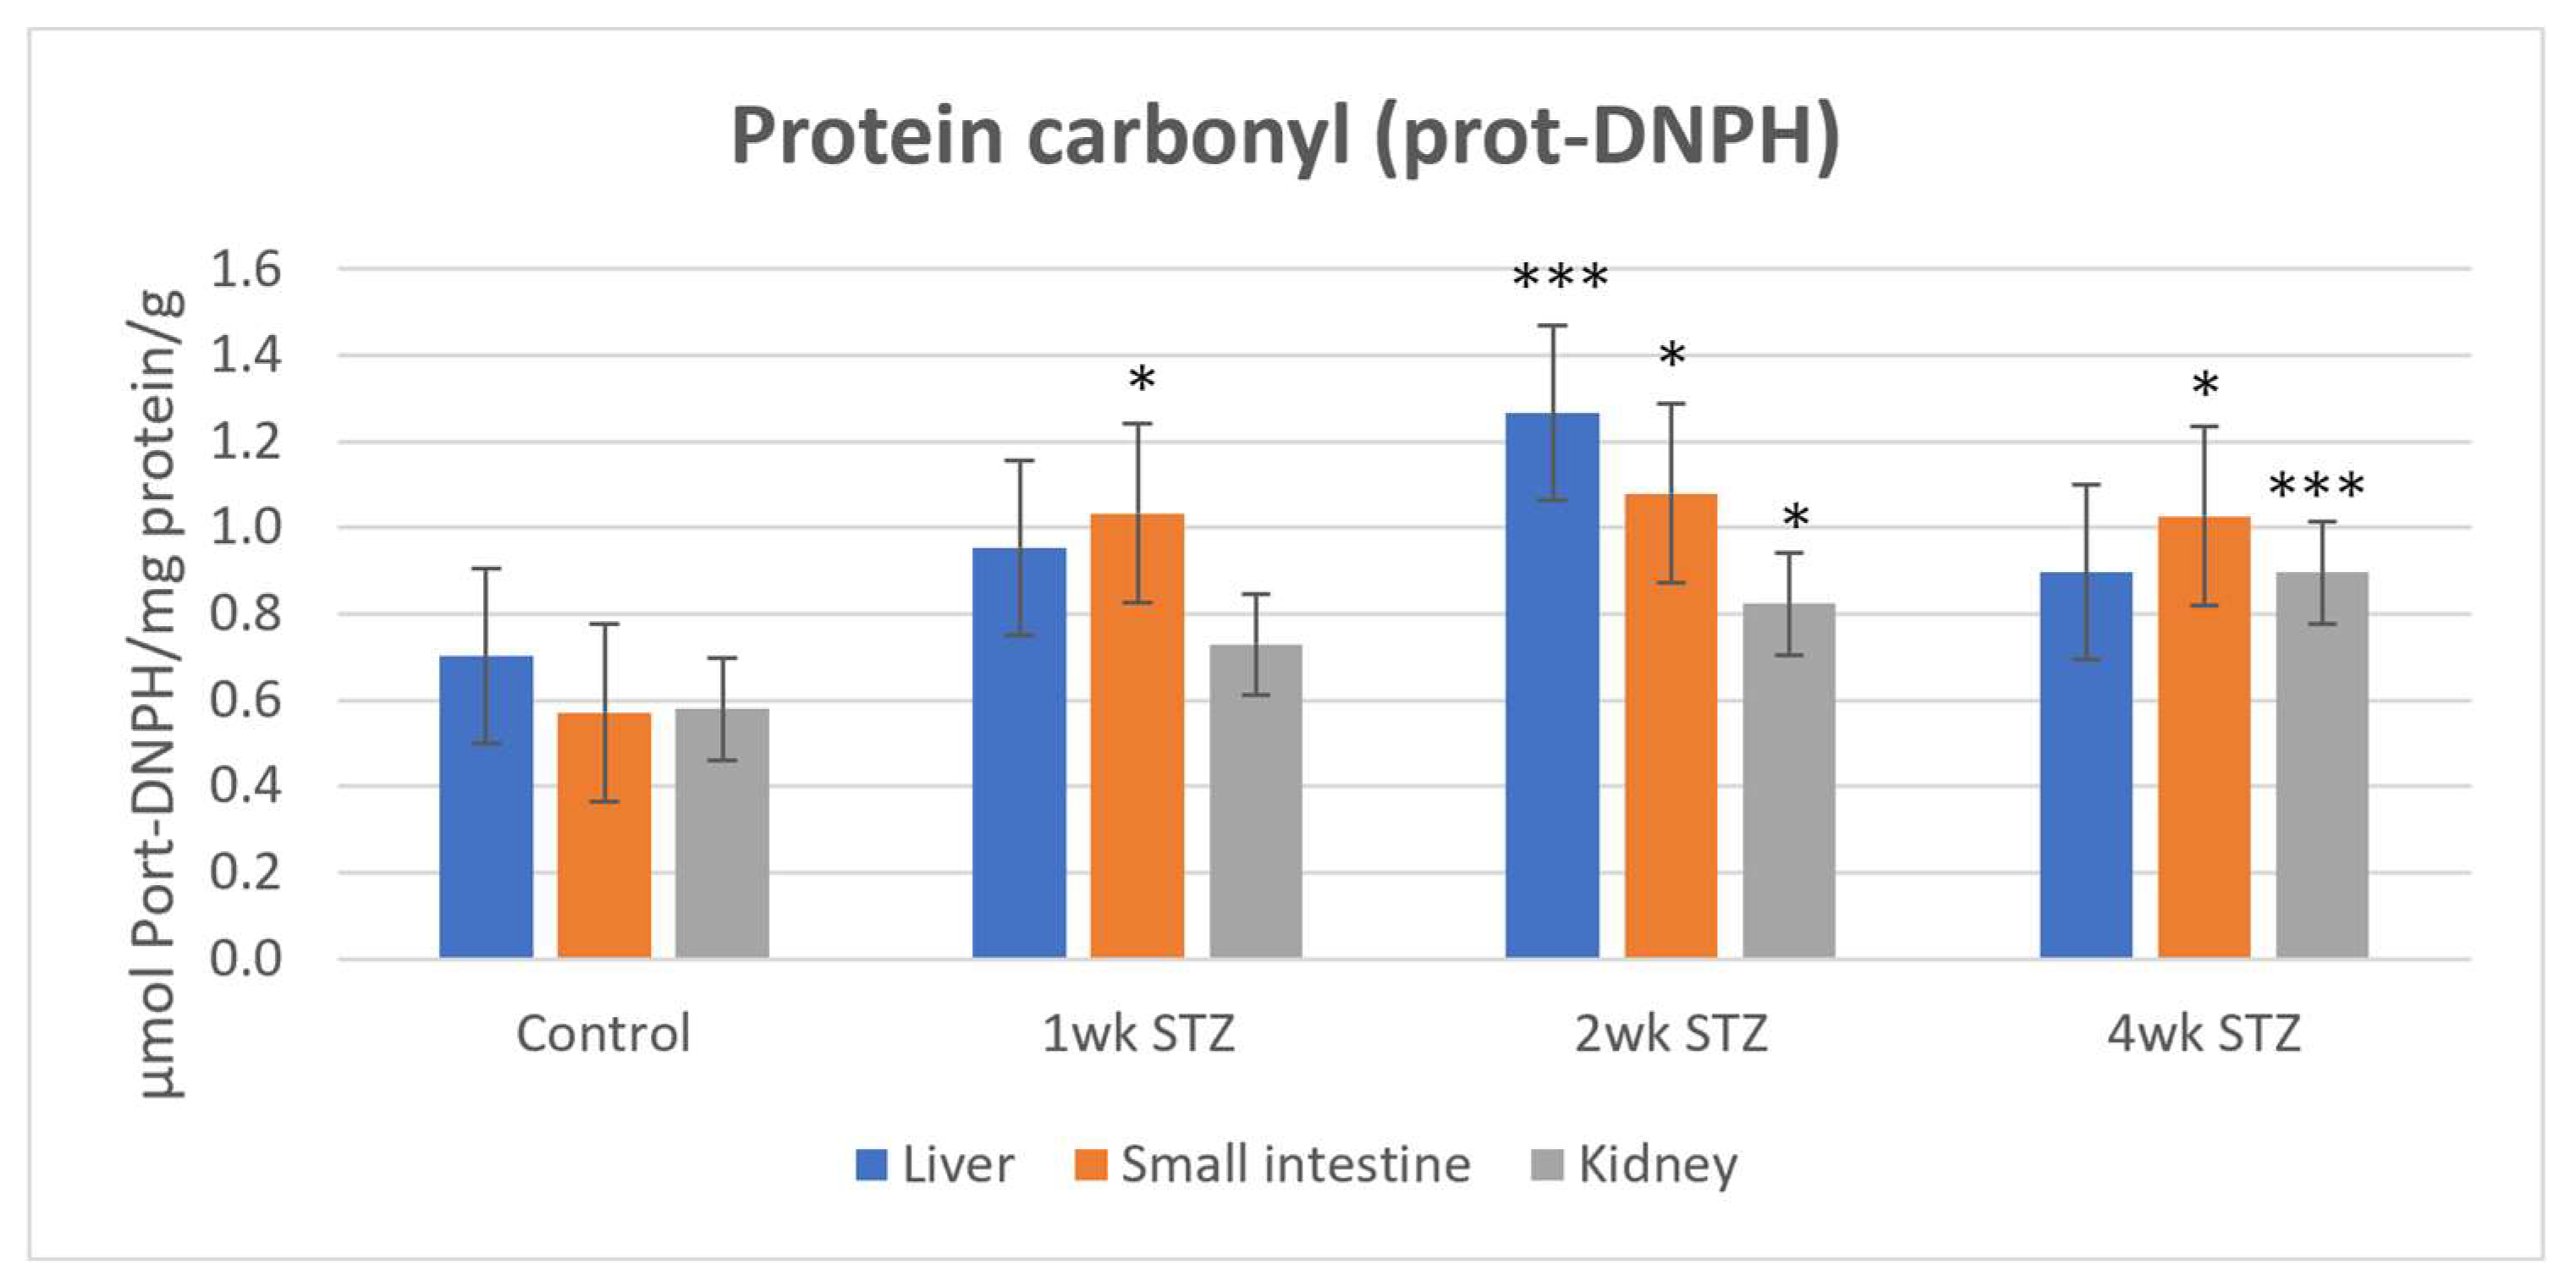
Protein carbonyl content, determined after derivatization with 2,4-dinitrophenylhydrazine (DNPH), was higher in STZ-treated samples than in controls in all three tissues. At 2 weeks, protein carbonyl levels were significantly higher than control values in each tissue, with the largest increase observed in the liver (81.4%). In the liver, protein carbonyl content in the 4-week STZ-treated samples decreased to approximately the level observed at 2 weeks. In the kidney, protein carbonyl content increased progressively throughout the experimental period, corresponding to increases of approximately 26% and 55% at 2 and 4 weeks, respectively. The largest increase was observed in the small intestinal samples: 80.1%, 89.5%, and 80.1% in the 1-, 2-, and 4-week samples, respectively (Figure 2).
Figure 2.
Comparison of the protein carbonyl content (μmol prot-DNPH/mg protein/g tissue) in the control, 1-week-, 2-week-, and 4-week-STZ treated rats. (* p < 0.05, *** p < 0.001).
3.4. Determination of Conjugated Dienes
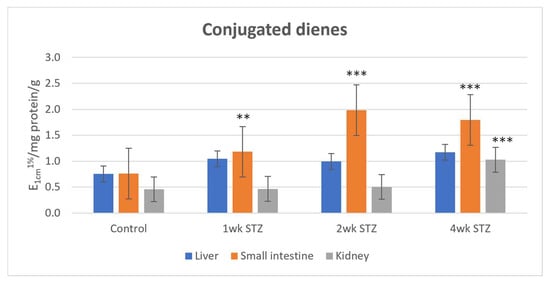
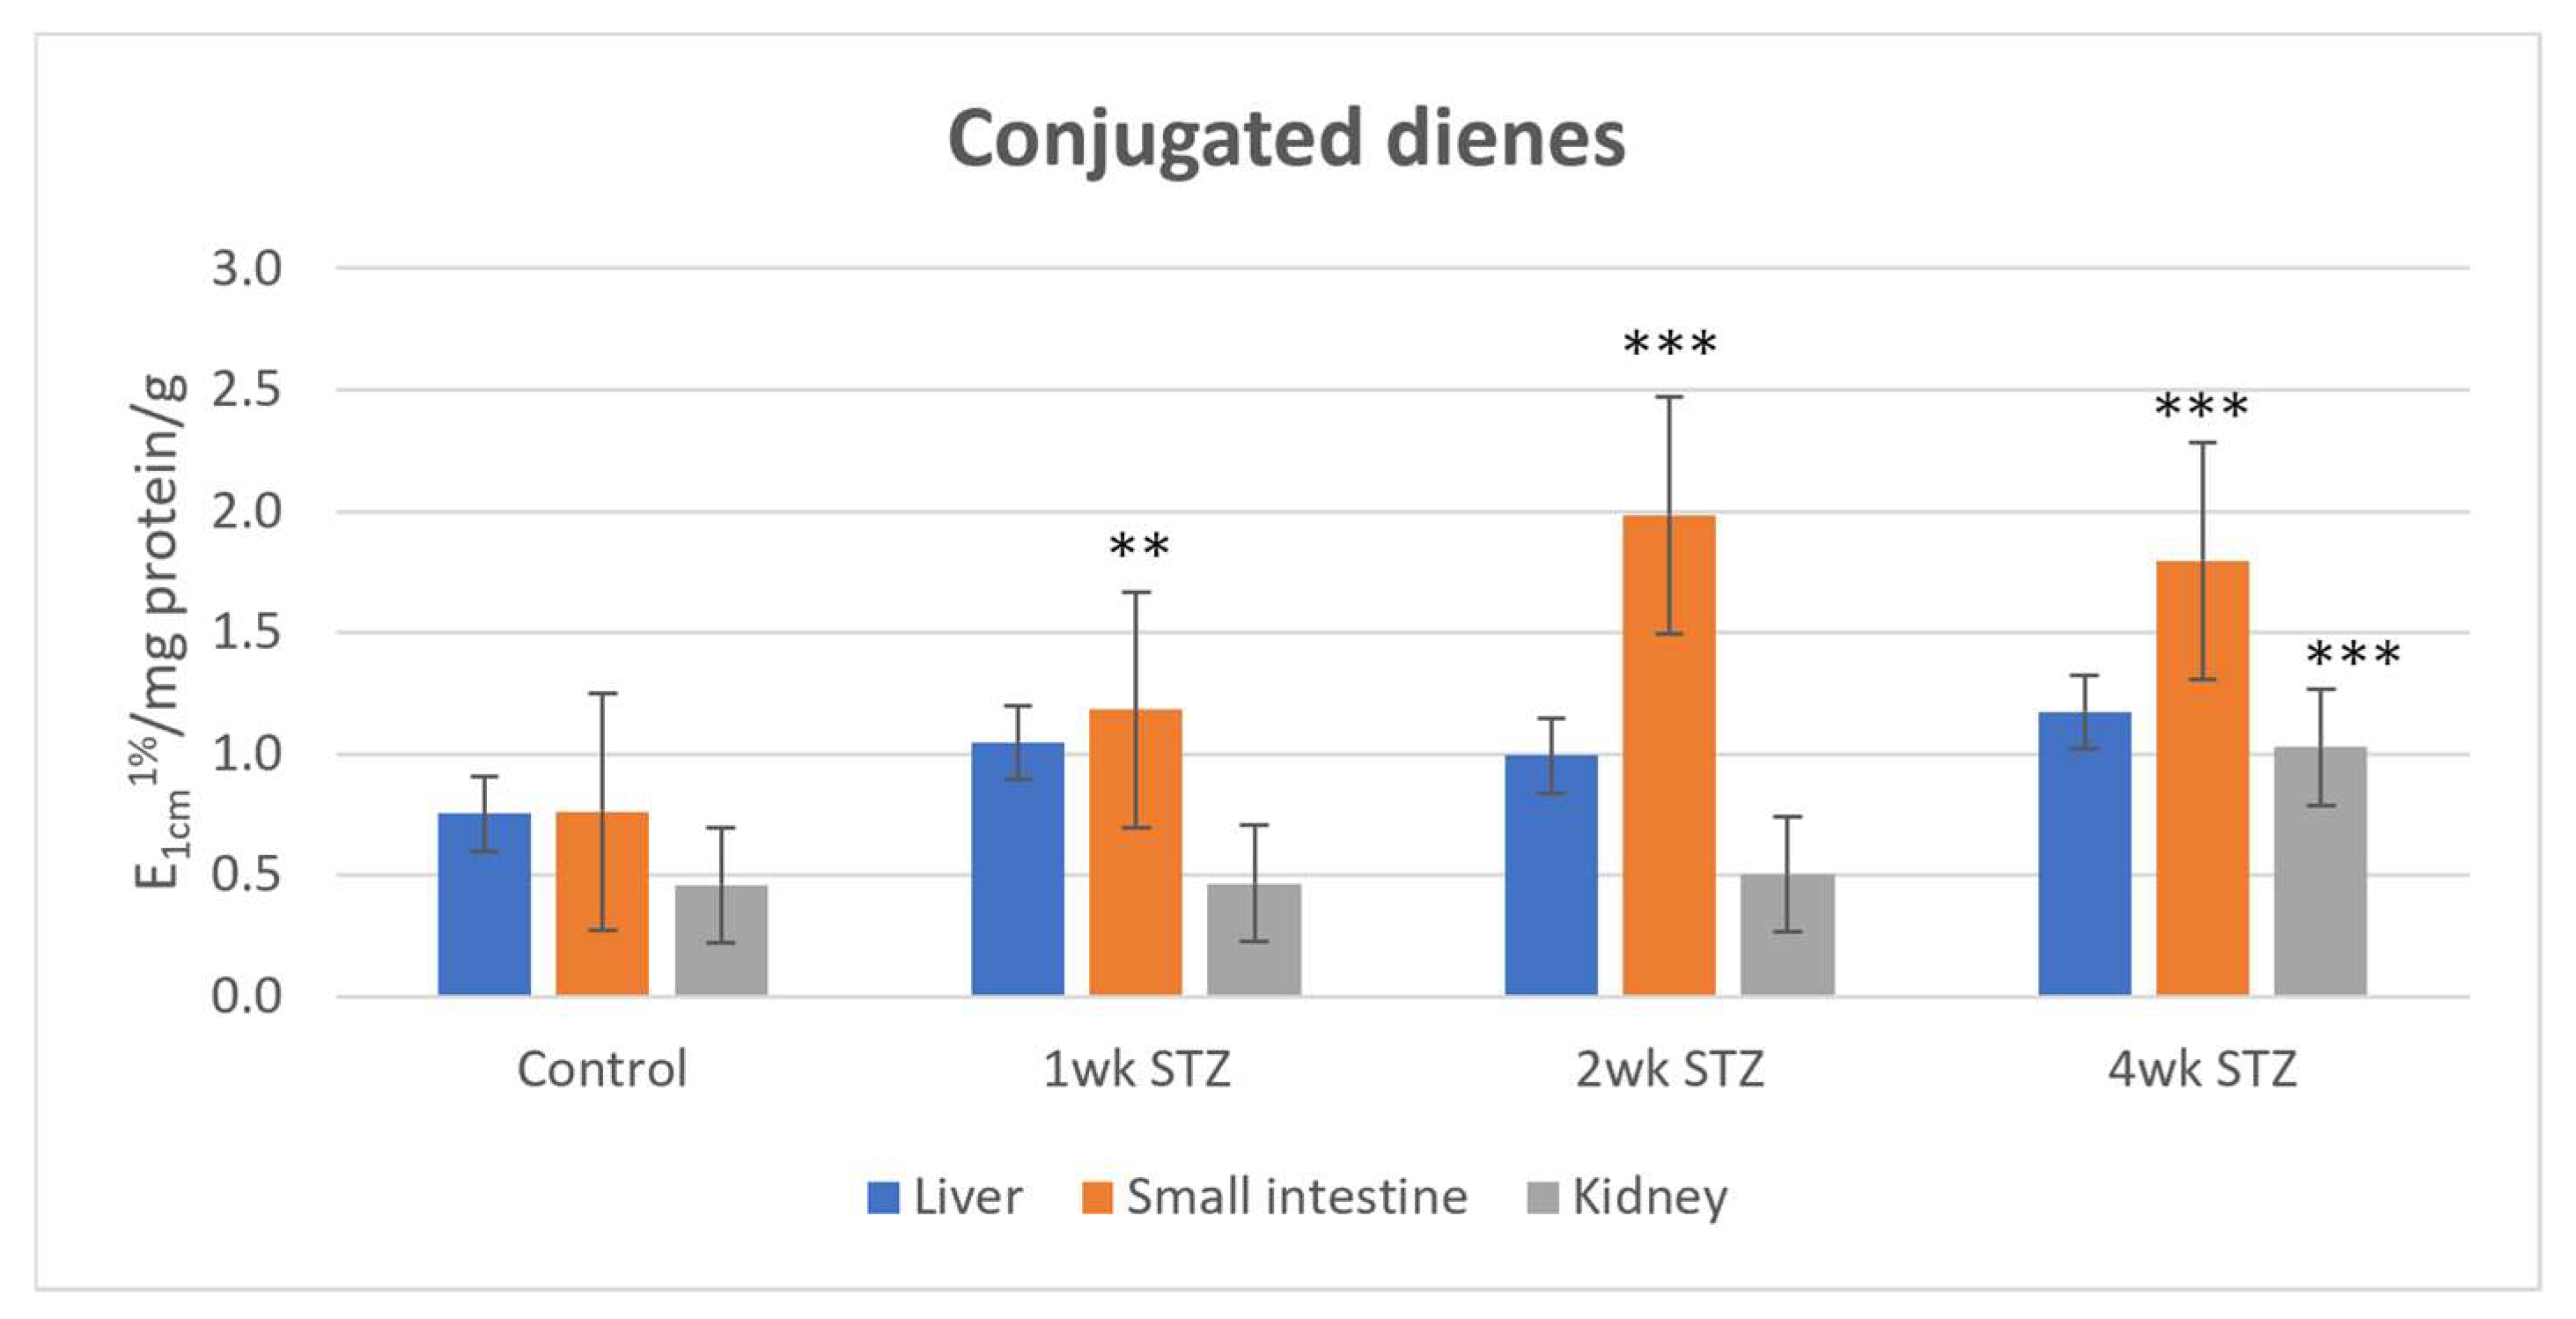
In the liver, conjugated diene levels increased only slightly in STZ-treated rats at each time point. In the kidney, a statistically significant increase was observed only in the 4-week samples, which showed a 123.9% increase relative to the control. At 1 and 2 weeks, conjugated diene levels in the kidney were comparable to those in the controls. In contrast, the small intestine showed significant increases in conjugated diene levels at all three time points, with increases of 55.3%, 160.5%, and 136.8% at 1, 2, and 4 weeks, respectively (Figure 3).
Figure 3.
Comparison of the conjugated diene levels (E1cm1%/mg protein/g tissue) in the control, 1-week, 2-week, and 4-week STZ-treated rats. (** p < 0.01, *** p < 0.001).
3.5. TBARS Determination
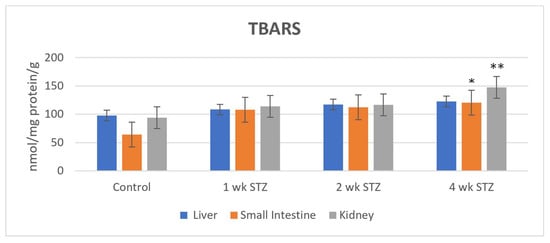
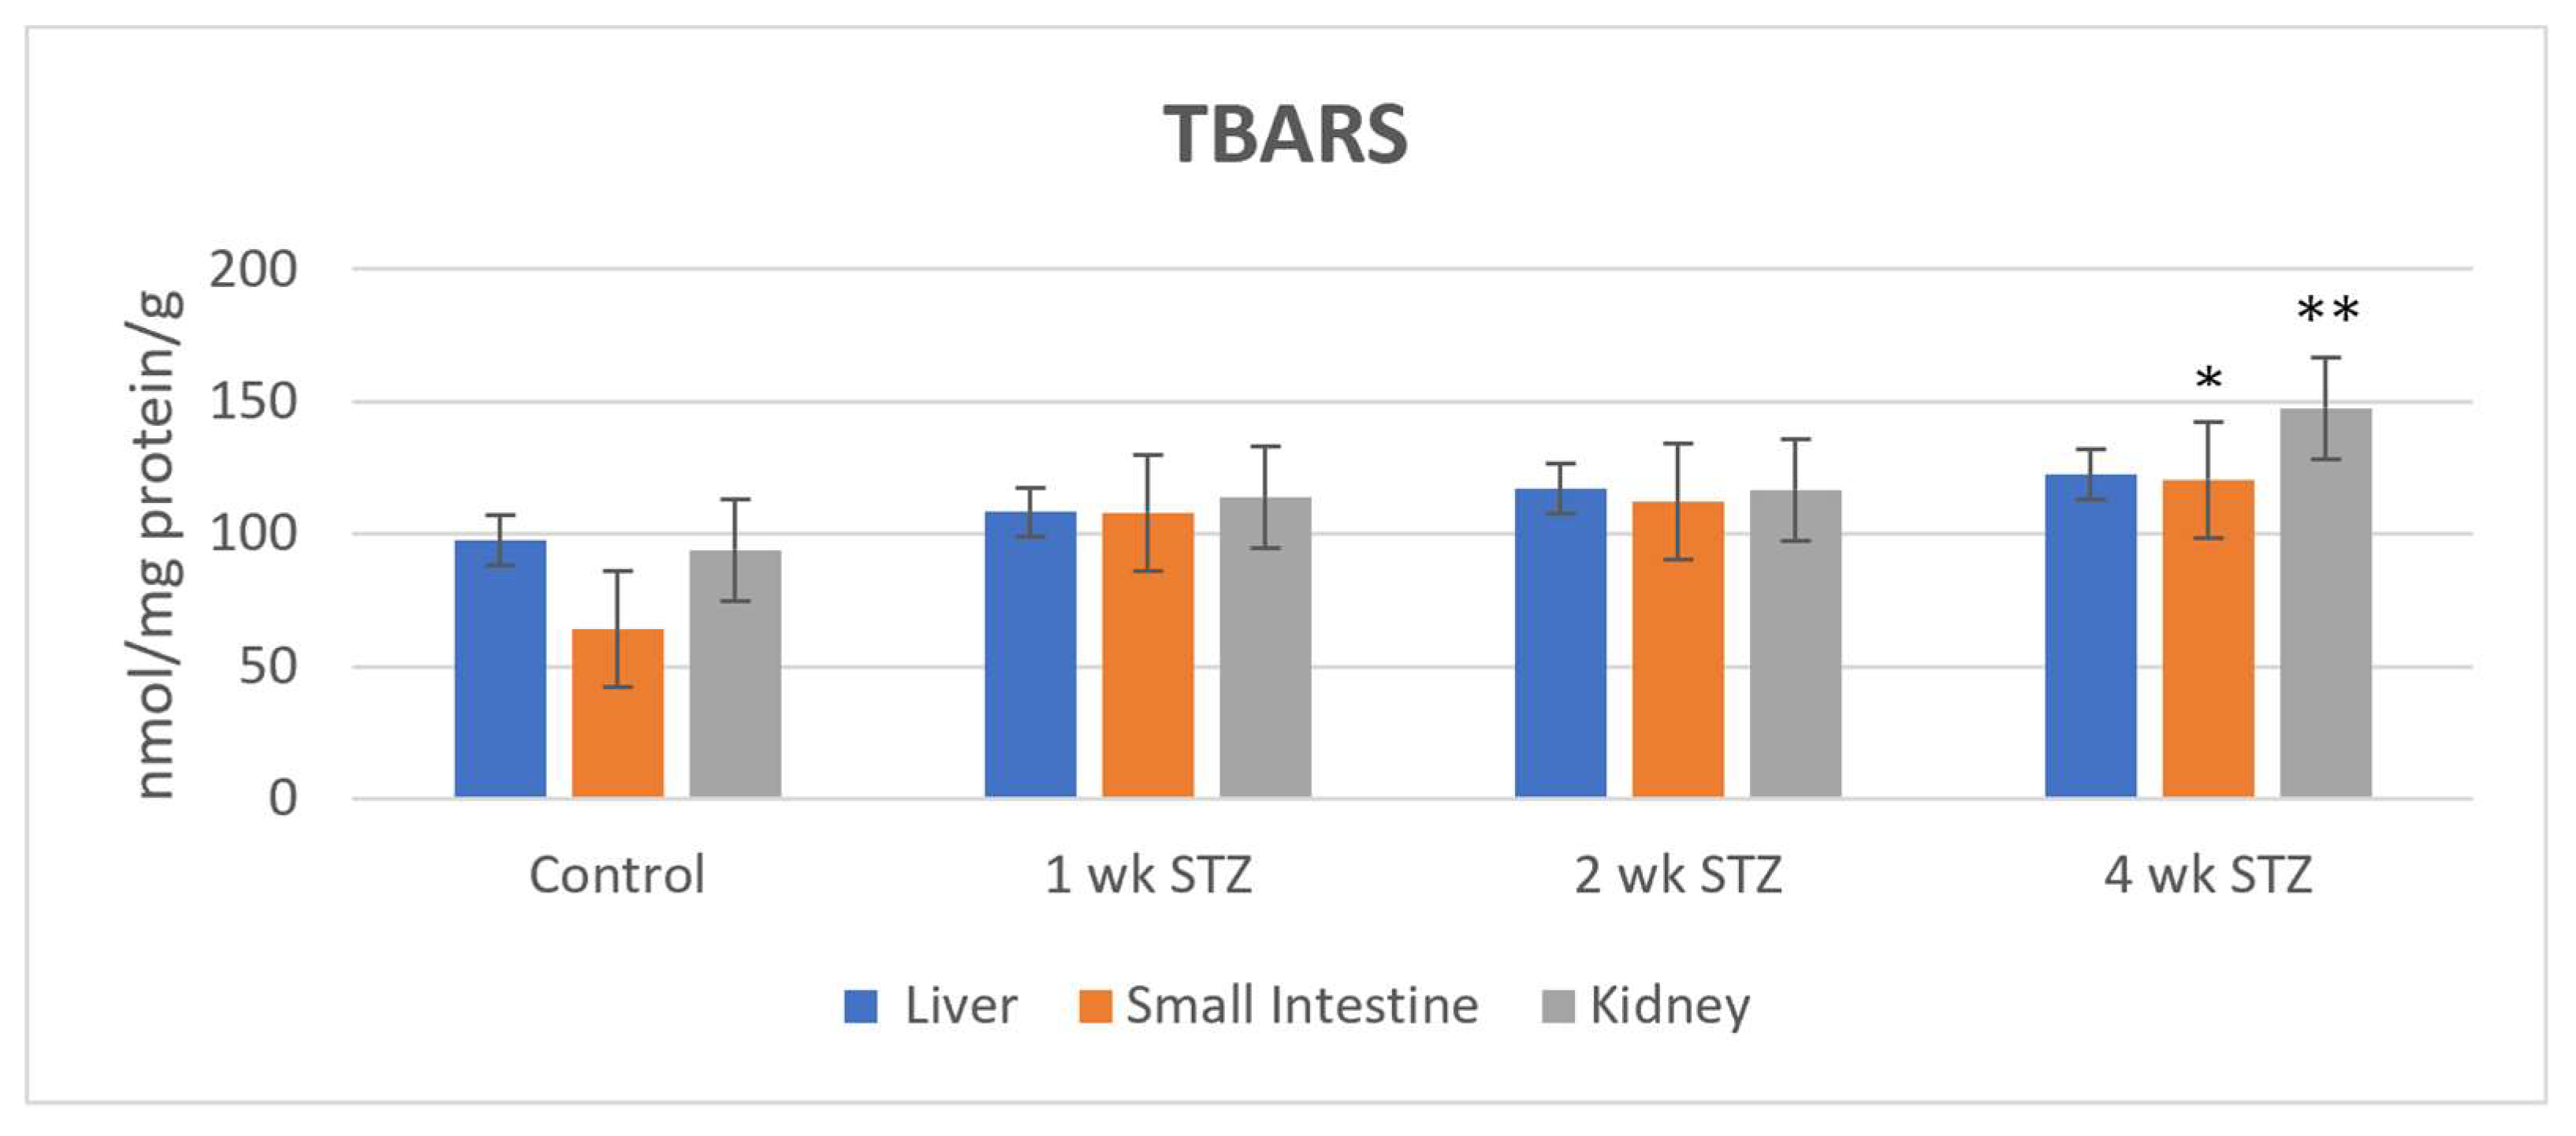
MDA is often used as an indicator of endogenous lipid oxidation by reactive oxygen species [35]. MDA is a reactive carbonyl compound that can be formed from lipid hydroperoxides and can subsequently react with nucleophilic sites in proteins and other cellular macromolecules. Accordingly, the MDA test results indicate steady-state lipid peroxide levels that can rearrange to form MDA under the test conditions. TBARS levels increased in all three tissues following STZ treatment. The largest increase was observed in the small intestinal samples: 73.4%, 79.7%, and 93.5% in the 1-, 2-, and 4-week samples, respectively. Like conjugated diene levels, the four-week STZ-treated samples also showed statistically increased TBARS levels in the small intestine (93.5%) and kidney (56.8%) (Figure 4).
Figure 4.
Comparison of the TBARS levels (nmol TBARS/mg protein/g tissue) in control, one-week-, two-week-, and four-week-STZ-treated rats. (* p < 0.05, ** p < 0.01).
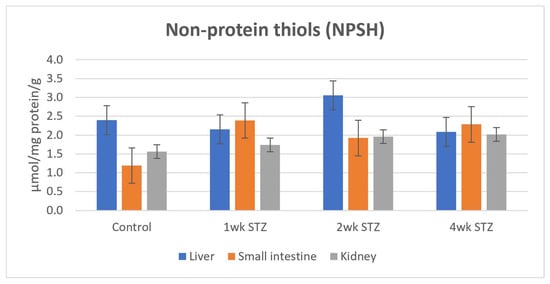
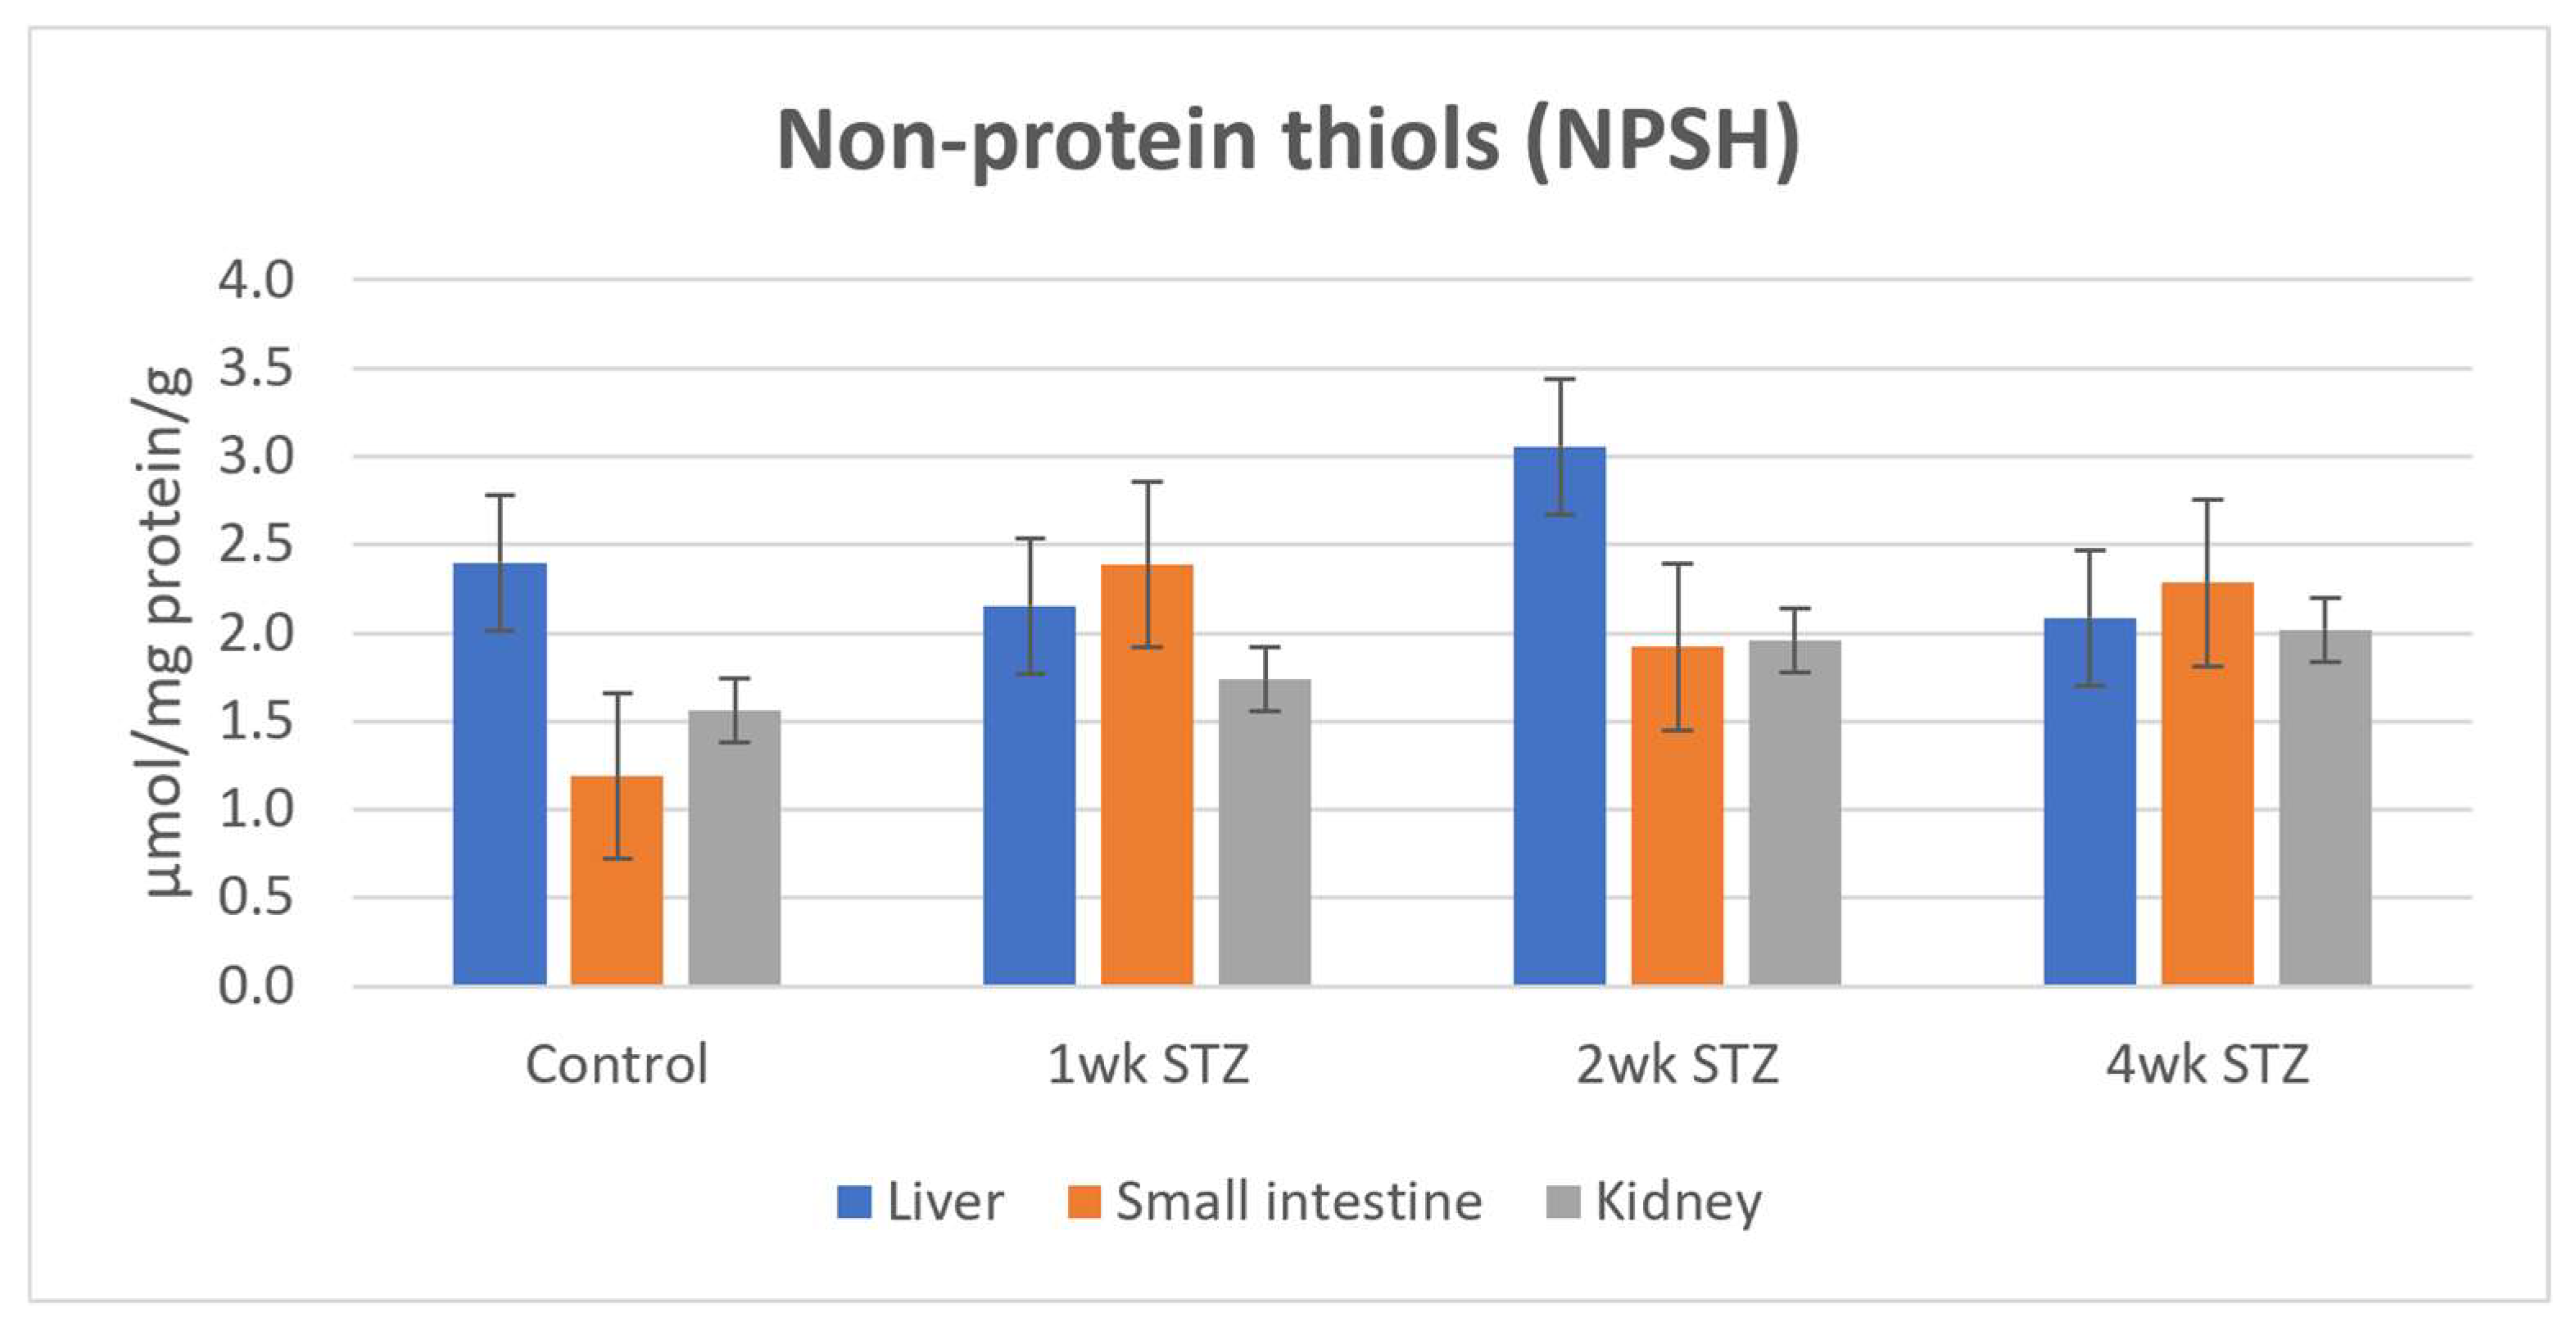
3.6. Determination of Non-Protein Thiols (NPSH)
Determination of non-protein thiols was performed by Ellman’s DTNB method [31,32]. The NPSH levels of the control liver samples were found to be similar to those reported in the literature for the determination of GSH (4 micromol/g liver tissue [36]; 150–180 nmol/mg protein [37] using different analytical methods. In the liver, the main NPSH is GSH, and cysteine levels are much lower (less than 0.1 micromol/g tissue); thus, measured NPSH levels are expected to reflect GSH predominantly [38]. This comparison supports the use of NPSH measurements as an indicator of the hepatic non-protein thiol pool, which is largely represented by GSH.
In the liver, STZ treatment resulted in a slight decrease in NPSH levels at 1 and 4 weeks, whereas the 2-week STZ-treated samples showed somewhat higher values than the controls. These fluctuations were not statistically significant.
In the kidney, NPSH levels increased slightly at each time point. In the small intestine, NPSH levels in STZ-treated samples increased at each timepoint compared with the control, although the lowest values within the STZ-treated groups were observed at 2 weeks (Figure 5).
Figure 5.
The quantities of non-protein thiols (expressed as μmol GSH/mg protein/g tissue) in control, one-week-, two-week-, and four-week STZ-treated rats.
3.7. Determination of Hydroxylated Phenylalanine (Phe) Derivatives
Phenylalanine (Phe) is an essential amino acid that is the physiological precursor of para-tyrosine (p-Tyr), dihydroxyphenylalanine (DOPA), catecholamines, melanin, and thyroid hormones [39]. Beyond these enzymatic reactions, Phe can also undergo nonenzymatic oxidation through reactions involving reactive oxygen species (ROS) [40]. Such reactions can result in the formation of all three tyrosine isomers, p-Tyr, m-Tyr, and o-Tyr [41].
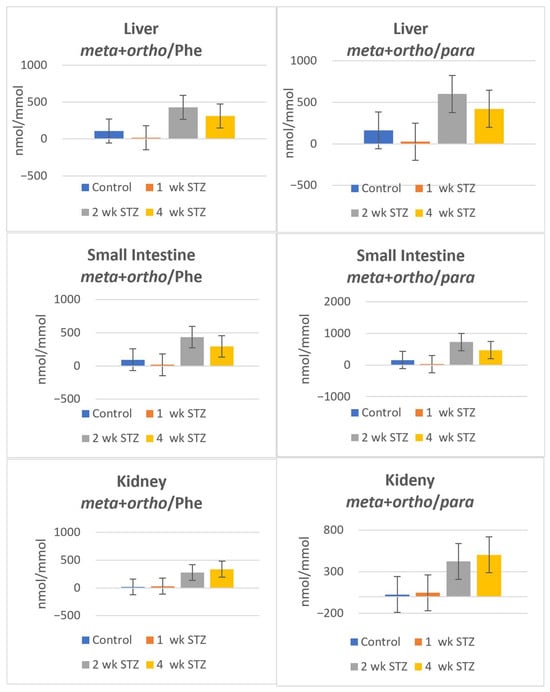
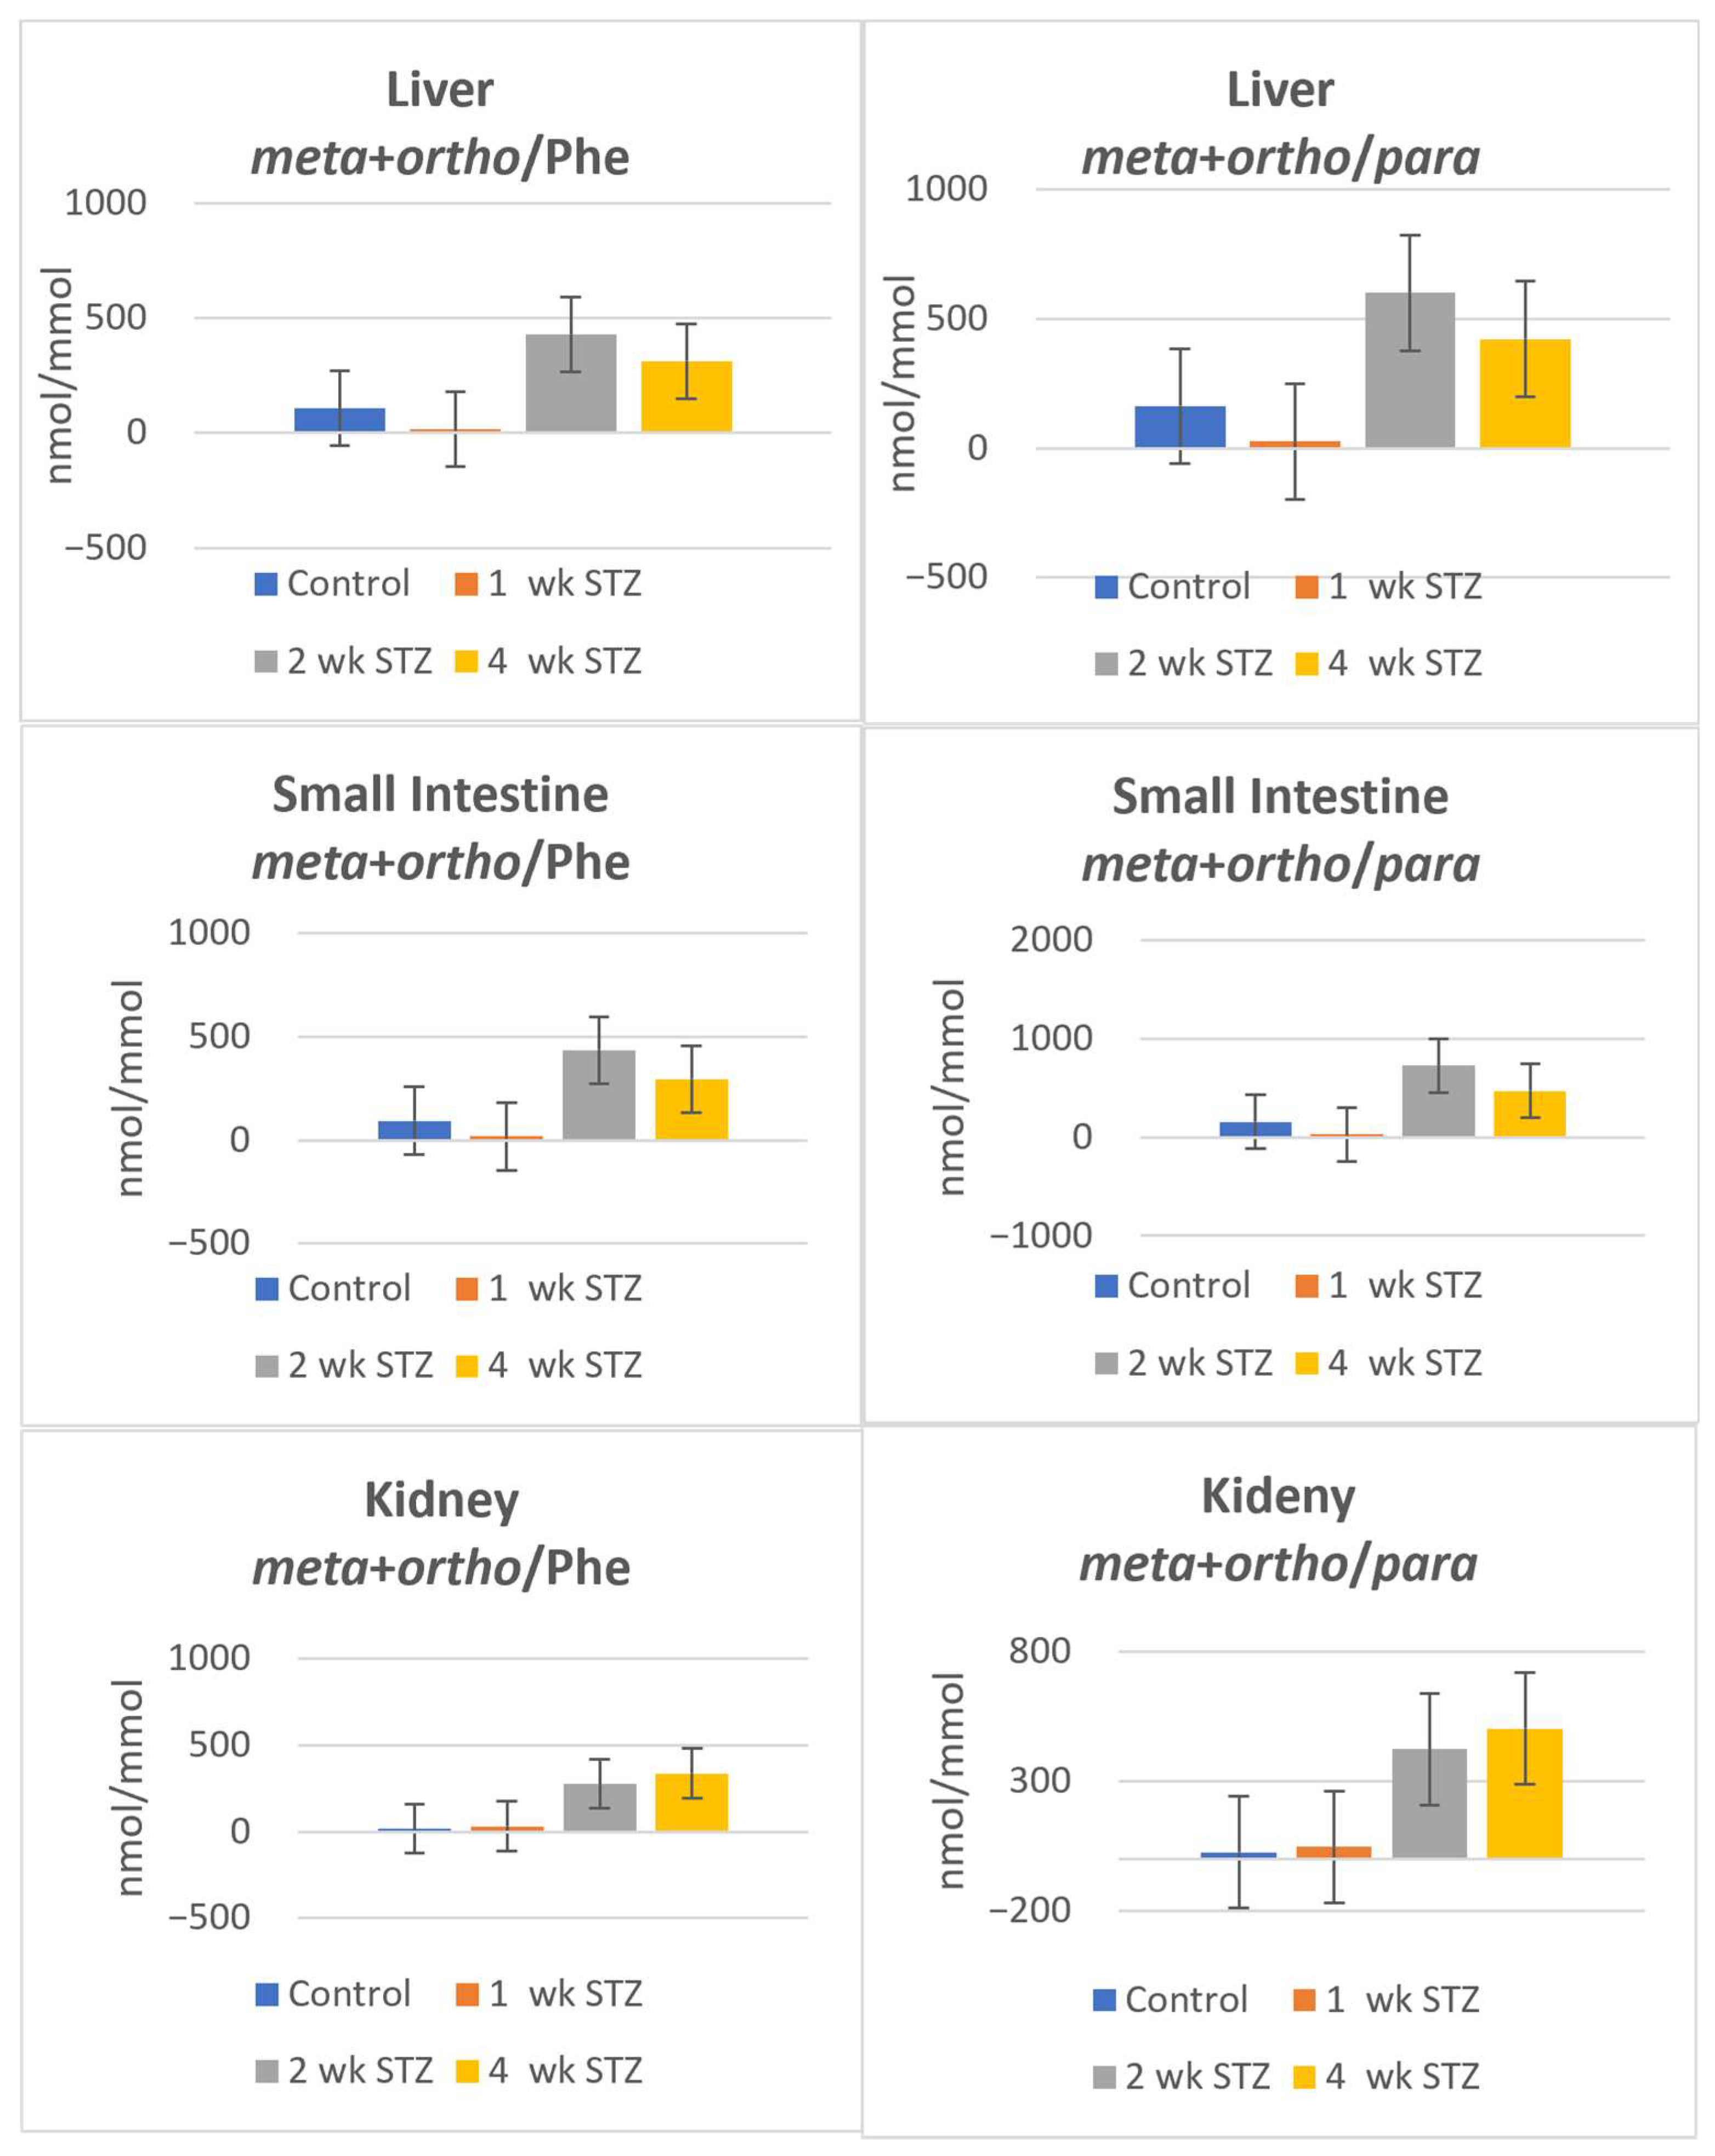
The relative levels of m-Tyr and o-Tyr, expressed relative to either the parent Phe or p-Tyr, were determined in the liver, small intestine, and kidney. At 1 week, no increase in the relative levels of m-Tyr and o-Tyr was observed in any of the investigated tissues. At 2 weeks, the relative levels increased in all three tissues; the largest relative increase was found in the liver (m-Tyr + o-Tyr/Phe: 302.3%; m-Tyr + o-Tyr/p-Tyr: 268.4%). At 4 weeks, the relative levels remained elevated in the liver and small intestine, whereas a further increase was observed in the kidney. Given the limited sample size, however, these observations should be interpreted as exploratory and do not permit robust conclusions regarding differences among groups (Figure 6).
Figure 6.
The relative amount of the m-Tyr + o-Tyr to Phe and p-Tyr (nmol/mmol) in control, one-week, two-week, and four-week STZ-treated rats.
4. Discussion
Our experimental model is based on a single i.v. administration of 65 mg/kg STZ, which resulted in persistent hyperglycemia throughout the 4-week study period. STZ is a highly selective cytotoxic agent for pancreatic β-cells. It is often administered as a single high dose to induce an insulin-deficient, type 1 diabetes-like phenotype in adult rats [15,16]. Treatment of rats with 70 mg/kg (i.v.) [1-, 2-, and 3’-14C]-labeled streptozotocin showed that the compound was extensively metabolized and almost completely cleared by the 360 min timepoint of the experiments [42]. However, the structures of metabolites were not identified. Although the possibility of early cellular effects associated with STZ itself or its reactive products cannot be completely excluded, the relatively rapid disposition of STZ supports the interpretation that persistent hyperglycemia is likely to be an important contributor to the biochemical alterations observed after 1 week, although a contribution from early STZ-related effects cannot be completely excluded.
The liver, small intestine, and kidney are involved in xenobiotic disposition and differ in their metabolic functions and antioxidant systems. The liver and kidney are also important targets of diabetic complications. Diabetic nephropathy, for example, occurs in patients with both type 1 and type 2 diabetes, including some patients receiving adequate glycemic control [43]. Sustained hyperglycemia has been associated with the formation of advanced glycation end products (AGEs), oxidative injury, hypoxia, metabolic and energetic disturbances, activation of the renin–angiotensin–aldosterone system (RAAS), and the production of inflammatory and fibrotic mediators, including transforming growth factor-β (TGF-β) [44,45,46]. Oxidative modification of cellular macromolecules may contribute to tissue dysfunction in this complex pathological setting.
Previous studies of whole-body protein metabolism in humans with diabetes have reported changes in protein turnover, including increased protein breakdown during insulin deprivation in type 1 diabetes [47]. In the present study, mean protein content was numerically lower in the liver, small intestine, and kidney of STZ-treated rats than in the control group; however, these differences were not statistically significant (Figure 1). Thus, the present results do not establish a significant change in total tissue protein content under the experimental conditions used.
Proteins are important targets of oxidative modification. Cysteine residues can form disulfide bonds with other protein thiols or with glutathione (GSH), while protein carbonyl groups can arise through several oxidative pathways, including the modification of amino acid side chains [48]. Protein carbonylation is commonly assessed by derivatization with 2,4-dinitrophenylhydrazine (DNPH). In the present study, DNPH-reactive protein carbonyl levels showed different patterns across the tissues and experimental time points (Figure 2). The magnitude and statistical significance of the observed differences varied by tissue and time point.
In the small intestine, DNPH-reactive protein carbonyl levels were approximately 80.1–89.5% higher than in the week-1 control group at the reported experimental time points (Figure 2). In the kidney, the corresponding values showed more moderate increases, ranging from 25.9% to 55.2% across the experimental time points. Differences in protein turnover and the removal or repair of oxidatively modified proteins may contribute to tissue-specific patterns of protein carbonyl accumulation [47,48]. However, protein turnover and the relevant repair or degradation pathways were not directly assessed in the present study, and their contribution remains speculative.
Lipid peroxidation is another form of oxidative modification that affects cellular membranes. It is initiated by (a) free radical species such as peroxyl radicals, hydroxyl radicals, and metal-oxyl radicals derived from the iron-mediated reduction of hydrogen peroxide or (b) non-radical species such as singlet oxygen, ozone, and peroxynitrite generated by the reaction of superoxide with nitric oxide [49]. The most prevalent radical species that can profoundly affect lipids are mainly hydroxyl radicals (•OH). Radical initiators can abstract a hydrogen atom from the allylic position of polyunsaturated fatty acids. As a result, lipid hydroperoxides (LOOHs)—as primary oxidation products—are formed, and simultaneous rearrangement of the neighboring (non-conjugated) double bonds yields a conjugated diene structure. Conjugated dienes have characteristic UV absorption around 230 nm [50].
One of the most widely used methods for measuring a tissue sample’s lipid-derived total carbonyl content is the thiobarbituric acid (TBA) test. However, most MDA measured with the TBA test forms from the more stable fatty acid hydroperoxides under the strong-acid test conditions [30,51]. Besides MDA, TBA also forms colored adducts with other compounds, including sugars, amino acids, and other aldehydic lipid oxidation products, leading to MDA overestimation by the TBA test [52,53]. Thus, this test is appropriately reported as thiobarbituric acid-reactive substances (TBARSs) rather than MDA [54].
Conjugated diene levels showed different patterns among the tissues (Figure 3). In the liver, the changes were relatively modest. The small intestine exhibited increases of 55.3%, 160.5%, and 136.8% relative to the week-1 control at weeks 1, 2, and 4, respectively. In the kidney, the largest increase was observed at week 4 (123.9%). These observations indicate that the magnitude of the measured changes in conjugated diene levels differed across tissues and experimental time points. The lack of time-matched control groups at weeks 2 and 4, however, prevents attribution of these differences specifically to the duration of hyperglycemia.
TBARS levels showed a different pattern from that of conjugated dienes, with comparatively large increases in the small intestine (Figure 4). In this tissue, TBARS levels were 73.4%, 79.7%, and 93.5% higher than in the week-1 control at weeks 1, 2, and 4, respectively. At week 1, the corresponding changes in the liver, small intestine, and kidney were 10.9%, 73.4%, and 21.0%, respectively. The differences between conjugated diene and TBARS patterns may reflect the distinct chemical properties of primary lipid oxidation products and the heterogeneous compounds detected by the TBARS assay.
Antioxidant enzyme activity and reactions of lipid-derived aldehydes with cellular nucleophiles may also influence the levels of the measured products [55,56]. These mechanisms, however, were not directly examined in the present study. Although increased lipid oxidation under hyperglycemic conditions is a plausible interpretation of the observed changes, the contribution of hyperglycemia duration cannot be established independently of other time-related factors. At later timepoints, however, the oxidative stress induced by high glucose levels can also contribute to the formation of oxidized lipids, leading to increased TBARS levels [57].
Non-protein thiols (NPSH) contribute to cellular redox homeostasis, with glutathione (GSH) being a major low-molecular-weight thiol in many tissues, particularly the liver and kidney. In the present study, hepatic NPSH levels were somewhat lower at week 1, higher at week 2, and lower again at week 4 relative to the control group; none of these differences was statistically significant (Figure 5). Changes in GSH availability and utilization, including its role in peroxide detoxification, may influence tissue NPSH levels [58]. However, GSH synthesis and turnover, as well as glutathione peroxidase (GPx) activity, were not directly measured in this study. Therefore, the mechanisms underlying the observed hepatic pattern cannot be established from NPSH measurements alone.
The small intestine and kidney showed different NPSH patterns from the liver. Small-intestinal NPSH levels were higher than the control value at the experimental time points, whereas kidney NPSH levels showed relatively modest changes (Figure 5). Differences in tissue thiol metabolism, antioxidant enzyme activity, amino acid availability, and GSH homeostasis may contribute to these patterns [59,60,61]. The dietary availability of cystine and methionine may also influence thiol metabolism; however, their contribution to the observed NPSH levels was not directly assessed [59]. Moreover, the higher NPSH levels in the small intestine occurred alongside changes in protein and lipid oxidation markers. This lack of parallel variation illustrates that individual biochemical indicators may reflect different aspects of the tissue response and need not change in the same direction.
Phenylalanine (Phe) is an essential amino acid, which is, among others, converted to p-Tyr in an enzyme-catalyzed reaction [39]. The nucleophilic aromatic ring can react with hydroxyl radicals via addition, and the primary adducts are stabilized as o-, m-, and p-hydroxylated phenylalanines (o-Tyr, m-Tyr, and p-Tyr) [12]. Accordingly, o- and m-Tyr are specific, stable hydroxyl radical markers [40]. In the present study, the o-Tyr + m-Tyr/p-Tyr and o-Tyr + m-Tyr/Phe ratios showed no pronounced increase at week 1 in the liver or small intestine but were elevated at week 2 in all three tissues. In the liver, the increases in the o-Tyr + m-Tyr/p-Tyr ratio were 268.4% and 159.1% at weeks 2 and 4, respectively. At week 4, the ratios were lower than at week 2 in the liver and small intestine but continued to increase in the kidney (Figure 6). These results show that the measured hydroxylated phenylalanine derivatives exhibited a pattern across experimental time points that differed from those of the lipid and protein oxidation markers. The findings, however, should be interpreted cautiously because only two independent animal samples per group were available for these measurements. Although the observed values may provide preliminary indications of oxidative amino acid modifications, the limited sample size restricts the assessment of biological variability and the robustness of comparisons among groups.
The liver is of particular relevance to xenobiotic disposition because it is a major site of xenobiotic metabolism and contains extensive systems for oxidative and conjugative biotransformation. In the present study, increased protein oxidation, conjugated diene formation, and TBARS levels were already evident at the 1-week time point, accompanied by changes in hepatic non-protein thiol levels. These observations are consistent with an altered oxidative environment developing early during the experimental period and provide a biochemical context for our previous observations of altered hepatic transporter expression and xenobiotic disposition in STZ-treated animals [19,20]. Nevertheless, the present data do not establish a direct causal relationship between oxidative modification and the altered expression or activity of specific transporters or drug-metabolizing enzymes.
The markers of phenylalanine hydroxylation showed a pattern across the experimental time points that differed from those observed for lipid and protein oxidation. The o-Tyr + m-Tyr markers did not show a pronounced increase at week 1 but were elevated at later time points, particularly in the liver. This pattern may provide a biochemical context for our previous observation that hydroxylated ibuprofen metabolites formed through non-CYP-catalyzed oxidation were not detected in bile during the 1-week experimental period [19]. However, this interpretation remains indirect, and the present study cannot establish a causal relationship between endogenous oxidative modifications and the metabolism of ibuprofen or other xenobiotics.
Taken together, the findings characterize tissue-specific patterns of oxidative modification in STZ-treated rats with persistent hyperglycemia at different experimental time points. Several markers showed pronounced changes in the small intestine, whereas the kidney showed increases in some markers at later time points. Because age- and time-matched control groups were not included at weeks 2 and 4, the observed differences cannot be attributed exclusively to the duration of hyperglycemia and may also reflect age-related or other time-dependent factors. Future studies incorporating time-matched control groups and direct measurements of drug-metabolizing enzymes, transporters, and other relevant molecular pathways will be needed to clarify the contribution of persistent hyperglycemia to these patterns and to investigate their potential relationship with altered xenobiotic disposition.
5. Conclusions
This study characterized tissue-specific patterns of oxidative modification of lipids, proteins, non-protein thiols (NPSHs), and phenylalanine-derived products in the liver, small intestine, and kidney of STZ-treated rats examined 1, 2, and 4 weeks after STZ administration. Relative to the common week-1 control group, the measured markers showed distinct patterns across tissues and experimental time points. The small intestine exhibited pronounced changes in protein and lipid oxidation markers, whereas the kidney showed increases in several markers at later experimental time points.
The patterns observed for o-Tyr and m-Tyr differed from those of some lipid and protein oxidation markers, highlighting the value of assessing complementary biochemical endpoints when characterizing oxidative modification. Because only two independent animal samples per group were available for the measurements of tyrosine derivatives, these results are now presented descriptively and interpreted as exploratory rather than as confirmatory evidence of differences among groups.
An additional limitation is that characterization of the diabetic state was based primarily on blood glucose measurements. Other indicators, including fructosamine concentrations, changes in body weight, and food and water consumption, were not assessed systematically. Consequently, the severity and progression of the diabetic state and the overall condition of the animals could not be comprehensively characterized using these additional parameters.
The present findings provide a biochemical context for previous observations of altered xenobiotic disposition in this experimental model [17,18,19,20]. However, the observed oxidative modifications do not establish a direct causal relationship with changes in xenobiotic metabolism or transport. Furthermore, because age- and time-matched control groups were not included at weeks 2 and 4, differences among the experimental time points cannot be attributed exclusively to the duration of hyperglycemia; age-related changes, other time-dependent factors, and early STZ-related effects cannot be conclusively excluded. Future studies incorporating time-matched control groups and direct measurements of relevant drug-metabolizing enzymes, transporters, and molecular pathways are needed to clarify the contribution of persistent hyperglycemia to the observed biochemical patterns and to investigate their potential relationship with altered xenobiotic disposition.
Author Contributions
Conceptualization, P.P. and I.W.; Investigation, H.O.M., A.A. and S.K.; Methodology, P.P., I.W., H.O.M. and A.A.; Writing—original draft, P.P. and H.O.M.; Writing—review, and editing, P.P., I.W. and H.O.M.; Funding acquisition, P.P. All authors have read and agreed to the published version of the manuscript.
Funding
This study was supported by the European Union and co-financed by the European Social Fund (EFOP-3.6.1.-16-2016-00004).
Institutional Review Board Statement
The study was designed and conducted according to European legislation (Directive 2010/63/E.U.) [24] and Hungarian Government regulation (40/2013., II. 14.) [25] on the protection of animals used for scientific purposes. The project was approved by the Animal Welfare Committee of the University of Pécs and by the Government Office of Baranya County (license No. BAI35/51-61/2016 and license supplement (supplement No. BAI35/90-5/2019), 29 June 2016.
Informed Consent Statement
Not applicable.
Data Availability Statement
The original contributions presented in this study are included in the article. Further inquiries can be directed to the corresponding authors.
Conflicts of Interest
The authors declare no conflicts of interest.
References
- Mekala, K.C.; Bertoni, A.G. Chapter 4. Epidemiology of diabetes mellitus. In Transplantation, Bioengineering, and Regeneration of the Endocrine Pancreas; Orlando, G., Piemonti, L., Ricordi, C., Stratta, R.J., Gruessner, R.W.G., Eds.; Academic Press: Cambridge, MA, USA, 2020; pp. 49–58. [Google Scholar] [CrossRef] [Scilit]
- Saeedi, P.; Petersohn, I.; Salpea, P.; Malanda, B.; Karuranga, S.; Unwin, N.; Colagiuri, S.; Guariguata, L.; Motala, A.A.; Ogurtsova, K.; et al. Global and regional diabetes prevalence estimates for 2019 and projections for 2030 and 2045: Results from the International Diabetes Federation Diabetes Atlas, 9th edition. Diabetes Res. Clin. Pract. 2019, 157, 107843. [Google Scholar] [CrossRef] [Scilit] [PubMed]
- Antar, S.A.; Ashour, N.A.; Sharaky, M.; Khattab, M.; Ashour, N.A.; Zaid, R.T.; Roh, E.J.; Elkamhawy, A.; Al-Karmalawy, A.A. Diabetes mellitus: Classification, mediators, and complications; A gate to identify potential targets for the development of new effective treatments. Biomed. Pharmacother. 2023, 168, 115734. [Google Scholar] [CrossRef] [Scilit] [PubMed]
- González, P.; Lozano, P.; Ros, G.; Solano, F. Hyperglycemia and oxidative stress: An integral, updated and critical overview of their metabolic interconnections. Int. J. Mol. Sci. 2023, 24, 9352. [Google Scholar] [CrossRef] [Scilit] [PubMed]
- Tangvarasittichai, S. Oxidative stress, insulin resistance, dyslipidemia and type 2 diabetes mellitus. World J. Diabetes 2015, 6, 456–480. [Google Scholar] [CrossRef] [Scilit] [PubMed]
- Molnár, G.A.; Wagner, Z.; Markó, L.; Kőszegi, T.; Mohás, M.; Kocsis, B.; Matus, Z.; Wagner, L.; Tamaskó, M.; Mazák, I.; et al. Urinary ortho-tyrosine excretion in diabetes mellitus and renal failure: Evidence for hydroxyl radical production. Kidney Int. 2005, 68, 2281–2287. [Google Scholar] [CrossRef] [Scilit] [PubMed]
- Darakjian, L.; Deodhar, M.; Turgeon, J.; Michaud, V. Chronic inflammatory status observed in patients with type 2 diabetes induces modulation of cytochrome P450 expression and activity. Int. J. Mol. Sci. 2021, 22, 4967. [Google Scholar] [CrossRef] [Scilit] [PubMed]
- Gwilt, P.R.; Nahhas, R.R.; Tracewell, W.G. The effects of diabetes mellitus on pharmacokinetics and pharmacodynamics in humans. Clin. Pharmacokinet. 1991, 20, 477–490. [Google Scholar] [CrossRef] [Scilit] [PubMed]
- Dostalek, M.; Akhlaghi, F.; Puzanovova, M. Effect of diabetes mellitus on pharmacokinetic and pharmacodynamic properties of drugs. Clin. Pharmacokinet. 2012, 51, 481–499. [Google Scholar] [CrossRef] [Scilit] [PubMed]
- Chen, F.; Li, D.-Y.; Zhang, B.; Sun, J.-Y.; Sun, F.; Ji, X.; Qiu, J.-C.; Parker, R.B.; Laizure, S.C.; Xu, J. Alterations of drug-metabolizing enzymes and transporters under diabetic conditions: What is the potential clinical significance? Drug Metab. Rev. 2018, 50, 369–397. [Google Scholar] [CrossRef] [Scilit] [PubMed]
- Ayala, A.; Muñoz, M.F.; Argüelles, S. Lipid peroxidation: Production, metabolism, and signaling mechanisms of malondialdehyde and 4-hydroxy-2-nonenal. Oxid. Med. Cell. Longev. 2014, 2014, 360438. [Google Scholar] [CrossRef] [Scilit] [PubMed]
- Biondi, R.; Xia, Y.; Rossi, R.; Paolocci, N.; Ambrosio, G.; Zweier, J.L. Detection of hydroxyl radicals by d-phenylalanine hydroxylation: A specific assay for hydroxyl radical generation in biological systems. Anal. Biochem. 2001, 290, 138–145. [Google Scholar] [CrossRef] [Scilit] [PubMed]
- Yang, Y.; Liu, X. Imbalance of drug transporter-CYP450s interplay by diabetes and its clinical significance. Pharmaceutics 2020, 12, 348. [Google Scholar] [CrossRef] [Scilit] [PubMed]
- Keller, M.A.; Piedrafita, G.; Ralser, M. The widespread role of non-enzymatic reactions in cellular metabolism. Curr. Opin. Biotechnol. 2015, 34, 153–161. [Google Scholar] [CrossRef] [Scilit] [PubMed]
- Ghasemi, A.; Jeddi, S.; Kashfi, K. Streptozotocin as a tool for induction of rat models of diabetes: A practical guide. EXCLI J. 2023, 22, 274–294. [Google Scholar] [CrossRef] [Scilit] [PubMed]
- Gajdosík, A.; Gajdosíková, A.; Stefek, M.; Navarová, J.; Hozová, R. Streptozotocin-induced experimental diabetes in male Wistar rats. Gen. Physiol. Biophys. 1999, 18, 54–62. [Google Scholar] [PubMed]
- Almási, A.; Pinto, É.dI.L.N.; Kovács, N.P.; Fischer, T.; Markovics, Z.; Fischer, E.; Perjési, P. Changes in hepatic metabolic enzyme activities and biliary excretion of 4-nitrophenol in streptozotocin induced diabetic rats. Braz. J. Pharm. Sci. 2018, 54, e17347. [Google Scholar] [CrossRef] [Scilit]
- Kuzma, M.; Nyúl, E.; Mayer, M.; Fischer, E.; Perjési, P. HPLC analysis of in vivo intestinal absorption and oxidative metabolism of salicylic acid in the rat. Biomed. Chromatogr. 2016, 30, 2044–2052. [Google Scholar] [CrossRef] [Scilit] [PubMed]
- Kovács, N.P.; Almási, A.; Garai, K.; Kuzma, M.; Vancea, S.; Fischer, E.; Perjési, P. Investigation of intestinal elimination and biliary excretion of ibuprofen in hyperglycemic rats. Can. J. Physiol. Pharmacol. 2019, 97, 1080–1089. [Google Scholar] [CrossRef] [Scilit] [PubMed]
- Mohammed, H.O.; Almási, A.; Molnár, S.; Perjési, P. The intestinal and biliary metabolites of ibuprofen in the rat with experimental hyperglycemia. Molecules 2022, 27, 4000. [Google Scholar] [CrossRef] [Scilit] [PubMed]
- Goyal, S.N.; Reddy, N.M.; Patil, K.R.; Nakhate, K.T.; Ojha, S.; Patil, C.R.; Agrawal, Y.O. Challenges and issues with streptozotocin-induced diabetes—A clinically relevant animal model to understand the diabetes pathogenesis and evaluate therapeutics. Chem. Biol. Interact. 2016, 244, 49–63. [Google Scholar] [CrossRef] [Scilit] [PubMed]
- Loo, R.Y.H.; Zhang, X.; Ching, C.; Teo, A.K.K. Models of hyperglycemia in diabetes mellitus and its complications. Nat. Rev. Endocrinol. 2026, 22, 369–380. [Google Scholar] [CrossRef] [Scilit] [PubMed]
- Espeland, M.A.; Semelka, C.T.; Kritchevsky, S.B.; Evans, J.K.; Newman, A.B. The look AHEAD research program: A 25-year retrospective from the perspective of geroscience. Diabetes Care 2026, 49, 1159–1162. [Google Scholar] [CrossRef] [Scilit] [PubMed]
- European-Union. Directive 2010/63/EU of the European Parliament and of the Council of 22 September 2010 on the Protection of Animals Used for Scientific Purposes Text with EEA Relevance. 2010. Available online: https://eur-lex.europa.eu/eli/dir/2010/63/oj (accessed on 30 July 2026).
- The Government of Hungary. Government Decree No. 40 of 2013 (II. 14.) on Animal Testing. 2013. Available online: https://www.fao.org/faolex/results/details/en/c/LEX-FAOC124420 (accessed on 30 July 2026).
- Dawnay, A.B.; Hirst, A.D.; Perry, D.E.; Chambers, R.E. A critical assessment of current analytical methods for the routine assay of serum total protein and recommendations for their improvement. Ann. Clin. Biochem. 1991, 28, 556–567. [Google Scholar] [CrossRef] [Scilit] [PubMed]
- Levine, R.L.; Garland, D.; Oliver, C.N.; Amici, A.; Climent, I.; Lenz, A.G.; Ahn, B.W.; Shaltiel, S.; Stadtman, E.R. Determination of carbonyl content in oxidatively modified proteins. Methods Enzymol. 1990, 186, 464–478. [Google Scholar] [CrossRef] [Scilit] [PubMed]
- Nakamura, A.; Goto, S. Analysis of protein carbonyls with 2,4-dinitrophenyl hydrazine and its antibodies by immunoblot in two-dimensional gel electrophoresis. J. Biochem. 1996, 119, 768–774. [Google Scholar] [CrossRef] [Scilit] [PubMed]
- Recknagel, R.O.; Ghoshal, A.K. Quantitative estimation of peroxidative degeneration of rat liver microsomal and mitochondrial lipids after carbon tetrachloride poisoning. Exp. Mol. Pathol. 1966, 5, 413–426. [Google Scholar] [CrossRef] [Scilit] [PubMed]
- Ohkawa, H.; Ohishi, N.; Yagi, K. Assay for lipid peroxides in animal tissues by thiobarbituric acid reaction. Anal. Biochem. 1979, 95, 351–358. [Google Scholar] [CrossRef] [Scilit] [PubMed]
- Ellis, H.R. On ‘Tissue sulfhydryl groups’ by George, L. Ellman. Arch. Biochem. Biophys. 2022, 726, 109174. [Google Scholar] [CrossRef] [Scilit] [PubMed]
- Sedlak, J.; Lindsay, R.H. Estimation of total, protein-bound, and nonprotein sulfhydryl groups in tissue with Ellman’s reagent. Anal. Biochem. 1968, 25, 192–205. [Google Scholar] [CrossRef] [Scilit] [PubMed]
- Mikolás, E.; Kun, S.; Laczy, B.; Molnár, G.A.; Sélley, E.; Kőszegi, T.; Wittmann, I. Incorporation of ortho- and meta-tyrosine into cellular proteins leads to erythropoietin-resistance in an erythroid cell line. Kidney Blood Press. Res. 2013, 38, 217–225. [Google Scholar] [CrossRef] [Scilit] [PubMed]
- Mohás-Cseh, J.; Molnár, G.A.; Pap, M.; Laczy, B.; Vas, T.; Kertész, M.; Németh, K.; Hetényi, C.; Csikós, O.; Tóth, G.K.; et al. Incorporation of oxidized phenylalanine derivatives into insulin signaling relevant proteins may link oxidative stress to signaling conditions underlying chronic insulin resistance. Biomedicines 2022, 10, 975. [Google Scholar] [CrossRef] [Scilit] [PubMed]
- Onyango, A.N.; Baba, N. New hypotheses on the pathways of formation of malondialdehyde and isofurans. Free Radic. Biol. Med. 2010, 49, 1594–1600. [Google Scholar] [CrossRef] [Scilit] [PubMed]
- Huang, Z.-Z.; Li, H.; Cai, J.; Kuhlenkamp, J.; Kaplowitz, N.; Lu, S.C. Changes in glutathione homeostasis during liver regeneration in the rat. Hepatology 1998, 27, 147–153. [Google Scholar] [CrossRef] [Scilit] [PubMed]
- Lőrincz, T.; Szarka, A. The determination of hepatic glutathione at tissue and subcellular level. J. Pharmacol. Toxicol. Methods. 2017, 88, 32–39. [Google Scholar] [CrossRef] [Scilit] [PubMed]
- Stipanuk, M.H.; Dominy, J.E., Jr.; Li, J.-I.; Coloso, R.M. Mammalian cysteine metabolism: New insights into regulation. J. Nutr. 2006, 136, 1652S–1659S. [Google Scholar] [CrossRef] [Scilit] [PubMed]
- Lerner, A.B. On the metabolism of phenylalanine and tyrosine. J. Biol. Chem. 1949, 181, 281–294. [Google Scholar] [CrossRef] [Scilit]
- Molnár, G.A.; Kun, S.; Sélley, E.; Kertész, M.; Szélig, L.; Csontos, C.; Böddi, K.; Bogár, L.; Miseta, A.; Wittmann, I. Role of tyrosine isomers in acute and chronic diseases leading to oxidative stress—A Review. Curr. Med. Chem. 2016, 23, 667–685. [Google Scholar] [CrossRef] [Scilit] [PubMed]
- Pennathur, S.; Wagner, J.D.; Leeuwenburgh, C.; Litwak, K.N.; Heinecke, J.W. A hydroxyl radical-like species oxidizes cynomolgus monkey artery wall proteins in early diabetic vascular disease. J. Clin. Invest. 2001, 107, 853–860. [Google Scholar] [CrossRef] [Scilit] [PubMed]
- Karunanayake, E.H.; Hearse, D.J.; Mellows, G. The synthesis of [14C]streptozotocin and its distribution and excretion in the rat. Biochem. J. 1974, 142, 673–683. [Google Scholar] [CrossRef] [Scilit] [PubMed]
- Barrera-Chimal, J.; Jaisser, F. Pathophysiologic mechanisms in diabetic kidney disease: A focus on current and future therapeutic targets. Diabetes Obes. Metab. 2020, 22, 16–31. [Google Scholar] [CrossRef] [Scilit] [PubMed]
- Brownlee, M. The pathobiology of diabetic complications: A unifying mechanism. Diabetes 2005, 54, 1615–1625. [Google Scholar] [CrossRef] [Scilit] [PubMed]
- Fiorentino, T.V.; Prioletta, A.; Zuo, P.; Folli, F. Hyperglycemia-induced oxidative stress and its role in diabetes mellitus related cardiovascular diseases. Curr. Pharm. Des. 2013, 19, 5695–5703. [Google Scholar] [CrossRef] [Scilit] [PubMed]
- Yaribeygi, H.; Sathyapalan, T.; Atkin, S.L.; Sahebkar, A. Molecular mechanisms linking oxidative stress and diabetes mellitus. Oxid. Med. Cell. Longev. 2020, 2020, 8609213. [Google Scholar] [CrossRef] [Scilit] [PubMed]
- Kehm, R.; Baldensperger, T.; Raupbach, J.; Höhn, A. Protein oxidation—Formation mechanisms, detection and relevance as biomarkers in human diseases. Redox Biol. 2021, 42, 101901. [Google Scholar] [CrossRef] [Scilit] [PubMed]
- Garibotto, G.; Sofia, A.; Saffioti, S.; Bonanni, A.; Mannucci, I.; Verzola, D. Amino acid and protein metabolism in the human kidney and in patients with chronic kidney disease. Clin. Nutr. 2010, 29, 424–433. [Google Scholar] [CrossRef] [Scilit] [PubMed]
- Girotti, A.W. Lipid hydroperoxide generation, turnover, and effector action in biological systems. J. Lipid Res. 1998, 39, 1529–1542. [Google Scholar] [CrossRef] [Scilit]
- Corongiu, F.P.; Banni, S. Detection of conjugated dienes by second derivative ultraviolet spectrophotometry. Methods Enzymol. 1994, 233, 303–310. [Google Scholar] [CrossRef] [Scilit] [PubMed]
- Jové, M.; Mota-Martorell, N.; Pradas, I.; Martín-Gari, M.; Ayala, V.; Pamplona, R. The advanced lipoxidation end-product malondialdehyde-lysine in aging and longevity. Antioxidants 2020, 9, 1132. [Google Scholar] [CrossRef] [Scilit] [PubMed]
- Gutteridge, J.M.C. Free-radical damage to lipids, amino acids, carbohydrates and nucleic acids determined by thiobarbituric acid reactivity. Int. J. Biochem. 1982, 14, 649–653. [Google Scholar] [CrossRef] [Scilit] [PubMed]
- Tsikas, D. Assessment of lipid peroxidation by measuring malondialdehyde (MDA) and relatives in biological samples: Analytical and biological challenges. Anal. Biochem. 2017, 524, 13–30. [Google Scholar] [CrossRef] [Scilit] [PubMed]
- Janero, D.R. Malondialdehyde and thiobarbituric acid-reactivity as diagnostic indices of lipid peroxidation and peroxidative tissue injury. Free Radic. Biol. Med. 1990, 9, 515–540. [Google Scholar] [CrossRef] [Scilit] [PubMed]
- Bhattacharyya, A.; Chattopadhyay, R.; Mitra, S.; Crowe, S.E. Oxidative stress: An essential factor in the pathogenesis of gastrointestinal mucosal diseases. Physiol. Rev. 2014, 94, 329–354. [Google Scholar] [CrossRef] [Scilit] [PubMed]
- Slatter, D.A.; Bolton, C.H.; Bailey, A.J. The importance of lipid-derived malondialdehyde in diabetes mellitus. Diabetologia 2000, 43, 550–557. [Google Scholar] [CrossRef] [Scilit] [PubMed]
- Davì, G.; Falco, A.; Patrono, C. Lipid peroxidation in diabetes mellitus. Antioxid. Redox Signal. 2005, 7, 256–268. [Google Scholar] [CrossRef] [Scilit] [PubMed]
- Lawrence, R.A.; Burk, R.F. Species, tissue and subcellular distribution of non Se-dependent glutathione peroxidase activity. J. Nutr. 1978, 108, 211–215. [Google Scholar] [CrossRef] [Scilit] [PubMed]
- Lu, S.C. Glutathione synthesis. Biochim. Biophys. Acta 2013, 1830, 3143–3153. [Google Scholar] [CrossRef] [Scilit] [PubMed]
- Hinchman, C.A.; Ballatori, N. Glutathione-degrading capacities of liver and kidney in different species. Biochem. Pharmacol. 1990, 40, 1131–1135. [Google Scholar] [CrossRef] [Scilit] [PubMed]
- Lash, L.H. Role of glutathione transport processes in kidney function. Toxicol. Appl. Pharmacol. 2005, 204, 329–342. [Google Scholar] [CrossRef] [Scilit] [PubMed]

Disclaimer/Publisher’s Note: The statements, opinions and data contained in all publications are solely those of the individual author(s) and contributor(s) and not of MDPI and/or the editor(s). MDPI and/or the editor(s) disclaim responsibility for any injury to people or property resulting from any ideas, methods, instructions or products referred to in the content. |
© 2026 by the authors. Licensee MDPI, Basel, Switzerland. This article is an open access article distributed under the terms and conditions of the Creative Commons Attribution (CC BY) license.