


Abstract
Introduction: The introduction of Combination Antiretroviral Therapy (cART) has substantially improved HIV management, reducing morbidity and mortality while extending life expectancy for People Living with HIV (PLHIV). However, the aging HIV population presents new challenges, including comorbidities and increased medication use leading to polypharmacy, which can compromise treatment adherence and result in adverse outcomes such as hospitalizations and drug reactions. The Medication Regimen Complexity Index (MRCI) provides a quantitative measure to assess medication regimen complexity, considering factors such as dosing frequency and administration instructions. Higher MRCI scores denote more complex regimens, posing challenges to patient adherence. Drug interactions, especially those involving anti-TB drugs and ART, further complicate management, potentially compromising treatment efficacy. Therefore, we examined the associations between MRCI and the number of drug–drug interactions in PLHIV. The findings will inform tailored interventions and support programs by the National AIDS Control Organization (NACO) to optimize treatment outcomes for PLHIV, contributing to public health efforts in India and globally. Methodology: This prospective, observational cohort study was conducted at a medical college-attached teaching hospital in southern India. The study assessed potential drug–drug interactions (pDDIs) by reviewing current prescriptions for interactions among antiretroviral drugs and concomitant medications. Interaction groupings were based on interaction type, interacting medications, clinical implications, and intensity criteria. Results: A total of 285 participants were included, with a median age of 48 years. A positive correlation of moderate-to-strong magnitude was found between average MRCI and the number of pDDIs (unadjusted Spearman ρ = 0.641, p < 0.001), and between baseline MRCI and the number of pDDIs (ρ = 0.575, p < 0.001). In a multivariable Poisson regression adjusting for baseline age, sex, comorbidity burden, co-trimoxazole (TMP-SMX) prophylaxis, CD4 count, viral suppression and antiretroviral regimen class (n = 285), the association between baseline MRCI and baseline pDDI count was attenuated but remained statistically significant (unadjusted IRR 1.068, 95% CI 1.052–1.085; adjusted IRR 1.051, 95% CI 1.031–1.073, p < 0.001), indicating that it is not fully explained by the covariates examined, including ART regimen class. Conclusions: Higher medication regimen complexity was significantly correlated with a greater number of potential drug–drug interactions among PLHIV. As this was an observational study of potential interactions, the findings indicate association rather than causation, and clinical consequences were not confirmed.
1. Introduction
The advent of Combination Antiretroviral Therapy (cART) marked a pivotal moment in HIV management, significantly reducing associated morbidity and mortality while improving life expectancy for People Living with HIV (PLHIV) [1]. However, the aging population of PLHIV brings about new challenges, including comorbid conditions and increased medication use, leading to polypharmacy. High pill burden, a consequence of complex medication regimens, often leads to poor adherence to ART, which can result in adverse outcomes such as hospitalizations and drug reactions [2]. The management of HIV is complicated by the prevalence of comorbidities and DDIs when concurrently administering ART with other medications.
Understanding and assessing individuals with HIV is crucial for implementing effective therapies, especially for special populations who often lack evidence-based guidance for their clinical management [3,4]. These populations have complex physiological changes, making drug–drug interaction (DDI) studies in healthy adults insufficient for understanding potential DDIs across diverse groups.
The Medication Regimen Complexity Index (MRCI) offers a quantitative measure to assess the complexity of medication regimens, taking into account factors like dosing frequency, dosage forms, and administration instructions [5]. Higher MRCI scores indicate more complex regimens, which may pose challenges to patients’ ability to adhere to their prescribed treatment plans.
Hepatic dysfunction is a common complication in PLHIV, exacerbated by comorbid hepatitis B and C infections. Drug interactions, especially those involving anti-TB drugs and ART, further complicate management, potentially compromising treatment efficacy. The impact of rifampicin on the metabolism of antiretroviral drugs, particularly nucleoside and NNRTI, underscores the importance of careful dosing adjustments and close monitoring.
In addition to hepatic dysfunction, renal impairment is prevalent among PLHIV, necessitating cautious management of hypertension, type 2 diabetes, and hyperlipidemia, considering potential drug interactions with ART. Strategies for minimizing DDIs and optimizing therapy in renal-impaired individuals are crucial for maintaining treatment efficacy and preventing adverse outcomes. Therefore, we examined the associations between MRCI and the number of drug–drug interactions in PLHIV. Through these objectives, the study aimed to provide valuable insights into improving treatment outcomes and patient care in HIV management.
2. Results
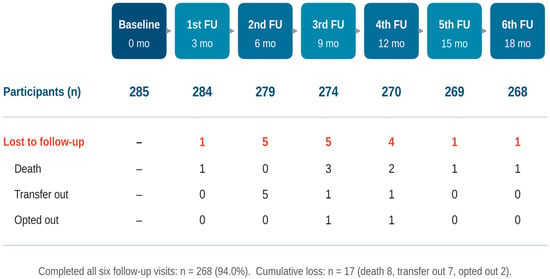
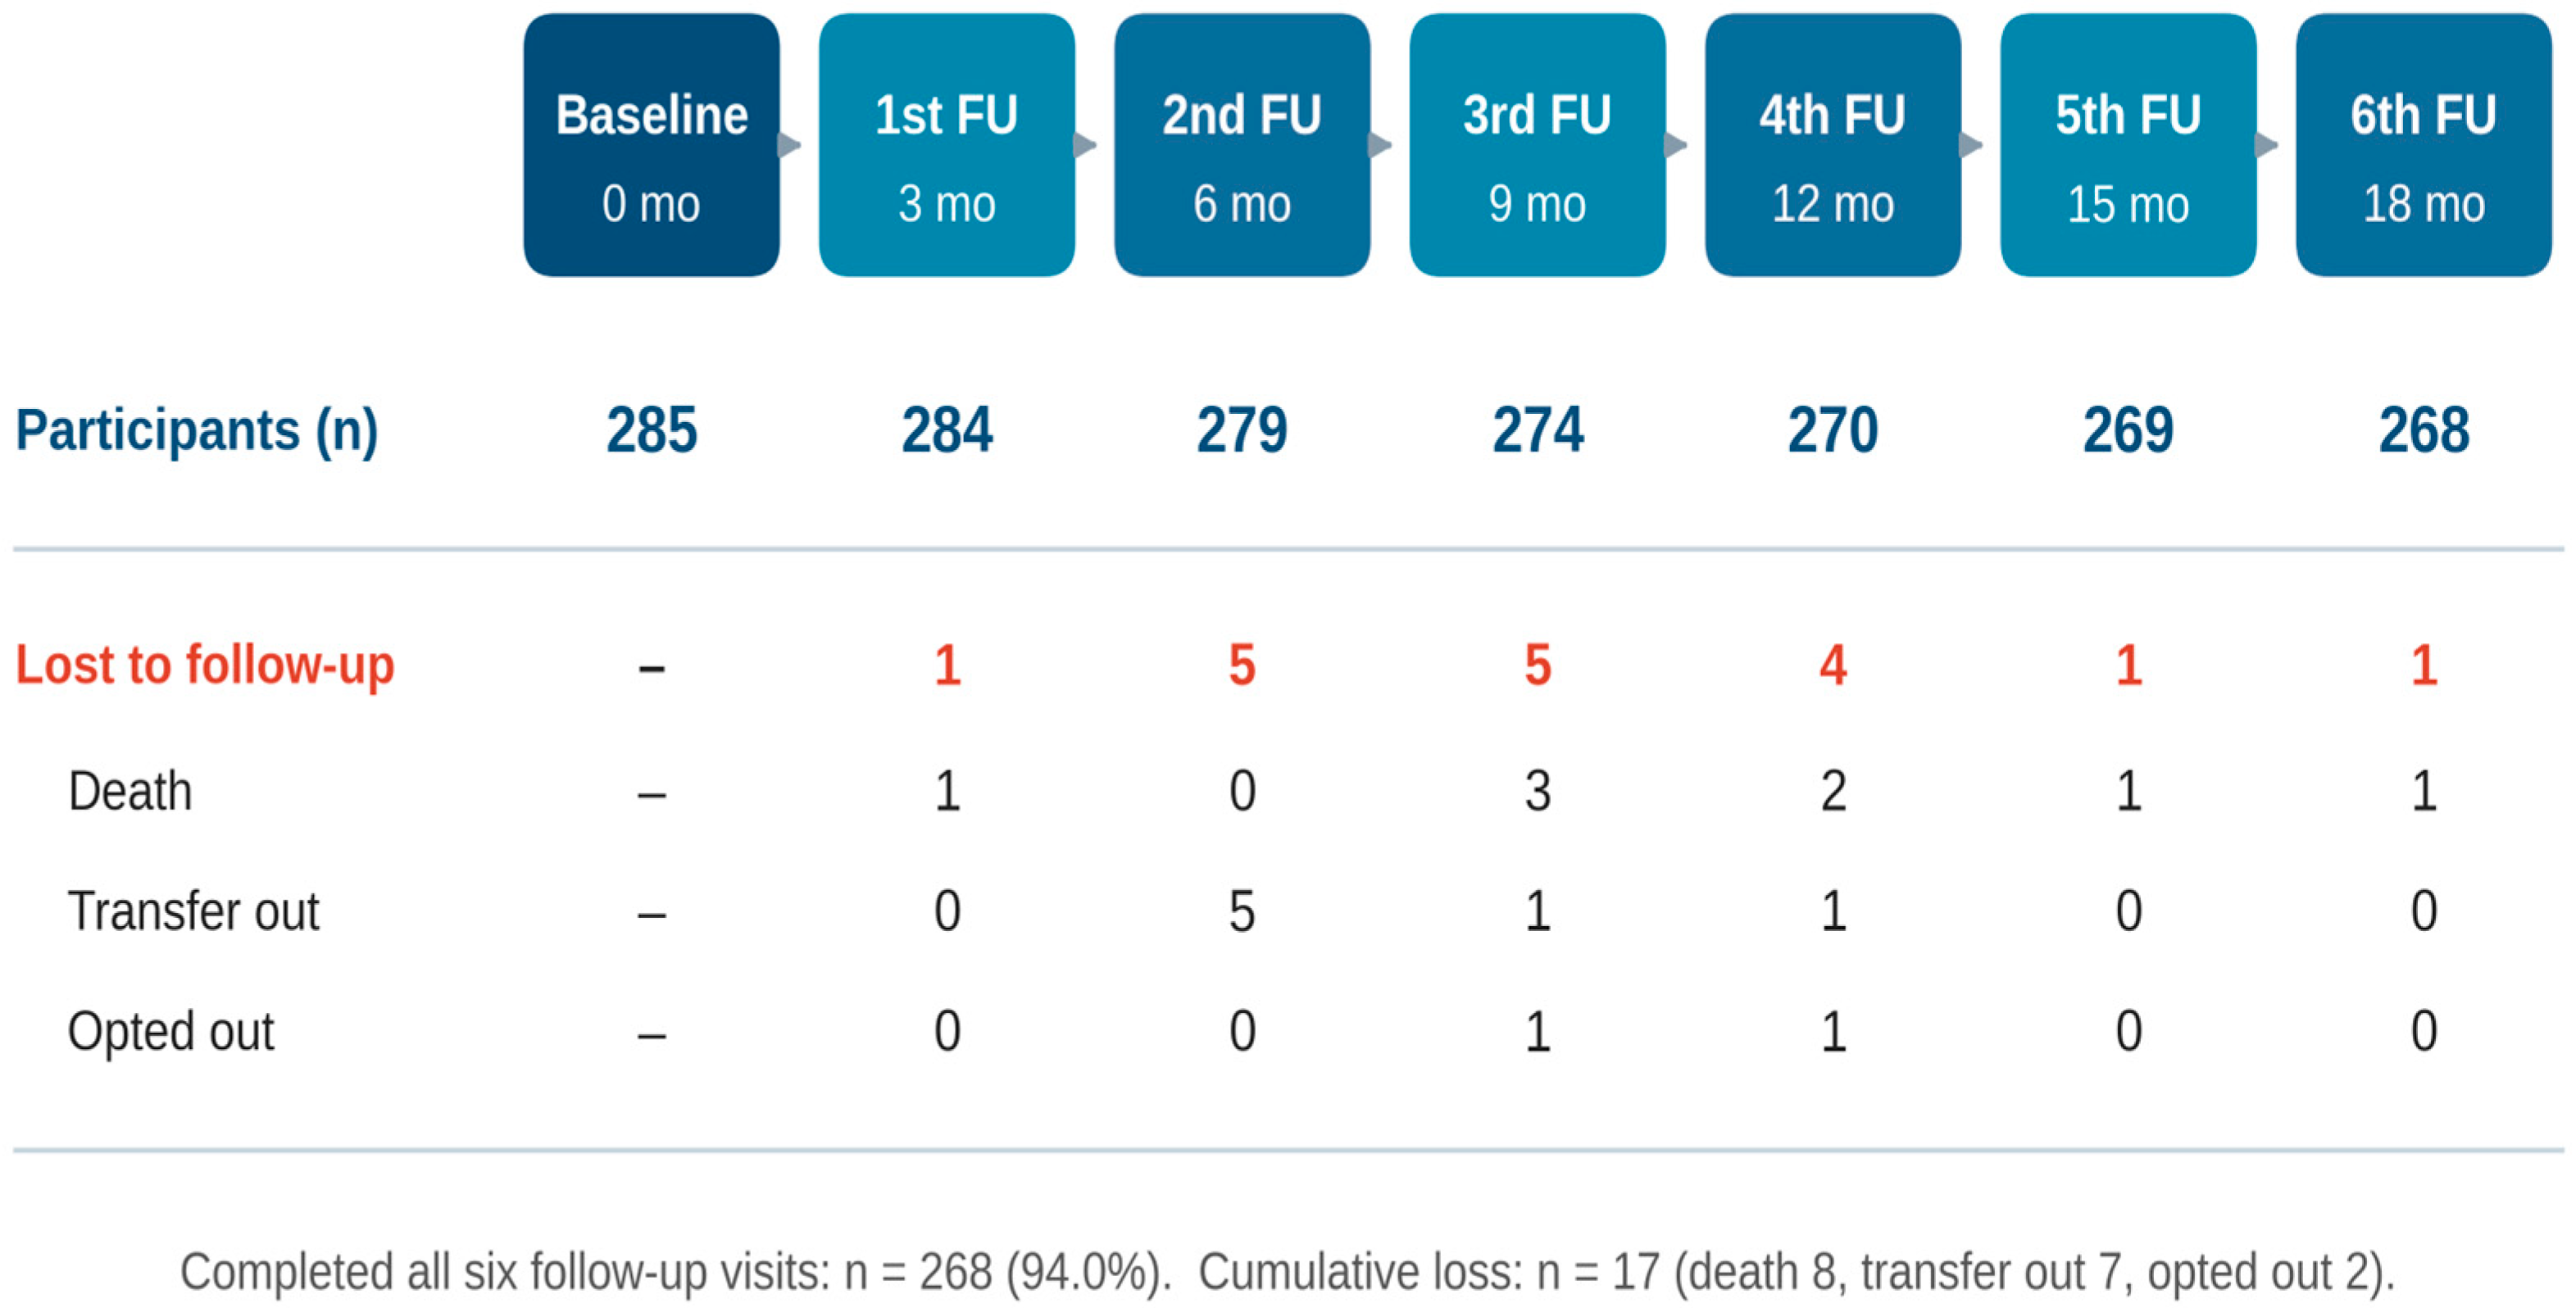
A total of 285 subjects underwent screening. Every participant was enrolled in the research and qualified. The research lasted eighteen months; 268 participants (94.0%) completed all six follow-up visits. The number of participants contributing data at each assessment was 285 (baseline), 284, 279, 274, 270, 269 and 268 (first to sixth follow-up; Figure 1 and Table 1), and each longitudinal analysis below uses the participant-contributed data at the respective visit, without imputation. Among the research participants, 147 (51.6%) were men and 138 (48.4%) were women. The median age was 48 years (interquartile range [IQR], 39.50–54.00). The demographic characteristics of the research sample were delineated in our prior publication [6].
Figure 1.
Participant retention across the follow-up timeline.
Table 1.
Participant-contributed data and potential drug–drug interactions (pDDIs) identified at each assessment.
Participant-contributed data at each visit are shown with losses to follow-up by cause (death, transfer out, opted out).
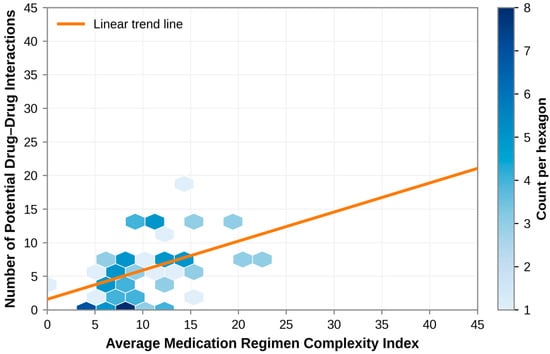
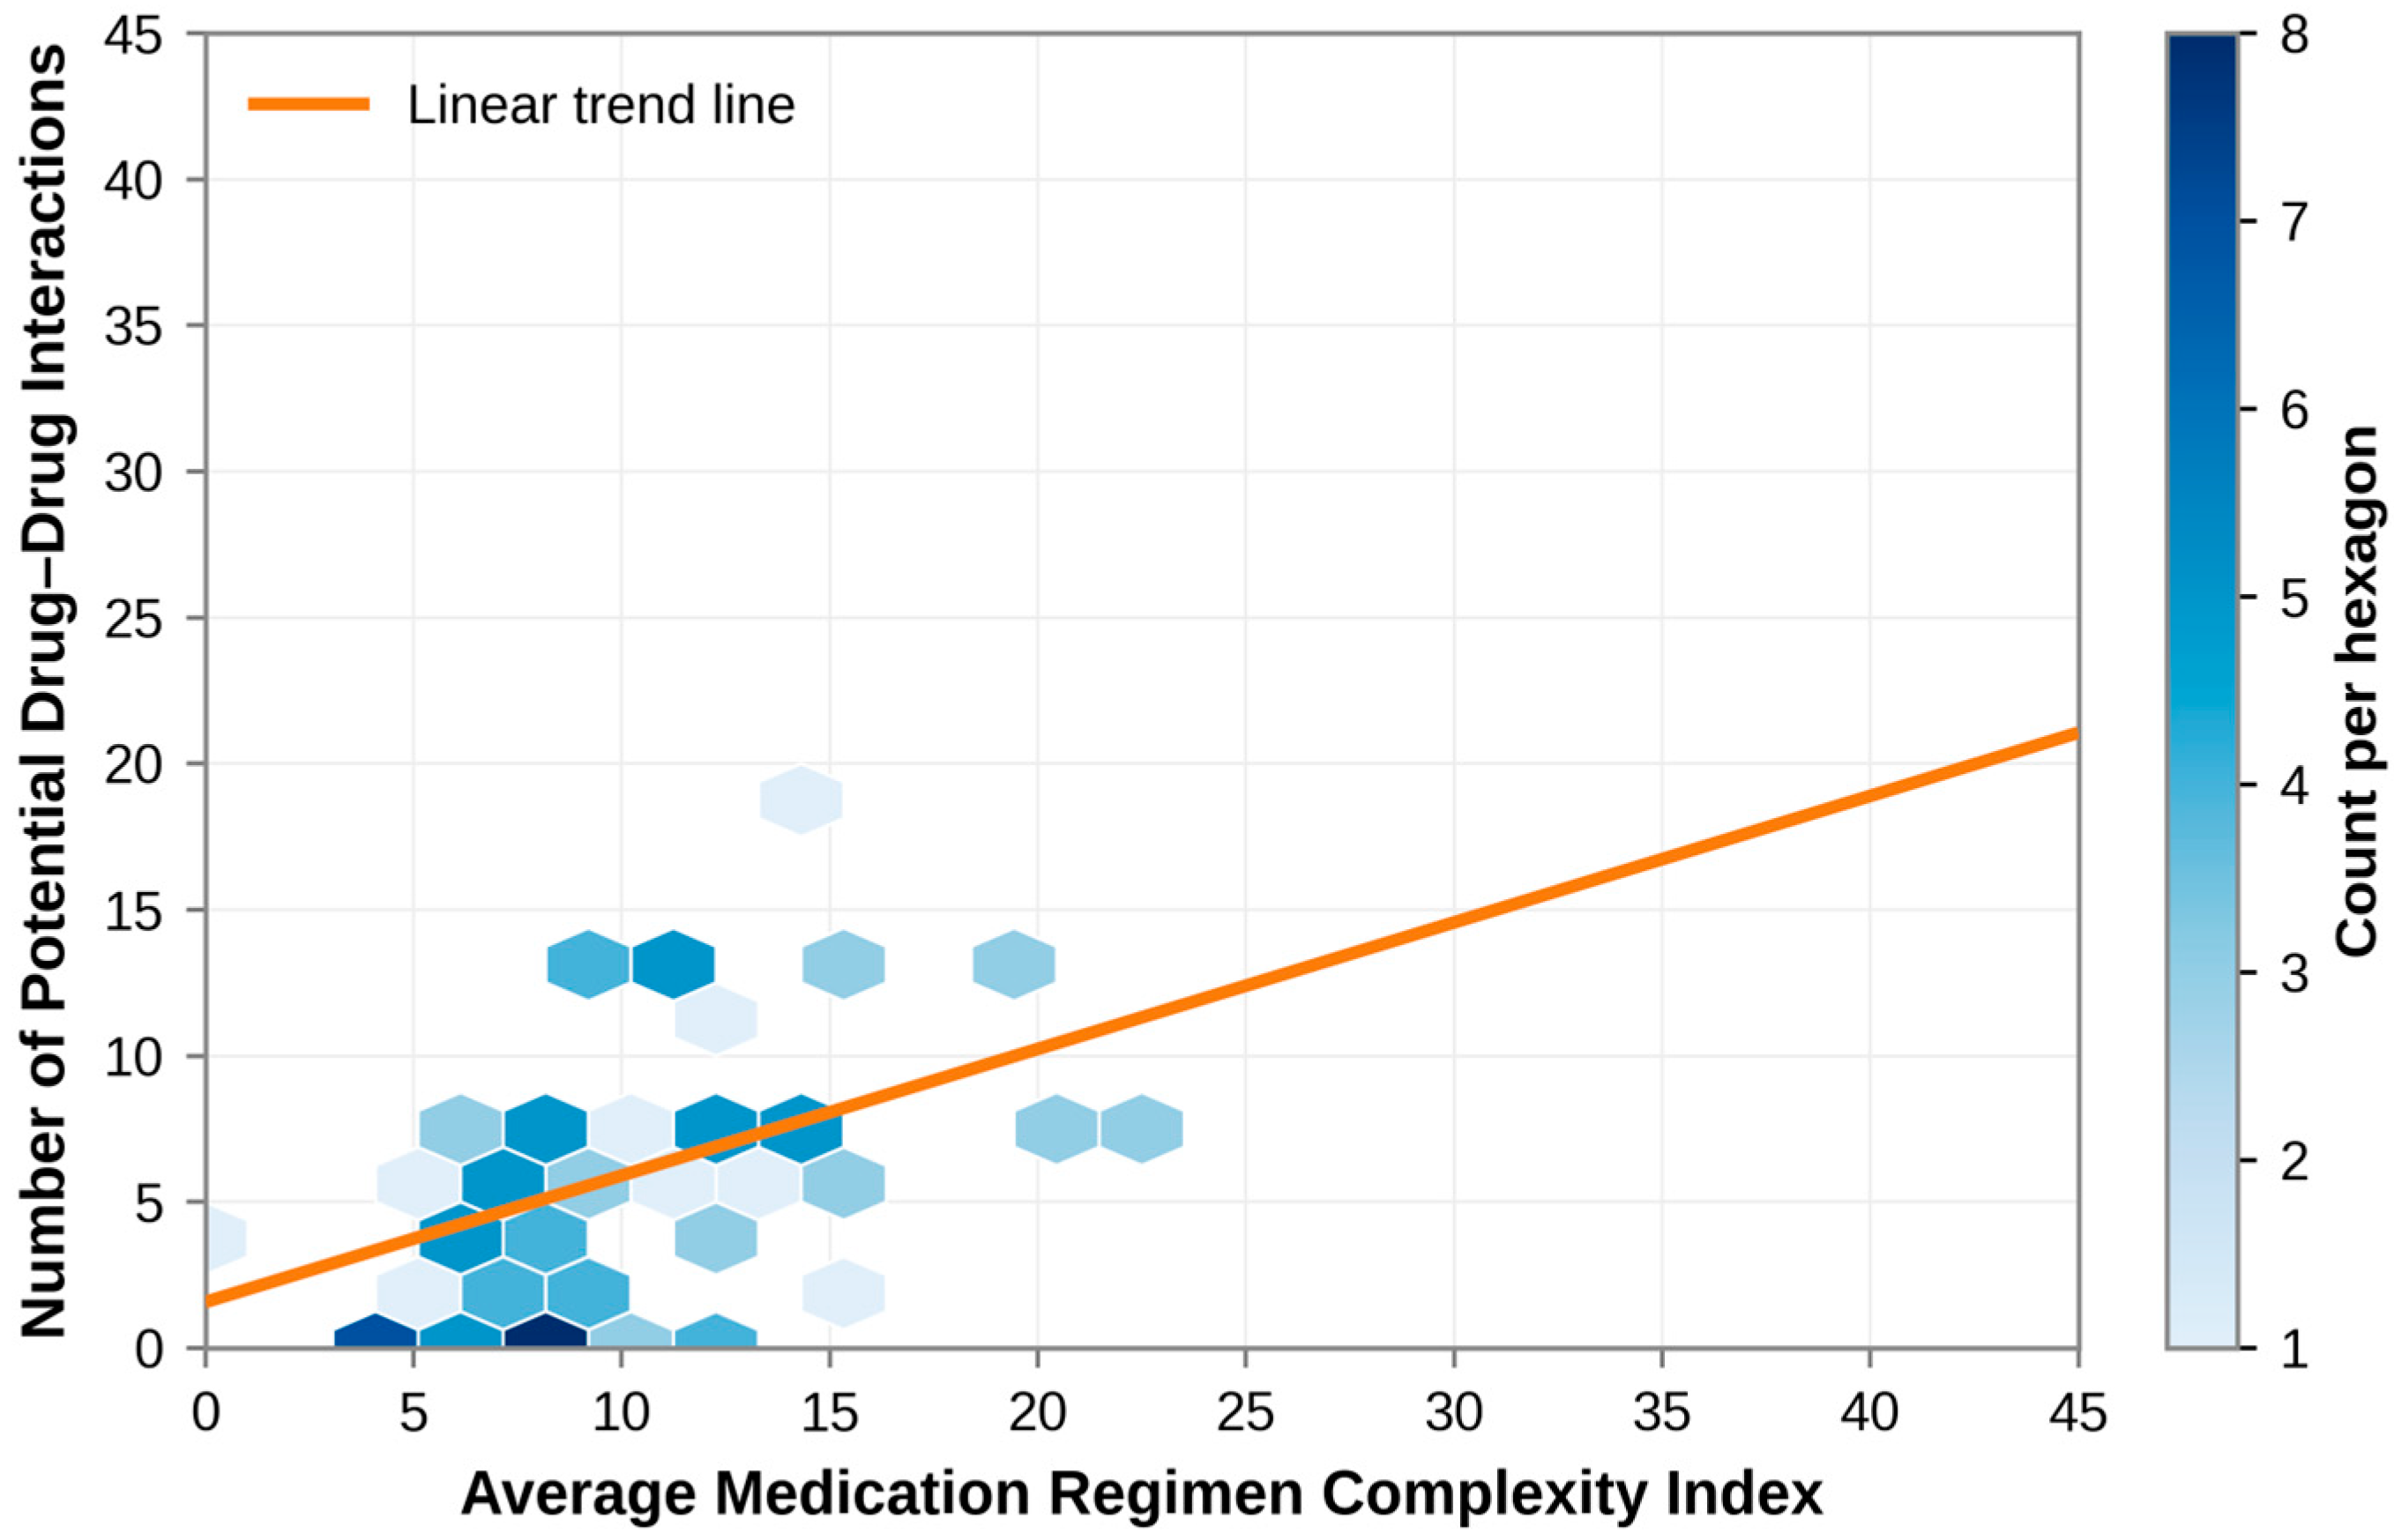
The correlation analysis between Average Medication Regimen Complexity Index and potential drug–drug interactions revealed a moderate-to-strong positive unadjusted correlation (Spearman’s rho = 0.641, p < 0.001) with the number of pDDIs per participant accumulated across the follow-up assessments. This indicates a statistically significant association between greater average regimen complexity and a larger number of pDDIs. Because this is a bivariate analysis, it does not account for medication burden or other confounders (see the multivariable analysis below).
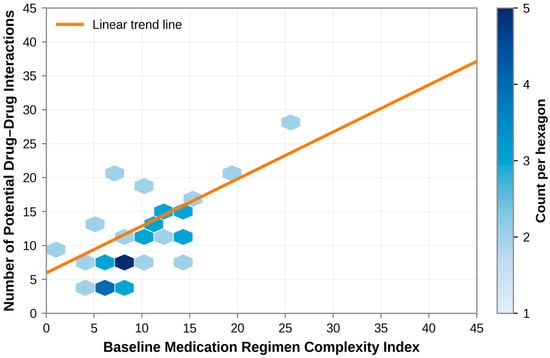
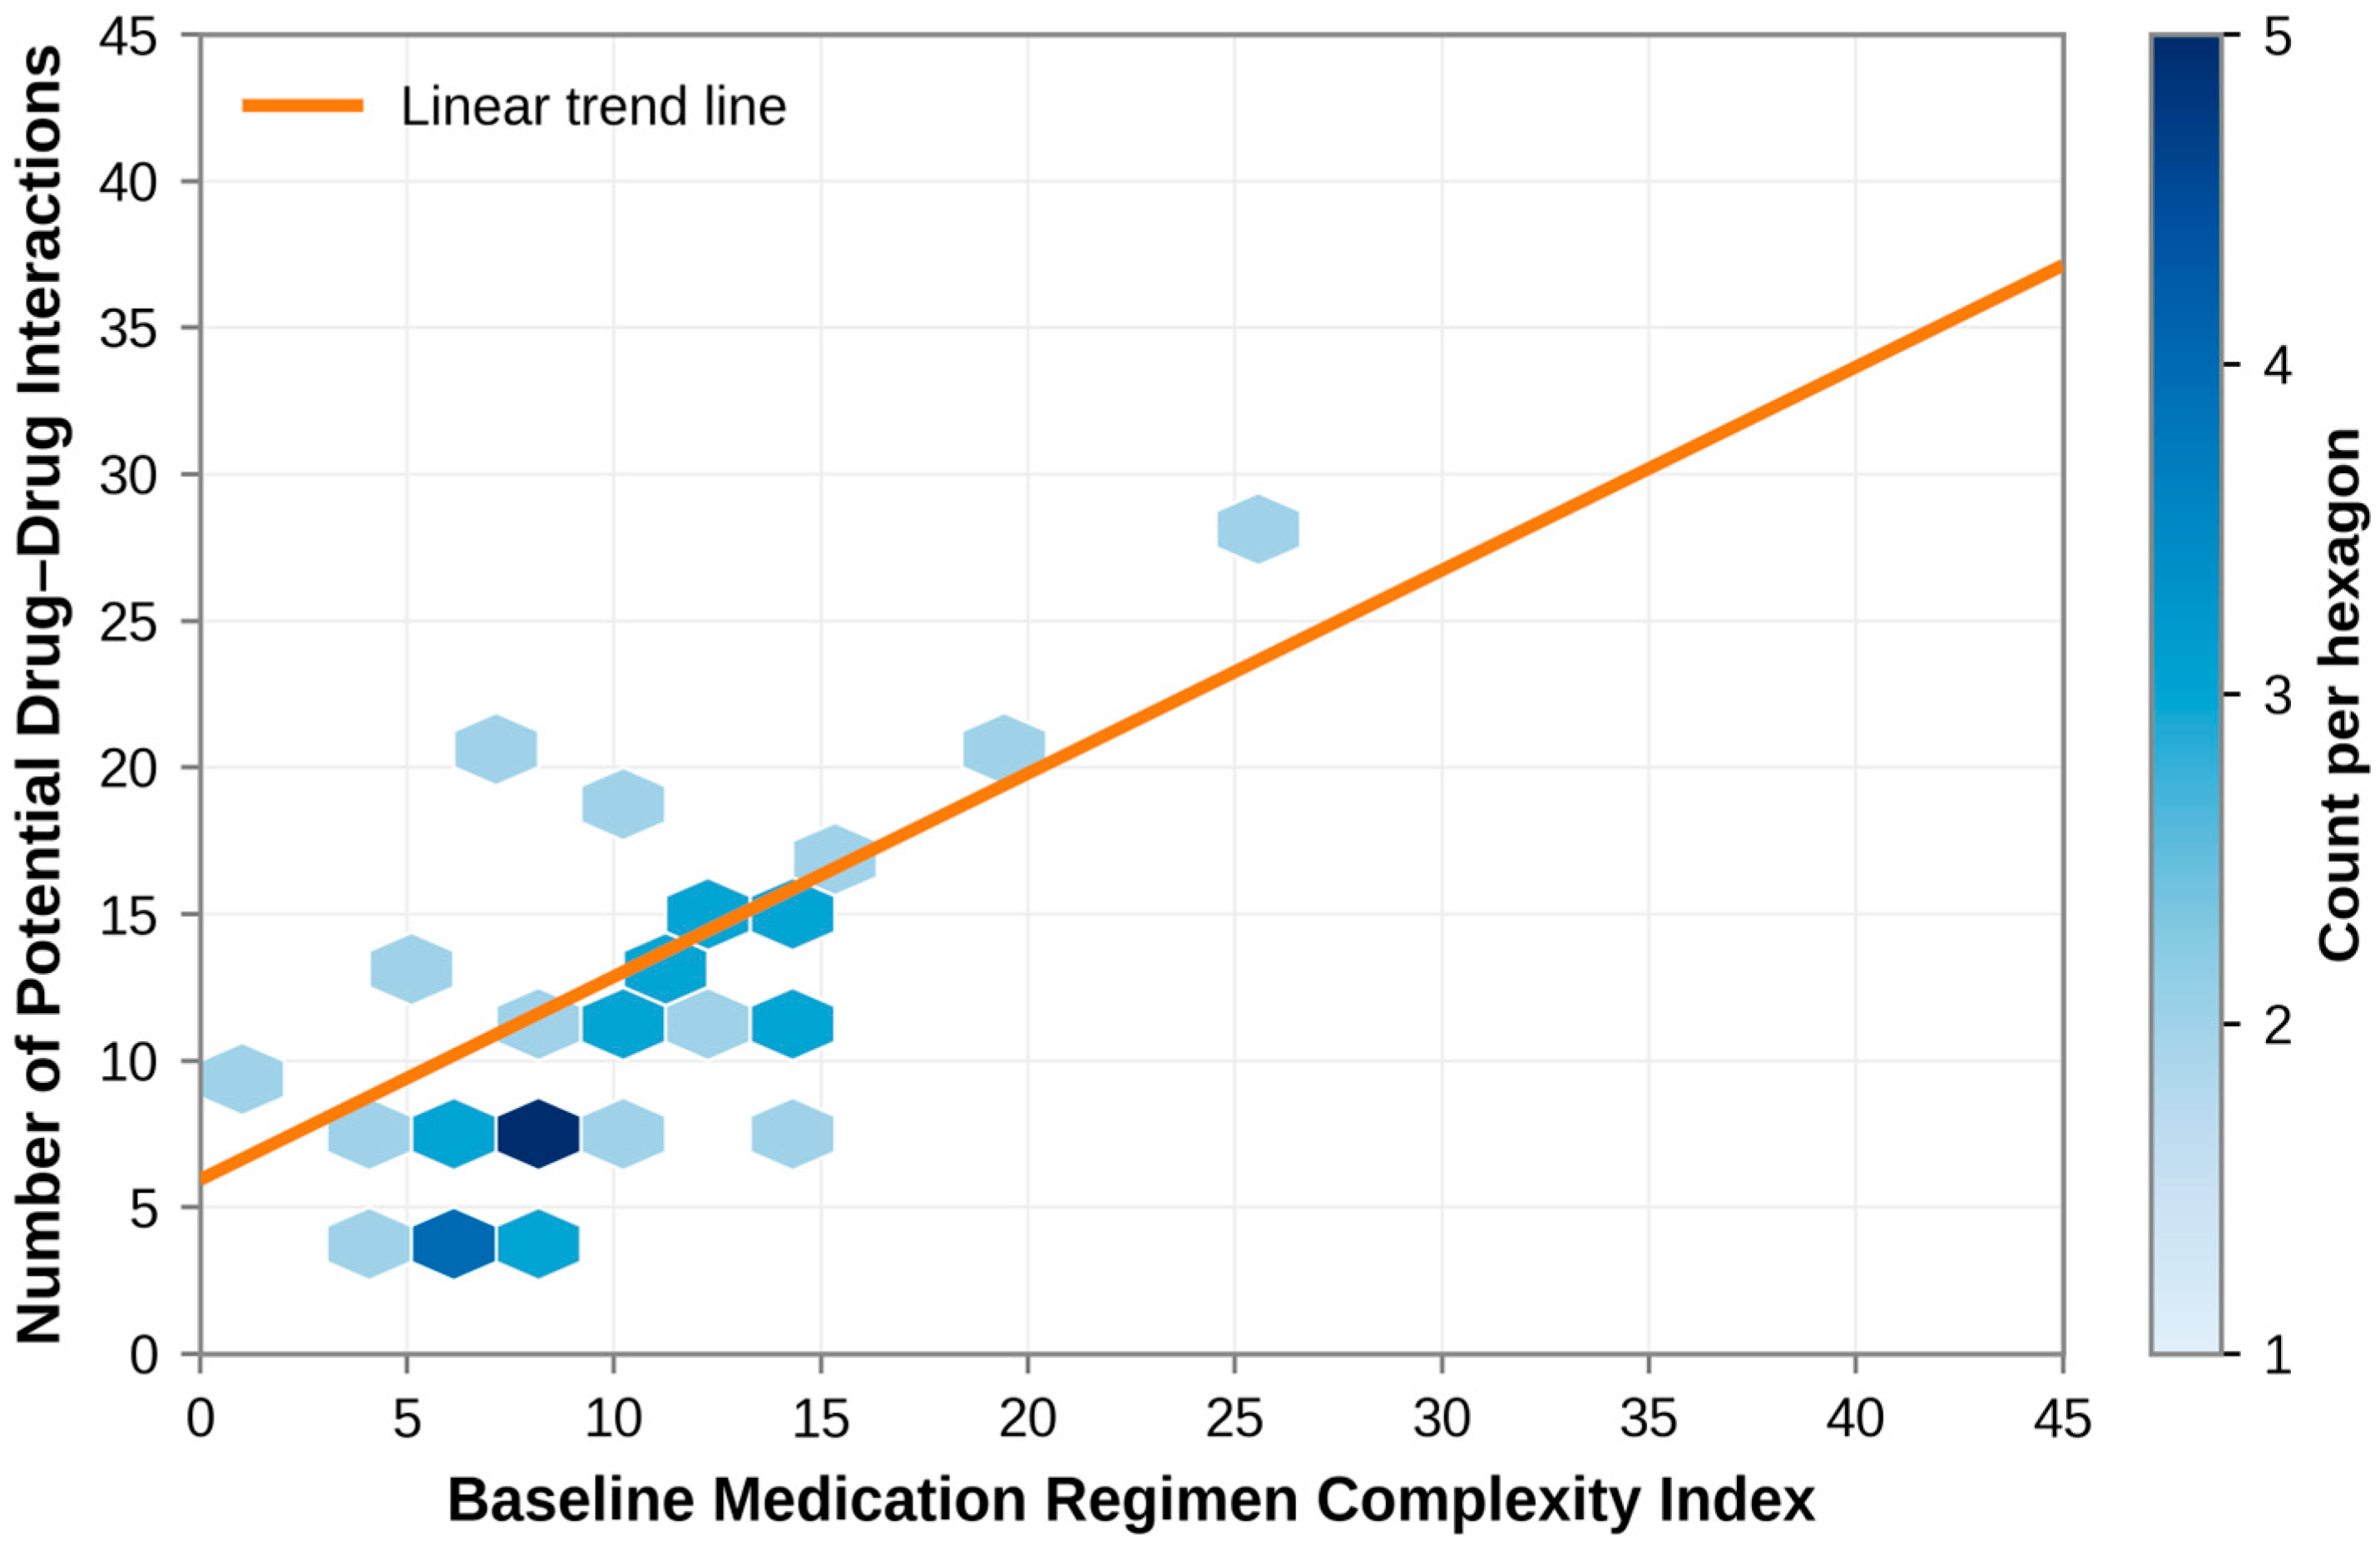
The correlation analysis between Baseline Medication Regimen Complexity Index score and potential drug–drug interactions revealed a moderate positive unadjusted correlation (Spearman’s rho = 0.575, p < 0.001) with the number of pDDIs accumulated across all follow-up assessments. Higher baseline regimen complexity was therefore associated with a larger cumulative number of pDDIs; this unadjusted association does not establish that regimen complexity itself causes interactions.
Two MRCI measures were analyzed against different pDDI outcome windows (Table 2). Average MRCI (the mean of the six follow-up assessments) and baseline MRCI were each correlated with the number of pDDIs per participant accumulated across follow-up (Figure 2 and Figure 3). Because baseline covariates are available only at baseline, the multivariable models relate baseline MRCI to the baseline pDDI count. For a like-for-like comparison, the unadjusted Spearman correlation between baseline MRCI and baseline pDDI count was ρ = 0.558 (p < 0.001; n = 285), similar to the value of 0.575 obtained with the cumulative follow-up count. The Spearman coefficients (0.641, 0.575 and 0.558) are unadjusted and should not be read as independent effects of regimen complexity; the adjusted association is reported in Table 3 (adjusted IRR 1.051 versus unadjusted IRR 1.068).
Table 2.
Overview of the MRCI measures, pDDI outcomes and analyses.
Figure 2.
The correlation analysis between Average Medication Regimen Complexity Index and potential drug–drug interactions.
Figure 3.
The correlation analysis between Baseline Medication Regimen Complexity Index and potential drug–drug interactions of all follow-ups.
Table 3.
Liverpool color grade and clinical-implication category of potential drug–drug interactions (pDDIs) at each assessment.
At baseline, out of 285 participants, 131 experienced pDDIs, accounting for 45.96% of the total population. Among these, 69 (52.67%) were male and 62 (47.33%) were female. The p-value for gender distribution concerning pDDIs was 0.371, indicating no significant difference between males and females in experiencing pDDIs.
Across subsequent follow-up periods (first to sixth), the prevalence of pDDIs fluctuated. However, there were no statistically significant differences observed in the prevalence of pDDIs between males and females during these follow-up visits, as indicated by p-values ranging from 0.248 to 0.889. Overall, the findings suggest that pDDIs were prevalent throughout the study period, affecting both male and female participants to a similar extent.
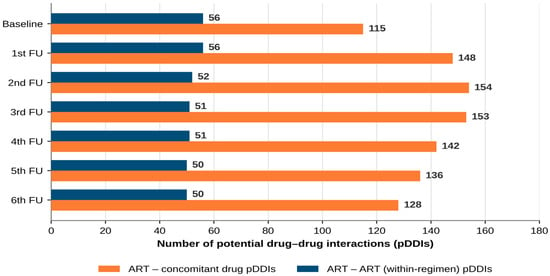
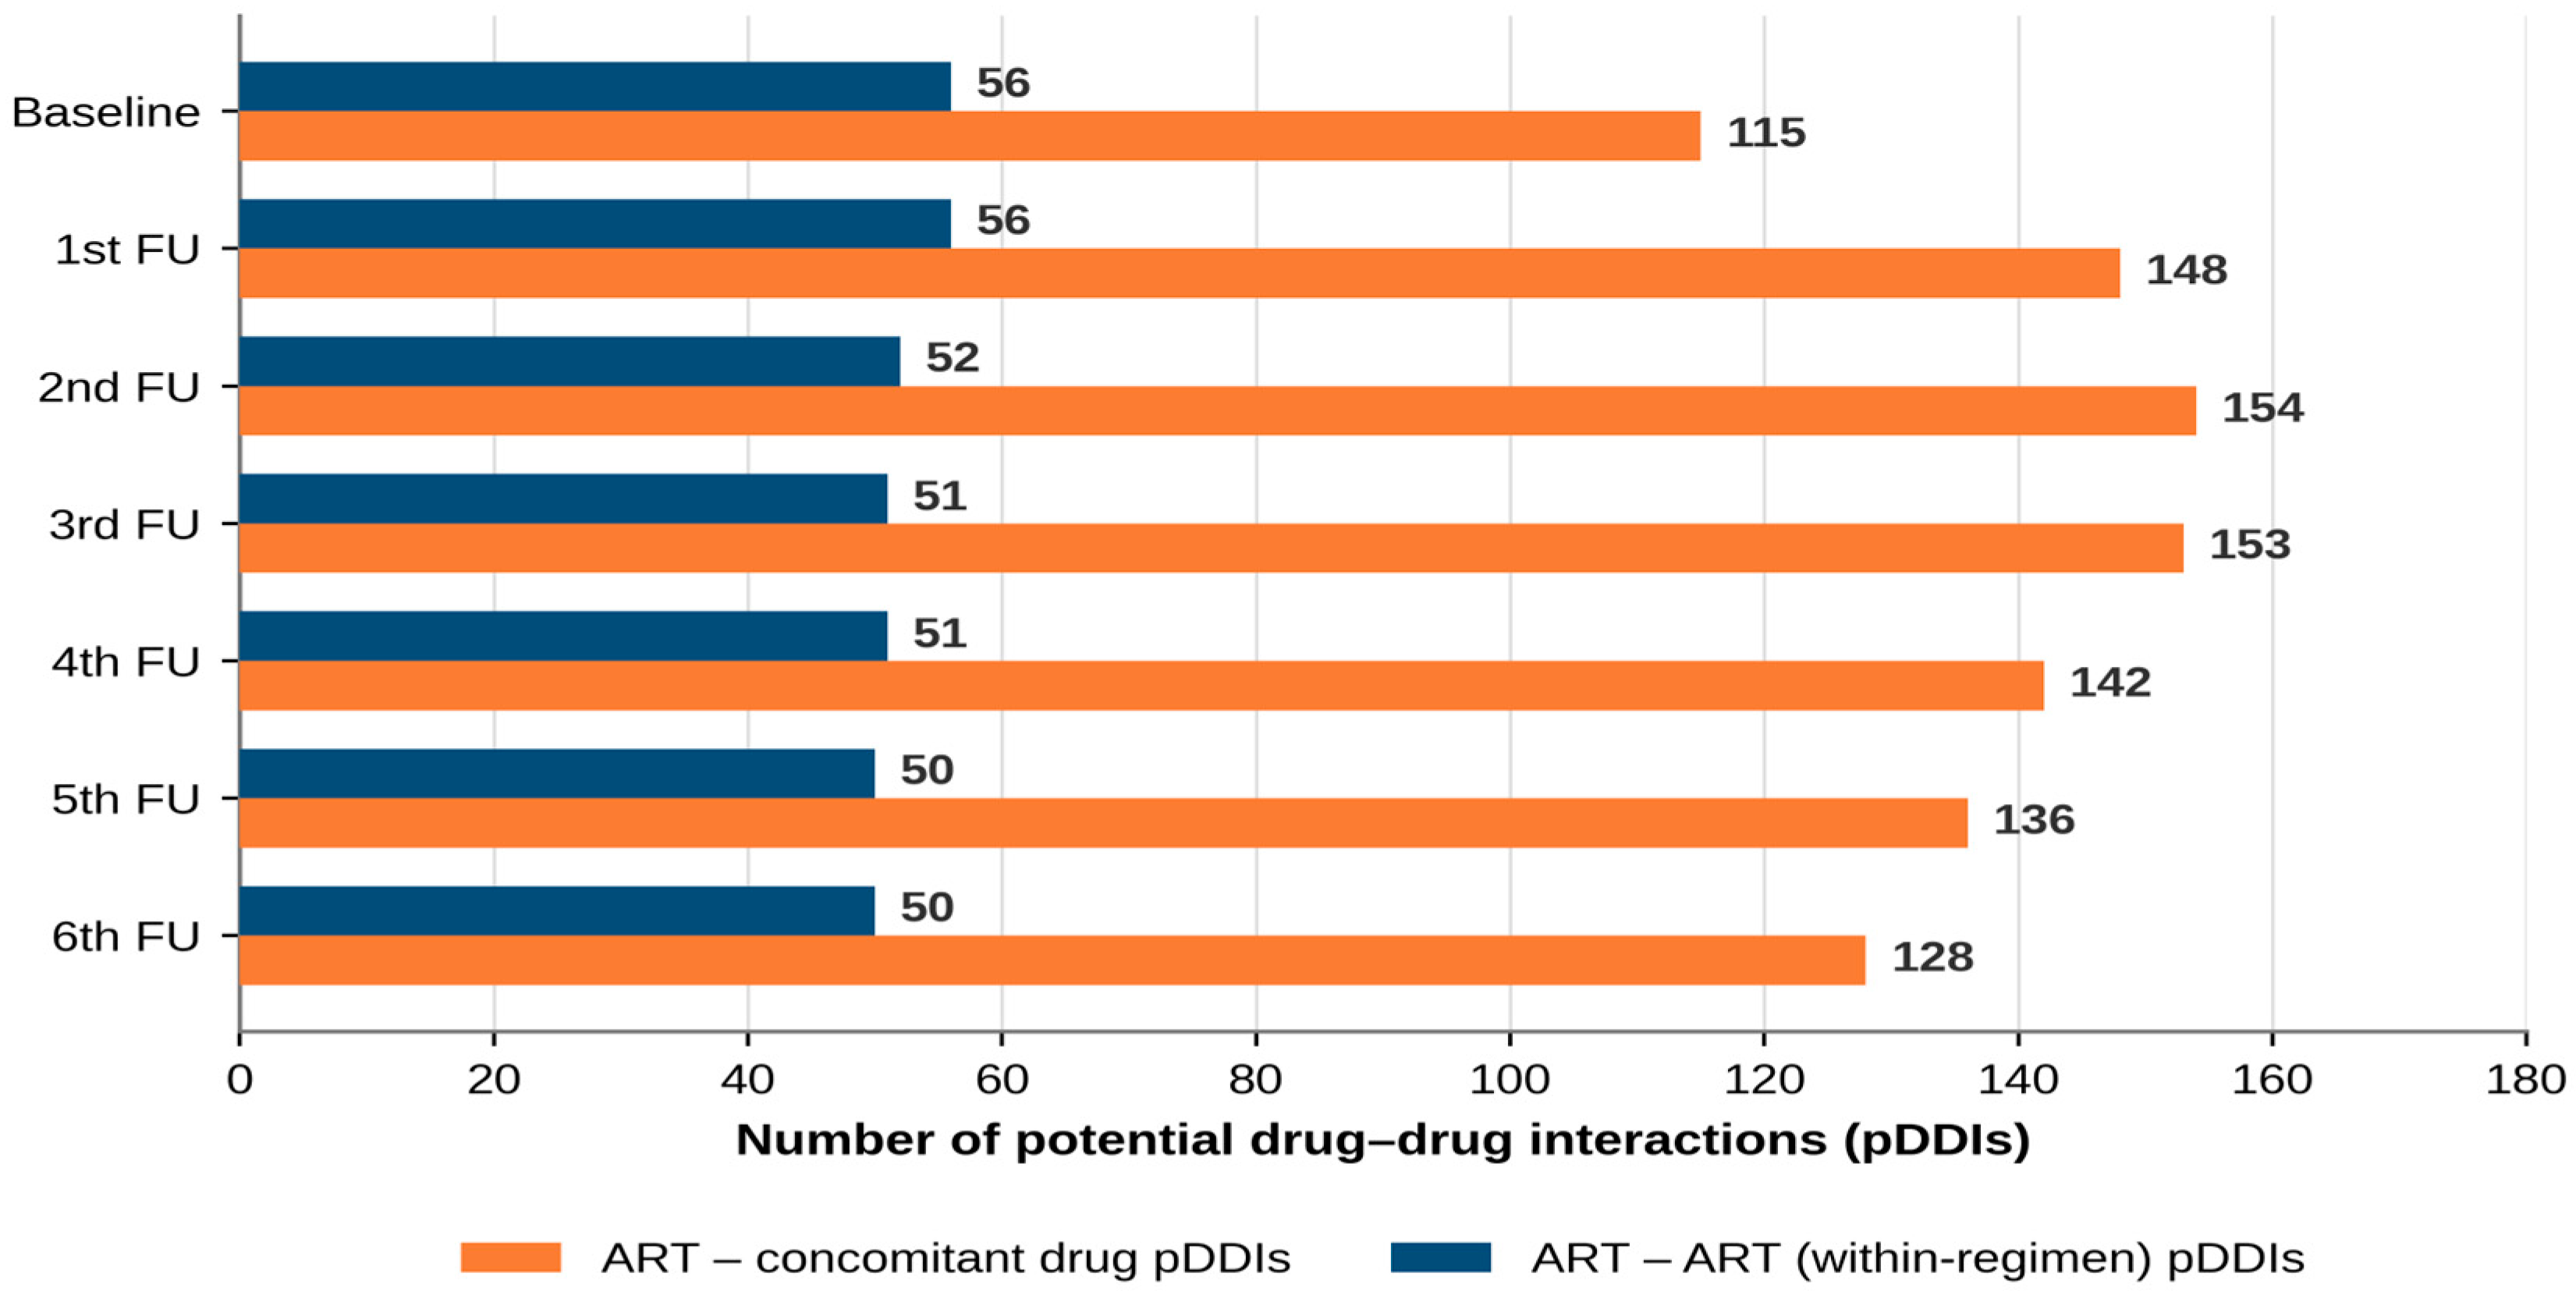
A total of 171 pDDIs were identified in the 285 baseline prescriptions (one prescription per participant): 115 (40.35 per 100 prescriptions) between ART and concomitant drugs and 56 (19.65 per 100 prescriptions) between ART drugs within the same prescription. Prescriptions with a pDDI contained one to four interactions (Figure 4).
Figure 4.
Trends in potential drug–drug interactions (pDDIs) for antiretroviral therapy (ART) drugs and concomitant drugs over follow-up periods. Bars show numbers of pDDIs (not numbers of participants).
Throughout the follow-up periods (first to sixth), the prevalence of pDDIs varied. The proportion of participants contributing data at each follow-up visit who experienced interactions within ART drugs ranged from 16.34% to 22.82%, while those experiencing interactions between ART and concomitant drugs ranged from 32.98% to 44.30%.
Across all follow-up periods, a higher prevalence of pDDIs was observed between ART and concomitant drugs compared to interactions within ART drugs alone. This trend persisted consistently over time. Gender-wise analysis showed no significant differences in the prevalence of pDDIs within ART drugs or between ART and concomitant drugs between males and females across all follow-up periods. Overall, the total number of pDDIs rose from 171 at baseline to a peak of 206 at the second follow-up and then declined to 178 at the sixth follow-up (Table 1), with 1342 pDDIs documented across the seven assessments. Expressed per participant contributing data, the number of pDDIs ranged from 0.60 to 0.74 per participant per assessment.
Overall, the total number of pDDIs increased progressively across follow-up periods, with a total of 1342 pDDIs documented throughout the study duration.
In the following paragraphs on Liverpool categories and clinical implications, percentages are proportions of all pDDIs identified at the respective assessment (Table 1), not proportions of participants.
Overall, the Liverpool HIV Drug Interactions Categorization revealed a consistent predominance of interactions classified as Amber across all follow-up periods, ranging from 80.88% to 84.47%. The percentage of interactions categorized as Red remained consistently low, ranging from 1.46% to 1.96%, while the percentage of Yellow interactions varied slightly, ranging from 14.08% to 17.41% (Supplementary Figure S1).
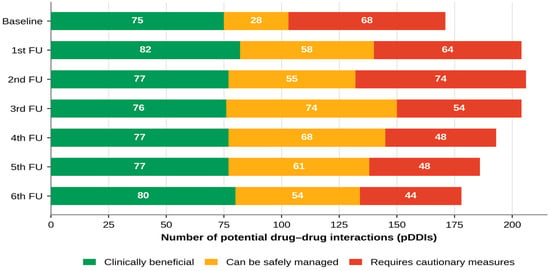
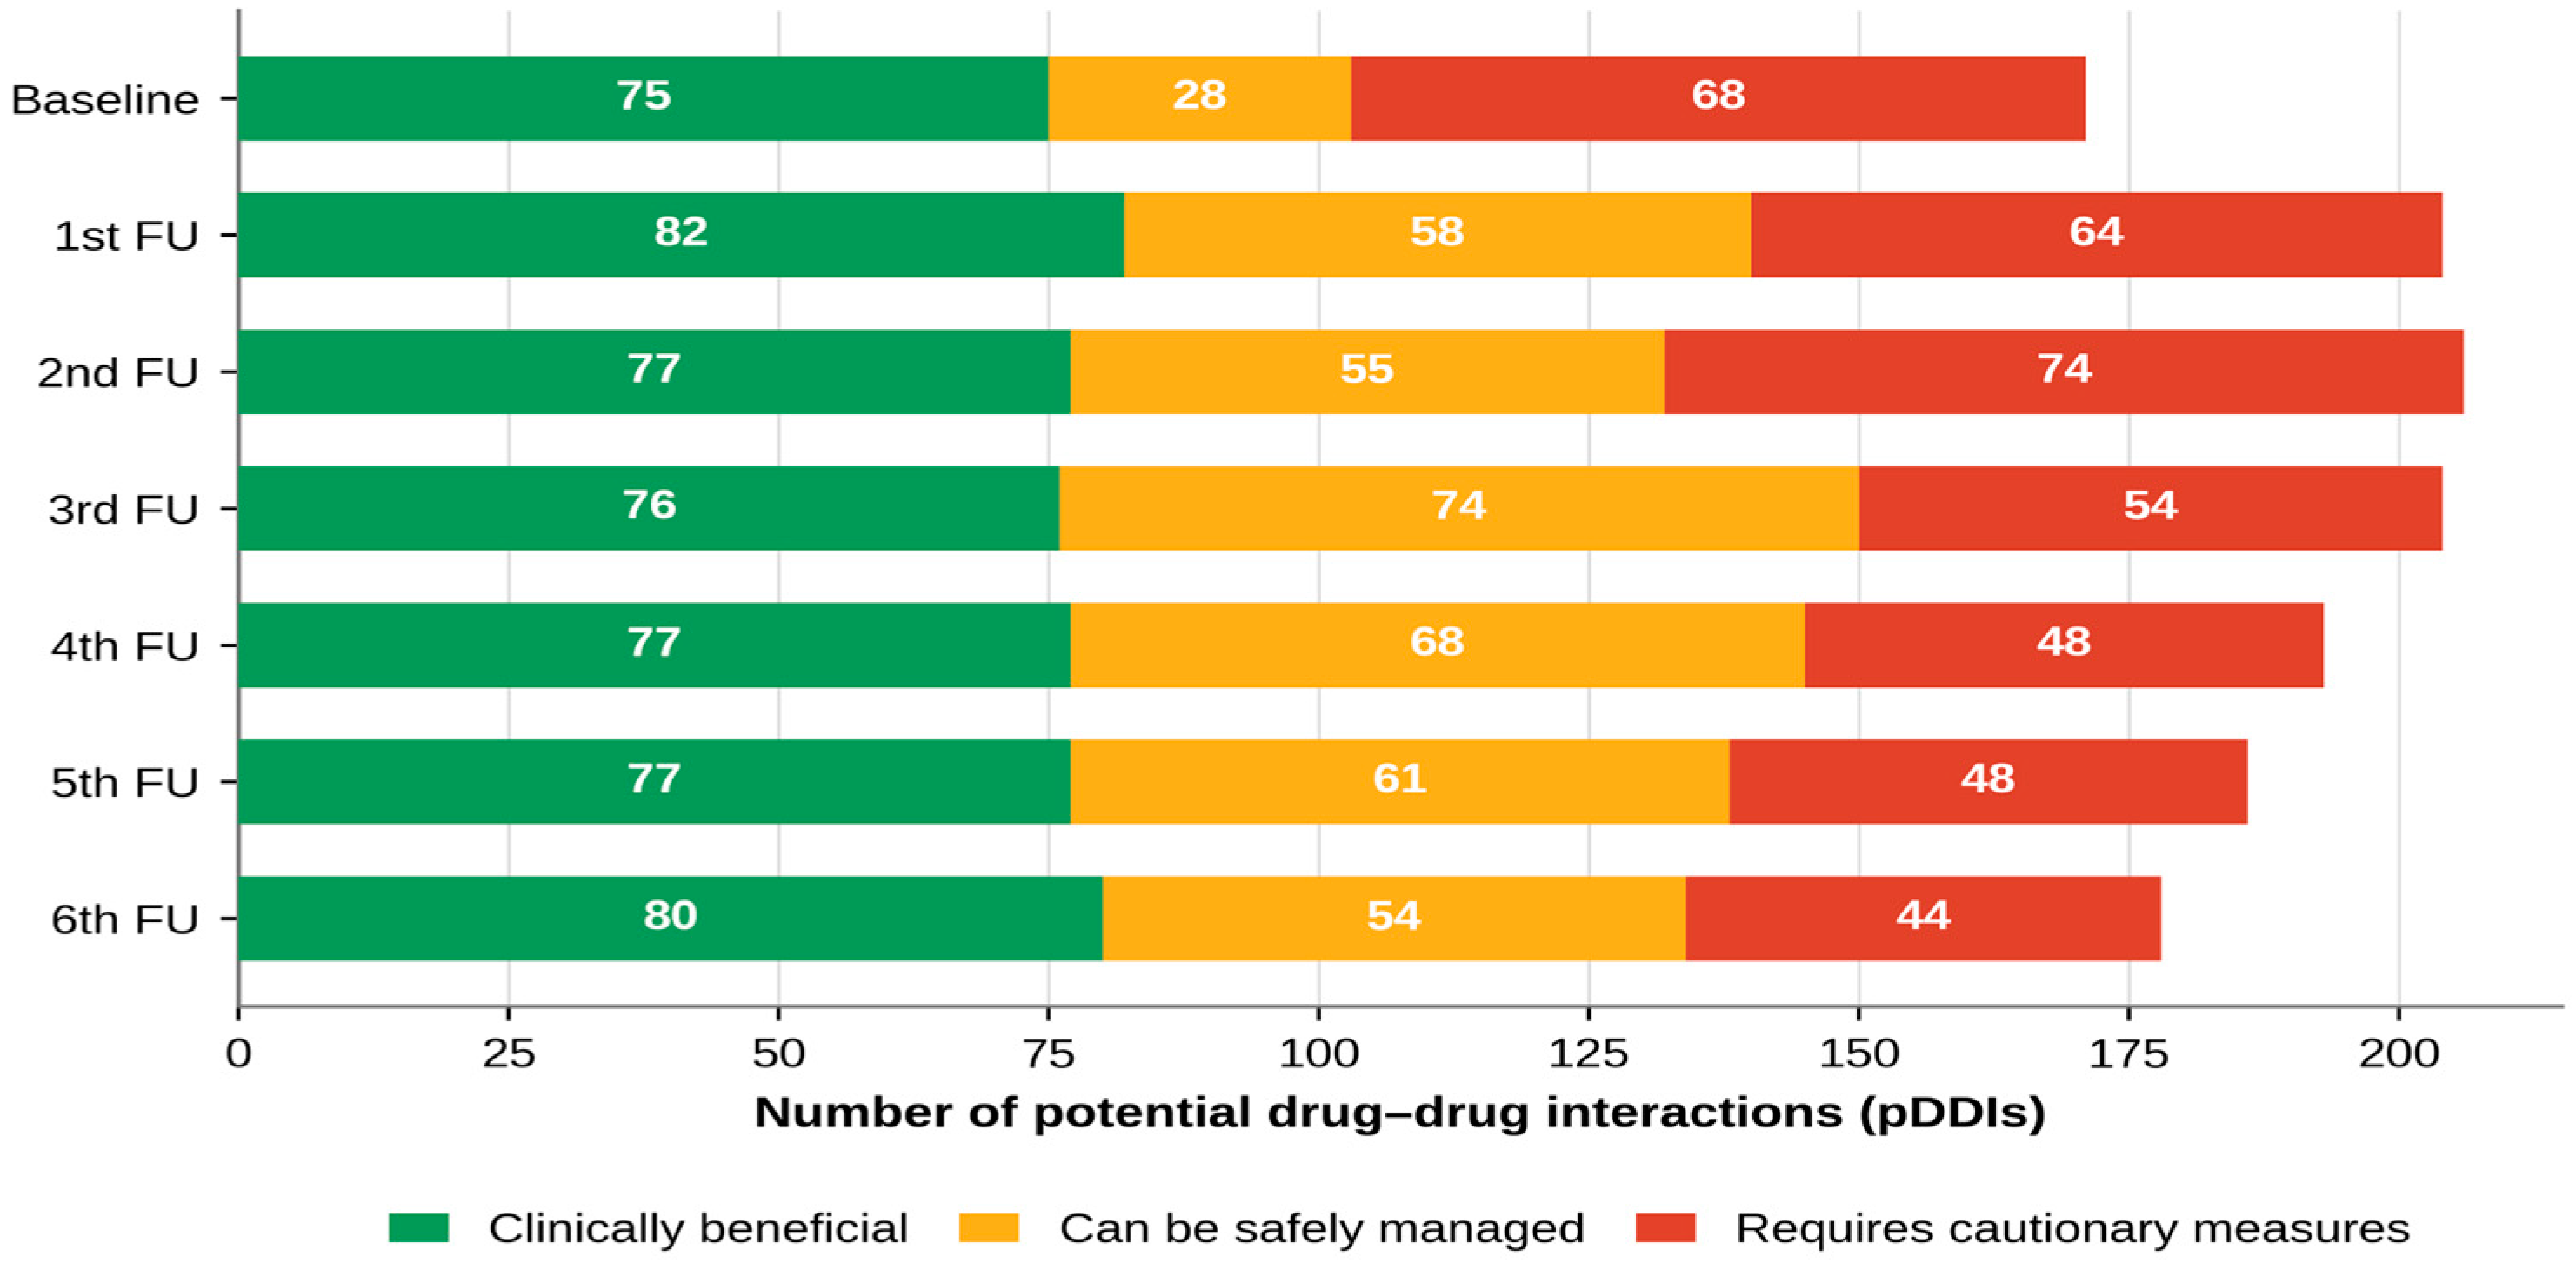
The analysis of trends in clinical implications of drug interactions over multiple follow-up periods yielded valuable insights: at baseline, of the 171 pDDIs identified, 75 (43.86%) were clinically beneficial, 28 (16.37%) could be safely managed and 68 (39.77%) required cautionary measures. The p-value for the comparison between males and females was 0.15, suggesting no statistically significant difference.
At the first follow-up visit (284 participants), of the 204 pDDIs identified, 82 (40.19%) were clinically beneficial, 58 (28.43%) could be safely managed and 64 (31.37%) required cautionary measures. The p-value for this period was 0.135, indicating no significant gender-based differences (Figure 5).
Figure 5.
Trends in clinical implications of drug interactions over follow-up periods.
Similar trends persisted in subsequent follow-up visits. Across the first to sixth follow-up visits, the proportion of pDDIs that were clinically beneficial ranged from 37.25% to 44.94%, the proportion that could be safely managed from 26.70% to 36.27%, and the proportion requiring cautionary measures from 24.72% to 35.92%. Gender-wise analysis showed no significant difference in the prevalence of clinical beneficial interactions, interactions that could be safely managed, or interaction-related cautionary measures across the follow-up periods.
Liverpool grade and clinical-implication category: The two classifications describe different properties of an interaction. The Liverpool grade reflects its intensity and the recommended action, whereas the clinical-implication category reflects the expected clinical consequence in the individual prescription. They are shown side by side for each assessment in Table 3. Across the seven assessments, 1104 of the 1342 pDDIs (82.3%) were Amber, 216 (16.1%) were Yellow and 22 (1.6%) were Red, whereas 544 (40.5%) were clinically beneficial, 398 (29.7%) could be safely managed and 400 (29.8%) required cautionary measures. The two distributions therefore differ markedly: Amber interactions outnumbered those requiring cautionary measures by nearly three to one (1104 versus 400; 2.1 to 3.3 times at the individual assessments). Because only 238 pDDIs were not Amber (22 Red and 216 Yellow), at least 306 Amber interactions were clinically beneficial, at least 160 could be safely managed and at least 162 required cautionary measures, and at least 704 of the 1104 Amber interactions (63.8%) did not require cautionary measures. The Amber grade therefore spans all three clinical-implication categories and cannot be read as a measure of clinical consequence counts derived from the totals in Table 3.
The distribution of drug interaction sites within the absorption, distribution, metabolism, and excretion (ADME) processes exhibited dynamic patterns across the follow-up periods. Absorption: The percentage of interactions related to absorption increased steadily from 18.12% at baseline to 38.23% by the third follow-up visit before gradually declining. Absorption and distribution: Although relatively low, interactions involving both absorption and distribution consistently present across all follow-up periods, ranging from 4.09% to 7.86%. This indicates concurrent impacts on these two processes, possibly affecting drug bioavailability and tissue distribution. Excretion: Interactions related to excretion fluctuated within a relatively narrow range of 12.74% to 16.66% throughout the follow-up period (depicted in Supplementary Figure S2), suggesting a consistent but moderate influence on drug elimination pathways. Metabolism: The majority of interactions occurred at the metabolism stage, comprising over 50% of interactions at baseline and remaining consistently high across all follow-up periods, albeit with a slight downward trend. Metabolism and excretion: Interactions involving both metabolism and excretion remained minimal but stable, accounting for less than 3% of interactions throughout the study duration.
The analysis of drug interactions involving transporters and enzymes revealed diverse patterns across the follow-up periods. Chelation and binding in the gastrointestinal tract: The number of drugs involved in chelation and binding in the gastrointestinal tract increased progressively from 24 (14.03%) at baseline to 57 (27.94%) by the third follow-up visit, before slightly decreasing to 33 (18.53%) by the sixth follow-up visit.
CYP3A4, CYP2B6, CYP2C19, and CYP1A2 inhibition: The number of drugs inhibiting these enzymes remained relatively stable throughout the follow-up periods, with minor fluctuations observed. CYP2D6 inhibition: Similar to CYP3A4 inhibition, the number of drugs inhibiting CYP2D6 remained consistent across most follow-up visits. CYP3A4 inhibition: Although prevalent at baseline (22 drugs), CYP3A4 inhibition decreased substantially in subsequent follow-up periods, indicating a dynamic change in drug regimens impacting this enzyme.
CYP450 CYP3A4/P-glycoprotein (P-gp) inhibition: The involvement of drugs in inhibiting both CYP3A4 and P-gp remained consistently high across all follow-up periods, indicating a sustained influence on these pathways. Changes in pH affecting atazanavir solubility: Initially absent at baseline, the number of drugs affecting atazanavir solubility due to changes in pH first appeared at the first follow-up visit (15 drugs) and then remained stable (14–15 per visit; Supplementary Figure S3), indicating a sustained rather than a progressive effect. The analysis of potential drug–drug interactions (pDDIs) across various age groups at baseline and during six follow-up visits was as follows:
Baseline assessment: At baseline, significant differences in the distribution of potential DDIs were observed across different age groups (p = 0.030 *). Among the study participants, the highest prevalence of potential DDIs was recorded in the age group of 41–64 years, with 103 cases. Conversely, participants under the age of 21 and those aged 65 and over exhibited lower incidences of potential DDIs, each accounting for five cases.
Follow-up visits: Over subsequent follow-up periods, a consistent pattern emerged, highlighting a decline in the prevalence of potential DDIs among older age groups. Notably, statistically significant reductions in potential DDIs were observed across all age groups from the first follow-up visit onwards. This downward trend persisted throughout the study duration, indicating a proactive approach to managing potential DDIs across various age.
Age group comparisons: Comparative analysis revealed that older age groups, particularly those aged 41–64 and 65 and over, consistently exhibited higher frequencies of potential DDIs compared to younger age groups.
Potential Drug–Drug Interactions (pDDIs) Among Patients with Comorbid Conditions
Trends in pDDIs: While there were minor variations in the frequencies of specific pDDIs over time, there were no significant deviations from the baseline observations. This suggests a stable pattern of potential drug interactions among patients with comorbid conditions across the follow-up period.
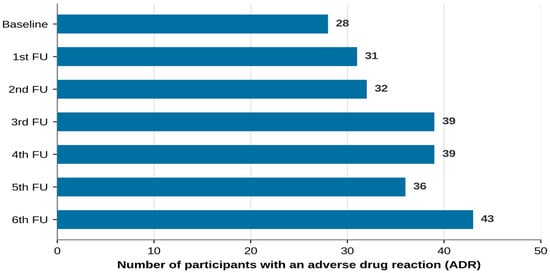
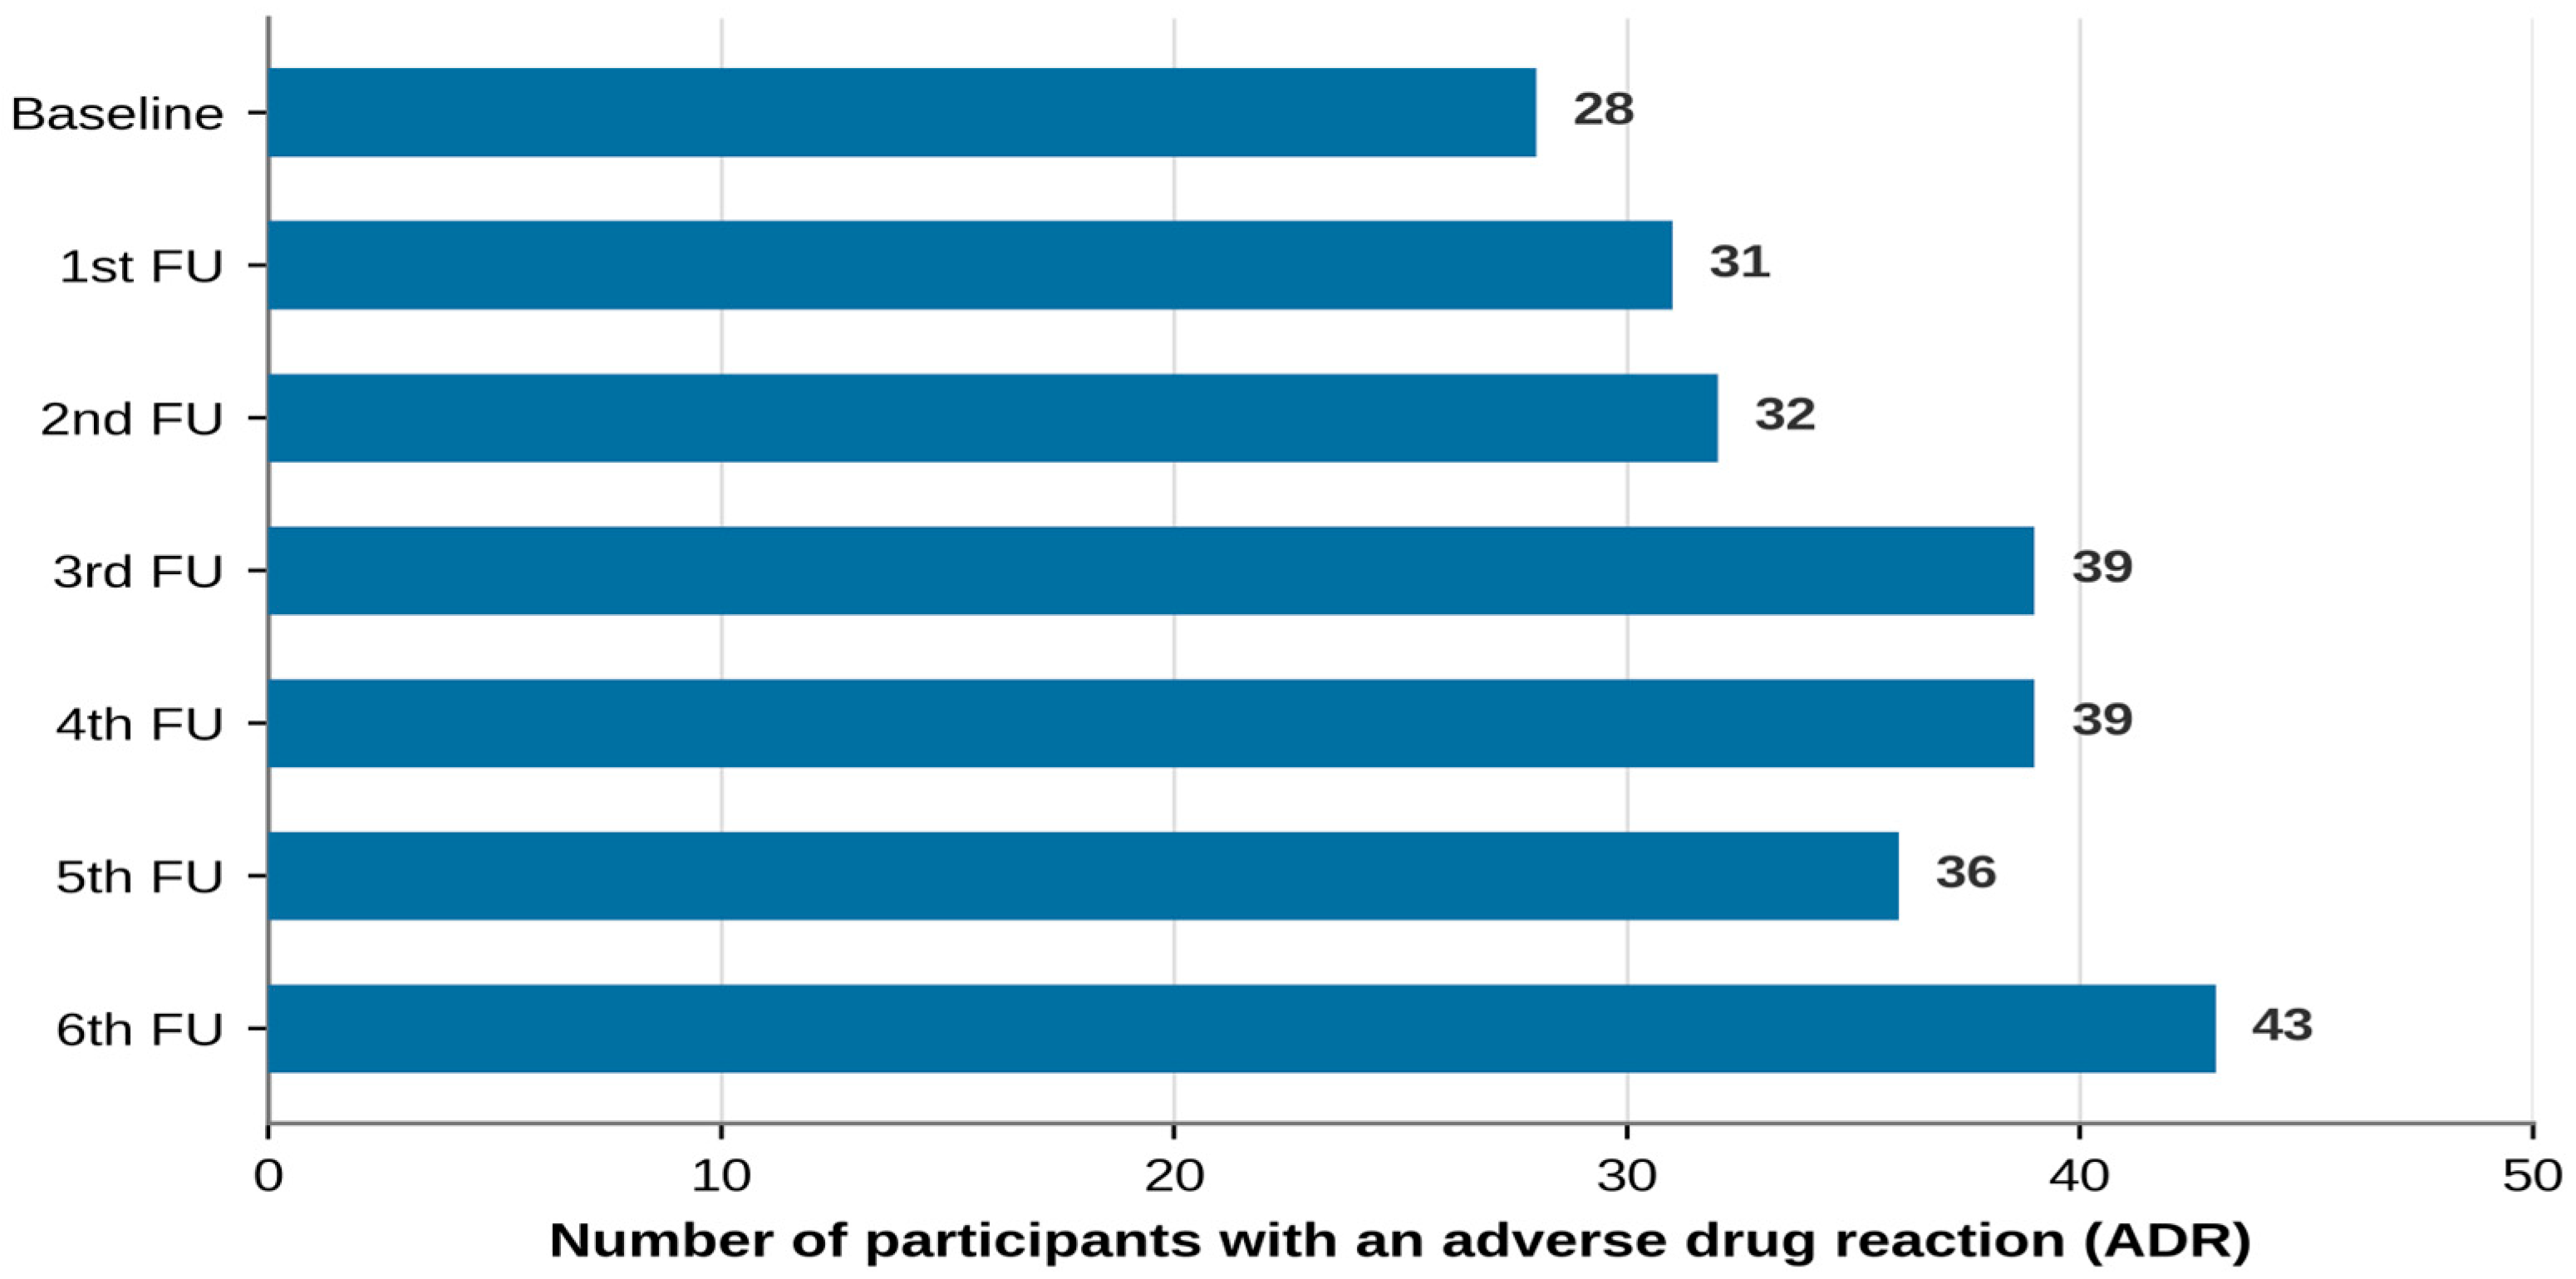
The analysis of adverse drug reactions (ADRs) and potential drug–drug interactions (pDDIs) across multiple follow-up visits revealed: at baseline, 28 participants (9.82% of 285) had a reported ADR; the number of participants with ADRs was 31, 32, 39, 39 and 36 at the first to fifth follow-up visits and was highest at the sixth follow-up (43 participants, 16.04% of 268; Figure 6). These counts describe the overall frequency of ADRs in the cohort. ADRs were not individually attributed to specific drug–drug interactions; the data therefore do not show that the ADRs were caused by pDDIs, and the temporal pattern should not be interpreted as evidence of a relationship between pDDIs and ADRs.
Figure 6.
Adverse drug reactions (ADRs) and potential drug–drug interactions (pDDIs) across follow-up visits. ADRs were not attributed to specific pDDIs.
The most common pDDI interaction within ART drugs is shown in Supplementary Table S1. ATV/r combined with TDF: significant increase in TDF 37% and 34%, involving CYP3A4/P-glycoprotein transporters. LPV/r combined with NVP: notable decrease in LPV 27%, highlighting potential interaction effects without direct involvement of transporters or enzymes. ATV/r combined with ritonavir and DTG: substantial increase in DTG 62% and 34%, suggesting enzyme inhibition or modulation of drug transporters.
The most common pDDI interaction between ART and concomitant drugs is shown in Supplementary Table S2. Dolutegravir and calcium supplements interaction: managing this interaction may involve adjusting the dosing intervals of the administered drugs. The combination of lamivudine with Trimethoprim/sulfamethoxazole resulted in a significant 43% increase in lamivudine’s AUC, potentially enhancing the therapeutic efficacy of lamivudine. Amlodipine exhibited interactions with various ART drugs, including efavirenz, atazanavir + ritonavir, and nevirapine.
- Multivariable Analysis of the MRCI–pDDI Association (Baseline Data)
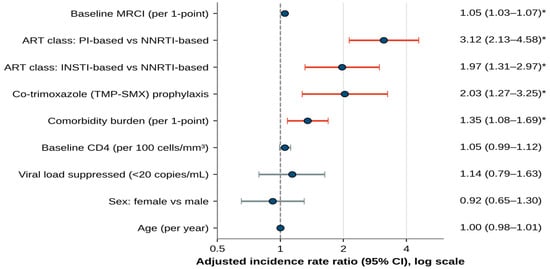
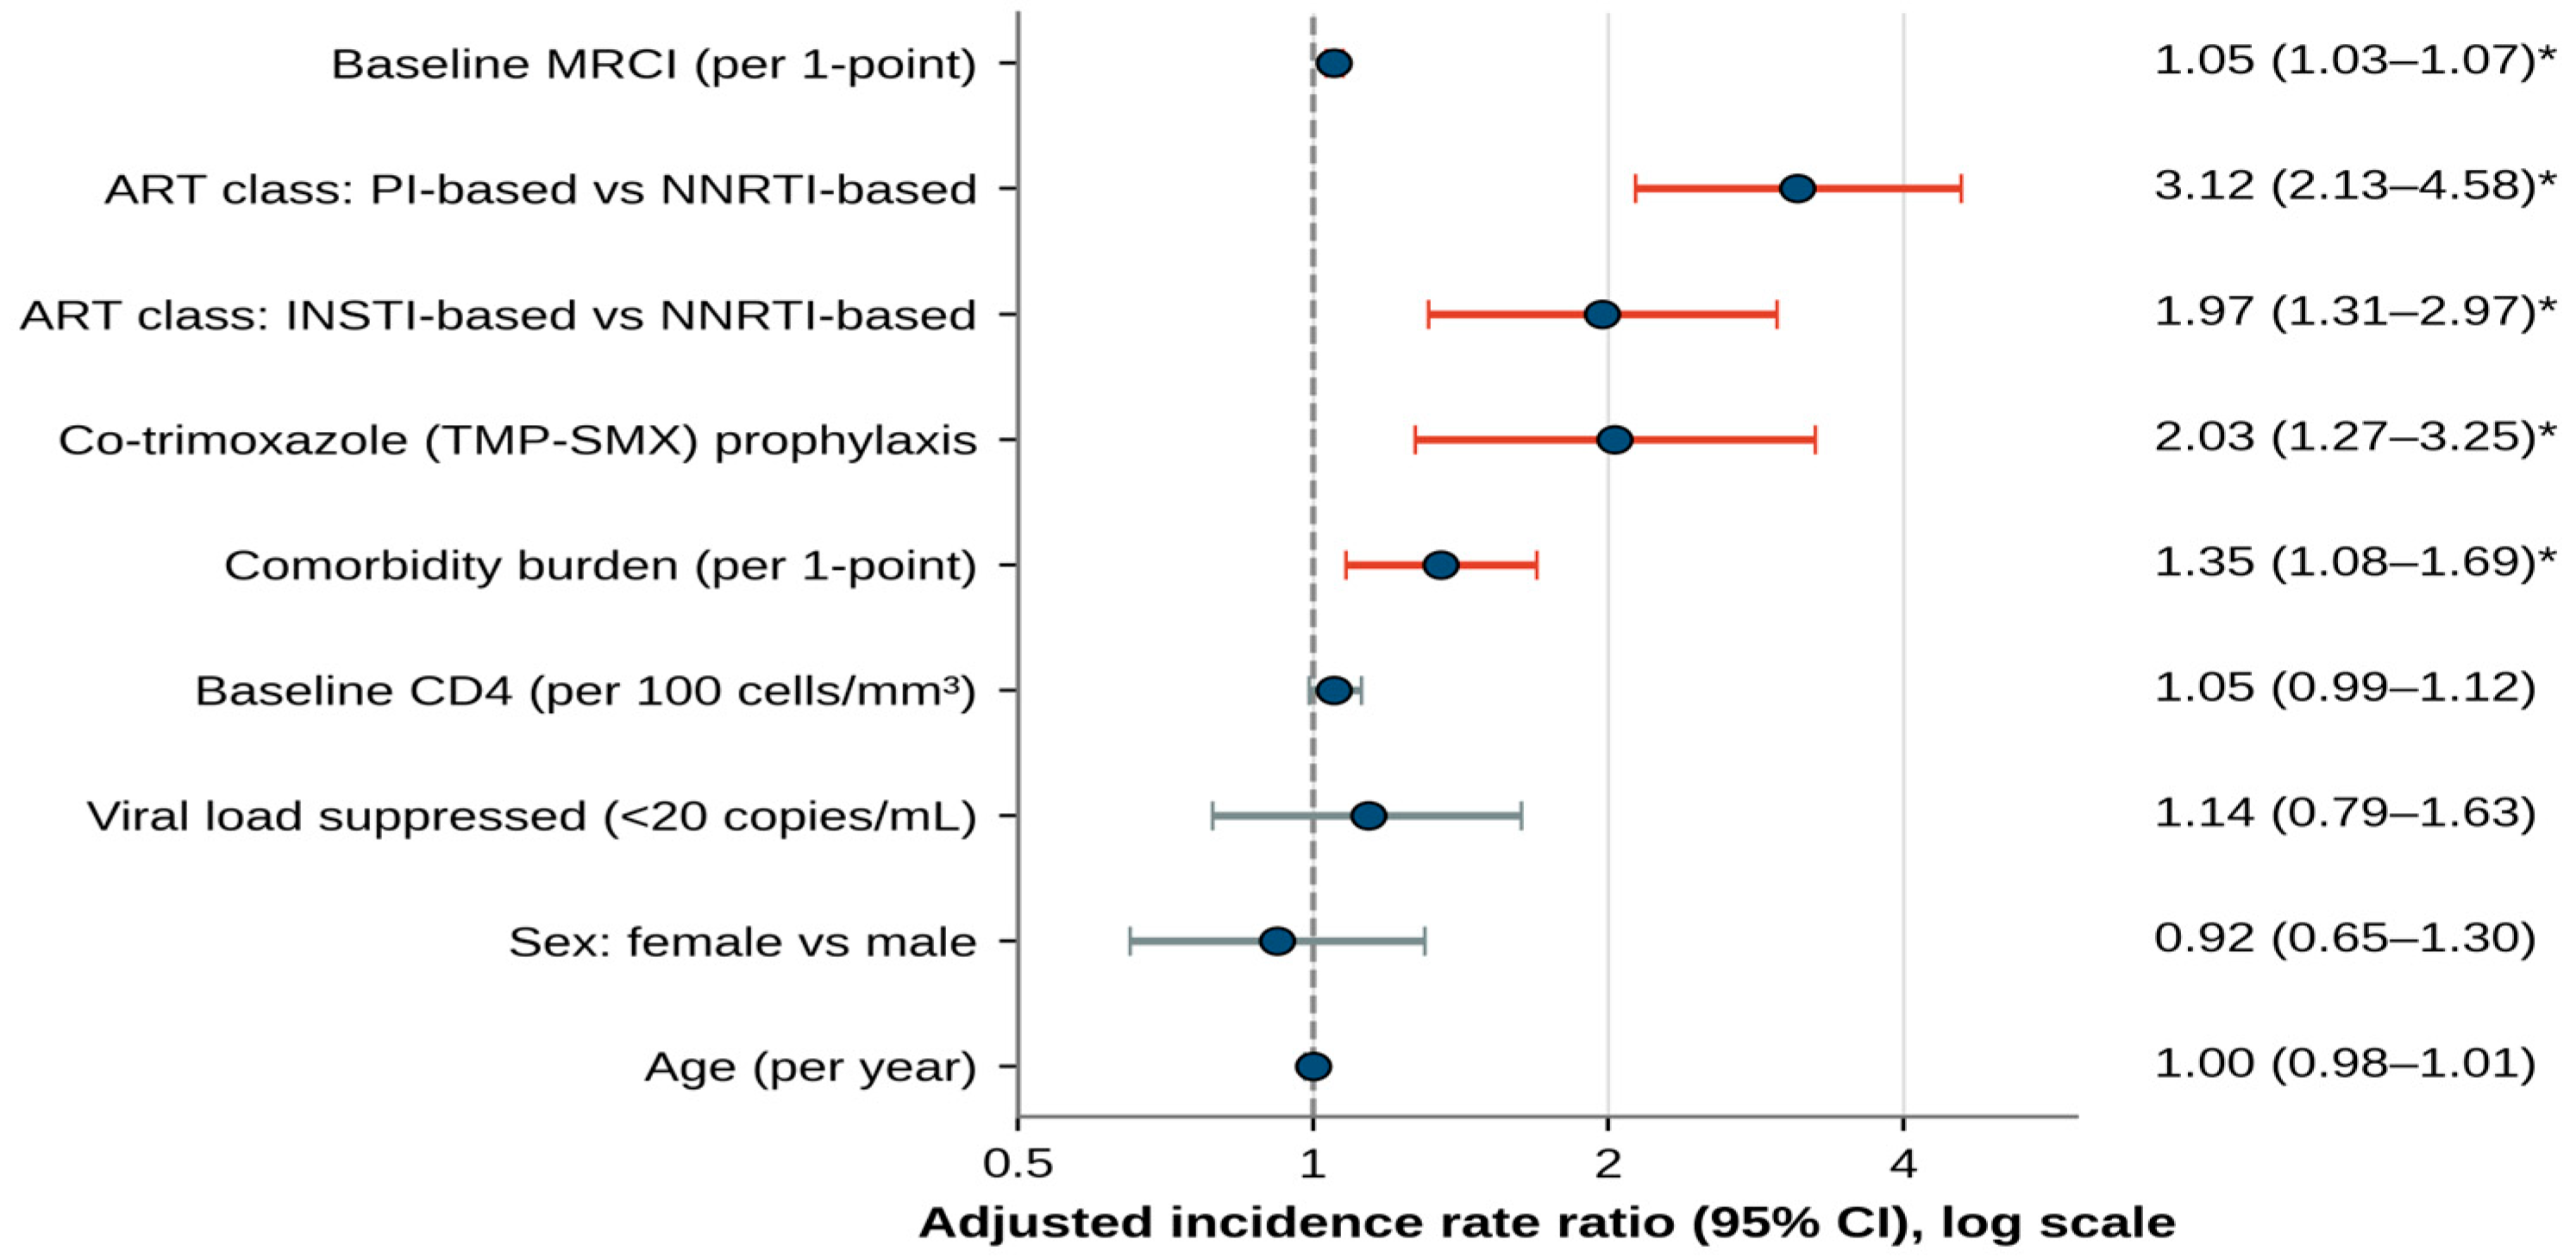
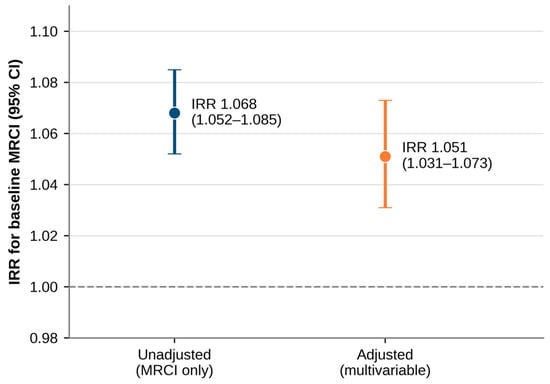
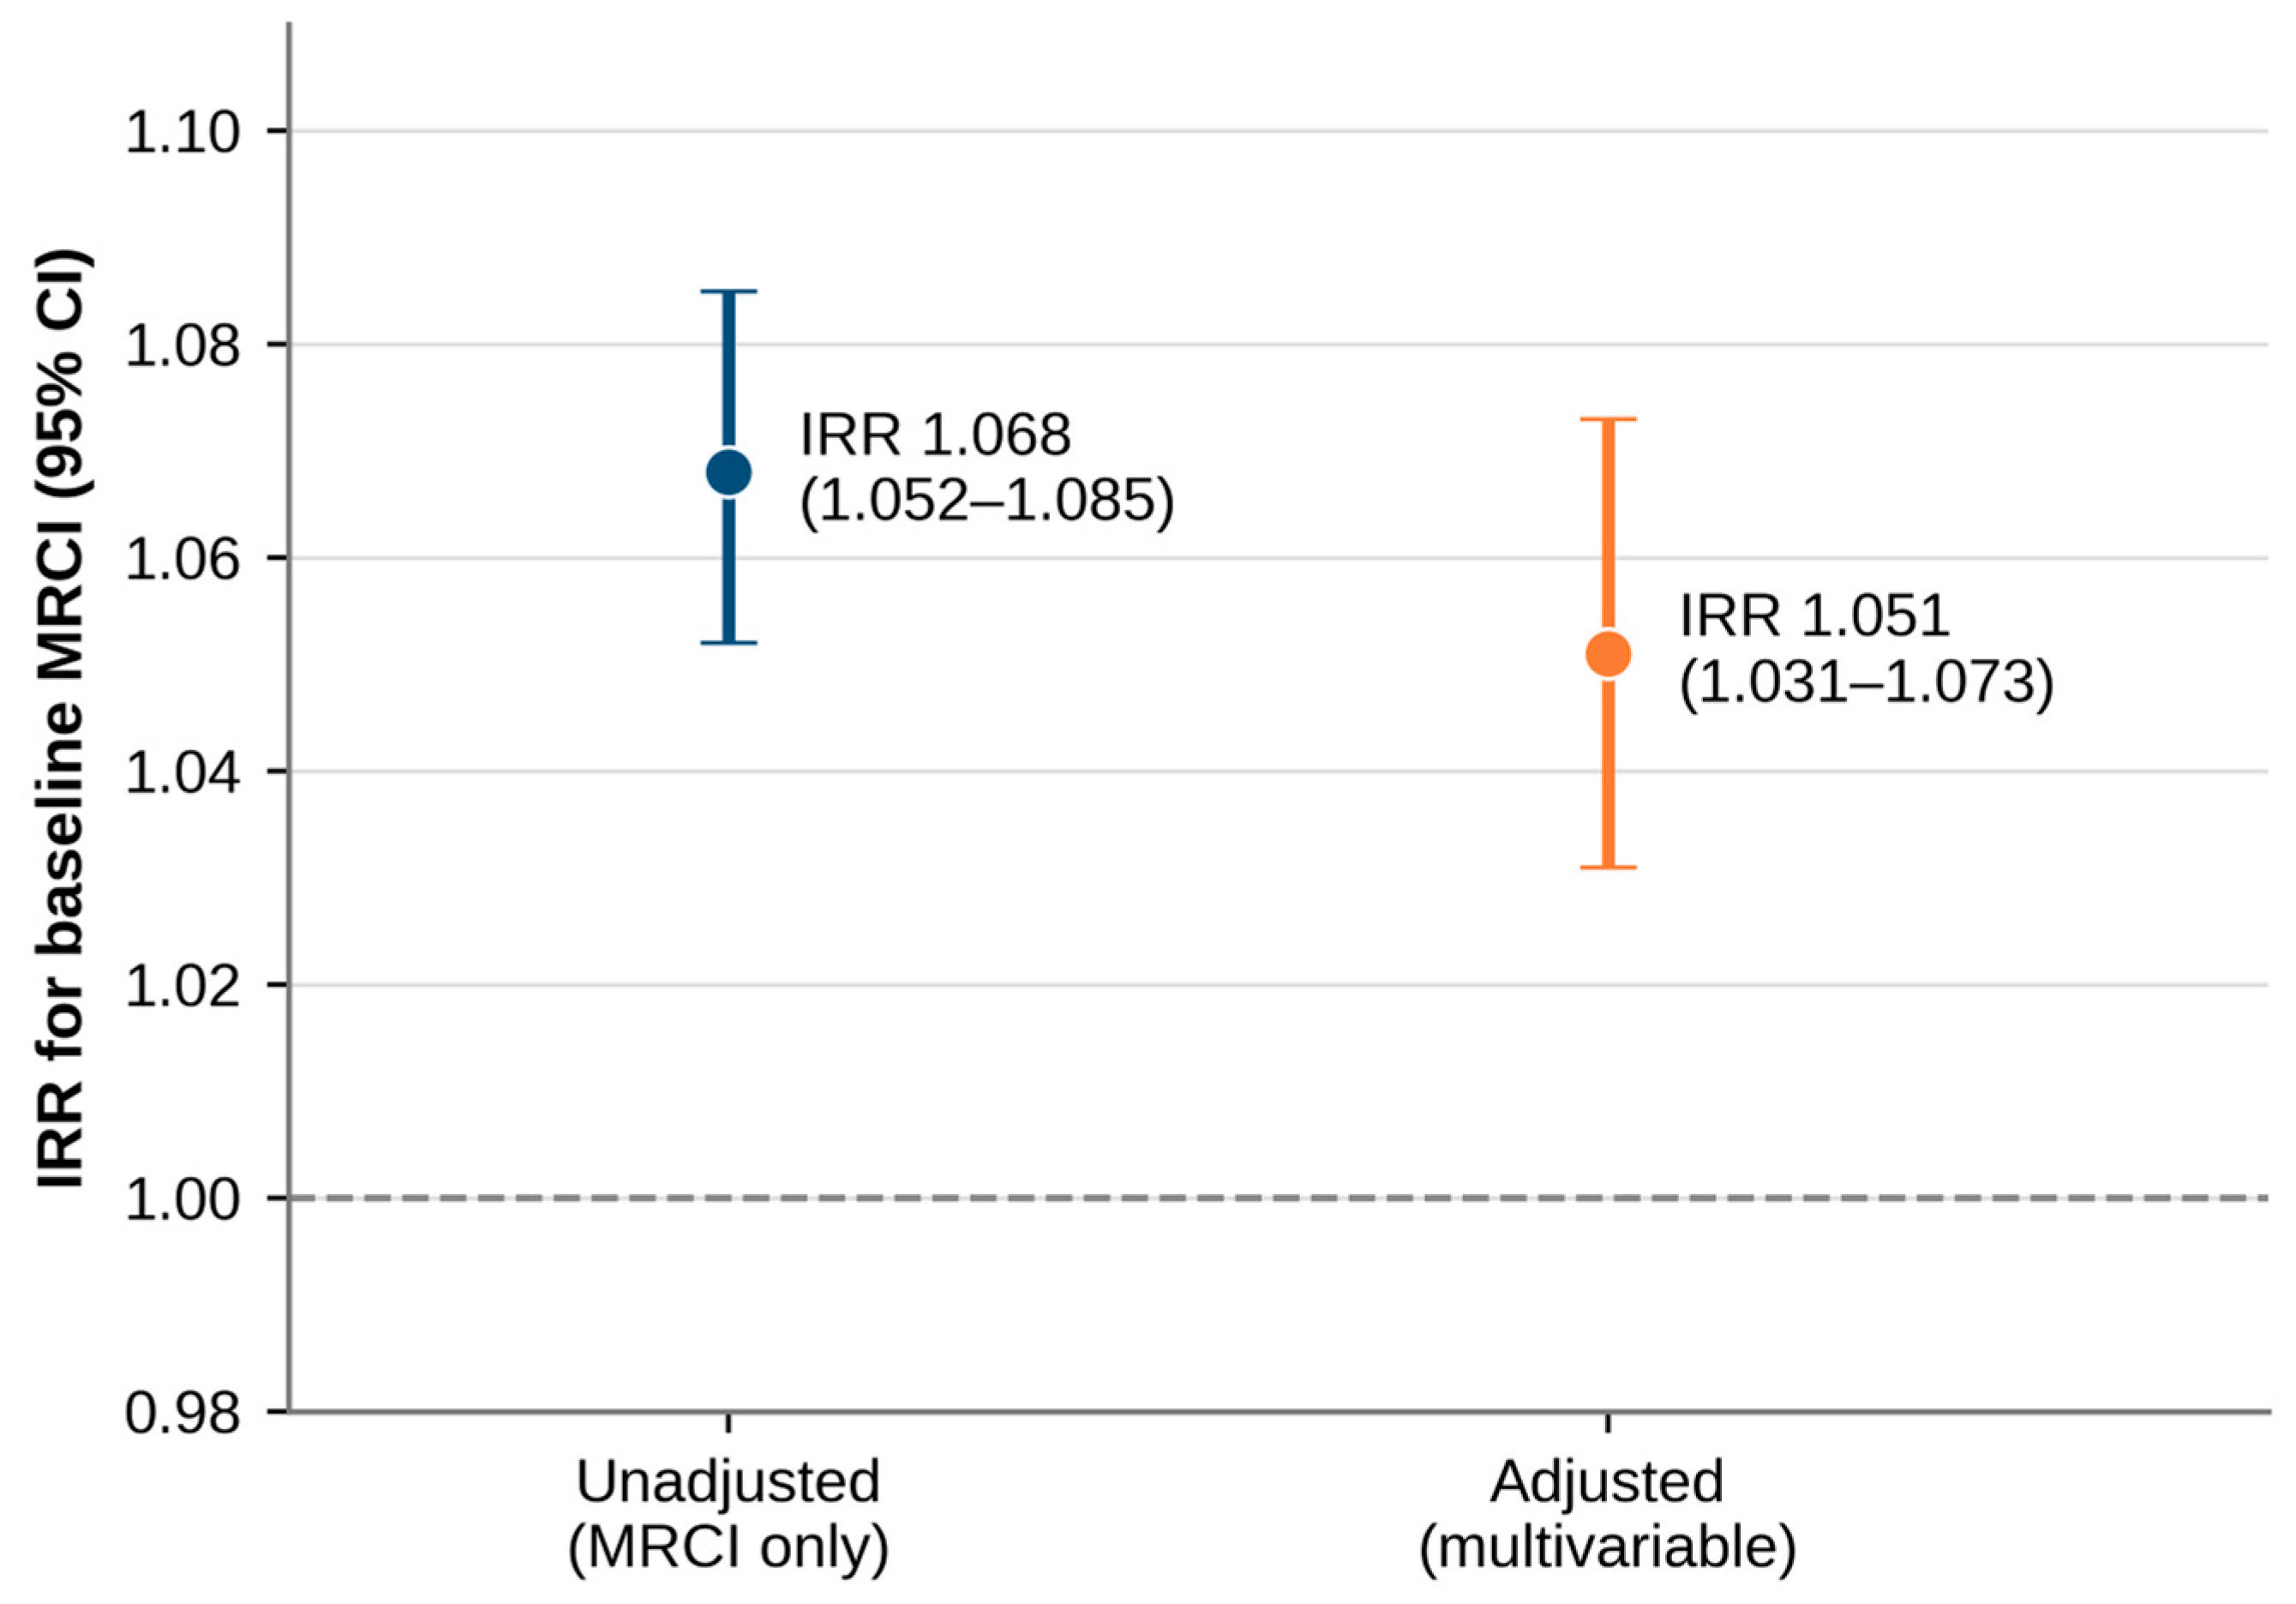
Because the Spearman correlation above is a bivariate, unadjusted statistic, a multivariable Poisson regression was performed on baseline data (n = 285) to test whether the MRCI–pDDI association persisted after adjusting for polypharmacy-related and clinical covariates. In the unadjusted (MRCI-only) Poisson model, each one-point increase in baseline MRCI score was associated with a 6.8% higher expected number of pDDIs (IRR = 1.068, 95% CI 1.052–1.085, p < 0.001). After adjustment for age, sex, comorbidity burden, Trimethoprim–sulfamethoxazole (TMP-SMX) prophylaxis, CD4 count, viral suppression and ART regimen class, the association was attenuated but remained statistically significant (adjusted IRR = 1.051, 95% CI 1.031–1.073, p < 0.001; Figure 7 and Figure 8). Variance inflation factors for all covariates, including MRCI and the comorbidity burden score, were below 1.4, indicating no meaningful collinearity. Antiretroviral regimen class was the covariate most strongly associated with pDDI count: participants on PI-based regimens had a 3.12-fold-higher adjusted rate of pDDIs (95% CI 2.13–4.58, p < 0.001) and those on INSTI-based regimens a 1.97-fold-higher rate (95% CI 1.31–2.97, p = 0.001), relative to NNRTI-based regimens. Comorbidity burden (adjusted IRR = 1.35, 95% CI 1.08–1.69, p = 0.009) and TMP-SMX prophylaxis (adjusted IRR = 2.03, 95% CI 1.27–3.25, p = 0.003) were also independently associated with a higher pDDI count, whereas age, sex, CD4 count and viral suppression status were not statistically significant. A sensitivity analysis using binary logistic regression (pDDI presence versus absence) gave a consistent result for MRCI (adjusted OR = 1.19, 95% CI 1.10–1.28, p < 0.001; Table 4). VIFs for all covariates ranged 1.00–1.35 (all <1.4), indicating no meaningful collinearity between MRCI and the comorbidity/polypharmacy-related covariates.
Figure 7.
Adjusted incidence rate ratios (95% CI) from the multivariable Poisson regression of baseline predictors of pDDI count (n = 285). Red markers denote p < 0.05. Forest plot of adjusted incidence rate ratios (IRRs) and 95% confidence intervals (CIs) for factors associated with the study outcome. Points represent adjusted IRR estimates, and horizontal bars indicate 95% CIs. The dashed vertical line represents the null value (IRR = 1.0). The asterisk (*) indicates statistically significant associations, defined as 95% CIs that exclude 1.0. The x-axis is presented on a logarithmic scale.
Figure 8.
Incidence rate ratio for baseline MRCI on pDDI count, unadjusted (bivariate Poisson) versus adjusted for age, sex, comorbidity burden, TMP-SMX prophylaxis, CD4 count, viral suppression and ART regimen class (multivariable Poisson).
Table 4.
Multivariable Poisson and logistic regression of baseline predictors of potential drug–drug interactions (n = 285).
The two effect measures answer different clinical questions. The Poisson IRR describes the burden of interactions: each one-point increase in baseline MRCI was associated with about 5% more pDDIs per participant (adjusted IRR 1.051), equivalent to roughly 28% more for a five-point and 64% more for a 10-point difference (1.0515 = 1.28; 1.05110 = 1.64). The logistic OR describes occurrence: each one-point increase was associated with 19% higher odds of having at least one pDDI (adjusted OR 1.19), and 131 of 285 participants (45.96%) had at least one pDDI at baseline. Because this outcome is common, the odds ratio overstates the corresponding relative risk and should not be read as a percentage increase in the probability of an interaction.
ART regimens were grouped by their third agent: NNRTI-based (n = 141, 49.5%; mainly tenofovir/lamivudine/efavirenz, n = 98; zidovudine-based regimens, n = 33; and tenofovir/lamivudine/nevirapine, n = 8), INSTI-based (n = 78, 27.4%; predominantly tenofovir/lamivudine/dolutegravir, n = 76) and PI-based (n = 65, 22.8%; ritonavir-boosted atazanavir in 63 and lopinavir/ritonavir in 2). One participant was on an atypical atazanavir–efavirenz combination. At baseline, the number of pDDIs per participant increased from 0.31 with NNRTI-based regimens to 0.69 with INSTI-based and 1.12 with PI-based regimens, and the proportion of participants with at least one pDDI was 24.8%, 57.7% and 81.5%, respectively; median baseline MRCI was 8, 8 and 12. These crude differences are consistent with the adjusted model, in which regimen class remained the strongest correlate of pDDI count.
3. Discussion
In our study, correlation analyses were conducted between the Medication Regimen Complexity Index and potential drug–drug interactions. The analysis revealed moderate-to-strong positive unadjusted correlations: Spearman’s rho was 0.641 (p < 0.001) for average MRCI and 0.575 (p < 0.001) for baseline MRCI with the number of pDDIs. These coefficients indicate that more complex regimens were associated with more potential interactions. However, because MRCI partly reflects the number of medications, which itself increases the opportunity for interactions, the bivariate coefficients cannot be interpreted as an independent effect of regimen complexity. In the adjusted baseline analysis, the association was attenuated (IRR 1.068 to 1.051) but remained statistically significant, and the adjusted estimate should be read together with the unadjusted correlations when interpreting the principal finding.
The escalation in drug–drug interactions among People Living with HIV (PLHIV) can be influenced by several factors. Firstly, the higher the number of medications prescribed, the greater the likelihood of encountering drug–drug interactions, as each additional medication introduces a potential interaction. The frequency of opportunistic infections and non-communicable diseases (NCDs) among HIV-positive individuals necessitates the administration of multiple medications by healthcare providers [7]. This phenomenon, known as polypharmacy [8], is compounded by various factors including patient age [9], extended hospitalization periods [10], alcohol consumption [11], substance abuse [11], and specific antiretroviral therapy (ART) medications such as protease inhibitors and reverse transcriptase inhibitors [12,13], which have been associated with an increased risk of drug interactions. These factors collectively contribute to the complexity of therapeutic management and elevate the potential for drug–drug interactions (DDIs) in the PLHIV population.
In our investigation, we identified a total of 1342 drug interactions over an 18-month follow-up period, with 365 interactions involving antiretroviral therapy (ART) medications and 977 interactions occurring between ART and concomitant medications. Among the most prevalent potential drug–drug interactions (pDDIs) between ART and concomitant medications, we observed a noteworthy interaction between dolutegravir (DTG) and metformin, leading to an increase in metformin concentration necessitating dosage reduction [14]. Another common pDDI involved atazanavir/ritonavir (ATV/r) and amlodipine, resulting in a twofold increase in amlodipine concentration and potentially severe adverse effects like hypotension and bradycardia [15]. Additionally, lamivudine (3TC) combined with Trimethoprim/sulfamethoxazole resulted in a 43% increase in lamivudine concentration, which was clinically beneficial.
Most interactions occurred between ART and concomitant drugs (976 of 1342; 72.7%), whereas 366 (27.3%) occurred within ART regimens; among the latter, the most frequent involved boosted protease inhibitors (PIs) like ATV/r and TDF in combination, as well as integrase strand transfer inhibitor (INSTI)-based regimens like ATV/r and DTG. Notably, all interactions identified were primarily pharmacokinetic in nature, involving processes such as metabolism, absorption, and excretion, which often had clinical benefits. For instance, combining ATV/r with TDF led to a significant increase in TDF concentration of 37%, necessitating a dosage adjustment. Similarly, combining ATV/r with DTG resulted in a substantial 62% increase in DTG concentration, also requiring a dosage adjustment.
Clinically beneficial interactions deserve specific attention. Across the seven assessments, 544 of the 1342 pDDIs (40.5%) were classified as clinically beneficial and a further 398 (29.7%) as manageable without changing the regimen (Table 1), so that fewer than one-third (400; 29.8%) required cautionary measures. An example is the 43% increase in lamivudine exposure with co-trimoxazole, which is thought to reflect reduced renal tubular secretion of lamivudine and did not call for dose adjustment in patients with normal renal function; it is conceptually similar to the deliberate pharmacokinetic boosting of protease inhibitors by ritonavir, in which an interaction is used therapeutically [16]. Recognizing such interactions is a core task of clinical pharmacy practice. It allows pharmacists to distinguish interactions that can be accepted or exploited from those requiring dose adjustment, separation of administration (for example, dolutegravir with calcium supplements) or monitoring (for example, tenofovir exposure when combined with atazanavir/ritonavir), and it limits alert fatigue and unnecessary regimen changes that could themselves increase regimen complexity and compromise adherence. Because interaction databases flag potential rather than confirmed effects, the beneficial classification in this study reflects the expected pharmacokinetic direction and clinician judgment; it was not confirmed by drug-level monitoring or clinical outcomes.
In the adjusted model, PI-based (IRR 3.12) and INSTI-based (IRR 1.97) regimens had higher pDDI counts than NNRTI-based regimens. PI-based regimens were almost entirely ritonavir-boosted atazanavir (63 of 65), and ritonavir is a potent CYP3A4 inhibitor that alters exposure to many co-prescribed drugs. INSTI-based regimens were predominantly dolutegravir-based (76 of 78); the most frequent dolutegravir interactions in this cohort involved calcium supplements and metformin, which are managed by timing or dose adjustment rather than by changing the regimen. The NNRTI-based group, the largest (49.5%), had the fewest pDDIs per participant. Because regimen class also differs in the concomitant medicines prescribed, residual confounding by indication is possible, and some regimens were represented by few participants.
Previous research by Mark W. Hull et al. highlighted potential issues associated with PIs, emphasizing metabolic abnormalities, increased cardiovascular risk, and drug interactions. Their findings underscored the importance of evaluating drug interactions, particularly with ritonavir-boosted PIs, before initiating protease inhibitor-based therapy or introducing new medications to patients already on such regimens [16,17]. In our study, only 16.04% of the total cases involved adverse drug reactions (ADRs) due to pDDIs, and none were correlated with severe ADRs or hospitalizations, supporting the clinical benefits of pDDIs through pharmacokinetic mechanisms. But ADRs were not attributed to specific interactions, so no inference can be drawn about ADRs due to pDDIs; their causality and severity in relation to pDDIs will be examined separately.
Pedro Amariles et al. conducted a systematic review aimed at updating clinically relevant drug interactions in People Living with HIV on antiretroviral therapy, with a focus on novel drug interaction pairs published between 2017 and 2022. Their analysis highlighted that second-generation INSTIs (CAB, BIC, and DTG) have a lower likelihood of inhibiting CYP450 isoenzyme metabolism compared to PIs, thus posing a reduced risk of clinically relevant drug interactions [18,19,20]. However, our study found that boosted PIs remained a prominent regime associated with drug interactions compared to INSTI-based regimens. Additionally, the review highlighted pharmacokinetic mechanisms as predominant in explaining drug interactions, consistent with our findings where all identified interactions were attributed to pharmacokinetic mechanisms [19]. Because the University of Liverpool HIV Drug Interactions resource is periodically updated, changes in interaction classifications or recommendations over the study period may have influenced pDDI assessment; therefore, the findings should be interpreted cautiously.
The findings concern potential interactions identified from an interaction database, not confirmed clinical harm. Amber interactions predominated (80.88–84.47%), whereas Red interactions accounted for only 1.46–1.96%, and many pDDIs were classified as clinically beneficial or manageable without regimen change. Amber denotes an interaction that may require monitoring or a dose or timing adjustment rather than harm. Accordingly, statements about the “risk of adverse outcomes” have been replaced by statements about association with potential interactions, and the clinical consequences of the identified pDDIs (including ADRs attributable to them) were not adjudicated in this analysis.
Because the unadjusted Spearman correlation cannot by itself distinguish an independent effect of regimen complexity from confounding by the number of medications a patient is prescribed, we additionally fitted a multivariable Poisson regression using baseline data to test whether the MRCI–pDDI association was robust to adjustment. The association was attenuated after adjustment (IRR falling from 1.068 unadjusted to 1.051 adjusted) but remained statistically significant, and variance inflation factors indicated no meaningful collinearity between MRCI and the comorbidity/polypharmacy-related covariates included. This suggests that regimen complexity, as captured by MRCI, carries information about pDDI risk beyond what is explained by comorbidity burden, TMP-SMX prophylaxis, CD4 count, viral suppression and ART regimen class alone, even though these factors—particularly for PI-based and INSTI-based regimens—independently and more strongly predicted pDDI occurrence. The attenuation itself is informative: it indicates that part, but not all, of the originally observed correlation is attributable to shared variance between MRCI and medication/comorbidity burden, which should temper any causal interpretation of the bivariate correlation reported as the primary result.
Strengths and limitations of the study: The prospective nature of the study minimized data loss, providing robust data for analysis and interpretation. The study included a large sample size and a relatively long follow-up period, allowing for comprehensive analysis and enhancing generalizability to broader populations. Limitations: The study was conducted at a single urban center, so the generalizability of the study findings to other healthcare settings and patient populations may be limited. The potential overlap between MRCI components and medication-related factors contributing to pDDIs may have contributed to the observed correlation and should therefore be considered when interpreting this association. To directly test this, a multivariable Poisson regression using baseline data showed that the MRCI–pDDI association persisted after adjusting for comorbidity burden, TMP-SMX prophylaxis, CD4 count, viral suppression and ART regimen class (adjusted IRR = 1.05, 95% CI 1.03–1.07, p < 0.001), with variance inflation factors below 1.4 for all covariates, indicating no meaningful collinearity between MRCI and these polypharmacy-related measures. This adjustment was, however, necessarily restricted to baseline covariates only, since consistent longitudinal CD4 and viral load data were not available across all follow-up visits for the full cohort. Participants were on ART for >6 months with an adherence rate of >95%, which may have influenced MRCI scores. Variability in MRCI scores, particularly during the initial 6-month period, could impact the study’s findings. Further limitations are as follows. First, pDDIs were identified from an interaction database and represent potential rather than confirmed interactions, and ADRs were not attributed to specific interactions. Second, the clinical-implication categories were assigned by clinicians without a formal inter-rater agreement statistic.
4. Materials and Methods
This prospective, observational cohort study was conducted at a medical college-attached teaching hospital. Kasturba Medical College Hospital (KMCH), Attavar, Mangaluru, provides a service to the Dakshina Kannada district in Karnataka, India. Institutional Human Ethics Committee approval was secured before commencing the study (IEC KMC MLR 05–19/227). The study was registered with the Clinical Trials Registry—India (CTRI), and the registration number is CTRI/2019/06/019609.
MRCI was calculated using a scientifically validated instrument consisting of three parts: Part A, which assesses pharmaceutical dosage forms; Part B, which assesses dosing frequency; and Part C, which assesses additional medication-dispensing instructions. The scores from the three parts were summed to obtain the total MRCI score. Data were collected at baseline and every 3 months during the 18-month follow-up period using a pre-designed proforma. Average MRCI calculation: The Average Medication Regimen Complexity Index (MRCI) score was calculated as the arithmetic mean of the total MRCI scores obtained at the six follow-up assessments (follow-ups 1–6) for each participant. Concomitant medications were recorded at each follow-up visit by reviewing the patient’s prescription and National Agency Treatment Card. Adherence was assessed at each refill visit using pill counts. MRCI was calculated at each follow-up assessment rather than only at baseline, allowing medication regimen complexity to be assessed longitudinally throughout the study period. The relation between the MRCI and the number of pDDIs in PLHIV was assessed. The current prescription was reviewed for potential DDIs among the antiretroviral drugs using the University of Liverpool HIV Drug Interactions Web/Mobile application (https://www.hiv-druginteractions.org/) [21].
Unit of analysis: A pDDI was defined as one potentially interacting drug pair identified in a participant’s current prescription at a given assessment (one prescription per participant per assessment). The participant-level outcome was the number of pDDIs per participant—the baseline count for baseline analyses and the count accumulated across the assessments for the follow-up correlations; participants with at least one pDDI were additionally analyzed as a binary outcome. Interaction-level summaries (interacting medications, clinical implication, Liverpool category and mechanism) use the total number of pDDIs at the assessment as the denominator, whereas participant-level proportions use the number of participants contributing data at that assessment (Table 1). Two MRCI measures were used: baseline MRCI and average MRCI, the mean of the total MRCI scores at the six follow-up assessments; their relationship to the pDDI outcomes is summarized in Table 2.
The following potential DDI groupings were done: based on the type of drug interaction: pharmacokinetic, pharmacodynamic, or both. Based upon the interacting medications: interaction between ART drugs, interaction between ART and concomitant drugs, and interaction between concomitant drugs. Additionally, the interactions were classified based on their clinical implications and management strategies: clinical beneficial interactions, interactions that can be safely managed, and use with caution/harmful interactions. The classification was independently assessed by practicing clinicians based on the predefined criteria, available clinical information, and their clinical expertise. Any ambiguous cases or disagreements were discussed and resolved by consensus. No formal inter-rater agreement statistic was calculated. Based on the intensity of the drug interaction, as described by the University of Liverpool HIV Drug Interactions criteria, interventions are required (Red and Amber color) or no intervention is required (Green and Yellow color).
Two classification systems were applied to each pDDI and are not interchangeable. The University of Liverpool color grade (Red: do not co-administer; Amber: potential interaction that may require monitoring or a dose or timing adjustment; Yellow: potential weak interaction, no action needed; Green: no interaction expected) reflects the intensity of the interaction and the recommended action and was taken from the database output. The clinical-implication categories used in this study (clinically beneficial, can be safely managed, and use with caution/harmful) describe the expected clinical consequence in the individual prescription and were assigned by the clinicians, who reviewed the color-coded output together with the available clinical information. A pDDI can therefore carry both labels; for example, an Amber interaction may be classed as safely managed or, less commonly, as clinically beneficial. The clinicians did not reclassify the Liverpool color grades. The distributions of the two classifications at each assessment are shown in Table 3.
Statistical Analysis
Statistical analyses were performed using SPSS version 11. Continuous variables were summarized using appropriate measures of central tendency and dispersion, while categorical variables were presented as frequencies and percentages. Spearman’s rank correlation coefficient (ρ) was used to assess the association between MRCI scores and the number of pDDIs, including separate analyses for baseline MRCI and average MRCI. The chi-square test was used to assess associations between categorical variables; Fisher’s exact test was used where appropriate. All analyses were conducted using participants with available data for the respective assessment, and participants who did not complete a particular follow-up assessment were excluded from that specific analysis. No imputation was performed for missing data. The Spearman correlations were unadjusted bivariate analyses; the adjusted analysis is described below. Percentages are reported with the denominator stated: participants contributing data at the assessment, or the total number of pDDIs at the assessment. All reported associations were based on unadjusted bivariate analyses. A two-sided p-value < 0.05 was considered statistically significant. The detailed sample size calculation methodology was reported in our prior publication [7]. Assuming a correlation coefficient of 0.3, with 90% power and a two-sided significance level of 0.001, the required sample size was 221 participants; allowing for a 30% non-response rate, the final target sample size was 285 participants.
To account for potential confounding by polypharmacy and other baseline clinical characteristics, a multivariable Poisson regression analysis was additionally performed using baseline data only (n = 285). The outcome was the baseline number of pDDIs per participant, the number of interacting drug pairs in the baseline prescription, range 0–4. Because the Pearson dispersion ratio was below 1 and the estimated negative binomial overdispersion parameter approximated zero, the Poisson specification was retained in preference to a negative binomial model. Baseline MRCI score was entered as the primary predictor, with adjustment for age, sex, a comorbidity burden score (the sum of diabetes, hypertension and prior tuberculosis), co-trimoxazole (TMP-SMX) prophylaxis, baseline CD4 count, baseline viral suppression status (HIV RNA < 20 copies/mL versus higher/target not detected categories), and antiretroviral regimen class (NNRTI-based as reference, versus protease inhibitor [PI]-based or integrase strand transfer inhibitor [INSTI]-based regimens). Regimens were classified by their third agent (NNRTI: efavirenz or nevirapine; PI: ritonavir-boosted atazanavir or lopinavir; INSTI: dolutegravir or other integrase inhibitors). Variance inflation factors (VIFs) were calculated for all covariates to assess collinearity between MRCI and the polypharmacy/comorbidity-related covariates. Results are reported as incidence rate ratios (IRRs) with 95% confidence intervals. As a sensitivity analysis, a binary logistic regression model (pDDI presence versus absence, using the same covariate set) was also fitted, with results reported as odds ratios (ORs). This adjusted analysis used baseline data only and is reported alongside, without replacing, the unadjusted Spearman correlation results presented above.
5. Conclusions
Our findings regarding potential drug–drug interactions (DDIs) highlighted that higher medication regimen complexity was significantly correlated with a greater number of potential drug–drug interactions. The moderate-to-strong unadjusted correlations were attenuated but remained statistically significant after adjustment for baseline covariates, supporting an association that is not explained solely by comorbidity burden or ART regimen class. The implications of our study extend beyond clinical practice to public health policy and program development.
Supplementary Materials
The following supporting information can be downloaded at: https://www.mdpi.com/article/10.3390/ph19111757/s1, Supplementary Methods S1. Sample size calculation; Supplementary Figure S1. Distribution of Drug Interaction Classifications Using the Liverpool HIV Drug Interactions Categorization; Supplementary Figure S2. Distribution of Drug Interaction Sites within ADME Processes Over Follow-up Periods; Supplementary Figure S3. Drug Interactions Involving Transporters/Enzymes and Number of Drugs Over Follow-up Periods; Supplementary Table S1. Most common pDDI Interaction within ART drugs; Supplementary Table S2. Most common pDDI Interaction between ART and concomitant drugs.
Author Contributions
B.P.: Conceptualization, methodology, validation, formal analysis, investigation, data curation, writing—original draft preparation, writing—review and editing. A.K.: Conceptualization, validation, resources, writing—review and editing. S.B.R.: Conceptualization, validation, resources, writing—review and editing, supervision, project administration. M.B.Y.: Conceptualization, validation, resources, writing—review and editing, supervision, project administration. S.D.U.: Conceptualization, validation, resources, writing—review and editing, supervision, project administration. A.K.S.: Conceptualization, validation, resources, data curation, writing—review and editing, supervision, project administration. All authors have read and agreed to the published version of the manuscript.
Funding
This research received no external funding.
Institutional Review Board Statement
The study was conducted in accordance with the Declaration of Helsinki and approved by the Institutional Human Ethics Committee (IEC KMC MLR 05–19/227, approval date: 15 May 2019) prior to commencement of the study.
Informed Consent Statement
Informed consent was obtained from all participants included in the study.
Data Availability Statement
Data is contained within the article and Supplementary Materials.
Acknowledgments
The authors sincerely thank all participants for their valuable contributions to this research. During the preparation of this work, the authors used Grammarly for grammatical editing and language correction. After using this tool, the authors reviewed and edited the content as needed and take full responsibility for the content of the publication. No other AI-assisted tools were used in the preparation of this manuscript.
Conflicts of Interest
The authors declare no conflicts of interest.
References
- Bolduc, P.; Roder, N.; Colgate, E.; Cheeseman, S.H. Care of Patients With HIV Infection: Antiretroviral Drug Regimens. FP Essent. 2016, 443, 23–30. [Google Scholar]
- Sanyaolu, A.; Okorie, C.; Kumar, A.; LaMoure, D.; Rabadi, M.; Hernandez, J.; Omiloli, G. Current trends of HIV/AIDS in Asia. South East Asia J. Public Health 2017, 7, 3–11. [Google Scholar] [CrossRef] [Scilit]
- Grimsrud, K.N.; Sherwin, C.M.; Constance, J.E.; Tak, C.; Zuppa, A.F.; Spigarelli, M.G.; Mihalopoulos, N.L. Special population considerations and regulatory affairs for clinical research. Clin. Res. Regul. Aff. 2015, 32, 45–54. [Google Scholar] [CrossRef] [Scilit]
- Winter, S.S.; Page-Reeves, J.M.; Page, K.A.; Haozous, E.; Solares, A.; Cordova, C.N.; Larson, R.S. Inclusion of special populations in clinical research: Important considerations and guidelines. J. Clin. Transl. Res. 2018, 4, 56–69. [Google Scholar]
- George, J.; Phun, Y.T.; Bailey, M.J.; Kong, D.C.; Stewart, K. Development and validation of the medication regimen complexity index. Ann. Pharmacother. 2004, 38, 1369–1376. [Google Scholar] [CrossRef] [Scilit]
- Liverpool HIV Interactions [Internet]. Available online: https://www.hiv-druginteractions.org/ (accessed on 3 March 2024).
- Poojar, B.; Shenoy, A.; Kamath, A.; Ramapuram, J.; Rao, S.B. Evaluation of health literacy and medication regimen complexity index among patients with human immunodeficiency virus infection: A single-Centre, prospective, cross-sectional study. Clin. Epidemiol. Glob. Health 2023, 19, 101206. [Google Scholar] [CrossRef] [Scilit]
- Hattoh, K.A.; Sienso, B.A.; Kuugbee, E.D. Prevalence of comorbidities and associated factors among HIV patients attending antiretroviral clinics in the Tamale metropolis, Ghana. Venereology 2023, 2, 1–15. [Google Scholar] [CrossRef] [Scilit]
- Siefried, K.J.; Mao, L.; Cysique, L.A.; Rule, J.; Giles, M.L.; Smith, D.E.; McMahon, J.; Read, T.R.; Ooi, C.; Tee, B.K.; et al. Concomitant medication polypharmacy, interactions and imperfect adherence are common in Australian adults on suppressive antiretroviral therapy. Aids 2018, 32, 35–48. [Google Scholar] [CrossRef] [Scilit]
- Scondotto, G.; Pojero, F.; Pollina Addario, S.; Ferrante, M.; Pastorello, M.; Visconti, M.; Scondotto, S.; Casuccio, A. The impact of polypharmacy and drug interactions among the elderly population in Western Sicily, Italy. Aging Clin. Exp. Res. 2018, 30, 81–87. [Google Scholar] [CrossRef] [Scilit]
- Siddiqua, A.; Abdullah, R.K.; Kareem, N.A. Impact of clinical pharmacist intervention towards polypharmacy in elderly population-a systematic study. Res. J. Pharm. Technol. 2019, 12, 2621–2627. [Google Scholar] [CrossRef] [Scilit]
- Watkins, C.C.; Pieper, A.A.; Treisman, G.J. Safety considerations in drug treatment of depression in HIV-positive patients: An updated review. Drug Saf. 2011, 34, 623–639. [Google Scholar] [CrossRef] [Scilit]
- Hisaka, A.; Ohno, Y.; Yamamoto, T.; Suzuki, H. Prediction of pharmacokinetic drug–drug interaction caused by changes in cytochrome P450 activity using in vivo information. Pharmacol. Ther. 2010, 125, 230–248. [Google Scholar] [CrossRef] [Scilit]
- Kirby, B.J.; Collier, A.C.; Kharasch, E.D.; Whittington, D.; Thummel, K.E.; Unadkat, J.D. Complex drug interactions of HIV protease inhibitors 1: Inactivation, induction, and inhibition of cytochrome P450 3A by ritonavir or nelfinavir. Drug Metab. Dispos. 2011, 39, 1070–1078. [Google Scholar] [CrossRef] [Scilit]
- Song, I.H.; Zong, J.; Borland, J.; Jerva, F.; Wynne, B.; Zamek-Gliszczynski, M.J.; Humphreys, J.E.; Bowers, G.D.; Choukour, M. The effect of dolutegravir on the pharmacokinetics of metformin in healthy subjects. J. Acquir. Immune Defic. Syndr. 2016, 72, 400–407. [Google Scholar] [CrossRef] [Scilit]
- Puech, R.; Gagnieu, M.C.; Planus, C.; Charpiat, B.; Boibieux, A.; Ferry, T.; Tod, M. Extreme bradycardia due to multiple drug–drug interactions in a patient with HIV post-exposure prophylaxis containing lopinavir–ritonavir. Br. J. Clin. Pharmacol. 2011, 71, 621. [Google Scholar] [CrossRef] [Scilit]
- Hull, M.W.; Montaner, J.S. Ritonavir-boosted protease inhibitors in HIV therapy. Ann. Med. 2011, 43, 375–388. [Google Scholar] [CrossRef] [Scilit]
- Hsu, A.; Granneman, G.R.; Bertz, R.J. Ritonavir: Clinical pharmacokinetics and interactions with other anti-HIV agents. Clin. Pharmacokinet. 1998, 35, 275–291. [Google Scholar] [CrossRef] [Scilit]
- Amariles, P.; Rivera-Cadavid, M.; Ceballos, M. Clinical Relevance of Drug Interactions in People Living with Human Immunodeficiency Virus on Antiretroviral Therapy—Update 2022: Systematic Review. Pharmaceutics 2023, 15, 2488. [Google Scholar] [CrossRef] [Scilit]
- European Association for the Study of the Liver. EASL clinical practical guidelines on the management of acute (fulminant) liver failure. J. Hepatol. 2017, 66, 1047–1081. [Google Scholar] [CrossRef] [Scilit]
- Dooley, K.E.; Kaplan, R.; Mwelase, N.; Grinsztejn, B.; Ticona, E.; Lacerda, M.; Sued, O.; Belonosova, E.; Ait-Khaled, M.; Angelis, K.; et al. Dolutegravir-based antiretroviral therapy for patients coinfected with tuberculosis and human immunodeficiency virus: A multicenter, noncomparative, open-label, randomized trial. Clin. Infect. Dis. 2020, 70, 549–556. [Google Scholar] [CrossRef] [Scilit]

Disclaimer/Publisher’s Note: The statements, opinions and data contained in all publications are solely those of the individual author(s) and contributor(s) and not of MDPI and/or the editor(s). MDPI and/or the editor(s) disclaim responsibility for any injury to people or property resulting from any ideas, methods, instructions or products referred to in the content. |
© 2026 by the authors. Licensee MDPI, Basel, Switzerland. This article is an open access article distributed under the terms and conditions of the Creative Commons Attribution (CC BY) license.