


Abstract
Background/Objectives: Two novel heteronuclear Ru(II)-p-cymene complexes bearing ferrocenyl thioether ligands were synthesized and evaluated for their anticancer and antimicrobial potential. Methods/Results: Both complexes exhibited pronounced antiproliferative activity against human cancer cell lines, with IC50 values ranging from 8.42 to 24.62 μM after 72 h, showing activity corresponding to the level of activity of standard cisplatin treatment. Mechanistic studies in HeLa cells revealed concentration-dependent cell cycle disruption accompanied by an increased sub-G1 population and only a slight elevation in intracellular reactive oxygen species, without the potential to induce apoptosis, indicating that growth inhibition is predominantly mediated through cytostatic rather than apoptotic mechanisms. In contrast, both compounds displayed substantially lower activity in three-dimensional multicellular tumor spheroids, emphasizing the need to improve tumor penetration and efficacy in physiologically relevant models. The complexes inhibited all microorganisms included in the tested panel, with MIC values ranging from 0.16 to 10 mg/mL; Staphylococcus aureus was the most susceptible strain (MIC = 0.16 mg/mL). Biophysical studies revealed weak-to-moderate DNA binding of both complexes, consistent with a predominantly groove-associated and external binding mode rather than classical intercalation, as supported by fluorescence displacement, viscosity, and molecular docking analyses. Both complexes exhibited moderate-to-high affinity for human serum albumin, while the single-methylene spacer difference resulted in distinct albumin binding-site preferences, highlighting the sensitivity of protein recognition to subtle structural modifications without substantially affecting overall binding affinity. Conclusions: Overall, these Ru(II)-p-cymene/ferrocenyl complexes combine promising antiproliferative and antimicrobial activities with a mechanism of action distinct from cisplatin, representing attractive candidates for further structural optimization aimed at improving selectivity and efficacy in three-dimensional tumor models.
1. Introduction
Ruthenium-based organometallic complexes have emerged as promising alternatives to platinum drugs owing to their favorable pharmacological properties, including tunable ligand exchange kinetics, accessible redox chemistry, and the ability to interact with multiple intracellular targets. In particular, Ru(II)–arene complexes have attracted considerable attention because their structural versatility enables fine modulation of physicochemical properties, cellular uptake, and biological activity while often exhibiting reduced systemic toxicity compared with conventional platinum-based agents [1,2,3,4]. These characteristics have stimulated extensive research into their development as anticancer and antimicrobial agents.
The incorporation of a ferrocenyl fragment into ruthenium complexes represents an attractive strategy for enhancing biological activity. Ferrocene is a chemically stable, lipophilic organometallic scaffold capable of reversible Fe(II)/Fe(III) redox cycling, which may promote oxidative stress, influence cellular signaling pathways, and alter biomolecular interactions [5,6,7,8]. Conjugation of ferrocenyl ligands with a ruthenium center can therefore combine the favorable pharmacological characteristics of both metal fragments, resulting in compounds with multimodal mechanisms of action. Such heteronuclear complexes have demonstrated promising anticancer, antimicrobial, and antiproliferative properties, although their biological behavior strongly depends on ligand architecture, coordination environment, and overall molecular geometry [9,10,11].
We previously reported heterometallic Ru(II)–terpyridine–ferrocene complexes incorporating (2-(methylthio)ethyl)ferrocene (mtefc) and (3-(methylthio)propyl)ferrocene (mtpfc) ligands. Those compounds exhibited high stability under physiological conditions, strong interactions with DNA and serum albumin, and pronounced antitumor activity through apoptosis induction and stimulation of immunogenic cell death, ultimately promoting antitumor immune responses in vivo [12]. These findings demonstrated the therapeutic potential of combining ruthenium and ferrocene within a single molecular framework. However, the biological properties of analogous Ru(II)–p-cymene systems remain largely unexplored despite their distinct coordination chemistry, ligand exchange behavior, and well-established relevance in medicinal inorganic chemistry.
Besides their anticancer potential, ruthenium-containing compounds are increasingly recognized as promising antimicrobial agents. The rapid emergence of antimicrobial resistance has created an urgent need for new chemotypes with mechanisms of action distinct from those of conventional antibiotics. Metal complexes offer several advantages in this regard, including multiple intracellular targets, redox activity, and reduced susceptibility to established resistance mechanisms. Among them, ruthenium complexes have demonstrated broad-spectrum antibacterial and antifungal activities, while ferrocenyl derivatives may further enhance membrane permeability and redox-mediated biological effects [13,14,15,16]. Consequently, combining both organometallic fragments may provide compounds with dual anticancer and antimicrobial potential.
In the present study, we synthesized two novel heteronuclear Ru(II)–p-cymene complexes, [Ru(p-cym)Cl2(mtefc)] (1) and [Ru(p-cym)Cl2(mtpfc)] (2) (Figure 1), and comprehensively evaluated their biological properties. First, their antimicrobial activity was investigated against representative Gram-positive and Gram-negative bacteria, as well as fungal strains, to assess their broad-spectrum antimicrobial potential. Subsequently, the antiproliferative activity of both complexes was evaluated in a panel of human cancer cell lines and compared with cisplatin, followed by mechanistic studies including cell-cycle distribution, intracellular reactive oxygen species generation, apoptosis, and evaluation in three-dimensional multicellular tumor spheroids. Finally, the interactions of both complexes with calf thymus DNA and human serum albumin were examined experimentally and complemented by molecular docking studies to elucidate their binding modes and transport-related properties. Through this integrated biological evaluation, we aimed to establish structure–activity relationships and assess the therapeutic potential of these Ru(II)–p-cymene–ferrocenyl complexes as multifunctional organometallic drug candidates.
Figure 1.
Structures of complexes 1 and 2.
2. Results and Discussion
2.1. Synthesis and Characterization
The synthetic route to the Ru(II)–p-cymene complexes bearing ferrocenyl thioether ligands is outlined in Scheme 1. Complexes 1 and 2 were obtained via a straightforward ligand substitution reaction between the dimeric precursor [Ru(p-cym)Cl2]2 and two equivalents of the corresponding thioether ligand, (2-(methylthio)ethyl)ferrocene (mtefc) or (3-(methylthio)propyl)ferrocene (mtpfc), in absolute ethanol at room temperature. This mild synthetic protocol afforded the expected half-sandwich (“piano-stool”) Ru(II) complexes in good isolated yields (71–78%) and high purity. The identity and purity of both complexes were confirmed by 1H and 13C NMR, FT-IR, HPLC, and high-resolution mass spectrometry (HRMS). The spectroscopic data were fully consistent with the proposed molecular structures, confirming successful coordination of the ferrocenyl thioether ligands to the Ru(II)–p-cymene fragment through the sulfur donor atom.
Scheme 1.
Synthesis of complexes 1 and 2.
The successful formation of complexes 1 and 2 was further confirmed by NMR and HRMS analyses. The 1H NMR spectra (Figures S3 and S5) exhibited the characteristic resonances of the η6-p-cymene ligand in the δ 5.7–5.9 ppm region, confirming the preservation of the half-sandwich Ru(II)–p-cymene framework upon coordination. Signals corresponding to the ferrocenyl cyclopentadienyl protons were observed at δ 4.00–4.10 ppm, while the methylene protons of the alkyl thioether linker resonated at approximately δ 2.6 and 1.7 ppm. The methylthio group, together with the p-cymene methyl substituent and the isopropyl methine proton, gave the expected singlet resonances around δ 2.1–2.8 ppm, whereas the isopropyl methyl groups appeared at δ 1.20 ppm. Overall, the observed chemical shifts and signal pattern were fully consistent with the proposed coordination of the ferrocenyl thioether ligand to the ruthenium center. High-resolution mass spectrometry provided additional confirmation of the molecular compositions. The experimental molecular ion peaks corresponding to [1]+ and [2]+ were detected at m/z 565.9820 and 579.9982, respectively (Figures S7 and S8), in excellent agreement with the calculated monoisotopic masses of 565.9835 and 579.9992. The very small mass errors (−2.65 and −1.72 ppm, respectively) further verified the identity and high purity of the synthesized Ru(II)–p-cymene complexes. The purity of complexes 1 and 2, determined by HPLC, was 97% and 95%, respectively (Figure S12).
2.2. Solution Stability
The stability of complexes 1 and 2 was preliminarily investigated in DMSO and in a DMSO–water mixture using UV–Vis spectrophotometry (Figure S9), considering their potential application in biological studies. Both complexes were dissolved in DMSO, and the resulting solutions were used to prepare samples in DMSO and DMSO–water mixtures (1:10, v/v) at a final ruthenium concentration of 5 × 10⁻⁴ M. The UV–Vis absorption spectra were recorded immediately after sample preparation and monitored over a period of 24 h. No significant changes in the absorption spectra were observed during this period, indicating that complexes 1 and 2 remained stable under the investigated conditions.
2.3. Antimicrobial Activity
The antimicrobial activity of complexes 1 and 2 was evaluated against a representative panel of Gram-positive and Gram-negative bacteria, as well as filamentous fungi, including clinically and environmentally relevant species (Table 1 and Table 2). Both complexes inhibited the growth of all tested microorganisms, with minimum inhibitory concentration (MIC) values ranging from 0.16 to 10 mg/mL, indicating antimicrobial activity across the tested panel, although inhibition generally required relatively high concentrations. The two Ru(II)-p-cymene complexes displayed comparable antibacterial potency, with MIC values between 0.16 and 2.5 mg/mL. The lowest MIC value was observed against Staphylococcus aureus (MIC = 0.16 mg/mL), identifying this strain as the most susceptible microorganism tested. In contrast, the lowest susceptibility was found for Proteus mirabilis (MIC = 2.5 mg/mL), whereas intermediate activity was recorded against Bacillus subtilis, Escherichia coli, and Klebsiella pneumoniae (MIC = 1.25 mg/mL). These findings suggest that the nature of the ferrocenyl thioether linker has only a minor influence on antibacterial activity, as both complexes exhibited nearly identical potency across the bacterial panel.
Table 1.
The antibacterial activity of the tested compounds.
Table 2.
The antifungal activity of the tested compounds.
The antifungal activity was generally weaker than the antibacterial activity, with MIC values ranging from 2.5 to 10 mg/mL. Nevertheless, complex 2 consistently outperformed complex 1, exhibiting lower MIC values (2.5–5 mg/mL) against most fungal strains, while complex 1 showed only moderate inhibition (predominantly 10 mg/mL), with improved activity observed only against Mucor mucedo and Geotrichum candidum. The enhanced antifungal activity of complex 2 may be associated with the slightly longer alkyl spacer connecting the ferrocenyl and thioether moieties, which could influence molecular flexibility and interactions with fungal cellular targets. As expected, the reference antimicrobial agents streptomycin and ketoconazole displayed substantially higher activity than the investigated complexes (Table 1 and Table 2). No inhibitory effect was observed for the corresponding DMSO solvent control, indicating that the solvent did not contribute to the observed antimicrobial effect.
The antimicrobial profile of complexes 1 and 2 revealed a clear preference for Gram-positive bacteria over Gram-negative bacteria and fungi. This trend is consistent with the well-established differences in microbial cell envelope architecture. Gram-positive bacteria lack the outer membrane characteristic of Gram-negative species, facilitating the penetration of metal-based compounds, whereas the outer membrane of Gram-negative bacteria represents an effective permeability barrier. In fungi, the presence of a rigid cell wall composed primarily of chitin and β-glucans provides an additional level of protection, which likely contributes to the lower antifungal activity observed for both complexes.
Although the precise mechanism of antimicrobial action remains to be established, the biological activity of Ru(II)–ferrocene complexes is likely multifactorial. Their lipophilic organometallic framework may promote interactions with microbial membranes, leading to membrane destabilization and impaired cellular integrity. In addition, the ferrocenyl unit can undergo reversible redox cycling, while the ruthenium center may further contribute to intracellular oxidative stress, resulting in disruption of bacterial redox homeostasis. Ruthenium complexes have also been reported to interact with nucleic acids and proteins, thereby interfering with essential cellular processes such as DNA replication, transcription, and protein homeostasis [17,18,19,20,21]. The combination of these complementary mechanisms may reduce the likelihood of resistance development compared with conventional antibiotics.
Our findings are in agreement with the growing body of research demonstrating the antimicrobial potential of ruthenium-based complexes [18,22,23,24]. In particular, Ru–arene compounds have shown pronounced activity against clinically relevant Gram-positive pathogens, including Staphylococcus aureus, through mechanisms involving membrane disruption, oxidative stress, and intracellular target modulation [18,20,25,26,27]. Consistent with these reports, complexes 1 and 2 exhibited their highest antibacterial activity against S. aureus, identifying this pathogen as the most susceptible microorganism in the present study. Although the activity of the investigated complexes was substantially lower than that of the reference antimicrobial agents, their activity across the tested microbial panel supports further investigation and structural optimization. Future studies should focus on elucidating the molecular basis of their antimicrobial effects, evaluating activity against multidrug-resistant clinical isolates and biofilms, and establishing structure–activity relationships to optimize potency and selectivity.
2.4. The MTT Assay
The antiproliferative activity of complexes 1 and 2 was evaluated against a panel of human cancer cell lines (A549, MDA-MB-231, LS-174, and HeLa), with cisplatin (CDDP) included as the reference drug. Cytotoxicity toward normal human lung fibroblasts (MRC-5) was also assessed to obtain a preliminary estimate of selectivity. Cell viability was determined after 72 h of exposure using the MTT assay, and the results are summarized as IC50 values in Table 3, with the corresponding dose–response curves presented in Figure 2. Both Ru(II)–p-cymene complexes exhibited pronounced concentration-dependent antiproliferative activity against all investigated cancer cell lines, with IC50 values ranging from 8.42 to 24.62 μM. Among the tested tumor models, HeLa cervical adenocarcinoma cells were the most sensitive, with IC50 values of 8.42 and 11.50 for complexes 1 and 2, respectively. The remaining cell lines also showed substantial susceptibility, confirming the broad-spectrum cytotoxic potential of both compounds.
Table 3.
Cytotoxic activity of investigated complexes 1, 2, and CDDP in terms of mean IC50 values with 95% confidence intervals (95% CI), determined after 72 h treatment by MTT assay.
Figure 2.
Cell survival diagrams of A549, HeLa, LS-174, MDA-MB-231 and MRC-5 cells after 72 h of continual action of investigated compounds 1–2 compared to CDDP. Data represent the mean ± SD of at least two (A549) or three (HeLa, LS-174, MDA-MB-231, MRC-5) independent experiments performed in triplicate.
Notably, complexes 1 and 2 exhibited activity against the colorectal adenocarcinoma cell line LS-174. Although this finding is of interest, the limited selectivity of the complexes should be taken into account when evaluating their therapeutic potential. Their observed activity against LS-174 cells may warrant further investigation to determine whether the underlying mechanisms differ from those of cisplatin. Ruthenium complexes are generally believed to exert their antitumor activity through multiple intracellular targets rather than exclusively through DNA crosslinking, involving redox imbalance, mitochondrial dysfunction, protein interactions, and modulation of cell-cycle progression. Such multimodal mechanisms have been proposed to contribute to their ability to overcome platinum resistance and have stimulated considerable interest in ruthenium-based anticancer agents over the past decade [28,29,30,31].
Despite their promising anticancer activity, neither complex demonstrated appreciable selectivity toward malignant cells under the present experimental conditions. The IC50 values determined for the normal MRC-5 fibroblasts (8.82 μM for 1 and 9.17 μM for 2) were at the same level as those obtained for the most sensitive cancer cell lines. This observation indicates that further structural optimization will be required to improve the therapeutic window while preserving the favorable antiproliferative potency. Strategies such as ligand modification, tuning of lipophilicity, or targeted drug-delivery approaches may enhance tumor selectivity and reduce off-target toxicity, which remains one of the principal challenges in the development of metal-based anticancer agents [32,33].
Overall, the results demonstrate that both Ru(II)–p-cymene–ferrocenyl complexes possess significant in vitro antiproliferative activity, particularly against cancer cell lines with reduced sensitivity to cisplatin. These findings support further mechanistic investigations to elucidate their mode of action and identify structural features responsible for their promising biological activity.
2.5. Results of the Cell Cycle Analysis
The effect of complexes 1 and 2 on the cell cycle progression in HeLa cells, was examined after 72 h treatment with concentrations corresponding to IC50 (8 µM) and 2xIC50 (16 µM). A flow cytometric analysis was performed using PI staining, and the results are presented in Figure 3 and Figure S10. The results show that complexes 1 and 2 induced a concentration-dependent decrease in the percentage of cells in G1 phase (up to 40.52% for complex 1 and up to 38.42% for complex 2 compared to the control (52.17%)). Complexes 1 and 2 also induced increases in sub-G1 cells with fragmented DNA: up to 26.89% for complex 1 and up to 28.48% for complex 2 compared to the control (16.18%). Treatment with CDDP is known to induce more pronounced changes in the cell cycle, with blockade of the cell cycle in S phase and an increase in the percentage of sub-G1 cells in a concentration- and time-dependent manner [29].
Figure 3.
Effect of complexes 1 and 2 on cell cycle phase distribution of HeLa cells, following 72 h continual action. Bar graphs are representative of at least two independent experiments.
Accumulation of cells in the sub-G1 phase is generally considered an indicator of DNA fragmentation and irreversible loss of genomic integrity, frequently accompanying programmed cell death or other forms of irreversible growth inhibition. However, unlike cisplatin, which typically induces pronounced S-phase or G2/M cell-cycle arrest prior to apoptosis through DNA crosslinking and activation of the DNA damage response, complexes 1 and 2 did not produce distinct arrest at any specific checkpoint. Instead, the observed redistribution of the cell population, characterized by depletion of G1 cells and a moderate increase in the sub-G1 fraction, suggests a different mode of action from that of platinum-based drugs [29,30].
This behavior is consistent with the growing evidence that Ru(II)–arene complexes act through multiple intracellular targets rather than exclusively through DNA damage. Depending on their ligand environment, ruthenium complexes have been reported to interfere with redox homeostasis, mitochondrial function, protein activity, and cell-cycle-regulatory pathways, resulting in cytostatic growth inhibition, delayed cell-cycle progression, or non-classical cell death mechanisms [31,32,33]. The relatively modest increase in the sub-G1 population observed here therefore suggests that DNA fragmentation is unlikely to represent the predominant mechanism responsible for the pronounced antiproliferative activity of complexes 1 and 2. This interpretation is further supported by the apoptosis and ROS analyses presented in the following sections, indicating that these Ru(II)–p-cymene–ferrocenyl complexes exert their biological effects through a mechanism distinct from that of cisplatin.
2.6. Results of Annexin V-FITC/PI Apoptosis Assay
To determine whether the antiproliferative activity of complexes 1 and 2 was associated with apoptosis, HeLa cells were treated with the compounds at IC50 (8 and 11 µM, respectively) and 2 × IC50 (16 and 22 µM, respectively) concentrations for 48 h, followed by Annexin V-FITC/propidium iodide (PI) dual staining and flow cytometric analysis. Cisplatin (CDDP) was used as a positive control. The percentages of viable, early apoptotic (Annexin V-positive/PI-negative), late apoptotic or necrotic (Annexin V-positive/PI-positive), and dead (Annexin V-negative/PI-positive) cells are summarized in Figure 4, while representative dot plots are presented in Figure 5. In contrast to cisplatin, neither complex 1 nor 2 produced a significant increase in either early or late apoptotic cell populations after 48 h of treatment, even at the higher concentrations investigated. The absence of a concentration-dependent apoptotic response indicates that apoptosis is unlikely to represent the primary mechanism underlying the pronounced antiproliferative activity of these Ru(II)–p-cymene complexes. Conversely, cisplatin induced the expected apoptotic response, increasing the proportion of early apoptotic cells to 29.25% and late apoptotic cells to 14.72% at both investigated concentrations, compared with 5.86% and 2.05%, respectively, in untreated control cells.
Figure 4.
Flow cytometric analysis of HeLa cells treated with complexes 1, 2, and CDDP after 48 h. The data represent the mean values ± SD of two independent experiments. Statistical significance: ** p < 0.01, *** p < 0.001, **** p < 0.0001 compared to the control group (Two-way ANOVA, Dunnett’s post-hoc test).
Figure 5.
The representative dot plot diagrams obtained by flow-cytometric analysis of treated HeLa cells after dual staining with Annexin-V-FITC and PI. The Annexin-V FITC/PI staining was monitored in HeLa cells, following 48 h treatment with complexes 1, 2 and CDDP. The intact-live cells can be seen in the lower-left quadrant, early apoptotic cells in the lower-right quadrant, late apoptotic or necrotic cells in the upper-right quadrant, and necrotic cells in the upper-left quadrant.
To examine whether apoptosis might occur at later time points, the analysis was repeated after 72 h of treatment (Figure S11). Even after prolonged exposure, complexes 1 and 2 failed to induce a substantial increase in either early or late apoptotic populations, whereas cisplatin produced a marked accumulation of apoptotic and dead cells. These findings clearly distinguish the biological effects of the investigated ruthenium complexes from those of the platinum reference compound and indicate that their cytotoxic activity is not primarily mediated through the classical apoptotic pathway.
Increasing evidence suggests that many Ru(II)–arene complexes exert their antiproliferative effects through mechanisms distinct from apoptosis, including prolonged cytostatic growth inhibition, mitochondrial dysfunction, oxidative stress, metabolic reprogramming, autophagy, ferroptosis, or other regulated non-apoptotic forms of cell death [33,34,35,36]. Therefore, the lack of Annexin V positivity observed in the present study should not be interpreted as an absence of biological activity but rather as evidence of a different cellular response to treatment. Additional mechanistic studies employing specific molecular markers of autophagy, ferroptosis, necroptosis, and mitochondrial dysfunction will be required to identify the dominant pathways responsible for their antiproliferative effects.
2.7. Trypan Blue Exclusion Assay
To further elucidate the biological effects of complexes 1 and 2, additional experiments were performed to distinguish between true cytotoxicity and antiproliferative activity. Since the MTT assay is based on the measurement of mitochondrial dehydrogenase activity, it primarily reflects cellular metabolic activity and cannot discriminate between reduced viability caused by cell death and decreased proliferation. Therefore, complementary approaches, including apoptosis analysis, Trypan blue exclusion assay (Figure 6), and a morphological examination (Figure 7) were employed.
Figure 6.
The cell survival curves obtained during 72 h continuous treatment of HeLa cells with investigated complexes.
Figure 7.
The micrographs presenting HeLa cells treated with investigated complexes 1 and 2 and CDDP after 72 h of treatment. Untreated cells were used as control cells. Bright-field images were obtained using a bright-field inverted microscope (Olympus CKX53, Olympus, Tokyo, Japan) equipped with a 4 ×/0.13 objective lens, and images were captured using a digital camera (Olympus EP50, Olympus, Tokyo, Japan).
The ability of complexes 1 and 2 to induce apoptosis was investigated by monitoring phosphatidylserine externalization using Annexin V-FITC/PI dual staining after treatment of HeLa cells. In contrast to cisplatin-treated cells, which exhibited a pronounced increase in early and late apoptotic populations, neither complex 1 nor 2 caused a significant accumulation of apoptotic cells, even after prolonged exposure. These results indicate that the antiproliferative effects of the investigated Ru(II)–p-cymene complexes are not primarily mediated through the classical apoptotic pathway.
Morphological analysis of HeLa cells following 72 h treatment further supported this conclusion. Cells exposed to complexes 1 and 2 displayed reduced proliferation compared with the untreated controls, without extensive morphological features characteristic of massive cell death (Figure 7). These observations suggested that the reduction in metabolic activity detected by the MTT assay may predominantly reflect suppression of cellular growth rather than direct induction of cell killing.
To further confirm the effect of complexes on cellular proliferation and membrane integrity, Trypan blue exclusion assays were performed after 24, 48, and 72 h of continuous treatment. The numbers of viable and non-viable cells were monitored by light microscopy, and cell growth curves were generated based on viable cell counts (Figure 6). As expected, untreated HeLa cells exhibited exponential growth, consistent with the reported doubling time of approximately 20–24 h for this cell line. Treatment with complex 1 resulted in an initial proliferation rate comparable to, or slightly higher than, that of the control population during the first 48 h, followed by a marked reduction in growth during the subsequent 24 h. This resulted in an increased doubling time of 23.3 h compared with 20.4 h for untreated cells. Complex 2 produced a milder effect, with treated cells exhibiting a doubling time of 21.5 h. Although the differences in doubling time appear moderate, the continuous suppression of cell growth is consistent with the reduced metabolic activity observed in the MTT assay.
Taken together, the combined results from apoptosis detection, morphological evaluation, and Trypan blue exclusion demonstrate that complexes 1 and 2 predominantly exert a cytostatic/antiproliferative effect in HeLa cells rather than inducing extensive cytotoxic cell death. This behavior distinguishes these Ru(II)-p-cymene–ferrocenyl complexes from cisplatin and suggests that their biological activity may involve sustained inhibition of cellular proliferation through alternative mechanisms, which warrants further investigation.
2.8. Analysis of Morphological Changes
Morphological alterations in HeLa cells following treatment with complexes 1 and 2 were examined using bright-field microscopy, and representative images are presented in Figure 7 and Figure S11. Cells were exposed to both complexes at a concentration of 12.5 μM, corresponding to a value slightly above the experimentally determined IC50 concentrations (Table 3), for 72 h.
Treatment with 1 and 2 resulted primarily in a reduction in cell number compared with untreated controls, while no extensive morphological features characteristic of apoptotic or necrotic cell death were observed. Cells treated with complex 1 largely retained their typical epithelial-like morphology, although some cells exhibited reduced spreading and loss of well-defined cellular borders, suggesting mild cellular stress and impaired proliferation. Similarly, treatment with 2 resulted in decreased cell density and slightly increased intercellular spaces, indicating suppression of cell growth rather than extensive cell destruction. These observations are consistent with an antiproliferative/cytostatic effect, in agreement with the results obtained from the MTT and Trypan blue exclusion assays.
In contrast, cisplatin treatment at an equimolar concentration caused a pronounced reduction in cell number accompanied by marked morphological alterations, including cell rounding, shrinkage, and loss of normal attachment characteristics, which are commonly associated with apoptosis and severe cytotoxic stress. It should be noted that the cisplatin concentration selected for this comparative experiment was approximately four times higher than its IC50 value and was applied for a prolonged exposure period; therefore, these conditions were intentionally chosen to demonstrate the different cellular responses induced by cisplatin and the investigated ruthenium complexes.
The morphological findings are consistent with the Annexin V-FITC/PI apoptosis analysis, which demonstrated that complexes 1 and 2 did not significantly increase early or late apoptotic cell populations, even at elevated concentrations, whereas cisplatin induced a clear apoptotic response (Figure 4 and Figure 5). Taken together, these results indicate that the reduction in cell viability observed in the MTT assay is mainly associated with inhibition of proliferation rather than extensive apoptotic cell death. However, the exact type of cellular response induced by 1 and 2 cannot be conclusively determined based on the current data, and additional studies targeting specific cell-death pathways will be required to fully elucidate their mechanism of action.
Since redox activity is considered one of the important mechanisms associated with the biological effects of ruthenium and ferrocenyl-based compounds, the ability of complexes 1 and 2 to modulate intracellular reactive oxygen species (ROS) levels was investigated in HeLa cells. Intracellular ROS production was assessed after 72 h of treatment using the DCFH-DA fluorescent probe followed by flow cytometric analysis. This assay provides an estimation of the overall oxidative status of cells by monitoring the oxidation-dependent increase in DCF fluorescence.
Treatment with complexes 1 and 2 resulted in only a moderate elevation in intracellular ROS levels compared with untreated cells (Figure 8). Quantitative analysis based on the geometric mean fluorescence intensity (Geo Mean fold change) revealed a maximum increase of approximately 1.41-fold for both complexes, whereas cisplatin induced a more pronounced oxidative response, reaching a 2.26-fold increase compared with the control (Figure 9).
Figure 8.
The ROS detection using DCFH-DA (2′,7′-dichlorofluorescein diacetate) measured by flow cytometry in HeLa cells (representative experiment out of three). How to interpret the histogram: The purple peak represents the unstained control population (low fluorescence ~102). The orange peak is the stained control—untreated HeLa cells (represents the baseline intracellular ROS level). The broad distribution around ~103–104 fluorescence indicates the normal oxidative state of cell production, common in HeLa cells. The blue populations denote complex 1, with a slight right shift compared to the control (indicating a moderate ROS increase relative to the untreated cells), the green population is complex 2 (indicating a moderate ROS decrease relative to the untreated cells, with a shift to the left compared to the control), and the red population is CDDP, with a strong right shift ~104–105 (indicating high ROS production, suggesting strong oxidative stress induced by the treatment).
Figure 9.
The ROS Fold Change bar graphs. The ROS fold change compares treated cells to untreated control (Formula ROS Fold Change = Geo Mean of treated sample/Geo Mean of control sample).
The limited ROS generation observed for complexes 1 and 2 suggests that oxidative stress may contribute to their biological activity, but it is unlikely to represent the primary mechanism responsible for their antiproliferative effects. This observation is consistent with the previously described results showing the absence of substantial apoptosis induction and the predominant cytostatic response in HeLa cells. In contrast, cisplatin, which is known to induce oxidative stress as a consequence of DNA damage, mitochondrial dysfunction, and activation of apoptotic signaling pathways, produced a considerably stronger increase in ROS levels.
Ruthenium(II)–arene and ferrocenyl-containing complexes are frequently associated with redox-mediated biological effects due to the ability of the metal centers to participate in electron-transfer processes. However, the extent of ROS generation is highly dependent on the ligand environment, intracellular localization, and cellular context. The moderate ROS elevation observed for complexes 1 and 2 may therefore represent one component of a broader mechanism involving inhibition of proliferation, cell-cycle modulation, and disruption of cellular homeostasis rather than direct oxidative damage as the main cause of cell death.
Overall, these findings support the concept that Ru(II)-p-cymene–ferrocenyl complexes induce a biological response distinct from cisplatin, characterized by limited oxidative stress and predominantly antiproliferative activity.
2.9. Results of Growth Inhibition in MCTSs
Two-dimensional monolayer cultures are widely used for preliminary anticancer screening; however, they do not fully reproduce the complex microenvironments of solid tumors. Three-dimensional multicellular tumor spheroids (MCTS) provide a more physiologically relevant in vitro model by mimicking important characteristics of tumor tissues, including cell–cell interactions, extracellular matrix organization, limited drug diffusion, nutrient gradients, and the presence of quiescent or hypoxic cell populations [30]. Consequently, compounds showing promising activity in conventional 2D assays may display reduced efficacy when evaluated in 3D tumor models [31,32].
To further evaluate the anticancer potential of 1 and 2, their activity was investigated in a HeLa MCTS model and compared with cisplatin. Spheroids were treated for 72 h, and changes in morphology and metabolic activity were assessed by bright-field microscopy and an MTT assay, respectively (Figure 10 and Figure 11).
Figure 10.
The growth inhibition images obtained after 72 h of drug treatment in HeLa MCTSs. The bright-field images were obtained using an inverted microscope (Olympus CKX53, Olympus, Tokyo, Japan) equipped with a 4 ×/0.13 objective lens, and images were captured using a digital camera (Olympus EP50, Olympus, Tokyo, Japan).
Figure 11.
The cell survival diagrams of HeLa cells MCTSs after 72 h of continual action of investigated compounds 1 and 2 compared to CDDP. Data are representative for one out of three separate experiments with standard deviations.
Untreated control spheroids maintained a compact, spherical morphology with smooth and well-defined edges, indicating preserved cell–cell interactions and continuous proliferation within the 3D structure. In contrast, cisplatin treatment resulted in pronounced morphological alterations, including reduced compactness, disruption of spheroid architecture, irregular borders, and accumulation of cellular debris. These effects became increasingly evident with increasing cisplatin concentrations, indicating extensive cytotoxic damage and loss of spheroid integrity.
In comparison, treatment with 1 and 2 produced only minimal morphological changes, with spheroids largely maintaining their original size, compactness, and overall organization. Although some cellular shedding was observed at higher concentrations, no substantial disruption of the spheroid structure was detected. Quantitative evaluation using the MTT assay confirmed these observations, demonstrating markedly reduced activity of both ruthenium complexes in the 3D model compared with their effects in conventional 2D cultures.
Complex 1 showed limited influence on spheroid viability, with metabolic activity remaining above 95% even at the highest tested concentration (100 μM). Complex 2 exhibited slightly higher activity, reducing spheroid viability to approximately 88% at 100 μM; however, this effect remained modest and was not comparable with the activity observed for cisplatin. The reference drug produced the strongest inhibition of spheroid viability; nevertheless, even at the highest concentration tested, cell survival remained around 70%, indicating the intrinsic resistance of the MCTS model compared with monolayer cultures.
The reduced efficacy of complexes 1 and 2 in the 3D tumor model is consistent with the behavior commonly observed for metal-based anticancer agents. Tumor spheroids frequently exhibit increased resistance due to limited compound diffusion, stronger cell–cell interactions, extracellular matrix barriers, and the presence of slowly proliferating cells that are less susceptible to antiproliferative agents.
Overall, these results demonstrate that while complexes 1 and 2 exhibit significant antiproliferative activity in conventional cancer cell models, their effectiveness is substantially reduced in a more complex 3D tumor environment. This finding emphasizes the importance of incorporating advanced biological models during the preclinical evaluation of ruthenium-based anticancer candidates.
2.10. Binding Modes of Complexes with DNA and HSA
2.10.1. Fluorescence Quenching of Complexes 1 and 2 with CT-DNA
The interactions between nucleic acids and metal complexes have attracted considerable research interest, and fluorescence quenching approaches are widely employed as valuable tools for investigating the binding behavior of bioactive compounds in biochemical systems [33,34]. Therefore, the modes of interaction of complexes 1 and 2 with DNA were investigated using fluorescence displacement assays.
The EB–DNA displacement experiments provided further evidence against a classical intercalative binding mode (Figure 12). Upon gradual addition of complexes 1 and 2 to the EB–DNA system, only a moderate reduction in fluorescence intensity was observed, yielding Stern–Volmer constants (Ksv) of approximately 2.0 × 10⁴ M−1. Since classical DNA intercalators generally exhibit substantially higher quenching constants (105–106 M−1), the obtained Ksv values indicate weak competition with ethidium bromide (EB) and suggest the absence of strong π-stacking-driven intercalation [34].
Figure 12.
DNA-EB Fluorescence emission spectra of the DNA–ethidium bromide (EB) system (red line) in the absence and presence of increasing concentrations of 1 (left) and 2 (right). The arrows indicate the decrease in fluorescence intensity of the DNA–EB complex upon addition of the complexes. Inserts show the corresponding Stern–Volmer plots (I0/I versus 105·[Q]).
To further elucidate the possible involvement of the DNA minor groove, Hoechst 33258 displacement experiments were performed. Similar to the EB assay, titration of complexes 1 and 2 into the DNA–Hoechst system resulted in only moderate fluorescence quenching, with Ksv values of approximately 2.3 × 10⁴ M−1 (Table 4, Figure 13). The comparable quenching efficiencies observed for both fluorescent probes indicate that the complexes do not strongly compete with Hoechst 33258, which binds preferentially within the minor groove. These findings suggest that complexes 1 and 2 most likely interact with DNA through weak groove association and/or external surface binding rather than through specific minor-groove insertion.
Table 4.
Stern–Volmer and quenching rate constants of complexes 1 and 2 with DNA-EB and DNA-HOE systems.
Figure 13.
Fluorescence emission spectra of the DNA–HOE system (red line) in the absence and presence of increasing concentrations of 1 (left) and 2 (right). The arrows indicate the decrease in fluorescence intensity of the DNA–EB complex upon addition of the complexes. Inserts show the corresponding Stern–Volmer plots (I0/I versus 105·[Q]).
The similar fluorescence responses obtained with both probes are characteristic of DNA ligands exhibiting low-affinity, nonspecific interactions, likely influenced by electrostatic contributions and steric limitations. Furthermore, the apparent quenching rate constants calculated using τ0 = 10−8 s exceed the diffusion-controlled limit, indicating that the observed fluorescence decrease is primarily associated with complex–DNA binding/displacement processes rather than dynamic quenching.
Similar fluorescence responses have been reported for structurally related Ru(II)–arene and ferrocenyl organometallic complexes that lack extended planar aromatic ligands. In these systems, only partial displacement of ethidium bromide and Hoechst 33258 is typically observed, with Stern–Volmer quenching constants generally remaining in the 104 M−1 range, considerably lower than those characteristic of classical DNA intercalators. Such behavior has been attributed to the inability of the bulky organometallic scaffold and the piano-stool geometry of the Ru(II)–arene fragment to achieve efficient π–π stacking with DNA base pairs. Instead, DNA recognition is proposed to occur predominantly through weak electrostatic interactions, hydrogen bonding, and shallow groove association, often accompanied by only limited perturbation of the DNA duplex. These observations closely parallel the behavior of complexes 1 and 2, which likewise exhibit moderate displacement of both EB and Hoechst 33258 together with comparable quenching constants for the two probes. The similar responses obtained in both fluorescence assays further support the absence of a preferred intercalative or minor-groove binding mode and instead point toward a weak, non-specific DNA association governed primarily by the steric and electronic properties of the complexes rather than by extensive aromatic stacking interactions [34,35,36].
2.10.2. Viscosity
Although the viscosity measurements showed a pronounced increase in (η/η0)1/3 with increasing r values (Figure 14), suggesting DNA elongation or conformational changes, the fluorescence displacement results did not provide strong evidence for classical intercalation or pronounced minor-groove binding. These findings may be reconciled by considering a predominantly groove-associated or external binding mode accompanied by partial intercalation or local perturbation of the DNA structure. Nevertheless, the available experimental data do not allow these contributions to be distinguished unambiguously. Therefore, the interaction of complexes 1 and 2 with DNA is best described as a non-classical binding mode that may involve a combination of groove association, external interactions, and limited intercalative contributions [34,35,37].
Figure 14.
Relative viscosity of DNA, expressed as (η/η0)1/3, as a function of r = [complex or EB]/[DNA] in the presence of complex 1, 2 and EB.
2.10.3. Interaction with Human Serum Albumin (HSA)
The intrinsic fluorescence of HSA, arising predominantly from Trp-214, was efficiently quenched upon addition of complexes 1 and 2, indicating the formation of stable protein–ligand adducts (Figure 15, Figure 16 and Figure 17). The calculated binding constants (9.6 × 10⁴–1.73 × 10⁵ M−1) fall within the range commonly reported for bioactive metal complexes interacting with serum albumin, suggesting sufficiently strong yet reversible binding that is favorable for albumin-mediated transport under physiological conditions. Binding affinities of this magnitude are considered advantageous because they enable efficient transport in the bloodstream while allowing subsequent dissociation of the ligand at the target site, thereby preserving pharmacological activity rather than causing irreversible sequestration by the carrier protein.
Figure 15.
Fluorescence emission spectra of adduct HSA (red line) in the absence and presence of increasing concentrations of 1 (left) and 2 (right). The arrows indicate the decrease in fluorescence intensity upon addition of the complexes. Insets show the corresponding plots of log[(I0 − I)/I] versus log[Q].
Figure 16.
Fluorescence emission spectra of adduct HSA-ibuprofen (red line) in the absence and presence of increasing concentrations of 1 (left) and 2 (right). The arrows indicate the decrease in fluorescence intensity upon addition of the complexes. Insets show the corresponding plots of log[(I0 − I)/I] versus log[Q].
Figure 17.
Fluorescence emission spectra of adduct HSA-Eosin (red line) in the absence and presence of increasing concentrations of 1 (left) and 2 (right). The arrows indicate the decrease in fluorescence intensity upon addition of the complexes. Insets show the corresponding plots of log[(I0 − I)/I] versus log[Q].
Scatchard analysis indicated the presence of a single predominant class of binding sites, suggesting that the interaction is governed by a specific binding event rather than nonspecific adsorption onto the protein surface. Similar binding behavior has been reported for numerous Ru(II)–arene complexes, whose interactions with HSA are primarily driven by hydrophobic contacts, van der Waals forces, and, where applicable, hydrogen-bonding interactions within the hydrophobic cavities of the protein.
Competitive displacement experiments further revealed that the two complexes exhibit different binding preferences within HSA (Table 5). For complex 1, the binding constant decreased markedly in the presence of eosin Y, whereas no reduction was observed in the presence of ibuprofen, indicating competition with the Site I probe and suggesting preferential binding within Sudlow site I (subdomain IIA). In contrast, complex 2 displayed a significant decrease in binding affinity in the presence of ibuprofen, while eosin Y produced virtually no effect, indicating preferential association with Sudlow site II (subdomain IIIA). Although both complexes exhibit comparable overall affinities toward HSA, the displacement experiments demonstrate that they recognize different binding regions within the protein.
Table 5.
Binding constants (Kb) of complexes 1 and 2 with HSA and HSA–probe systems.
The observed difference in site preference is particularly interesting because 1 and 2 differ only in the length of the alkyl spacer of the coordinated ferrocenyl thioether ligand. Complex 2, containing the 3-(methylthio)propyl substituent, possesses only one additional methylene group compared with 1, while the coordination environment of the Ru(II)–arene center remains unchanged. Although this structural modification is subtle, the slightly longer alkyl chain may increase the conformational flexibility of the ligand and influence the relative orientation of the ferrocenyl and thioether groups within the albumin binding pocket. Consequently, the additional methylene unit may facilitate a different mode of accommodation within the hydrophobic cavities of HSA, leading to altered site selectivity without substantially affecting the overall binding affinity.
The present findings are consistent with previous reports showing that Ru(II)–arene and related organometallic complexes typically bind HSA with association constants in the range of 104–106 M−1 and that even subtle modifications of ligand architecture can influence binding-site preference while maintaining similar overall protein affinity. This sensitivity reflects the adaptable nature of the Sudlow binding pockets, which accommodate ligands according to a combination of hydrophobicity, conformational flexibility, and molecular shape rather than through a single dominant interaction.
Overall, the moderate-to-high binding affinities together with the observed site selectivity indicate that HSA is likely to serve as an efficient transport protein for both complexes under physiological conditions. Since albumin binding plays an important role in determining the circulation time, biodistribution, and bioavailability of metal-based drugs, the present results suggest that complexes 1 and 2 possess favorable pharmacokinetic characteristics while retaining the ability to dissociate from the carrier protein and reach their biological targets.
2.10.4. Molecular Docking Simulation
Molecular docking studies were performed to further characterize the possible modes of interaction of complexes 1 and 2 with DNA and to complement the experimental fluorescence displacement and viscosity measurements. The docking protocol considered the entire DNA sequence as a potential binding region, allowing the identification of the most favorable ligand orientations. Among the ten predicted binding positions, complex 1 interacted with seven different regions of the DNA molecule, whereas complex 2 showed interactions at all ten evaluated positions. Notably, all predicted binding sites for both complexes were located within the minor groove of the DNA double helix, suggesting that groove association represents a favorable interaction mode for these organometallic compounds. The calculated binding energies and inhibition constants (Table 6) indicated very similar affinities of complexes 1 and 2 toward DNA, with complex 1 exhibiting slightly more favorable binding characteristics. This difference was mainly attributed to lower ΔGtotal and ΔGtor energy contributions, suggesting a more favorable balance between intermolecular interactions and ligand conformational adaptation within the DNA binding site. Nevertheless, the comparable overall binding energies indicate that the extension of the alkyl spacer by one methylene group in complex 2 does not substantially alter the general affinity toward DNA.
Table 6.
Thermodynamic parameters corresponding to the most stable conformation of the target-ligand complexes obtained by docking analysis. The inhibition constant values (Ki) are presented in μM, while all energy values are presented in kcal/mol.
The predicted binding orientations provide further insight into the possible non-classical DNA-binding modes of complexes 1 and 2. In the most favorable predicted DNA–complex 1 structure, the complex interacts with nucleotides G2, C3, and C23 through π–alkyl contacts involving the nucleobases and the hydrophobic regions of the p-cymene moiety (Table 7, Figure 18). Similarly, complex 2 establishes predicted π–sulfur and π–alkyl contacts with nucleotides A5, G4, and C21, involving the thioether substituent, p-cymene fragment, and ferrocenyl moiety (Table 6, Figure 18). These predicted interactions are compatible with groove-associated binding, as no insertion of an extended planar aromatic surface between adjacent DNA base pairs was observed in the docked poses. However, molecular docking provides a plausible binding model and does not independently establish the binding mode in solution.
Table 7.
The type of interactions and corresponding interatomic distance obtained by molecular docking analysis for the most stable complex (the lowest values of ΔGbind and Ki) formed between DNA and HSA molecules and ligands 1 and 2, respectively.
Figure 18.
Molecular docking positions of complexes 1 and 2 with selected DNA and HSA molecules.
The molecular docking calculations predicted preferential localization of complexes 1 and 2 within the DNA minor groove. The fluorescence displacement experiments using ethidium bromide (EB) and Hoechst 33258 showed moderate quenching, indicating limited displacement of these probes under the experimental conditions. These results do not provide definitive evidence of a specific DNA-binding mode but suggest that strong classical intercalation is unlikely to be the predominant mechanism. In contrast, the increase in DNA solution viscosity suggests that the complexes may induce changes in DNA conformation, potentially involving partial intercalation or other binding-induced structural perturbations. Therefore, the experimental and computational findings are broadly consistent with a non-classical DNA-binding mechanism, although the precise contributions of groove association, external binding, and partial intercalation cannot be unequivocally established from the available data.
Although complexes 1 and 2 possess the same Ru(II)–arene core and differ only in the length of the alkyl spacer in the coordinated ferrocenyl thioether ligand, subtle differences in their predicted interaction patterns were observed. The additional methylene group in complex 2 may allow a slightly different orientation of the thioether-containing substituent, resulting in distinct contacts with DNA nucleobases. Nevertheless, the similar predicted binding energies and localization within the minor groove suggest that this structural modification influences the detailed interaction pattern without substantially changing the predicted overall binding mode.
Overall, the fluorescence displacement assays, viscosity measurements, and molecular docking calculations suggest that complexes 1 and 2 do not predominantly exhibit classical DNA intercalation. Instead, the results support a possible groove-associated or external binding mode, potentially accompanied by partial intercalation or local conformational changes in the DNA structure. The hydrophobic, π–alkyl, and π–sulfur contacts identified by docking provide plausible explanations for the predicted interactions; however, these computational observations should not be considered definitive proof of the binding mechanism.
Human serum albumin (HSA) is a single-chain protein organized into three homologous domains (I–III), each divided into A and B subdomains. Molecular docking was performed within the selected binding pocket of the HSA structure used in the calculations.
Molecular docking studies were conducted to investigate the possible interactions of complexes 1 and 2 with HSA and to complement the experimental fluorescence quenching and competitive displacement results. Both complexes were predicted to bind within the same hydrophobic cavity of HSA, where their interactions involve a combination of electrostatic, hydrophobic, and π-mediated contacts (Table 6, Figure 18). The calculated docking energies suggest favorable interactions with the selected binding pocket; however, these predictions should be interpreted as estimates of binding poses and relative interaction energies rather than direct measurements of experimental binding affinity.
Although complexes 1 and 2 share the same Ru(II)–arene core and differ by one methylene group in the alkyl spacer of the coordinated ferrocenyl thioether ligand, subtle differences in their predicted interaction patterns were observed. In both complexes, the chloride ligands were predicted to participate in electrostatic interactions with Lys195 and Lys199 (Table 7, Figure 18). The p-cymene moiety contributes alkyl and π–alkyl contacts, while the ferrocenyl fragment participates in hydrophobic π–alkyl interactions involving residues such as Leu238, Leu260, Ile290, Ala291, and Arg257. Additional contacts involving the thioether functionality and Tyr150, His242, His288, and Ala291 may further contribute to the predicted stabilization of the complexes within the binding cavity.
Despite the overall similarity of the predicted binding poses, the additional methylene group in complex 2 may allow a different orientation of the thioether-containing substituent within the binding pocket. This difference is reflected in the predicted interactions with amino acid residues, with His242 involved in the interaction pattern of complex 1 and Arg218 contributing to that of complex 2. These observations suggest that the increased flexibility of the longer alkyl spacer may influence the orientation of the ligand and the distribution of intermolecular contacts. Nevertheless, these structural differences are based on computational predictions and do not, by themselves, establish different experimental binding sites.
The fluorescence quenching experiments yielded association constants of 9.6 × 10⁴ M−1 for complex 1 and 1.73 × 10⁵ M−1 for complex 2, indicating that both complexes interact with HSA under the experimental conditions. Competitive displacement experiments suggested different binding-site preferences: complex 1 showed a decrease in the calculated binding constant in the presence of eosin Y, whereas complex 2 showed a decrease in the presence of ibuprofen. These findings are consistent with possible preferential interactions of complex 1 with the region probed by eosin Y and of complex 2 with the region probed by ibuprofen. However, the docking calculations predicted both complexes within the same HSA cavity. Therefore, the computational results do not independently confirm the experimentally inferred site assignments, and the apparent discrepancy should be acknowledged. Further site-specific binding studies or docking calculations targeting the individual Sudlow sites would be required to clarify this difference.
Furthermore, complex 1 exhibited a slightly more favorable calculated docking energy than complex 2 (Table 6). This prediction does not directly correspond to the experimental association constants, which were higher for complex 2. Such differences are not unexpected because docking scores and experimentally determined association constants represent distinct quantities and are influenced by different assumptions and factors. In particular, docking scores depend on the scoring function, conformational sampling, and representation of protein flexibility and solvent effects. Consequently, the calculated energies should not be used to establish a definitive experimental affinity ranking. Instead, the docking results provide complementary structural information about possible interactions of the complexes with HSA.
Overall, the fluorescence quenching and competitive displacement experiments demonstrate that complexes 1 and 2 interact with HSA and suggest different binding-site preferences. Molecular docking provides plausible models of their interactions within the selected HSA cavity, although the predicted common binding location does not fully reproduce the experimentally inferred differences in site preference. The combined findings highlight the potential importance of ligand structure and flexibility in HSA recognition. However, the present results do not establish the circulation time, biodistribution, bioavailability, or overall pharmacokinetic properties of the investigated complexes, which would require dedicated experimental investigations.
3. Materials and Methods
3.1. Reagents and Instrumentation
All reagents and biomolecules, including calf-thymus DNA (CT-DNA), ethidium bromide (EB), human serum albumin (HSA), Eosin Y, ibuprofen, dimethyl sulfoxide (DMSO), 3-(4,5-dimethylthiazol-2-yl)-2,5-diphenyltetrazolium bromide (MTT), and phosphate-buffered saline (PBS), were purchased from Sigma-Aldrich (St. Louis, MO, USA) and used without further purification. Two ligands (2-(methylthio)ethyl)ferrocene (mtefc) and (3-(methylthio)propyl)ferrocene (mtpfc) were synthesized following modified literature procedures [12].
Melting points were determined using a Mel-Temp capillary melting-point apparatus and are reported uncorrected. Fourier-transform infrared (FT-IR) spectra were recorded in the spectral range from 4000 to 400 cm−1 using a PerkinElmer Spectrum 3 FT-IR/FIR spectrophotometer (PerkinElmer, Waltham, MA, USA). UV–Vis absorption spectra were recorded using a PerkinElmer Lambda 35 double-beam spectrophotometer (PerkinElmer, Waltham, MA, USA) equipped with 1.0 cm path-length quartz cuvettes (3.0 mL). Fluorescence measurements were performed using a Shimadzu RF-1501 PC spectrofluorometer (Shimadzu Corporation, Kyoto, Japan), with both excitation and emission slit widths set to 10 nm. Density and viscosity measurements were carried out using an Anton Paar DMA 5000 M density meter equipped with a Lovis 2000 ME rolling-ball microviscometer (Anton Paar GmbH, Graz, Austria). 1H and 13C NMR spectra were recorded in DMSO-d6 at 288 K using a Bruker Ascend 400 (400 MHz) spectrometer. The original NMR spectra are provided in the Supplementary Materials.
3.2. Synthesis
3.2.1. [Ru(p-Cym)Cl2(mtefc)], Mtefc = (2-(Methylthio)ethyl)ferrocene (1)
To a solution of [Ru(p-cym)Cl2]2 (0.10 mmol, 61 mg) in absolute ethanol (8 mL) at room temperature, a solution of the ferrocene-derived ligand mtefc (0.20 mmol, 52 mg) in absolute ethanol (2 mL) was added dropwise. Upon addition of the ligand solution, the color of the reaction mixture immediately changed from orange to red. After 15 min, precipitation of the complex was observed. The reaction mixture was then left to stand at room temperature overnight without stirring. The resulting orange precipitate was collected by filtration, washed with absolute ethanol, and dried under vacuum to afford the desired complex as an orange powder. Yield: 71% (41 mg). Complex 1 is soluble in chloroform, dimethylformamide and dimethyl sulfoxide, slightly soluble in water. IR (ν, cm−1): 3076, 2959, 1716, 1462, 1421, 1377; 1H NMR (400 MHz, DMSO-d6) δ 5.81 (d, J = 6.1 Hz, 2H, CHAr), 5.77 (d, J = 6.1 Hz, 2H, CHAr), 4.12 (s, 7H, CHFc), 4.05 (s, 2H, CHFc), 2.79–2.86 (septet, 1H, CHiPr), 2.54–2.62 (m, 4H, CH2CH2), 2.08 (s, 3H, CH3), 2.06 (s, 3H, SCH3), 1.18 (d, J = 6.9 Hz, 6H, (CH3)2) ppm; 13C NMR (101 MHz, DMSO-d6) δ 106.9, 100.6, 87.6, 86.8, 86.0, 68.8, 68.4, 67.4, 34.6, 30.4, 29.7, 21.9, 18.3, 15.3 ppm; HRMS (m/z): calculated for C23H30Cl2FeRuS [M]+ = 565.9835; found [M]+ = 565.9820.
3.2.2. [Ru(p-Cym)Cl2(mtpfc)], Mtpfc = (3-(Methylthio)propyl)ferrocene (2)
A solution of the ferrocene-derived ligand mtpfc (0.20 mmol, 56 mg) in absolute ethanol (2 mL) was added dropwise to a solution of [Ru(p-cym)Cl2]2 (0.10 mmol, 61 mg) in absolute ethanol (8 mL) at room temperature. The reaction mixture was stirred for 24 h, during which the solution gradually turned orange. The solvent was then removed under reduced pressure to approximately half of the initial volume. Hexane (5 mL) was subsequently added, and the mixture was cooled to induce precipitation. The resulting light orange solid was collected by filtration, washed with diethyl ether, and dried under vacuum to afford the ruthenium complex as a light orange powder. Yield: 78% (45 mg). Complex 2 is soluble in chloroform, dimethylformamide and dimethyl sulfoxide, slightly soluble in water. IR (ν, cm−1): 3078, 2964, 1719, 1472, 1423, 1322; 1H NMR (400 MHz, DMSO-d6) δ 5.81 (d, J = 6.2 Hz, 2H, CHAr), 5.77 (d, J = 6.2 Hz, 2H, CHAr), 4.10 (s, 7H, CHFc), 4.04 (s, 2H, CHFc), 2.79–2.86 (septet, 1H, CHiPr), 2.45–2.49 (m, 2H, CH2), 2.34–2.38 (m, 2H, CH2), 2.08 (s, 3H, CH3), 2.03 (s, 3H, SCH3), 1.68–1.75 (m, 2H, CH2), 1.18 (d, J = 6.9 Hz, 6H, (CH3)2); 13C NMR (101 MHz, DMSO-d6) δ 106.9, 100.6, 86.8, 86.0, 68.8, 68.2, 67.4, 33.5, 30.4, 30.2, 28.4, 21.9, 18.3, 15.1 ppm; HRMS (m/z): calculated for C24H32Cl2FeRuS [M]+ = 579.9992; found [M]+ = 579.9982.
3.3. Antimicrobial Activity Assay
The antimicrobial activity of the two ruthenium–ferrocene complexes was evaluated using the broth microdilution method. The tested microorganisms were obtained from the American Type Culture Collection (ATCC). The bacterial strains included Bacillus subtilis (ATCC 6633), Staphylococcus aureus (ATCC 25923), Escherichia coli (ATCC 25922), Proteus mirabilis (ATCC 29906), and Klebsiella pneumoniae (ATCC 70063). The fungal strains included Aspergillus niger (ATCC 16888), Penicillium italicum (ATCC 10454), Mucor mucedo (ATCC 20094), Candida albicans (ATCC 10259), and Geotrichum candidum (ATCC 34614).
Bacterial suspensions were prepared from 24 h cultures grown at 37 °C on Mueller–Hinton agar and adjusted to approximately 1 × 10⁸ CFU/mL using the 0.5 McFarland standard. Fungal suspensions were prepared from spores collected from 3–7-day-old cultures grown on Sabouraud dextrose agar and suspended in sterile distilled water. The fungal suspensions were adjusted to approximately 1 × 10⁶ CFU/mL according to the procedure recommended by the National Committee for Clinical Laboratory Standards (NCCLS, 1998) [38].
The minimum inhibitory concentration (MIC) was determined using the broth microdilution method in 96-well microtiter plates, according to the procedure described by Sarker et al. (2007) [39]. Stock solutions of the tested complexes were prepared in 10% DMSO, followed by serial twofold dilutions ranging from 20 to 0.078 mg/mL prior to inoculation. Mueller–Hinton broth and Sabouraud dextrose broth were used as the culture media for bacteria and fungi, respectively. Ten microliters of the standardized bacterial or fungal suspension was added to each well containing 100 µL of the corresponding test mixture, resulting in a final assay volume of 110 µL. Accordingly, the final inoculum densities were approximately 9.1 × 10⁶ CFU/mL for bacteria and 9.1 × 10⁴ CFU/mL for fungi.
Resazurin was used as a viability indicator for the bacterial assay. The plates were incubated at 37 °C for 24 h for bacterial strains and at 28 °C for 72 h for fungal strains. For bacteria, the MIC was defined as the lowest concentration of the tested complex that prevented the color change of resazurin from blue to pink, indicating the absence of detectable bacterial growth. For fungi, the MIC was defined as the lowest concentration at which visible mycelial growth was inhibited.
Streptomycin and ketoconazole were used as positive controls for the bacterial and fungal assays, respectively. Wells containing DMSO at the corresponding concentration were included as solvent controls to assess any potential effect of the solvent on microbial growth.
3.4. Biological Studies
3.4.1. Cell Culture
The cell lines used in this study were purchased from the American Type Culture Collection (ATCC, Manassas, VA, USA) and are maintained within the cell repository at the Institute for Oncology and Radiology of Serbia. A549 (Database Name: American Type Culture Collection (ATCC), Accession Number: CCL-185). MDA-MB-231 (Database Name: American Type Culture Collection (ATCC), Accession Number: HTB-26). LS-174 (Database Name: American Type Culture Collection (ATCC), Accession Number: CCL-188). HeLa (Database Name: American Type Culture Collection (ATCC), Accession Number: CCL-2). MRC-5 (Database Name: American Type Culture Collection (ATCC), Accession Number: CCL-171). Human tumor cell lines derived from lung carcinoma (A549), colon carcinoma (LS-174), breast carcinoma (MDA-MB-231), and cervical carcinoma (HeLa), as well as human non-tumor fetal lung fibroblasts (MRC-5), were maintained as monolayer cultures in RPMI 1640 medium. The medium was prepared in sterile deionized water and supplemented with penicillin (100 IU/mL), streptomycin (200 μg/mL), HEPES buffer (25 mM), L-glutamine (3 mM), and 10% heat-inactivated fetal calf serum (FCS), with the pH adjusted to 7.2. Cells were cultured at 37 °C in a humidified atmosphere containing 5% CO2.
3.4.2. MTT Assay
The cytotoxicity of 1 and 2 was evaluated using the 3-(4,5-dimethylthiazol-2-yl)-2,5-diphenyltetrazolium bromide (MTT) assay, as previously described [40]. Cisplatin (CDDP) was used as a reference compound. Briefly, 24 h after seeding into 96-well cell culture plates (SPL Life Sciences Co., Ltd., Gyeonggi-do, Republic of Korea), the cells were treated with the tested compounds. The complexes were initially dissolved in DMSO at a concentration of 10 mM and subsequently diluted with complete culture medium to the desired concentrations. The final concentration of DMSO did not exceed 1% (v/v). Following 72 h of treatment, 20 μL of MTT solution (5 mg/mL in PBS, pH 7.2) was added to each well. The cells were incubated for an additional 4 h at 37 °C in a humidified atmosphere containing 5% CO2. Subsequently, 100 μL of 10% sodium dodecyl sulfate (SDS) solution was added to each well, and the plates were incubated for 24 h. Absorbance was measured at 570 nm using a Multiskan SkyHigh ELISA reader (Thermo Scientific, Waltham, MA, USA). The IC50 value, defined as the concentration of the tested compound required to inhibit cell growth by 50%, was determined from the corresponding cell viability curves. All in vitro cytotoxicity experiments were performed in three independent experiments (n = 3) for HeLa, LS-174, MRC-5 and MDA-MB-231, and two independent experiments (n = 2), for A549 cells. With each concentration treatment evaluated in triplicate. The data from independent experiments were pooled, and the IC50 values along with their corresponding 95% confidence intervals (95% CI) were determined by non-linear regression analysis (four-parameter logistic curve) using GraphPad Prism 8 software (GraphPad Software, San Diego, CA, USA). To determine the statistical significance of differences in cytotoxic activity between the investigated complexes and CDDP, a one-way analysis of variance (ANOVA) followed by Tukey’s post hoc test was employed. A p-value less than 0.05 (* p < 0.05, ** p < 0.01, *** p < 0.001) was considered statistically significant.
3.4.3. Cell Cycle Analysis
Cell cycle distribution was analyzed in HeLa cells following treatment with complexes 1 and 2 using flow cytometry after propidium iodide (PI) staining [41]. Cells were seeded at a density of 2 × 10⁵ cells per well in six-well plates (SPL Life Sciences Co., Ltd., Gyeonggi-do, Republic of Korea) and allowed to adhere. The cells were subsequently treated with 1 and 2 or CDDP at concentrations corresponding to the respective IC50 and 2 × IC50 values.
After 72 h of treatment, the cells were harvested, washed twice with ice-cold PBS, and fixed overnight in 70% ethanol. Following fixation, the cells were washed with PBS and incubated with RNase A (1 mg/mL) for 30 min at 37 °C. Immediately before flow-cytometric analysis, the cells were stained with PI (400 μg/mL) in the dark. Samples were analyzed using a 2-laser, 6-color LongCyte™ flow cytometer (Challenbio, Beijing, China), and data were processed using ModelFlower software. A minimum of 10,000 events per sample were acquired and analyzed.
3.4.4. Annexin V-FITC/PI Apoptosis Assay
The ability of complexes 1 and 2 to induce apoptotic cell death in HeLa cells was evaluated using an Annexin V-FITC/PI assay with a TACS™ Annexin V-FITC Apoptosis Detection Kit (Cat. No. 4830-250-K; R&D Systems, Minneapolis, MN, USA). Briefly, HeLa cells were seeded at a density of 2 × 10⁵ cells per well in six-well plates (SPL Life Sciences Co., Ltd., Gyeonggi-do, Republic of Korea). After 24 h, the cells were treated with the tested complexes or CDDP. Cells were treated with concentrations corresponding to Table 3. Following 48 h of treatment, the cells were harvested and resuspended in 200 μL of 1× binding buffer (10 mM HEPES/NaOH, pH 7.4, 140 mM NaCl, and 2.5 mM CaCl2).
An aliquot of 100 μL of the cell suspension (approximately 1 × 10⁵ cells) was transferred to a 5 mL round-bottom polystyrene tube (Falcon, Corning, NY, USA) and incubated with 5 μL each of Annexin V-FITC and PI (50 μg/mL in PBS) [42,43]. After incubation for 15 min at 37 °C in the dark, 400 μL of 1× binding buffer was added to each tube. Samples were analyzed using a 2-laser, 6-color LongCyte™ flow cytometer (Challenbio, Beijing, China), and data were processed using ModelFlower software. A minimum of 10,000 events per sample were acquired and analyzed. The gating strategy was established using unstained and single-stained controls (Annexin V-FITC alone and PI alone) to properly set the compensation and quadrant gates distinguishing live (Annexin V−/PI−), early apoptotic (Annexin V+/PI−), late apoptotic/necrotic (Annexin V+/PI+), and dead/necrotic cells (Annexin V−/PI+).
All flow cytometry experiments for the 48 h timepoint were performed in duplicate ((n = 2) independent biological replicates). Data are expressed as mean ± standard deviation (SD). Statistical evaluation and graph generation were performed using GraphPad Prism 8 software (GraphPad Software, San Diego, CA, USA). Statistical significance between the untreated control and treated groups within each cell population was determined using two-way analysis of variance (ANOVA) followed by Dunnett’s post-hoc test. Differences were considered statistically significant at p < 0.05.
3.4.5. Trypan Blue Exclusion Assay
The trypan blue exclusion assay was performed to assess the viability of HeLa cells treated with complexes 1 and 2 and to further evaluate the results obtained from the MTT assay [44]. HeLa cells were treated with the respective IC50 concentrations of complexes 1 and 2 for 24, 48, and 72 h. Following treatment, the cells were harvested and stained with 0.4% trypan blue solution according to the previously described procedure [44]. Cell viability was assessed by light microscopy, and cell numbers were determined using a hemocytometer. Viable cells with intact plasma membranes excluded the dye and appeared clear, whereas non-viable cells stained blue.
3.4.6. Measurement of Intracellular Reactive Oxygen Species (ROS)
Intracellular reactive oxygen species (ROS) levels were determined by flow cytometry using 2′,7′-dichlorodihydrofluorescein diacetate (DCFH-DA; Sigma-Aldrich, St. Louis, MO, USA) as a fluorescent probe [45]. Cells were seeded in six-well plates at a density of 2 × 10⁶ cells per well. After 24 h, the culture medium was replaced with fresh medium containing complexes 1 or 2, or CDDP, at concentrations corresponding to the IC50 and 2 × IC50 values. Cells were then incubated for an additional 72 h.
Following treatment, the cells were harvested, washed twice with ice-cold PBS, and resuspended in 1 mL of 25 μM DCFH-DA solution. Cells were incubated for 30 min at 37 °C in the dark, washed with PBS, and resuspended in 500 μL of PBS. Samples were immediately analyzed by flow cytometry using the FL1 channel. Measurements were performed using a 3-laser, 14-color LongCyte™ flow cytometer (Challenbio, Beijing, China), and data were processed using ModelFlower software (version 314-20240430). The geometric mean fluorescence intensity (Geo Mean) of DCF-dependent fluorescence was determined, with 10,000 cells analyzed per sample.
3.4.7. Morphological Analysis
For morphological analysis, cells were seeded as monolayer cultures in 96-well plates (Thermo Scientific Nunc, Waltham, MA, USA). After 24 h, the cells were treated with the tested complexes or CDDP. Following 72 h of treatment, cellular morphology was examined using a bright-field inverted microscope (Olympus CKX53, Tokyo, Japan) equipped with a 4×0.13 objective. Images were captured using an Olympus EP50 digital camera (Olympus, Tokyo, Japan).
3.4.8. Generation and Analysis of Multicellular Tumor Spheroids
Multicellular tumor spheroids (MCTSs) composed exclusively of HeLa cells were generated as a three-dimensional (3D) cell culture model. Briefly, HeLa cells were seeded at an optimized density of 1000 cells per well in ultra-low-attachment (ULA) 96-well plates (Nunclon Sphera, Thermo Scientific). The cells were cultured in the respective culture medium, and spheroid formation was allowed to proceed for 24 h at 37 °C in a humidified atmosphere containing 5% CO2 [46].
Following spheroid formation, the MCTSs were treated with freshly prepared serial dilutions of complexes 1 and 2 or cisplatin for 72 h. The cytotoxicity of the tested compounds was subsequently evaluated using the MTT assay. Spheroid growth and morphology were examined after 72 h of treatment using a bright-field inverted microscope (Olympus CKX53, Tokyo, Japan) equipped with a 4×0.13 objective. Images were captured using an Olympus EP50 digital camera (Olympus, Tokyo, Japan).
3.5. DNA/HSA Binding Mode
3.5.1. Preparation of HSA and CT-DNA Solutions
Human serum albumin (HSA), calf-thymus DNA (CT-DNA), and analytical-grade reagents were used as received. All solutions were prepared in phosphate-buffered saline (PBS) at physiological pH. The concentration of the CT-DNA stock solution was determined spectrophotometrically at 260 nm using a molar extinction coefficient of ε = 6600 M−1 cm−1. The purity of CT-DNA was assessed from the absorbance ratio at 260 and 280 nm (A260/A280). A ratio of 1.8–1.9 indicated high DNA purity and negligible protein contamination.
3.5.2. Fluorescence Quenching Measurements
The competitive binding interactions of ethidium bromide (EB) or Hoechst with complexes 1 and 2 in the presence of CT-DNA were evaluated using fluorescence spectroscopy. Fluorescence measurements were performed using an excitation wavelength of 527 nm and monitoring emission at 612 nm. Stock solutions of CT-DNA (2.6 mM) and compounds 1 and 2 (1 mM) were prepared in 10 mM PBS (pH 7.4). DNA–compound mixtures were generated by combining the DNA stock with graded concentrations of each compound. For all fluorescence experiments, the final DNA concentration was maintained at 29.5 μM, while the concentration of the compounds varied from 2.95 to 29.5 μM. Samples were equilibrated at room temperature prior to measurement. Emission spectra were recorded over the 550–750 nm range to assess fluorescence changes associated with binding interactions. Fluorescence measurements for the Hoechst–DNA competitive binding assay were recorded using an excitation wavelength of 350 nm and monitoring emission at 460 nm, characteristic of Hoechst 33258 bound to DNA.
The interaction strengths and corresponding binding parameters were evaluated using the Stern–Volmer formalisms Equation (1).
where I0 and I are the emission intensities in the absence and in the presence of the quencher (complexes 1 or 2), respectively, [Q] is the total concentration of quencher, Ksv is the Stern-Volmer quenching constant, which can be obtained from the slope of the plot of I0/I vs.
I0/I = 1+ Ksv[Q]
Fluorescence quenching studies were employed to investigate the binding interactions between human serum albumin (HSA) and the test compounds 1 and 2. This approach monitors changes in the intrinsic fluorescence of the tryptophan residues within HSA upon interaction with potential quenchers. A stock solution of HSA (2 μM) was prepared in 10 mM PBS (pH 7.4), and stock solutions of compounds 1 and 2 were prepared at 1 mM. Increasing concentrations of each compound were introduced to the protein solution, with compound 1 and 2 added up to 2 × 10⁻⁵ M. Fluorescence emission spectra were collected from 300–500 nm using an excitation wavelength of 285 nm, with maximum emission monitored at 358 nm. Under identical conditions, no intrinsic fluorescence was observed for the compounds alone in buffer.
The interaction strengths and corresponding binding parameters were evaluated using the Stern–Volmer and Scatchard formalisms (Equations (2) and (3)).
where I0 = the initial tryptophan fluorescence intensity of HSA, I = the tryptophan fluorescence intensity of HSA after the addition of the quencher, kq = the quenching rate constants of HSA, Ksv = Stern-Volmer quenching constant, τ0 = the average lifetime of HSA without the quencher, [Q] = the concentration of the quencher respectively. Ksv (M−1) can be obtained by the slope of the diagram I0/I vs., taking as fluorescence lifetime (τ0) of tryptophan in HSA at around 10−8 s [Q] (Stern-Volmer plots), and subsequently the approximate kq (M−1 s−1) may be calculated.
I0/I = 1 + kq τ0 [Q] = 1 + Ksv[Q]
From Scatchard equation:
where, Kb and n are the binding constant and the number of the binding sites, respectively. The number of the binding sites and the binding constant have been obtained from the slope and intercept of the linear plot of log[(I0 − I)/I] vs. log [Q].
log (I0 − I/I) = log Kb + n log [Q]
Competitive site-marker experiments were also performed to elucidate the preferred binding regions of compounds 1 and 2 on HSA. Eosin Y (a marker for site I, subdomain IIA) and ibuprofen (a marker for site II, subdomain IIIA) were examined as reference ligands. Fluorescence spectra were recorded with an excitation wavelength of 295 nm and an emission range of 300–500 nm. HSA and each marker were present at equimolar concentrations (2.0 × 10⁻⁶ M). For the competition studies, compounds 1 and 2 were added incrementally up to 2 × 10⁻⁵ M in the eosin Y system and for the ibuprofen system. The resulting fluorescence changes were used to assess competitive binding at the two primary ligand-binding sites of HSA.
3.5.3. Viscosity Measurement
Samples with a constant DNA concentration (20 µM) and varying concentrations of complexes and EB (2–20 µM) were prepared to obtain different ratios of [complex or EB]/[DNA] (0, 0.1, 0.2, 0.3, 0.4, 0.5, 0.6, 0.7, 0.8, 0.9, and 1). The viscosity of the DNA solution alone was first measured and taken as η0, after which the viscosity of each sample (η) was measured separately at 25 °C. The cube root of the relative viscosity, (η/η0)1/3, was then plotted as a function of the concentration ratio. All measurements were conducted at Aton Paar (Austria).
3.5.4. Molecular Docking Simulation
To investigate the ability of complexes 1 and 2 to inhibit the DNA molecule and the HSA molecule, the molecular docking analysis was employed. The geometries of both complexes, which were considered as ligands in this analysis, were first optimized using the Gaussian 16 software package. [47] For that purpose, the B3LYP functional in combination with 6-311++G(d,p) basis set was used for C, H, S and Cl atoms, while Fe(II) and Ru(II) was estimated using LANL2TZ(f) basis set. [48] It was confirmed that the geometries optimized in the vacuum correspond to an energy minimum by the absence of imaginary frequencies.
The molecular docking analysis was performed using AutoDock 4.2 and the AMDock software packages. [49,50] The preparation of target molecules for molecular docking analysis, which involved the removal of water molecules and the corresponding ligands from the initial target molecular structures, was done using BIOVIA Discovery Studio. [51] To investigate the ability of complexes 1 and 2 to inhibit the DNA molecule, the DNA sequence was retrieved from the Protein Data Bank (PDB ID: 1M6F). [52] The possibility of inhibiting this DNA sequence throughout its entire volume was examined by using a grid box with its center positioned at coordinates 14.255 Å × 20.566 Å × 8.796 Å along the x, y, and z axes of the coordinate system and with dimensions of 66 × 66 × 126 npts. In order to examine the possibility of inhibiting the HSA molecule by the complexes 1 and 2 considered here, the structure of the HSA molecule with PDB ID: 7DJN was retrieved from the PDB database. [53] Bearing in mind that the HSA molecule is significantly larger than the aforementioned DNA sequence, and in order to rationalize the time required for molecular docking analysis, the active site of this target was determined using the AGFR program. [54] The grid box defined in this way was used for the molecular docking analysis and had dimensions of 64 × 54 × 54 npts and a center with coordinates of 15.002 Å × 23.113 Å × 20.023 Å relative to the x, y, and z axes of the coordinate system. In all cases, a point spacing of 0.375 Å was used. To predict the most favourable receptor–ligand binding position, as well as the energy of binding, the Lamarckian genetic algorithm was used. [55] In this process, the ligand structure was treated as flexible, whereas the structure of the target molecule was considered rigid.
3.6. HPLC Purity
The purity of compounds was verified by HPLC using a PerkinElmer Flexar system equipped with a UV/Vis detector and autosampler. Separation was performed on a C18 column (4.6 × 100 mm, 3.5 µm particle size) at a flow rate of 1.0 mL min−1, with an injection volume of 10 µL (Figure S12). The mobile phase consisted of acetonitrile (A) and water (B) containing 0.5% HCOOH. Following a 1 min equilibration period (10% A/90% B), a two-step gradient program was applied: 20% A/80% B (step 1, 5 min) and 90% A/10% B (step 2, 6 min).
4. Conclusions
In this study, two new half-sandwich Ru(II)-p-cymene complexes bearing ferrocenyl thioether ligands, 1 and 2, were successfully synthesized by a straightforward ligand substitution reaction under mild conditions and fully characterized by NMR, FT-IR, and HRMS analyses, confirming the proposed molecular structures. The simple synthetic procedure, together with the good isolated yields and high purity of the products, demonstrates the suitability of this ligand platform for the preparation of biologically relevant ruthenium organometallic compounds.
Both complexes inhibited all bacterial and fungal strains included in the tested panel, with Staphylococcus aureus being the most susceptible microorganism. However, their MIC values were substantially higher than those of the reference antimicrobial agents, indicating modest antimicrobial potency under the present experimental conditions. Although their activity remained lower than that of the reference antimicrobial agents, the results confirm that incorporation of the ferrocenyl thioether ligand into the Ru(II)-p-cymene framework affords compounds with reproducible and biologically relevant antimicrobial properties. The slightly enhanced antifungal activity of complex 2 further indicates that subtle structural modifications, such as elongation of the alkyl spacer, can influence biological performance.
The investigated complexes also demonstrated significant in vitro antiproliferative activity against several human cancer cell lines. Mechanistic studies revealed that their biological activity differs substantially from that of the platinum drug. Cell-cycle analysis indicated only moderate perturbation of cell-cycle progression accompanied by an increase in the sub-G1 population, whereas Annexin V/PI staining, morphological evaluation, Trypan blue exclusion, and ROS measurements consistently demonstrated that the complexes predominantly exert a cytostatic rather than strongly cytotoxic effect. The absence of apoptosis and only moderate oxidative stress suggest that inhibition of cell proliferation is mediated through alternative, non-classical pathways characteristic of many Ru(II)–arene complexes. Nevertheless, the comparable levels of cytotoxicity observed in tumor cell lines and normal fibroblasts indicate a lack of selectivity toward tumor cells, while the absence of activity in the three-dimensional spheroid model suggests that further structural optimization is necessary to improve the therapeutic potential of these compounds.
Biophysical studies demonstrated that both complexes interact only weakly to moderately with DNA and do not behave as classical intercalators. The combined fluorescence displacement, viscosity, and molecular docking results consistently support a groove-associated and predominantly external binding mode stabilized by hydrophobic, π-mediated, and electrostatic interactions. In contrast, both compounds exhibited moderate-to-high affinity toward human serum albumin, with binding constants favorable for reversible protein transport under physiological conditions. Interestingly, although the complexes differ only by a single methylene unit in the ligand spacer, they displayed different albumin binding-site preferences, highlighting the influence of subtle structural modifications on protein recognition while preserving overall affinity.
Overall, the present work demonstrates that ferrocenyl thioether-functionalized Ru(II)-p-cymene complexes combine favorable synthetic accessibility with broad biological activity and distinct biomolecular interaction profiles. The multimodal behavior observed in this study—including antimicrobial activity, pronounced antiproliferative effects, non-classical cellular responses, weak DNA association, and efficient albumin binding—supports the potential of this class of organometallic compounds as promising scaffolds for further medicinal chemistry development. Future investigations should focus on detailed elucidation of their molecular mechanisms of action, optimization of structure–activity relationships to improve potency and selectivity, evaluation against multidrug-resistant microorganisms and advanced tumor models, and in vivo pharmacokinetic and efficacy studies.
Supplementary Materials
The following supporting information can be downloaded at https://www.mdpi.com/article/10.3390/ph19111756/s1, Figure S1: IR spectrum of complex 1; Figure S2: IR spec-trum of complex 2; Figures S3 and S4: NMR spectra of compex 1; Figures S5 and S6: NMR spectra of complex 2; Figure S7: HRMS spectrum of complex 1; Figure S8: HRMS spectrum of complex 2; Figure S9: UV−vis spectra of complexes 1 and 2; Figure S10: Effect of complexes 1 and 2 on cell cycle progression in HeLa cells following 72 h continual action; Figure S11: The mi-crographs presenting HeLa cells treated with investigated complexes 1 and 2 and CDDP after 72 h of treatment. Figure S12: Chromatograms of complex 1.
Author Contributions
N.J.: Methodology, formal analysis, data curation, investigation, writing—original draft, and writing—review & editing. L.M.: Formal analysis, data curation, and investigation. D.S.: Investigation, formal analysis, and data curation. N.G.: Writing—original draft, methodology, investigation, and data curation. J.M.: Methodology, formal analysis, data curation, investigation, and writing—original draft. M.K.: Methodology and writing—original draft. S.J.: Methodology, investigation, and software. A.R.S.: Writing—review & editing, writing—original draft, visualization, validation, supervision, resources, methodology, investigation, funding acquisition, and conceptualization. All authors have read and agreed to the published version of the manuscript.
Funding
This research was funded by the Ministry of Science, Technological Development and Innovation of the Republic of Serbia (grant number 451-03-33/2026-03/200378, 451-03-68/2022-14/200043 and 451-03-33/2026-03/200122).
Institutional Review Board Statement
Not applicable.
Informed Consent Statement
Not applicable.
Data Availability Statement
The original contributions presented in this study are included in the article/Supplementary Material. Further inquiries can be directed to the corresponding author.
Acknowledgments
The authors employed GPT 5.6 Sol (OpenAI, San Francisco, CA, USA) to enhance the overall readability of the English in the manuscript, grammar, and clarity when preparing this article. Following the use of this service, the authors thoroughly examined and made any necessary revisions to the text; they are solely responsible for the publication’s accuracy and final content.
Conflicts of Interest
The authors declare no conflicts of interest.
References
- Gasser, G.; Metzler-Nolte, N. The potential of organometallic complexes in medicinal chemistry. Curr. Opin. Chem. Biol. 2012, 16, 84–91. [Google Scholar] [CrossRef] [Scilit] [PubMed]
- Alessio, E. Thirty years of the drug candidate NAMI-A and the myths in the field of ruthenium anticancer compounds: A personal perspective. Eur. J. Inorg. Chem. 2017, 2017, 1549–1560. [Google Scholar] [CrossRef] [Scilit]
- Süss-Fink, G. Arene ruthenium complexes as anticancer agents. Dalton Trans. 2010, 39, 1673–1688. [Google Scholar] [CrossRef] [Scilit] [PubMed]
- Jaouen, G.; Vessières, A.; Top, S. Ferrocifen type anti cancer drugs. Chem. Soc. Rev. 2015, 44, 8802–8817. [Google Scholar] [CrossRef] [Scilit] [PubMed]
- Allison, M.; Caramés-Méndez, P.; Hofmann, B.J.; Pask, C.M.; Phillips, R.M.; Lord, R.M.; McGowan, P.C. Cytotoxicity of Ruthenium(II) Arene Complexes Containing Functionalized Ferrocenyl β-Diketonate Ligands. Organometallics 2023, 42, 1869–1881. [Google Scholar] [CrossRef] [Scilit] [PubMed]
- Camm, K.D.; El-Sokkary, A.; Gott, A.L.; Stockley, P.G.; Belyaeva, T.; McGowan, P.C. Synthesis, molecular structure and evaluation of new organometallic ruthenium anticancer agents. Dalton Trans. 2009, 38, 10914–10925. [Google Scholar] [CrossRef] [Scilit] [PubMed]
- Zeng, L.; Gupta, P.; Chen, Y.; Wang, E.; Ji, L.; Chao, H.; Chen, Z.S. The development of anticancer ruthenium(II) complexes: From single molecule compounds to nanomaterials. Chem. Soc. Rev. 2017, 46, 5771–5804. [Google Scholar] [CrossRef] [Scilit] [PubMed]
- Patra, M.; Gasser, G. The medicinal chemistry of ferrocene and its derivatives. Nat. Rev. Chem. 2017, 1, 0066. [Google Scholar] [CrossRef] [Scilit]
- Denny, W.A. Prodrug strategies in cancer therapy. Eur. J. Med. Chem. 2001, 36, 577–595. [Google Scholar] [CrossRef] [Scilit] [PubMed]
- Gasser, G.; Ott, I.; Metzler-Nolte, N. Organometallic anticancer compounds. J. Med. Chem. 2011, 54, 3–25. [Google Scholar] [CrossRef] [Scilit] [PubMed]
- Mu, C.; Prosser, K.E.; Harrypersad, S.; MacNeil, G.A.; Panchmatia, R.; Thompson, J.R.; Sinha, S.; Warren, J.J.; Walsby, C.J. Activation by oxidation: Ferrocene-functionalized Ru(II)-arene complexes with anticancer, antibacterial, and antioxidant properties. Inorg. Chem. 2018, 57, 15247–15261. [Google Scholar] [CrossRef] [Scilit] [PubMed]
- Milutinović, M.M.; Čanović, P.P.; Stevanović, D.; Masnikosa, R.; Vraneš, M.; Tot, A.; Zarić, M.M.; Simović Marković, B.; Misirkić Marjanović, M.; Vučićević, L.; et al. Newly synthesized heteronuclear ruthenium(II)/ferrocene complexes suppress the growth of mammary carcinoma in 4T1-treated BALB/c mice by promoting activation of antitumor immunity. Organometallics 2018, 37, 4250–4266. [Google Scholar] [CrossRef] [Scilit]
- Sharma, B.; Shukla, S.; Rattan, R.; Fatima, M.; Goel, M.; Bhat, M.; Dutta, S.; Ranjan, R.K.; Sharma, M. Antimicrobial agents based on metal complexes: Present situation and future prospects. Int. J. Biomater. 2022, 2022, 6819080. [Google Scholar] [CrossRef] [Scilit] [PubMed]
- Wagner, G.; Korenkov, V.; Judy, J.D.; Bertsch, P.M. Nanoparticles composed of Zn and ZnO inhibit Peronospora tabacina spore germination in vitro and P. tabacina infectivity on tobacco leaves. Nanomaterials 2016, 6, 50. [Google Scholar] [CrossRef] [Scilit] [PubMed]
- Evans, A.; Kavanagh, K.A. Evaluation of metal-based antimicrobial compounds for the treatment of bacterial pathogens. J. Med. Microbiol. 2021, 70, 001363. [Google Scholar] [CrossRef] [Scilit] [PubMed]
- Frei, A.; Verderosa, A.D.; Elliott, A.G.; Zuegg, J.; Blaskovich, M.A. Metals to combat antimicrobial resistance. Nat. Rev. Chem. 2023, 7, 202–224. [Google Scholar] [CrossRef] [Scilit] [PubMed]
- Mensah, S.; Rosenthal, J.; Dagar, M.; Brown, T.; Mills, J.; Hamaker, C.; Ferrence, G.; Webb, M. A Ru(II)-arene-ferrocene complex with promising antibacterial activity. Dalton Trans. 2022, 51, 17609–17619. [Google Scholar] [CrossRef] [Scilit] [PubMed]
- Bollinger, T.; Murphy, B.; Dagar, M.; Hacker, R.; Oskard, S.; Brennessel, W.; Webb, M. Two perfectly cromulent ferrocene containing ruthenium(II)-arene antibacterial agents. Can. J. Chem. 2025, 103, 880–889. [Google Scholar] [CrossRef] [Scilit]
- Munteanu, A.; Uivaroși, V. Ruthenium complexes in the fight against pathogenic microorganisms. An extensive review. Pharmaceutics 2021, 13, 874. [Google Scholar] [CrossRef] [Scilit] [PubMed]
- Li, F.; Collins, J.; Keene, F. Ruthenium complexes as antimicrobial agents. Chem. Soc. Rev. 2015, 44, 2529–2542. [Google Scholar] [CrossRef] [Scilit] [PubMed]
- Varney, A.; Smitten, K.; Thomas, J.; McLean, S. Transcriptomic analysis of the activity and mechanism of action of a ruthenium(II)-based antimicrobial that induces minimal evolution of pathogen resistance. ACS Pharmacol. Transl. Sci. 2021, 4, 168–178. [Google Scholar] [CrossRef] [Scilit] [PubMed]
- Namiecińska, E.; Grazul, M.; Sadowska, B.; Więckowska-Szakiel, M.; Hikisz, P.; Pasternak, B.; Budzisz, E. Arene–ruthenium(II) complexes with carbothiamidopyrazoles as a potential alternative for antibiotic resistance in human. Molecules 2022, 27, 468. [Google Scholar] [CrossRef] [Scilit] [PubMed]
- Tao, R.; Lu, Y.; Xia, W.; Zhang, C.; Wang, C. Characterization and antibacterial activity of ruthenium-based shikimate cross-linked chitosan composites. Int. J. Biol. Macromol. 2022, 217, 890–901. [Google Scholar] [CrossRef] [Scilit] [PubMed]
- Huang, H.Y.; Wang, Q.; Zhang, C.Y.; Chen, Z.X.; Wang, J.T.; Liao, X.W.; Yu, R.J.; Xiong, Y.S. Synthesis and biological evaluation of ruthenium complexes containing phenylseleny against Gram-positive bacterial infection by damage membrane integrity and avoid drug-resistance. J. Inorg. Biochem. 2023, 242, 112175. [Google Scholar] [CrossRef] [Scilit] [PubMed]
- Wang, L.; Liu, L.; Wang, X.; Tan, Y.; Duan, X.; Zhang, C.; Cheng, J.; Xiong, Y.; Jiang, G.; Wang, J.; et al. Ruthenium(II) complexes targeting membrane as biofilm disruptors and resistance breakers in Staphylococcus aureus bacteria. Eur. J. Med. Chem. 2022, 238, 114485. [Google Scholar] [CrossRef] [Scilit] [PubMed]
- Bolhuis, A.; Hand, L.; Marshall, J.; Richards, A.; Rodger, A.; Aldrich-Wright, J. Antimicrobial activity of ruthenium-based intercalators. Eur. J. Pharm. Sci. 2011, 42, 313–317. [Google Scholar] [CrossRef] [Scilit] [PubMed]
- Jabłońska-Wawrzycka, A.; Rogala, P.; Czerwonka, G.; Hodorowicz, M.; Kalinowska-Tłuścik, J.; Karpiel, M. Chloride and acetonitrile ruthenium(IV) complexes: Crystal architecture, chemical characterization, antibiofilm activity, and bioavailability in biological systems. Molecules 2025, 30, 564. [Google Scholar] [CrossRef] [Scilit] [PubMed]
- Janković, N.; Bogdanović, G.A.; Gligorijević, N.; Milović, L.; Međedović, M.; Matić, J.; Kosanić, M.; Vraneš, M.; Rilak Simović, A. Novel organoruthenium complexes containing β-diketonates: Synthesis, characterization, DNA/HSA interactions, and the impact of biocompatible ionic liquids on biological activities. J. Inorg. Biochem. 2025, 270, 112941. [Google Scholar] [CrossRef] [Scilit] [PubMed]
- Nikolić, S.; Rangasamy, L.; Gligorijević, N.; Aranđelović, S.; Radulović, S.; Gasser, G.; Grgurić-Šipka, S. Synthesis, characterization and biological evaluation of novel Ru(II)–arene complexes containing intercalating ligands. J. Inorg. Biochem. 2016, 160, 156–165. [Google Scholar] [CrossRef] [Scilit] [PubMed]
- Costa, E.C.; Moreira, A.F.; de Melo-Diogo, D.; Gaspar, V.M.; Carvalho, M.P.; Correia, I.J. 3D tumor spheroids: An overview on the tools and techniques used for their analysis. Biotechnol. Adv. 2016, 34, 1427–1441. [Google Scholar] [CrossRef] [Scilit] [PubMed]
- Huang, H.; Zhang, P.; Chen, Y.; Ji, L.; Chao, H. Labile ruthenium(II) complexes with extended phenyl-substituted terpyridyl ligands: Synthesis, aquation and anticancer evaluation. Dalton Trans. 2015, 44, 15602–15610. [Google Scholar] [CrossRef] [Scilit] [PubMed]
- Minchinton, A.I.; Tannock, I.F. Drug penetration in solid tumours. Nat. Rev. Cancer 2006, 6, 583–592. [Google Scholar] [CrossRef] [Scilit] [PubMed]
- Łęczkowska, A.; Vilar, R. Interaction of metal complexes with nucleic acids. Annu. Rep. Prog. Chem. Sect. A Inorg. Chem. 2013, 109, 299–316. [Google Scholar] [CrossRef] [Scilit]
- Pages, B.J.; Ang, D.L.; Wright, E.P.; Aldrich-Wright, J.R. Metal complex interactions with DNA. Dalton Trans. 2015, 44, 3505–3526. [Google Scholar] [CrossRef] [Scilit] [PubMed]
- Kellett, A.; Molphy, Z.; Slator, C.; McKee, V.; Farrell, N.P. Molecular methods for assessment of non-covalent metallodrug–DNA interactions. Chem. Soc. Rev. 2019, 48, 971–988. [Google Scholar] [CrossRef] [Scilit] [PubMed]
- Hartinger, C.G.; Dyson, P.J. Bioorganometallic chemistry—From teaching paradigms to medicinal applications. Chem. Soc. Rev. 2009, 38, 391–401. [Google Scholar] [CrossRef] [Scilit] [PubMed]
- Zeglis, B.M.; Pierre, V.C.; Barton, J.K. Metallo-intercalators and metallo-insertors. Chem. Commun. 2007, 43, 4565–4579. [Google Scholar] [CrossRef] [Scilit] [PubMed]
- NCCLS (National Committee for Clinical Laboratory Standards). Reference Method for Broth Dilution Antifungal Susceptibility Testing of Conidium-Forming Filamentous Fungi; Proposed Standard M38-P; NCCLS: Wayne, PA, USA, 1998. [Google Scholar]
- Sarker, S.D.; Nahar, L.; Kumarasamy, Y. Microtitre plate-based antibacterial assay incorporating resazurin as an indicator of cell growth, and its application in the in vitro antibacterial screening of phytochemicals. Methods 2007, 42, 321–324. [Google Scholar] [CrossRef] [Scilit] [PubMed]
- Supino, R. MTT Assays. In In Vitro Toxicity Testing Protocols; O’Hare, S., Atterwill, C.K., Eds.; Humana Press: Totowa, NJ, USA, 1995; pp. 137–149. [Google Scholar]
- Ormerod, M.G. Flow Cytometry: A Practical Approach; Oxford University Press: New York, NY, USA, 1994. [Google Scholar]
- BD Biosciences. FITC Annexin V Apoptosis Detection Kit I. Available online: https://www.bdbiosciences.com/en-eu/products/reagents/flow-cytometry-reagents/research-reagents/panels-multicolor-cocktails-ruo/fitc-annexin-v-apoptosis-detection-kit-i.556547 (accessed on 2 October 2026).
- van Engeland, M.; Nieland, L.J.W.; Ramaekers, F.C.S.; Schutte, B.; Reutelingsperger, C.P.M. Annexin V-affinity assay: A review on an apoptosis detection system based on phosphatidylserine exposure. Cytometry 1998, 31, 1–9. [Google Scholar]
- Strober, W. Trypan blue exclusion test of cell viability. Curr. Protoc. Immunol. 2015, 111, A.3B.1–A.3B.2. [Google Scholar] [CrossRef] [Scilit] [PubMed]
- Eruslanov, E.; Kusmartsev, S. Identification of ROS using oxidized DCFDA and flow-cytometry. Methods Mol. Biol. 2010, 594, 57–72. [Google Scholar] [CrossRef] [Scilit] [PubMed]
- Savić, A.; Gligorijević, N.; Aranđelović, S.; Dojčinović, B.; Kaczmarek, A.M.; Radulović, S.; Van Deun, R.; Van Hecke, K. Antitumor activity of organoruthenium complexes with chelate aromatic ligands, derived from 1,10-phenantroline: Synthesis and biological activity. J. Inorg. Biochem. 2020, 202, 110869. [Google Scholar] [CrossRef] [Scilit] [PubMed]
- Frisch, M.J.; Trucks, G.W.; Schlegel, H.B.; Scuseria, G.E.; Robb, M.A.; Cheeseman, J.R.; Scalmani, G.; Barone, V.; Petersson, G.A.; Nakatsuji, H.; et al. Gaussian; Gaussian, Inc.: Wallingford, CT, USA, 2019. [Google Scholar]
- Pritchard, B.P.; Altarawy, D.; Didier, B.; Gibson, T.D.; Windus, T.L. New Basis Set Exchange: An open, up-to-date resource for the molecular sciences community. J. Chem. Inf. Model. 2019, 59, 4814–4820. [Google Scholar] [CrossRef] [Scilit] [PubMed]
- Morris, G.M.; Huey, R.; Lindstrom, W.; Sanner, M.F.; Belew, R.K.; Goodsell, D.S.; Olson, A.J. AutoDock4 and AutoDockTools4: Automated docking with selective receptor flexibility. J. Comput. Chem. 2009, 30, 2785–2791. [Google Scholar] [CrossRef] [Scilit] [PubMed]
- Valdés-Tresanco, M.S.; Valdés-Tresanco, M.E.; Valiente, P.A.; Moreno, E. AMDock: A versatile graphical tool for assisting molecular docking with Autodock Vina and Autodock4. Biol. Direct 2020, 15, 12. [Google Scholar] [CrossRef] [Scilit] [PubMed]
- BIOVIA. Discovery Studio Modeling Environment; Dassault Systèmes: San Diego, CA, USA, 2025. [Google Scholar]
- Nguyen, B.; Lee, M.P.H.; Hamelberg, D.; Joubert, A.; Bailly, C.; Brun, R.; Neidle, S.; Wilson, W.D. Strong binding in the DNA minor groove by an aromatic diamidine with a shape that does not match the curvature of the groove. J. Am. Chem. Soc. 2002, 124, 13680–13681. [Google Scholar] [CrossRef] [Scilit] [PubMed]
- Berman, H.; Henrick, K.; Nakamura, H. Announcing the worldwide Protein Data Bank. Nat. Struct. Mol. Biol. 2003, 10, 980. [Google Scholar] [CrossRef] [Scilit] [PubMed]
- Zhang, Y.; Forli, S.; Omelchenko, A.; Sanner, M.F. AutoGridFR: Improvements on AutoDock affinity maps and associated software tools. J. Comput. Chem. 2019, 40, 2882–2886. [Google Scholar] [CrossRef] [Scilit] [PubMed]
- Morris, G.M.; Goodsell, D.S.; Halliday, R.S.; Huey, R.; Hart, W.E.; Belew, R.K.; Olson, A.J. Automated docking using a Lamarckian genetic algorithm and an empirical binding free energy function. J. Comput. Chem. 1998, 19, 1639–1662. [Google Scholar] [CrossRef] [Scilit]
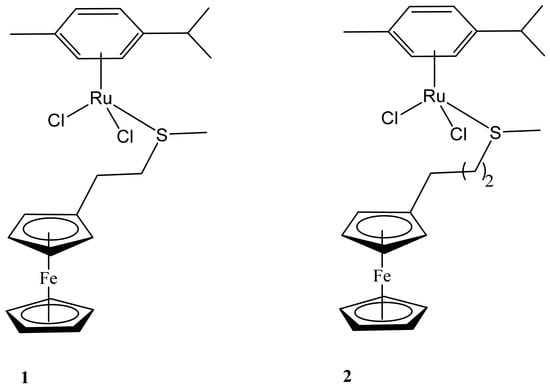
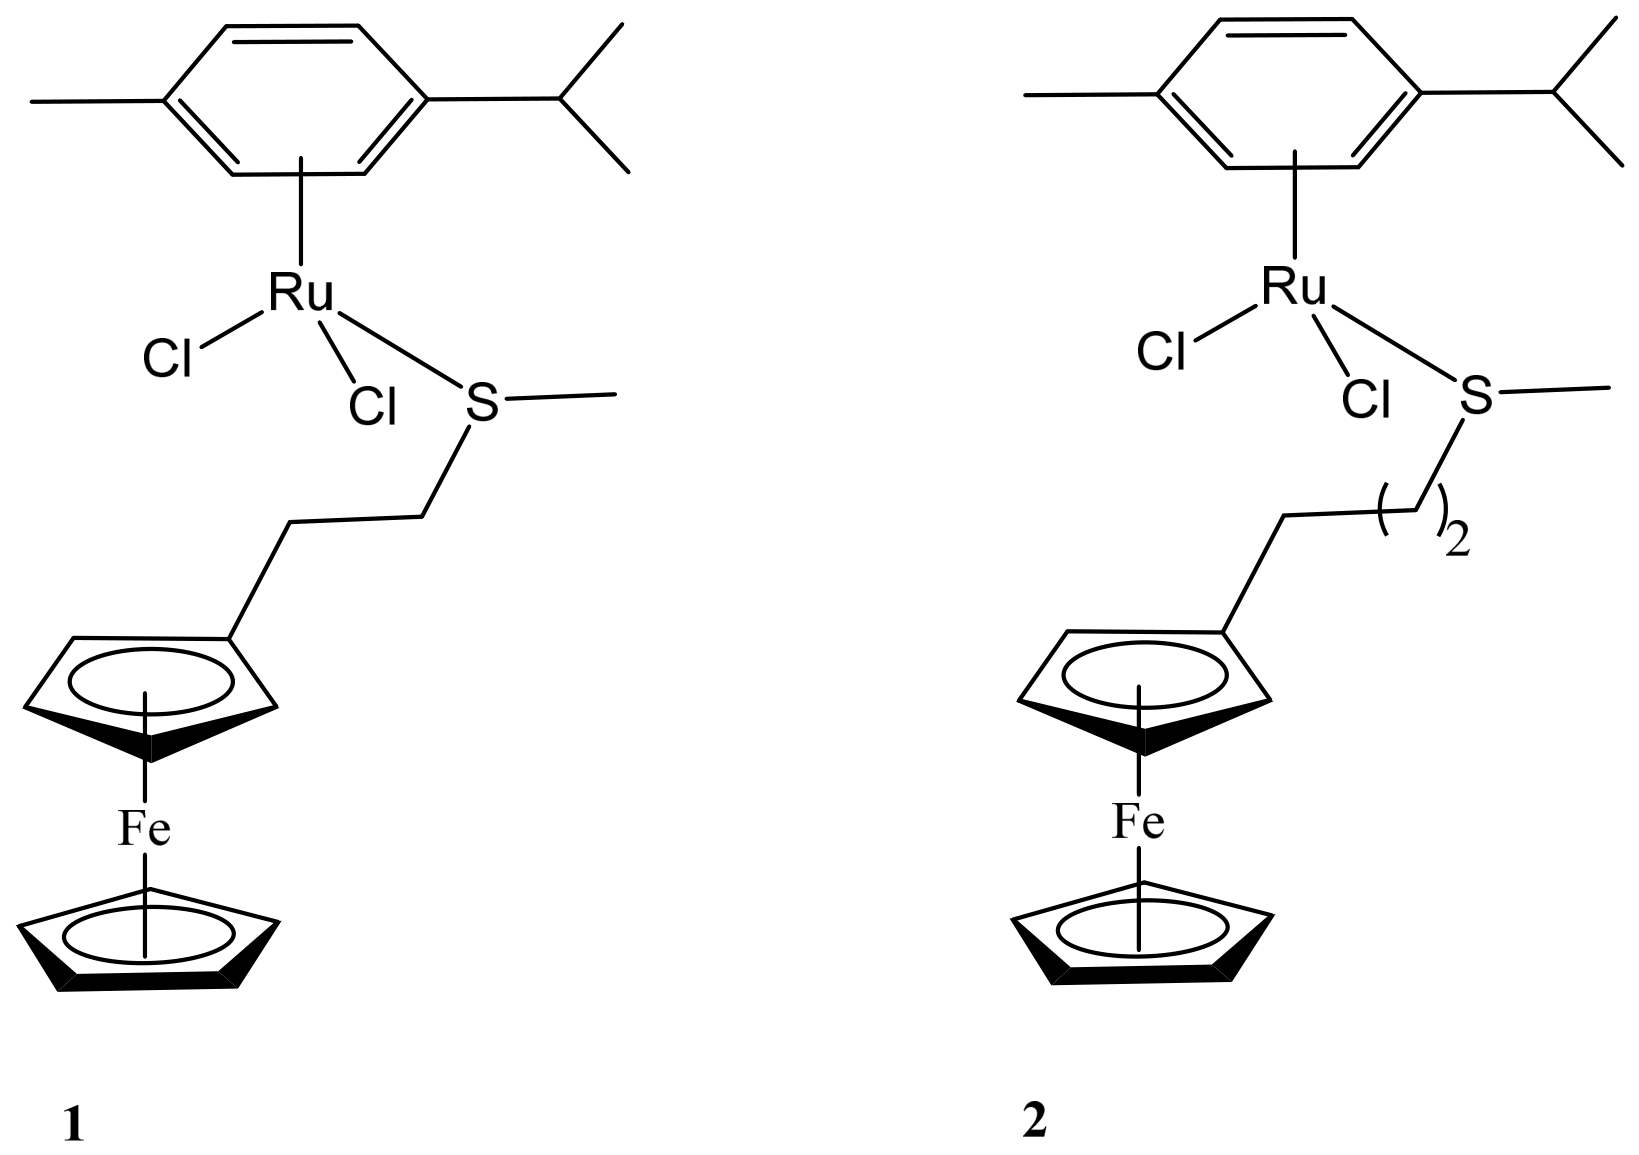
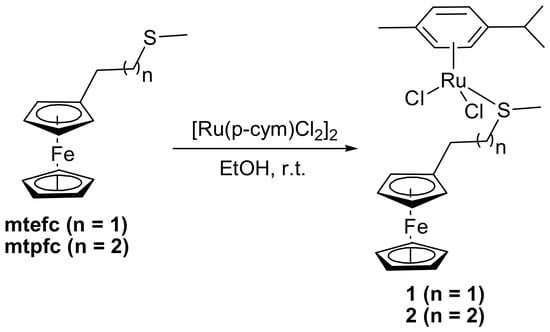
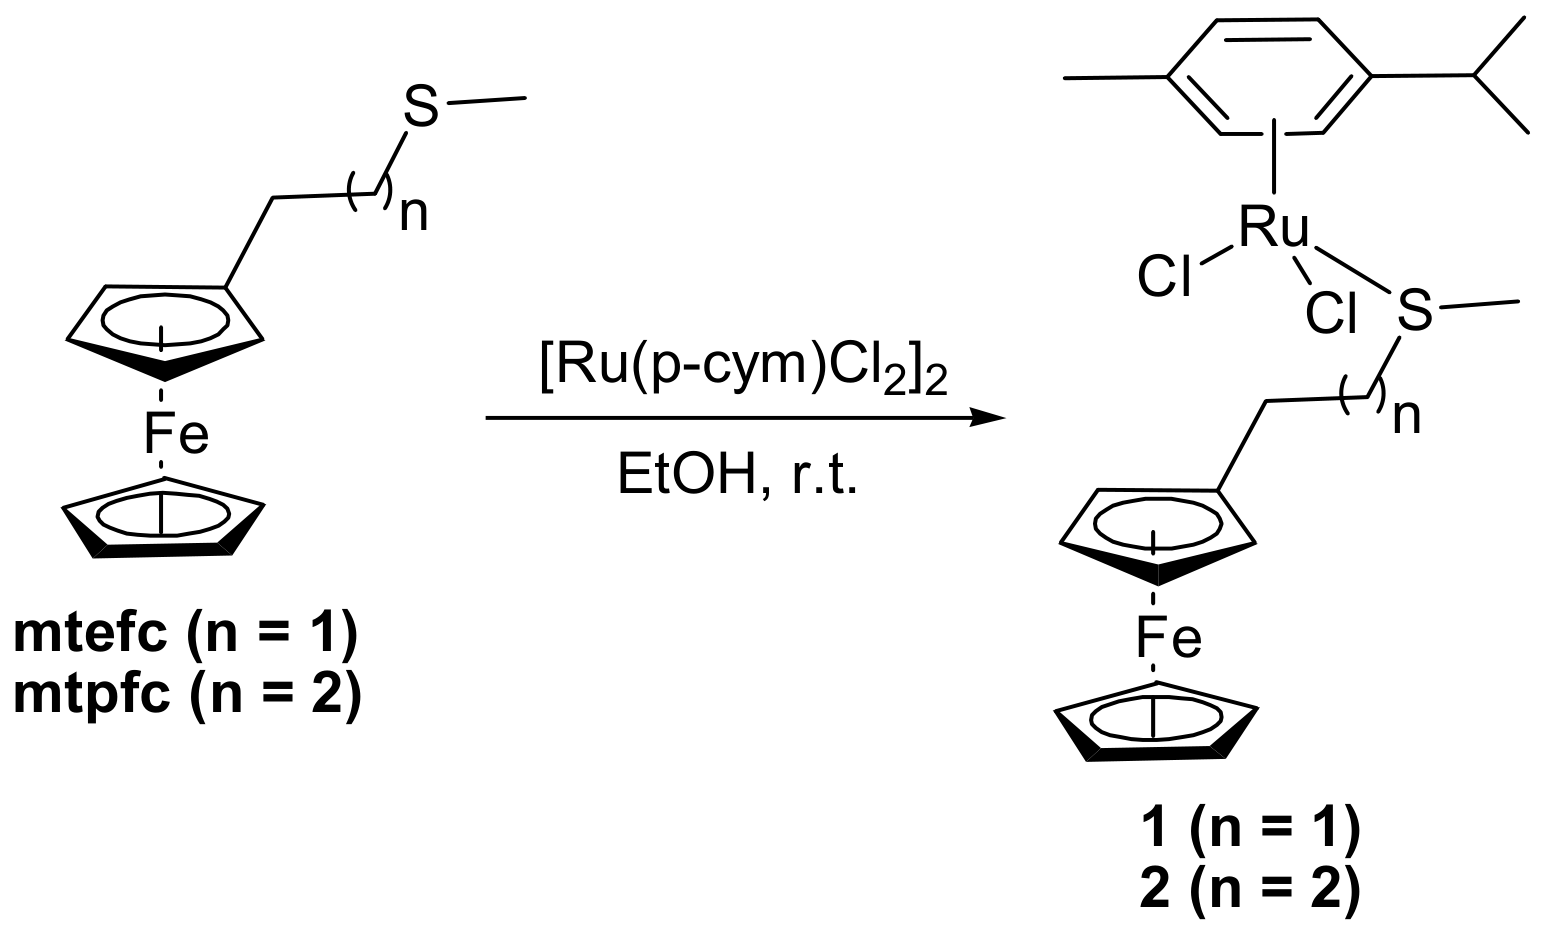
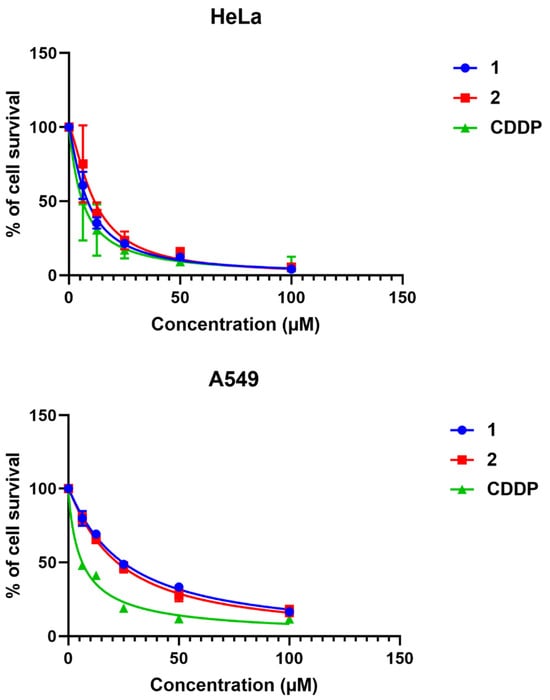
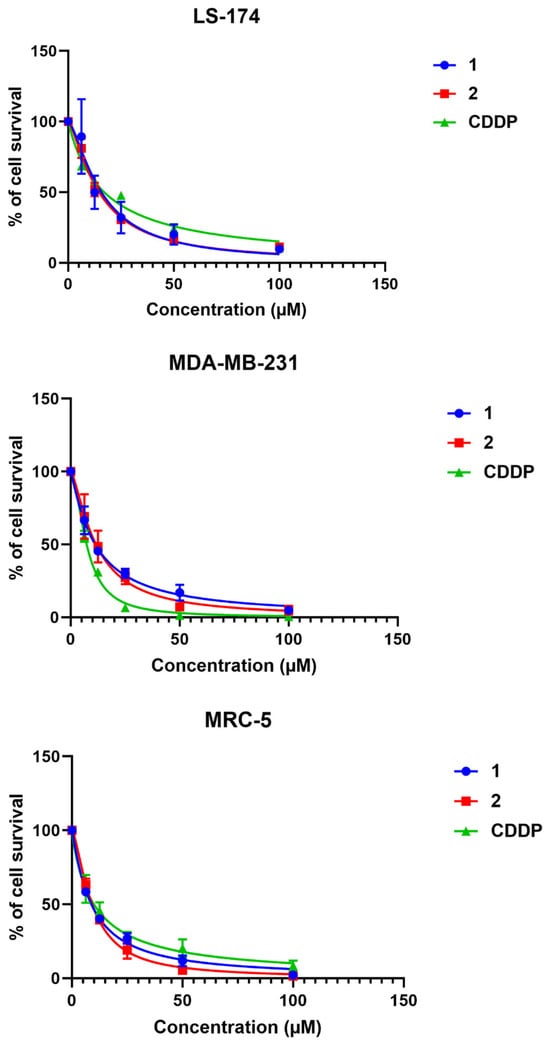
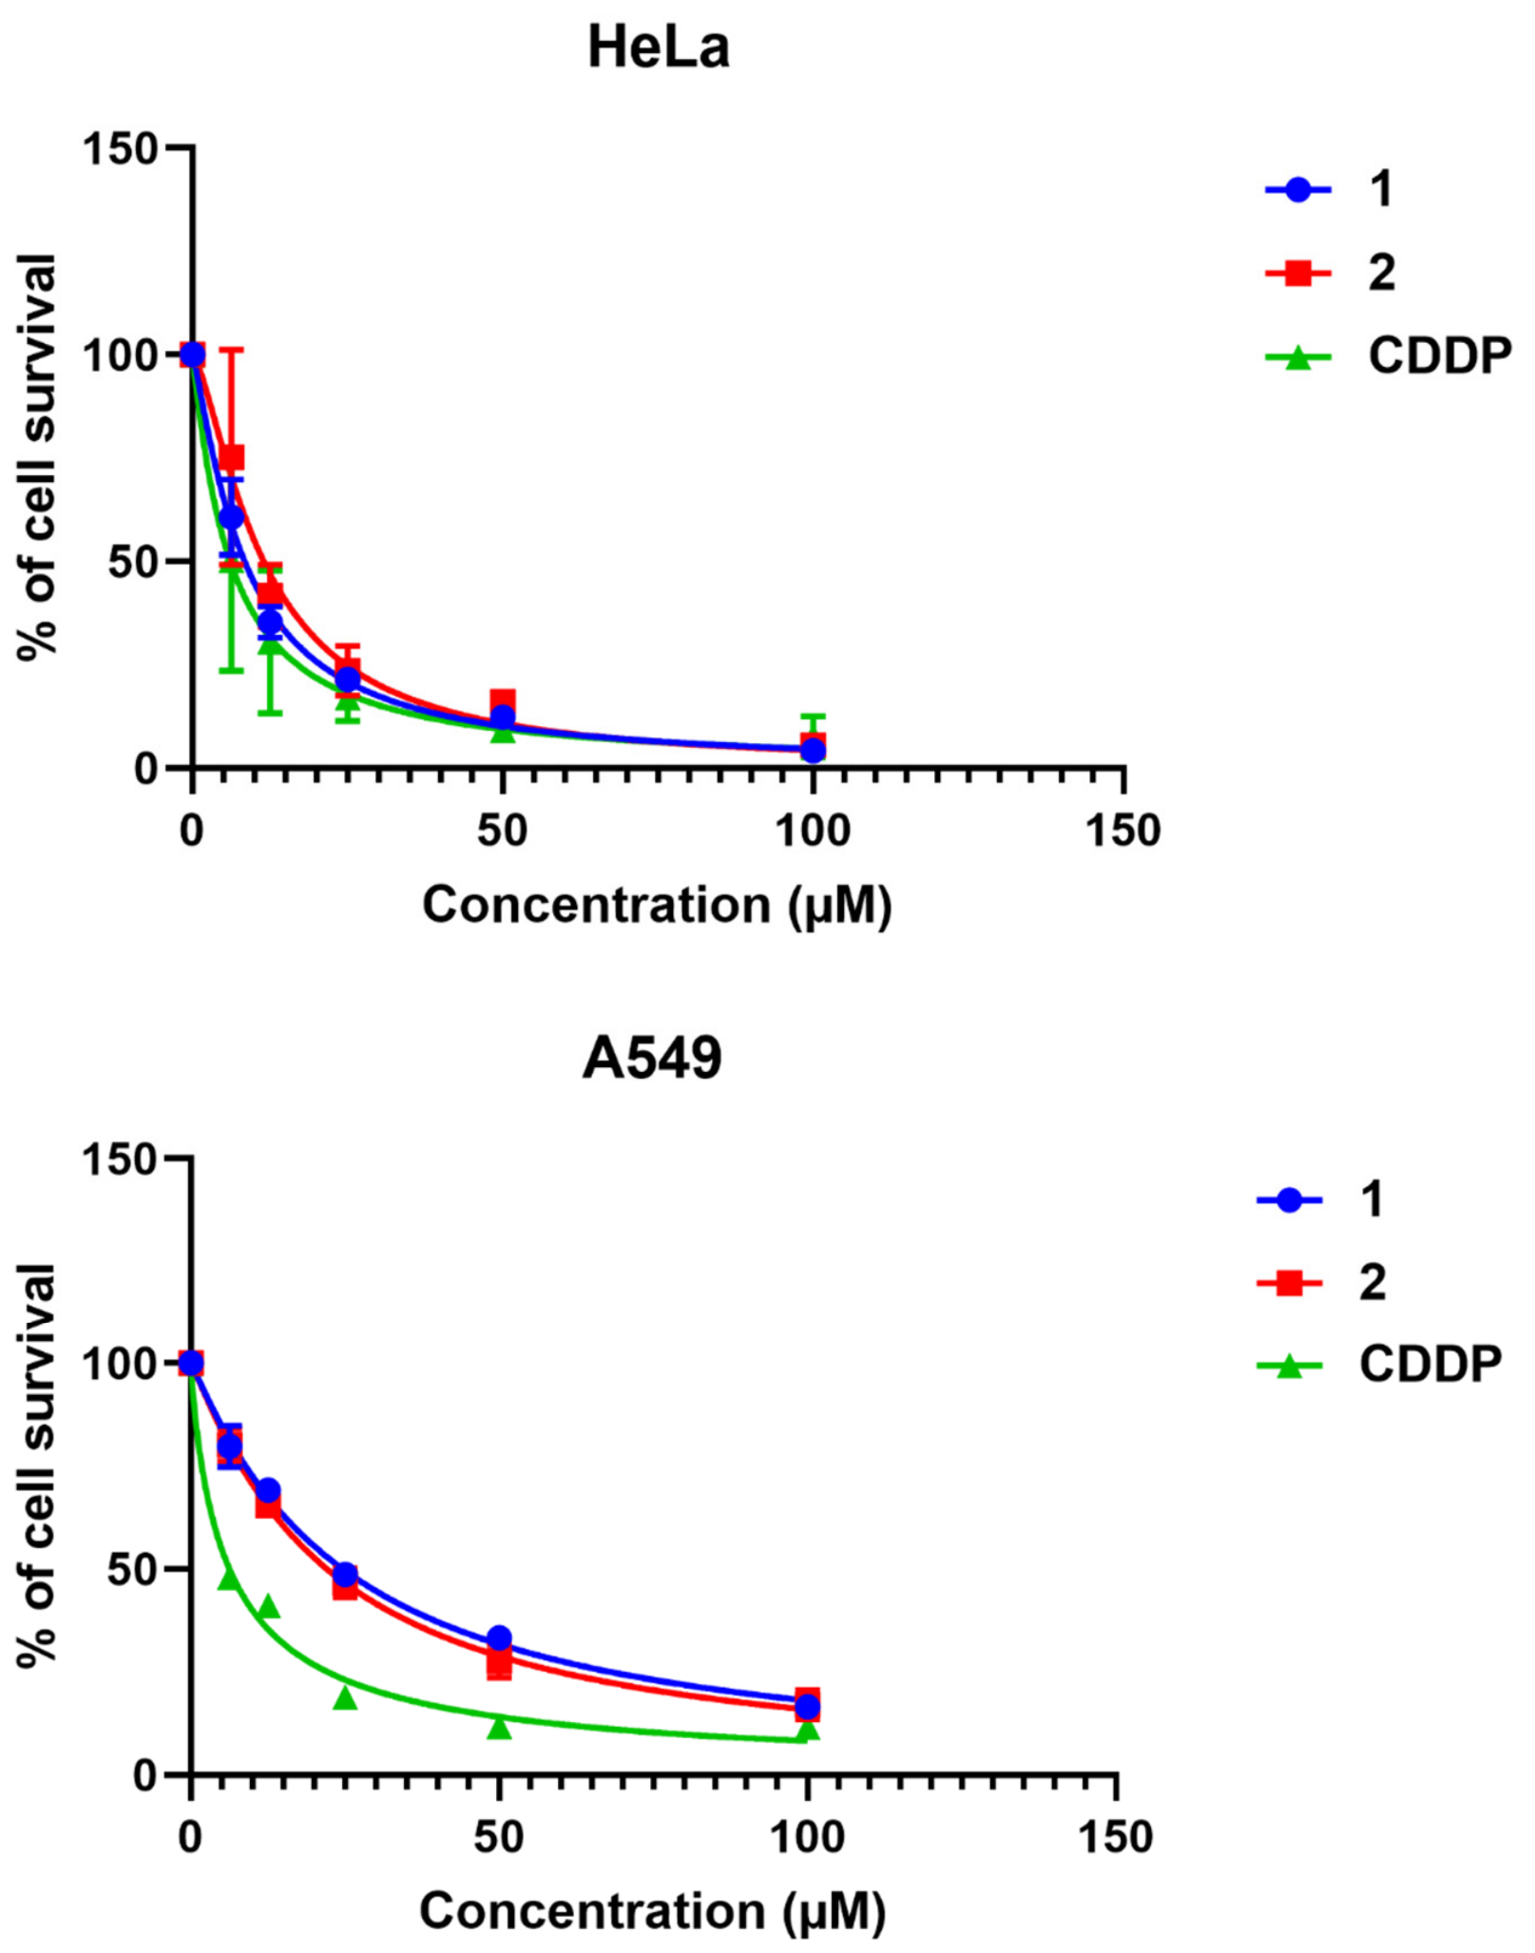
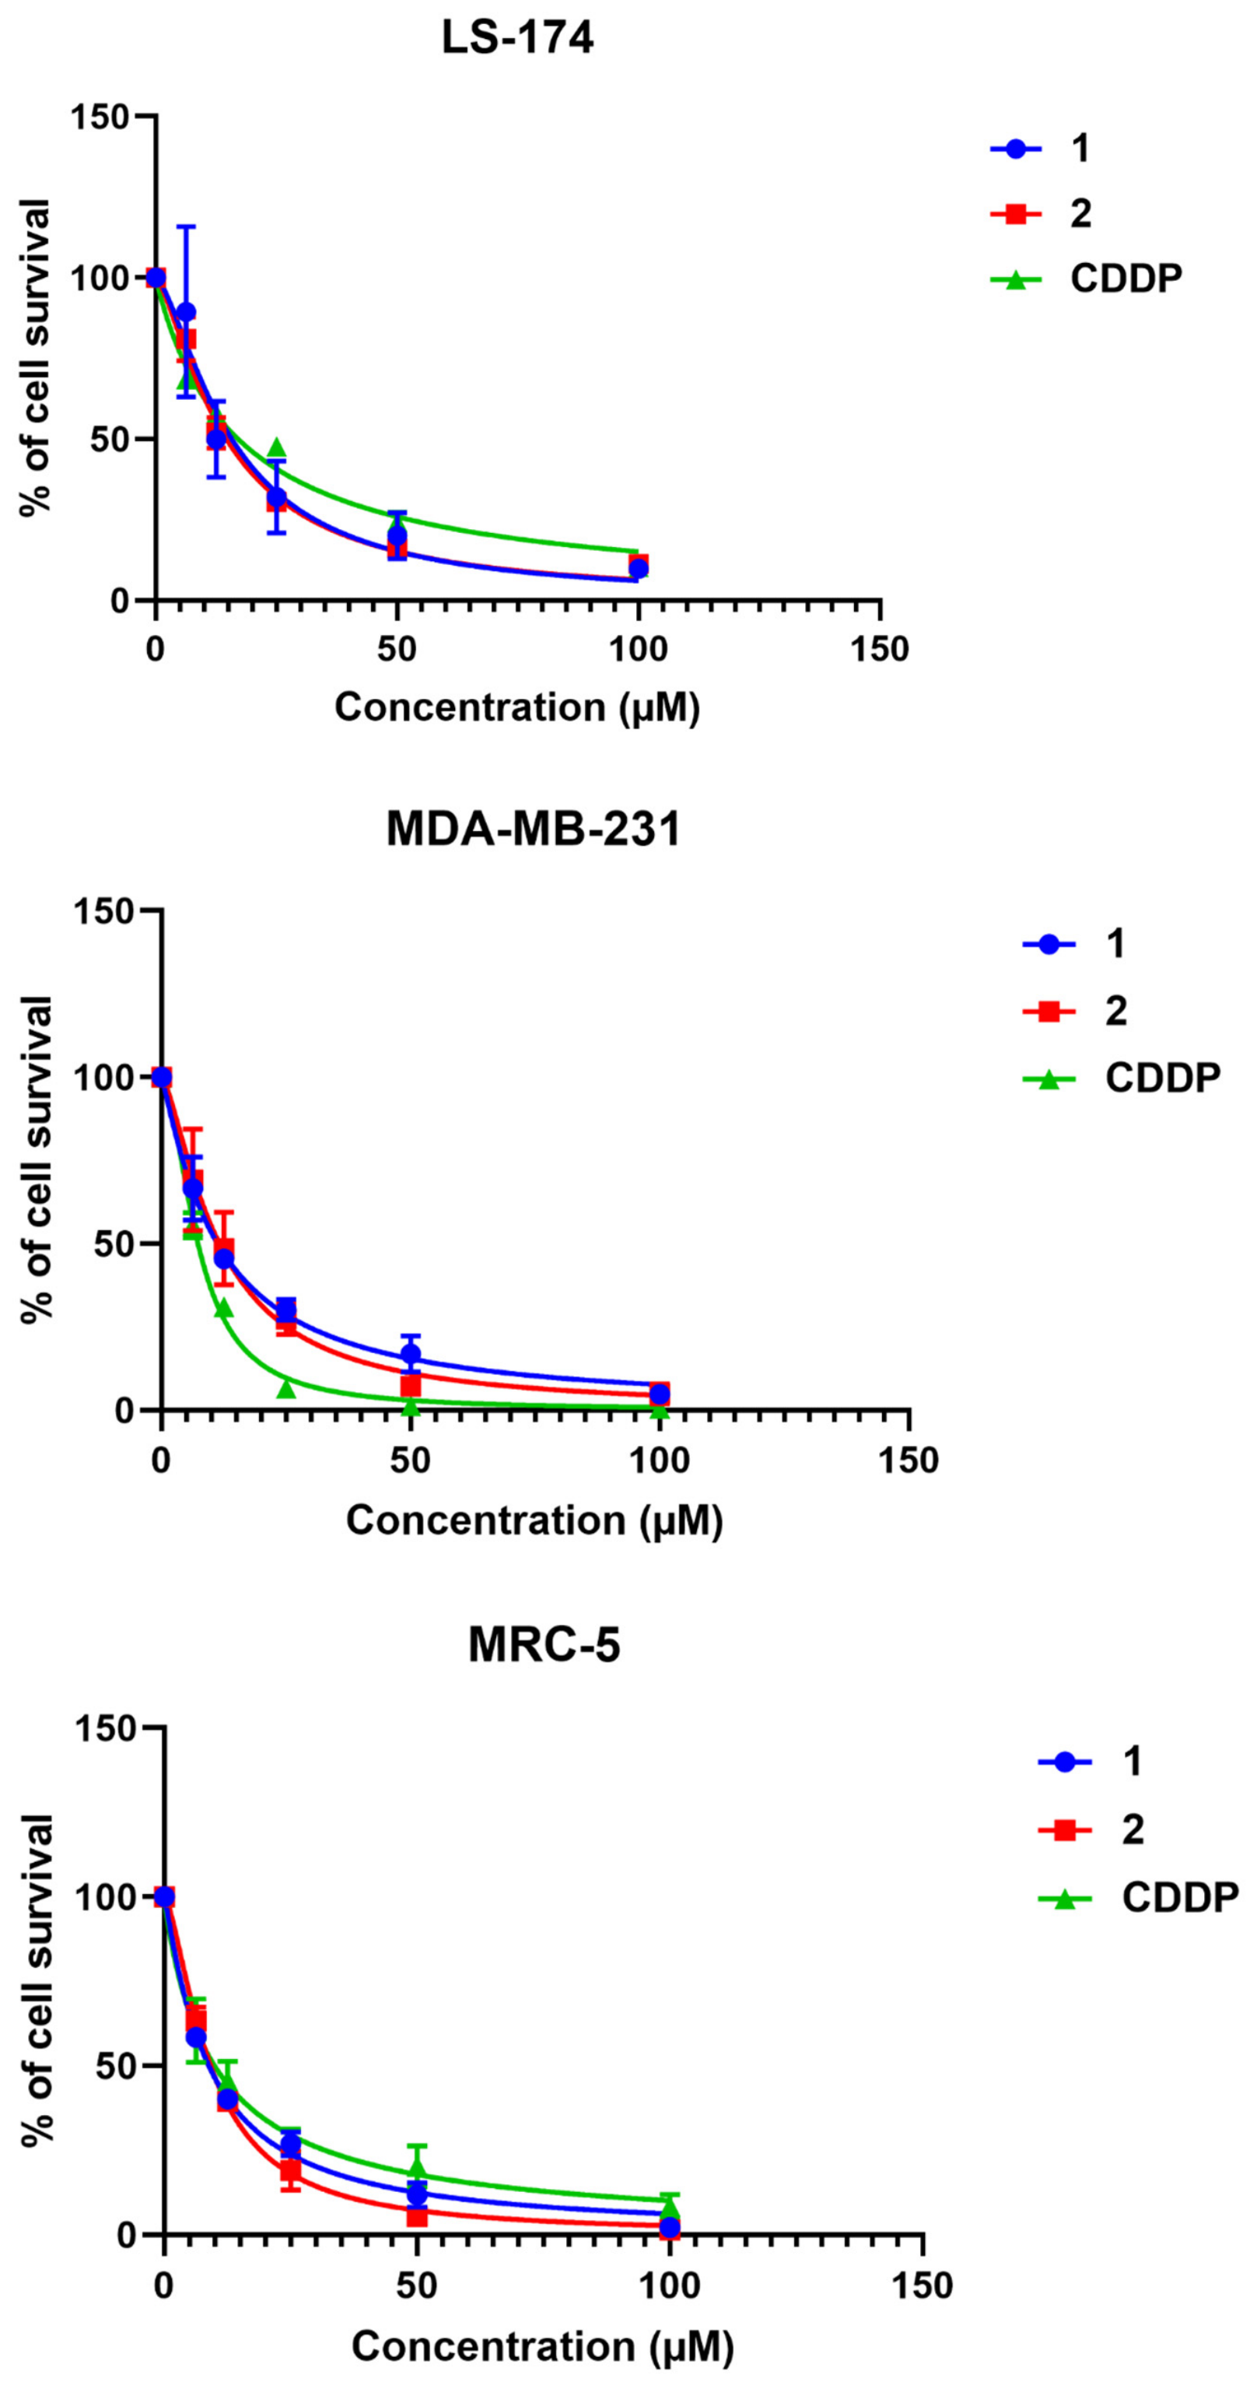
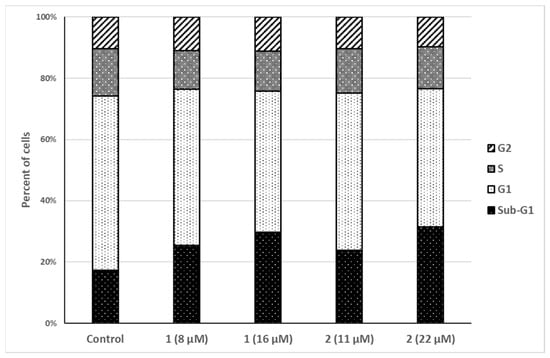
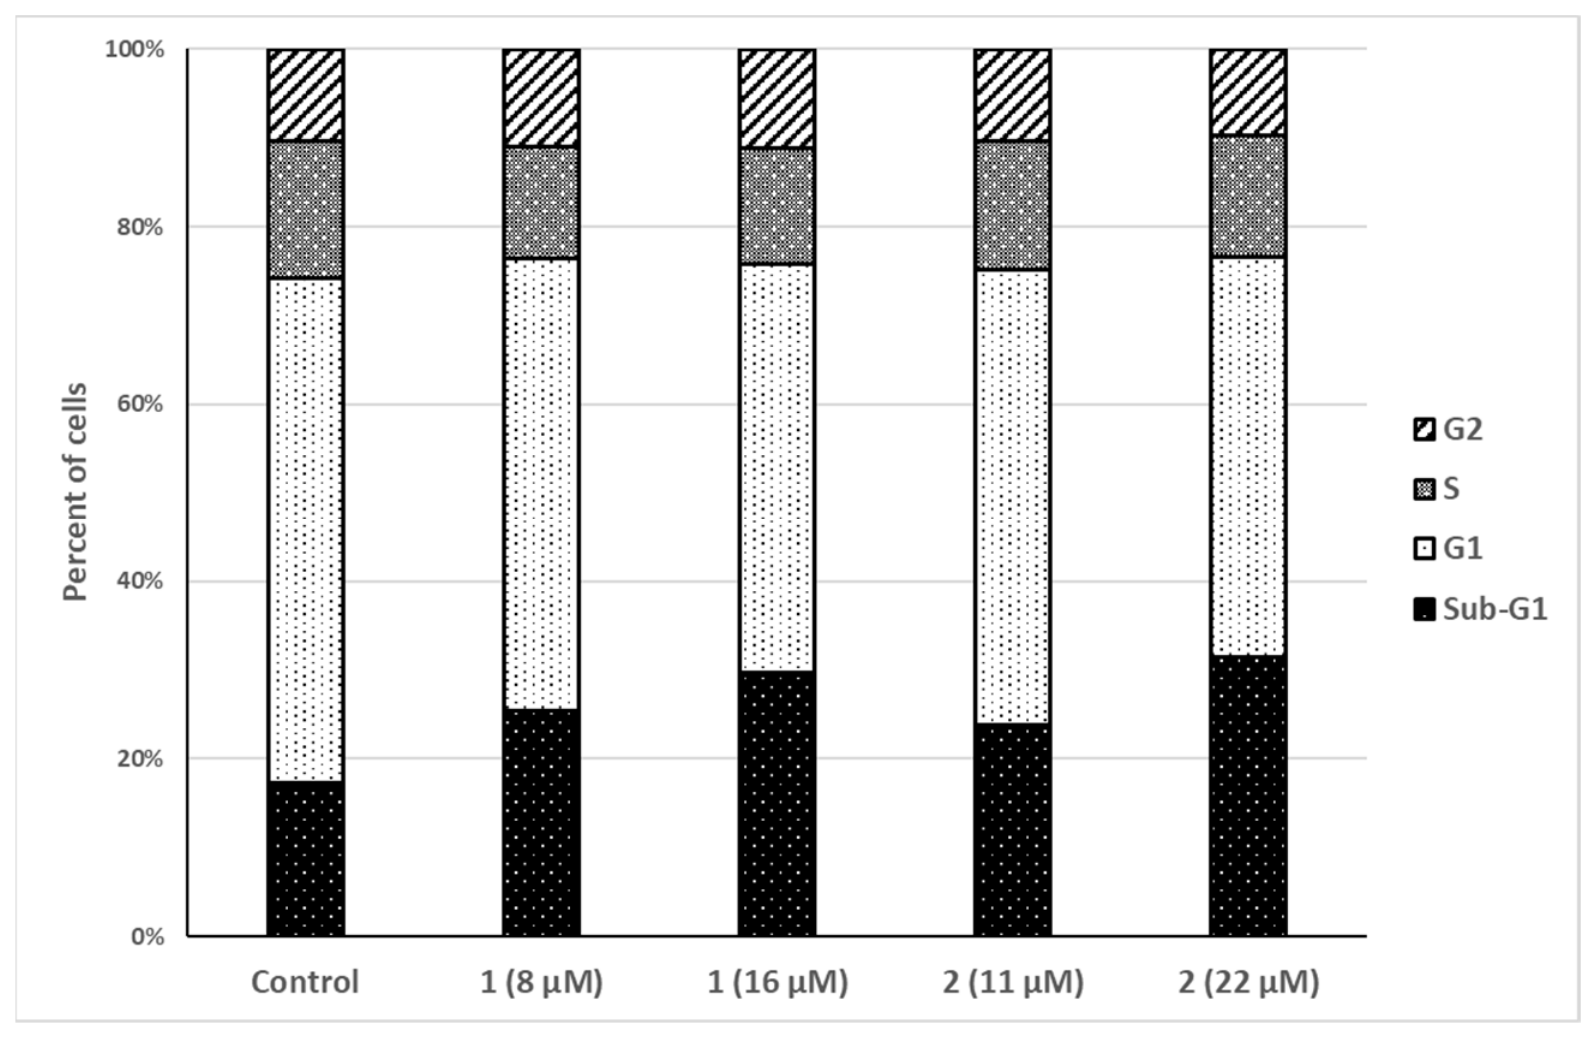
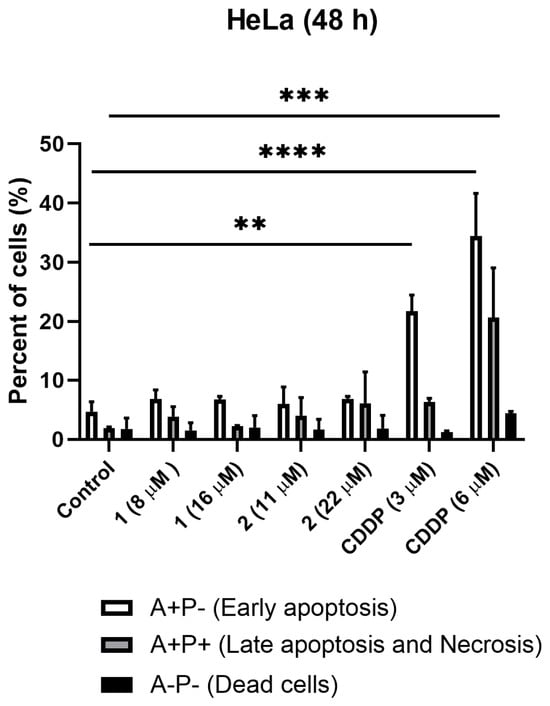
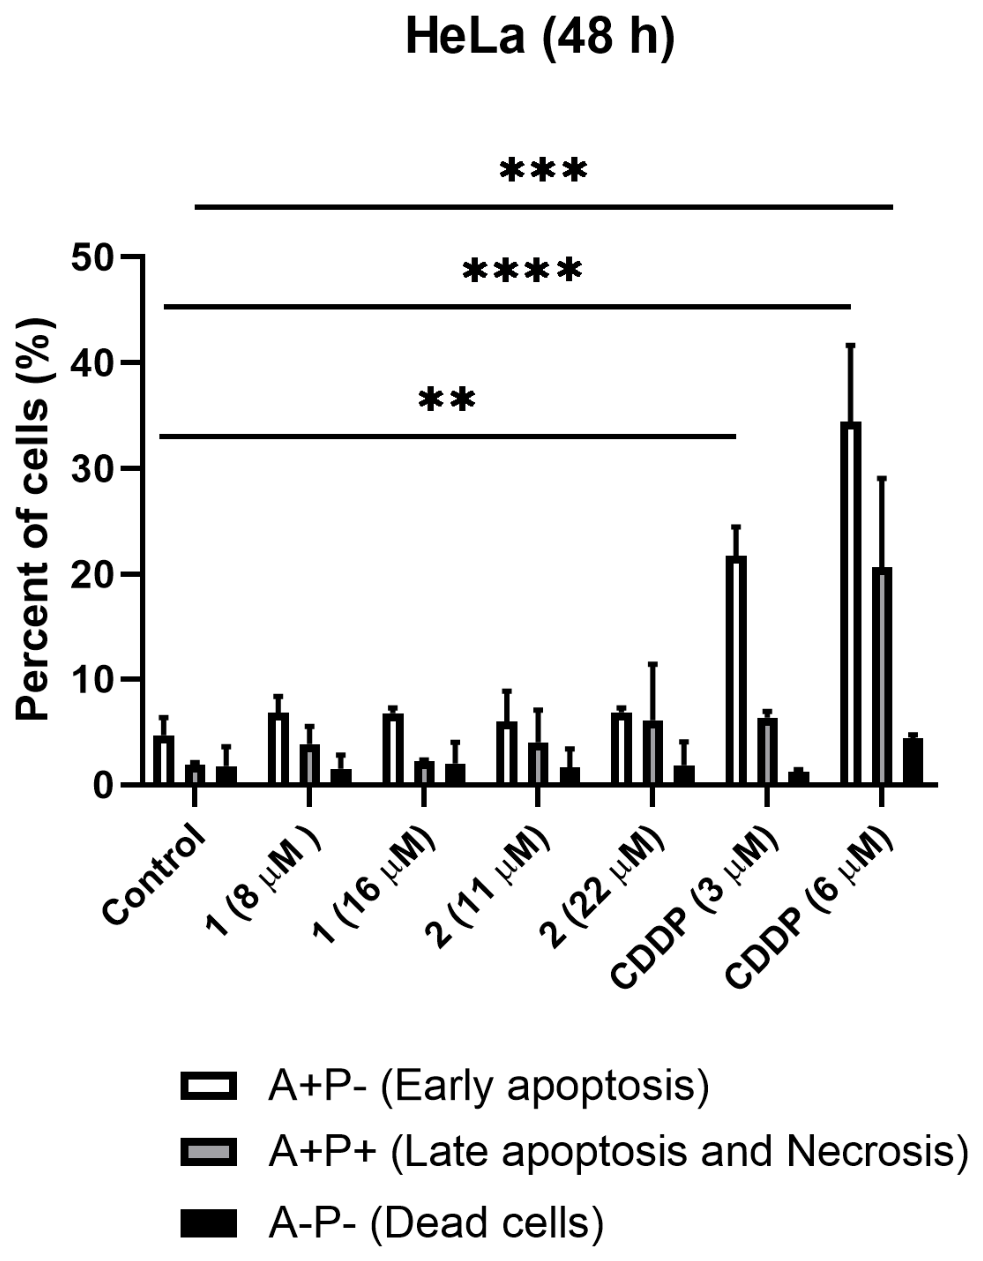
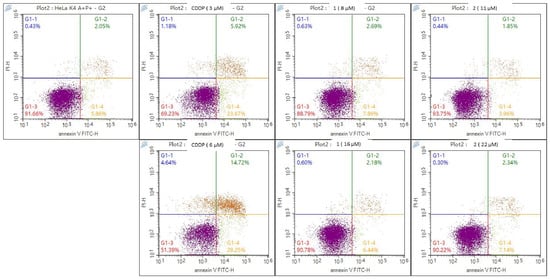
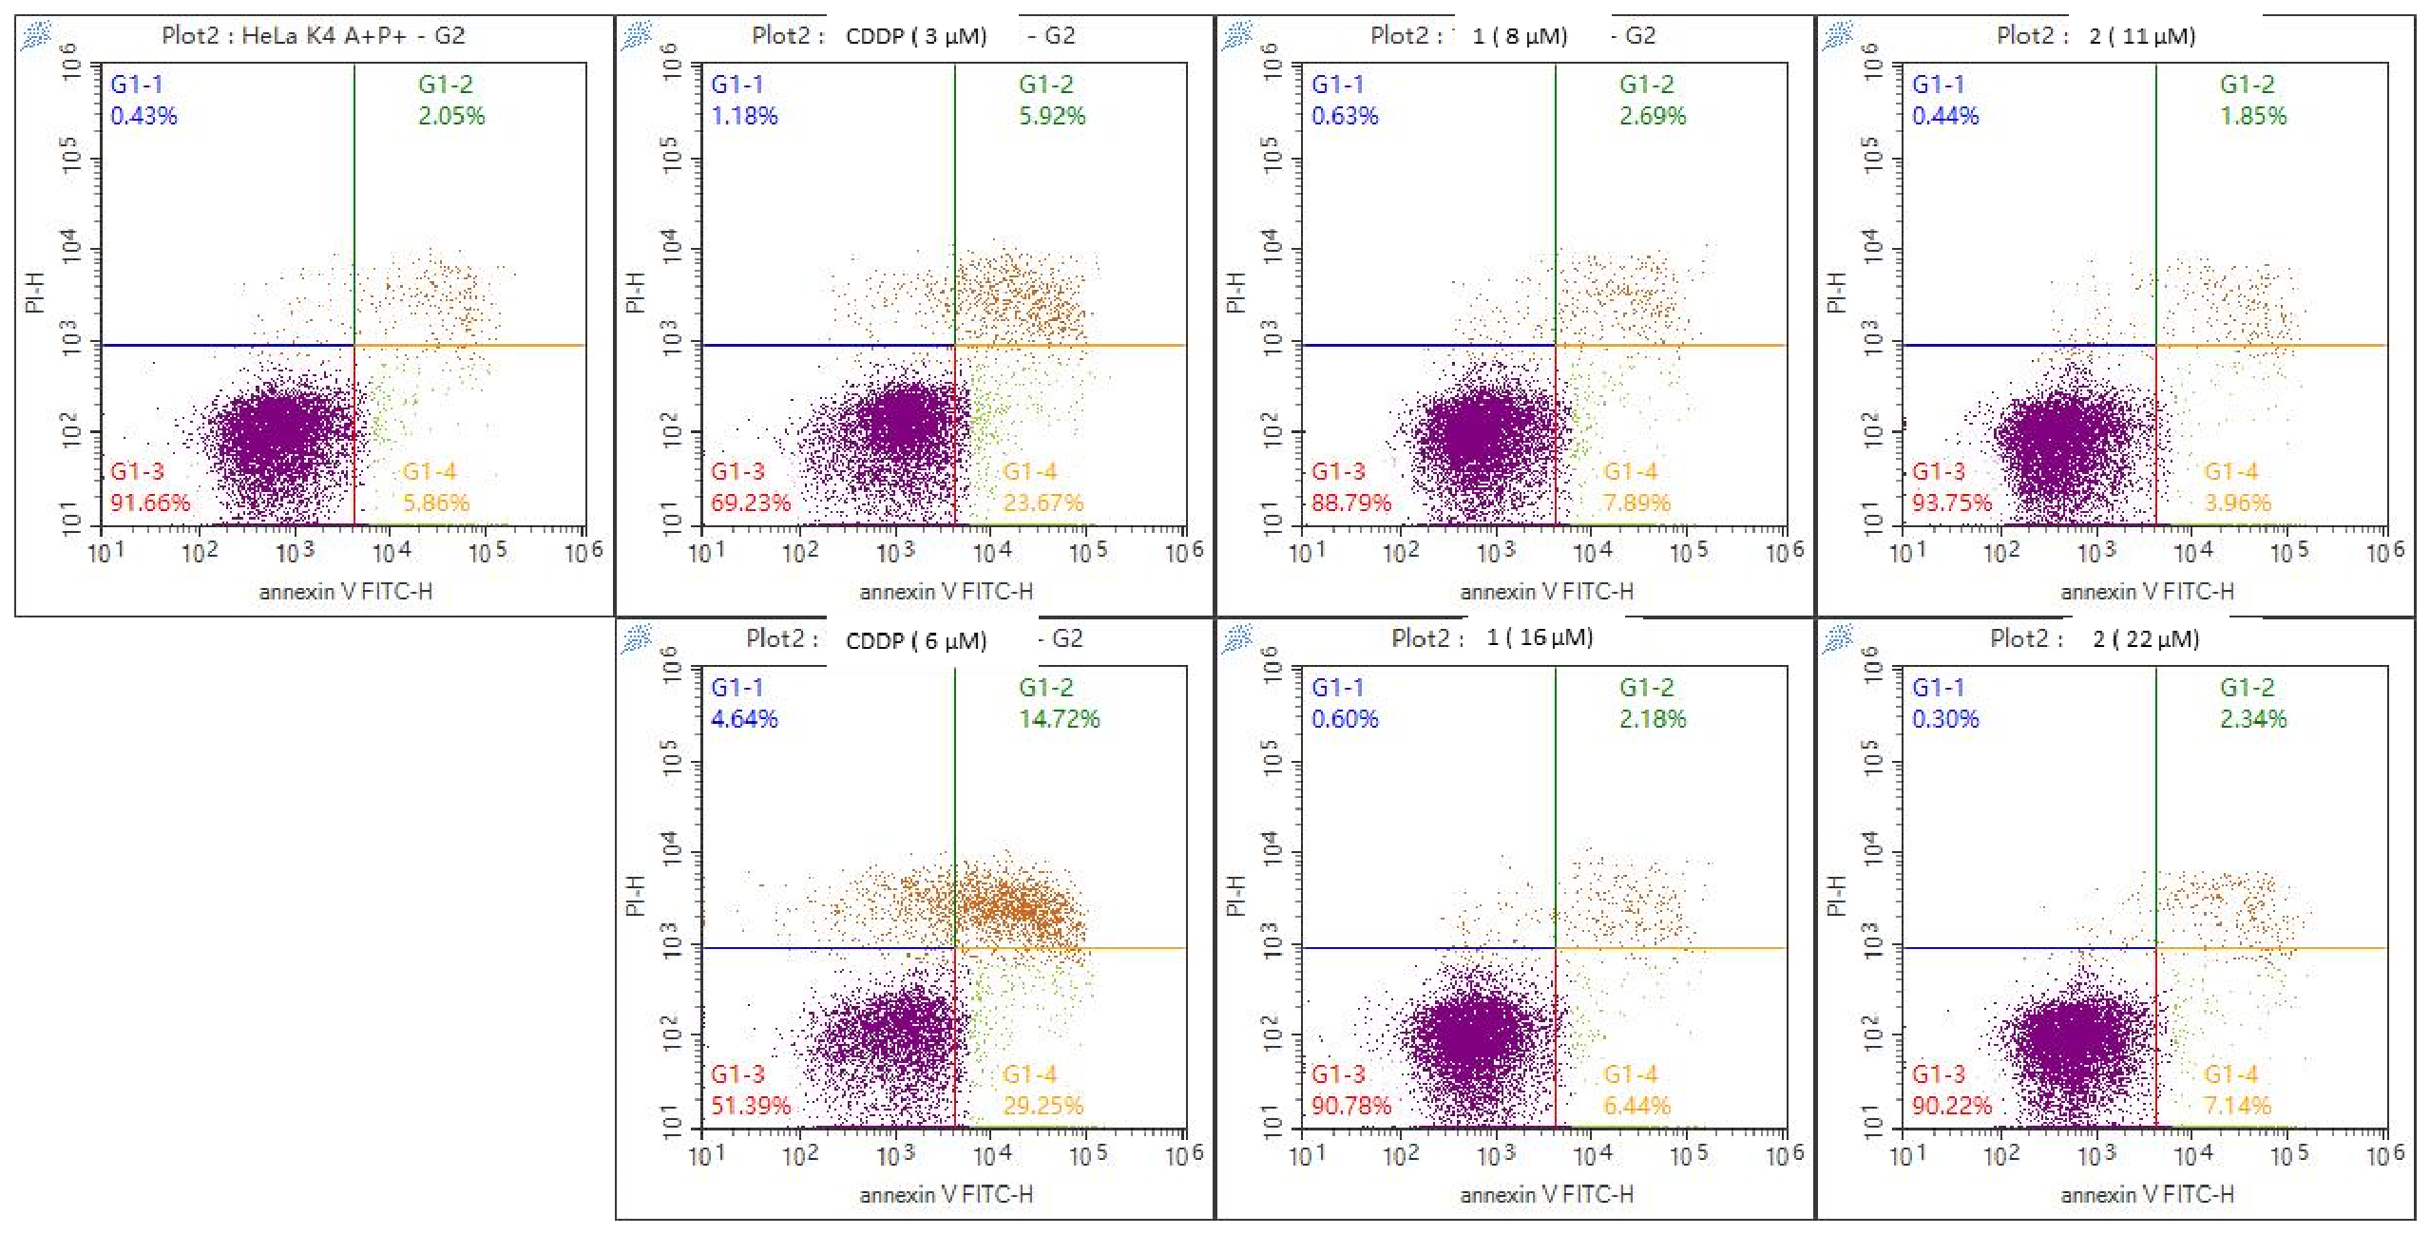
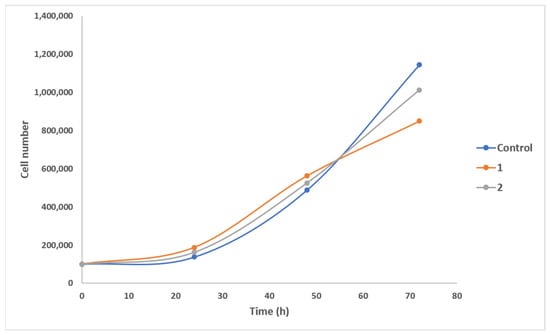
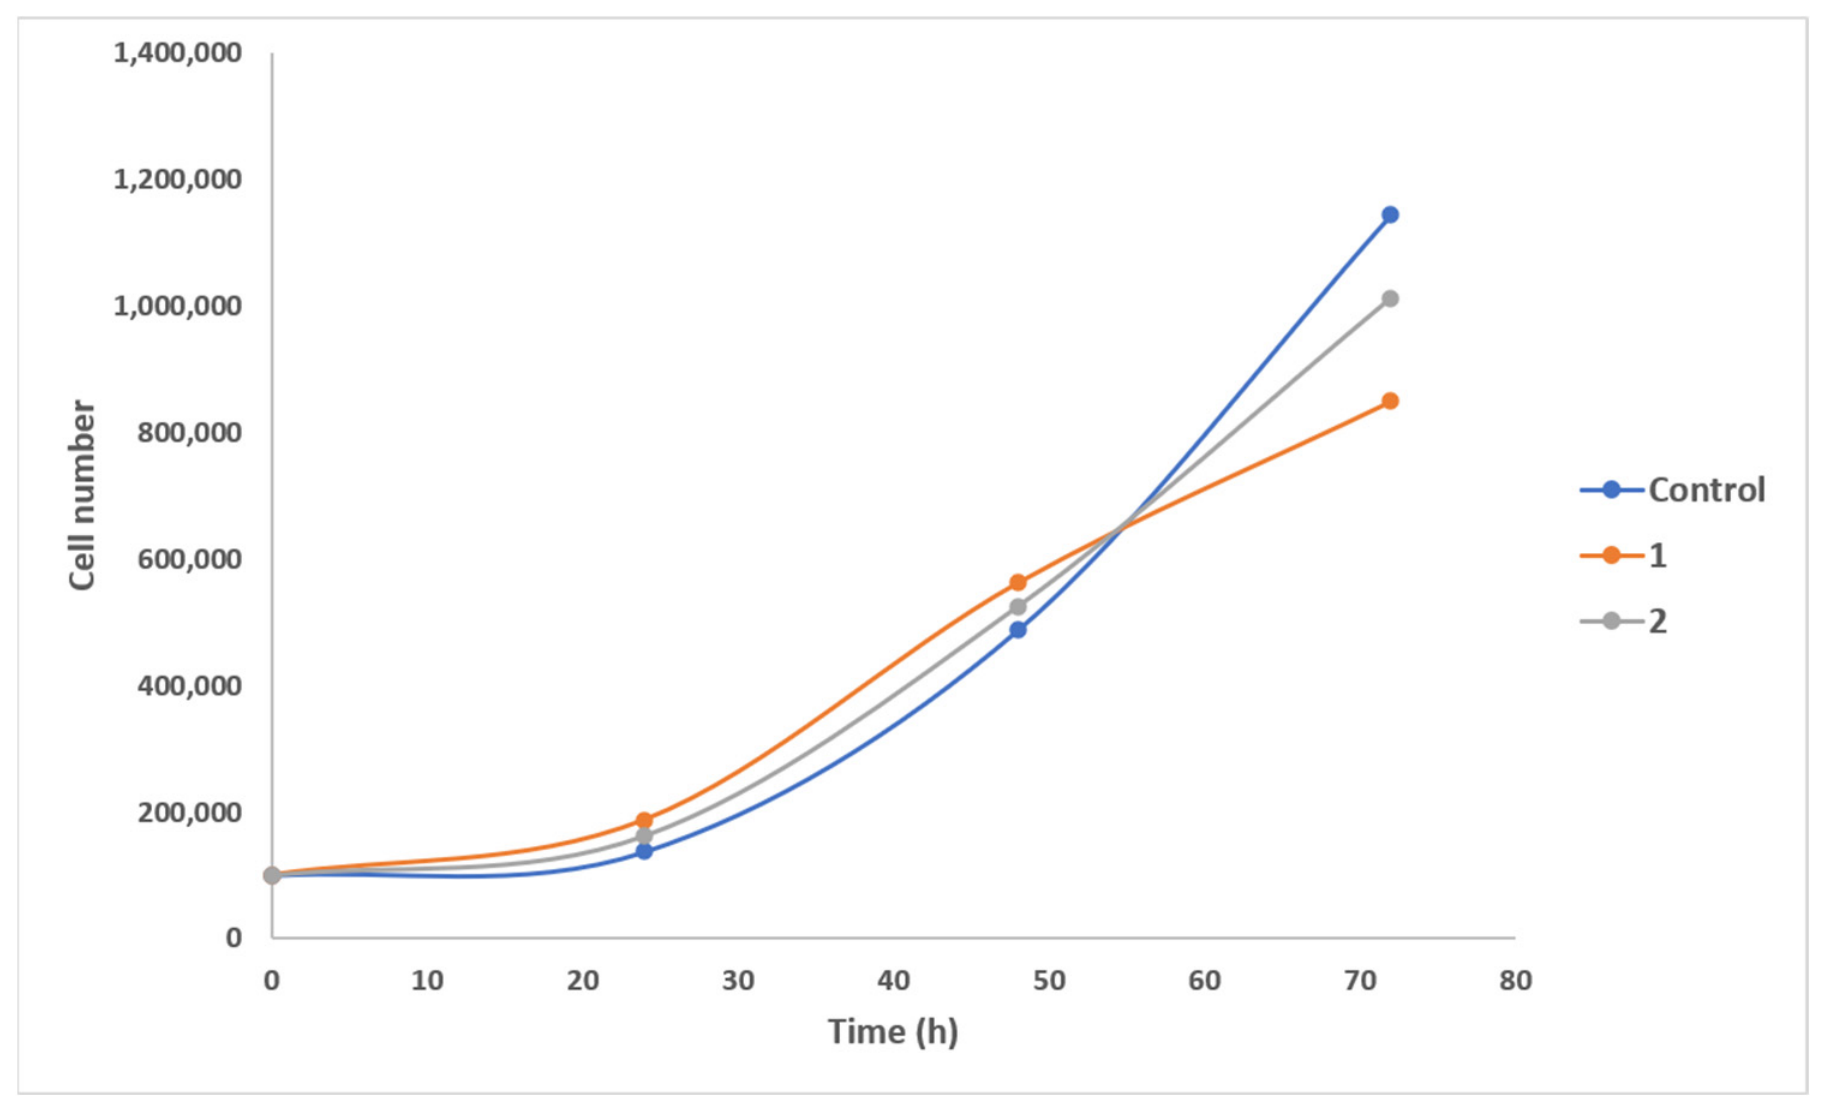


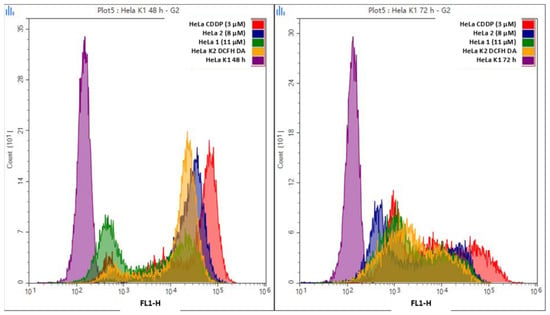
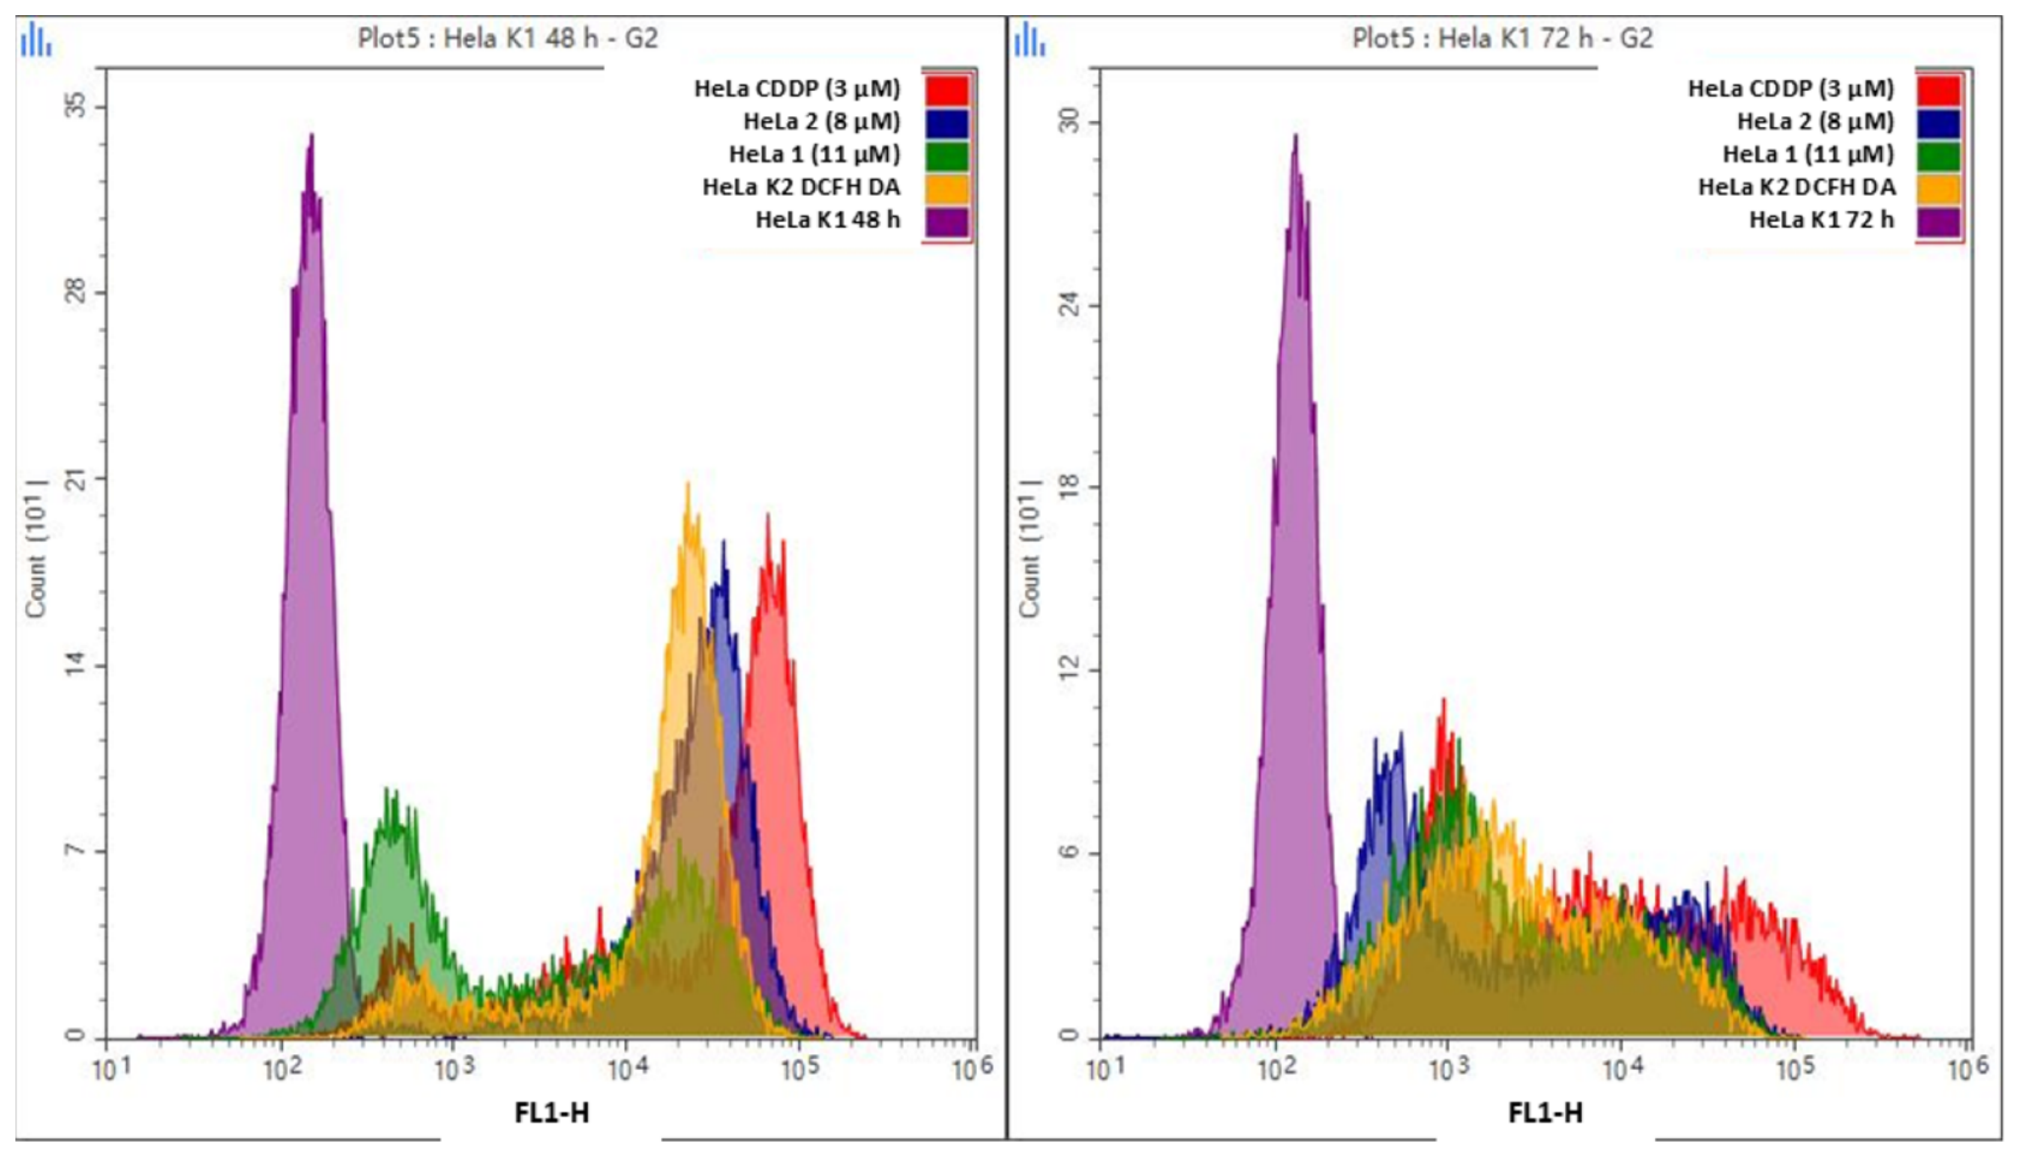
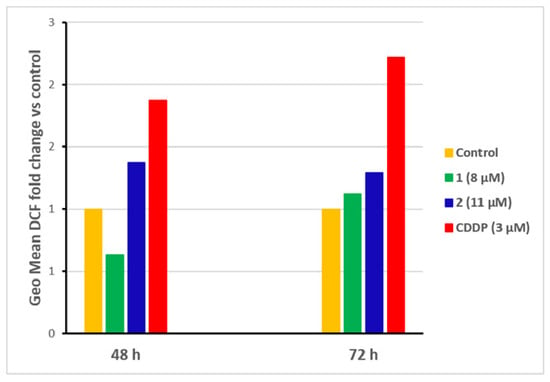
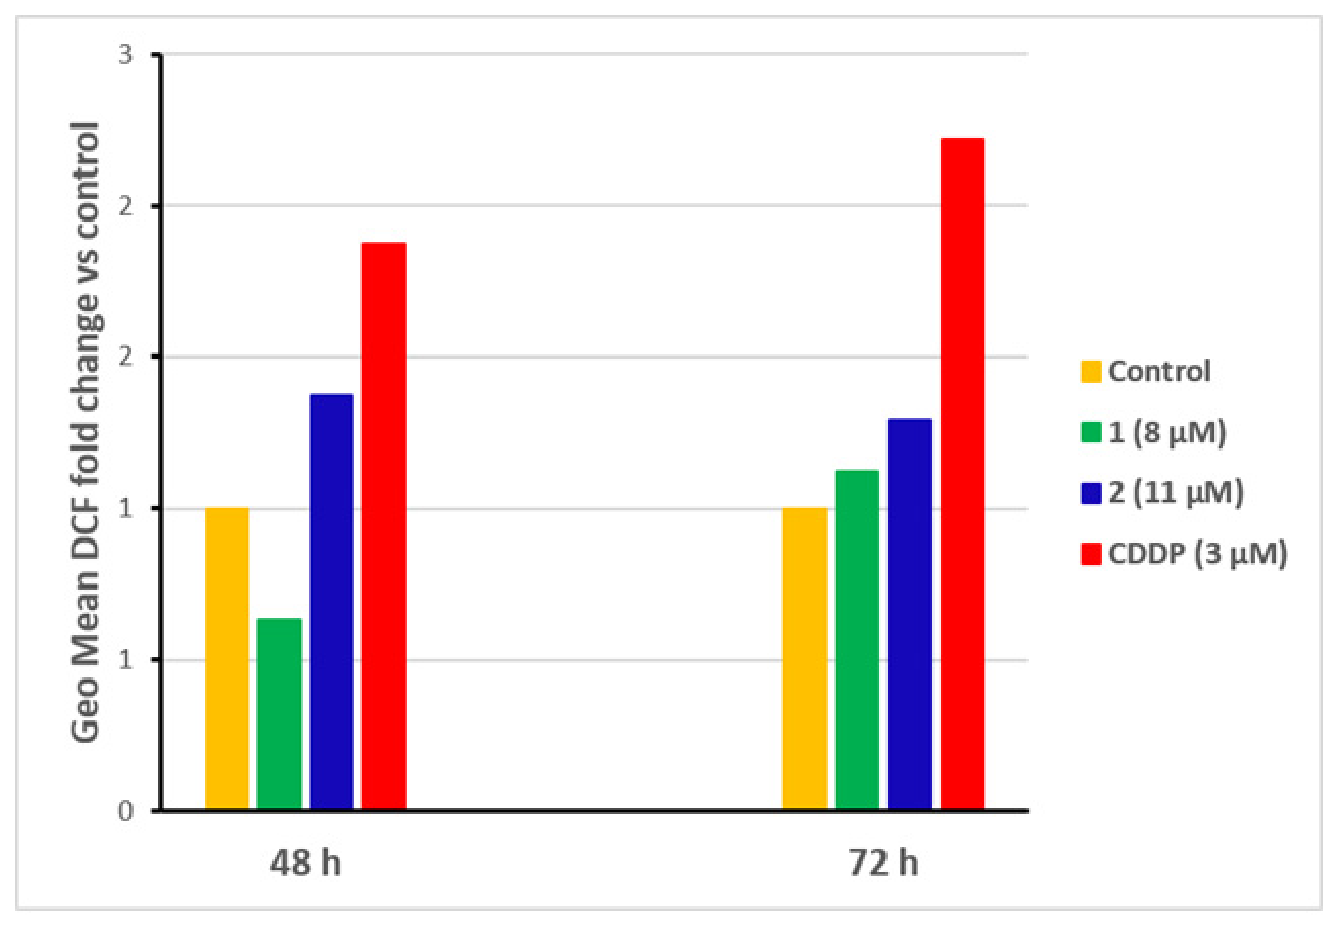
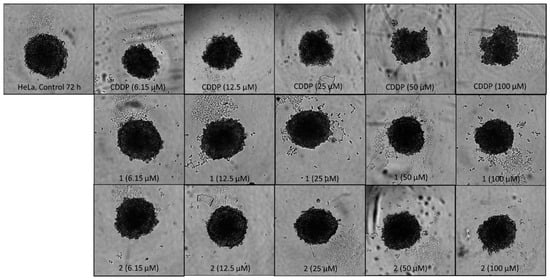
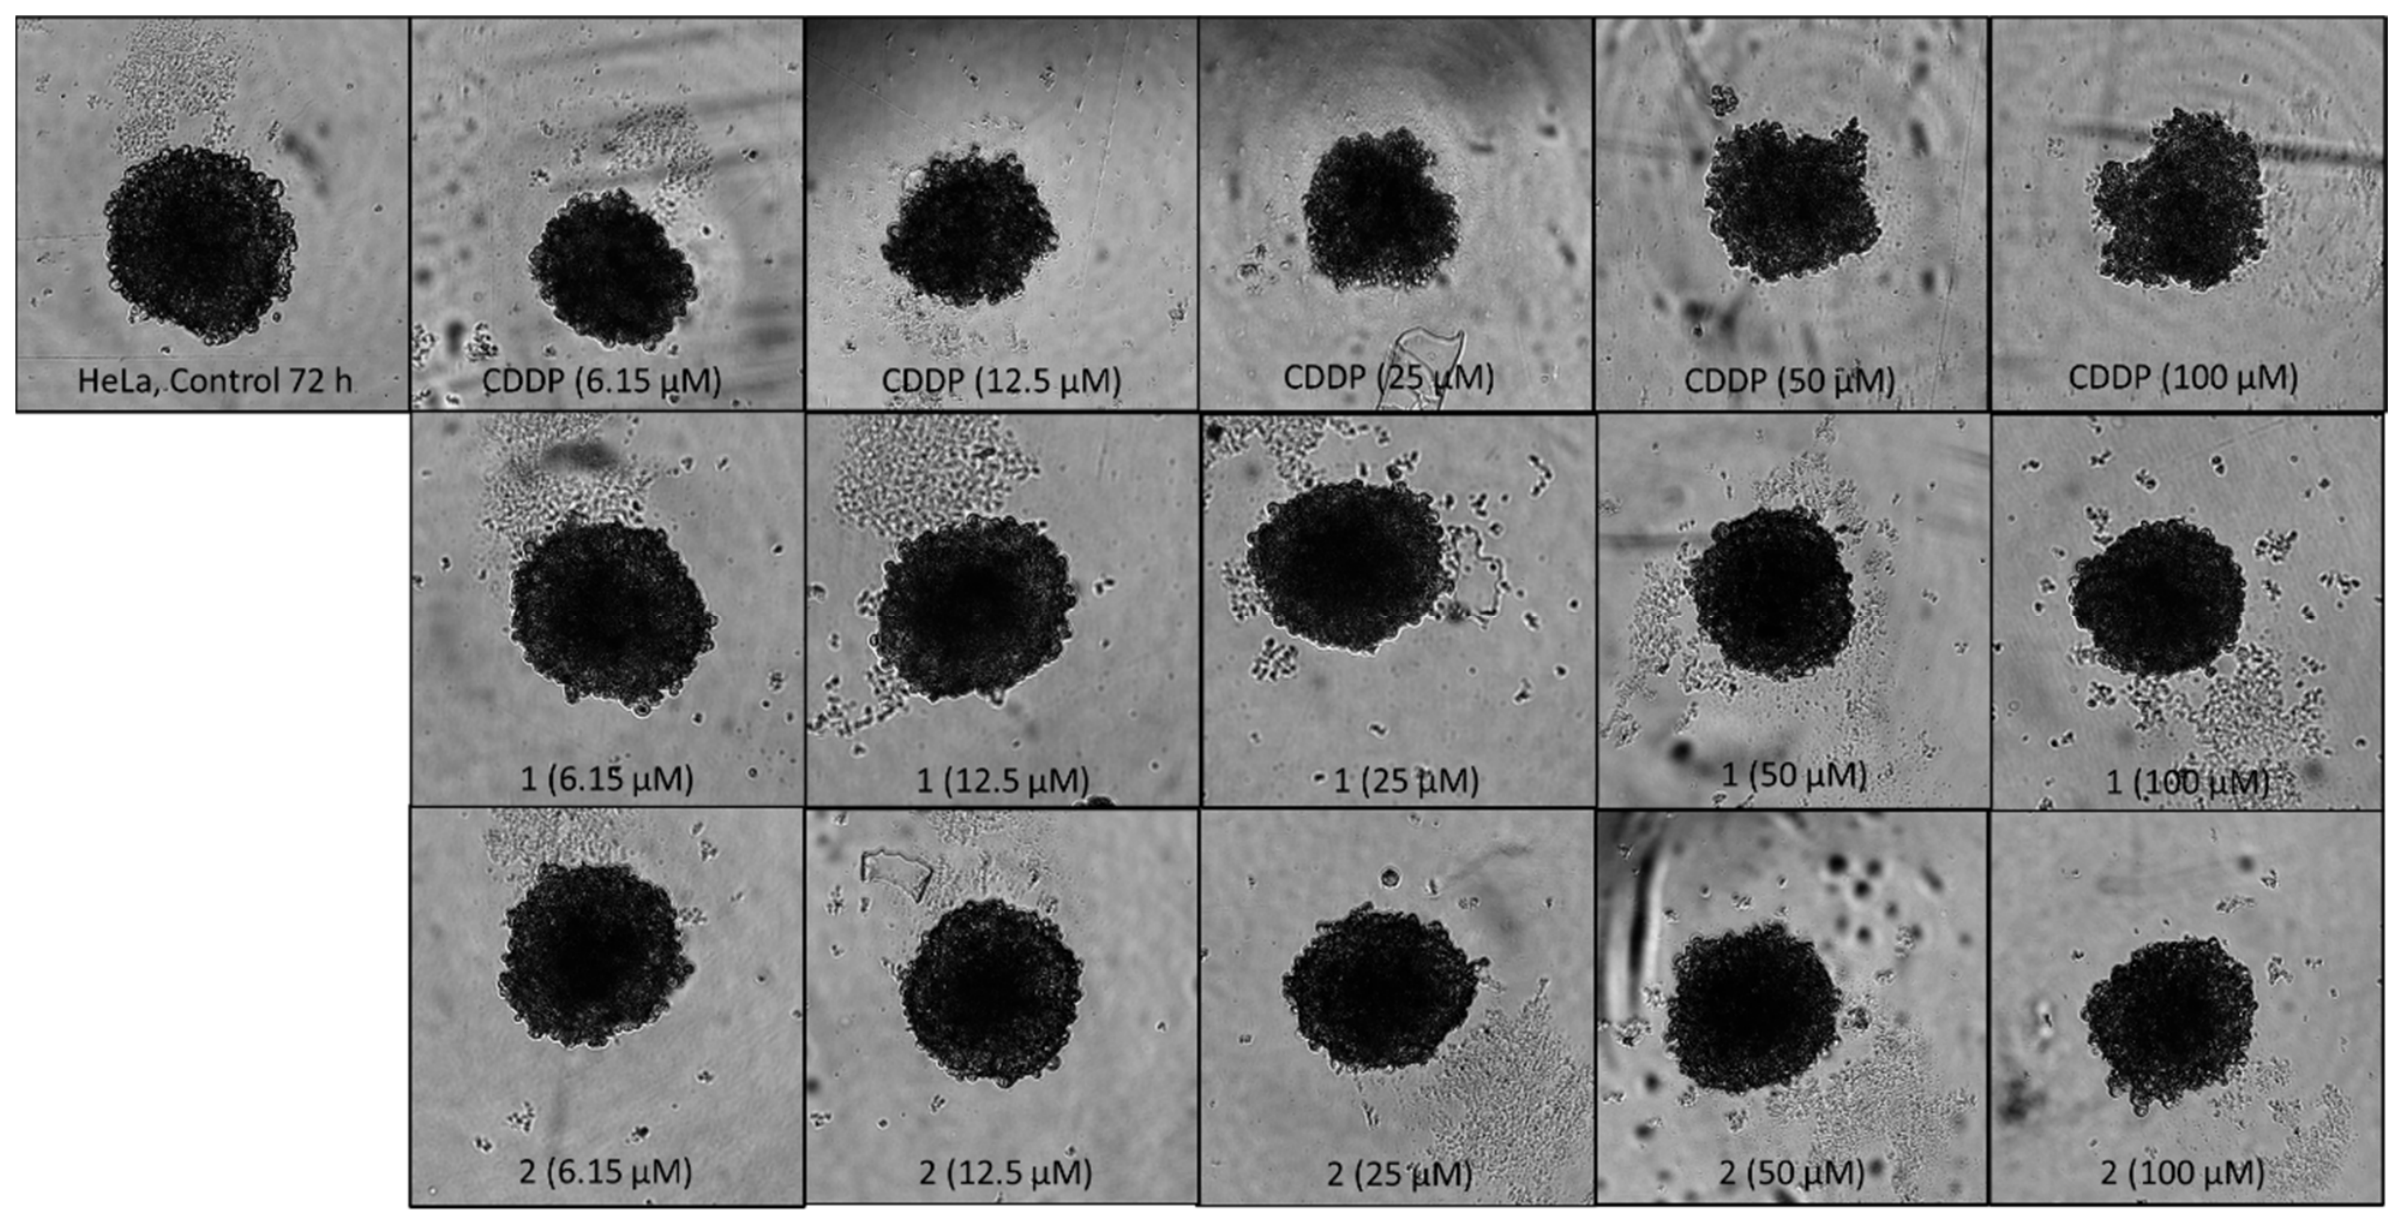
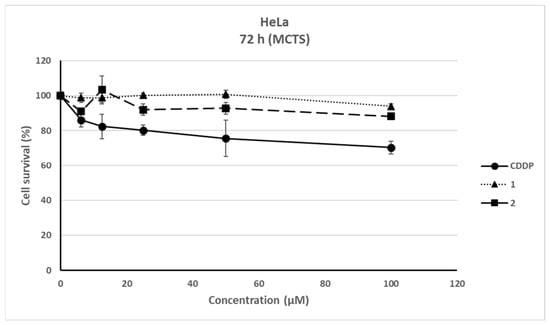
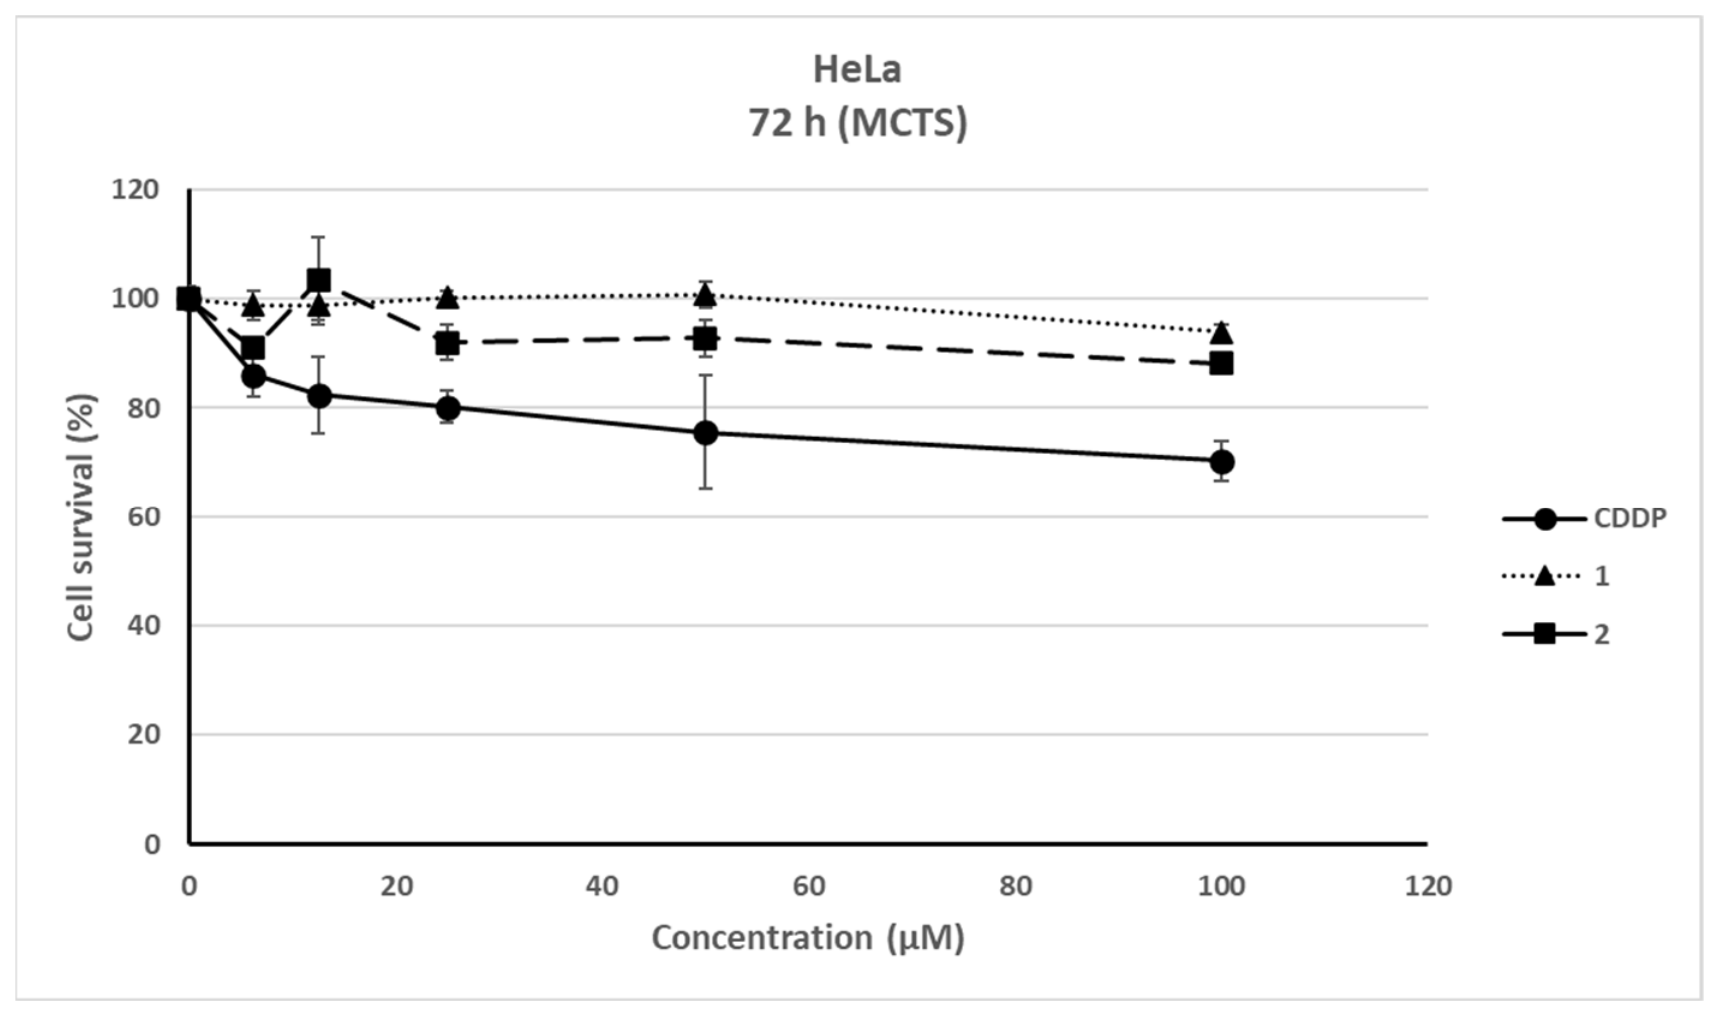
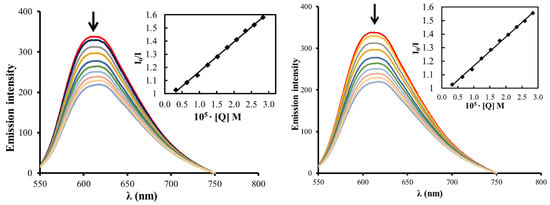
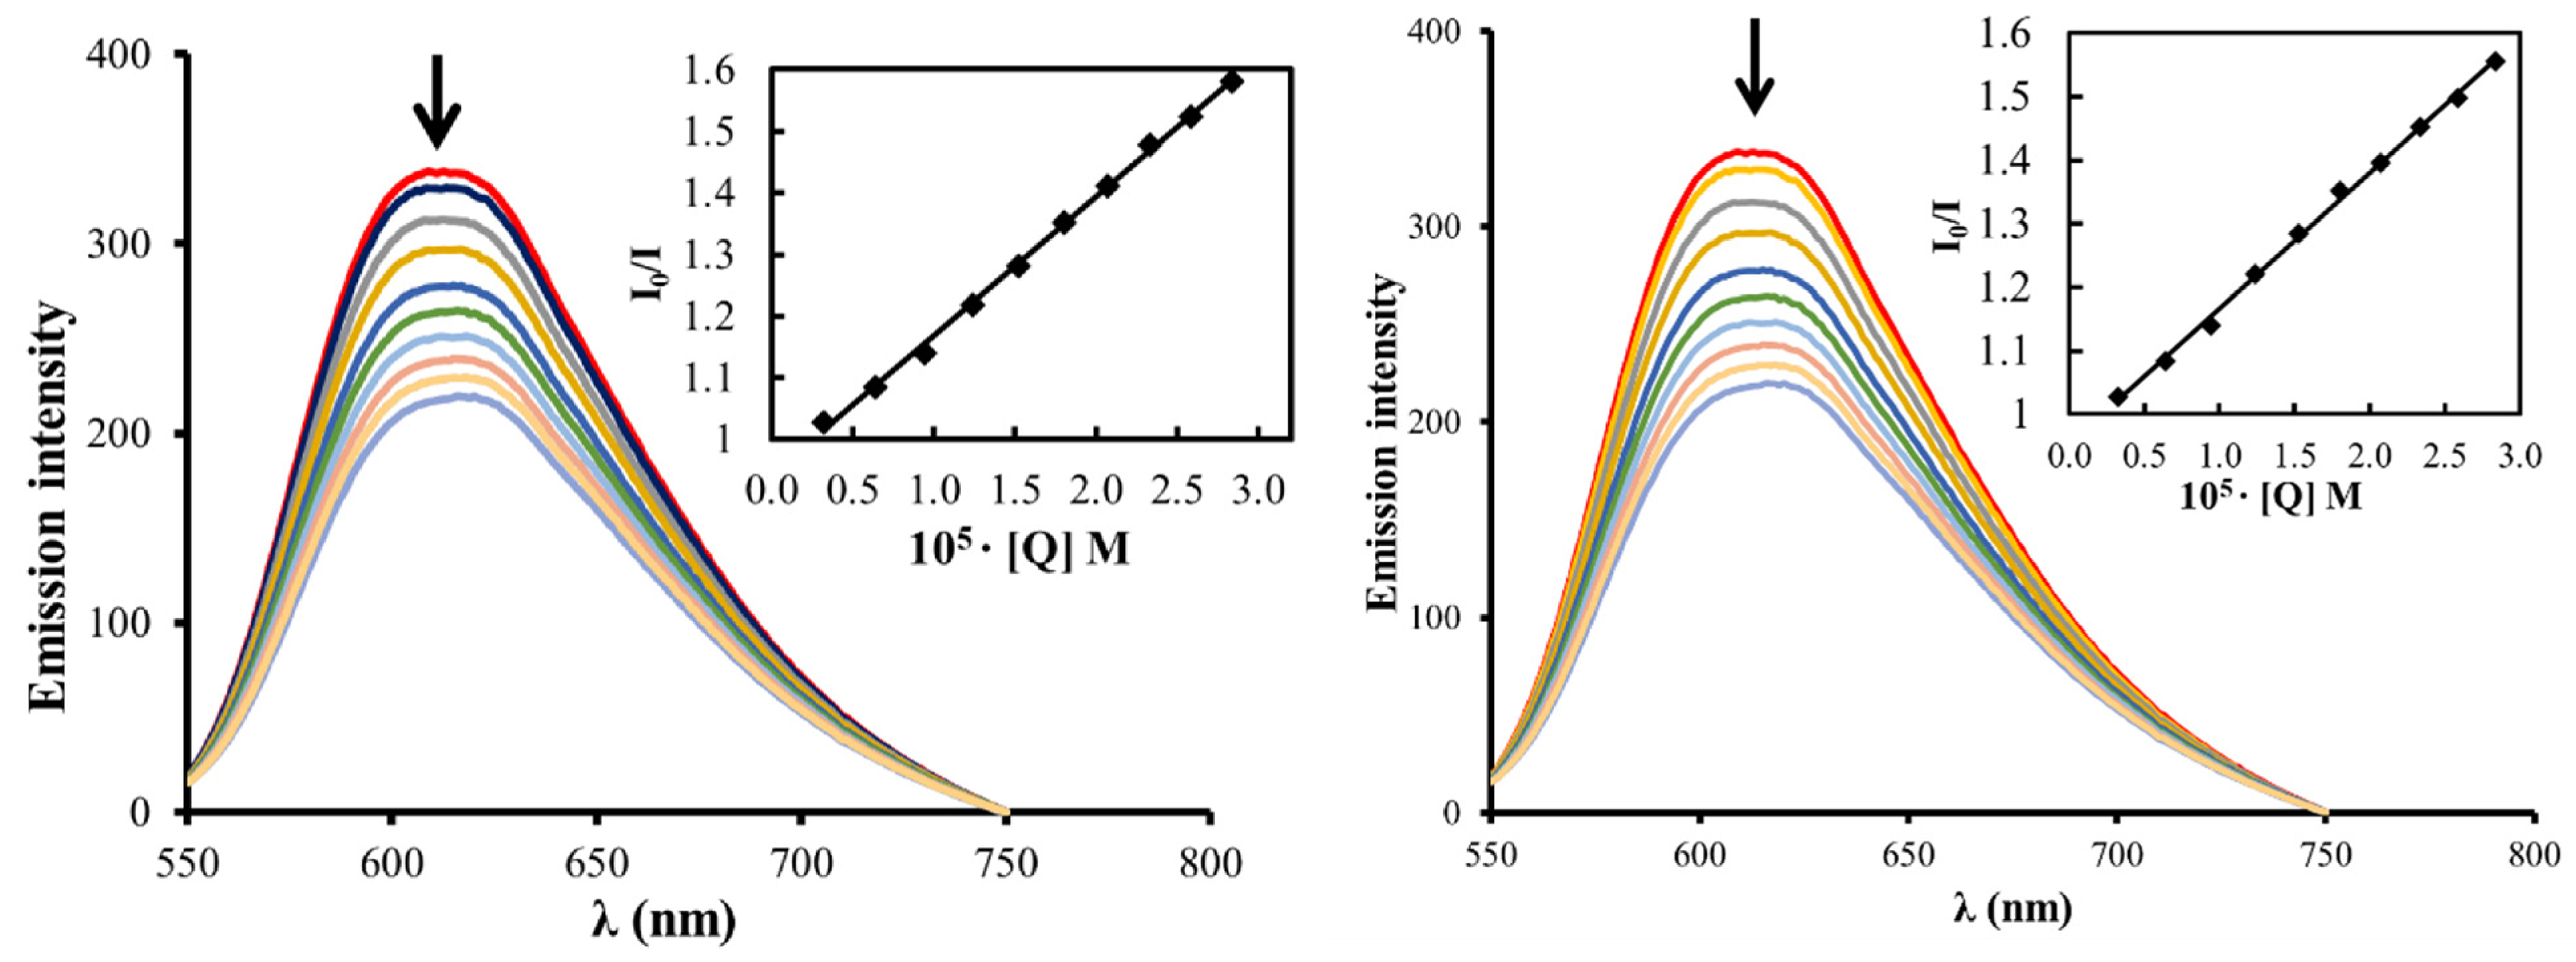
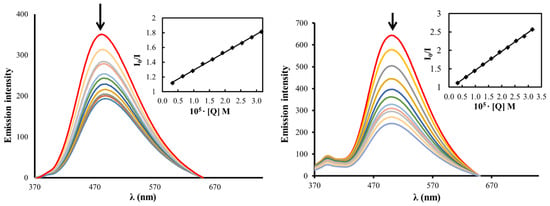
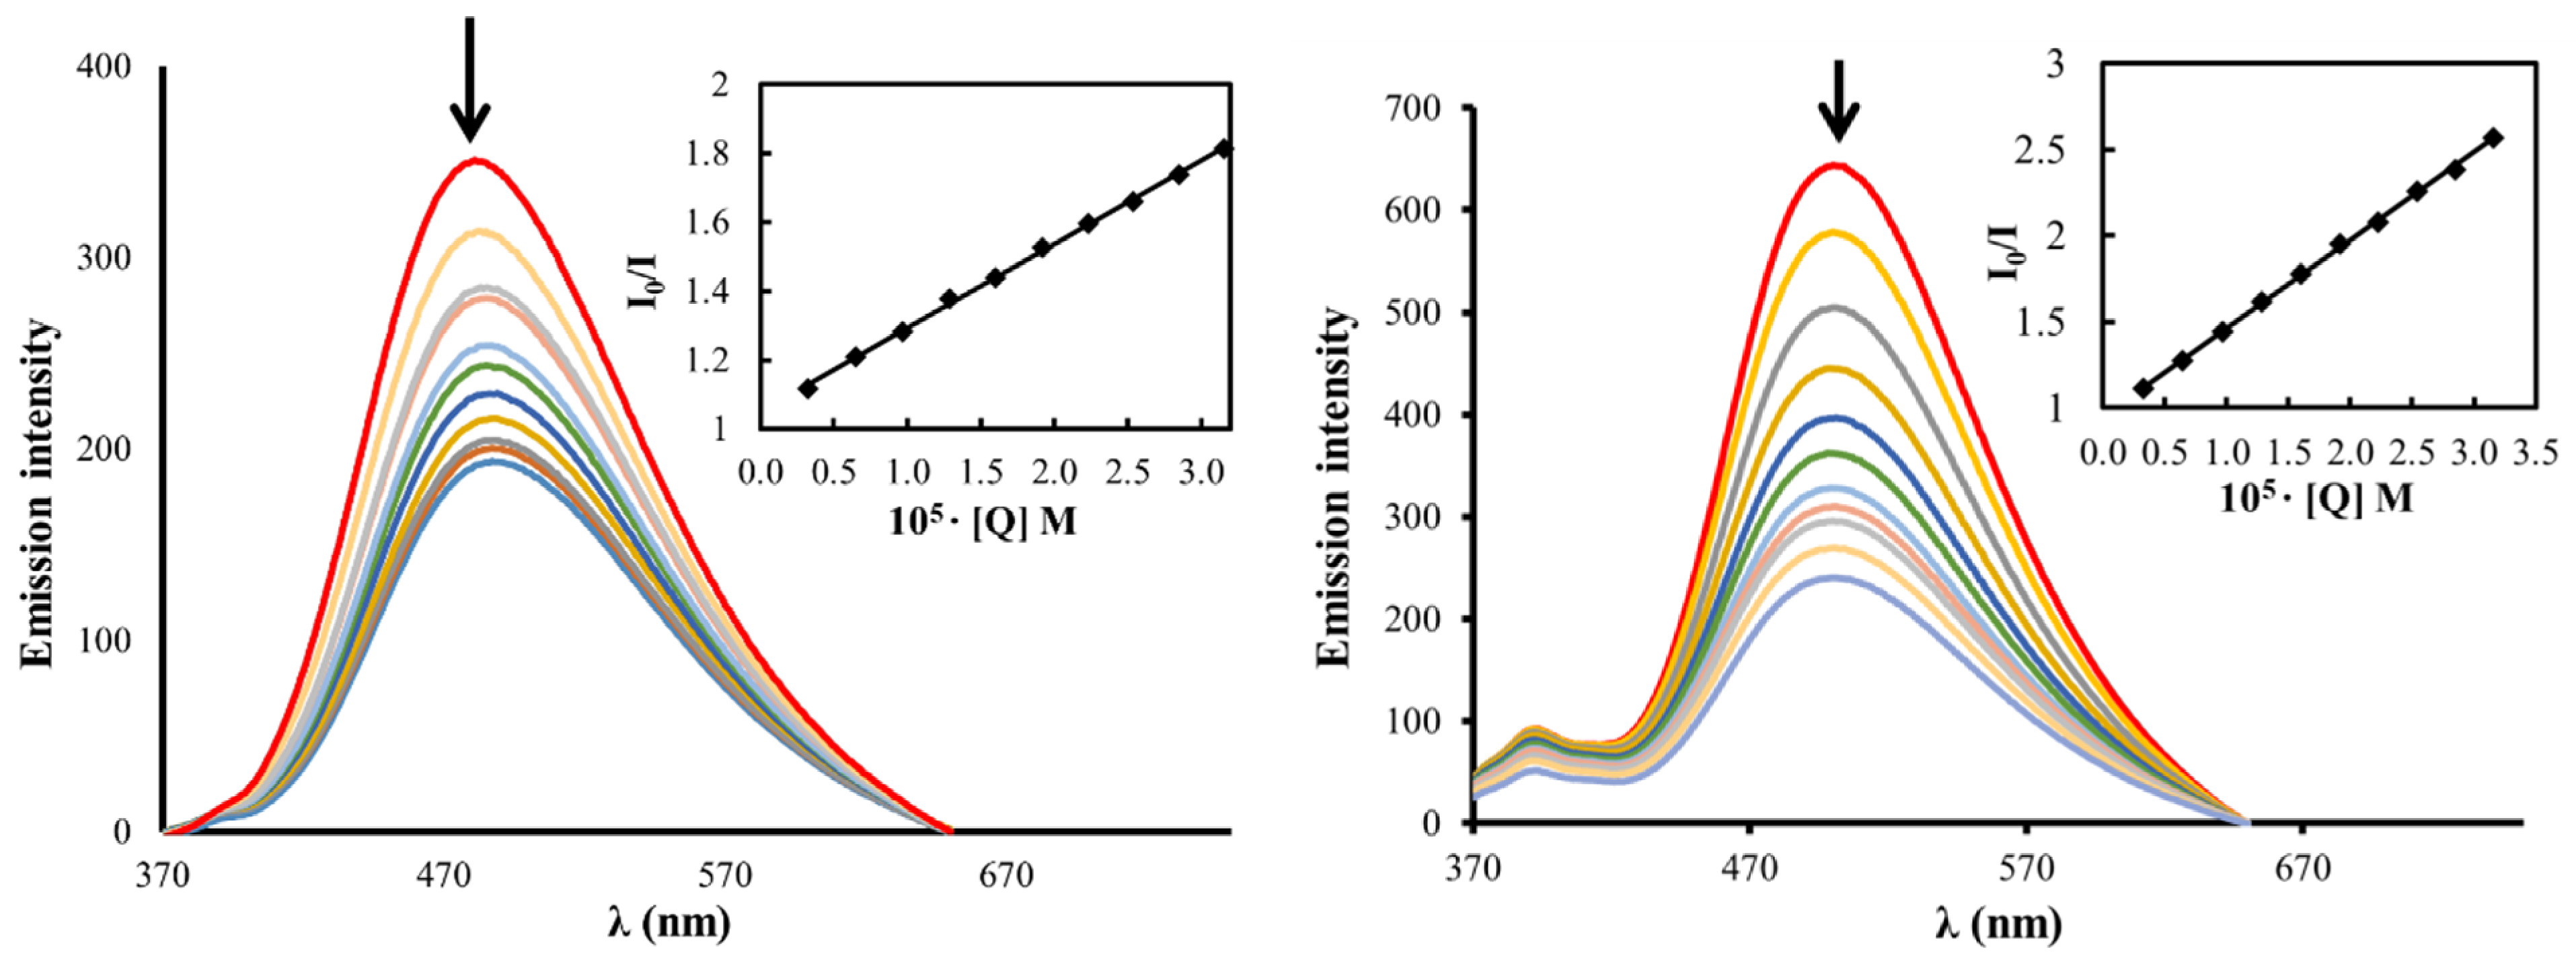
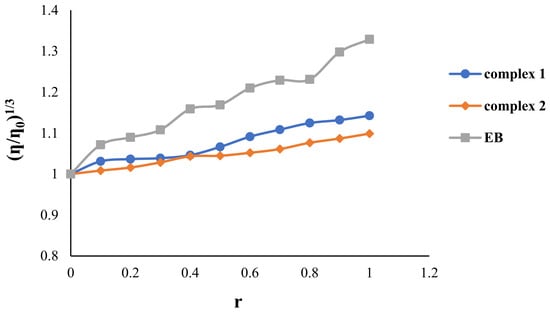
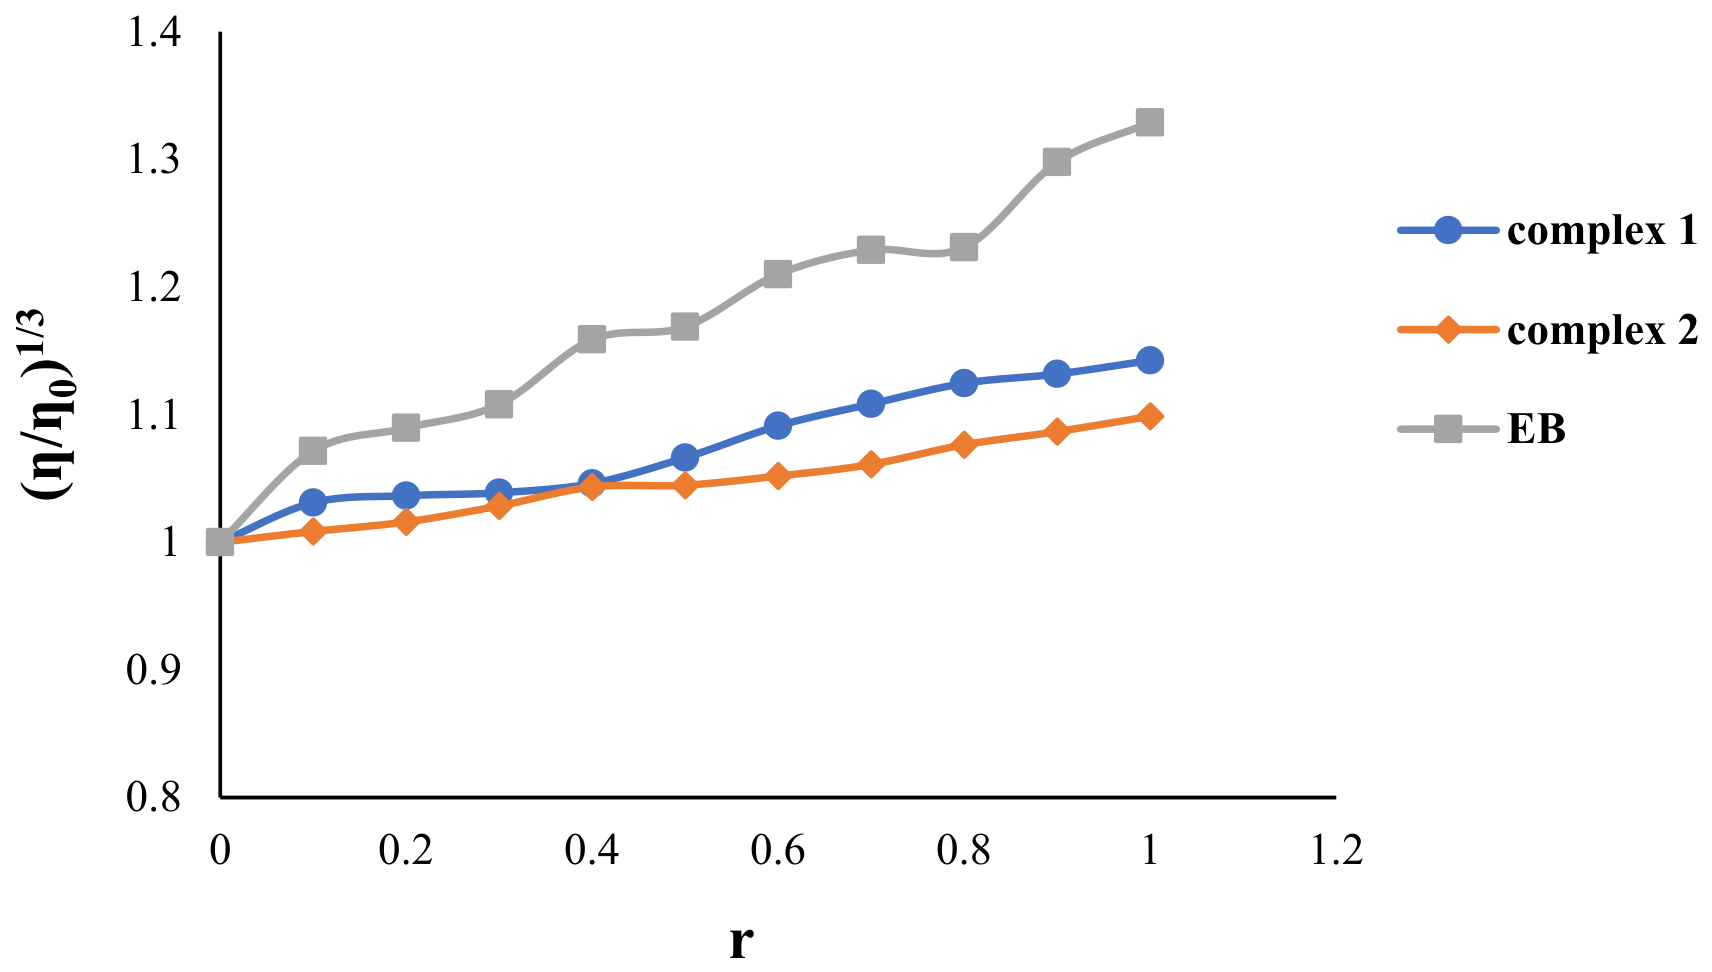
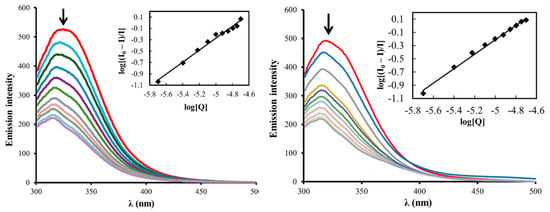
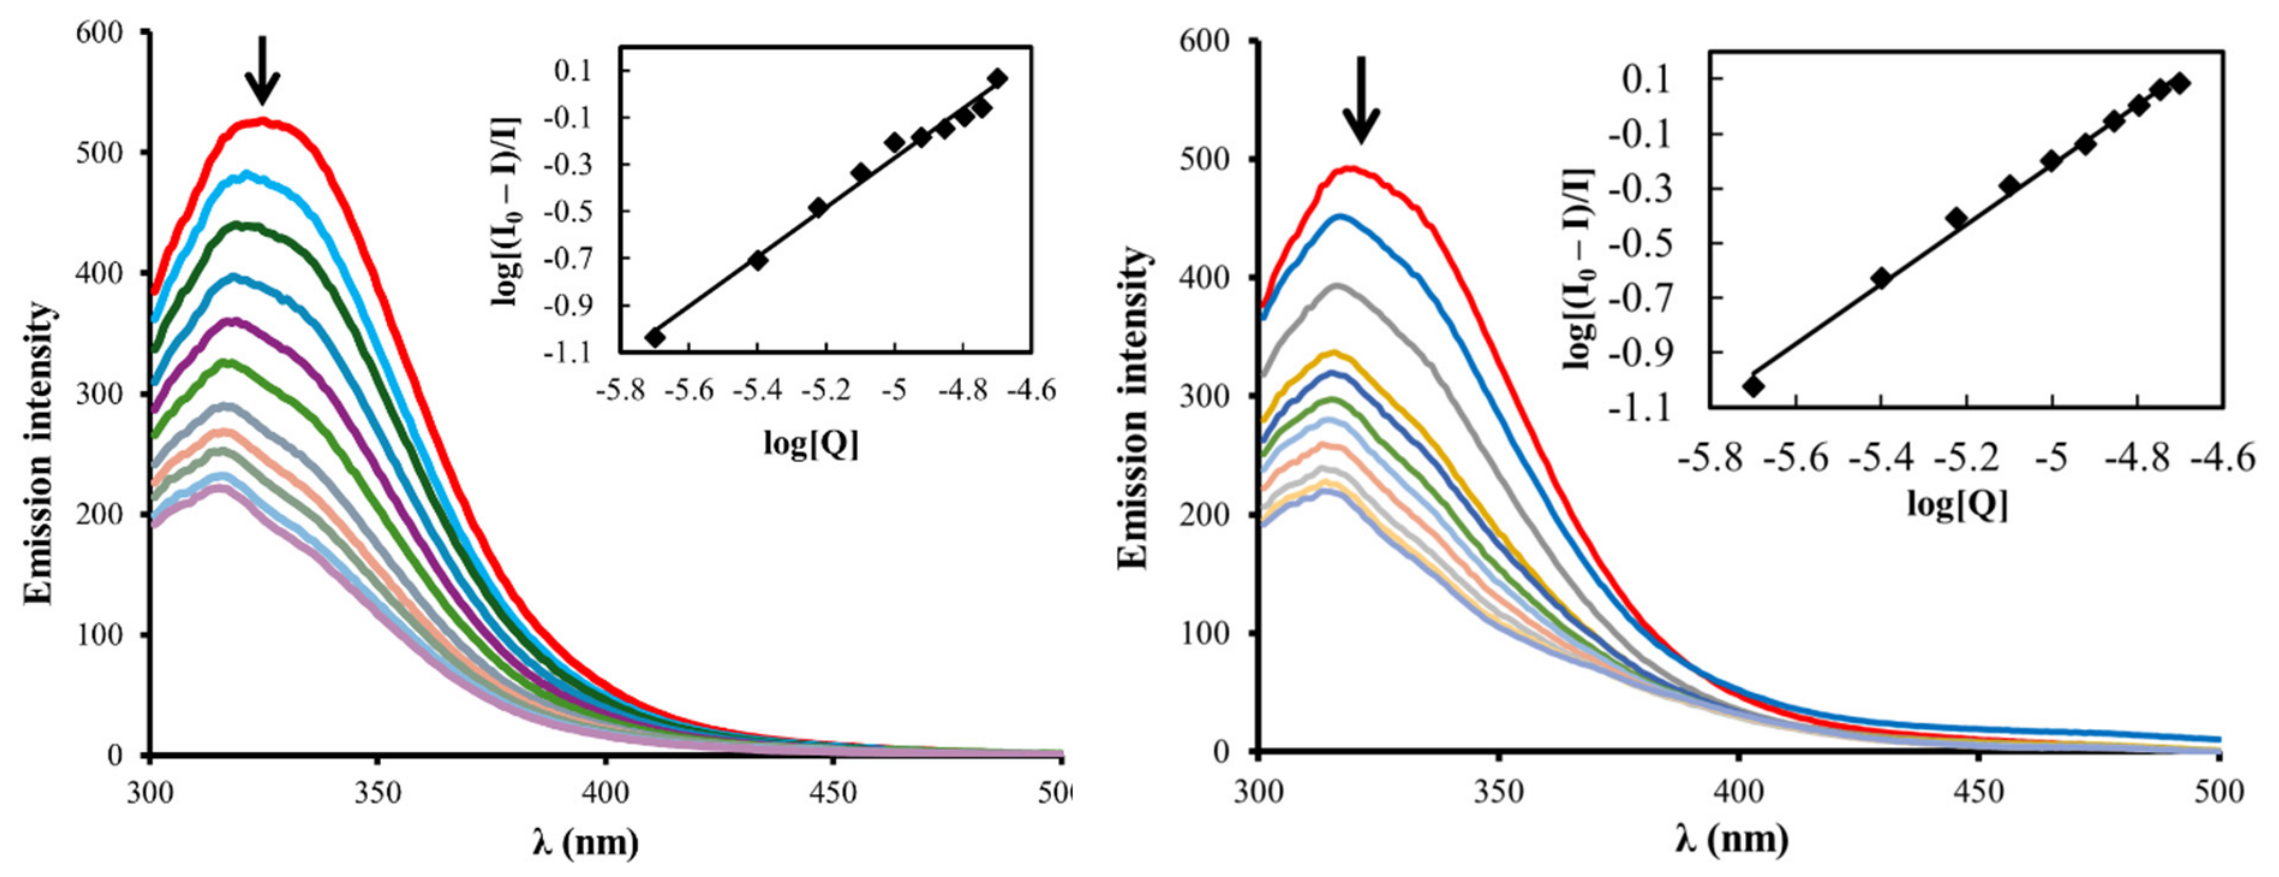
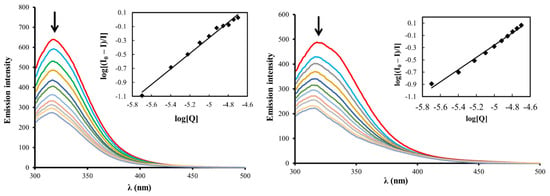
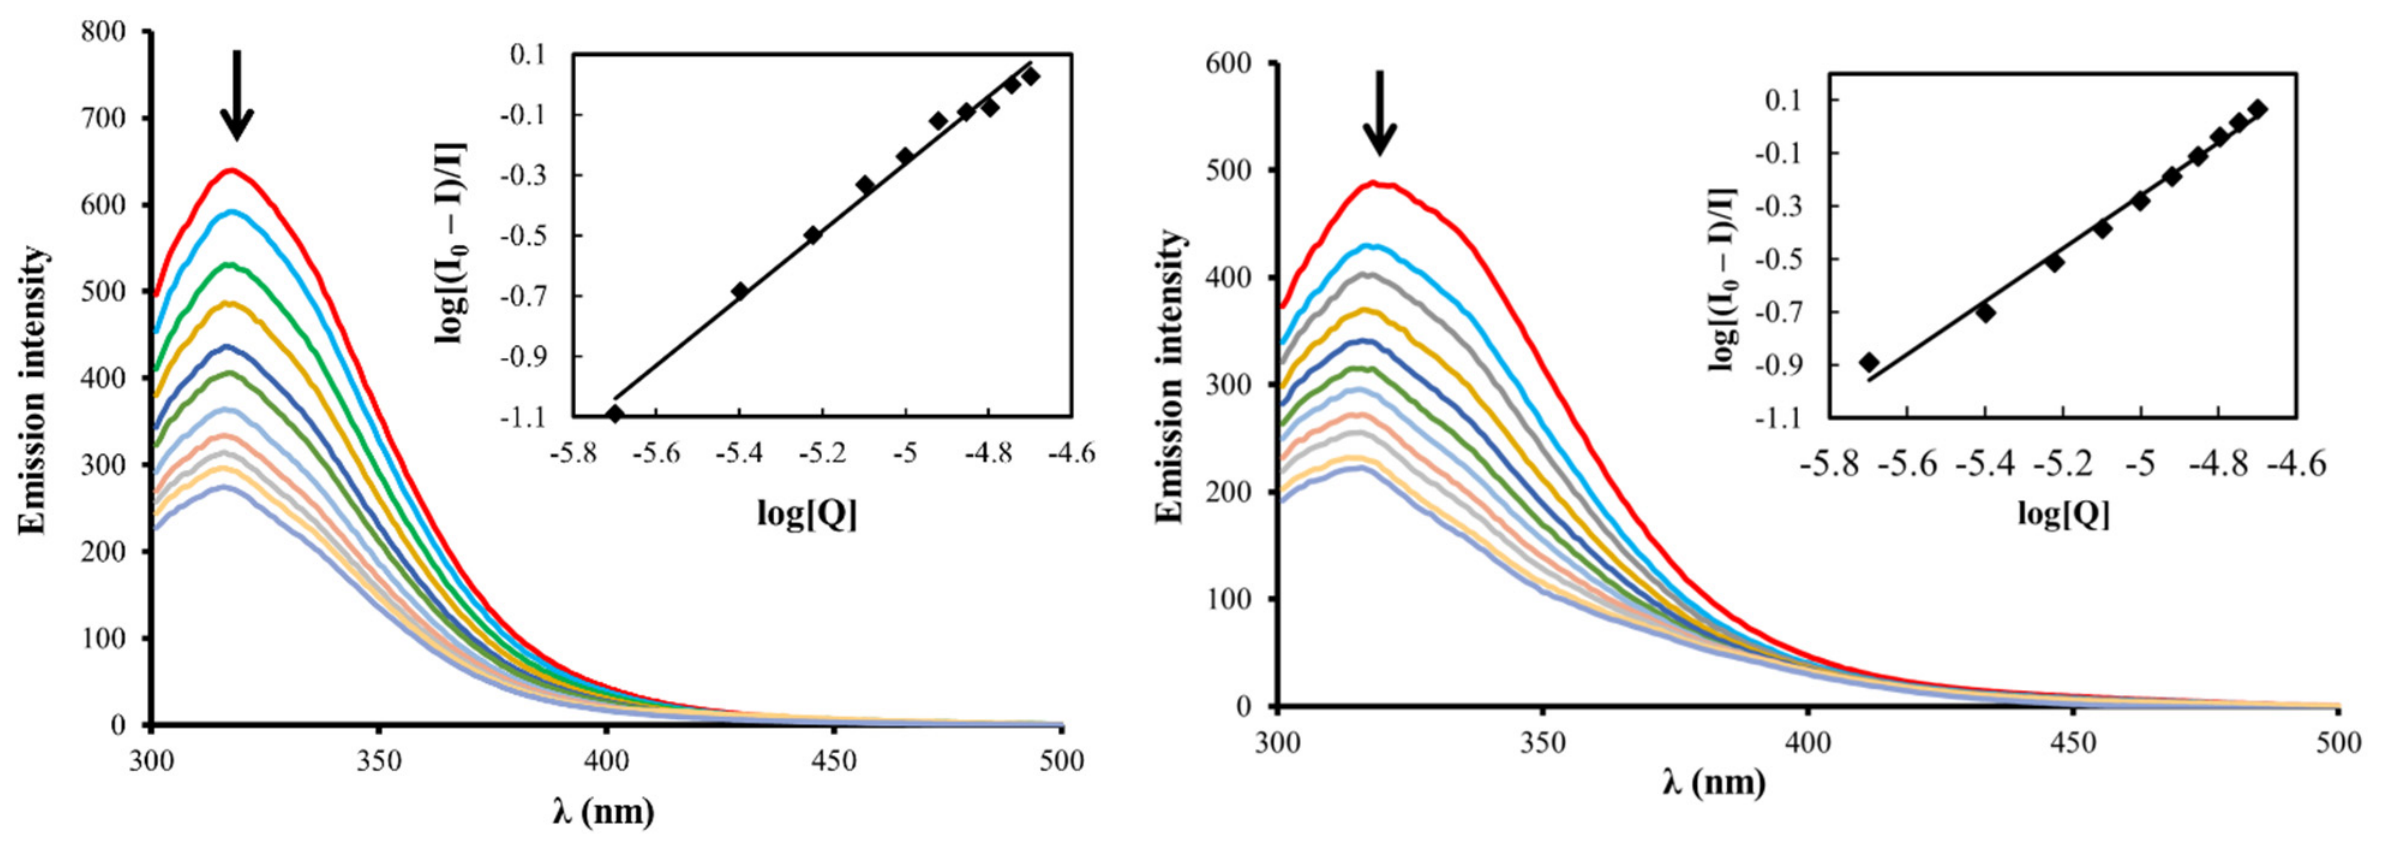
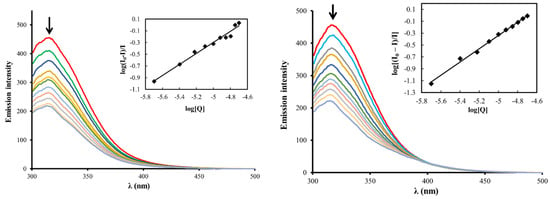
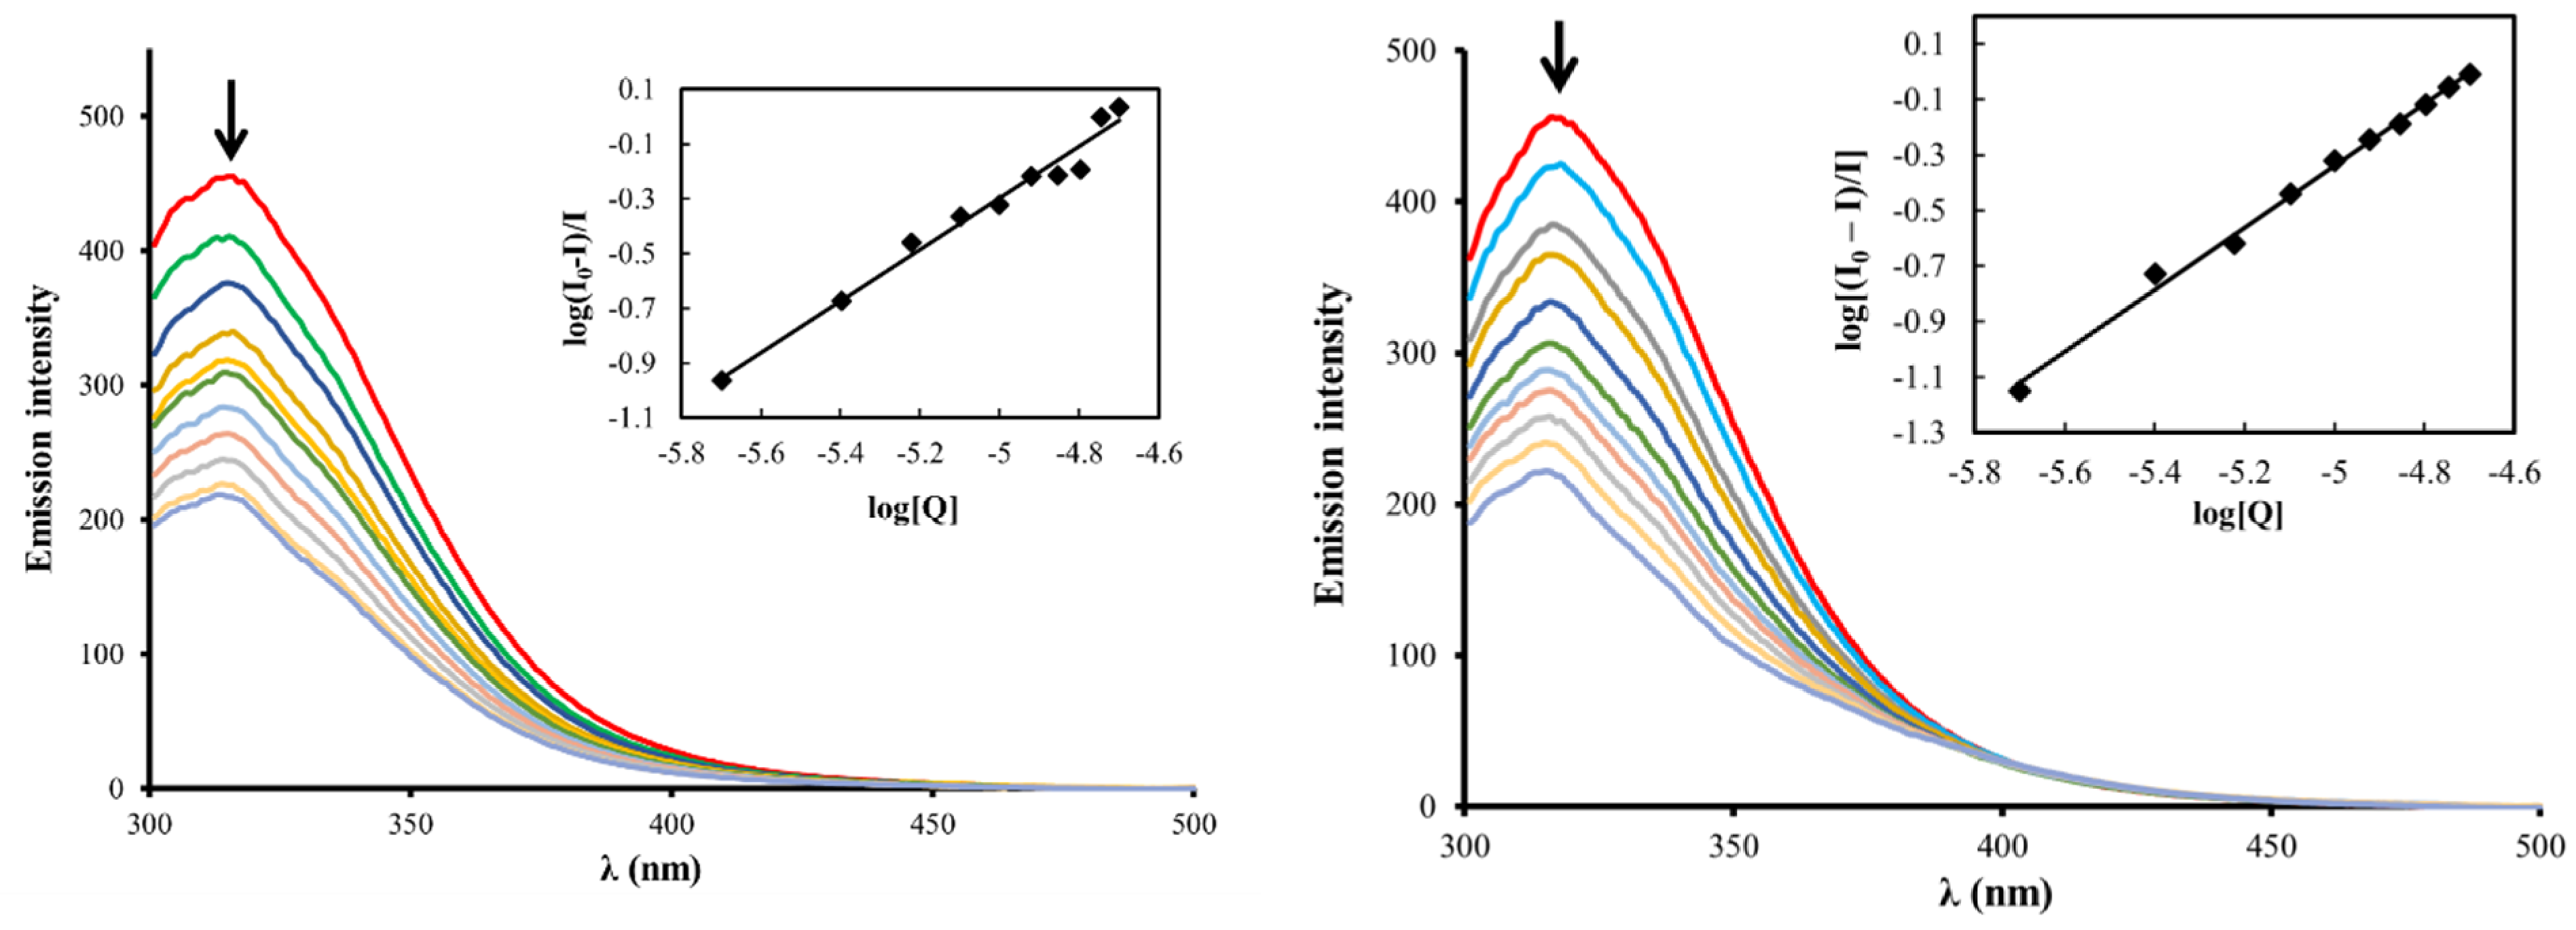
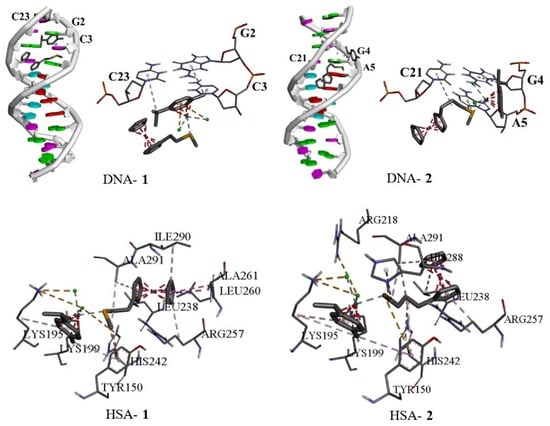
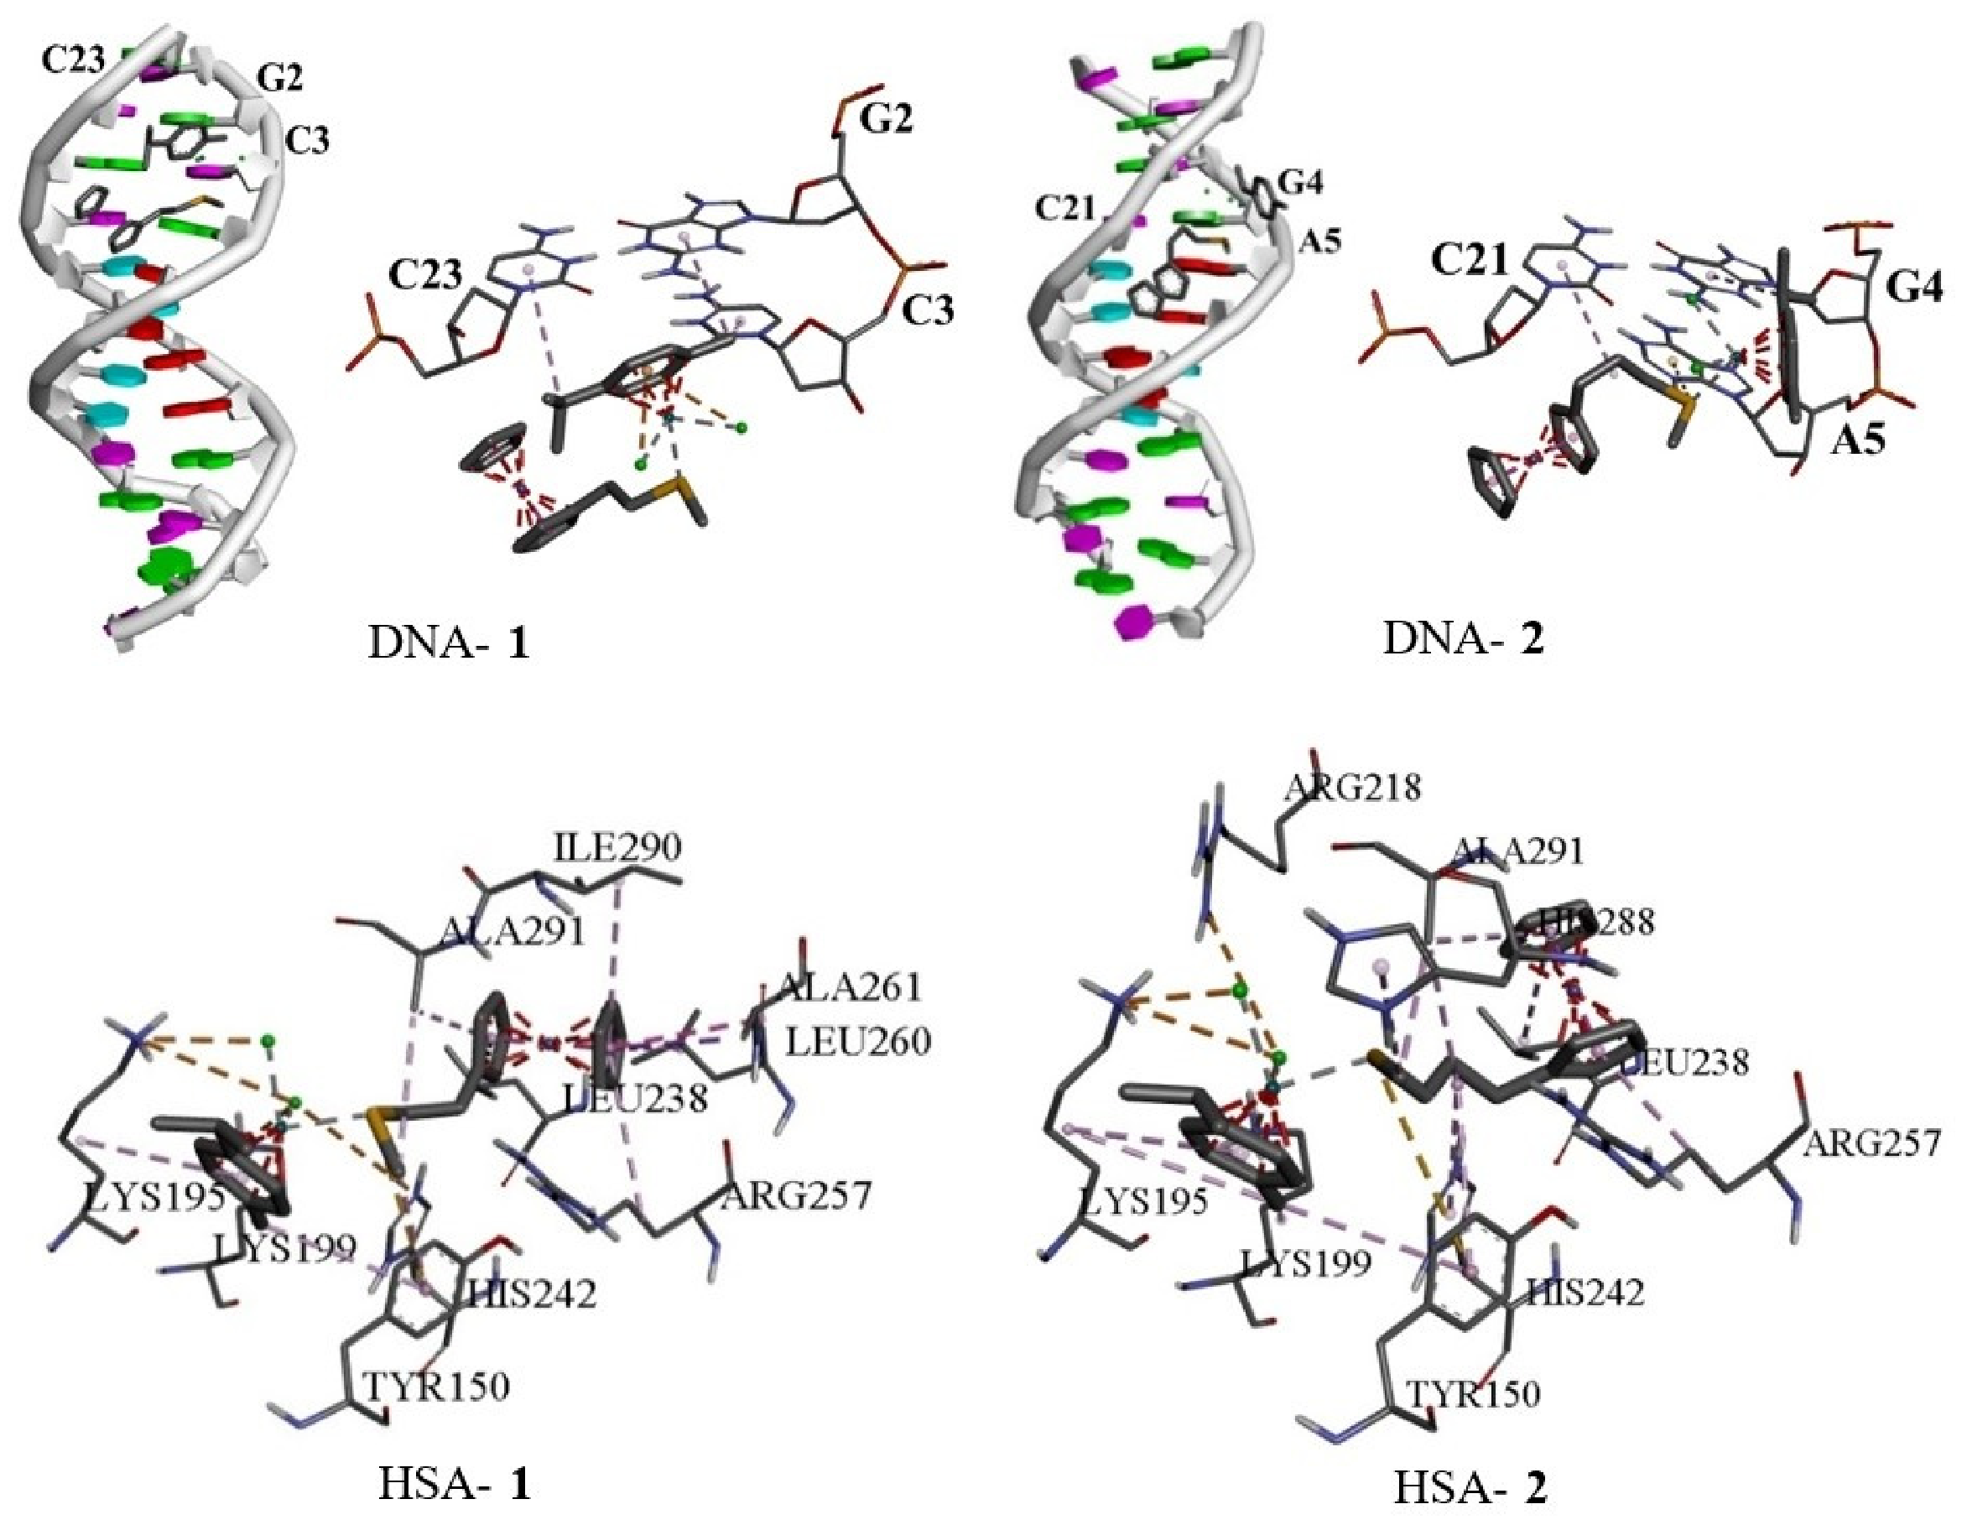

Disclaimer/Publisher’s Note: The statements, opinions and data contained in all publications are solely those of the individual author(s) and contributor(s) and not of MDPI and/or the editor(s). MDPI and/or the editor(s) disclaim responsibility for any injury to people or property resulting from any ideas, methods, instructions or products referred to in the content. |
© 2026 by the authors. Licensee MDPI, Basel, Switzerland. This article is an open access article distributed under the terms and conditions of the Creative Commons Attribution (CC BY) license.