


Abstract
Background: Acetaminophen (APAP) is widely used in pregnancy, and its oxidative metabolite N-acetyl-p-benzoquinone imine (NAPQI) may contribute to hepatotoxicity. Whether dosing time affects APAP oxidative metabolism during pregnancy remains undetermined. Methods: In a pregnancy physiologically based pharmacokinetic (PBPK) model of APAP, circadian rhythms in CYP2E1, hepatic blood flow (HBF), and glomerular filtration rate (GFR) were described by cosine functions. Maternal APAP and NAPQI-related exposure was simulated after a single 1000 mg oral dose at four dosing times at 40 weeks of gestation. Counterfactual analyses in which each rhythm was switched off quantified its contribution to the difference in the 20:00/08:00 exposure ratio relative to the no-rhythm reference. Rhythm amplitude, peak phase, and interindividual variability were also examined. Results: APAP exposure varied little with dosing time, with 20:00/08:00 ratios of 0.92 for AUC0–48h and 0.96 for Cmax. NAPQI-related exposure was highest at 20:00 and lowest at 08:00, with AUC0–48h and Cmax ratios of 2.42 and 3.52; virtual population simulations showed the same direction (median ratios, 2.52 and 3.51). Rhythm-removal comparisons showed that CYP2E1 had the largest conditional contribution (91.00% for AUC0–48h and 89.69% for Cmax, respectively), while HBF contributions were smaller and GFR contributed less than 1%. Increasing CYP2E1 amplitude widened the exposure change, whereas shifting its peak phase to 08:00 or 12:00 reversed the effect direction. Conclusions: These hypothesis-generating computational predictions identify biological timing as a determinant of modeled oxidative exposure at term. Clinical evaluation is needed before they can inform dosing decisions.
1. Introduction
Acetaminophen (APAP) is a commonly used antipyretic and analgesic during pregnancy, and its use is widespread [1,2]. Because nonsteroidal anti-inflammatory drugs are restricted after 20 weeks of gestation, APAP has become increasingly prominent for symptomatic treatment during pregnancy, and the safety of maternal APAP use continues to attract attention. Although APAP is generally well tolerated at therapeutic doses, it remains the most common cause of drug-induced acute liver failure in the United States and the United Kingdom [3]. In healthy adults taking APAP at the recommended maximum of 4 g/day, a substantial proportion develop elevated serum aminotransferases [4]. Pregnancy-related changes in hepatic blood flow (HBF), drug-metabolizing enzyme activity, and other physiological processes can alter maternal drug disposition [5], and case reports show that APAP-associated liver injury during pregnancy can progress to liver failure requiring transplantation [6]. Therefore, the hepatic safety risk associated with maternal APAP exposure during pregnancy warrants attention.
APAP is primarily conjugated by UGT and SULT enzymes into inactive glucuronide and sulfate metabolites, while a small fraction undergoes oxidation by CYP2E1 and other enzymes to form the reactive metabolite NAPQI. NAPQI is normally rapidly detoxified by glutathione; when formation exceeds detoxification, as can occur in overdose, protein binding and oxidative stress can contribute to hepatocyte injury [7,8]. The broader toxicological relevance of oxidative stress is illustrated by Li et al., who linked impaired antioxidant defenses and lipid peroxidation with reproductive toxicity in female rats exposed to beta-cypermethrin and emamectin benzoate [9]. In addition to gestational age, circadian rhythms may be an important but long-neglected source of variability. Many CYP, UGT, and SULT family members show rhythmic hepatic expression [10,11]. Animal studies show that CYP2E1 and SULT1A1 are regulated by molecular clock pathways such as CLOCK/BMAL1 [12,13], and circadian differences in APAP hepatotoxicity associated with rhythmic CYP2E1 overexpression have been demonstrated in animals [14]. Human HBF, gastric emptying, and glomerular filtration rate (GFR) also exhibit circadian fluctuations [15,16,17], and pregnancy-related changes in cortisol rhythm may further reshape the temporal structure of drug disposition [18]. These findings suggest that dosing time may affect APAP oxidative metabolism by altering the relationship between APAP exposure and the CYP2E1 activity rhythm, but this relationship remains to be characterized in pregnant women.
Direct clinical evidence is currently insufficient to determine how dosing time affects APAP exposure and NAPQI formation during pregnancy. This evidence gap is not accidental: pregnant women are underrepresented in interventional drug studies, and chronopharmacokinetic studies require control of dosing, sampling, sleep, and meal timing, increasing the difficulty of study design and implementation [19,20,21,22]. In this context, physiologically based pharmacokinetic (PBPK) modeling, owing to its transparent mechanistic structure, ability to integrate physiological and enzymatic parameters, and capacity to perform virtual trials without directly exposing pregnant women or fetuses, has been recognized by regulators as an important tool for filling PK data gaps in pregnant populations and supporting dose decisions [23]. In other words, PBPK modeling provides mechanistic surrogate evidence when direct clinical evidence is lacking and can support hypothesis generation and prioritization for subsequent human studies.
Among existing models, the pregnancy APAP PBPK model developed by Mian et al. provides an extensible foundation [24]: it integrates physiological and enzyme activity changes across gestation, evaluates predictions for APAP and measurable stable metabolites using available clinical data, and simulates APAP pharmacokinetics following oral administration of 1000 mg every 6 h at different gestational ages. APAP exposure decreased with advancing gestation, with the lowest steady-state mean concentration in late pregnancy. Under the assumption that CYP2E1 activity was uniformly increased by 80%, the molar dose fraction of APAP converted to NAPQI was highest in the first trimester (11.0%), compared with 7.7% in nonpregnant individuals. These findings indicate that pregnancy itself may alter the NAPQI formation burden, but the model did not incorporate the temporal dimension of circadian rhythms [24].
Building on the pregnancy APAP PBPK model developed by Mian et al. [24], this study incorporated circadian rhythms in CYP2E1, HBF, and GFR into a unified framework and simulated maternal APAP- and NAPQI-related exposure after a single oral dose of APAP at 08:00, 14:00, 20:00, and 02:00 in women in late pregnancy, thereby examining how exposure varies with dosing time. Counterfactual scenario analysis was used to identify the rhythm sources of dosing-time differences. While keeping the virtual individual, dose, and pregnancy physiology constant, we switched individual circadian rhythms on or off to construct control scenarios. By comparing exposure ratios between dosing times across scenarios, we quantified the relative contributions of CYP2E1, HBF, and GFR rhythms to dosing-time differences in exposure and evaluated the influence of uncertainty in rhythm parameters and interindividual variability. This study aimed to evaluate the model-predicted relationship between dosing time and NAPQI-related exposure and provide testable hypotheses for chronopharmacokinetic studies of APAP during pregnancy.
2. Results
2.1. Maternal APAP Exposure Is Minimally Affected by Dosing Time
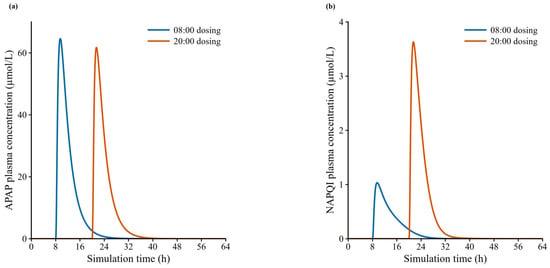
Virtual individual simulations showed little variation in maternal APAP exposure across dosing times (02:00, 08:00, 14:00, and 20:00): Cmax ranged from 61.73 to 64.58 µmol/L and AUC0–48h from 277.92 to 300.88 µmol·h/L. After 08:00 and 20:00 dosing, AUC0–48h was 300.88 and 277.92 µmol·h/L, respectively, with a 20:00/08:00 ratio of 0.92 (Figure 1a; Table 1). Virtual population simulations were consistent, with median Cmax ranging from 83.19 to 84.85 µmol/L and median AUC0–48h from 288.41 to 311.76 µmol·h/L; IQRs overlapped across dosing times (Table 1).
Figure 1.
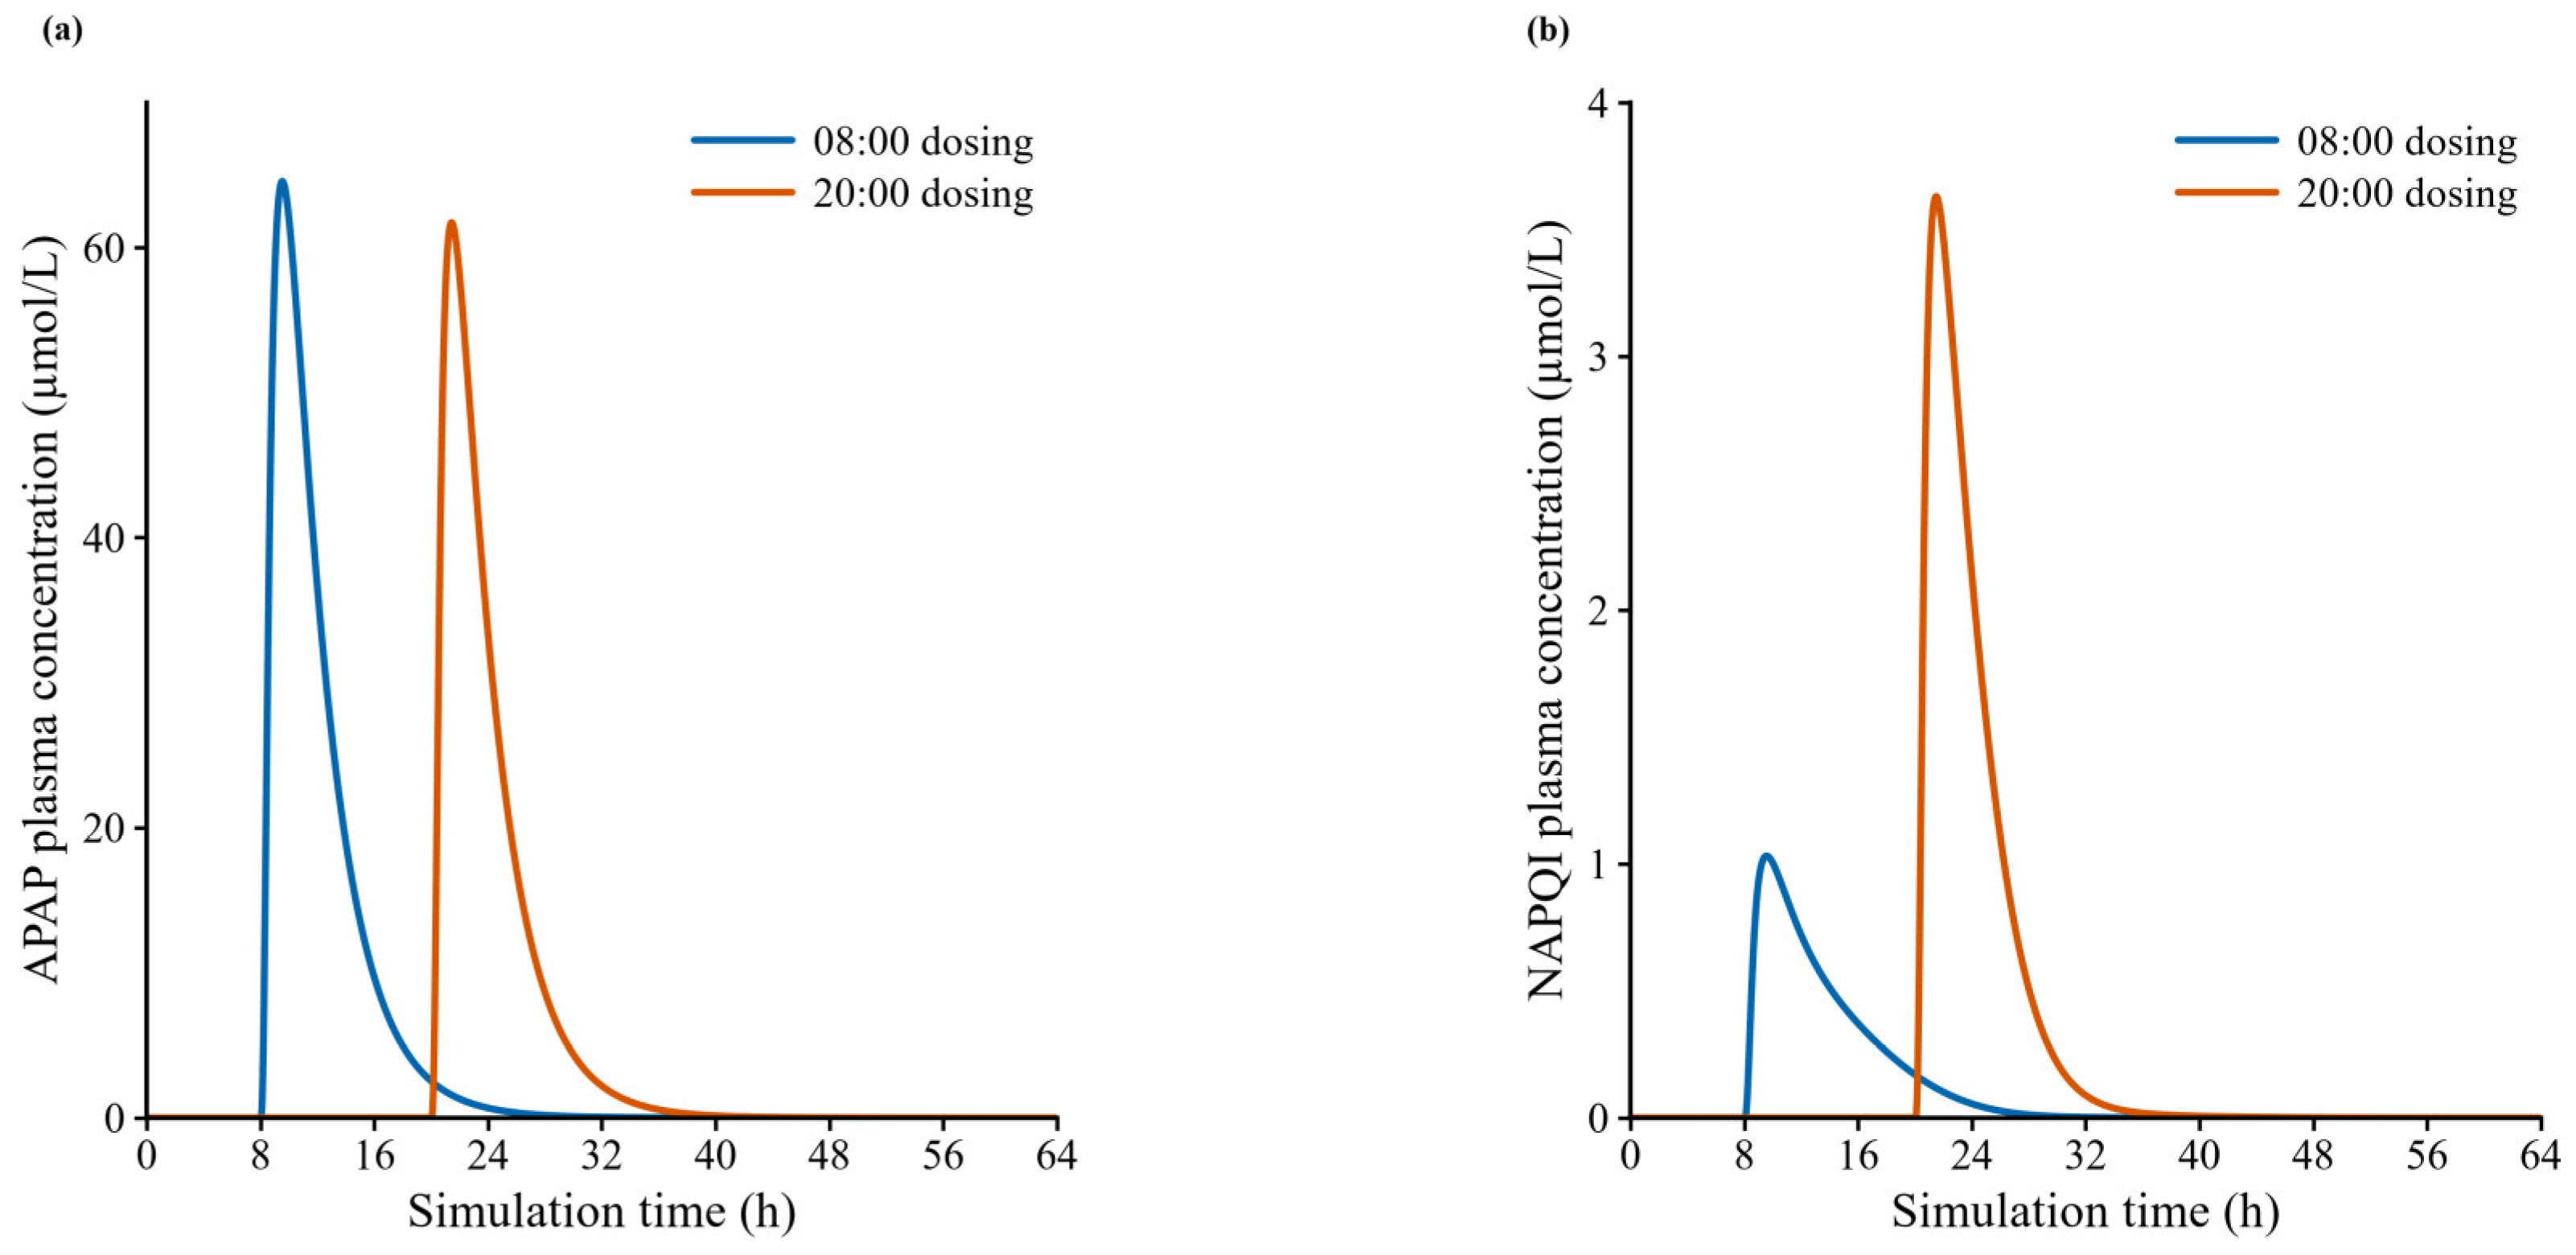
Model-predicted maternal APAP and NAPQI concentration–time curves after 08:00 and 20:00 dosing. (a) Maternal plasma APAP concentrations over time after a single 1000 mg oral dose of APAP at 08:00 and 20:00. (b) Model-predicted maternal plasma NAPQI concentrations over time after 08:00 and 20:00 dosing with all three rhythms on. APAP, acetaminophen; NAPQI, N-acetyl-p-benzoquinone imine.
Table 1.
Maternal APAP exposure in virtual individual and population simulations at different dosing times.
The ratios of the population medians at 20:00 versus 08:00 were 0.98 for Cmax and 0.93 for AUC0–48h, close to the virtual individual ratios (0.96 and 0.92). These simulations showed little variation in total maternal APAP exposure across dosing times.
2.2. NAPQI-Related Exposure Varies with Dosing Time
Under the reference rhythm assumptions, model-predicted NAPQI-related exposure varied substantially with dosing time. In virtual individual simulations, NAPQI Cmax ranged from 1.03 to 3.63 µmol/L and AUC0–48h from 6.90 to 16.68 µmol·h/L. Among the four dosing times, both metrics were highest after 20:00 and lowest after 08:00 dosing; the 20:00/08:00 Cmax and AUC0–48h ratios were 3.52 and 2.42, respectively (Figure 1b; Table 2). Virtual population simulations were consistent: median Cmax and AUC0–48h were 4.21 µmol/L and 14.12 µmol·h/L after 20:00 dosing and 1.20 µmol/L and 5.60 µmol·h/L after 08:00 dosing. The corresponding ratios of the population medians were 3.51 and 2.52, respectively; the IQRs at the two times did not overlap (Table 2).
Table 2.
NAPQI exposure in virtual individual and population simulations at different dosing times.
2.3. CYP2E1 Shows the Largest Conditional Rhythm-Removal Contribution Under the Reference Assumptions
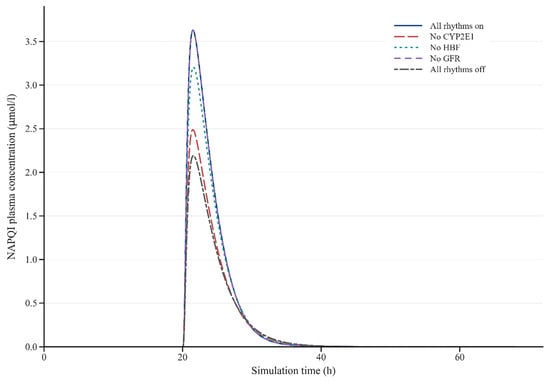
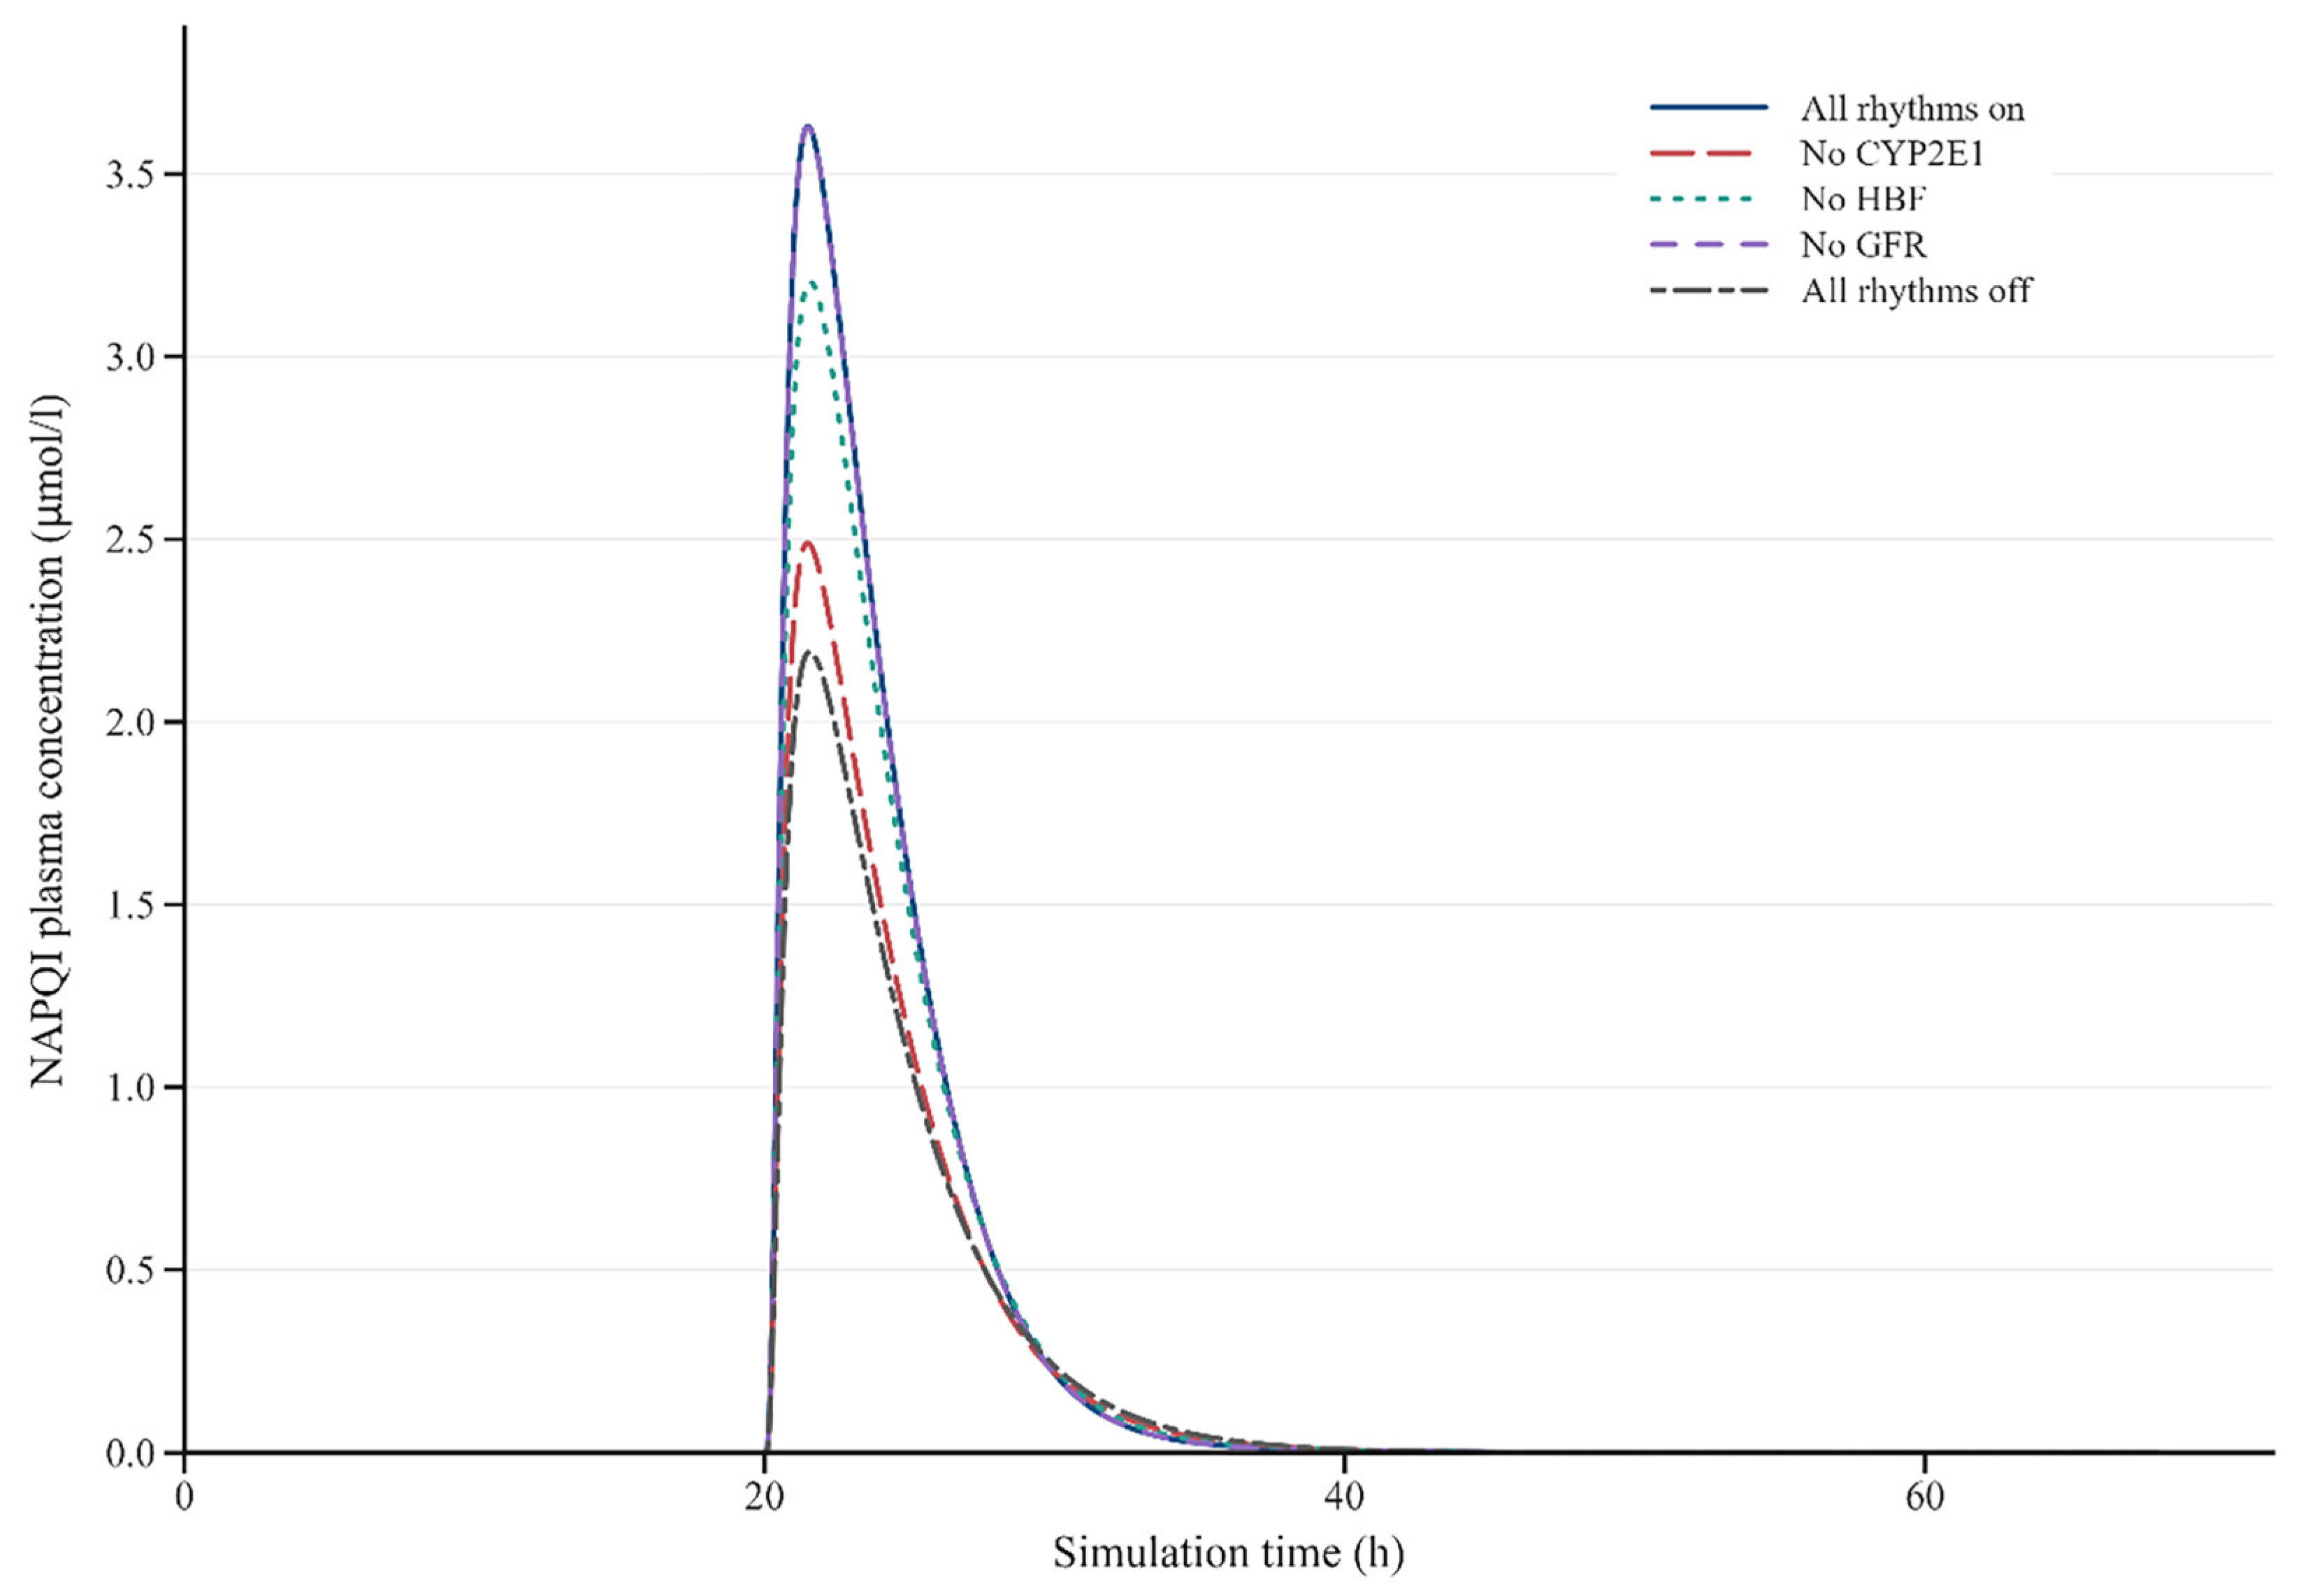
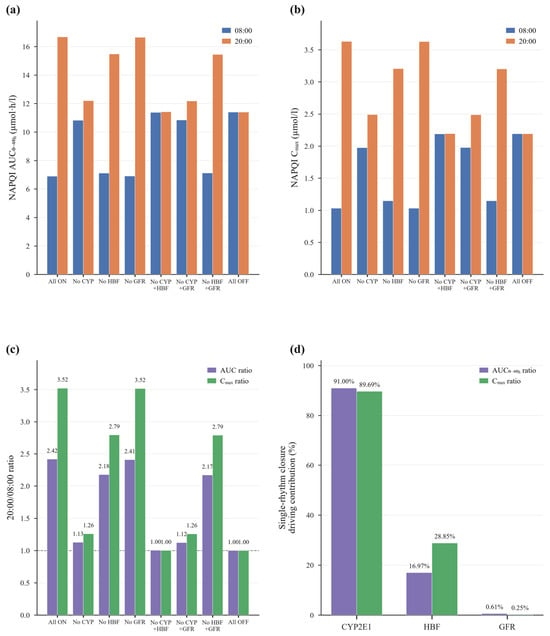
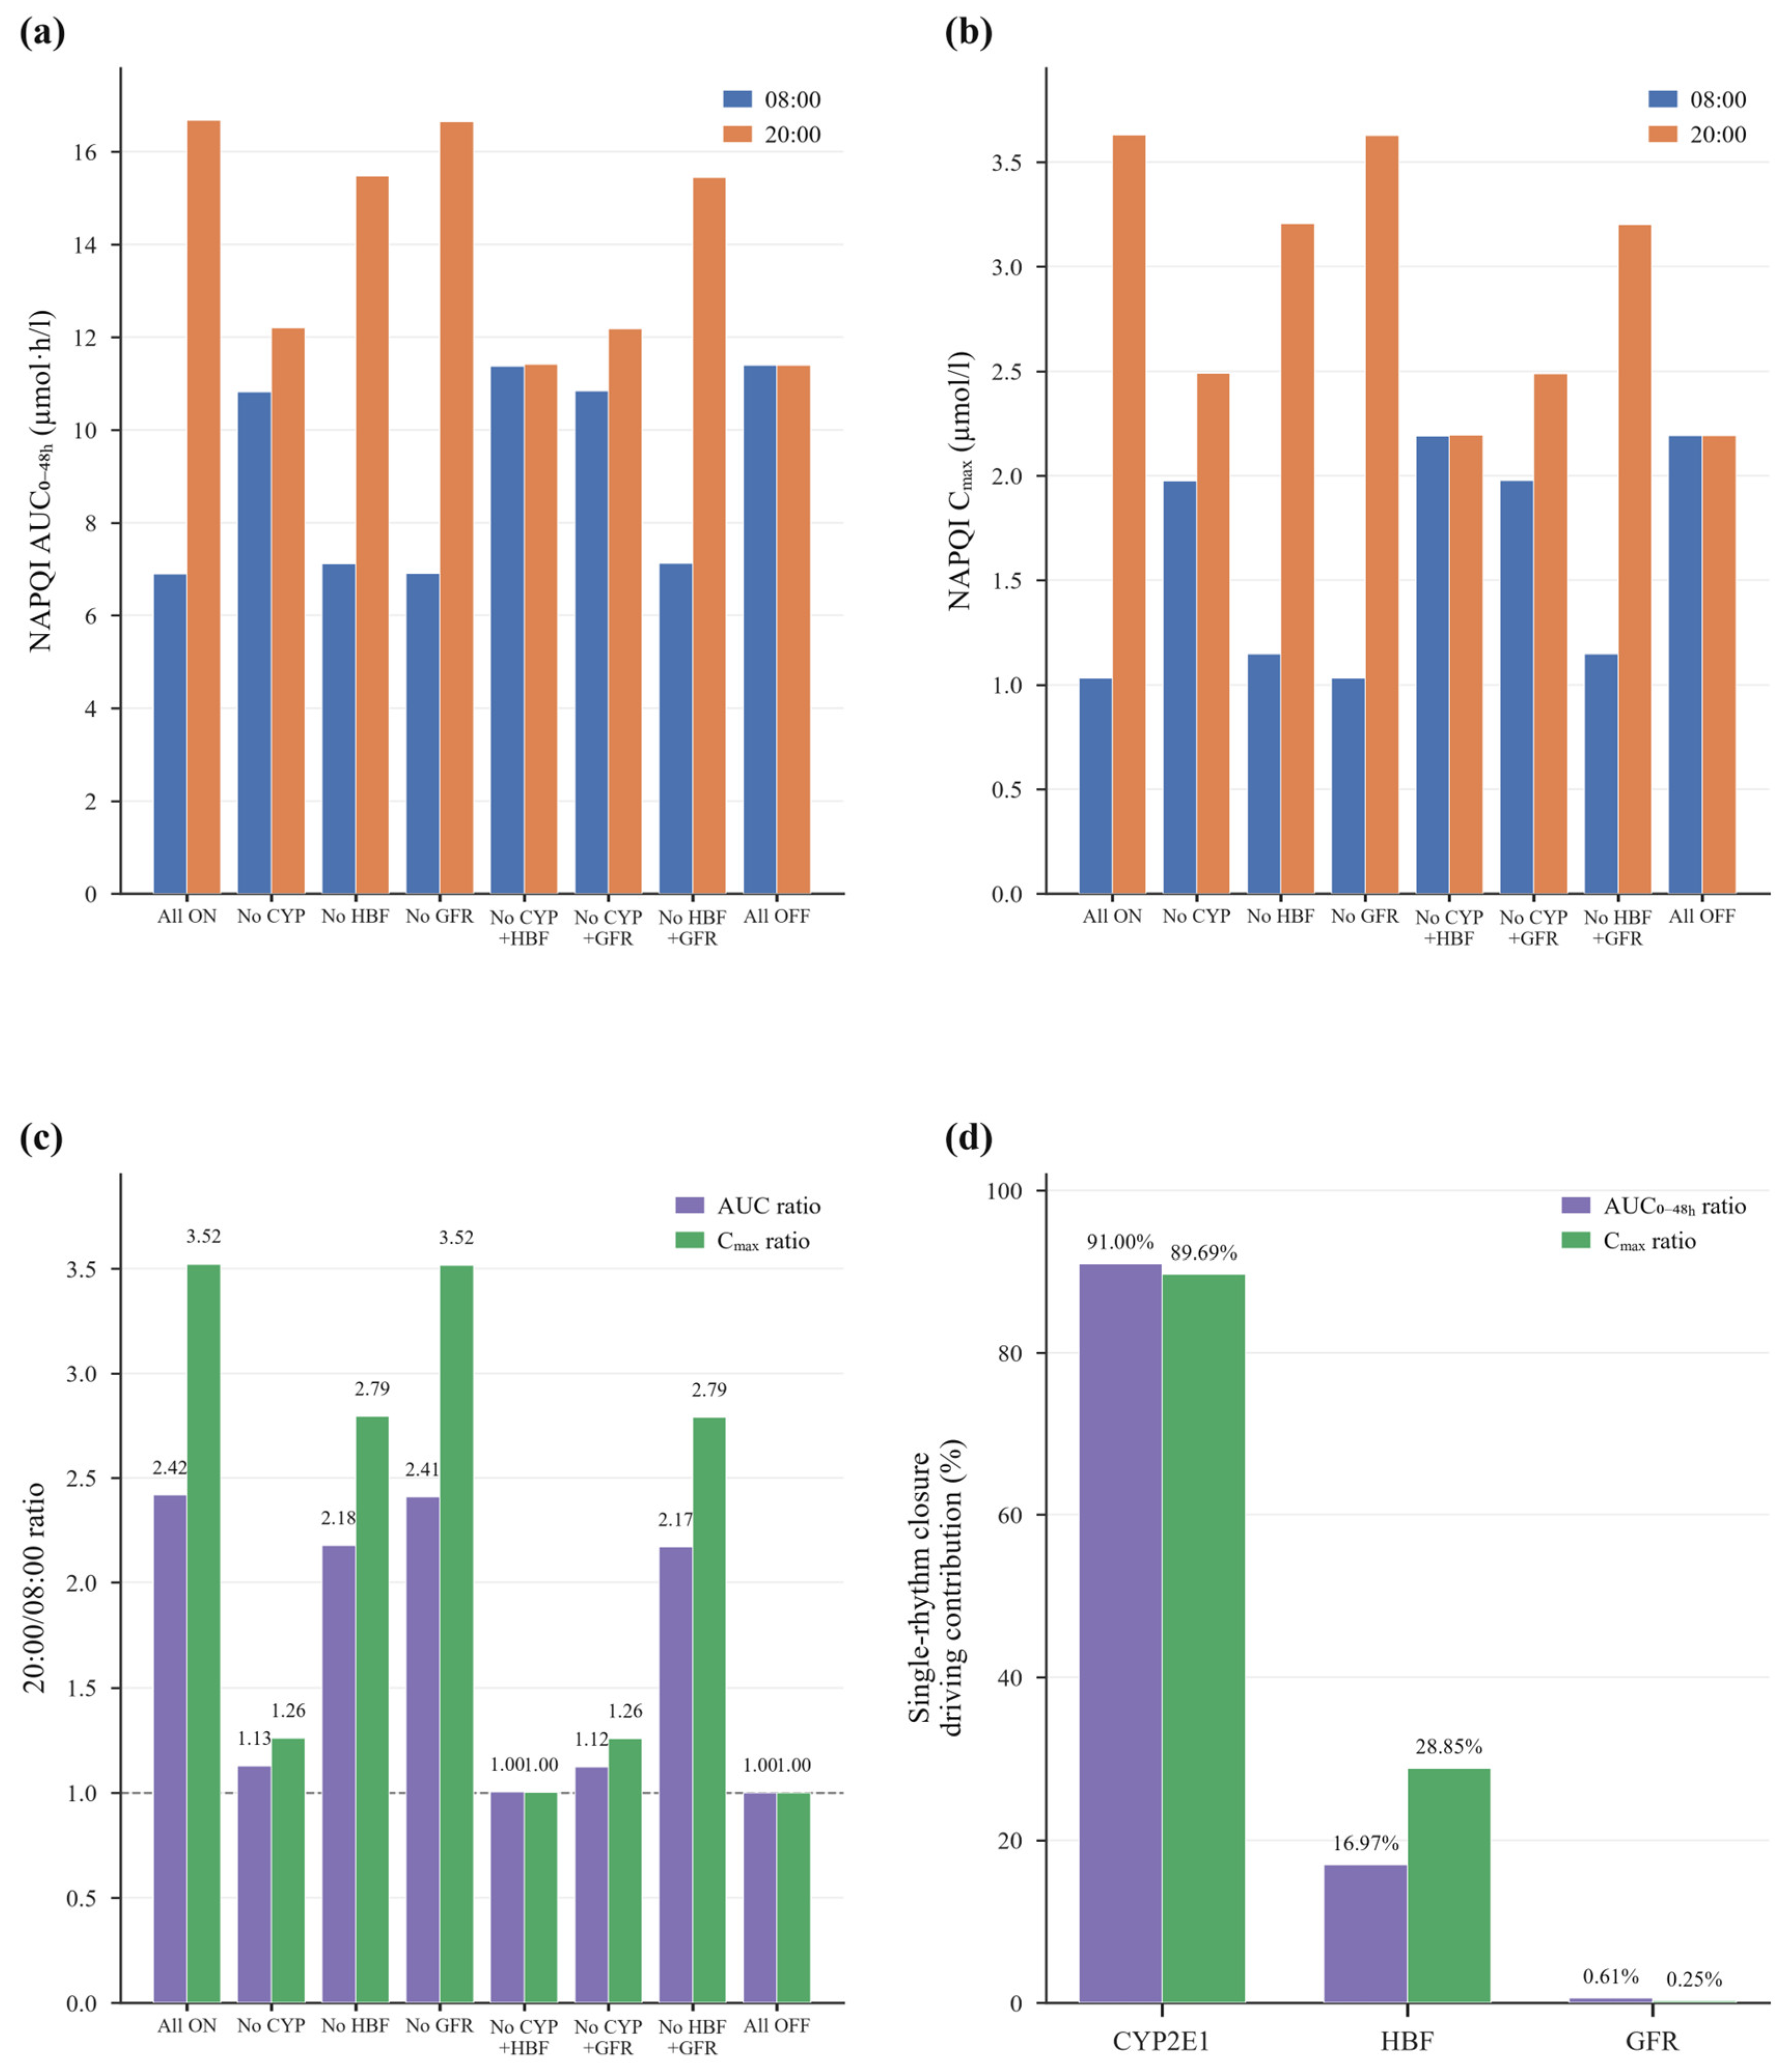
To identify the rhythm sources of dosing-time differences in NAPQI exposure, we performed counterfactual analyses by sequentially turning off individual rhythm components. With all three rhythms on, the 20:00/08:00 AUC0–48h and Cmax ratios were 2.42 and 3.52, respectively. Turning off the CYP2E1 rhythm alone reduced these ratios to 1.13 and 1.26, respectively; turning off HBF reduced them to 2.18 and 2.79; and turning off GFR had little effect (2.41 and 3.52). After pairwise removal of CYP2E1 + HBF, CYP2E1 + GFR, and HBF + GFR, AUC0–48h ratios were 1.00, 1.12, and 2.17, respectively, and Cmax ratios were 1.00, 1.26, and 2.79 (Figure 2 and Figure 3a–c; Table 3). In terms of net contribution, turning off CYP2E1 changed the AUC0–48h net contribution at 08:00 and 20:00 from baseline values of −39.45% and +46.38% to −5.05% and +7.07%, respectively. After turning off HBF, AUC0–48h net contributions were −37.59% and +35.86% at the two times. Turning off GFR produced smaller changes (Table 4). The conditional rhythm-removal contributions for the 20:00/08:00 AUC0–48h ratio were 91.00%, 16.97%, and 0.61% for CYP2E1, HBF, and GFR, respectively, and the corresponding Cmax shares were 89.69%, 28.85%, and 0.25% (Figure 3d). Under the reference rhythm assumptions, turning off CYP2E1 produced the largest reduction in the 20:00/08:00 ratio, followed by HBF, whereas GFR had little effect.
Figure 2.
Model-predicted plasma NAPQI concentration–time curves under different counterfactual scenarios after 20:00 dosing. NAPQI, N-acetyl-p-benzoquinone imine; All rhythms on; No CYP2E1, CYP2E1 rhythm off; No HBF, hepatic blood flow rhythm off; No GFR, glomerular filtration rate rhythm off; All rhythms off, all three rhythms off.
Figure 3.
Scenario comparisons and contribution decomposition for NAPQI exposure in counterfactual analyses. (a) Virtual individual NAPQI AUC0–48h after 08:00 and 20:00 dosing across counterfactual scenarios. (b) Virtual individual NAPQI Cmax after 08:00 and 20:00 dosing across counterfactual scenarios. (c) Changes in NAPQI AUC0–48h and Cmax 20:00/08:00 ratios across counterfactual scenarios. (d) Conditional rhythm-removal contributions of CYP2E1, HBF, and GFR to the changes in the 20:00/08:00 exposure ratios (AUC0–48h and Cmax) relative to the no-rhythm reference, estimated by turning off each rhythm while the other two remained active. AUC0–48h, area under the plasma concentration–time curve from 0 to 48 h; Cmax, maximum plasma concentration; NAPQI, N-acetyl-p-benzoquinone imine; All ON, all three rhythms on; No CYP, CYP2E1 circadian rhythm off; No HBF, hepatic blood flow circadian rhythm off; No GFR, glomerular filtration rate circadian rhythm off; No CYP + No HBF, both CYP2E1 and hepatic blood flow rhythms off; No CYP + No GFR, both CYP2E1 and glomerular filtration rate rhythms off; No HBF + No GFR, both hepatic blood flow and glomerular filtration rate rhythms off; All OFF, all three rhythms off.
Table 3.
Virtual individual NAPQI AUC0–48h and Cmax under counterfactual scenarios.
Table 4.
Net percentage changes in NAPQI AUC0–48h and Cmax under counterfactual scenarios relative to the no-rhythm reference.
2.4. Sensitivity Analysis
To examine the influence of rhythm parameter settings, we performed sensitivity analyses on relative amplitude and peak phase for CYP2E1, HBF, and GFR. When CYP2E1 relative amplitude increased from 0.4 to 0.6 (baseline, 0.5), the magnitude of net contribution increased: for 08:00 dosing, the AUC0–48h net contribution changed from −32.43% to −46.55%, and for 20:00 dosing it increased from 38.67% to 54.00% (Table S1). With CYP2E1 relative amplitude fixed at 0.5 and all other rhythm parameters held at baseline, changing its peak phase from 22:00 affected the direction of net contribution. When peak phase shifted to 12:00, the AUC0–48h net contribution changed from −39.45% to +27.16% for 08:00 dosing, and from +46.38% to −31.73% for 20:00 dosing; Cmax net contribution changed in the same direction. A peak phase of 08:00 also reversed both metrics relative to the 22:00 baseline: AUC0–48h net contributions were +19.46% and −25.67% for 08:00 and 20:00 dosing, respectively, and Cmax net contributions were +30.67% and −39.43% (Table S2). When HBF relative amplitude varied from 0.5× to 1.5×, the AUC0–48h net contribution after 20:00 dosing ranged from 40.71% to 53.06%; when peak phase shifted from 06:00 to 10:00, it ranged from 39.56% to 50.55%. Changes in GFR amplitude and peak phase produced almost no change in net contribution (Table S3). These single-individual results indicate that net-contribution magnitude and direction were most sensitive to CYP2E1 amplitude and to the alignment between its peak phase and dosing time.
To characterize physiological variability while holding rhythm amplitudes and phases at their reference values, we simulated the 2000 virtual individuals with all three rhythms on and compared the resulting net contributions. Median AUC0–48h net contributions were −41.93% and 49.01% for 08:00 and 20:00 dosing, respectively, and median Cmax net contributions were −52.32% and 67.27%, with narrow IQRs close to the single-virtual-individual results (Table S4). To assess sensitivity to the assumed representative CYP2E1 peak phase, we evaluated three independent fixed-phase scenarios (20:00, 22:00, and 00:00). The cross-phase envelope of median within-individual 20:00/08:00 NAPQI-related exposure ratios was 2.20–2.57 for AUC0–48h and 2.48–3.72 for Cmax (Table S5). To quantify variability in individual biological timing, we performed a hierarchical Monte Carlo analysis using prespecified early, intermediate, and late chronotype groups. The overall median within-profile AUC0–48h ratio was 2.34 [IQR 2.06–2.48] (2.5th–97.5th percentiles, 1.40–2.58), and the Cmax ratio was 3.26 [2.82–3.48] (1.93–3.62). Ratios exceeded 1 in 99.995% of profiles for AUC0–48h and 100% for Cmax. Median AUC0–48h ratios were 1.84, 2.40, and 2.47 in the early, intermediate, and late groups, respectively; corresponding Cmax ratios were 3.17, 3.43, and 2.67. One early-group profile had an AUC0–48h ratio of 0.91 and a Cmax ratio of 1.47 (Table S6). These population simulations indicated that higher NAPQI-related exposure after 20:00 dosing was generally retained across the prespecified phase and chronotype settings, although its magnitude varied among scenarios and groups.
3. Discussion
This study integrates CYP2E1, HBF, and GFR rhythms into a term-pregnancy APAP PBPK framework to distinguish dosing-time effects on maternal parent drug and oxidative metabolism pathways. Although total parent drug exposure changed little, model-predicted NAPQI-related exposure varied substantially with dosing time. Under the reference rhythm assumptions, conditional rhythm-removal analyses identified the largest contribution from CYP2E1, with a smaller contribution from HBF and a near-zero contribution from GFR. In the hierarchical Monte Carlo analysis, nearly all profiles showed higher exposure after evening dosing under the prespecified biological-timing distributions, with the magnitude varying across chronotype groups. The broader CYP2E1 phase scan showed that the direction could reverse. Together, these analyses identify the relationship between biological phase and dosing time as a factor to test in studies of APAP oxidative metabolism during pregnancy.
The relative insensitivity of total maternal APAP exposure to dosing time is broadly compatible with limited human chronopharmacokinetic data. Kolawole et al. compared morning, midday, and evening dosing in seven fasting healthy men and found that the main differences were in absorption rate and time to peak; the Cmax difference was not statistically significant, and the AUC differences across times were inconsistent [25]. This finding suggests that the parent drug curve can be influenced by gastric emptying and absorption phase without necessarily producing a stable diurnal gradient in total exposure. Studies of APAP disposition during pregnancy are not fully consistent. A comparison of pregnant and nonpregnant women reported no significant differences in APAP pharmacokinetics [26], whereas a within-woman study at delivery and postpartum and an earlier pregnancy metabolism study reported higher total clearance, glucuronidation, and oxidative clearance [27]. A systematic review also noted that pregnancy is often accompanied by faster drug clearance and lower total exposure, although clinical consequences cannot be inferred from plasma concentrations alone [28]. The PBPK model of Mian et al. integrated these gestational-age-dependent changes into a unified structure and predicted lower steady-state APAP exposure in late pregnancy than in the nonpregnant state, while identifying increased oxidative metabolism as an important factor limiting dose escalation [24]. Our study compared dosing phases within the same term-pregnancy physiological background and showed that relatively stable parent drug AUC and Cmax can coexist with substantial variation in the modeled oxidative pathway. Evaluating parent drug exposure and oxidative metabolism together may therefore better characterize dosing-time effects.
The large CYP2E1 contribution in the reference scenario is biologically plausible, with its magnitude depending on rhythm parameters and their translation across species and physiological states. Murine hepatic Cyp2e1 is rhythmically regulated by HNF-1α and CRY1 [12], and changing feeding schedules can reset the diurnal rhythm of APAP hepatotoxicity [14]. The hepatic clock also coordinates phase I–III detoxification through PAR bZIP transcription factors and nuclear receptor networks, with feeding as an important synchronizing signal [29,30]. Human placental lactogen increases CYP2E1 expression and activity in primary hepatocytes from female donors [31], supporting pregnancy-related modulation of baseline activity without defining its circadian phase or amplitude. Mian et al. assumed a uniform 80% increase in CYP2E1 during pregnancy as an upper-bound scenario for oxidative metabolism [24]; the present model superimposes an exploratory cosine rhythm on that baseline. Species differences in activity–rest cycles, feeding, enzyme regulation, and experimental light–dark conditions may alter the alignment of dosing with CYP2E1 activity and hence the magnitude or direction of predicted exposure differences. The amplitude and phase analyses characterize this dependence, while the Monte Carlo analysis describes its expression across prespecified biological-timing distributions. These findings motivate pregnancy-specific measurements of CYP2E1 rhythms and the use of individual biological-phase markers alongside clock time [32].
The smaller conditional contributions of HBF and GFR are consistent with their roles in APAP disposition under the tested rhythm amplitudes. At therapeutic doses, APAP is cleared mainly by glucuronidation and sulfation, with renal excretion of parent drug and oxidative metabolism each accounting for only a small fraction. Therefore, within the amplitude range used in this model, changes in CYP2E1-mediated formation clearance more readily alter NAPQI-related exposure than small fluctuations in blood flow or filtration. Estimated HBF and measured GFR both show diurnal variation in healthy individuals [15,17], and during pregnancy blood volume, organ blood flow, and renal function undergo systematic changes with gestational age; PBPK modeling can place these concurrent processes within a unified framework [33,34]. In this study, the conditional HBF contribution to Cmax was higher than that to AUC, suggesting that the blood flow rhythm contributes relatively more to the peak concentration difference. However, AUC and Cmax alone cannot distinguish the effects of formation, distribution, and elimination. The GFR rhythm had a relatively small amplitude, and GFR is not a controlling factor in the oxidative formation of NAPQI from APAP; consequently, its contribution in this model was small.
This study has several limitations. The CYP2E1 rhythm parameters were informed by rodent evidence, and HBF and GFR rhythms by nonpregnant adults. The chronotype proportions and phase distributions used in the hierarchical Monte Carlo analysis were prespecified sensitivity assumptions, rather than measured characteristics of pregnant women. Amplitudes were fixed in that analysis and examined separately in the one-at-a-time analyses. NAPQI-related concentrations have not been directly validated against human measurements, and their exposure ratios do not quantify liver injury risk. The inherited model assumes equivalent concentrations for NAPQI and cysteine and mercapturate conjugates without explicitly parameterizing detoxification kinetics [24]. Both absolute and relative exposure predictions depend on these structural assumptions. Hepatotoxicity additionally involves glutathione-dependent detoxification, protein binding, downstream cellular injury, and individual susceptibility [7,8]. The study addresses a single 1000 mg dose at 40 weeks of gestation. Changes in maternal fluid volumes, tissue distribution, hepatic and renal physiology, enzyme activity, and circadian parameters across gestation may alter the magnitude, direction, and relative rhythm contributions of the predicted differences. Repeated dosing introduces residual exposure and successive encounters with different circadian phases; applicability to earlier pregnancy and repeated therapeutic dosing therefore remains to be evaluated. Fasting/fed conditions and concomitant medications were not examined. Maternal–fetal exchange and amniotic-fluid distribution were represented in the model, but their individual contributions to maternal exposure were not separately quantified, and fetal and amniotic-fluid concentrations were not analyzed as separate outcomes. These scope and parameter constraints are consistent with broader limitations in pregnancy PBPK modeling [33,34].
4. Materials and Methods
4.1. Pregnancy APAP PBPK Model and Study Scope
We performed PBPK modeling and simulation using Open Systems Pharmacology (OSP) Suite 12.2 (PK-Sim and MoBi; open-source software licensed under GPLv2; https://github.com/Open-Systems-Pharmacology; accessed on 10 January 2026). The base model was the pregnancy APAP PBPK framework developed by Mian et al. and evaluated against clinical data for APAP and measurable stable metabolites [24]. This framework represents gestational changes in physiology and enzyme activity within a single model structure and includes NAPQI formation. The pregnancy model is publicly available as a reusable project in the Pregnancy-Models repository (https://github.com/Open-Systems-Pharmacology/Pregnancy-Models; accessed on 26 January 2026), provided as PK-Sim and MoBi projects that facilitate further mechanistic extension within the existing parameter system. Its clinical evaluation covered APAP and measurable stable metabolites but did not assess pregnancy-specific circadian effects or direct in vivo NAPQI concentrations [24]. The pregnancy framework extends the nonpregnant model with nine pregnancy-related compartments, including maternal and fetal placental compartments, fetal compartments and liver, amniotic-fluid compartments, and umbilical cord vessels [24]. In this study, maternal anatomy and physiology were fixed at 40 weeks using the inherited pregnancy parameterization. Plasma volume and total body water were not separately estimated or varied across gestation, and drug distribution was represented by the inherited tissue volumes and tissue-to-plasma partitioning rather than by a separately fitted apparent volume of distribution. APAP and its metabolites, including the NAPQI-related species, were represented in the relevant compartments, with maternal–fetal exchange through the placental and umbilical transport pathways. The reported endpoints were maternal peripheral venous concentrations; fetal and amniotic-fluid concentrations were not analyzed as separate outcomes. Because the model did not explicitly parameterize NAPQI detoxification kinetics and assumed that cysteine and mercapturate conjugate concentrations were equivalent to NAPQI concentrations [24], NAPQI-related AUC and Cmax represent simulated exposure under this simplified model representation.
4.2. Dosing Regimen
A single 1000 mg oral dose of APAP was administered at 08:00, 14:00, 20:00, or 02:00 to compare the effects of dosing time on maternal pharmacokinetics and metabolism. Gestational age was set to 40 weeks to represent late pregnancy/term, allowing the contributions of circadian rhythms and dosing phase to be examined against a fixed gestational physiological background. A single dose rather than multiple doses was used to reduce the influence of residual drug from previous doses and dosing intervals, to facilitate comparison of the relationship between dosing phase and metabolic conversion, and to align with previous chronopharmacokinetic studies using single doses [25].
4.3. Integration of Circadian Rhythms and Virtual Individual Simulations
To examine the potential effects of dosing time on APAP and NAPQI exposure, we introduced circadian rhythms in CYP2E1, HBF, and GFR into the base model using time-dependent expressions in MoBi. Rhythm variation was described by a cosine function (cosinor model) [35]:
In this equation, P(t) is the value of the parameter at time t; t is 24 h clock time (h); Pbaseline is the mean level after removal of circadian fluctuation, that is, the 24 h baseline value; Amplitude is the relative amplitude (0–1); and tpeak is the peak phase, defined as the time at which the parameter reaches its maximum. Informed by the animal evidence for rhythmic CYP2E1 regulation [12,36], we selected a peak phase of 22:00 and a relative amplitude of 0.5 and implemented the rhythm by modulating intrinsic clearance. HBF estimated using indocyanine green clearance in healthy participants peaks at 08:00; we set its peak at 08:00 with an amplitude of 0.145 [15]. GFR in healthy adults is higher during the day and lower at night; we set its peak at 07:46 with an amplitude of 0.038 [17,37]. These prespecified phase and amplitude values define an exploratory reference scenario. Because direct observations of CYP2E1, HBF, and GFR rhythms during pregnancy are lacking, these parameters were derived from studies in nonpregnant populations or rodents, and their uncertainty was evaluated in sensitivity analyses. Table 5 summarizes the rhythm parameters.
Table 5.
Circadian rhythm parameters integrated into the pregnancy PBPK model.
Virtual individual simulations used a single virtual pregnant woman (height, 1.63 m; body weight, 64.67 kg) without random sampling or interindividual variability to obtain predicted plasma concentration–time curves for APAP and NAPQI at different dosing times and to calculate exposure metrics, including maximum plasma concentration (Cmax) and area under the plasma concentration–time curve from 0 to 48 h (AUC0–48h).
4.4. Virtual Population Simulations and Estimation of Exposure Distributions
To examine the effect of interindividual variability on exposure predictions, we constructed a virtual population based on the deterministic model framework. The virtual population was generated using the PK-Sim population module, with pregnancy-related changes in anatomical and physiological parameters and their variability structure derived from the pregnancy parameter library established by Dallmann et al. [33]. We included 2000 women at 40 weeks of gestation. Height, body weight, and related physiological parameters were sampled from their distributions with covariate correlations; median height and body weight were 1.63 m and 66.61 kg, respectively. Interindividual variability was reported as coefficient of variation (CV): CYP2E1 reference concentration, 29.87%; liver-specific blood flow, 4.94%; absolute hepatic blood flow, 25.69%; and GFR, 20.01%. The CV of approximately 30% for CYP2E1 activity was based on variability in human hepatic CYP2E1 protein abundance [38], whereas the CVs for HBF and GFR were the realized variability in the current population of 2000 virtual individuals. For each dosing time, APAP and NAPQI AUC0–48h and Cmax were obtained from virtual population simulations and reported as median and interquartile range (IQR).
4.5. Counterfactual Analysis
Counterfactual frameworks have been used for mechanistic decomposition and causal interpretation in pharmacokinetics [39]. To quantify the relative contributions of circadian rhythm components to dosing-time differences in NAPQI exposure, we adopted a counterfactual control approach within the same pregnancy PBPK framework. Specifically, while holding model structure, non-rhythm parameters, and dose constant, we used the same virtual individual or the same virtual population and constructed different intervention scenarios solely by turning rhythms on or off. We compared NAPQI AUC0–48h and Cmax after 08:00 and 20:00 dosing to evaluate the effects of each rhythm and their combinations on exposure ratios.
4.5.1. Construction of Counterfactual Scenarios
Let N = {CYP2E1, HBF, GFR}. Let S ⊆ N denote the set of rhythms kept on, with the remaining rhythms considered off. For a given dosing time t in {08:00, 20:00}, the NAPQI exposure metric is defined as:
In each scenario, non-rhythm parameters and dose remained unchanged; the cosine amplitude of the corresponding rhythm was set to 0 to turn it off. With all rhythms on as the baseline, seven additional off scenarios were constructed, covering all eight combinations of the three rhythms: (1) single-rhythm off: turn off CYP2E1, HBF, or GFR rhythm individually while keeping the other rhythms on, to estimate the conditional effect of removing that rhythm when the others remain on; (2) pairwise off: turn off (CYP2E1 + HBF), (CYP2E1 + GFR), or (HBF + GFR) to assess nonadditive effects together with other scenarios; and (3) all off: set all three rhythm amplitudes to 0 as the no-rhythm reference. All scenarios were simulated in virtual individuals at 08:00 and 20:00 to obtain Ek(t,S).
Ek(t,S), where k ∈ {AUC0–48h,Cmax}
4.5.2. Rhythm-Induced Changes in NAPQI Exposure at Each Dosing Time
Using the all-rhythms-off scenario as the reference, we calculated the net percentage contribution of a rhythm on/off combination S to absolute NAPQI exposure. For each dosing time t and metric k (NAPQI AUC0–48h and Cmax), we defined:
Here, ∅ denotes the all-off set. Positive and negative values indicate that rhythms increase or decrease exposure, respectively. This metric describes the net change in exposure for combination S relative to the no-rhythm reference.
4.5.3. Conditional Contributions of Individual Rhythms to Dosing-Time Differences in NAPQI Exposure
To quantify the rhythm-level sources of dosing-time differences, we compared the relative difference in NAPQI exposure after 20:00 and 08:00 dosing, represented by the 20:00/08:00 exposure ratio, and quantified the conditional contributions of the three rhythms (CYP2E1, HBF, and GFR). For each metric k (NAPQI AUC0–48h and Cmax), we defined:
For each rhythm, we calculated the following conditional removal percentage:
Here, Rk(N), Rk(∅), and Rk(N\{i}) denote the 20:00/08:00 exposure ratios with all rhythms on, all rhythms off, and only rhythm i off, respectively. This metric represents the conditional change in exposure ratio caused by turning off rhythm i within the total change. Because these comparisons can include overlapping interactions, the percentages are conditional and non-additive; they are not independent shares of the total effect and are not expected to sum to 100%.
4.6. Sensitivity Analysis
To examine how predicted NAPQI exposure changes with key rhythm parameter values and population variability, and with all three rhythms on, we changed only one parameter of one rhythm at a time while keeping other parameters at the main model values in Section 2.3. We simulated virtual individuals after 08:00 and 20:00 dosing and evaluated AUC0–48h and Cmax. (1) CYP2E1: for amplitude scanning, peak phase was fixed at 22:00 and relative amplitude ranged from 0.4 to 0.6 (±0.1 around the setpoint of 0.5); for phase scanning, relative amplitude was fixed at 0.5 and peak phase was set to 00:00, 04:00, 08:00, 12:00, 16:00, or 20:00, with 22:00 as baseline. (2) HBF: for amplitude scanning, peak phase was fixed at 08:00 and relative amplitude ranged from 0.5× to 1.5× the setpoint of 0.145; for phase scanning, amplitude was fixed at 0.145 and peak phase ranged from 06:00 to 10:00 (±2 h around 08:00). (3) GFR: for amplitude scanning, peak phase was fixed at 07:46 and relative amplitude ranged from 0.5× to 1.5× the setpoint of 0.038; for phase scanning, amplitude was fixed at 0.038 and peak phase ranged within ±2 h of 07:46.
Population variability analyses were designed to distinguish three sources of uncertainty in the predicted dosing-time difference: variability in inherited physiology, sensitivity to selected fixed CYP2E1 peak phases, and variability in individual biological timing. All three analyses used the same 2000 virtual individuals at 40 weeks of gestation, a single 1000 mg oral APAP dose, and paired simulations at 08:00 and 20:00. Unless stated otherwise, the individual physiological parameters, rhythm amplitudes, and reference peak phases were retained at their main-model values, and the three rhythms were modeled together. For physiological variability, only the inherited individual physiological parameters varied across the virtual population; rhythm parameters were held at their reference values. Each individual was simulated with all three rhythms on and with all three rhythms off, and the net contribution was calculated as:
Here, E denotes NAPQI AUC0–48h or Cmax, i denotes the virtual individual, and “on” and “off” denote the all-rhythms-on and all-rhythms-off conditions, respectively. Net-contribution distributions were summarized as the median [IQR] and 2.5th–97.5th percentiles, and the 20:00-versus-08:00 comparison was paired within each individual. To test sensitivity to the assumed CYP2E1 peak phase, only the CYP2E1 peak phase was changed, to 20:00, 22:00, or 00:00, while CYP2E1 amplitude, the HBF and GFR parameters, individual physiology, and dosing conditions remained fixed. These three fixed-phase scenarios were analyzed independently; their individuals were not mixed or re-paired across scenarios, and no chronotype sampling was applied. For each scenario, exposure distributions and within-individual 20:00/08:00 ratios were summarized as the median [IQR] and 2.5th–97.5th percentiles. The cross-phase envelope was defined as the minimum-to-maximum range of the scenario-specific medians.
To characterize individual biological-timing variability, we varied rhythm peak phases while retaining each individual’s physiology and the reference rhythm amplitudes. The three rhythms remained active, and the 2000 individuals were assigned a prespecified chronotype structure of 500 early (25%), 1000 intermediate (50%), and 500 late (25%) individuals. For each individual, ten shared phase offsets were sampled from truncated normal distributions with means of −2 h, 0 h, or +2 h for the early, intermediate, and late groups, respectively; a within-group SD of 1 h; and bounds of −4 to +4 h. In addition, one stable rhythm-specific deviation was sampled for each individual and each rhythm (CYP2E1, HBF, and GFR) from N(0, 0.52 h2); that deviation was reused across the individual’s ten phase draws. Thus, the peak phase for individual i, rhythm j, and draw k was φ(ijk) = φ(0j) + δ(ik) + ε(ij), where φ(0j) is the reference peak phase, δ(ik) is the shared biological-timing offset, and ε(ij) is the stable rhythm-specific deviation. The same physiology and sampled phase parameters were used for the 08:00 and 20:00 simulations, producing 20,000 paired profiles for each dosing time; these profiles represent ten phase draws from each of the 2000 individuals rather than 20,000 independent individuals. Overall and chronotype-specific within-profile 20:00/08:00 ratios were summarized as the median [IQR] and 2.5th–97.5th percentiles, together with the proportion of ratios greater than 1. The chronotype proportions and phase distributions were prespecified sensitivity-analysis settings and were not estimates of the pregnant population.
5. Conclusions
This study provides hypothesis-generating computational predictions of dosing-time effects on APAP oxidative metabolism after a single 1000 mg dose at 40 weeks of gestation. CYP2E1 had the largest conditional rhythm-removal contribution under the reference assumptions, while total maternal APAP exposure varied little. Higher evening NAPQI-related exposure persisted in nearly all Monte Carlo profiles under the prespecified phase distributions, whereas the broader phase scan could reverse the direction. The findings prioritize CYP2E1 phase and amplitude and oxidative metabolism markers for clinical investigation before informing dosing decisions.
Supplementary Materials
The following supporting information can be downloaded at: https://www.mdpi.com/article/10.3390/ph19111745/s1, Table S1: Net contributions of NAPQI AUC0–48h and Cmax relative to the no-rhythm reference in the CYP2E1 relative-amplitude sensitivity analysis; Table S2: Net contributions to NAPQI in the sensitivity analysis of the CYP2E1 rhythm peak phase; Table S3: Net contributions of NAPQI in the sensitivity analyses of the HBF and GFR rhythm amplitudes and peak phases; Table S4: Population distribution of net contributions to NAPQI exposure in the virtual population. Table S5: NAPQI exposure distributions and within-individual ratios across fixed CYP2E1 peak-phase scenarios; Table S6: Overall and chronotype-stratified NAPQI exposure ratios in the hierarchical Monte Carlo analysis.
Author Contributions
Conceptualization, H.C., J.A. and Y.Z.; methodology, H.C. and J.A.; software, H.C. and J.A.; validation, M.W. and Y.C.; formal analysis, H.C. and J.A.; investigation, H.C., J.A. and J.L.; data curation, M.W., Y.C. and J.L.; writing—original draft preparation, H.C. and J.A.; writing—review and editing, H.W. and Y.Z.; supervision, H.W. and Y.Z.; project administration, Y.Z.; funding acquisition, Y.Z. and H.W. All authors have read and agreed to the published version of the manuscript.
Funding
This work was supported by the Joint Funds for the innovation of science and technology, Fujian province (grant numbers: 2024Y9110 and 2025Y9103).
Institutional Review Board Statement
Not applicable.
Informed Consent Statement
Not applicable.
Data Availability Statement
The original contributions presented in this study are included in the article/supplementary material. The base pregnancy APAP PBPK model is publicly available in the Pregnancy-Models repository (https://github.com/Open-Systems-Pharmacology/Pregnancy-Models; accessed on 26 January 2026). Further inquiries can be directed to the corresponding authors.
Acknowledgments
The authors thank the Open Systems Pharmacology community for maintaining the PK-Sim and MoBi software (version 12.2) and the publicly available Pregnancy-Models repository, which provided the foundational pregnancy APAP PBPK framework for this work. The authors also acknowledge the Department of Clinical Pharmacy and Pharmacy Administration, School of Pharmacy, Fujian Medical University, and the Cadres’ Healthcare Office, Fujian Provincial Hospital, for institutional support.
Conflicts of Interest
The authors declare no conflicts of interest.
References
- Werler, M.M.; Mitchell, A.A.; Hernandez-Diaz, S.; Honein, M.A. Use of over-the-counter medications during pregnancy. Am. J. Obstet. Gynecol. 2005, 193, 771–777. [Google Scholar] [CrossRef] [Scilit]
- Lupattelli, A.; Spigset, O.; Twigg, M.J.; Zagorodnikova, K.; Mårdby, A.C.; Moretti, M.E.; Drozd, M.; Panchaud, A.; Hämeen-Anttila, K.; Rieutord, A.; et al. Medication use in pregnancy: A cross-sectional, multinational web-based study. BMJ Open 2014, 4, e004365. [Google Scholar] [CrossRef] [Scilit]
- Chun, L.; Tong, M.; Busuttil, R.; Hiatt, J. Acetaminophen Hepatotoxicity and Acute Liver Failure. J. Clin. Gastroenterol. 2009, 43, 342–349. [Google Scholar] [CrossRef] [Scilit]
- Watkins, P.B.; Kaplowitz, N.; Slattery, J.T.; Colonese, C.R.; Colucci, S.V.; Stewart, P.W.; Harris, S.C. Aminotransferase elevations in healthy adults receiving 4 grams of acetaminophen daily: A randomized controlled trial. JAMA 2006, 296, 87–93. [Google Scholar] [CrossRef] [Scilit]
- Anderson, G.D. Pregnancy-induced changes in pharmacokinetics: A mechanistic-based approach. Clin. Pharmacokinet. 2005, 44, 989–1008. [Google Scholar] [CrossRef] [Scilit]
- Kamath, P.; Kamath, A.; Ullal, S.D. Liver injury associated with drug intake during pregnancy. World J. Hepatol. 2021, 13, 747–762. [Google Scholar] [CrossRef] [Scilit]
- McGill, M.R.; Jaeschke, H. Metabolism and disposition of acetaminophen: Recent advances in relation to hepatotoxicity and diagnosis. Pharm. Res. 2013, 30, 2174–2187. [Google Scholar] [CrossRef] [Scilit]
- Hinson, J.A.; Roberts, D.W.; James, L.P. Mechanisms of acetaminophen-induced liver necrosis. In Handbook of Experimental Pharmacology; Springer: Berlin/Heidelberg, Germany, 2010; pp. 369–405. [Google Scholar] [CrossRef] [Scilit]
- Li, Y.; He, X.; Sun, B.; Hu, N.; Li, J.; You, R.; Tao, F.; Fang, L.; Li, Y.; Zhai, Q. Combined exposure of beta-cypermethrin and emamectin benzoate interferes with the HPO axis through oxidative stress, causing an imbalance of hormone homeostasis in female rats. Reprod. Toxicol. 2024, 123, 108502. [Google Scholar] [CrossRef] [Scilit]
- Yu, F.; Liu, Y.; Zhang, R.; Zhu, L.; Zhang, T.; Shi, Y. Recent advances in circadian-regulated pharmacokinetics and its implications for chronotherapy. Biochem. Pharmacol. 2022, 203, 115185. [Google Scholar] [CrossRef] [Scilit]
- Okyar, A.; Ozturk Civelek, D.; Akyel, Y.K.; Surme, S.; Pala Kara, Z.; Kavakli, İ.H. The role of the circadian timing system on drug metabolism and detoxification: An update. Expert Opin. Drug Metab. Toxicol. 2024, 20, 503–517. [Google Scholar] [CrossRef] [Scilit]
- Matsunaga, N.; Ikeda, M.; Takiguchi, T.; Koyanagi, S.; Ohdo, S. The molecular mechanism regulating 24-hour rhythm of CYP2E1 expression in the mouse liver. Hepatology 2008, 48, 240–251. [Google Scholar] [CrossRef] [Scilit]
- Guo, L.; Yu, F.; Zhang, T.; Wu, B. The clock protein Bmal1 regulates circadian expression and activity of sulfotransferase 1a1 in mice. Drug Metab. Dispos. 2018, 46, 1403–1410. [Google Scholar] [CrossRef] [Scilit]
- Matsunaga, N.; Nakamura, N.; Yoneda, N.; Qin, T.; Terazono, H.; To, H.; Higuchi, S.; Ohdo, S. Influence of feeding schedule on 24-h rhythm of hepatotoxicity induced by acetaminophen in mice. J. Pharmacol. Exp. Ther. 2004, 311, 594–600. [Google Scholar] [CrossRef] [Scilit]
- Lemmer, B.; Nold, G. Circadian changes in estimated hepatic blood flow in healthy subjects. Br. J. Clin. Pharmacol. 1991, 32, 627–629. [Google Scholar] [CrossRef] [Scilit]
- Goo, R.H.; Moore, J.G.; Greenberg, E.; Alazraki, N.P. Circadian variation in gastric emptying of meals in humans. Gastroenterology 1987, 93, 515–518. [Google Scholar] [CrossRef] [Scilit]
- Koopman, M.G.; Koomen, G.C.; Krediet, R.T.; de Moor, E.A.; Hoek, F.J.; Arisz, L. Circadian rhythm of glomerular filtration rate in normal individuals. Clin. Sci. 1989, 77, 105–111. [Google Scholar] [CrossRef] [Scilit]
- Allolio, B.; Hoffmann, J.; Linton, E.A.; Winkelmann, W.; Kusche, M.; Schulte, H.M. Diurnal salivary cortisol patterns during pregnancy and after delivery: Relationship to plasma corticotrophin-releasing-hormone. Clin. Endocrinol. 1990, 33, 279–289. [Google Scholar] [CrossRef] [Scilit]
- Bicker, J.; Alves, G.; Falcão, A.; Fortuna, A. Timing in drug absorption and disposition: The past, present, and future of chronopharmacokinetics. Br. J. Pharmacol. 2020, 177, 2215–2239. [Google Scholar] [CrossRef] [Scilit]
- Bruguerolle, B.; Lemmer, B. Recent advances in chronopharmacokinetics: Methodological problems. Life Sci. 1993, 52, 1809–1824. [Google Scholar] [CrossRef] [Scilit]
- Weld, E.D.; Bailey, T.C.; Waitt, C. Ethical issues in therapeutic use and research in pregnant and breastfeeding women. Br. J. Clin. Pharmacol. 2022, 88, 7–21. [Google Scholar] [CrossRef] [Scilit]
- McKiever, M.; Frey, H.; Costantine, M.M. Challenges in conducting clinical research studies in pregnant women. J. Pharmacokinet. Pharmacodyn. 2020, 47, 287–293. [Google Scholar] [CrossRef] [Scilit]
- Cole, S.; Coppola, P.; Kerwash, E.; Nooney, J.; Lam, S.P. Pharmacokinetic characterization to enable medicine use in pregnancy, the potential role of physiologically-based pharmacokinetic modeling: A regulatory perspective. CPT Pharmacomet. Syst. Pharmacol. 2020, 9, 547–549. [Google Scholar] [CrossRef] [Scilit]
- Mian, P.; van den Anker, J.N.; van Calsteren, K.; Annaert, P.; Tibboel, D.; Pfister, M.; Allegaert, K.; Dallmann, A. Physiologically Based Pharmacokinetic Modeling to Characterize Acetaminophen Pharmacokinetics and N-Acetyl-p-Benzoquinone Imine (NAPQI) Formation in Non-Pregnant and Pregnant Women. Clin. Pharmacokinet. 2020, 59, 97–110. [Google Scholar] [CrossRef] [Scilit]
- Kolawole, J.A.; Chuhwak, P.D.; Okeniyi, S.O. Chronopharmacokinetics of acetaminophen in healthy human volunteers. Eur. J. Drug Metab. Pharmacokinet. 2002, 27, 199–202. [Google Scholar] [CrossRef] [Scilit]
- Rayburn, W.; Shukla, U.; Stetson, P.; Piehl, E. Acetaminophen pharmacokinetics: Comparison between pregnant and nonpregnant women. Am. J. Obstet. Gynecol. 1986, 155, 1353–1356. [Google Scholar] [CrossRef] [Scilit]
- Kulo, A.; Peeters, M.Y.; Allegaert, K.; Smits, A.; de Hoon, J.; Verbesselt, R.; Lewi, L.; van de Velde, M.; Knibbe, C.A. Pharmacokinetics of paracetamol and its metabolites in women at delivery and post-partum. Br. J. Clin. Pharmacol. 2013, 75, 850–860. [Google Scholar] [CrossRef] [Scilit]
- Pariente, G.; Leibson, T.; Carls, A.; Adams-Webber, T.; Ito, S.; Koren, G. Pregnancy-Associated Changes in Pharmacokinetics: A Systematic Review. PLoS Med. 2016, 13, e1002160. [Google Scholar] [CrossRef] [Scilit]
- Gachon, F.; Olela, F.F.; Schaad, O.; Descombes, P.; Schibler, U. The circadian PAR-domain basic leucine zipper transcription factors DBP, TEF, and HLF modulate basal and inducible xenobiotic detoxification. Cell Metab. 2006, 4, 25–36. [Google Scholar] [CrossRef] [Scilit]
- Zmrzljak, U.P.; Rozman, D. Circadian regulation of the hepatic endobiotic and xenobitoic detoxification pathways: The time matters. Chem. Res. Toxicol. 2012, 25, 811–824. [Google Scholar] [CrossRef] [Scilit]
- Lee, J.K.; Chung, H.J.; Fischer, L.; Fischer, J.; Gonzalez, F.J.; Jeong, H. Human placental lactogen induces CYP2E1 expression via PI 3-kinase pathway in female human hepatocytes. Drug Metab. Dispos. 2014, 42, 492–499. [Google Scholar] [CrossRef] [Scilit]
- Cederroth, C.R.; Albrecht, U.; Bass, J.; Brown, S.A.; Dyhrfjeld-Johnsen, J.; Gachon, F.; Green, C.B.; Hastings, M.H.; Helfrich-Förster, C.; Hogenesch, J.B.; et al. Medicine in the Fourth Dimension. Cell Metab. 2019, 30, 238–250. [Google Scholar] [CrossRef] [Scilit]
- Dallmann, A.; Ince, I.; Meyer, M.; Willmann, S.; Eissing, T.; Hempel, G. Gestation-Specific Changes in the Anatomy and Physiology of Healthy Pregnant Women: An Extended Repository of Model Parameters for Physiologically Based Pharmacokinetic Modeling in Pregnancy. Clin. Pharmacokinet. 2017, 56, 1303–1330. [Google Scholar] [CrossRef] [Scilit]
- Dallmann, A.; Pfister, M.; van den Anker, J.; Eissing, T. Physiologically Based Pharmacokinetic Modeling in Pregnancy: A Systematic Review of Published Models. Clin. Pharmacol. Ther. 2018, 104, 1110–1124. [Google Scholar] [CrossRef] [Scilit]
- Cornelissen, G. Cosinor-based rhythmometry. Theor. Biol. Med. Model. 2014, 11, 16. [Google Scholar] [CrossRef] [Scilit]
- Lee, Y.; Keshavarzian, A.; Song, B.J. Diurnal regulation and gene-specific vulnerability of oxidative alcohol-metabolizing enzymes to circadian disruption. Int. J. Mol. Sci. 2026, 27, 2041. [Google Scholar] [CrossRef] [Scilit]
- Lorenzo-Lozano, M.C.; Blázquez-Manzanera, A.L.; Carnicero, J.A. How kidney clock works: Circadian pattern of eGFR based on a population data group. J. Physiol. Biochem. 2023, 79, 543–554. [Google Scholar] [CrossRef] [Scilit]
- Lipscomb, J.C.; Teuschler, L.K.; Swartout, J.C.; Striley, C.A.; Snawder, J.E. Variance of Microsomal Protein and Cytochrome P450 2E1 and 3A Forms in Adult Human Liver. Toxicol. Mech. Methods 2003, 13, 45–51. [Google Scholar] [CrossRef] [Scilit]
- Goulooze, S.C.; Marostica, E.; Snelder, N. Tutorial on Causal Mediation Analysis for Pharmacometricians. CPT Pharmacomet. Syst. Pharmacol. 2026, 15, e70193. [Google Scholar] [CrossRef] [Scilit]

Disclaimer/Publisher’s Note: The statements, opinions and data contained in all publications are solely those of the individual author(s) and contributor(s) and not of MDPI and/or the editor(s). MDPI and/or the editor(s) disclaim responsibility for any injury to people or property resulting from any ideas, methods, instructions or products referred to in the content. |
© 2026 by the authors. Licensee MDPI, Basel, Switzerland. This article is an open access article distributed under the terms and conditions of the Creative Commons Attribution (CC BY) license.