


Abstract
To address the problems existing in nuclear reactor accident emergency training, a design scheme and system prototype of radiation detection training equipment for penetrating radiation fields in enclosed spaces, based on inertial sensors and wireless Bluetooth communication is proposed. First, the penetrating radiation field is modeled. On this basis, a calculation model of the neutron/γ dose equivalent rate is established. This model is based on the motion path of simulated radiation detection equipment. Second, the MPU6050 inertial sensor is designed and developed. It monitors the three-axis acceleration and three-axis angular acceleration values in real time. This enables the indoor positioning function of the simulated detection training equipment. The Digital Motion Processor (DMP) filtering algorithm is used to process the measured data. This improves the detection accuracy. Finally, a Bluetooth communication module is designed and developed. It transmits the detected position data to the main control computer in real time. The main control computer performs calculation and analysis to obtain the radiation intensity value. This value is sent to the Arduino controller. The Arduino controller controls the display of the value on the liquid crystal screen. Experimental verification is carried out. Experimental verification indicates that the maximum error of the system’s three-dimensional spatial positioning is 0.08 m, the mean relative error of the radiation dose rate simulation is 4.81%, and the maximum relative error is 7.8%. The system relatively accurately achieves radiation dose simulation and radiation source localization according to different working modes, providing a high cost-effectiveness training method for radiation detection training with high safety and good economy.
1. Introduction
Since the 2011 Fukushima nuclear power plant accident in Japan, nuclear radiation safety has remained a global focus [1,2,3,4]. The accident brought problems such as nuclear radiation pollution control and public health. These problems keep nuclear radiation safety a key part of global security issues. Nuclear radiation safety control is a challenge for the community with a shared future for mankind. Professional emergency rescue plays a crucial role in addressing the challenges of nuclear accidents. Nuclear fuel radiation reconnaissance and detection training is a very important link [5,6,7].
Many practical problems exist in conventional nuclear radiation detection training. For example, considering the personal safety of trainers, radioactive sources with high radiation dose rates cannot be used as training sources. These problems greatly affect training effectiveness. Therefore, using simulation methods to conduct radiation detection training has become one of the main means for training nuclear professionals. Tlaczala [8], Tiftikci [9], and James [10] constructed radiation detection training systems or laboratories through virtual reality or physical simulation technologies. Danilo [11] achieved precise positioning of equipment through a hybrid method of artificial intelligence and finite elements. This provides a reference for improving the accuracy of hybrid radiation field modeling methods. Zhang [12] and Guo [13] constructed nuclear emergency response and rescue training systems using virtual reality technology. These systems enable simulated radiation detection training during nuclear emergencies. Jiang [14] combined global positioning technology with computers. This combination enables the simulation of ground radiation fields after nuclear explosions. It solves the problem of radiation reconnaissance. Lin [15] adopted a passive method to enable numerical simulation, detection and analysis of nuclear material radiation fields. Zhang [16] developed a radiation monitoring system training simulator using a hardware-in-the-loop simulation technology route. All the above simulated detection equipment has achieved good application results. Among them, training equipment developed using physical simulation schemes is mainly used for outdoor radiation detection training. Outdoor areas are wide with large target ranges. The requirements for measurement error accuracy are not high. Additionally, there is no need to consider the impact of indoor signal shielding. However, for physical simulation training of radiation detection in tunnel environments, the limited indoor space and the impact of signal shielding make it difficult to guarantee the measurement accuracy and real-time performance of existing technical schemes. Existing indoor positioning technologies include Bluetooth Low Energy (BLE) [17], ultrawideband (UWB) [18], pedestrian dead reckoning (PDR) [19], Quick Response (QR) [20], and radio frequency identification (RFID) [21]. Most of these existing technologies have the advantage of high prediction accuracy. However, these technologies still have some shortcomings. The coverage of BLE technology has certain limitations. UWB technology has high costs and cannot meet existing needs easily. PDR technology has large cumulative errors. Its positioning accuracy decreases with time. QR technology cannot meet the needs of nuclear radiation detection training. RFID technology is greatly affected by environmental interference factors. In recent years, researchers have proposed hybrid systems that combine inertial measurement units with wireless communication. Zhang [22] integrated an IMU with a Hall sensor array. This integration achieves high-precision positioning. However, the effective positioning distance is limited. Vedaei [23] integrated an IMU with sidewall cameras. This integration can accurately capture 3D trajectories without external reference equipment. However, multiple modules consume high power and have poor battery life. Wu [24] integrated an IMU with RSS-based OWP. This integration reduces positioning errors. However, data synchronization poses challenges. Although existing indoor positioning technologies are relatively mature, many practical problems exist in nuclear radiation detection training.
Existing single technical schemes (BLE, UWB, PDR, QR, RFID) cannot simultaneously meet the requirements of anti-shielding, low cost, and low cumulative error in enclosed spaces. Hybrid technical schemes have shortcomings such as short detection distance, poor battery life, and low practicality. These shortcomings greatly affect the detection performance of simulated detection of nuclear fuel penetrating radiation fields in enclosed spaces. To address this, this paper designs a scheme for simulated radiation detection training equipment in indoor positions based on inertial sensors and wireless Bluetooth communication. It simulates the radiation dose rate values formed by radiation sources in space through changes in spatial distance. This effectively simulates the radiation field detection training process.
2. Methods
The key to conducting radiation detection training in an enclosed space environment lies in radiation field simulation and radiation source localization. Therefore, this paper focuses on the design of a radiation field simulation and detection system, with the core aim of addressing these two key technical issues.
2.1. Modeling of Indoor Radiation Field Intensity
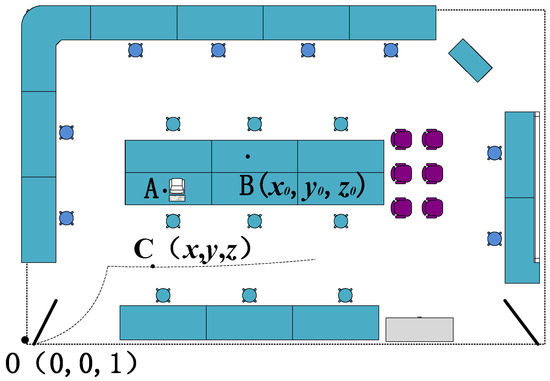
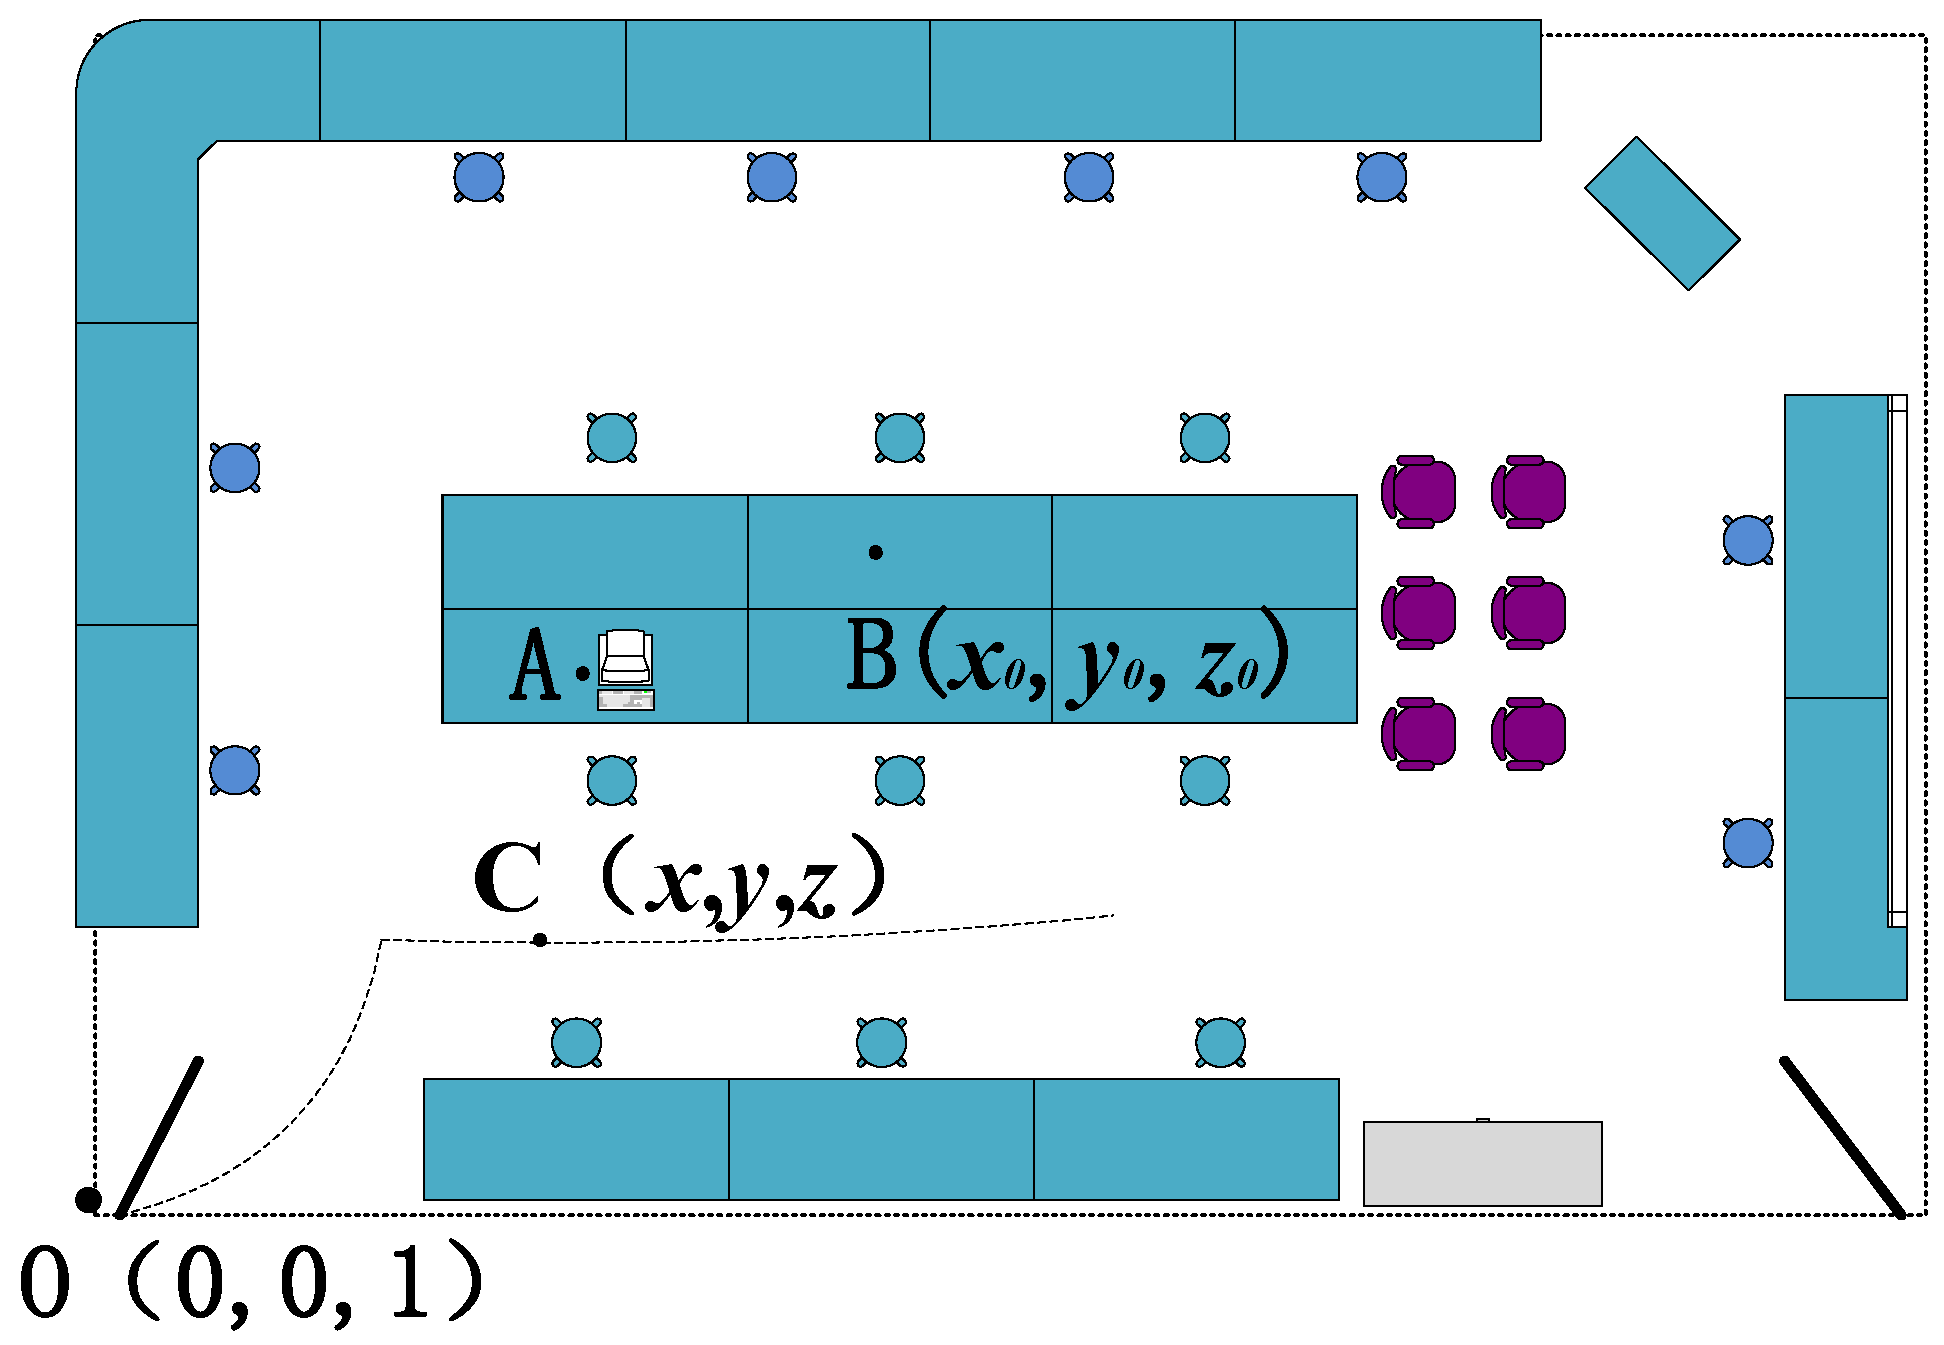
The intensity of the indoor radiation field is determined by the characteristics of the radiation source and environmental factors. In this paper, the simulated enclosed space is set as a specific simulated laboratory, and the layout of the laboratory is shown in Figure 1. Point A is the location where the main control computer of the radiation simulation detection equipment is situated.
Figure 1.
Schematic diagram of the laboratory.
This study establishes a laboratory spatial coordinate system Oxyz, with the origin O at (0, 0, 1), the OZ axis pointing vertically upward, the OX axis pointing horizontally to the right, and the OY axis pointing forward; at the initial time, the radiation simulation and detection equipment initializes at O(0, 0, 1), and the simulation assumes a point source, where the host computer sets the source position at B(x0, y0, z0), as shown in Figure 1; as the radiation detection equipment moves along the dashed path in Figure 1, the radiation intensity at any position C(x, y, z) depends on the spatial distance R between B and C, the medium type, and the medium distribution; to improve simulation accuracy, the γ and neutron radiation fields use the Monte Carlo particle transport code SuperMC, which simulates the photon transport process and calculates the neutron radiation field, the gamma radiation field, and the mixed gamma–neutron radiation field, with the primary metric being the distribution of the neutron/γ dose equivalent rate in the laboratory space under the assumed source conditions; the simulation workflow includes generating the geometric model via CAD modeling, producing the physical model via parametric physical modeling, performing three-dimensional radiation field simulation to obtain a virtual radiation environment, and referencing [25,26].
2.2. Principle of Calculation of the Motion Path of Radiation Simulation Detection Equipment
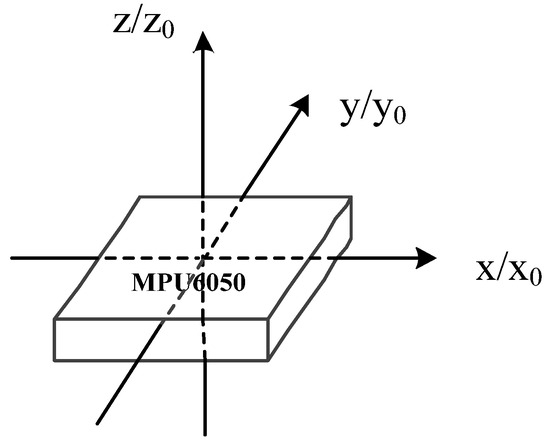
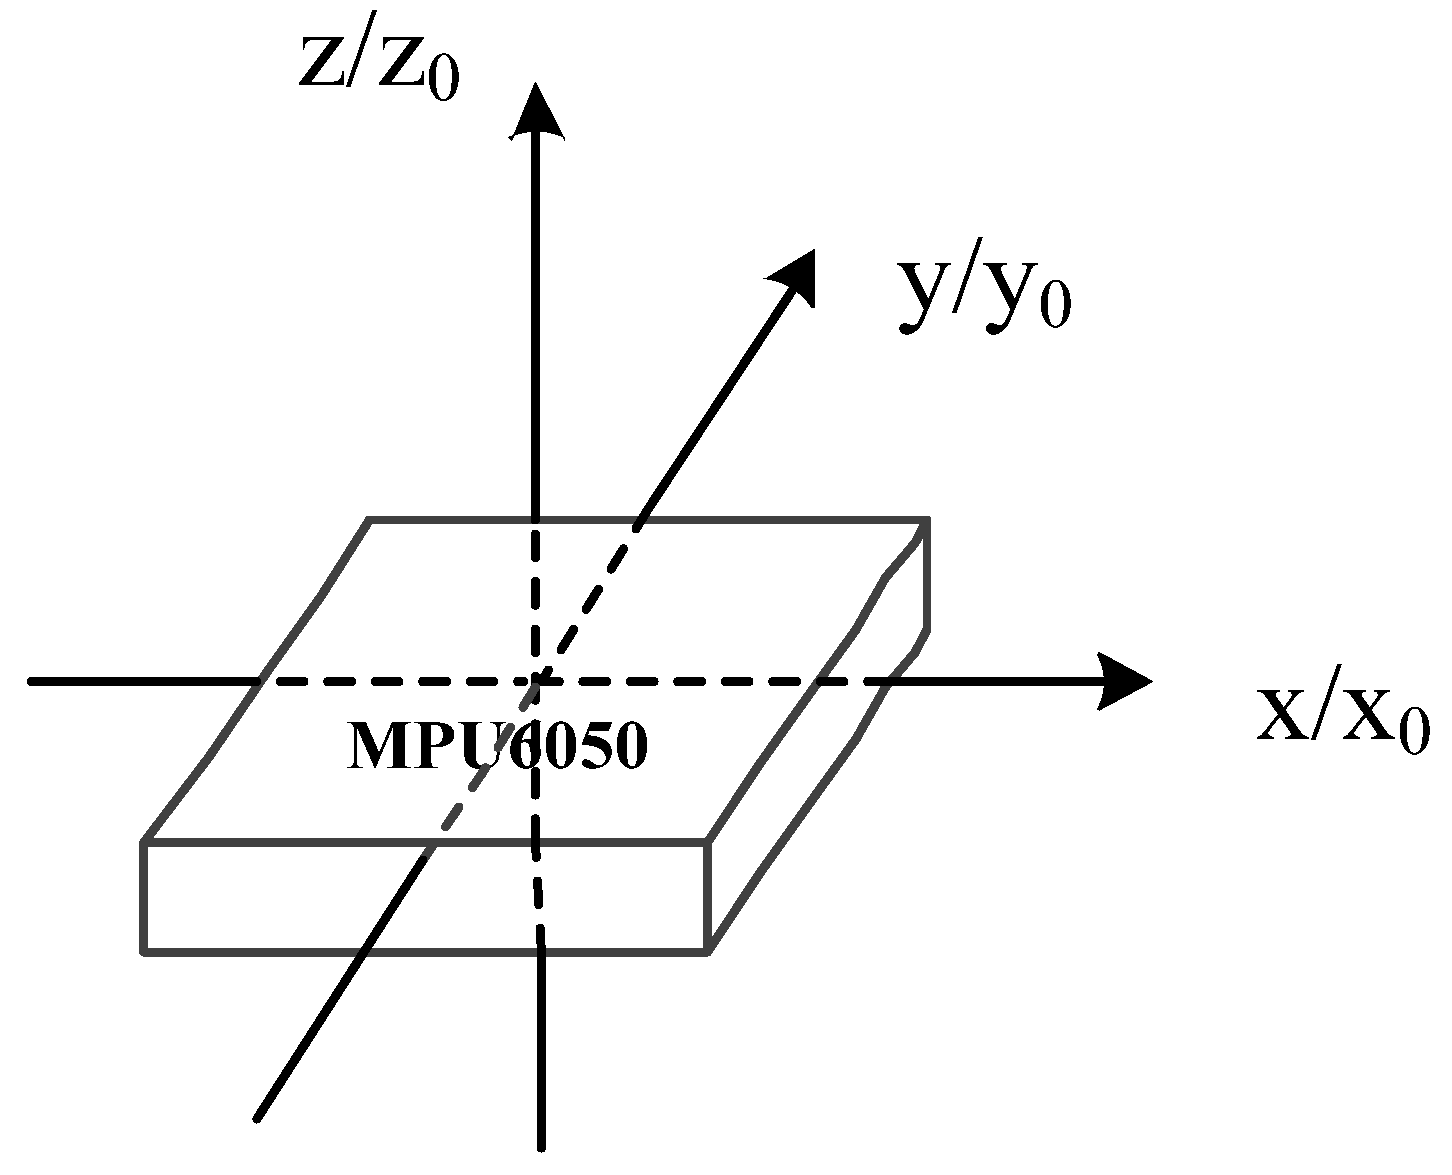
MPU6050 inertial sensors are widely used, as shown in Figure 2. The sensor offers a small size, low cost, and low power consumption. It also provides attitude and motion data without additional multi-sensor suites, which simplifies system integration. Although the sensor has drawbacks such as zero-offset, these can be suppressed by optimized cooperative strategies. It aligns closely with the application scenarios and core requirements of enclosed-space nuclear radiation detection training equipment and fully meets the accuracy requirements for radiation detection training. Under ideal conditions, it is assumed that the MPU6050 inertial sensor remains horizontally level, with its y-axis always pointing forward, the x-axis horizontal to the right (the right-hand direction when moving forward), and the z-axis vertical upward. In this case, the inertial coordinate system x0y0z0 coincides with the MPU6050 coordinate system xyz. The system computes the spatial trajectory and direction angle in real time from the three-axis acceleration values [27,28].
Figure 2.
Schematic diagram of the inertial coordinate system and the MPU6050 coordinate system.
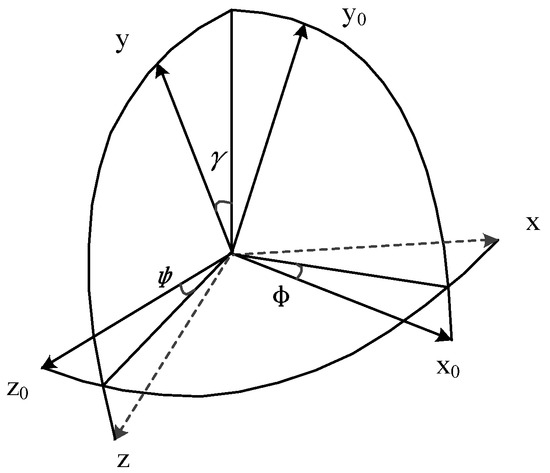
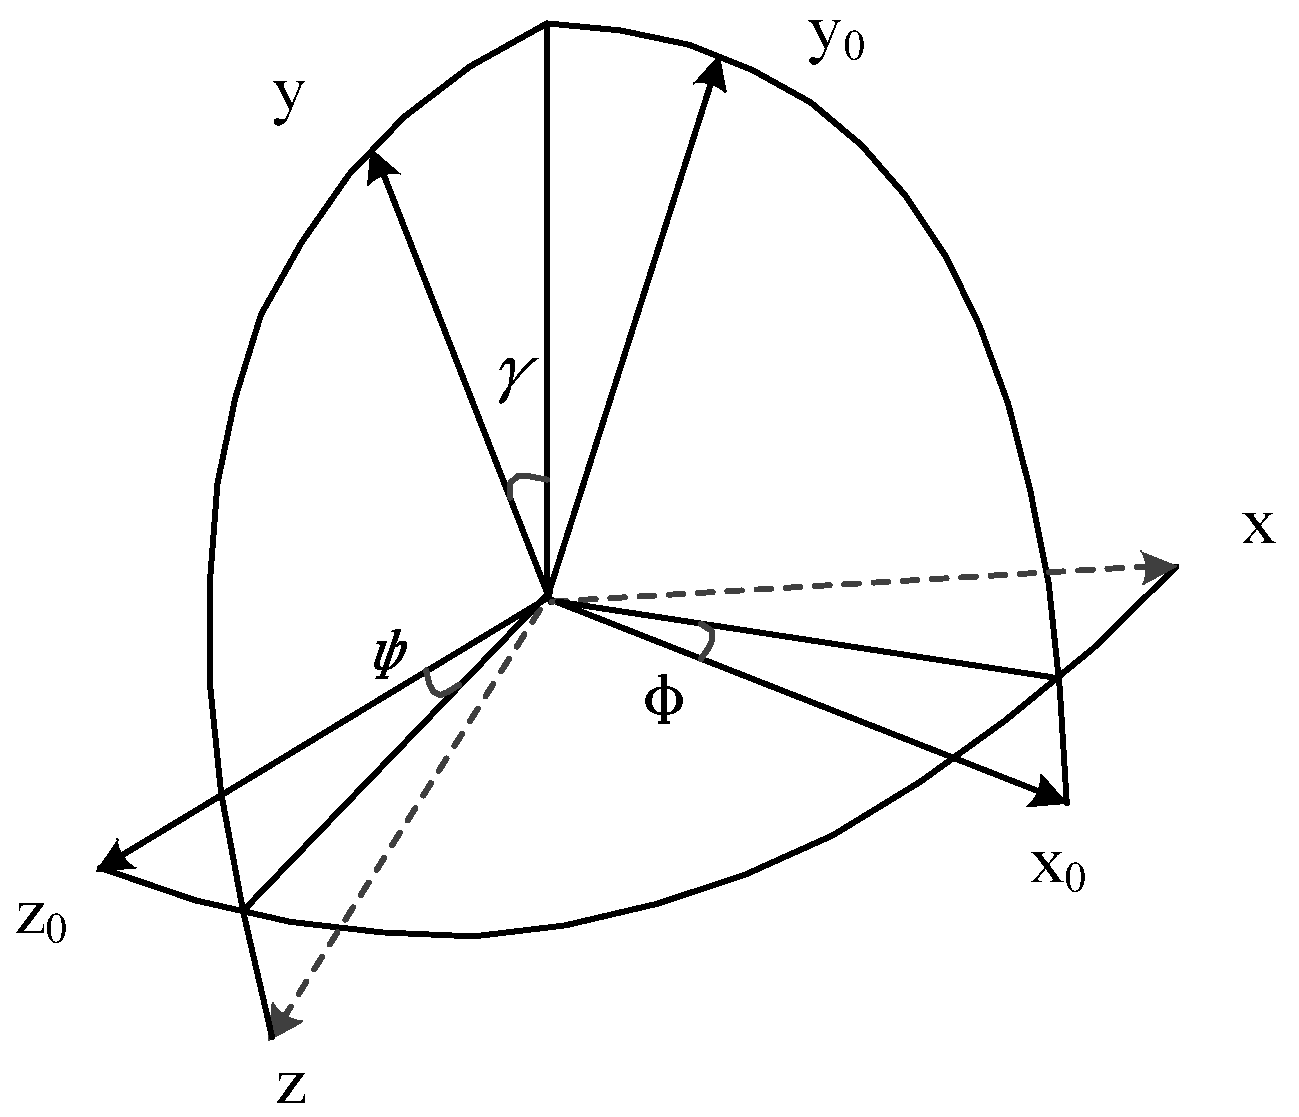
The above two coordinate systems are not completely coincident in actual motion, as shown in Figure 3. In the figure, respectively represent the rotation angle around the three axes of X, Y, and Z (the meaning of the angle is determined by the rotation order), which are called pitch, yaw, and roll angles.
Figure 3.
Schematic diagram of coordinate conversion.
To transform the MPU6050 coordinate system into the inertial coordinate system of the simulated detection device, this paper adopts a rotation sequence: first around the Z0-axis, second around the transitional Y0′-axis, and third around the transitional X′-axis. This means rotating initially around the positive z-axis by an angle φ, then rotating around the positive transitional Y0′-axis by an angle φ, and finally rotating around the transitional X′-axis by an angle γ. The ZYX rotation sequence matches the pattern of human motion attitude changes. First, the yaw angle (rotation around the Z0-axis) determines the travel direction. Then, the pitch angle (rotation around the transitional Y0′-axis) and roll angle (rotation around the transitional X′-axis) correct for attitude deviations caused by device tilting. This aligns with practical operational logic. Based on this transformation sequence, the directional cosine relationship between the two coordinate systems can be expressed as follows:
where
The three rotation matrices are:
Thus, the rotation matrix for the transformation from the coordinate Oxyz to the coordinate Ox0y0z0 is obtained:
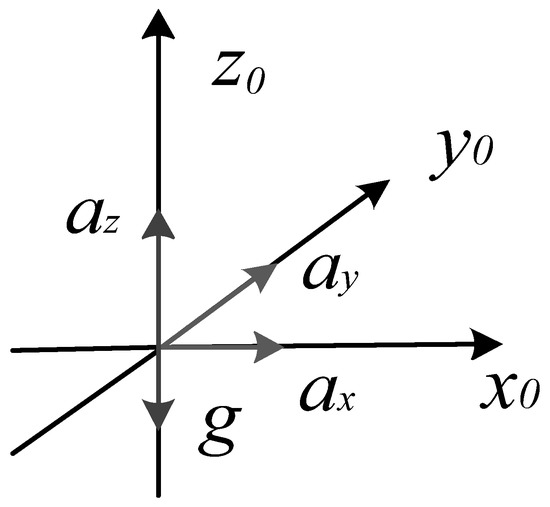
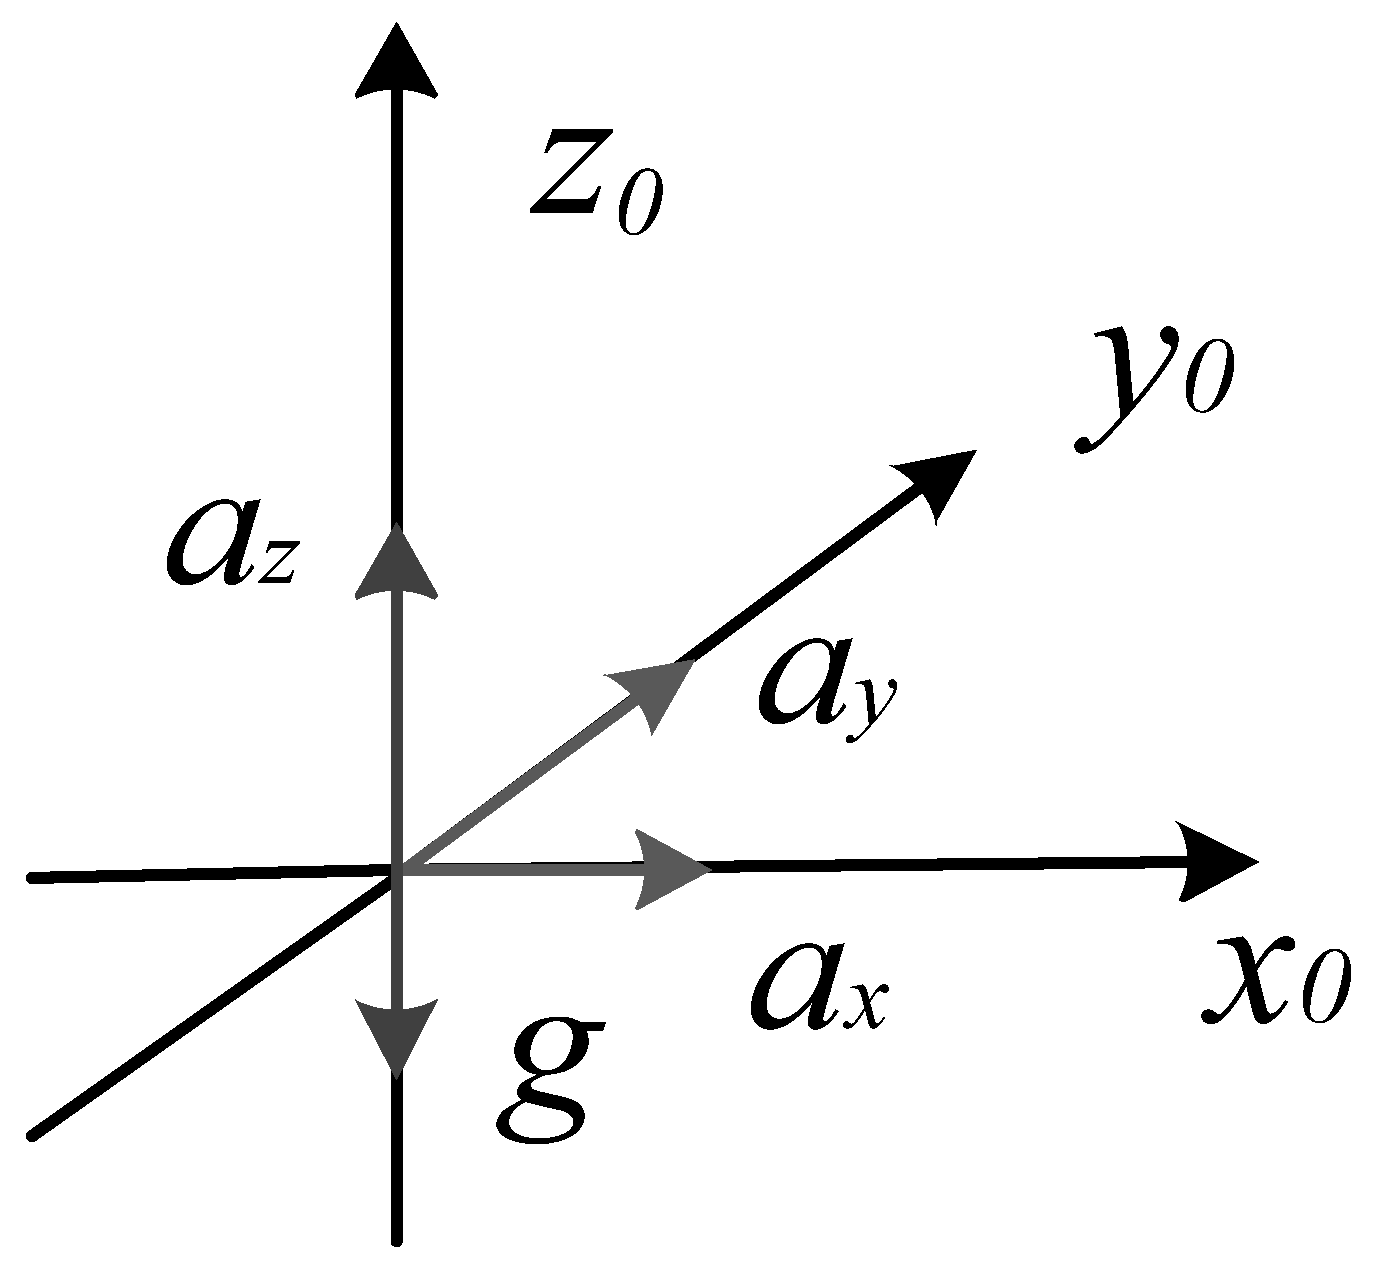
Through coordinate transformation, the three-axis linear acceleration in the inertial coordinate system is obtained, which are recorded as ax, ay, and az. The schematic diagram of the acceleration of the simulated detection device during the movement is shown in Figure 4.
Figure 4.
Schematic diagram of acceleration.
The velocities vx, vy, and vz, and displacements Sx, Sy, and Sz in the three axis directions can be obtained from the knowledge of physics [29,30]. Their calculation formulas are as follows:
where v0 and S0 are the initial velocity and initial displacement of the simulated detection device. In this experimental scheme, the simulated detection equipment starts to move from the initial position S0(0,0,1) at rest, so the above two equations can be simplified as:
Finally, the real-time spatial coordinates of the simulated detection equipment are (Sx, Sy, Sz). The distance between the simulated detection equipment and the simulated radiation source (coordinates (x0, y0, z0)) can be calculated by the distance formula between two points.
3. Results
3.1. Design of Detection Training Equipment
This paper adopts the Arduino UNO R3 produced by Arduino S.r.l. in Italy as the main control chip of the analog detection equipment. It employs the MPU6050 inertial sensor for processing inertial position information and data. An HC-05 Bluetooth module enables communication between the host computer and the radiation simulation detection device. The module’s antenna is externalized and mounted at a 30° tilt relative to the device casing to reduce signal shielding from metal components. Furthermore, an independent shield protects the module, mitigating electromagnetic interference from other electronic devices in the nuclear radiation training environment. The LCD12864 liquid crystal display module updates and displays the radiation dose rate value of the simulated detection equipment in real time. Among them, the MPU6050 sensor adopts the Kalman and DMP motion processor for data output and fusion calculation processing to eliminate errors and compensate for data such as acceleration, angular velocity, three-axis rotational angular velocity, and spatial three-axis displacement. Through the theory of space inertial coordinate and target carrier coordinate transformation, the angular velocity after error elimination and compensation is converted to the corresponding coordinate axes of the moving simulated detection equipment. The three-axis spatial displacement is obtained through integration and compensation, so as to obtain the spatial position information of the simulated detection equipment. Finally, the radiation dose rate value is calculated through the radiation dose rate calculation formula, and the data are displayed on the LCD screen in real time with updates per second.
The MPU6050 employs a static calibration method, with the sensor fixed to a high-precision fixture in a vibration-free, constant-temperature laboratory environment at 25 ± 2 °C to avoid the effects of gravitational interference and temperature drift. Data are acquired at a sampling frequency of 100 Hz. The zero-bias values are written into the sensor registers and subtracted in real time during data acquisition to eliminate fixed offsets. Dynamic uniform linear motion is performed to define the motion trajectory, and the corresponding calibration is carried out. After calibration, the accelerometer zero-bias error is ≤0.05 m/s2, and the gyroscope zero-bias stability is ≤0.5°/s. The sensor sampling frequency is set to 100 Hz, the DMP fusion output frequency is 100 Hz, and the DMP is configured with a 42 Hz low-pass filter. The Kalman filter parameters are set to Q = 0.001 and R = 0.1. The Bluetooth transmission rate is 10 Hz, and the screen refresh period is 1 Hz, meeting the requirements for real-time training.
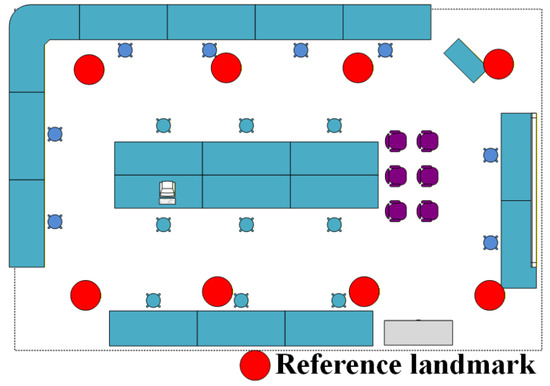
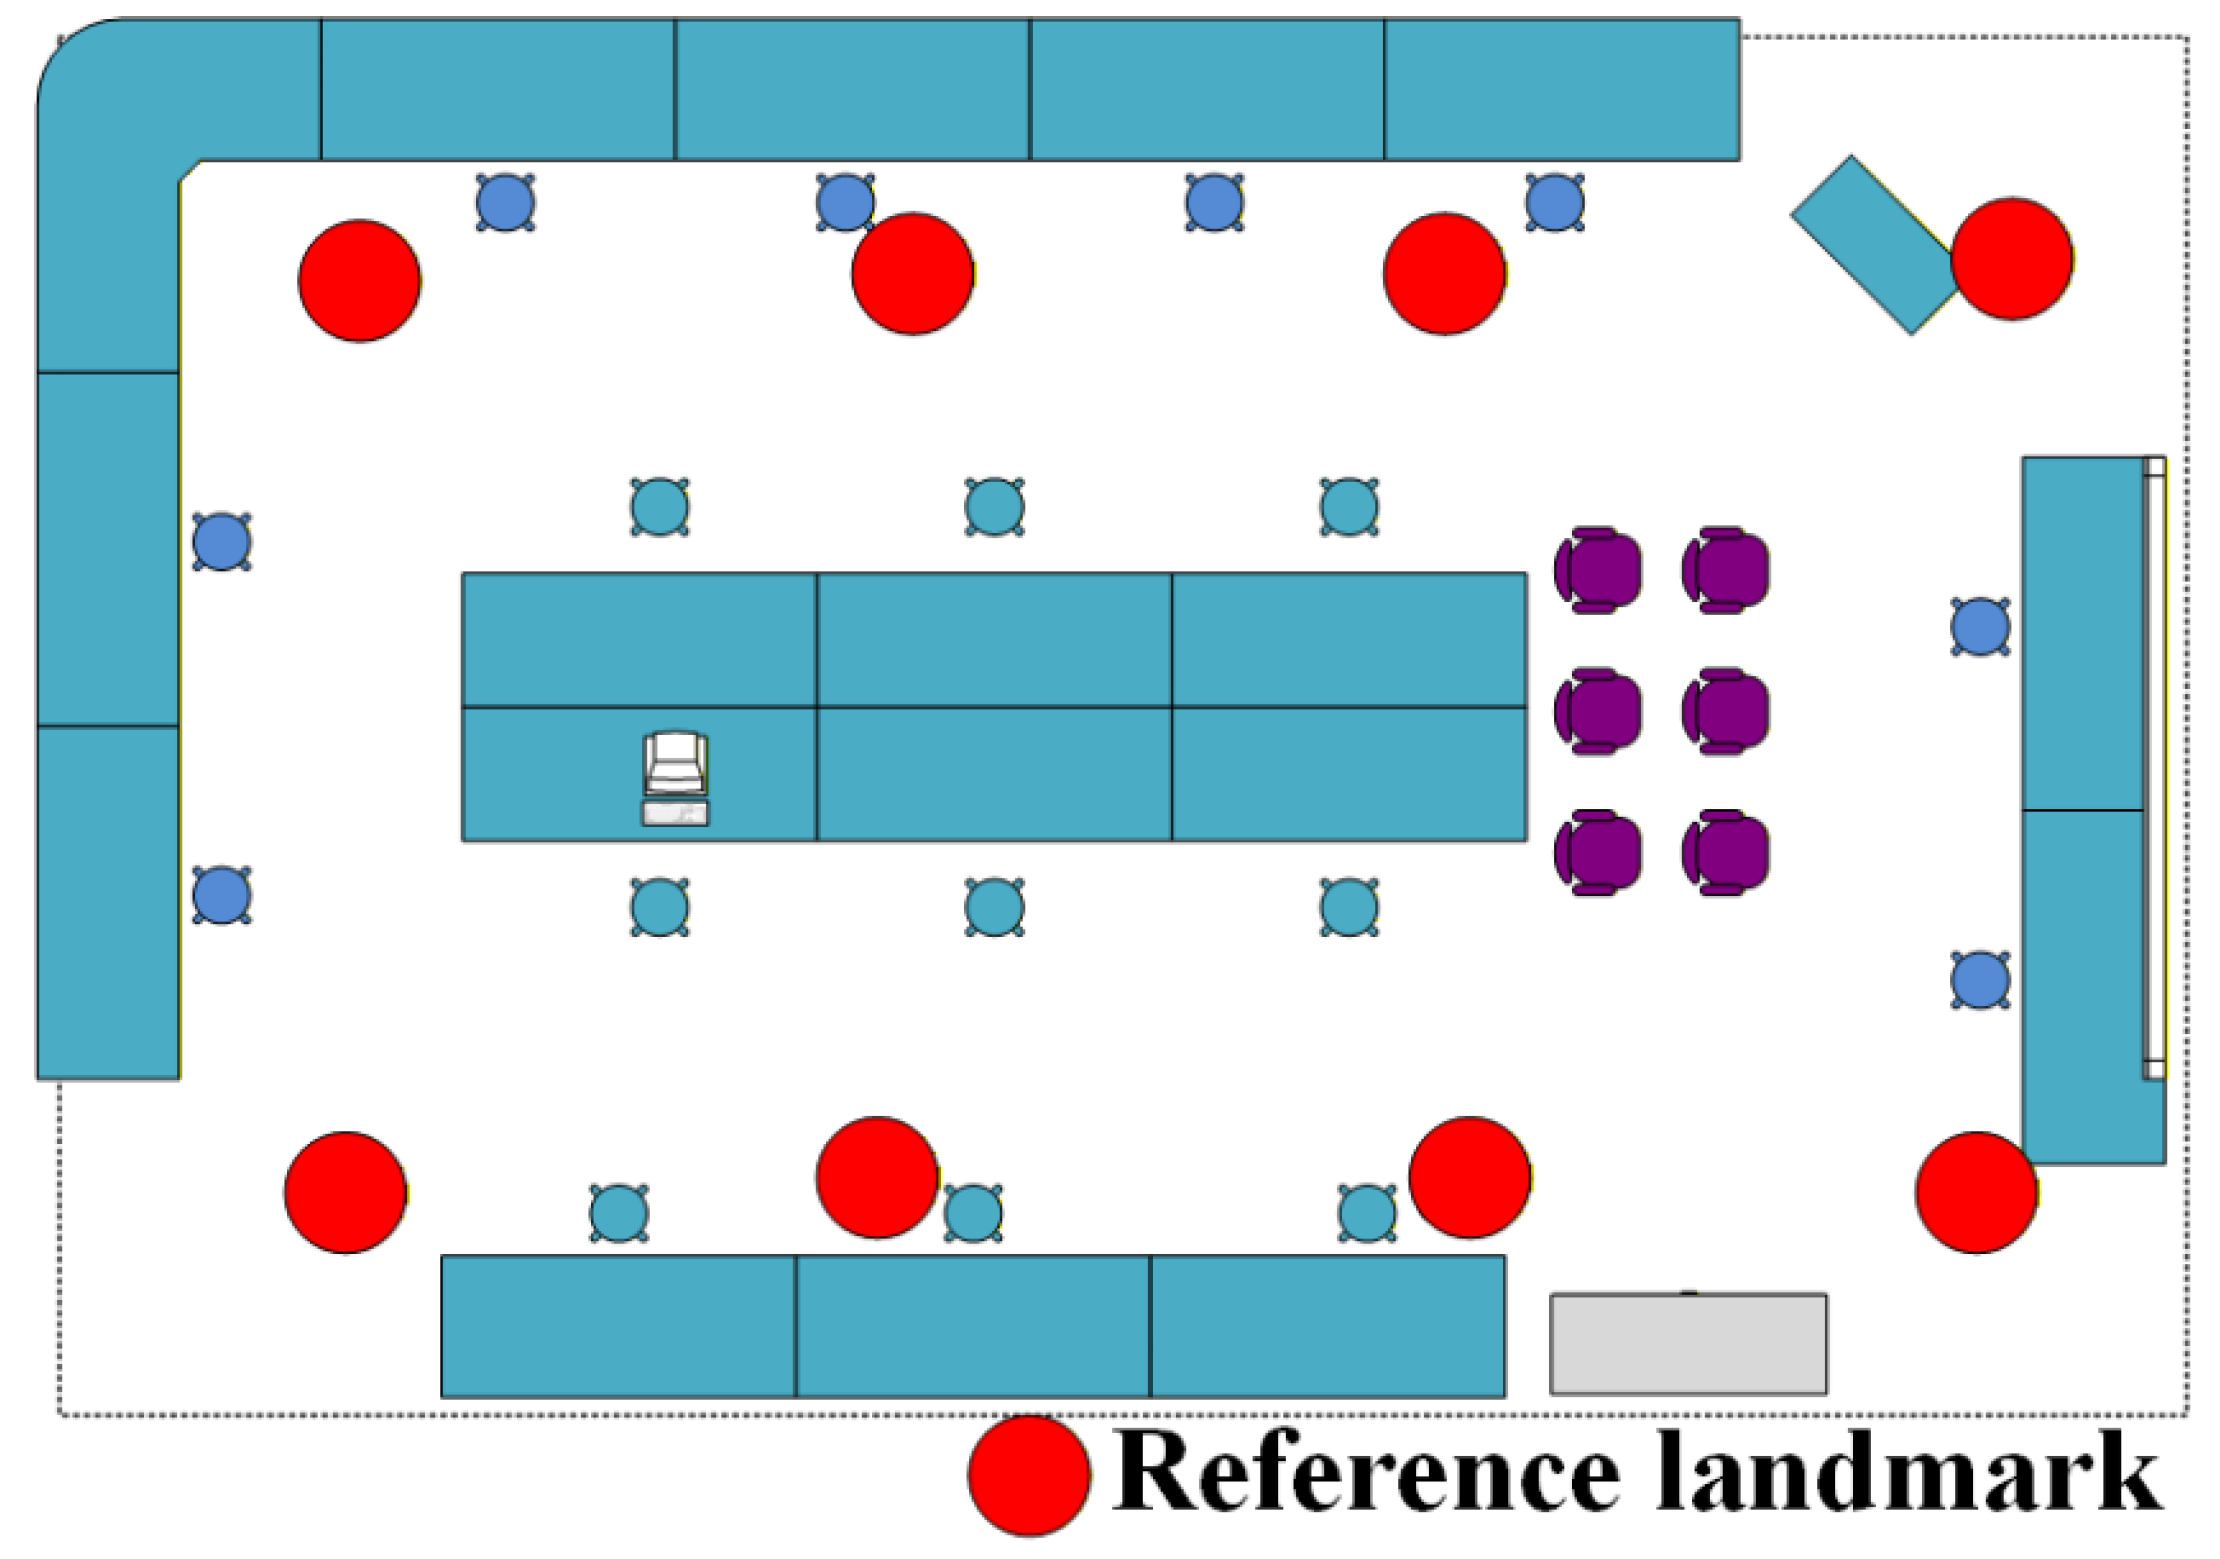
During the movement of the positioning module, drift may occur. To avoid the accumulation of errors during training, this study adopts landmark calibration to eliminate such cumulative errors. Specifically, eight reference landmarks are arranged in the laboratory space, and their exact positions are illustrated in Figure 5. Precise three-dimensional coordinates of these reference landmarks are pre-measured. During training, the positioning module is placed at the nearest reference landmark for calibration approximately every 5 min.
Figure 5.
Reference landmark distribution.
The overall design target is an average absolute error in three-dimensional space positioning of ≤0.06 m and a maximum error of ≤0.08 m. For repeated measurements at the same calibration point, the standard deviation of the positioning error is ≤0.01 m, ensuring consistency and reliability of the training data. The relative error between the simulated γ dose equivalent rate and the calibrated true value has a mean ≤ 8% and a maximum ≤ 8%, which is below the ±20% allowable deviation specified in the GBZ 128-2002 standard. The system features strong endurance, accurate positioning, and high efficiency.
3.2. Overall Design
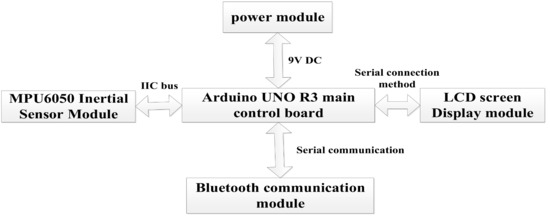
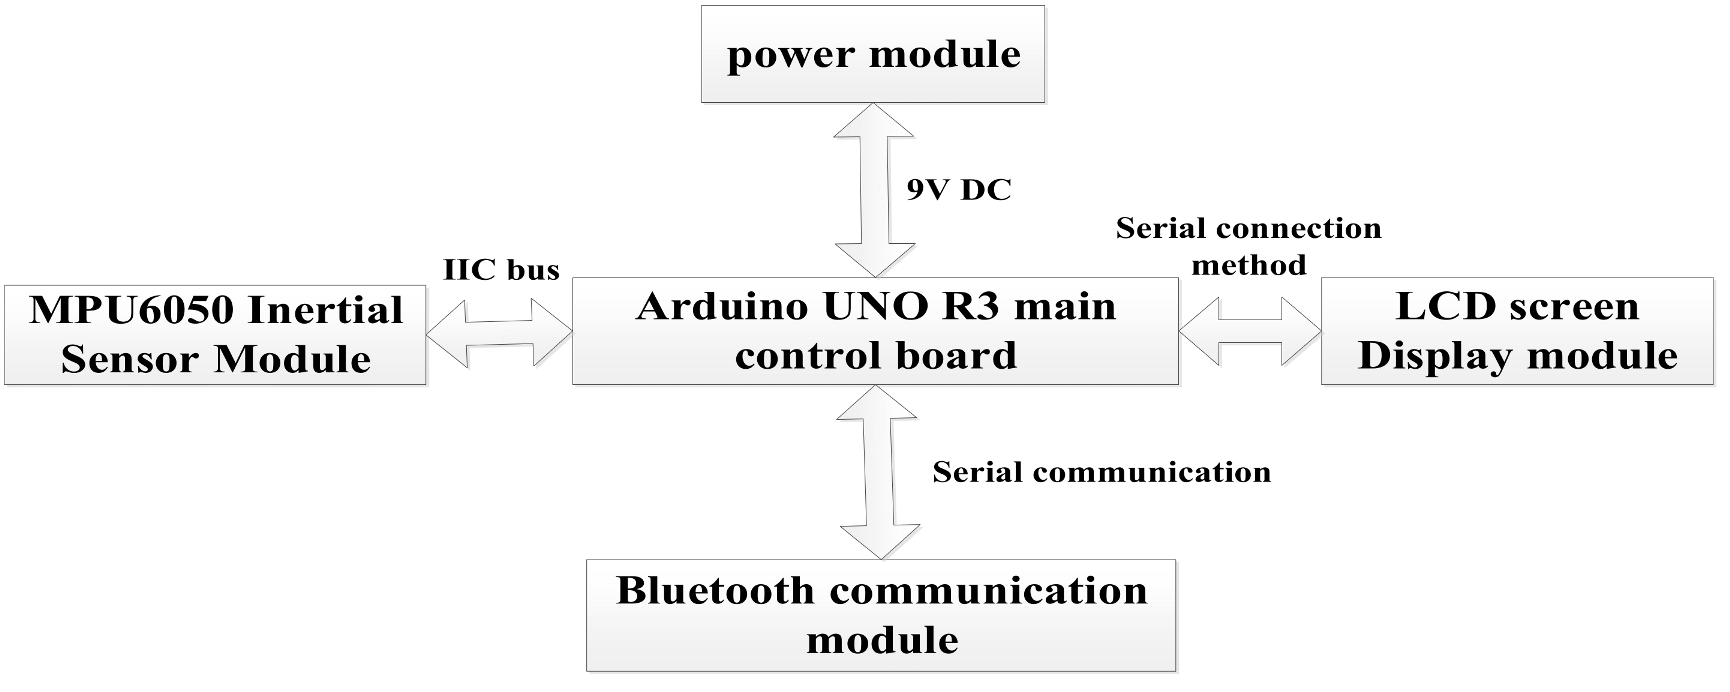
The overall design block diagram of the analog detection equipment in this work is shown in Figure 6.
Figure 6.
Overall design block diagram of the analog detection equipment.
The equipment is divided into five parts, namely the Arduino main control board module, MPU6050 inertial module, LCD screen display module, Bluetooth communication module, and power supply module. The Arduino main control module adopts the UNO R3 main control board [31], which is equipped with a power supply filter, a voltage regulator chip, and related circuits. The functions of the main control chip and power module can be achieved simply by powering the entire main control board. A 9V DC power input produced by Delipu Company, located in Guangzhou, Guangdong Province, China, is adopted. Therefore, this section focuses on designing the program flows of the MPU6050 inertial sensor module, Bluetooth communication module, and LCD screen display module [32]. The overall parameters of the device are listed in Table 1.
Table 1.
Overall device parameters.
3.3. Each Module Design
3.3.1. MPU6050 Positioning Module Design
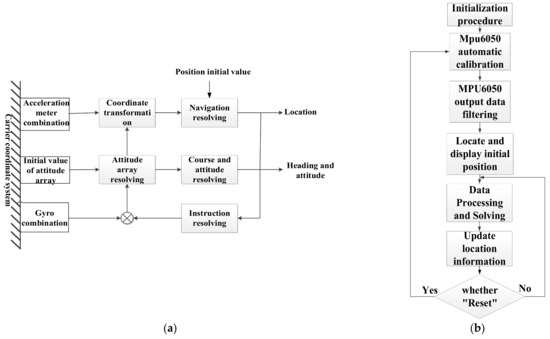
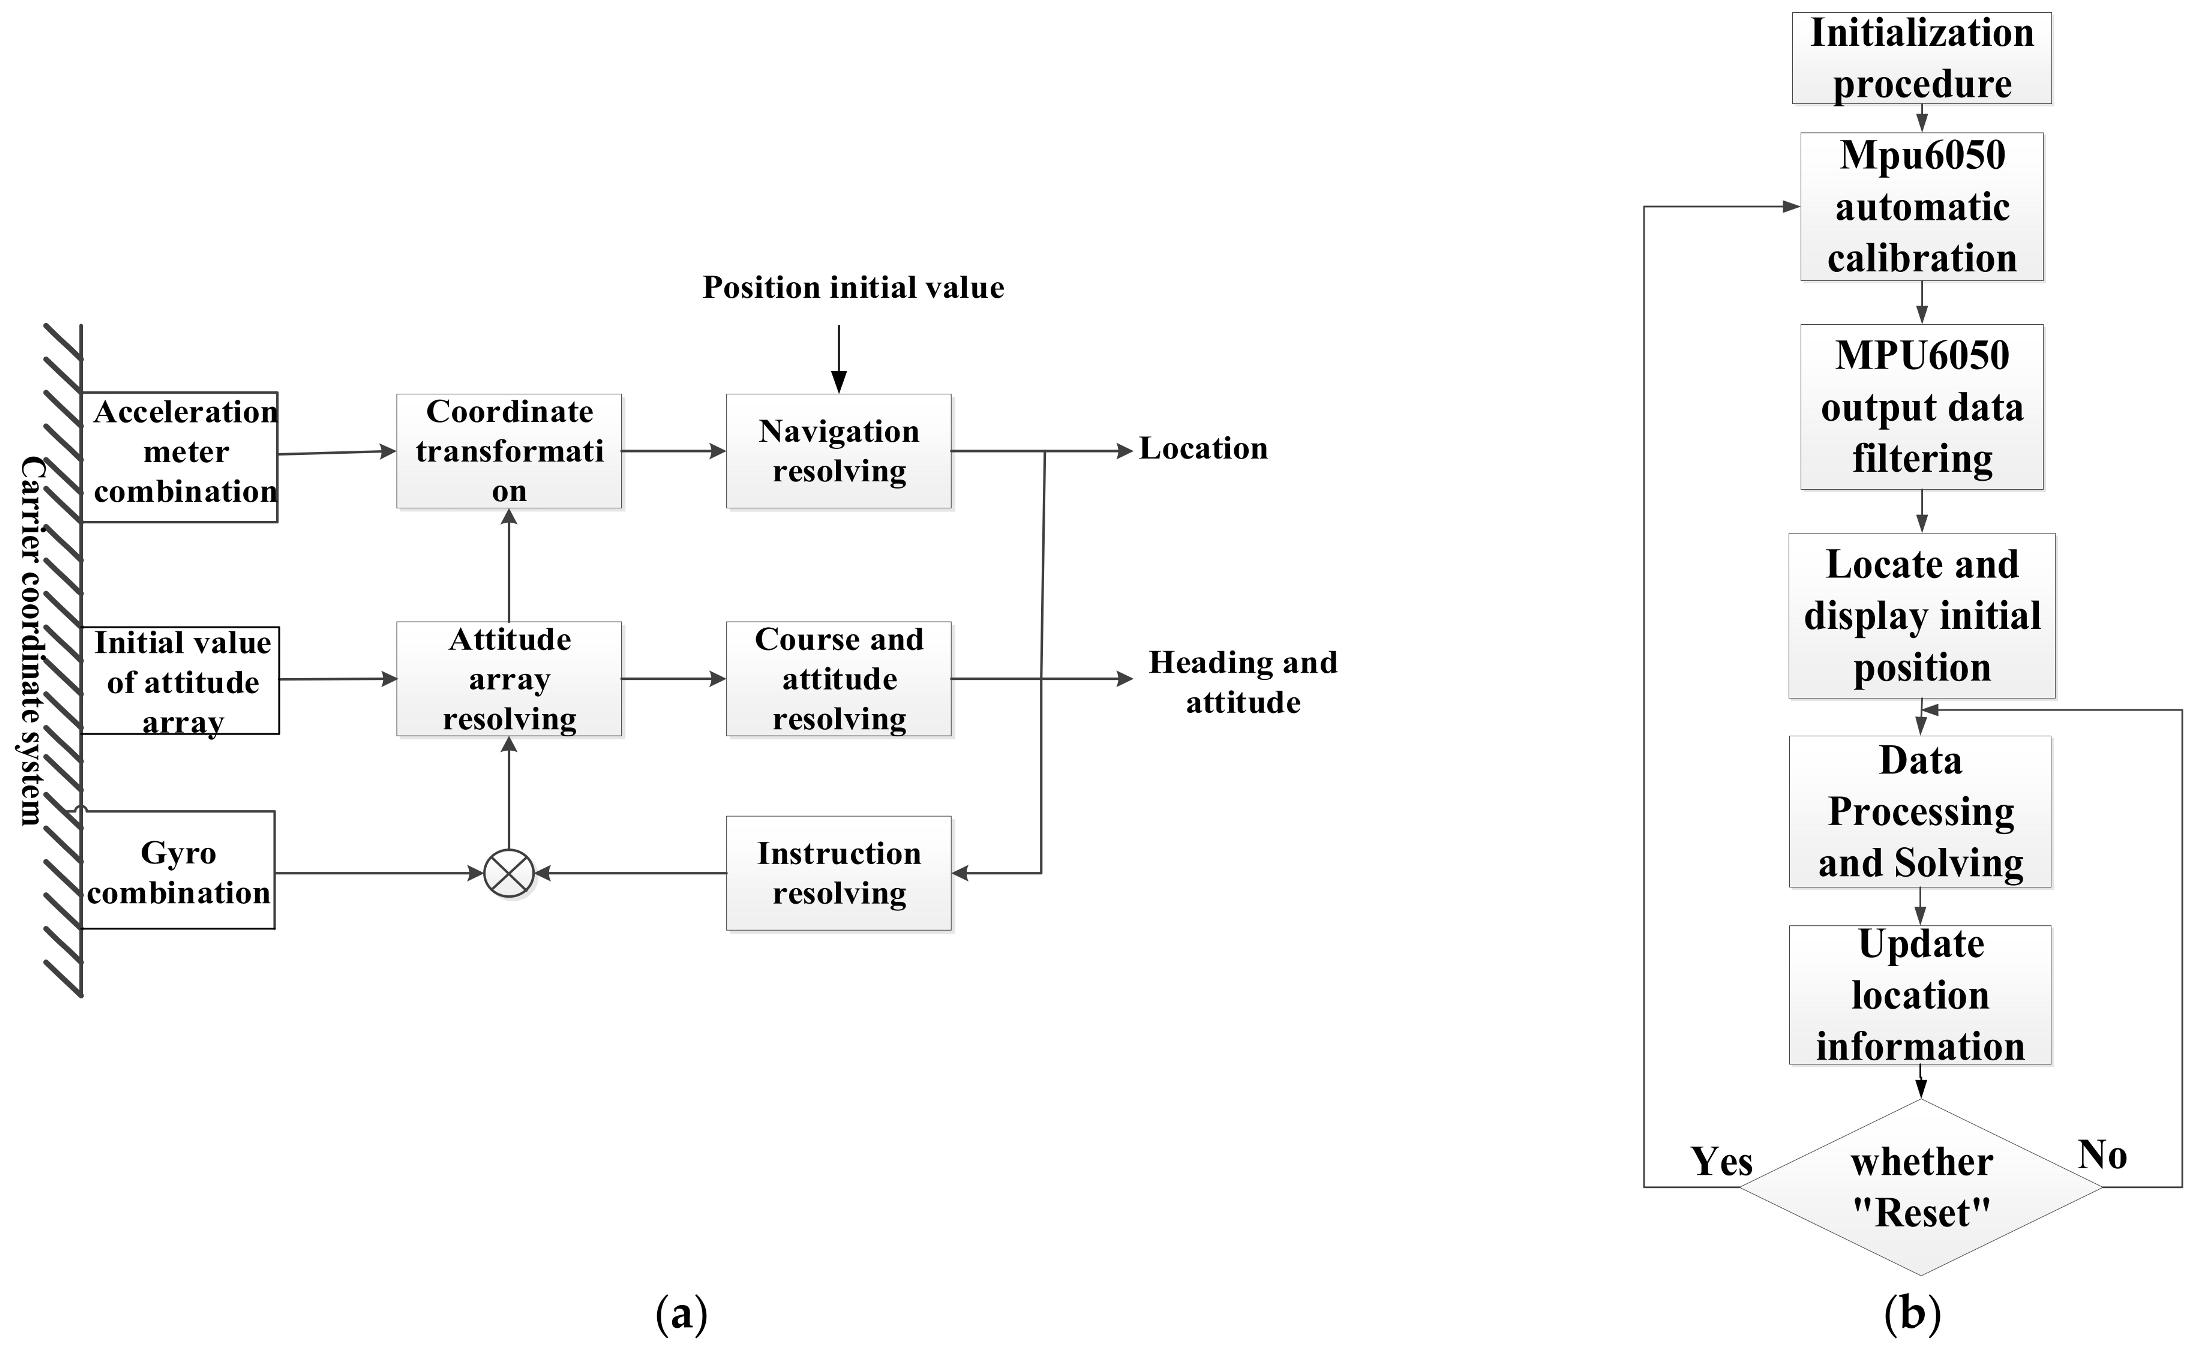
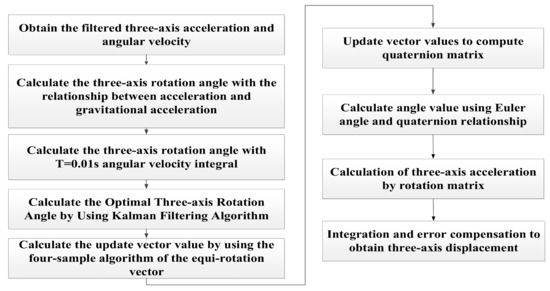
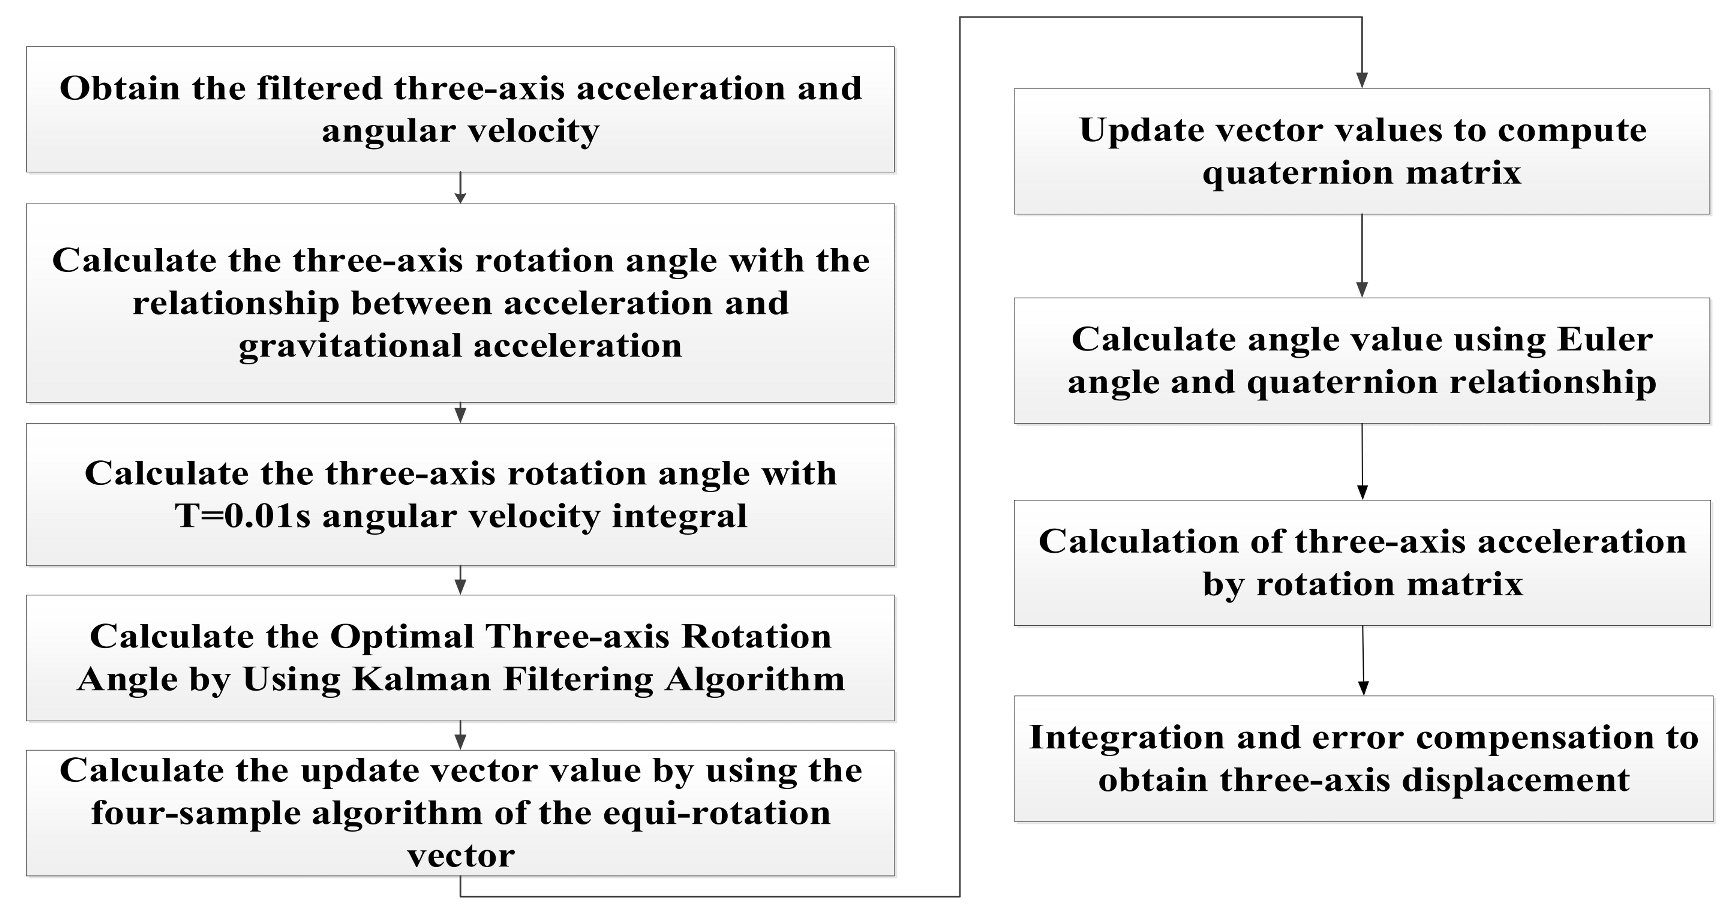
In this paper, the indoor positioning scheme is designed as follows: after performing DMP filtering on the data from the MPU6050 three-axis accelerometer and gyroscope, the three-axis rotation angles (i.e., Euler angles) are calculated. The angle values obtained from the two different calculation formulas are fused via a Kalman filter to determine the optimal angle values [33,34]. Then, the rotation vector four-sample algorithm is used to solve the current quaternion, and the rotation matrix is finally derived from the quaternion. Through this matrix, the three-axis acceleration values are converted to the three axes of the moving simulated detection equipment, and the three-dimensional displacements are ultimately obtained through integration with error correction to determine the target position coordinates [35]. Its principle diagram is shown in Figure 7a, and the program flowchart is shown in Figure 7b.
Figure 7.
Inertial navigation system. (a) Schematic diagram of the inertial navigation system. (b) Inertial navigation positioning program flowchart.
The flow of data processing and calculation is shown in Figure 8.
Figure 8.
Data processing and calculation flowchart.
3.3.2. Bluetooth Communication Module Design
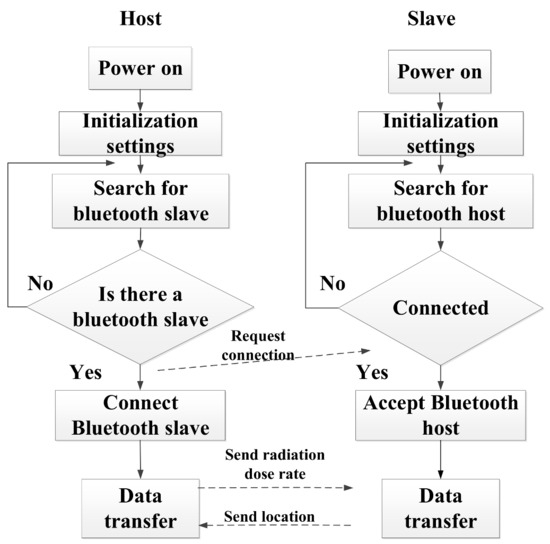
In this article, the master-slave connection mode of the HC-05 Bluetooth module is used. The main control machine is in active mode, and it automatically searches for Bluetooth matching and pairing when it is turned on. The analog detection device is in slave mode, waiting to be connected after powering on.
The main process is: after the master computer and the analog detection device are turned on, the master-slave Bluetooth module starts self-checking. Then, the master module starts to search for a pairable Bluetooth module nearby, and the slave module enters a state of waiting to be connected. When the host module searches for the slave module, it starts to send a request-to-connect command. After the slave receives the command, it starts to connect with the master module. After connection, the Arduino UNO R3 analog detection device main control board sends the processed location information from the slave module to the Bluetooth master module. Next, the Bluetooth master module receives the location information and uploads it to the control terminal of the master computer. After the master computer recognizes and processes the location information, it calls the database and transmits the radiation dose rate value at the location of the simulated detection device to the Bluetooth master. The Bluetooth master sends it to the Bluetooth slave, and the slave receives the data and uploads it to the Arduino UNO R3 master. Eventually, the host computer control screen displays these data. The master-slave Bluetooth communication process is shown in Figure 9.
Figure 9.
Master-slave Bluetooth communication process.
3.3.3. Screen Display Module Design
After the LCD is powered on, the initialization process is started. The process is as follows: after 40 ms of power-on, the reset port level signal changes from low level to high level, and the reset is started. The first step is to set the function setting and perform the basic command operation of 8-bit data transfer (the minimum operation time of this process should last 100 µs). The second step is to set the display switch control settings. The display mode is set as follows: when D = 1, the display mode is the overall display; when C = 1, the cursor function is turned on; and when B = 1, the cursor position is set to white (the minimum operation time of this process should last 100 µs). The third step is to set the clear screen setting and perform the setting to clear all the contents displayed on the screen. During this process, the D2RAM address is filled, and it starts from 00H again (the minimum operation time of this process should last for 10 ms). The fourth step is to set the input mode setting and perform cursor and shift settings. After the above four steps are set, the initialization process is completed.
After the initialization is completed, the LCD screen will enter the standby mode. In this mode, the screen waits for interruption by other expansion commands. Any expansion command can terminate the standby mode. In this article, when the Arduino UNO R3 main control board receives the radiation dose rate value, it first sends the serial-port read-address command to the LCD. After the LCD control chip receives the address command, it enters the display state from the standby state. Then the main control board sends the display-character internal code to the LCD control chip. After processing, the Chinese characters and radiation dose rate values are displayed at the designated position.
3.4. Verifying Equipment Accuracy
Prior to the initiation of training, precomputation is performed using SuperMC, and the results are stored in a data table. In the near-field region, the spatial resolution of the radiation field distribution is 0.05 m, whereas in the far-field region it is 0.1 m. When a measurement point does not coincide with any computation point, the radiation dose rate at the measurement point is calculated using the weighted average of eight adjacent points.
In reactor nuclear accident emergency training, the system primarily trains personnel to locate radioactive sources by detecting penetrating radiation fields in enclosed spaces and to respond promptly. The key performance metrics of interest are positioning accuracy and the credibility of the radiation field simulation.
3.4.1. Spatial Positioning Verification
The system is applied to training for locating radioactive sources and responding to accidents. Considering the movement range of personnel during detection and response operations, a three-dimensional absolute positioning error of no more than 0.2 m does not affect operations or training. Therefore, the permissible positioning error is defined as 0.2 m. To verify the system’s spatial positioning error, this study selected 10 calibration points within the training area, recorded their true coordinates, and had trainees sequentially pass through each point while holding the positioning module to read the measured coordinates. These were compared with the true coordinates to analyze the positioning error (Table 2).
Table 2.
Statistical analysis of positioning error.
Comparing the true coordinates of the calibration points with the system-measured coordinates, the maximum error of the system’s three-dimensional spatial positioning was 0.08 m, which did not exceed the allowable error range.
3.4.2. Radiation Field Simulation Verification
To verify the credibility of the system’s radiation field simulation, this study conducted a radiation field monitoring experiment in a nuclear-related laboratory using a Cs-137 radiation source. The source coordinates were (8, 6.5, 1), the γ-ray energy was 661.7 keV, and the activity was 1.24 × 10⁶ Bq. Dose rates were measured at four calibration points, and the measured values were compared with the system-simulated values. The data are presented in Table 3.
Table 3.
Statistical analysis of dose rate error.
Considering that instrument measurements in radiation dose monitoring also introduce errors, the relative error in this study is defined as the relative error between the system-simulated values and the calibration true values. The mean relative error of the system-simulated values is 4.81%, and the maximum is 7.8%. Dose-rate monitoring is subject to multiple uncertainty factors related to the radiation source, monitoring equipment, and other aspects. According to GBZ 128-2002 [36], the allowable deviation between personal dose equivalent and environmental γ dose-rate monitoring results and the true values is ±20%. The deviations between the system-simulated values and the calibration true values do not exceed the allowable error range for personal and environmental radiation monitoring; therefore, such radiation field simulation errors are considered acceptable for radiation detection simulation equipment.
3.5. System Performance Comparison and Verification
Based on the Arduino UNO R3 as the core controller of the simulated detection device, the MPU6050 inertial sensor is used to acquire and process attitude and motion information, the HC-05 Bluetooth module enables wireless communication between the host controller and the simulated detection device, and the LCD12864 liquid crystal display updates and shows radiation dose-rate data in real time. The MPU6050 integrates a Kalman filtering algorithm and DMP function to output and fuse accelerometer and gyroscope data, thereby correcting and compensating for multidimensional data such as acceleration, angular velocity, and three-axis spatial rotation angles. According to the principle of transformation between the spatial inertial coordinate system and the target carrier coordinate system, the error-corrected angular-velocity data are mapped onto the inertial coordinate axes of the detection device during movement; through integration and a dynamic compensation mechanism, the system calculates the spatial displacement in the three axes to obtain the real-time spatial position of the detection device. Finally, combined with the radiation dose-rate calculation model, it receives dose-rate data from the host controller and displays them on the LCD screen with a refresh frequency of once per second. In three-dimensional spatial positioning, the mean absolute error does not exceed 0.06 m, the maximum error is controlled within 0.08 m, and the standard deviation of positioning error for repeated measurements at the same calibration point is less than 0.01 m to ensure stability and consistency of training data. In addition, the mean relative error between the simulated γ dose-equivalent rate and the standard true value is no more than 8%, and the maximum relative error is no more than 7.8%, which is better than the ±20% allowable error range specified in GBZ 128-2002. A comparative analysis between the proposed method and mainstream methods is shown in Table 4.
Table 4.
Performance comparison of different radiation detection training devices.
Compared with the other two methods, the relative improvement in detection efficiency regarding the maximum three-dimensional positioning error of this study is 46.7% and 86.3%, respectively, while the maximum relative error of radiation dose rate simulation is 7.8%. In summary, the system demonstrates clear advantages in safety and achieves compliance with the required accuracy, fully meeting the demands of closed-space nuclear radiation detection training.
4. Conclusions
In response to the practical needs of radiation source detection in nuclear accident emergency training, this paper proposes a design scheme and system prototype of penetrating radiation field simulation and detection equipment. Based on modeling the nuclear fuel through-radiation field, the system uses the inertial sensor MPU6050 (serial interface module) to acquire real-time three-axis acceleration and three-axis angular velocity. The main controller receives, processes, and analyzes the data to localize the simulated detection device within the preset radiation field and transmits the position information to the host computer. The host computer then performs integrated processing and sends the radiation intensity value to the Arduino controller to drive its screen display module and show the radiation intensity. The maximum three-dimensional positioning error is 0.08 m. Compared with other classical methods, the relative improvement in detection efficiency regarding the maximum three-dimensional positioning error of this study is 46.7% and 86.3%, respectively. The maximum relative error of the radiation dose rate simulation is 7.8%. The system’s radiation field simulation and radiation source localization accuracy can meet the requirements of nuclear emergency training. It achieves a balance between safety, economy, timeliness, and other aspects, providing a high cost-effectiveness technical means for nuclear emergency radiation detection training. Through trial use, some deficiencies have been identified in the current system. Future optimizations will be carried out in the following aspects to better support nuclear emergency radiation detection training:
- (1)
- In the present study, the system only considers the simulated detection of the penetrating radiation field from a point source. Under accident conditions, the morphology and size of radiation sources may affect emergency response. Subsequent research should incorporate simulated training for radiation sources with different configurations and emitting rays of varying energies.
- (2)
- Owing to the long computation time of the SuperMC program for radiation-field simulation, the preparation time for emergency training using the system is relatively long. Subsequent research should explore methods and measures to improve computational efficiency.
- (3)
- Future studies will focus on testing dynamic scenarios involving variable velocity and rotation to verify the system’s real-time performance under dynamic conditions and to enhance the authenticity and effectiveness of training. At the same time, research will emphasize deep learning-based methods [39] for the reliability assessment of radiation fields.
Author Contributions
G.H. and H.L. conceived and designed the project. B.L. performed the experiments and analyzed the data. F.W. wrote and edited the manuscript. M.G. and X.X. reviewed and edited the manuscript. All authors have read and agreed to the published version of the manuscript.
Funding
This research received no external funding.
Data Availability Statement
Data sharing does not apply to this article.
Conflicts of Interest
The authors declare that they have no conflicts of interest.
References
- Mabon, L. Treated water releases from the fukushima dai’ichi nuclear power plant: An overview of the decision-making process and governing institutions. Mar. Policy 2024, 163, 106120. [Google Scholar] [CrossRef] [Scilit]
- Ferreira, M.F.; Turner, A.; Jha, A.N. Controlled release of radioactive water from the fukushima daiichi nuclear power plant: Should we be concerned? Environ. Sci. Technol. 2024, 58, 4840–4843. [Google Scholar] [CrossRef] [Scilit] [PubMed]
- Igarashi, J.; Ninomiya, K.; Zheng, J.; Zhang, Z.; Fukuda, M.; Aono, T.; Minowa, H.; Yoshikawa, H.; Sueki, K.; Satou, Y.; et al. Fukushima daiichi nuclear power plant accident: Understanding formation mechanism of radioactive particles through sr and pu quantities. Environ. Sci. Technol. 2024, 58, 14823–14830. [Google Scholar] [CrossRef] [Scilit] [PubMed]
- Sato, H.; Onda, Y.; Tsumune, D.; Kohata, K.; Okamura, T. Leaked tritium reveals the source of 137cs from the fukushima daiichi nuclear power plant to the ocean. Water Res. 2025, 288, 124464. [Google Scholar] [CrossRef] [Scilit]
- Ji, Y.; Wang, X.; Zou, Y.; Li, D.; Zhang, Y.; Ning, J. A simulation system of radiation field and its detection for nuclear and radiological emergency preparedness and response training. J. Radiol. Prot. 2022, 42, 021526. [Google Scholar] [CrossRef] [Scilit]
- Zhao, X.; Li, X. Comparison of standard training to virtual reality training in nuclear radiation emergency medical rescue education. Disaster Med. Public Health Prep. 2022, 17, e197. [Google Scholar] [CrossRef] [Scilit]
- Canales-Verdial, J.I.; Wagner, J.R.; Schmucker, L.A.; Wetzel, M.; Proctor, P.; Carson, M.; Meng, J.; Withers, N.J.; Harris, C.T.; Nogan, J.J.; et al. Energy-efficient neuromorphic architectures for nuclear radiation detection applications. Sensors 2024, 24, 2144. [Google Scholar] [CrossRef] [Scilit]
- Tlaczala, W.; Grajner, G.; Zaremba, M. Virtual Laboratory with simulated nuclear physics experiments. IEEE Trans. Instrum. Meas. 2008, 57, 1766–1770. [Google Scholar] [CrossRef] [Scilit]
- Tiftikci, A.; Kocar, C. Virtual radiation detection and measurement laboratory. Comput. Appl. Eng. Educ. 2013, 21, 550–560. [Google Scholar] [CrossRef] [Scilit]
- James, M.G.; Nicholson, A.D.; Douglas, E. Data for training and testing radiation detection algorithms in an urban environment. Sci. Data 2020, 7, 328. [Google Scholar] [CrossRef] [Scilit]
- Ratticò, D.; Carlo, D.D.; Silipo, G.; Laganà, F. Hybrid fem-ai approach for thermographic monitoring of biomedical electronic devices. Computers 2025, 14, 344. [Google Scholar] [CrossRef] [Scilit]
- Zhang, B. Simulation software for emergency response to nuclear radioactive accident. Nucl. Electron. Detect. Technol. 2014, 34, 557–561. [Google Scholar]
- Guo, D.; Yang, X.; Yu, M. Discussion on the application of virtual reality-augmented reality technology in the simulation training of emergency medical rescue in nuclear and radiation emergencies. Chin. J. Disaster Med. 2018, 6, 101–104. [Google Scholar]
- Jiang, J.; Yu, P.; Feng, D. Simulation radiation field training system. In Proceedings of the 8th National Academic Annual Conference on Nuclear Electronics and Nuclear Detection Technology, Zhuhai, China, 2–7 December 1996; China Nuclear Society: Mianyang, China; Chinese Institute of Electronics: Mianyang, China, 1996. [Google Scholar]
- Lin, Y.; Guo, C.; Jiang, M. Numerical simulation analysis of passive detection of nuclear warhead radiation field. In Proceedings of the 14th National Academic Annual Conference on Nuclear Electronics and Nuclear Detection Technology, Urumqi, China, 15–20 June 2008; China Nuclear Society: Mianyang, China; Chinese Institute of Electronics: Mianyang, China, 2008. [Google Scholar]
- Zhang, K.; Ming, C.; Gong, J.; Xia, W.M.; Zhang, W.Y.; Fu, J.Z. Development of training simulator for radiation monitoring system. Radiat. Prot. Bull. 2009, 29, 37–40. [Google Scholar]
- Ghaemifar, M.; Motie, S.; Moosaviun, S.M.; Nemati, Y.; Ebadollahi, S. Bluetooth low energy for indoor positioning: Challenges, algorithms and datasets. Autom. Constr. 2025, 177, 106316. [Google Scholar] [CrossRef] [Scilit]
- He, H.; Wang, J.; Zhao, Z.; Huang, D.; Lau, A.P.T.; Lu, C.; Tang, M. Ultrawideband dynamic microwave frequency–amplitude measurement. Sci. Adv. 2025, 11, eadu5130. [Google Scholar] [CrossRef] [Scilit]
- He, J.; Xiang, W.; Zhang, Q.; Wang, B. Radarpdr: Radar-assisted indoor pedestrian dead reckoning. Sensors 2023, 23, 2782. [Google Scholar]
- Yan, J.; Lee, J.; Zlatanova, S.; Diakité, A.A.; Kim, H. Navigation network derivation for qr code-based indoor pedestrian path planning. Trans. GIS 2022, 3, 1240–1255. [Google Scholar] [CrossRef] [Scilit]
- Liu, J. Rfid (radio frequency identification) localization and application. Appl. Sci. 2024, 14, 5932. [Google Scholar] [CrossRef] [Scilit]
- Zhang, H.; Li, Y.; Li, Z. 6-d spatial localization of wireless magnetically actuated capsule endoscopes based on the fusion of hall sensor array and imu. IEEE Sens. J. 2022, 22, 13424–13433. [Google Scholar]
- Vedaei, S.S.; Wahid, K.A. A localization method for wireless capsule endoscopy using side wall cameras and imu sensor. Sci. Rep. 2021, 11, 11204. [Google Scholar] [CrossRef] [Scilit]
- Wu, F.; De Bruycker, J.; Delabie, D.; Stevens, N.; Rottenberg, F.; De Strycker, L. Owp-imu: An rss-based optical wireless and imu indoor positioning dataset. IEEE Robot. Autom. Lett. 2025, 10, 12103–12108. [Google Scholar]
- Wu, Y.C.; Song, J.; Hu, L.Q. Super Monte Carlo Nuclear Calculation Simulation Software System supermc. Nucl. Sci. Eng. 2016, 36, 62–71. [Google Scholar]
- Sun, L.L.; Song, Z.H. Research on Optimization of Ship Reactor Radiation Shielding Structure Based on Super MC. Nucl. Power Eng. 2020, 41, 174–177. [Google Scholar]
- Chen, W. Research and Application of Attitude Estimation Algorithm Based on Quaternion and Kalman Filter. Master’s Thesis, Yanshan University, Yanshan, China, 2015. [Google Scholar]
- Ju, D. Research and Implementation of a Moving Object Trajectory Detection System Based on Acceleration Sensor. Master’s Thesis, Nanjing University of Posts and Telecommunications, Nanjing, China, 2014. [Google Scholar]
- Qin, Y. Inertial Navigation, 2nd ed.; Science Press: Beijing, China, 2014; pp. 243–348. [Google Scholar]
- Gao, Z. Inertial Navigation System Technology; Tsinghua University Press: Beijing, China, 2012; Volume 1–35, pp. 224–253. [Google Scholar]
- Liu, M.; Chen, L.; Wang, Z.; Zhang, Y. Design and implementation of a portable IRIG-B(DC) signal monitoring system based on Arduino. Comput. Meas. Control 2016, 24, 37–39. [Google Scholar]
- Zhao, G.; Wang, W.; Cai, X.M. A preliminary study on the application mode of open source hardware in the teaching of automation major. Res. Explor. Lab. 2013, 32, 355–357. [Google Scholar]
- Invensense. MPU-6000 and MPU-6050 Product Specification Revision 3.3; Invensense: Sunnyvale, CA, USA, 2012. [Google Scholar]
- Chen, X. Research on Motion Trajectory Reconstruction Technology Based on MEMS Inertial Sensor; University of Electronic Science and Technology of China: Chengdu, China, 2013. [Google Scholar]
- Du, S.; Chen, J. Research on Data Acquisition and Quality Screening of Multiple Inertial Sensors. J. Qingdao Univ. (Nat. Sci. Ed.) 2017, 30, 25–30. [Google Scholar]
- Chinese Center for Disease Control and Prevention; Institute of Radiation Protection and Nuclear Safety Medicine. Occupational External Exposure Personal Monitoring Specifications. Ministry of Health National Occupational Health Standard; Chinese Center for Disease Control and Prevention: Beijing, China; Institute of Radiation Protection and Nuclear Safety Medicine: Beijing, China, 2002; p. 20. [Google Scholar]
- Wang, T.; Li, Y.; Liu, J.; Hu, K.; Shen, Y. Multipath-assisted single-anchor localization via deep variational learning. IEEE Trans. Wirel. Commun. 2024, 23, 9113–9128. [Google Scholar] [CrossRef] [Scilit]
- Lan, K.-C.; Shih, W.-Y. On calibrating the sensor errors of a pdr-based indoor localization system. Sensors 2013, 13, 4781–4810. [Google Scholar] [CrossRef] [Scilit]
- Pratticò, D.; Laganà, F. Infrared thermographic signal analysis of bioactive edible oils using cnns for quality assessment. Signals 2025, 6, 38. [Google Scholar] [CrossRef] [Scilit]

Disclaimer/Publisher’s Note: The statements, opinions and data contained in all publications are solely those of the individual author(s) and contributor(s) and not of MDPI and/or the editor(s). MDPI and/or the editor(s) disclaim responsibility for any injury to people or property resulting from any ideas, methods, instructions or products referred to in the content. |
© 2026 by the authors. Licensee MDPI, Basel, Switzerland. This article is an open access article distributed under the terms and conditions of the Creative Commons Attribution (CC BY) license.