


Abstract
Low-frequency vibrotactile stimulation has been used to augment musical experience, but its implementation in school settings remains underexplored, and it is not known whether repeated auditory–tactile experience changes subsequent auditory-only sensorimotor synchronization. In this class-allocated study, 60 children (Grades 3 and 4) received auditory-only or auditory–tactile music training (16 sessions over one school year); vibrotactile stimulation was delivered through ten electrodynamic transducers beneath particle-board platforms. Synchronization was assessed without tactile stimulation at three time points, using drumstick tapping to metronome sequences and musical excerpts. Synchronization consistency, the probability of significant phase concentration, and phase alignment were analysed using circular statistics and mixed-effects models. Metronome consistency improved across assessments in both groups, without a clear difference between classes. For the simple musical excerpt, children from the control-group of the third grade showed lower consistency at the final assessment, owing to a decline within that class. This was not observed for the metronome conditions or the complex excerpt. Because condition was confounded with class (four classes in total) and the analyses were exploratory, condition-related contrasts are descriptive. The study did not demonstrate a reproducible advantage of auditory–tactile training. The data neither establish nor exclude such an effect.
1. Introduction
Music is inherently a multimodal experience in which auditory information interacts with bodily movement and somatosensory feedback. Although musical sounds are primarily perceived through audition, low-frequency components of music can also be experienced through bodily vibration, providing an additional sensory route for accessing temporal and spectral information. Auditory–tactile interactions have been investigated in relation to multisensory perception, auditory and vibrotactile processing, music and sound appreciation, and sensory substitution applications [1,2,3,4,5,6,7]. Auditory and vibrotactile information can interact during the perceptual processing of temporal events, indicating that rhythmic information may be represented across different sensory modalities [1,8,9,10]. Vibrotactile stimulation has also been explored as a means of augmenting auditory experiences [11,12]. Concurrent auditory–tactile effects are therefore well documented, whereas the effect of repeated auditory–tactile experience on subsequent auditory-only motor synchronization remains underexplored.
Sensitivity to the musical beat is a fundamental aspect of musical perception and has been considered a widespread characteristic of human musical behaviour [13,14]. Beat perception depends on the processing of temporal and metric structure [15]. This temporal organization is closely related to sensorimotor synchronization (SMS), in which motor actions are coordinated in time with an external rhythmic stimulus. SMS is commonly investigated using repetitive tapping tasks, in which the timing of each motor response can be compared with the temporal structure of the sensory stimulus [16,17]. Tapping provides a direct behavioural measure of temporal coordination and allows individual differences in synchronization accuracy and consistency to be examined. The ability to synchronize movement with external rhythms develops throughout childhood and reflects the interaction of motor control, temporal prediction, and cognitive processes involved in coordinating actions with external events [18,19,20].
In school-aged children, synchronization performance also varies according to the characteristics of the rhythmic stimulus, with music and metronome sequences producing different patterns of accuracy and variability [20]. Recent developmental research has further shown that beat-tapping consistency is related to children’s processing of rhythmic patterns, supporting the relevance of sensorimotor synchronization to broader aspects of musical timing [21]. Because responses to periodic stimuli are inherently cyclic, phase-based measures can additionally be used to characterize both the temporal alignment and the concentration of motor responses relative to the pacing signal. Auditory and tactile stimulation can both provide temporal cues for sensorimotor synchronization, although the contribution of each modality may depend on the structure of the rhythmic information. Research comparing auditory and tactile metronomes has shown that tactile synchronization can approach auditory synchronization under some conditions, particularly for simple isochronous rhythms, whereas auditory information may provide an advantage when rhythmic sequences become more complex [22]. Similarly, vibrotactile stimulation has been shown to support beat perception and synchronization, although performance can vary according to rhythmic complexity and presentation modality [23]. Together, these findings suggest that vibrotactile information may constitute a relevant component of musical timing while its contribution depends on the temporal and perceptual conditions under which it is experienced [24]. Most of this evidence, however, concerns synchronization during the simultaneous presentation of auditory and tactile stimuli.
Despite the growing interest in multisensory approaches to music perception and learning, auditory–tactile experimental paradigms suitable for implementation with school-aged children in naturalistic educational environments remain insufficiently explored. Implementing whole-body vibrotactile stimulation in such environments introduces practical requirements concerning the delivery and temporal coordination of stimulation, bodily coupling, safety, accessibility, robustness, and compatibility with the educational setting. A particular methodological challenge is therefore presented by the need to integrate whole-body vibrotactile stimulation, classroom-compatible implementation, and quantitative assessment of motor timing within a single experimental scheme. From a sensing and measurement perspective, this requires the stimulation and response-acquisition components to be functionally distinguished while remaining integrated within the same experimental framework. In the present approach, the vibrotactile system provided the stimulation interface during a music training intervention, whereas sensorimotor skills were examined independently through drum tapping and expressed relative to an external temporal reference. This separation enables the effects associated with the multimodal training experience to be examined without concurrent tactile stimulation during response measurement.
Existing research has demonstrated that tactile information can interact with auditory temporal processing and can support the perception or synchronization of rhythmic events. This is particularly relevant during childhood, when sensorimotor synchronization continues to develop and individual differences in timing accuracy and consistency remain evident.
The present study therefore addresses a transfer question; namely, whether multimodal music training is associated with subsequent sensorimotor performance when tactile stimulation is not present during the assessment itself. Previous studies have often examined auditory–tactile interactions during the presentation of multisensory stimuli or have focused on perceptual integration, tactile enhancement, or synchronization during the simultaneous presentation of auditory and tactile stimuli [8,22,23]. Less is known about whether repeated experience with coupled auditory and tactile musical information may be associated with changes in children’s subsequent ability to synchronize motor responses with external auditory musical structures and metronomic sequences. The present study documents a classroom-feasible implementation that combines whole-body auditory–tactile stimulation during training with an instrumented tapping procedure for characterizing subsequent auditory–motor synchronization. Neither the stimulation system nor the response-acquisition chain was independently validated, so the setup is not presented as a calibrated measurement instrument.
The present study forms part of a broader research project conducted in an elementary music education context. In previous work, children’s beat sensitivity in simple and complex metric structures was examined following the same multimodal music training approach, and improvements in beat sensitivity following the multimodal training were reported [25]. The present study addresses a related but distinct outcome of the same research study by focusing on children’s sensorimotor synchronization and tapping behaviour.
The main aim of the present study was to examine sensorimotor synchronization within a whole-body auditory–tactile music training paradigm implemented in a naturalistic school setting. Allocation was made at the class level, so the design is quasi-experimental. Given the limited longitudinal evidence concerning transfer from repeated auditory–tactile musical experience to subsequent auditory–motor synchronization, all analyses were treated as exploratory, and no analysis plan was specified in advance. Specifically, we examined (i) whether synchronization consistency and the probability of significant phase concentration changed across assessments, (ii) whether these longitudinal trajectories differed between the auditory-only and auditory–tactile training conditions, and (iii) whether the distribution of phase alignment differed between training conditions. These outcomes were examined during tapping to isochronous auditory sequences presented at different tempi and during tapping to musical excerpts with different metric structures. If repeated experience with temporally coupled auditory and tactile information strengthens the representation of the beat, this could appear as more concentrated tapping—that is, as higher synchronization consistency and a higher probability of significant phase concentration—rather than as a systematic shift in phase alignment. These expectations are tentative.
2. Materials and Methods
The experimental framework comprised two complementary components: (1) an auditory–tactile stimulation paradigm implemented during classroom-based music training and (2) a subsequent sensorimotor synchronization response-measurement paradigm conducted without concurrent vibrotactile stimulation. The first component involved the delivery of whole-body vibrotactile stimulation through a platform-based system, whereas the second involved instrumented tapping and phase-based analysis of motor responses to auditory pacing signals.
2.1. Study Design, Participants, and Ethical Considerations
The design is a class-allocated, exploratory intervention study with a longitudinal component. Participants were not individually randomized, since pre-existing class sections were retained as intact groups. Within each grade, one of the two existing class sections was assigned to the auditory-only control condition and the other to the auditory–tactile condition by random draw. With only four classes in total, however, between-class differences cannot be separated from any effect of the training condition (see Section 3.5). Initially, 65 children were recruited from a public elementary school in Athens, Greece. Children were aged between 8 and 10 years and attended the third and fourth grades. Five children had to be excluded from the analysis due to developmental or neurological conditions diagnosed by the Greek Centres for Diagnosis, Assessment and Support (KEDASY) and coded according to the ICD-10, that could affect task performance, resulting in a final sample of 60 children which comprised 29 girls and 31 boys ( years, ). Eight children reported receiving additional music instruction outside school, including piano, guitar, violin, and choir lessons. The groups did not differ significantly in age within either grade (Grade 3: 0.03 years, ; Grade 4: −0.08 years, ), in the number of children with extra-school music instruction (Fisher and ) or in the months of instruction (Mann–Whitney and ). In the metronome tasks, synchronization consistency did not differ significantly between conditions at the first assessment (all ). For the OWA excerpt in Grade 3, the groups did not differ significantly at the first assessment (), though the auditory-only group started higher (Hedges , 95% CI [−1.38, 0.20]).
Children followed a structured music training intervention of 16 weekly sessions over one school year in which auditory–tactile stimulation was incorporated into the music activities for the experimental group, while the control group received the same music activities without the additional tactile stimulation. The age range of 8–10 years was selected deliberately, based on the assumption that children within this range represent a comparable developmental stage with respect to rhythm perception [26,27]. The experimental group included 29 children (15 children from Grade 3 and 14 from Grade 4), whereas 31 children formed the control group (14 children from the Grade 3 and 17 children from Grade 4).
The present study focuses specifically on the subsequent assessment of sensorimotor synchronization and tapping behaviour, exploring whether the involvement in the auditory–tactile music training was associated with differences in auditory sensorimotor synchronization. Sensorimotor synchronization assessments were conducted at three time points, subsequently referred to as PRE, MID, and POST. The first/PRE assessment was conducted at the beginning of the school year, before the intervention. After 8 training sessions, children completed the second/MID assessment. Sensorimotor synchronization was also assessed after the end of the training, while the children had already completed 8 more sessions of the second training period. Written informed consent was obtained from the parents and/or legal guardians of the children. All children participated voluntarily and were given the opportunity to leave the study at any stage. The ethical approvals are listed in the Institutional Review Board Statement.
2.2. Auditory–Tactile Stimulation Paradigm
2.2.1. Whole-Body Auditory–Tactile Stimulation System
The implementation of the auditory–tactile training required an experimental system capable of delivering vibrotactile stimulation within the educational environment. Although vibrotactile interfaces have been developed for music perception, rhythm learning, and auditory augmentation, many existing systems are designed for localized stimulation or specialized laboratory settings [11,28,29,30]. A whole-body configuration suitable for use by children in a school classroom presents different practical requirements [7]. The system should be able to provide sufficiently controlled and temporally precise tactile stimulation while remaining accessible, robust, portable, and compatible with the physical organization of the classroom. Previous experimental implementations have used single vibrating platforms equipped with tactile transducers to convey musical vibrations and investigate beat-related motor synchronization [28,31].
The system developed for the present study was designed to meet these requirements by integrating multiple electrodynamic tactile transducers into custom-made platforms on which children could sit or stand during the musical activities. This configuration provided a practical framework for implementing multimodal music training in a naturalistic educational setting. The experimental system was designed and configured according to the research objectives and the needs of the participating children. Particular emphasis was placed on safety, ease of use, accessibility, and the possibility of conveying sound and musical information through vibration.
Vibrotactile stimulation was delivered using ten Bass-Pump III (Sinuslive, Kaltenkirchen, Germany) tactile transducers (130 mm × 41 mm), each mounted below the center of a custom-made platform measuring 60 cm × 80 cm. The platforms served as the physical interface between the transducers and the children. The platforms were constructed from particle board (Figure 1).
Figure 1.
Snapshots from the training sessions and the classroom setting.
The Bass-Pump III transducers have a maximum power rating of 50 W and an impedance of 4 and operate according to an electrodynamic (voice-coil) principle. The interaction between the magnetic field and the electrical current flowing through the coil generates an oscillatory inertial force that excites the supporting surface. In the present configuration, the resulting mechanical vibrations were transferred from the transducers to the platforms and subsequently to the participants through bodily contact. They exhibit a resonance frequency of approximately 50 Hz and provide their optimum vibrotactile output within the 20–80 Hz frequency range, allowing low-frequency components of the musical stimuli to be conveyed through whole-body vibration. Their compact dimensions, portability, and commercial availability made them suitable for the construction of a feasible and relatively low-cost auditory–tactile stimulation system for classroom-based experiments. The electrical wiring configuration of the ten transducers is presented in Figure 2.
Figure 2.
Wiring diagram showing the electrical connections between the 10 bass shakers.
The complete system included a MacBook Pro computer (Apple, Cupertino, CA, USA), a Behringer KM750 (Behringer, Willich, Germany) power amplifier and an M-Audio Keystation 49 (M-Audio, Cumberland, RI, USA) MIDI keyboard, ten Bass-Pump III tactile transducers, two M-Audio Studiophile AV 40 studio monitors (M-Audio, Cumberland, RI, USA), and ten platforms constructed from particle board. Auditory stimuli were presented through the studio monitors. The tactile channel was routed through the amplifier to the ten transducers. For recorded music, the tactile signal was derived from the original audio material. Recordings were low-pass filtered at 100 Hz, shifted two octaves downward, and low-pass filtered again at 100 Hz (Figure 3).
Figure 3.
Each audio recording was first low-pass filtered with a cut-off frequency of 100 Hz. Subsequently the audio file was octave-shifted two octaves lower and the low-pass filtering procedure was repeated.
The original audio and the processed tactile channel were imported into REAPER (v6.0; Cockos Inc., Rosendale, NY, USA). The level of the tactile channel was adjusted manually. Rhythmic patterns were processed in the same way. For metronomic material, separate signals were generated in Pure Data (v0.49-0; Miller Puckette, University of California, San Diego, La Jolla, CA, USA), using a 220-Hz auditory carrier and a 60-Hz tactile carrier. The same tactile signal was distributed to the ten transducers through a common series–parallel circuit connected to the amplifier. No separate platform-specific level adjustment was used. Platform resonance was evaluated perceptually in a preliminary study with ten professional musicians. Participants received tactile-only stimulation and were asked to indicate the resonance frequency of each platform. The resulting values ranged from 48 to 55 Hz ( Hz, ). Auditory–tactile timing was also evaluated perceptually. Participants manually adjusted the delay in a Pure Data patch until the auditory and tactile signals were perceived as synchronous, in both seated and standing conditions. The mean selected auditory delay was 32 ms and was used as the system setting. This value reflects a perceptual alignment procedure and should not be interpreted as a measurement of physical system latency. This original school-based setup did not include instrumentation for measuring platform acceleration, vibration amplitude, or physical system latency. System settings were therefore established using the preliminary perceptual procedure described above. Since the system was designed for naturalistic classroom feasibility, no objective measurements of vibration amplitude, frequency response, or transfer characteristics were documented. The system is therefore reported as a classroom-feasible implementation. Its mechanical output, frequency response, transfer characteristics, and physical auditory–tactile latency were not characterized, and the perceptually set delay does not establish that the stimuli were physically synchronous. These limitations restrict reproducibility across sites.
2.2.2. Auditory–Tactile Music Training
The experimental system was used during a structured music training program conducted in the school music classroom. The intervention consisted of 16 weekly sessions scheduled across one school year. Each training session had a total duration of 45 min. Each 45-min session consisted of a warm-up (approx. 10 min), presentation of material (15 min), music play (15 min), and evaluation (5 min). The complete session-by-session structure and curriculum are provided in Appendix A. The training formed part of the regular music curriculum. The first author, who was also the participating children’s music teacher, designed and delivered the music training sessions. Children in the experimental group received the musical material in an auditory–tactile condition, whereas children in the control group received the same activities and musical material through auditory stimulation only. The training included activities related to beat, meter, rhythm, melody, dynamics, timbre, movement, singing, improvisation, and music games. Children used the vibrating platforms in both seated and standing positions, depending on the activity. Tactile stimulation was delivered during the musical activities involving the auditory–tactile system and was not presented during the sensorimotor synchronization assessments. The level of the tactile feedback was adjusted manually by the teacher depending on the children’s reactions. It was not recorded or standardized, and the same signal was sent to all ten platforms through a common circuit. No participant-specific adjustment of vibrotactile level was documented.
3. Sensorimotor Synchronization Response-Measurement Paradigm
Sensorimotor synchronization was assessed using two tapping tasks: synchronization with isochronous metronomic sequences and synchronization with musical excerpts. Tactile stimulation was not provided during any of the tapping assessments. Tapping assessments were administered individually in a quiet environment in the school. Children performed the tasks using an Alesis PercPad Compact (Alesis, Cumberland, RI, USA) electronic percussion instrument while holding a drumstick. Before the assessment, children were familiarized with the instrument and the available drum sounds. Each child selected one drum sound to be used throughout the assessment and was instructed to use a single pad of the percussion instrument. Children were motivated to concentrate on the auditory stimulus and avoid unnecessary body movements. All test stimuli were presented twice in randomized order. Children listened to the preferred drum sound using the Shure SRH840 (Shure, Niles, IL, USA) Professional Monitoring Headphones while tapping during all tasks. Response times were extracted from the MIDI note-on event generated at the strike, which does not depend on the selected drum sample. The strike-to-MIDI latency of the pad and acquisition chain was not independently validated.
3.1. Metronome Synchronization
Metronome synchronization introduces a regular and predictable temporal reference, allowing the capacity to align motor responses with an external pulse to be examined under controlled conditions. In the metronome synchronization task, children were instructed to tap in synchrony with three isochronous auditory sequences: 80 BPM, 100 BPM, and 120 BPM, corresponding to inter-onset intervals of 750, 600, and 500 ms, respectively. The metronomic stimuli were generated using the digital audio workstation REAPER v6.0. Each click consisted of an unaccented sinusoidal tone with a duration of 20 ms and frequency 220 Hz. Stimulus loudness was adjusted to a comfortable level for each participant. Each metronomic sequence was presented twice, lasted 20 s and the order of the tempi was randomized across participants. The two presentations of each metronome tempo were not treated as independent observations. For each child participant, tempo, and assessment, the circular information from the two repetitions was combined to obtain a single pooled participant-level observation. Pooling followed the same procedure as for the musical excerpts (concatenation of the phase angles of the two repetitions), and the same minimum of 15 valid taps per repetition was applied. Synchronization consistency (R) was retained for all usable pooled observations, whereas the circular mean phase angle () was included in the synchronization accuracy analysis only when the pooled phase distribution showed significant concentration according to the Rayleigh test ().
3.2. Synchronization with Musical Excerpts
During the synchronization task with musical excerpts, children were instructed to tap along with the quarter-note beat of the presented musical excerpt. The musical material was based partly on the stimulus set developed by Einarson and Trainor [14] for the complex Beat Alignment Test (cBAT). Hula in Seven (complex metric structure in 7/4, average BPM 159.5) was used as a complex-meter practice excerpt, and One Way or Another and Solsbury Hill were selected as experimental excerpts. The second practice excerpt, Kemal, was prepared for the present study following the stimulus construction procedure described by Einarson and Trainor [14] in a simple metric structure 4/4 and average BPM of 115.15. During the tapping tasks all children were asked to drum along to a short excerpt of the pop-rock song One Way or Another (simple metric structure 4/4, average BPM 164.6, duration 11 s) and to a short excerpt from Solsbury Hill (complex metric structure 7/4, average BPM 120, duration 18 s) [14]. The practice excerpts were used to familiarize the children with the task and were accompanied by instructions and feedback. All excerpts were presented twice in randomized order. During all synchronization tasks, children were instructed to focus on the auditory stimulus and to minimize additional body movements. The musical excerpts were presented without concurrent vibrotactile stimulation. The input tapping data of each participant were recorded in a separate midi channel parallel to the test channels.
For the phase analysis, a reference beat sequence was established for each musical excerpt according to its underlying beat. The average tempo of each excerpt was first determined using MixMeister BPM Analyzer (v1.0; MixMeister Technology, Fort Lauderdale, FL, USA). An isochronous woodblock sequence corresponding to this tempo was then created in GarageBand (v10.3.1; Apple, Cupertino, CA, USA) and superimposed on the musical excerpt, aligned with the original underlying beat. The onset times of this aligned beat sequence were subsequently used as the reference time series against which the tapping responses were expressed as phase angles [14]. The two presentations of each experimental excerpt were not treated as independent observations. Each repetition was first evaluated separately. A repetition was considered usable when it contained at least 15 valid taps and a stable median inter-tap interval (ITI) could be computed. Because some children produced tapping patterns corresponding more closely to the quarter-note beat whereas others followed an eighth-note subdivision, the metric level of each usable repetition was determined objectively from its median ITI: a repetition was classified as eighth-note tapping when its median ITI was shorter than 1.5 times the eighth-note period of the reference beat (the midpoint between the eighth- and quarter-note periods), and as quarter-note tapping otherwise. Each participant-level observation, for a given excerpt and assessment, was then assigned one of four statuses: (i) both repetitions usable and at the same metric level, in which case the phase angles of the two repetitions were concatenated before computing R, , and the Rayleigh test; (ii) a single usable repetition, which was retained alone; (iii) both repetitions usable but at different metric levels, which were not combined; or (iv) no usable repetition (insufficient data), in which case the outcome was treated as missing. Missing outcomes were not imputed. Insufficiency of data thus reflected the availability of usable tapping data, independently of the Rayleigh test and of the magnitude of R.
3.3. Data Acquisition and Processing
Individual tapping responses were recorded as MIDI events using the digital audio workstation REAPER (v6.0; Cockos Inc., Rosendale, NY, USA). The Alesis PercPad was connected to the recording computer through an M-Audio MIDISPORT Uno 1 USB MIDI interface (M-Audio, Cumberland, RI, USA). MIDI events generated by the percussion pad were acquired in REAPER and recorded on a separate MIDI channel running in parallel with the stimulus channels. The stimulus tracks and the children’s MIDI responses were therefore handled within the same REAPER session and timing environment, maintaining their temporal relationship during stimulus presentation and response recording. The end-to-end timing of the response-acquisition chain was not independently validated against a hardware reference. The audio interface buffer was set to a low value (64–128 samples) to limit latency, but this does not establish strike-to-MIDI accuracy. A constant latency, identical for all children and assessments, would shift the phase angles by a fixed amount without altering the consistency measure R and would not bias between-group comparisons of . However, this constant latency could not be separated from true asynchrony. Furthermore, any unquantified trial-to-trial variability (jitter) in the measurement chain would artificially reduce R regardless of group. Phase angles are therefore interpreted comparatively and not as absolute asynchronies. The timing of each drum response was extracted into CSV files containing the onset time of each recorded response. Separate reference CSV files contained the onset times of the pacing or reference events used for each experimental condition. The reference time series and the recorded tapping sequence of each child participant were retained as independent time series and inspected individually to identify missing responses, additional taps, and other response patterns that could influence the analysis. Each tapping response was evaluated relative to the temporal structure of the corresponding auditory reference. Because children did not always produce a strict one-to-one correspondence between tapping responses and pacing events, the responses were not analysed exclusively as linear asynchronies. Some participants produced more than one tap within a pacing cycle, whereas in other cycles only a few or no tapping response was recorded. In the circular analysis, each valid recorded tap was handled as an individual response and expressed according to its temporal position within the corresponding pacing cycle. Thus, multiple taps within a cycle contributed separate phase observations, whereas cycles without a recorded tap contributed no phase observation. Missing responses were not imputed. For the musical excerpts, tapping responses presenting different metric levels were treated according to the procedure described above. The temporal position of each tapping response within the corresponding pacing cycle was converted into a phase angle. The resulting phase values were subsequently analysed using circular statistical methods, as described in Section 3.4.
3.4. Circular Statistical Analysis
Circular statistical analysis was used to characterize the temporal relation between children’s tapping responses and the auditory pacing signal. Circular measures were calculated using the CircStat toolbox for MATLAB (R2019a; MathWorks, Natick, MA, USA); CircStat toolbox (v1.21.0.0; Philipp Berens, University of Tübingen, Tübingen, Germany) [32]. The onset of the reference beat was defined as . For each tapping response, its onset time was expressed as a position within one pacing cycle. One complete pacing cycle corresponded to . For the metronome conditions, the pacing period T was defined by the nominal tempo ( s). For the musical excerpts, the period was defined by the reference beat level used for that repetition. When tapping followed the eighth-note subdivision, the corresponding subdivision period was used. Phase values were represented within a signed range from to . Values crossing this boundary were wrapped by one complete cycle, so that phase positions near the end of one cycle and the beginning of the next remained adjacent in circular space. Following the phase convention used in the original analysis, negative phase angles indicated taps occurring after the pacing event, whereas positive angles indicated taps occurring before it. Circular calculations were performed in radians in CircStat and converted to degrees for reporting.
Two complementary measures were calculated. Synchronization consistency was quantified by the mean resultant vector length (R), which ranges from 0 to 1. Values closer to 1 indicate greater concentration of tapping responses around a preferred phase, whereas values closer to 0 indicate greater dispersion (Figure 4). Synchronization accuracy was quantified by the circular mean phase angle (), with values approaching indicating closer temporal alignment with the pacing signal (Figure 5). Mean resultant length and circular mean direction were obtained using circ_r and circ_mean, respectively [32]. The Rayleigh test of circular uniformity (circ_rtest) was used to assess whether each participant-level phase distribution showed significant concentration around a preferred direction () [32,33]. Synchronization consistency (R) was retained for all usable observations, irrespective of the Rayleigh test result. In contrast, was interpreted and included in the phase-accuracy analyses only when the Rayleigh test indicated significant phase concentration. Consequently, group comparisons for are conditional on concentrated tapping and do not reflect the entire sample. This restriction was applied because a mean direction has limited interpretive value when the phase distribution is approximately uniform. The Rayleigh test depends on both the concentration of phases and the number of observations, so a child who produced more taps had a statistical advantage in reaching significance, and significant phase concentration is therefore not a pure behavioural measure. Likewise, under a uniform distribution the expected value of R is approximately [33], about 0.23 at the minimum of 15 taps, so R is upwardly biased for small numbers of taps. The minimum of 15 valid taps limits but does not remove these effects, and the number of valid taps per observation was not summarized across cells. The circular measures and Rayleigh tests were obtained in MATLAB using CircStat [32]. Participant-level outcomes were subsequently imported into JASP (v0.16.0; University of Amsterdam, Amsterdam, The Netherlands), which implements linear mixed-effects modeling via the R packages lme4 (v1.1-27.1) and lmerTest (v3.1-3) for the inferential analyses described below [34].
Figure 4.
Examples of high and low synchronization consistency (R) at 100 BPM during the final assessment. Dots represent individual tapping-response phases and arrows represent the mean resultant vectors for participants D4 and C23.
Figure 5.
Examples of different synchronization accuracy () with similar consistency at 80 BPM during the second assessment.
3.5. Inferential Statistical Analysis
3.5.1. Metronome Synchronization Analysis
Synchronization consistency (R) was analysed separately for the 80, 100, and 120 BPM conditions using linear mixed-effects models [35]. Assessment (PRE, MID, POST), Training Condition (auditory-only control, auditory–tactile experimental), Grade (3, 4), and their interactions were included as fixed effects, with Participant included as a random intercept. Because the intervention was allocated to four intact classes, with one class per condition in each grade, between-class differences cannot be separated from the effect of the training condition. The participant-level random intercept accounts for repeated measures within children but not for variation at the class level, and with only two independent clusters per grade the data provide extremely limited independent replication at the level of allocation. Condition-related estimates, p values, and confidence intervals are therefore reported as descriptive, exploratory contrasts between these specific classes. They are not valid tests of the effect of the training condition, and no adjustment can supply the missing replication. No analysis plan was pre-specified. The total number of tests included 5 linear mixed models, 5 generalized linear mixed models, 12 Watson–Wheeler comparisons, and follow-up contrasts. Assessment was treated as a three-level categorical repeated factor. Fixed effects were evaluated using Type III tests with Satterthwaite degrees of freedom [36]. Significant Assessment effects were followed by Holm-adjusted pairwise comparisons of estimated marginal means [37]. Significant interactions were examined using Holm-adjusted simple contrasts at the relevant levels. Model assumptions were evaluated by visual inspection of residual Q–Q plots and residual-versus-fitted plots. No major deviations from normality or homoscedasticity were observed for the fitted models. The presence of significant phase concentration was represented as a binary outcome based on the Rayleigh test (; ). The probability of significant phase concentration was analysed separately for each tempo using binomial generalized linear mixed-effects models with a logit link [35]. Assessment, Training Condition, their interaction, and Grade were included as fixed effects, with Participant included as a random intercept. Fixed effects were evaluated using likelihood-ratio tests. Estimated marginal probabilities were reported on the response scale. Significant Assessment effects were followed by Holm-adjusted pairwise contrasts, and significant Assessment × Training Condition interactions were examined using Holm-adjusted simple contrasts [37]. Synchronization accuracy () was examined only for observations showing significant phase concentration according to the Rayleigh test. Circular distributions of participant-level values were compared between Training Conditions separately at each assessment and metronome tempo using Watson–Wheeler tests [33,38]. Holm correction was applied across the three assessment-specific comparisons within each tempo [37]. Circular mean directions and group resultant lengths were also calculated descriptively for each Assessment × Training Condition combination. The group resultant length describes the concentration of participant-level mean phase directions and is distinct from the individual synchronization consistency measure R.
3.5.2. Musical Excerpt Synchronization Analysis
The two experimental excerpts were analysed separately: One Way or Another (OWA), representing the simple 4/4 metric structure, and Solsbury Hill (SBH), representing the complex 7/4 structure. Meter type was therefore not entered as an additional factor in a common model. Synchronization consistency (R) was analysed separately for OWA and SBH using linear mixed-effects models [35]. Assessment (PRE, MID, POST), Training Condition, Grade, and their interactions were included as fixed effects, with Participant included as a random intercept. Fixed effects were evaluated using Type III tests with Satterthwaite degrees of freedom [36]. Significant Assessment effects were followed by Holm-adjusted pairwise comparisons of estimated marginal means [37]. Significant interactions were decomposed using Holm-adjusted simple contrasts at the relevant levels. Model assumptions were examined from residual Q–Q plots and residual-versus-fitted plots. The probability of significant phase concentration was analysed separately for OWA and SBH using binomial generalized linear mixed-effects models with a logit link [35]. Assessment, Training Condition, their interaction, and Grade were entered as fixed effects, with Participant included as a random intercept. Model terms were evaluated using likelihood-ratio tests. Estimated marginal probabilities were reported on the response scale. Significant Assessment effects were followed by Holm-adjusted pairwise contrasts. Significant Assessment × Training Condition interactions were examined using Holm-adjusted simple contrasts within Training Condition and between Training Conditions at each assessment [37]. For OWA, synchronization accuracy () was analysed only for observations showing significant phase concentration. Participant-level circular distributions were compared between Training Conditions separately at PRE, MID, and POST using Watson–Wheeler tests [33,38]. Holm correction was applied across the three assessment-specific comparisons [37]. Circular mean directions and group resultant lengths were calculated descriptively for each Assessment × Training Condition combination. For SBH, the number of observations showing significant phase concentration within several Assessment × Training Condition cells was too small for a reliable large-sample Watson–Wheeler comparison. Phase-angle outcomes for this excerpt were therefore summarized descriptively using circular mean directions, group resultant lengths, and sample sizes, without between-condition inferential testing [38,39]. All analyses used the available observations for each outcome. Missing circular outcomes were not imputed.
Use of Generative AI
During the preparation of this manuscript and the response to reviewers, the authors used AI tools (GPT-5; OpenAI, San Francisco, CA, USA) by OpenAI and Gemini (Gemini 3 Pro; Google, Mountain View, CA, USA) for language editing, text restructuring, and guidance on specific JASP workflows. Suggestions concerning statistical procedures were independently cross-checked against the relevant methodological literature before implementation. All statistical analyses were conducted and interpreted by the authors, who take full responsibility for the content of this publication.
4. Results
4.1. Usable Observations
Table 1 presents the breakdown of usable participant observations across excerpts, grades, conditions, and assessment periods. Missingness was small for OWA (161 of 180 usable observations) but substantial for SBH (112 of 180 usable observations), and it was unevenly distributed across cells, from 4 of 14 (Grade 4, auditory–tactile, PRE) to 12 of 15 (Grade 3, auditory–tactile, PRE). An observation was unusable when neither repetition had at least 15 valid taps and a computable median ITI, or when the two repetitions were at different metric levels and could not be combined (Section 3.2). This classification was independent of the Rayleigh test and of the value of R. The number of unusable observations was not broken down further by reason. Because unusable observations may reflect difficulty with the task, the SBH analyses describe the subset of children for whom usable data were available and probably overestimate the synchronization ability of the whole cohort.
Table 1.
Usable observations by Excerpt × Grade × Condition × Assessment. Cells show usable observations/total children (Rayleigh-significant observations in parentheses).
4.2. Metronome Tapping
4.2.1. Metronome: Synchronization Consistency (R)
Synchronization consistency (R) was examined separately for the 80, 100, and 120 BPM metronome tempi using linear mixed-effects models. Assessment (first/PRE, second/MID and final/POST), Training Condition (Auditory-only/Auditory–tactile), Grade (3/4), and their interactions were included as fixed effects, with Participant entered as a random intercept. The main model results are presented in Table 2.
Table 2.
Linear mixed-effects model results for metronome synchronization consistency (R).
Synchronization consistency R differed across assessments at all three tempi (all ). At 80 BPM, estimated marginal mean R increased from 0.35 at the first assessment to 0.49 at the second and 0.50 at the final. Holm-adjusted comparisons confirmed differences between the first and the second, between the first and the final (both ), but not between the second and the final assessments (). At 100 BPM, the corresponding values were 0.33, 0.38, and 0.52. The estimated R at the final assessment differed from that at the first () and second () assessments, whereas the comparison between the first and the second was not significant (). At 120 BPM, R increased from 0.31 to 0.41 and 0.49 across the three assessments, with differences between the first and the second (), first and final (), and second and final ().
Grade was associated with synchronization consistency at each tempo (all ). Children from the fourth grade had higher estimated R values than children from the Grade 3 at 80 BPM (0.55 vs. 0.35), 100 BPM (0.54 vs. 0.29), and 120 BPM (0.53 vs. 0.28). No Assessment × Grade interaction was found, suggesting that the difference between grades reflected overall synchronization consistency rather than a different pattern of change across assessments. R did not differ significantly between the experimental and the control groups at any of the three tempi (Table 2). For the metronome tasks, the partial for Training Condition was 0.054 (95% CI [0, 0.20]), 0.035 (95% CI [0, 0.17]), and 0.001 (95% CI [0, 0.06]) at 80, 100, and 120 BPM, respectively. The interactions between the Assessment × Training Condition were also non-significant at 80 BPM (), 100 BPM (), and 120 BPM (). The partial for the Assessment × Training Condition interaction was 0.039 (95% CI [0, 0.12]), 0.023 (95% CI [0, 0.09]), and 0.006 (95% CI [0, 0.05]) across the three tempi. Furthermore, the between-condition difference in change from PRE to POST (Hedges’ g, with grades pooled) was 0.21 (95% CI [−0.30, 0.72]), −0.25 (95% CI [−0.76, 0.26]), and 0.02 (95% CI [−0.49, 0.54]). Thus, although synchronization consistency increased across the three time points of the assessments, the pattern of change did not differ between the auditory-only and auditory–tactile classes. The confidence intervals are wide, so these results do not establish the absence of a condition-related difference. No other interactions reached significance. Figure 6 illustrates the course of synchronization consistency across assessments for the two conditions at each metronome tempo.
Figure 6.
Synchronization consistency (R) across the three assessments during metronome tapping at 80, 100, and 120 BPM for the auditory-only and auditory–tactile groups. Points represent individual observations, while lines and error bars indicate estimated means and 95% confidence intervals.
4.2.2. Metronome: Phase Concentration
The probability of significant phase concentration was analysed separately for each metronome tempo using binomial generalized linear mixed-effects models with a logit link (Table 3). At 120 BPM, a significant Grade effect was found, , . The estimated probability was higher in Grade 4 (0.87, 95% CI [0.74, 0.94]) than in Grade 3 (0.55, 95% CI [0.40, 0.69]). Assessment, Training Condition, and the Assessment × Training Condition interaction were not significant (). The probability of significant phase concentration differed across assessments, , at 100 BPM. The estimated probabilities were 0.65 at the first, 0.61 at the second, and 0.90 at the final assessment. Holm-adjusted contrasts showed higher probabilities at the final than at the first () and second assessments (), with no difference between the first and the second (). Grade also differed significantly at 100 BPM, , , with higher probability in Grade 4 (0.87, 95% CI [0.75, 0.94]) than in Grade 3 (0.57, 95% CI [0.42, 0.71]). Training Condition and the Assessment × Training Condition interaction showed no significance (both ). At 80 BPM, Grade had a significant effect, , . The estimated probability was higher in Grade 4 (0.82, 95% CI [0.71, 0.90]) than in Grade 3 (0.65, 95% CI [0.52, 0.76]). Assessment, Training Condition, and the Assessment × Training Condition interaction were not significant (all ).
Table 3.
Binomial generalized linear mixed-effects models for significant phase concentration.
4.2.3. Metronome: Synchronization Accuracy ()
Children’s synchronization accuracy, expressed by the mean phase angle , was examined only for observations showing significant phase concentration according to the Rayleigh test. Circular distributions were compared between the two Training Conditions separately at each assessment using Watson–Wheeler tests, with Holm correction across the three assessment-specific comparisons within each tempo. No significant differences between Training Conditions were found at any metronome tempo. The Holm-adjusted p values for the first, second, and final assessments were 0.96, 0.96, and 0.96 at 120 BPM; 0.32, 0.18, and 0.53 at 100 BPM; and 0.72, 1.00, and 1.00 at 80 BPM. Circular mean phase angles and group resultant lengths across assessments and Training Conditions are shown in Figure 7.
Figure 7.
Circular distributions of phase angle () across assessments and metronome tempi. Dots represent participant-level values with significant Rayleigh phase concentration; arrows indicate the group mean resultant vectors for the auditory-only (solid) and auditory–tactile (dashed) conditions.
4.3. Musical Excerpt Tapping
Synchronization during musical excerpt tapping was examined separately for the OWA (4/4) and SBH (7/4) excerpts. Of the 180 possible observations for each excerpt, usable circular outcomes were available for 161 OWA observations and 112 SBH observations.
4.3.1. Musical Excerpts: Synchronization Consistency (R)
For OWA, the linear mixed-effects model showed significant effects of Assessment, , , and Grade (, ). Significant Assessment × Training Condition, , , Assessment × Grade (, ), and Assessment × Training Condition × Grade interactions (, ) were also found. Training Condition and the Training Condition × Grade interaction were not significant ( and , respectively). Since the study sample had 14 to 17 children per cell, power for three-way interactions was very limited and these localized interactions are interpreted cautiously. Because of the significant three-way interaction, follow-up models were fitted separately by Grade (Table 4).
Table 4.
Estimated marginal means (R) and simple contrasts for synchronization consistency in the OWA (4/4) excerpt for Grade 3.
In Grade 3, synchronization consistency differed across assessments, , , and a significant Assessment × Training Condition interaction was found, , . Training Condition itself was not significant (). Estimated marginal mean R values in the auditory-only condition were 0.64, 0.58, and 0.22 at the first, second, and final assessments, respectively. The corresponding values in the auditory–tactile condition were 0.49, 0.56, and 0.52. Holm-adjusted comparisons showed that, within the auditory-only condition, R did not differ between the first and the second assessments (), but was lower at the final assessment than at both the first and second assessments (both ). No longitudinal differences were found in the auditory–tactile condition (all adjusted ). Between the two classes, no difference was observed at the first () or second assessment (). At the final assessment, the auditory–tactile class showed higher consistency than the auditory-only class (exploratory contrast, not adjusted for class: ; Hedges’ , 95% CI [0.51, 2.18]). This contrast reflects a decline in the auditory-only class, while R remained stable in the auditory–tactile class. The auditory-only class also started higher at the first assessment (PRE; , 95% CI [−1.38, 0.20]). This contrast is one of many exploratory tests and describes a difference between two classes, which cannot support a causal interpretation.
In Grade 4, Assessment, Training Condition, and their interaction were not significant (all ), though the difference at the final assessment pointed in the same direction (, 95% CI [−0.07, 1.46]). For SBH, synchronization consistency differed across assessments, , . Holm-adjusted comparisons, however, showed no significant differences between the first and the second assessments (), the first and the final assessments (), or the second and the final assessments (). Training Condition () and Grade () were not significant, and no interaction reached significance. Thus, although the omnibus Assessment effect was significant, no individual pairwise comparison remained significant after Holm correction. Figure 8 illustrates the course of synchronization consistency across assessments for each grade and condition during tapping to the two excerpts.
Figure 8.
Synchronization consistency (R) across the three assessments during tapping to the OWA (4/4) and SBH (7/4) musical excerpts, shown separately for Grade 3 and Grade 4 children in the auditory-only and auditory–tactile conditions. Points represent individual observations, while lines and error bars indicate estimated marginal means and 95% confidence intervals from the corresponding linear mixed-effects models. The upper panel shows OWA (4/4), and the lower panel shows SBH (7/4).
4.3.2. Musical Excerpts: Phase Concentration
The probability of significant phase concentration was analysed separately for each musical excerpt using binomial generalized linear mixed-effects models with a logit link (Table 5).
Table 5.
Binomial generalized linear mixed-effects model results for significant phase concentration during musical excerpt tapping.
For OWA, a significant Assessment × Training Condition interaction was found, , , together with a significant Grade effect, , . Assessment and Training Condition were not significant ( and , respectively). The estimated probability of significant phase concentration was 0.70 (95% CI [0.48, 0.86]) in Grade 3 and 0.91 (95% CI [0.74, 0.97]) in Grade 4.
Follow-up comparisons of the Assessment × Training Condition interaction showed that, within the auditory-only condition, the probability of significant phase concentration was lower at the final assessment than at both the first and the second assessments (both Holm-adjusted ). No significant longitudinal change was found in the auditory–tactile condition. The two Training Conditions did not differ at the first or second assessments, whereas at the final assessment the auditory–tactile class showed a descriptively higher predicted probability of significant phase concentration than the auditory-only class (exploratory contrast, not adjusted for class: ).
For SBH, the probability of significant phase concentration differed across assessments, , . Holm-adjusted comparisons showed a significant difference between the second and the final assessments (), whereas the first–second () and first–final () comparisons were not significant. Grade also had a significant effect, , , with an estimated probability of significant phase concentration of 0.22 (95% CI [0.09, 0.43]) in Grade 3 and 0.06 (95% CI [0.01, 0.30]) in Grade 4. Neither Training Condition () nor the Assessment × Training Condition interaction () was significant.
4.3.3. Musical Excerpts: Synchronization Accuracy ()
Children’s synchronization accuracy, expressed by the mean phase angle , was examined only for observations showing significant phase concentration according to the Rayleigh test. For OWA, circular phase distributions were compared between the two Training Conditions separately at each assessment using Watson–Wheeler tests, with Holm correction across the three assessment-specific comparisons. No significant between-condition differences were found at any assessment. The Holm-adjusted p values were 0.54, 1.00, and 1.00 for the first, second, and final assessments, respectively. Descriptively, mean phase angles were negative in both conditions at all three assessments, indicating that taps tended to occur after the reference beat. However, the between-condition phase distributions did not differ significantly.
For SBH, Rayleigh-significant observations were sparse, with individual Assessment × Training Condition cells containing between one and seven observations. These cell sizes were considered insufficient for reliable Watson–Wheeler comparisons. Phase-angle outcomes for SBH were therefore summarized descriptively only. Circular mean phase angles and group resultant lengths across assessments and Training Conditions are shown in Figure 9.
Figure 9.
Phase-angle distributions during tapping to the OWA (4/4) and SBH (7/4) musical excerpts across the three assessments. Individual participant mean phase angles () are shown on the circumference for observations with significant Rayleigh phase concentration (). Solid arrows indicate the auditory-only group mean resultant vectors, whereas dashed arrows indicate the auditory–tactile group mean resultant vectors. The text below each panel reports the number of Rayleigh-significant observations (n), the group circular mean phase angle, and the group resultant length (r). Negative values indicate taps occurring after the reference beat, whereas positive values indicate taps occurring before the beat. For OWA, between-condition phase distributions were compared using Watson–Wheeler tests; for SBH, phase-angle outcomes were retained as descriptive only because several cells contained too few Rayleigh-significant observations for reliable inferential comparison.
5. Discussion
This study was conducted to explore sensorimotor synchronization in school-aged children following auditory–tactile and auditory-only music training. A classroom-feasible auditory–tactile system was implemented in a naturalistic school setting, offering children in the experimental class a bimodal musical experience.
Vibrotactile feedback was excluded from the assessment procedure in order to examine subsequent tapping behaviour following the auditory–tactile training, rather than the immediate effect of tactile stimulation. Many auditory–tactile studies have examined perceptual or motor responses while auditory and tactile stimuli are presented simultaneously [8,22,23]. Here, all sensorimotor tasks were conducted in an auditory-only condition, so that the outcomes concern subsequent auditory–motor performance rather than the immediate contribution of tactile cues. Three main findings emerged. First, synchronization consistency showed a longitudinal improvement across the intervention in the metronome tapping tasks, but no consistent difference between the auditory-only and auditory–tactile classes was observed. Since both groups followed the same music training curriculum, improvement across time may reflect a combination of repeated musical practice, task familiarity, maturation, and general development of sensorimotor skills rather than a contribution that could be attributed to auditory–tactile stimulation. Second, Grade 4 children showed stronger synchronization consistency and a higher probability of significant phase concentration than Grade 3 children across several metronome conditions. Third, a localized contrast between the two Grade 3 classes emerged for the OWA musical excerpt (4/4) at the final assessment, which reflected a decrease in synchronization consistency in the auditory-only class, whereas performance in the auditory–tactile class remained relatively stable. No corresponding contrast was observed for the metronome tasks or for SBH (7/4).
The stronger metronome performance of Grade 4 children is consistent with previous evidence that sensorimotor synchronization develops gradually throughout childhood, approaching adult-like non-musician levels during early adolescence [40]. During metronome tapping and tapping to OWA, phase-concentrated responses were more common, whereas synchronization with SBH was less stable and produced fewer Rayleigh-significant phase-angle observations. This pattern suggests that, besides developmental factors contributing to sensorimotor performance, the temporal organization of the musical stimulus may have influenced children’s ability to maintain a stable relationship with the underlying beat. Entrainment theory, in which internal attentional oscillations align with the temporal structure of an external rhythm [41], provides one possible framework for interpreting this pattern. The finding should not, however, be attributed specifically to metric complexity, since SBH was the only excerpt representing a 7/4 structure and differed from OWA in several other musical characteristics.
The absence of consistent condition-related differences across the metronome tasks suggests that repeated auditory–tactile experience did not produce a broad additional advantage in subsequent synchronization with isochronous auditory pacing signals. The localized pattern observed in Grade 3 at the final assessment should not be interpreted as evidence of an improvement caused by auditory–tactile stimulation, since the between-condition difference emerged from a decline in the auditory-only class while the auditory–tactile class showed relatively stable tapping behaviour. The pattern was not found in the metronome tasks or for SBH, and the children of the auditory-only group improved in the metronome tasks, so it may represent a task- or sample-specific pattern. Since condition is confounded with class, it cannot be attributed to the training itself, and it is regarded as exploratory and hypothesis-generating. Mean phase angles were negative in both groups relative to the reference beat. Since the latency of the response-acquisition system was not independently validated, phase angles are interpreted comparatively and not as absolute asynchronies. The localized OWA differences may therefore be related more to the concentration and stability of tapping around a preferred phase than to a systematic shift in phase alignment.
The present study did not demonstrate a reproducible condition-related advantage of auditory–tactile training for subsequent sensorimotor synchronization in children aged 8–10 years. Because of the wide confidence intervals in the metronome analyses, the results neither establish the absence of a benefit nor allow one to be inferred: the only between-class contrast of note (Grade 3, OWA) reflects a decline in the auditory-only class, in the presence of a baseline difference and among many exploratory tests. Whether effects depend on developmental level, task context, stimulus characteristics, or the dimension of synchronization considered remains a question for adequately replicated designs. The classroom-based system, built from commercially available components, nevertheless provides a feasible framework for integrating auditory–tactile stimulation with music activities, although it would need instrumental calibration before use in cross-site studies.
6. Limitations and Future Directions
The study was conducted in a naturalistic school setting and involved class-level allocation rather than individual randomization. One class within each grade represented each Training Condition. Class-related variation therefore cannot be separated from condition-related differences, and a class-level random effect could not be estimated. The p values and confidence intervals for condition-related effects are therefore not valid tests of the training and are interpreted as descriptive and exploratory. This applies in particular to the Grade 3 pattern observed for OWA. The classes also differed at baseline in some outcomes (for OWA in Grade 3 the auditory-only class started higher), and the mixed models cannot adjust for class-level variation. The absence of a no-training control group also limits the interpretation of longitudinal changes, which may reflect maturation, repeated testing, the common music training curriculum, or their combination. Some children reported difficulty synchronizing with an external beat while using a drumstick. Individual differences in motor familiarity may therefore have contributed to tapping variability. No analysis plan was specified in advance and many tests were run, so isolated significant results are hypothesis-generating. The sample consisted of the children of the classes taught by the first author, who was also their music teacher, so it was determined by the composition of these classes and not selected in advance.
Phase-angle analyses were restricted to observations showing significant Rayleigh concentration, and Rayleigh-significant observations were sparse for SBH. Phase-angle findings for this excerpt should therefore be interpreted descriptively. Only 112 of 180 SBH observations were usable, and unusable observations may themselves reflect poorer synchronization. Unusable observations were unevenly distributed across cells (Table 1), so available-case analyses of SBH probably overestimate the ability of the whole cohort. The Rayleigh-based outcome depends on the number of taps as well as on concentration, and R is upwardly biased for small numbers of taps (Section 3.4). The reasons for unusable observations were not quantified separately, and no sensitivity analysis with equalized tap counts or alternative inclusion rules could be performed, so the robustness of the results, in particular for SBH, to the processing rules and to the number of taps remains untested. OWA and SBH also differed in tempo, duration, musical content, and metric structure; differences between excerpts cannot be attributed to meter alone. With one school, one excerpt per metric structure, and no pre-specified hypotheses, replication with a larger and more diverse sample and several stimuli per structure is needed before broader conclusions can be drawn. The auditory–tactile system was designed for practical classroom use, but its mechanical output was not instrumentally characterized. The tactile level was adjusted manually according to the children’s reactions and was not documented, the auditory–tactile delay was set perceptually, and the timing of the response-acquisition chain was not independently validated. Future studies should include calibrated measurements of vibration output, frequency response, system transfer characteristics, and auditory–tactile latency to improve reproducibility. They should also validate the strike-to-MIDI latency and its variability against a hardware reference before phase angles are interpreted as absolute asynchronies.
All sensorimotor synchronization assessments were conducted without concurrent vibrotactile stimulation. The present findings therefore concern subsequent auditory–motor performance following auditory–tactile training rather than the immediate effect of tactile cueing. Future studies should compare auditory-only, auditory–tactile, and tactile-only assessment conditions. Adequately replicated and calibrated studies are needed to determine whether, and under which conditions, repeated auditory–tactile experience supports children’s sensorimotor synchronization capacity.
Author Contributions
Conceptualization, M.P.-K., C.A. and A.A.; methodology, M.P.-K., C.A. and A.A.; software, K.B.; formal analysis, M.P.-K. and K.B.; investigation, M.P.-K.; resources, M.P.-K. and A.A.; data curation, M.P.-K.; writing—original draft preparation, M.P.-K.; writing—review and editing, K.B., C.A. and A.A.; visualization, M.P.-K.; supervision, A.A.; project administration, M.P.-K., C.A. and A.A. All authors have read and agreed to the published version of the manuscript.
Funding
M.P.-K. received study grants from the A. G. Leventis Foundation (Zurich, Switzerland) for the academic years 2017–2018, 2018–2019 and 2019–2020. The Foundation had no role in the design of the study; in the collection, analysis, or interpretation of data; in the writing of the manuscript; or in the decision to publish the results.
Institutional Review Board Statement
The study was conducted in accordance with the Declaration of Helsinki and was approved for conduct in the school setting by the National and Kapodistrian University of Athens (Central Protocol No. 1819017740/31-12-18; School of Philosophy Protocol No. 317/7-1-19), the Greek Ministry of Education (Protocol No. 54672/8-4-19), and the Institute of Educational Policy (Protocol No. .15/54672/61934/1/18-4-19).
Informed Consent Statement
Written informed consent was obtained from the parents and/or legal guardians of all children involved in the study.
Data Availability Statement
The data supporting the findings of this study are not publicly available due to privacy and ethical restrictions related to the participation of minors. Data sharing was not permitted under the conditions of the study approval.
Acknowledgments
The authors thank the participating children, their parents and legal guardians, as well as the school community for their cooperation and participation in the study. During the preparation of this manuscript, the authors used AI tools (GPT-5; OpenAI, San Francisco, CA, USA) by OpenAI and Gemini (Gemini 3 Pro; Google, Mountain View, CA, USA) for language editing, text restructuring, assistance with LaTeX formatting and graphical presentation, and guidance on selected statistical analysis workflows in JASP. Suggestions related to statistical procedures were cross-checked against independent methodological sources and the relevant literature before implementation. All analyses were performed, reviewed, and interpreted by the authors, who take full responsibility for the content of this publication.
Conflicts of Interest
The first author served as the music teacher of the participating children during the study. The authors declare no conflicts of interest.
Abbreviations
The following abbreviations are used in this manuscript:
| SMS | Sensorimotor synchronization |
| OWA | One Way or Another |
| SBH | Solsbury Hill |
| PRE | Pre (first)-training assessment |
| MID | Middle (second)-training assessment |
| POST | Post (final)-training assessment |
| BPM | Beats per minute |
| MIDI | Musical Instrument Digital Interface |
| CSV | Comma-separated values |
| ITI | Inter-tap interval |
| SD | Standard deviation |
| CI | Confidence interval |
Appendix A. Musical Training
Table A1.
First Training Period.
Table A2.
Second Training Period.
References
- Aker, S.C.; Innes-Brown, H.; Faulkner, K.F.; Vatti, M.; Marozeau, J. Effect of audio-tactile congruence on vibrotactile music enhancement. J. Acoust. Soc. Am. 2022, 152, 3396–3409. [Google Scholar] [CrossRef] [Scilit] [PubMed]
- Kayser, C.; Petkov, C.I.; Augath, M.; Logothetis, N.K. Integration of touch and sound in auditory cortex. Neuron 2005, 48, 373–384. [Google Scholar] [CrossRef] [Scilit] [PubMed]
- Bresciani, J.-P.; Ernst, M.O. Signal reliability modulates auditory-tactile integration for event counting. NeuroReport 2007, 18, 1157–1161. [Google Scholar] [CrossRef] [Scilit] [PubMed]
- Brochard, R.; Touzalin, P.; Després, O.; Dufour, A. Evidence of beat perception via purely tactile stimulation. Brain Res. 2008, 1223, 59–64. [Google Scholar] [CrossRef] [Scilit] [PubMed]
- Soto-Faraco, S.; Deco, G. Multisensory contributions to the perception of vibrotactile events. Behav. Brain Res. 2009, 196, 145–154. [Google Scholar] [CrossRef] [Scilit] [PubMed]
- Butler, J.S.; Foxe, J.J.; Fiebelkorn, I.C.; Mercier, M.R.; Molholm, S. Multisensory representation of frequency across audition and touch: High density electrical mapping reveals early sensory-perceptual coupling. J. Neurosci. 2012, 32, 15338–15344. [Google Scholar] [CrossRef] [Scilit] [PubMed]
- Merchel, S.; Altinsoy, M.E. Psychophysical comparison of the auditory and tactile perception: A survey. J. Multimodal User Interfaces 2020, 14, 271–283. [Google Scholar] [CrossRef] [Scilit]
- Lauzon, A.P.; Russo, F.A.; Harris, L.R. The influence of rhythm on detection of auditory and vibrotactile asynchrony. Exp. Brain Res. 2020, 238, 825–832. [Google Scholar] [CrossRef] [Scilit] [PubMed]
- Bernard, C.; Monnoyer, J.; Wiertlewski, M.; Ystad, S. Rhythm perception is shared between audio and haptics. Sci. Rep. 2022, 12, 4188. [Google Scholar] [CrossRef] [Scilit] [PubMed]
- Occelli, V.; Spence, C.; Zampini, M. Audiotactile interactions in temporal perception. Psychon. Bull. Rev. 2011, 18, 429–454. [Google Scholar] [CrossRef] [Scilit] [PubMed]
- Paisa, R.; Nilsson, N.C.; Serafin, S. Tactile displays for auditory augmentation—A scoping review and reflections on music applications for hearing impaired users. Front. Comput. Sci. 2023, 5, 1085539. [Google Scholar] [CrossRef] [Scilit]
- Siedenburg, K.; Bürgel, M.; Özgür, E.; Scheicht, C.; Töpken, S. Vibrotactile enhancement of musical engagement. Sci. Rep. 2024, 14, 7764. [Google Scholar] [CrossRef] [Scilit] [PubMed]
- Large, E.W.; Herrera, J.A.; Velasco, M.J. Neural networks for beat perception in musical rhythm. Front. Syst. Neurosci. 2015, 9, 159. [Google Scholar] [CrossRef] [Scilit] [PubMed]
- Einarson, K.M.; Trainor, L.J. Hearing the beat: Young children’s perceptual sensitivity to beat alignment varies according to metric structure. Music Percept. 2016, 34, 56–70. [Google Scholar]
- Grahn, J.A.; Brett, M. Rhythm and beat perception in motor areas of the brain. J. Cogn. Neurosci. 2007, 19, 893–906. [Google Scholar] [CrossRef] [Scilit] [PubMed]
- Repp, B.H. Sensorimotor synchronization: A review of the tapping literature. Psychon. Bull. Rev. 2005, 12, 969–992. [Google Scholar] [CrossRef] [Scilit] [PubMed]
- Repp, B.H.; Su, Y.-H. Sensorimotor synchronization: A review of recent research (2006–2012). Psychon. Bull. Rev. 2013, 20, 403–452. [Google Scholar] [CrossRef] [Scilit] [PubMed]
- Tranchant, P.; Vuvan, D.T.; Peretz, I. Keeping the beat: A large sample study of bouncing and clapping to music. PLoS ONE 2016, 11, e0160178. [Google Scholar] [CrossRef] [Scilit] [PubMed]
- Monier, F.; Droit-Volet, S. Development of sensorimotor synchronization abilities: Motor and cognitive components. Child Neuropsychol. 2019, 25, 1043–1062. [Google Scholar] [CrossRef] [Scilit] [PubMed]
- Carrer, L.R.J.; Pompéia, S.; Miranda, M.C. Sensorimotor synchronization with music and metronome in school-aged children. Psychol. Music 2023, 51, 523–540. [Google Scholar] [CrossRef] [Scilit]
- Kim, H.-W.; Lee, K.M.; Lee, Y.S. Sensorimotor and working memory systems jointly support development of perceptual rhythm processing. Dev. Sci. 2023, 26, e13261. [Google Scholar] [CrossRef] [Scilit] [PubMed]
- Ammirante, P.; Patel, A.D.; Russo, F.A. Synchronizing to auditory and tactile metronomes: A test of the auditory-motor enhancement hypothesis. Psychon. Bull. Rev. 2016, 23, 1882–1890. [Google Scholar] [CrossRef] [Scilit] [PubMed]
- Gilmore, S.A.; Russo, F.A. Neural and behavioral evidence for vibrotactile beat perception and bimodal enhancement. J. Cogn. Neurosci. 2021, 33, 635–650. [Google Scholar] [CrossRef] [Scilit] [PubMed]
- Hove, M.J.; Martinez, S.A.; Stupacher, J. Feel the bass: Music presented to tactile and auditory modalities increases aesthetic appreciation and body movement. J. Exp. Psychol. General. 2020, 149, 1137–1147. [Google Scholar] [CrossRef] [Scilit] [PubMed]
- Papadogianni-Kouranti, M.; Altinsoy, E.; Andreopoulou, A. Multimodal exploration in elementary music classroom. J. Multimodal User Interfaces 2024, 18, 55–68. [Google Scholar] [CrossRef] [Scilit]
- Trainor, L.J.; Corrigall, K.A. Music acquisition and effects of musical experience. In Music Perception; Jones Riess, M., Fay, R.R., Popper, A.N., Eds.; Springer: New York, NY, USA, 2010; Volume 36, pp. 89–127. [Google Scholar]
- Burunat, I.; Tsatsishvili, V.; Brattico, E.; Toiviainen, P. Coupling of action-perception brain networks during musical pulse processing: Evidence from region-of-interest-based independent component analysis. Front. Hum. Neurosci. 2017, 11, 230. [Google Scholar] [CrossRef] [Scilit] [PubMed]
- Tranchant, P.; Shiel, M.M.; Giordano, M.; Nadeau, A.; Peretz, I.; Zatorre, R.J. Feeling the beat: Bouncing synchronization to vibrotactile music in hearing and early deaf people. Front. Neurosci. 2017, 11, 507. [Google Scholar] [CrossRef] [Scilit] [PubMed]
- Remache-Vinueza, B.; Trujillo-León, A.; Zapata, M.; Sarmiento-Ortiz, F.; Vidal-Verdú, F. Audio-tactile rendering: A review on technology and methods to convey musical information through the sense of touch. Sensors 2021, 21, 6575. [Google Scholar] [CrossRef] [Scilit] [PubMed]
- Merchel, S.; Altinsoy, M.E. The influence of vibrations on musical experience. J. Audio Eng. Soc. 2014, 62, 220–234. [Google Scholar] [CrossRef] [Scilit]
- Giordano, M.; Sullivan, J.; Wanderley, M.M. Design of vibrotactile feedback and stimulation for music performance. In Musical Haptics; Papetti, S., Saitis, C., Eds.; Springer: Berlin/Heidelberg, Germany, 2018; pp. 103–122. [Google Scholar]
- Berens, P. CircStat: A MATLAB toolbox for circular statistics. J. Stat. Softw. 2009, 31, 1–21. [Google Scholar]
- Mardia, K.V.; Jupp, P.E. Directional Statistics; John Wiley & Sons: Hoboken, NJ, USA, 2000. [Google Scholar]
- JASP Team. JASP (Version 0.16) [Computer Software]. Available online: https://jasp-stats.org (accessed on 22 November 2021).
- Bates, D.; Mächler, M.; Bolker, B.M.; Walker, S.C. Fitting linear mixed-effects models using lme4. J. Stat. Softw. 2015, 67, 1–48. [Google Scholar]
- Kuznetsova, A.; Brockhoff, P.B.; Christensen, R.H.B. LmerTest package: Tests in linear mixed effects models. J. Stat. Softw. 2017, 82, 1–26. [Google Scholar] [CrossRef] [Scilit]
- Holm, S. A simple sequentially rejective multiple test procedure. Scand. J. Stat. 1979, 6, 65–70. [Google Scholar]
- Pewsey, A.; Neuhäuser, M.; Ruxton, G.D. Circular Statistics in R; Oxford University Press: Oxford, UK, 2013. [Google Scholar]
- Landler, L.; Ruxton, G.D.; Malkemper, E.P. Advice on comparing two independent samples of circular data in biology. Sci. Rep. 2021, 11, 20337. [Google Scholar] [CrossRef] [Scilit] [PubMed]
- Einarson, K.M. Beat Perception and Synchronization Abilities in Young Children. Doctoral Dissertation, McMaster University, Hamilton, ON, Canada, 2016. [Google Scholar]
- Large, E.W.; Jones, M.R. The dynamics of attending: How people track time-varying events. Psychol. Rev. 1999, 106, 119–159. [Google Scholar] [CrossRef] [Scilit]
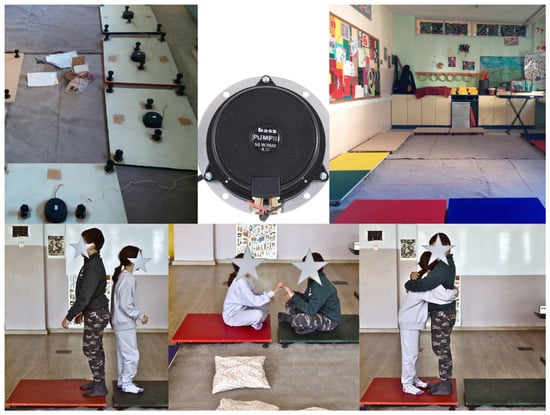
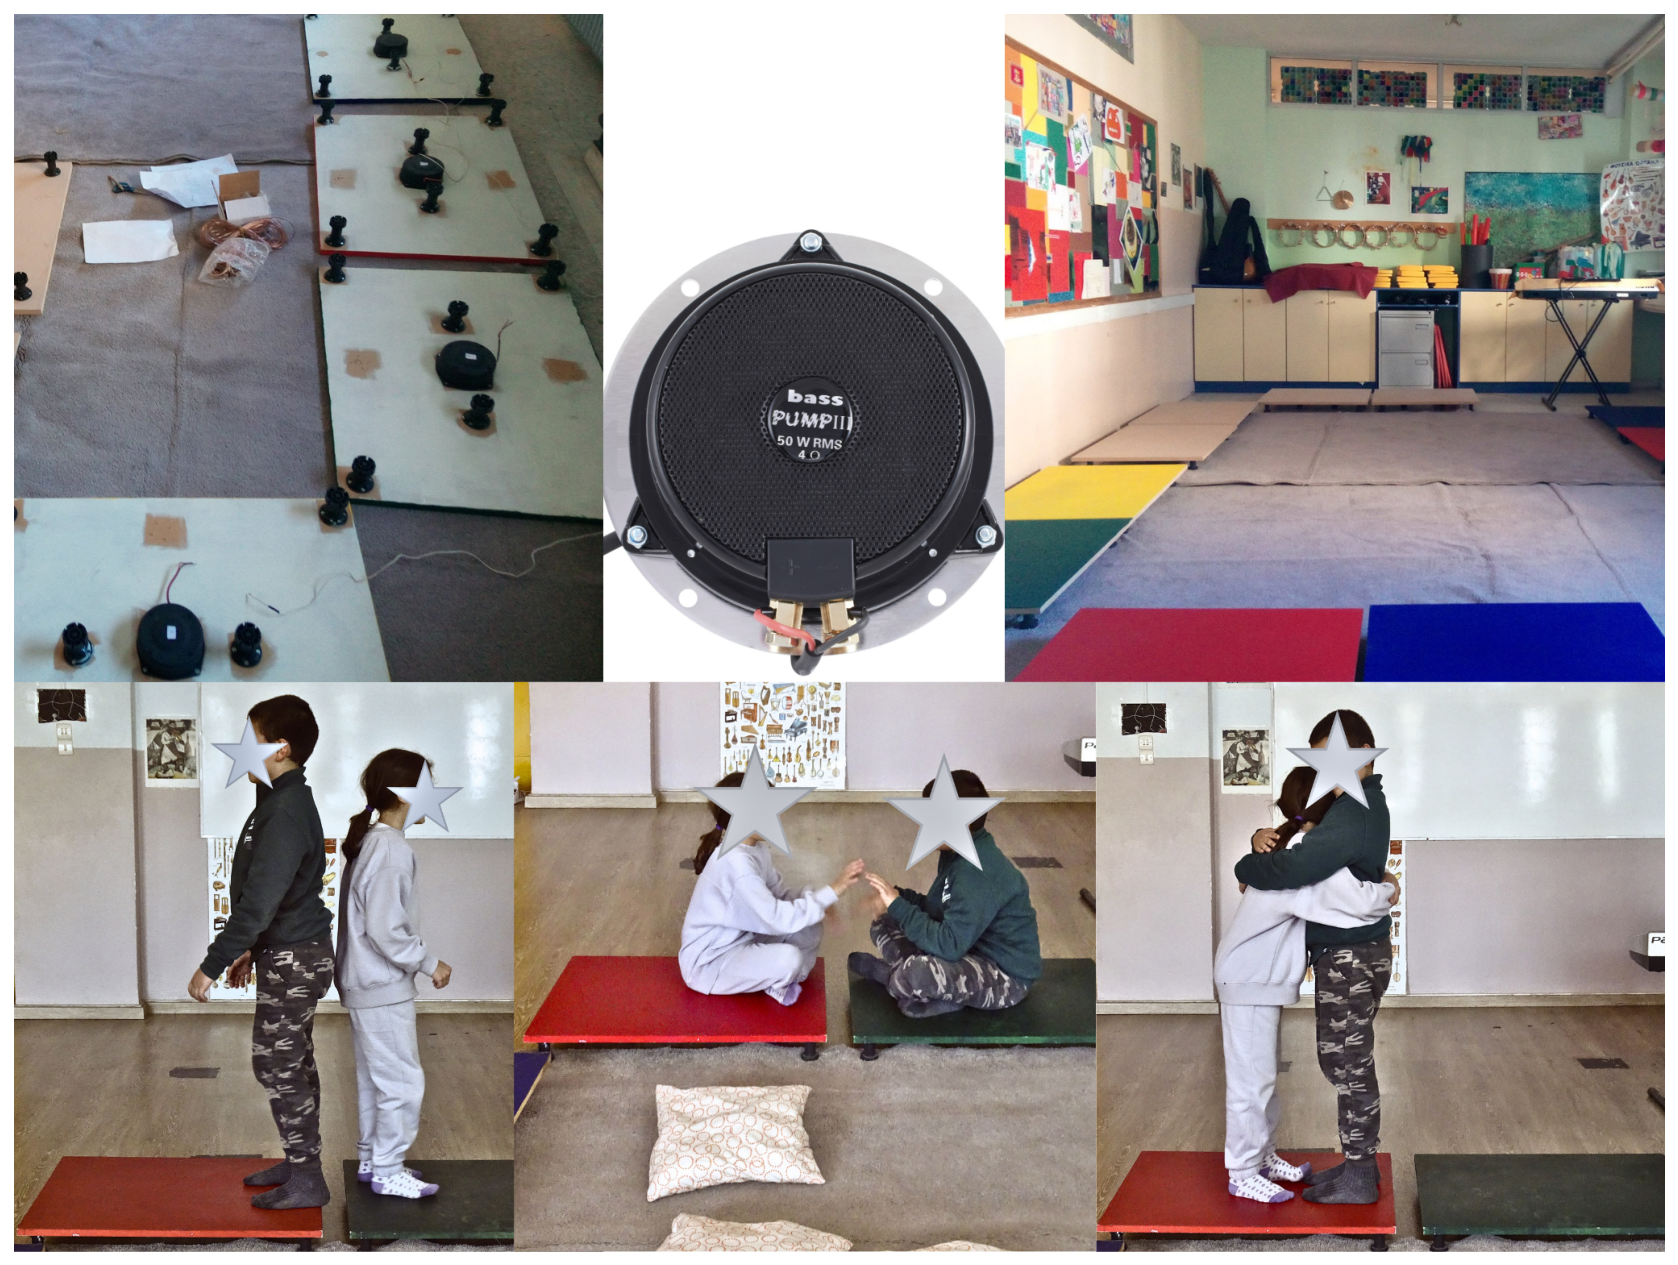
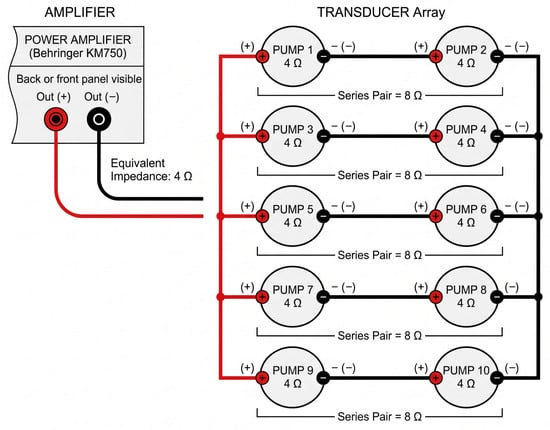
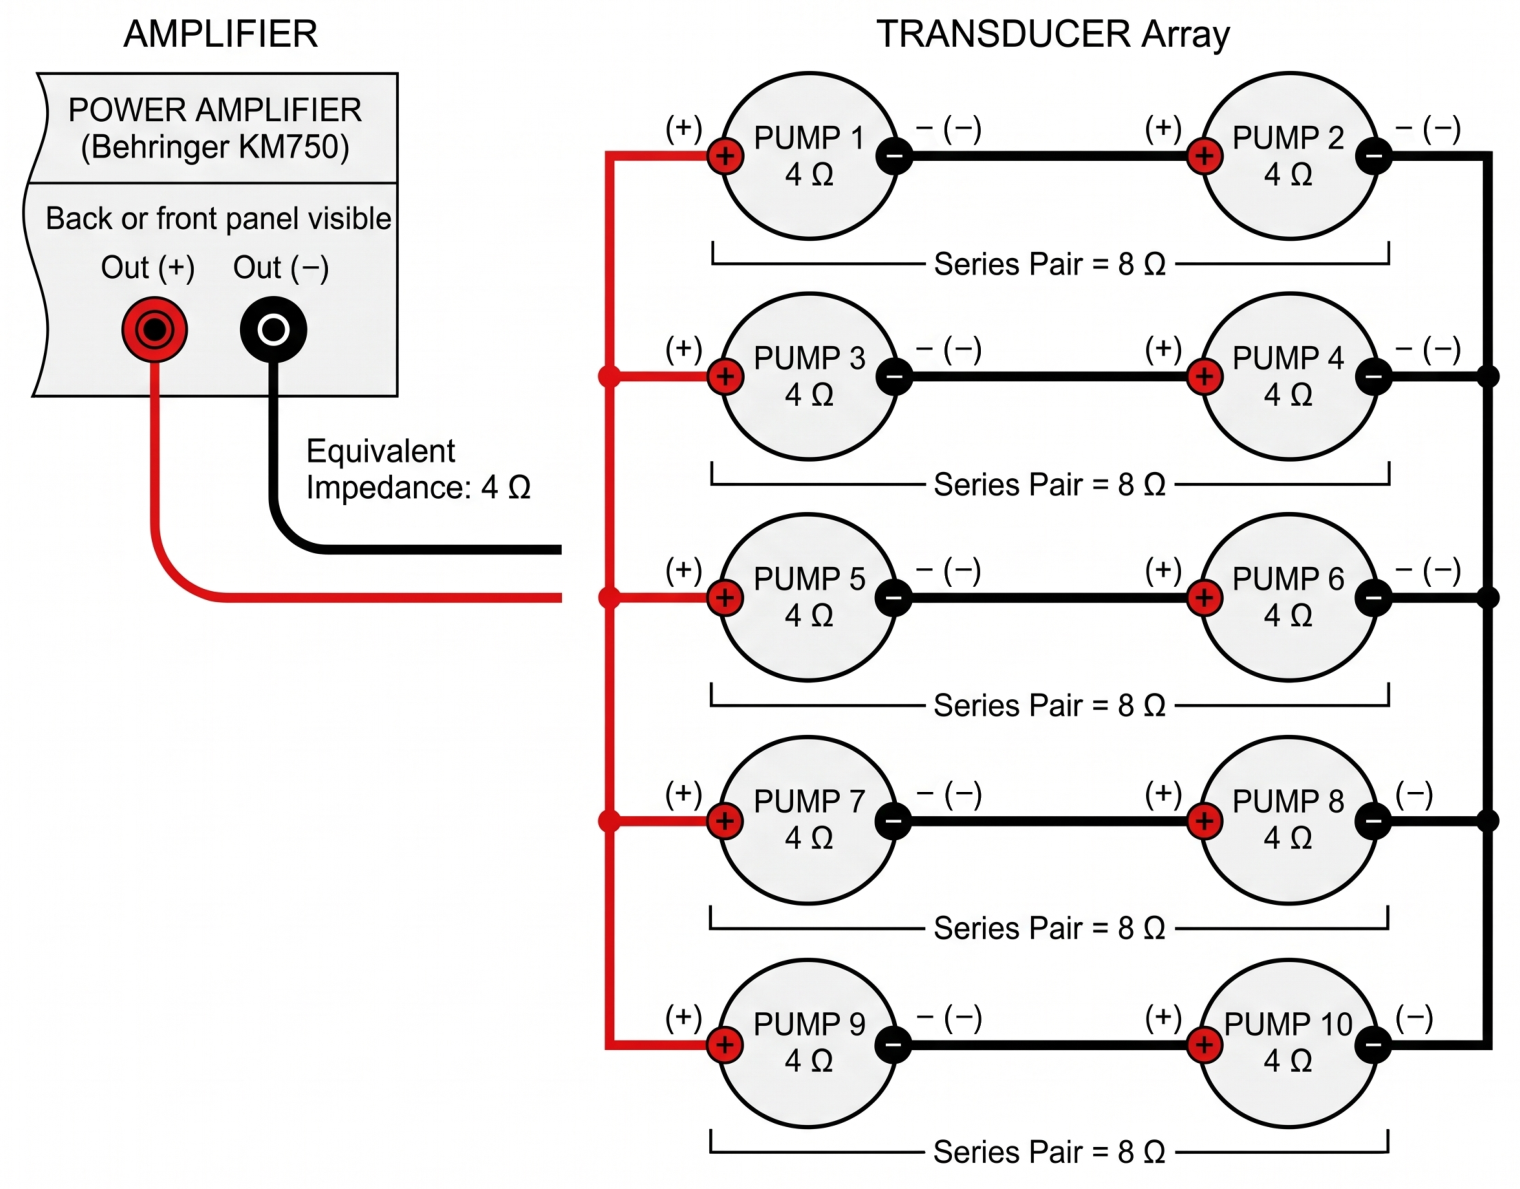
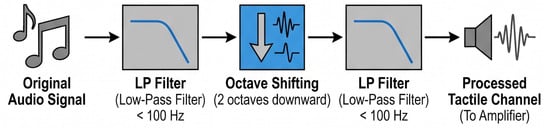
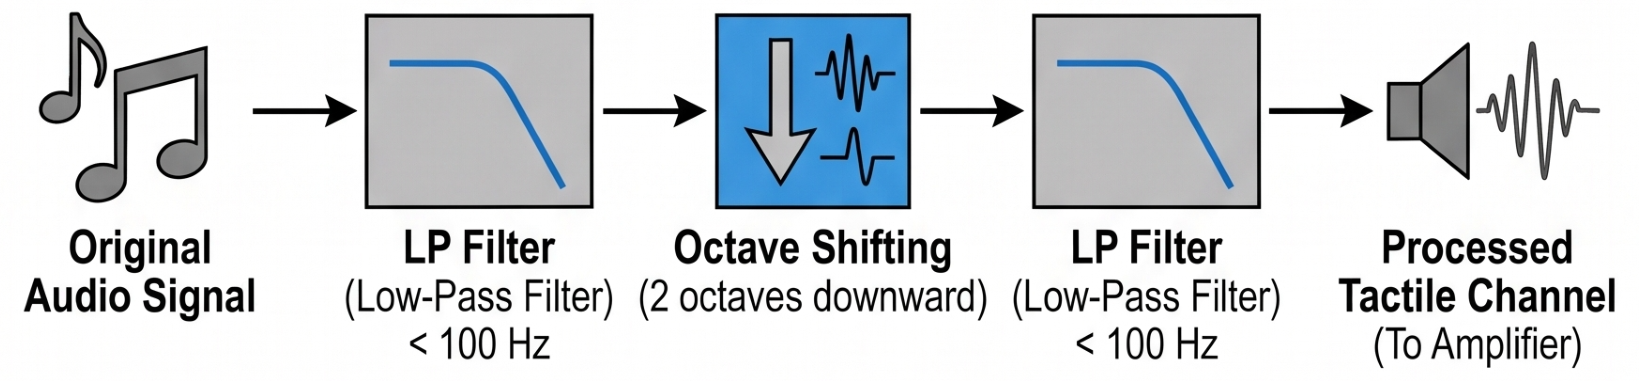
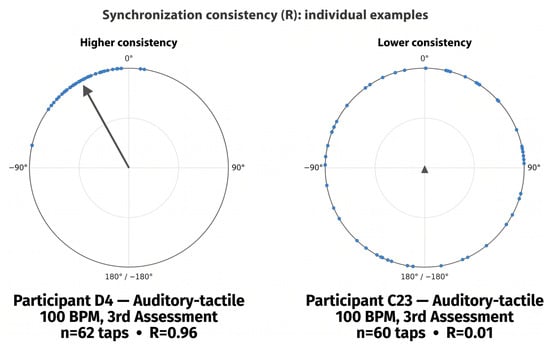
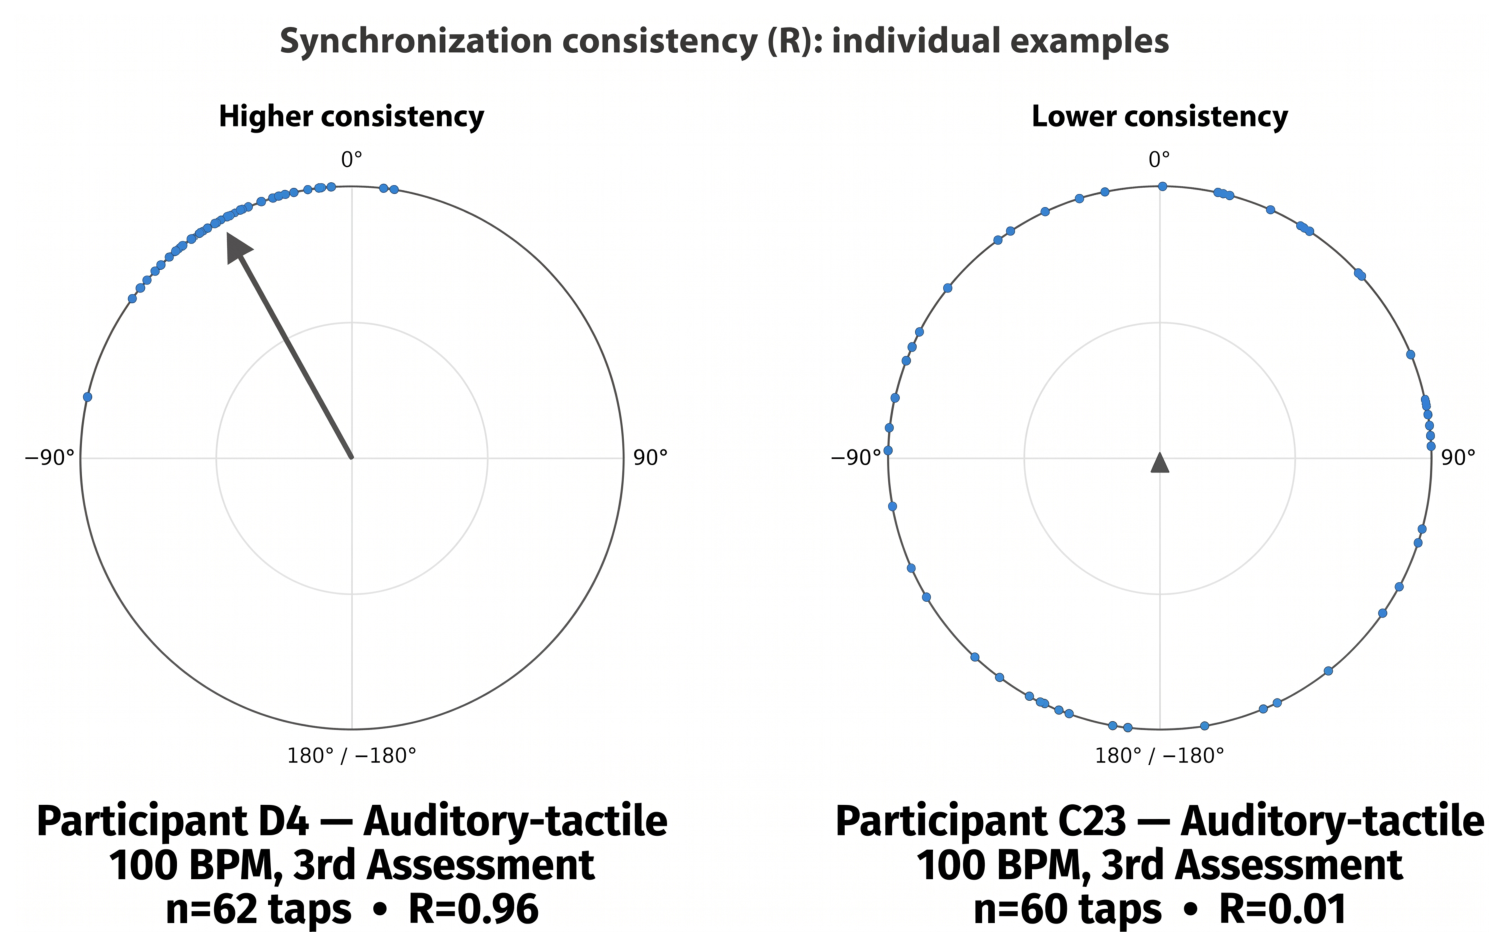
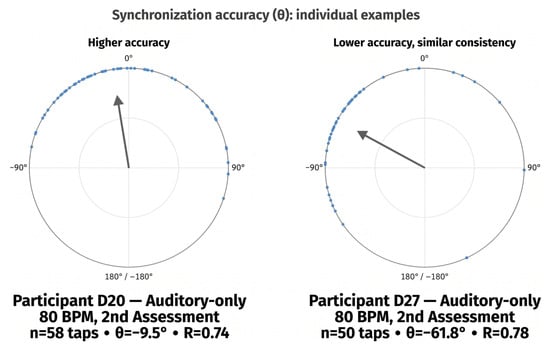
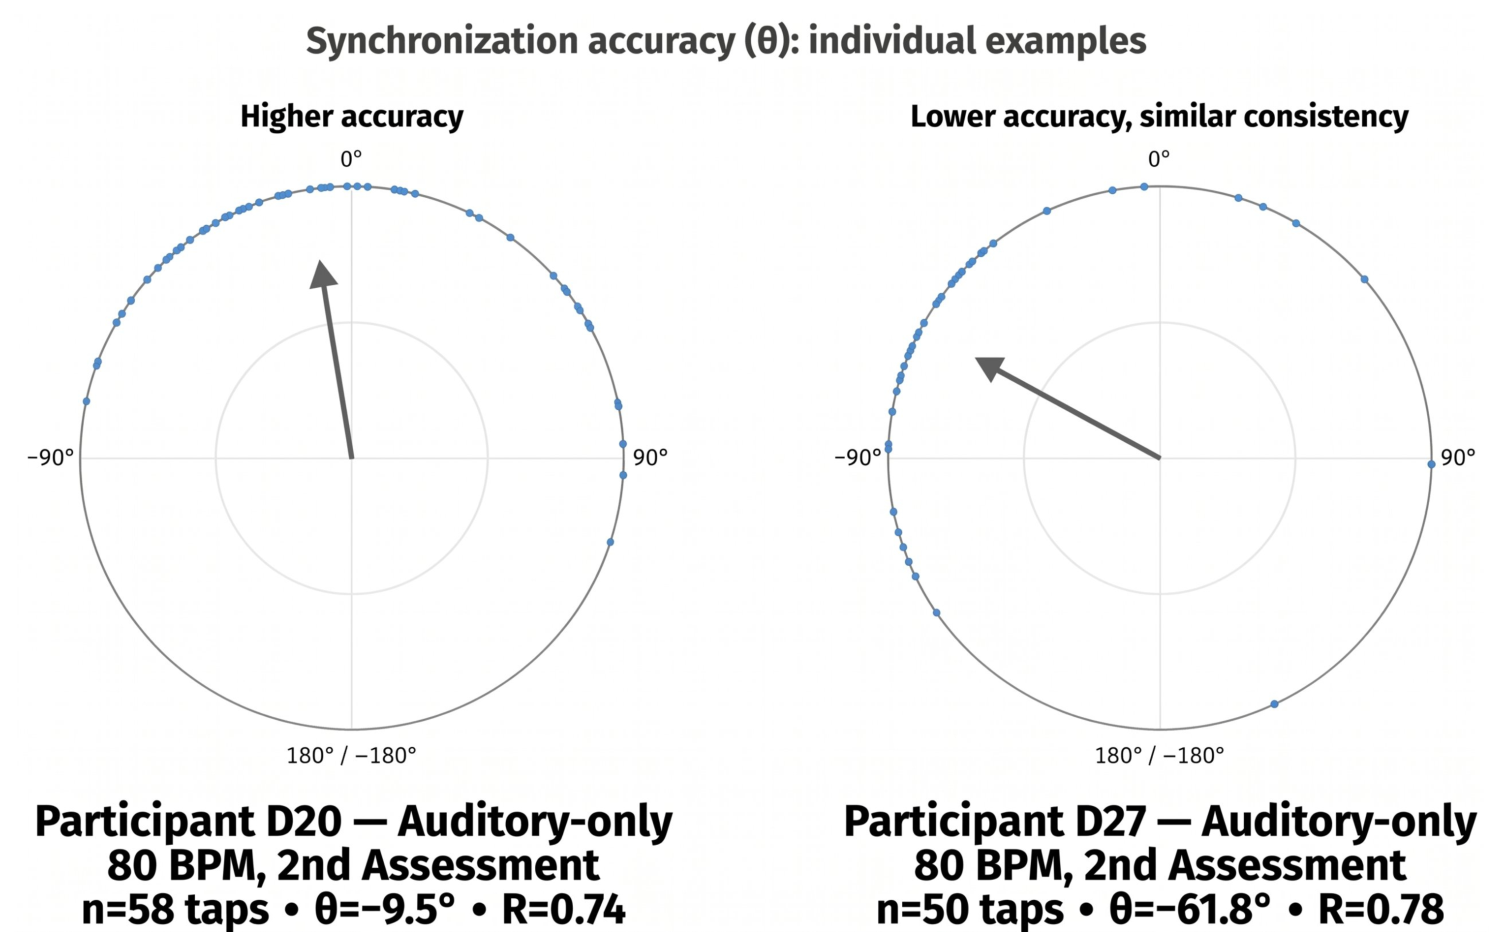
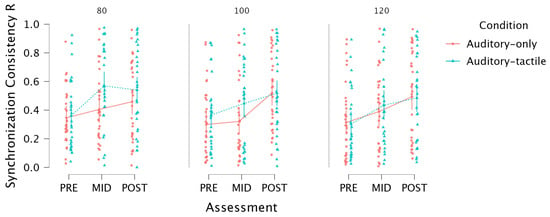
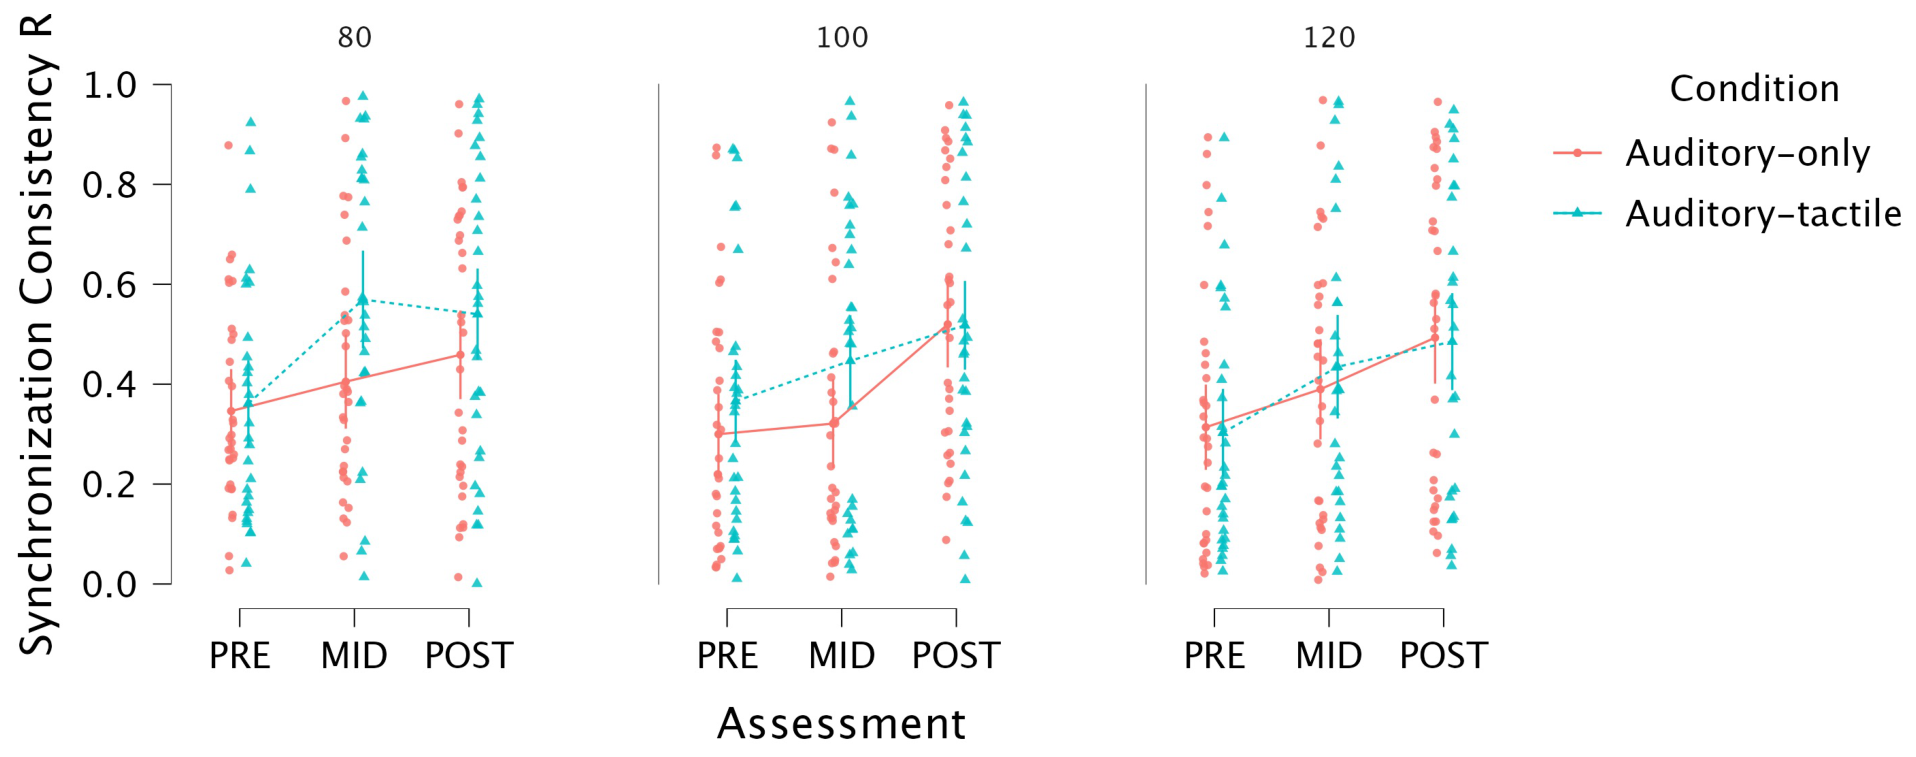
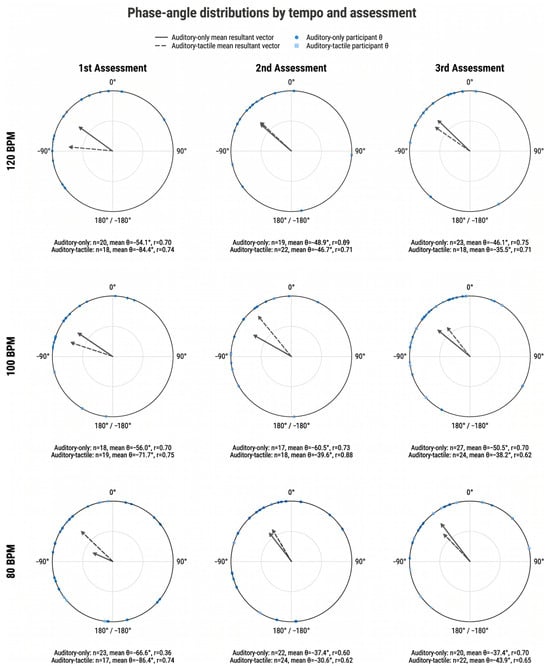
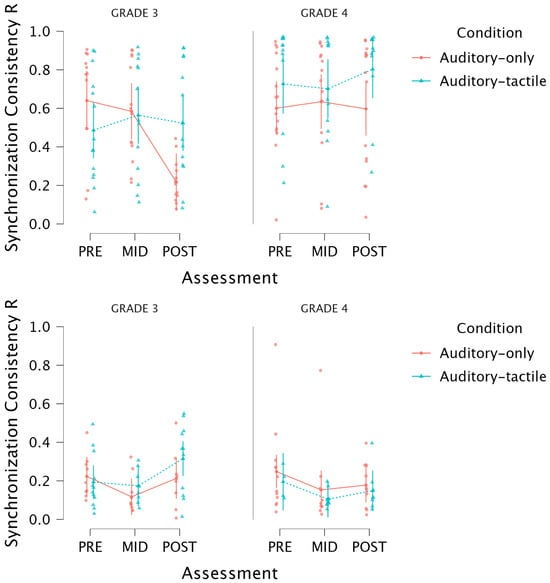
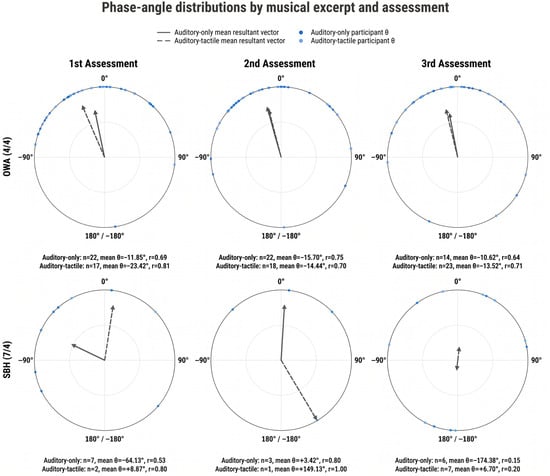
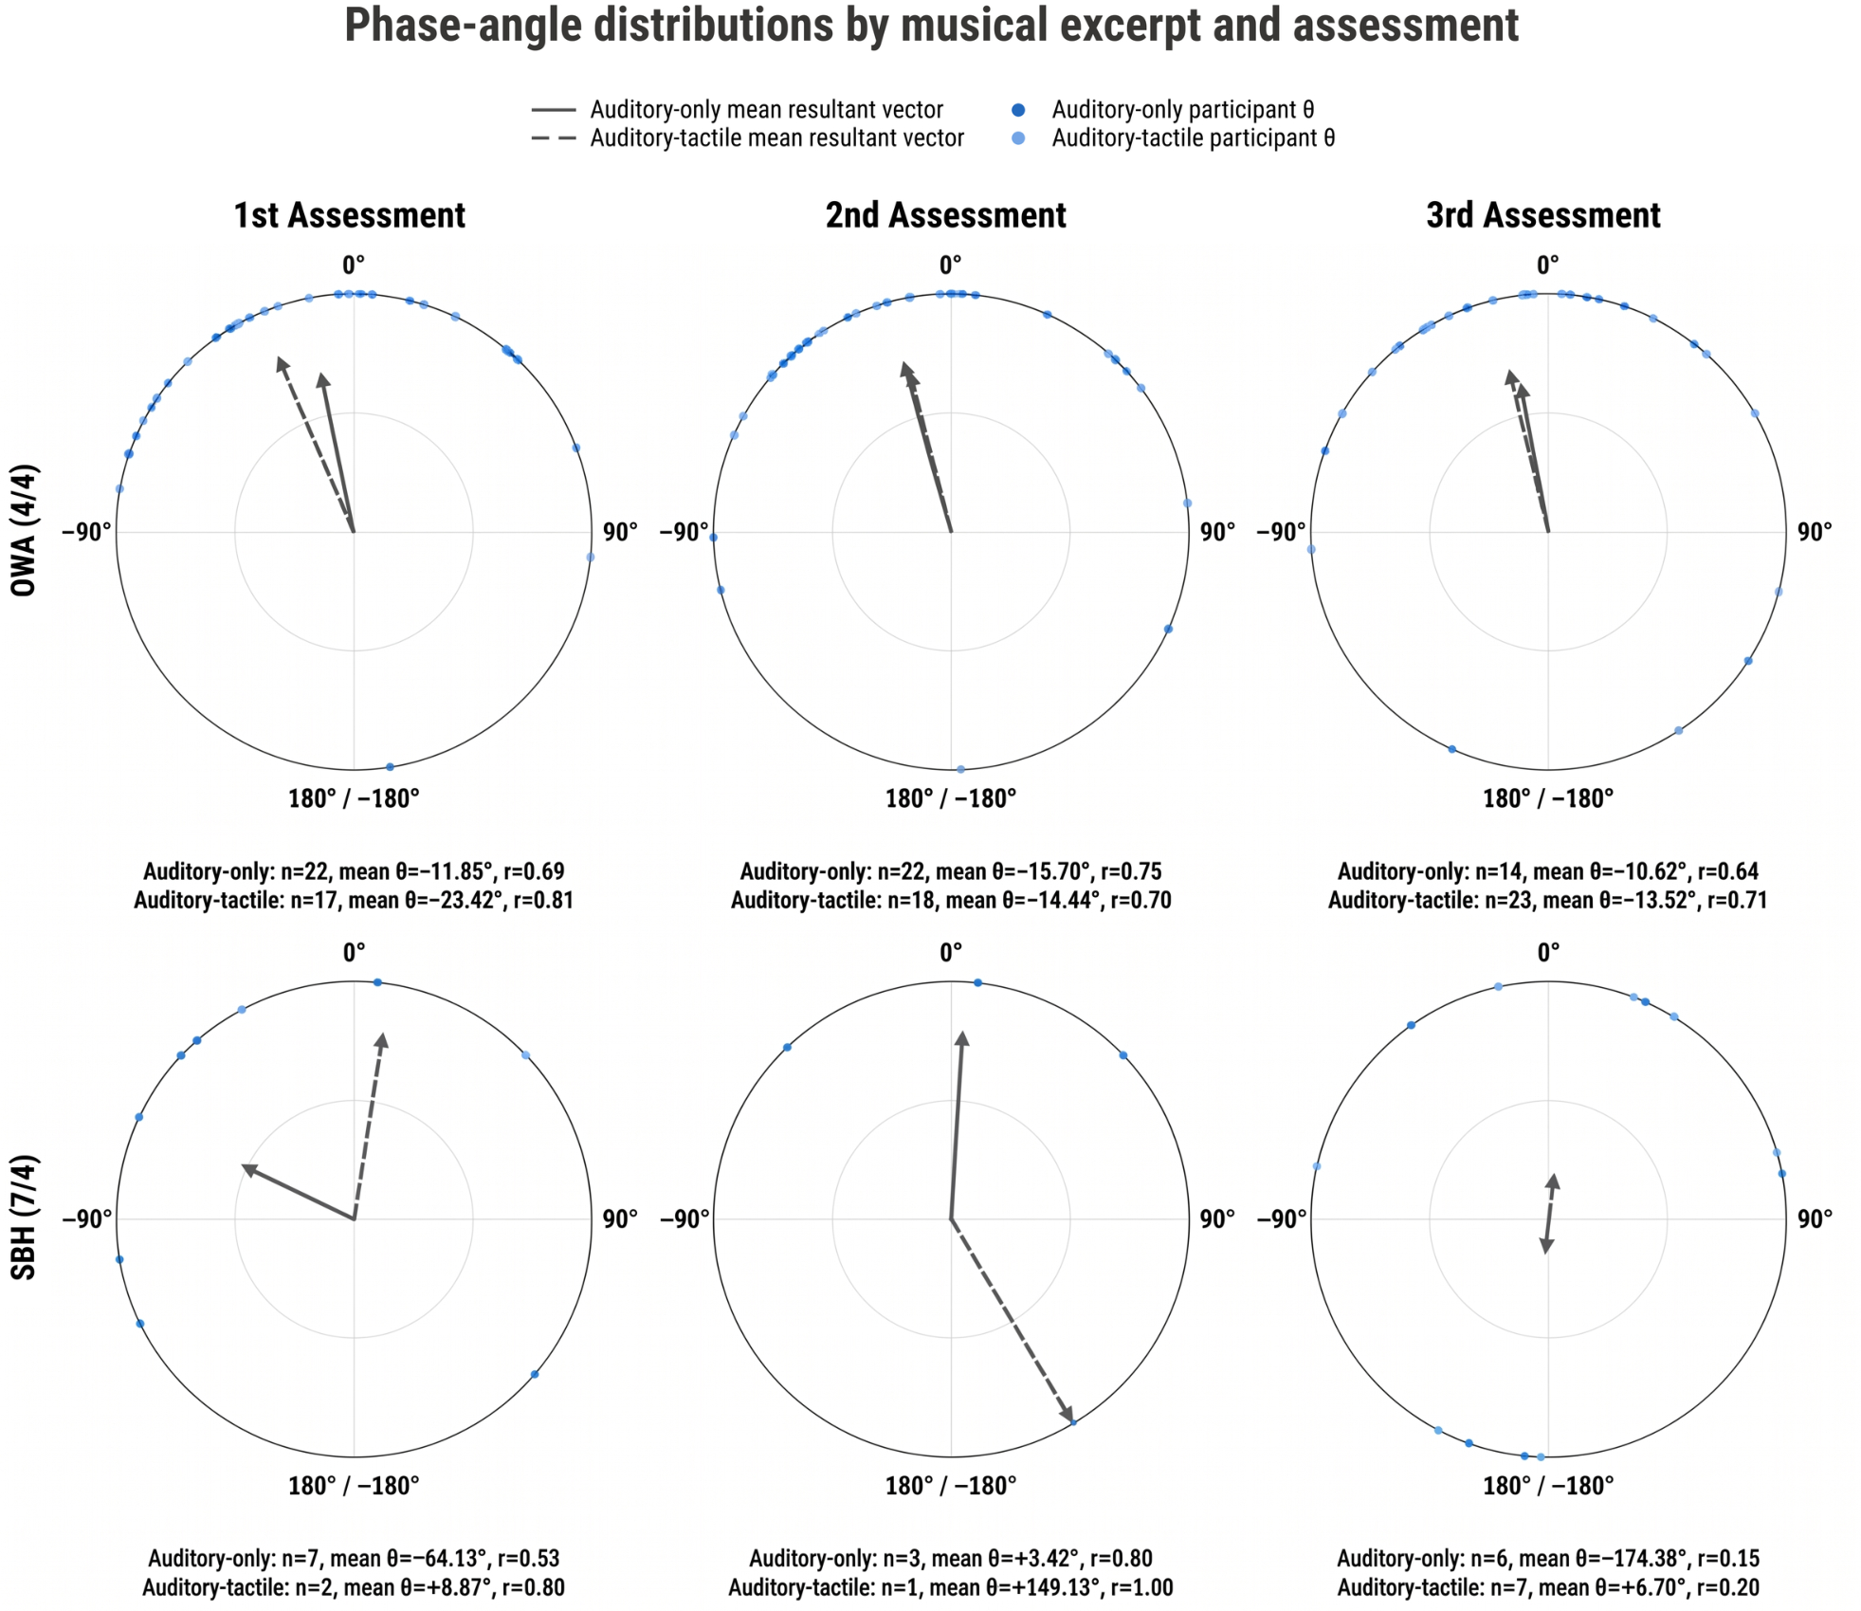

Disclaimer/Publisher’s Note: The statements, opinions and data contained in all publications are solely those of the individual author(s) and contributor(s) and not of MDPI and/or the editor(s). MDPI and/or the editor(s) disclaim responsibility for any injury to people or property resulting from any ideas, methods, instructions or products referred to in the content. |
© 2026 by the authors. Licensee MDPI, Basel, Switzerland. This article is an open access article distributed under the terms and conditions of the Creative Commons Attribution (CC BY) license.