


Abstract
Security operations teams in IoT-rich and distributed enterprise environments are routinely faced with backlogs of tens of thousands of disclosed vulnerabilities, yet must focus remediation efforts on the small fraction that carries real exploitation risk. Sharing the threat intelligence needed to make that judgment accurately is often legally or contractually impossible because raw vulnerability records expose sensitive asset and configuration data. We address this tension with the Federated Vulnerability Prioritization and Management (FVPM) framework, which lets multiple organizations collaboratively train a shared risk model while each retains its local CVE data behind its own perimeter. Our dataset covers 220,763 CVE records from the National Vulnerability Database (NVD), enriched with EPSS exploitability scores. Rather than using CVSS severity thresholds as a proxy for risk, we build ground-truth high-risk labels from confirmed exploitation evidence in three independent sources—the CISA Known Exploited Vulnerabilities (KEV) catalog, ExploitDB, and the Metasploit Framework—yielding 4528 HighRisk CVEs (2.05% of the dataset). Training uses a three-layer MLP (128 → 64 → 32 neurons) distributed across 20 non-IID federated clients; Focal Loss combined with SMOTE handles the severe class imbalance, and Platt calibration corrects the probability overestimation that SMOTE introduces before scores feed into the composite prioritization formula. Under the non-IID partition, FedAvg reaches PR-AUC = 0.4428 and ROC-AUC = 0.8880, against a centralized baseline PR-AUC of 0.6005. The resulting federated performance gap of ΔPR-AUC ≈ 0.16 reflects the cost of training without data sharing, not a formal privacy mechanism, and we argue it is an acceptable trade-off given that raw organizational records never leave local systems. Weight optimization over the FVPM composite score selects as the highest-accuracy configuration; SHAP attribution independently confirms EPSS as the dominant predictive feature (Mean|SHAP| = 3.69), with VulnerabilityAge and AttackVector as secondary signals. FVPM nevertheless adds value beyond standalone EPSS: it provides early-warning estimates for newly disclosed CVEs before EPSS scores are published, supports privacy-preserving inference over local asset inventories, and allows organizations to customize composite weights to their own criticality profiles.
1. Introduction
The rapid growth of cloud computing, Internet of Things (IoT), distributed enterprise information systems, and enterprise digital infrastructures has significantly expanded the cybersecurity attack surface. As organizations increasingly rely on interconnected systems, the timely identification and remediation of exploitable vulnerabilities has become a critical operational challenge. The National Vulnerability Database (NVD) catalogs more than 220,000 disclosed CVEs, yet security teams must prioritize a small fraction of these for immediate remediation given constrained resources [1]. This challenge is especially acute in sensor-rich and IoT environments, where heterogeneous device fleets operated by multiple organizations introduce distributed vulnerability profiles that cannot be aggregated without sharing sensitive asset data.
Vulnerability prioritization is inherently complicated by two competing demands. First, organizations must share threat intelligence to accurately assess exploitation risk across the broader security landscape. Second, raw vulnerability records may disclose sensitive information about organizational assets, configurations, and security posture that cannot legally or strategically be shared. Federated learning addresses this tension by enabling multiple organizations to collaboratively train a shared model without exchanging raw data [2].
Existing AI-driven vulnerability prioritization systems predominantly rely on centralized learning architectures that require the collection and pooling of vulnerability data from multiple organizations [3,4,5]. Such approaches introduce data-governance challenges, increased communication overhead, and limitations in collaborative intelligence sharing. Furthermore, most prior work defines high-risk labels using a single severity metric, such as CVSS score, rather than confirmed exploitation evidence, which may misclassify actively exploited vulnerabilities of moderate severity.
This paper proposes the Federated Vulnerability Prioritization and Management (FVPM) framework, which addresses these limitations through four technical innovations: (i) a confirmed-exploitation labeling strategy that derives high-risk labels from the union of KEV, ExploitDB, and Metasploit records; (ii) a federated vulnerability risk prediction model trained with Focal Loss and SMOTE to handle the extreme class imbalance inherent in real-world vulnerability datasets; (iii) Platt calibration of federated predictions to correct for the probability miscalibration introduced by SMOTE oversampling; and (iv) a composite FVPM prioritization score with grid-search weight optimization.
The main contributions of this work are as follows:
- We construct a large-scale vulnerability assessment dataset of 220,763 CVEs with confirmed-exploitation high-risk labels derived from KEV, ExploitDB, and Metasploit (4528 records, 2.05% prevalence).
- We design and evaluate a three-layer VulnerabilityMLP trained under a 20-client non-IID federated environment with Focal Loss and SMOTE, achieving PR-AUC = 0.4428 under federation versus PR-AUC ≈ 0.60 for a centralized baseline, thereby quantifying the federated performance gap (ΔPR-AUC ≈ 0.16) as the cost of decentralized non-IID training without data sharing.
- We compare three federated aggregation strategies (FedAvg, WeightedFedAvg, and FedProx with μ = 0.001) and show that FedAvg and WeightedFedAvg achieve equivalent performance while FedProx introduces a marginal regularization bias.
- We introduce a Platt-calibrated composite FVPM prioritization score and perform a systematic grid search over weight combinations, revealing that EPSS achieves the highest standalone prioritization accuracy ().
- We provide SHAP-based explainability analysis confirming the dominant role of EPSS (Mean|SHAP| = 3.69) and identifying VulnerabilityAge and AttackVector as secondary predictors.
The remainder of this paper is organized as follows. Section 2 reviews related work. Section 3 describes the FVPM architecture. Section 4 presents the federated learning methodology and prioritization mechanism. Section 5 describes the experimental setup. Section 6 presents and discusses experimental results. Section 7 addresses threats to validity. Section 8 concludes the paper.
2. Background and Related Work
2.1. Traditional Vulnerability Scanning
Automated vulnerability scanning has become a fundamental component of cybersecurity management. Traditional scanners such as Nessus, OpenVAS, and Qualys assess systems by comparing software configurations and network services against known vulnerability repositories. While these tools effectively identify known vulnerabilities, they remain limited in detecting zero-day attacks and previously unseen threats [5,6]. Several studies report that signature-based scanners frequently generate false-positive alerts and face challenges in large-scale enterprise environments [4].
2.2. Vulnerability Detection vs. Vulnerability Prioritization
It is important to distinguish between two related but distinct tasks in AI-driven cybersecurity. Vulnerability detection (or software vulnerability discovery) identifies previously unknown defects in source code or binary artifacts by analyzing code structure, control-flow graphs, or semantic program representations [3,7,8,9]. The output is a binary label indicating whether a code artifact contains a vulnerability. In contrast, vulnerability prioritization operates on publicly disclosed CVE records and ranks them by their likelihood of active exploitation and organizational impact. The input is structured vulnerability metadata (CVSS attributes, EPSS scores, and patch availability), and the output is an ordered risk list that guides remediation decisions. FVPM addresses the prioritization task exclusively and should not be compared with detection-focused models on source-code benchmarks. Section 2.4 and Table 1 highlight this distinction in the survey of prior work.
2.3. Deep Learning for Vulnerability Analysis
Deep learning has attracted considerable attention for vulnerability detection and prioritization. VulDeePecker introduced a framework that automatically learns semantic vulnerability representations from source code and significantly outperforms traditional static analysis methods [3]. Subsequent frameworks such as SySeVR and Devign further improved detection performance by incorporating semantic code representations and graph-based program analysis [7,8]. Transformer-based models including CodeBERT, GraphCodeBERT, CodeT5, LineVul, and VulBERTa have demonstrated strong performance across software vulnerability tasks [9,10,11,12,13]. Despite their effectiveness, these models primarily operate in centralized settings and require access to raw code or vulnerability records, limiting applicability to privacy-sensitive organizational environments.
2.4. Federated Learning in Cybersecurity
Federated learning enables multiple organizations to jointly train models without sharing raw data [2]. The Federated Averaging (FedAvg) algorithm has become the de facto standard for distributed model aggregation, while FedProx introduced a proximal regularization term to improve stability under non-IID data distributions [14].
Recent studies have applied federated learning to intrusion detection, malware analysis, threat intelligence sharing, and anomaly detection, demonstrating competitive predictive performance while preserving organizational privacy [15]. Secure aggregation protocols [16] provide cryptographic guarantees that even the aggregation server cannot reconstruct individual client model updates, strengthening the privacy assurances of the FedAvg paradigm. FVPM adopts the honest-but-curious server assumption in its current form; integration of secure aggregation is identified as future work. Fang et al. [17] proposed a federated learning architecture for comprehensive Android malware detection across distributed clients without sharing raw samples. Xue et al. [18] proposed RobustPPFL, a secure and robust privacy-preserving federated learning framework against poisoning attacks under non-IID distributions. Zhang et al. [19] designed LSFL, a lightweight and secure federated learning scheme for edge computing environments that reduces communication overhead while preserving data privacy. However, relatively limited attention has been devoted to vulnerability prioritization and management using federated learning, particularly in the context of large-scale vulnerability intelligence datasets combining NVD and EPSS.
2.5. Exploit Prediction Scoring System
The Exploit Prediction Scoring System (EPSS) provides machine-learning-derived probability estimates of the likelihood that a disclosed vulnerability will be exploited in the wild within 30 days [20]. Unlike CVSS, which measures theoretical severity, EPSS captures real-world exploitability dynamics informed by observed exploitation activity. EPSS directly models attack probability: its score represents the empirical probability of active exploitation observed across OSINT sources and threat-intelligence feeds. This makes EPSS the closest available proxy to the confirmed-exploitation ground truth used to define HighRisk labels in FVPM (KEV ∪ ExploitDB ∪ Metasploit), which explains its dominant contribution in the grid-search weight optimization and SHAP analysis. Quantifying attack success probability is a challenge shared across security domains: Pljonkin et al. [21] model the probability of successful non-classical attacks on quantum key distribution (QKD) calibration processes, while Pljonkin et al. [22] analyze interception probability in QKD synchronization channels. FVPM adopts an analogous probabilistic framing for the CVE domain, using EPSS as the empirical attack-probability measure for classical network vulnerabilities. Recent studies have demonstrated that EPSS provides superior vulnerability triage performance compared with CVSS-only strategies [20]. Our work extends these findings by embedding EPSS within a federated prioritization framework and quantifying its relative contribution through grid-search weight optimization and SHAP analysis.
2.6. Research Gap
Table 1 summarizes representative AI-based vulnerability analysis approaches. Existing systems primarily rely on centralized learning architectures, do not incorporate confirmed-exploitation labeling strategies, and lack systematic privacy trade-off analysis. Recent CVE prioritization work by Le et al. [23] has advanced ML-based risk ranking using NVD metadata, but remains centralized and does not incorporate EPSS exploitability intelligence or federated learning for privacy-preserving multi-organizational deployment. Caruccio et al. [24] provide a multi-criteria categorization of federated learning approaches relevant to collaborative cybersecurity settings. Furthermore, no prior work evaluates EPSS integration within a federated prioritization mechanism using grid-search weight optimization. The proposed FVPM framework addresses these gaps.
Table 1.
Representative AI-based vulnerability analysis studies and comparison with the proposed FVPM framework. Task: D = Detection (code-level), P = Prioritization (CVE-level).
3. FVPM Architecture
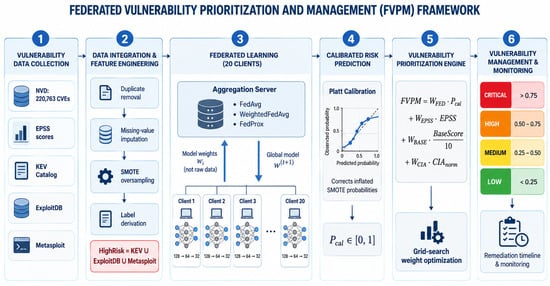
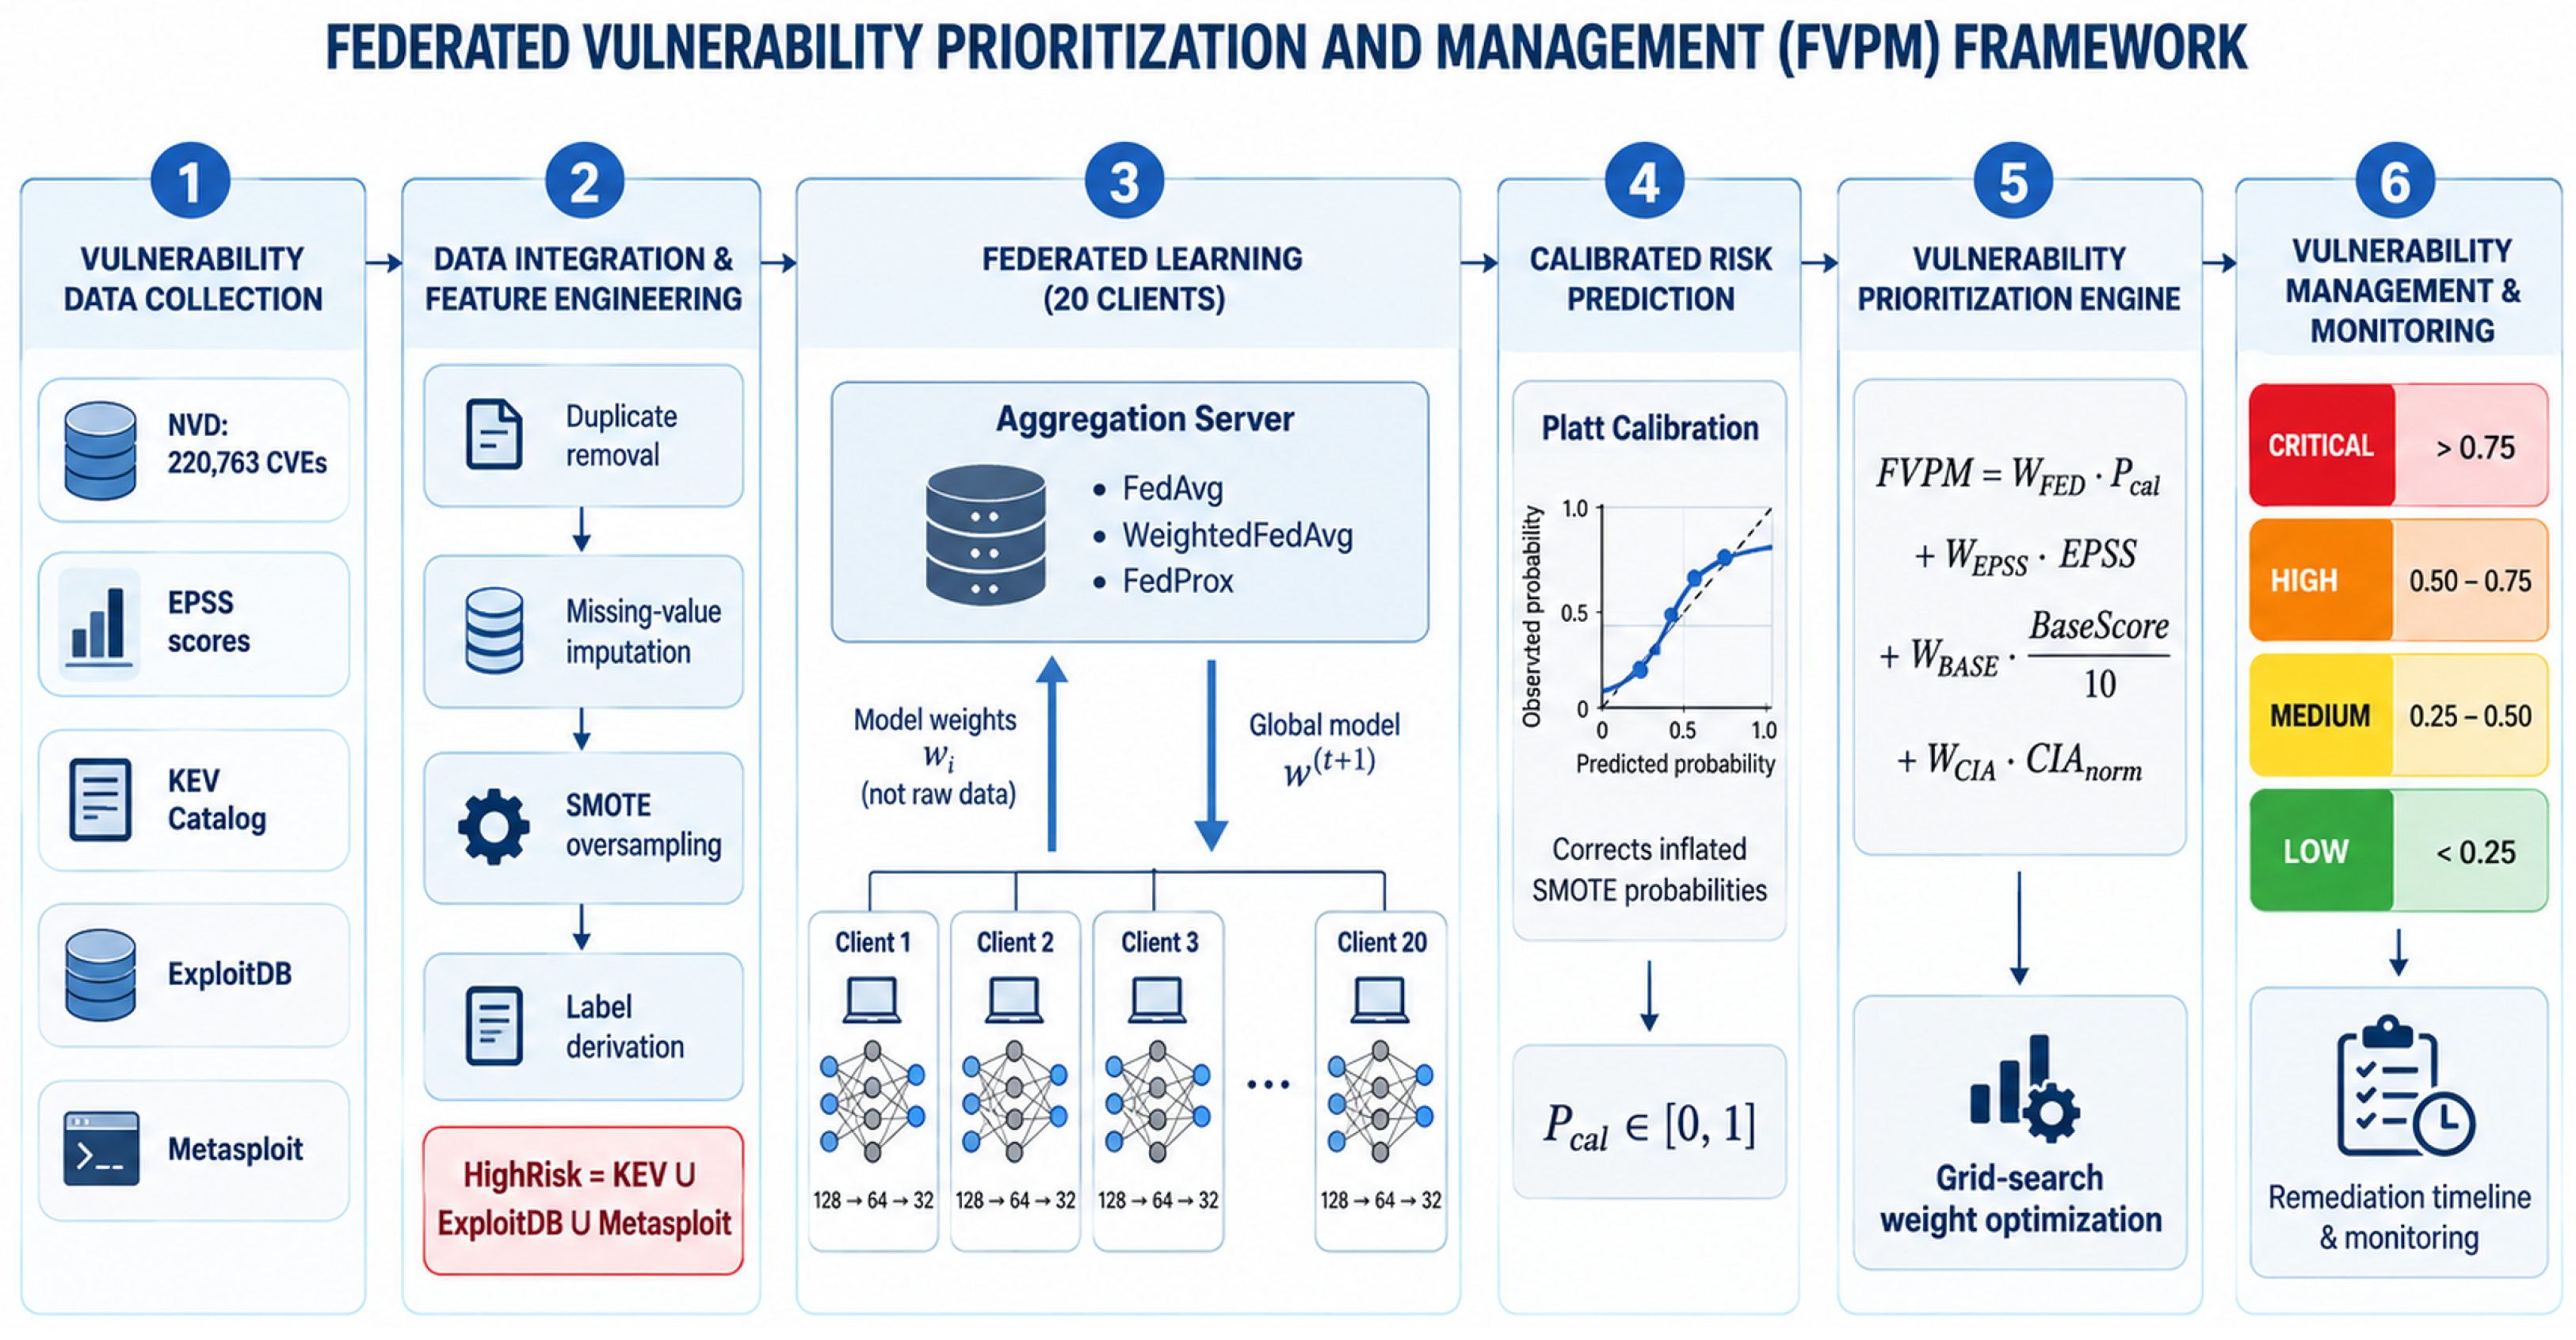
The proposed FVPM framework integrates vulnerability intelligence, federated learning, and risk-aware prioritization within a decentralized architecture. As illustrated in Figure 1, the framework consists of six interconnected modules: (1) Vulnerability Data Collection, (2) Data Integration and Feature Engineering, (3) Federated Learning, (4) Calibrated Risk Prediction, (5) Vulnerability Prioritization Engine, and (6) Vulnerability Management and Monitoring.
Figure 1.
Architecture of the proposed Federated Vulnerability Prioritization and Management (FVPM) framework.
3.1. Vulnerability Data Collection Layer
NVD CVE records and EPSS scores are collected and merged using the CVE identifier as a common key. The resulting dataset contains 220,763 vulnerability records enriched with CVSS metrics, attack vectors, impact scores, and EPSS exploitability probabilities.
3.2. Data Integration and Feature Engineering Layer
Raw vulnerability records are preprocessed through duplicate removal, missing-value imputation, categorical encoding, and feature normalization.
EPSS percentile values and the HighRisk label are excluded from model input features to prevent target leakage. The raw EPSS score is retained as a legitimate model input feature, since high-risk labels are derived from confirmed exploitation evidence (KEV, ExploitDB, and Metasploit) rather than from EPSS values directly, avoiding any circular dependency. Confirmed-exploitation labels are derived from the union of three authoritative sources: the CISA Known Exploited Vulnerabilities (KEV) catalog, ExploitDB, and the Metasploit Framework. This strategy identifies 4528 high-risk vulnerabilities (2.05% prevalence) among the 220,763 CVE records.
3.3. Federated Learning Layer
Each participating organization trains a local VulnerabilityMLP model on its private vulnerability dataset and transmits only model parameters to the aggregation server. The server aggregates parameters using FedAvg, WeightedFedAvg, or FedProx and redistributes the updated global model to clients for subsequent communication rounds. The complete data flow is as follows: (1) each organization maintains a local dataset of CVE records enriched with CVSS attributes and EPSS scores—no raw records leave the local environment; (2) local VulnerabilityMLP parameters are trained on for epochs, and the resulting weight tensor is transmitted to the aggregation server; (3) the server computes the aggregate from without accessing any local data; (4) the global model is broadcast to all clients; (5) after convergence, Platt calibration is applied on a held-out validation set to correct probability overestimation from SMOTE; (6) the calibrated global model generates per-CVE risk probabilities that feed into the FVPM composite score.
3.4. Calibrated Risk Prediction Layer
Raw federated prediction probabilities are corrected using Platt scaling (logistic calibration) to account for the systematic probability overestimation introduced by SMOTE oversampling. SMOTE inflates the minority class prevalence from the true 2.05% to 50% during training, causing the uncalibrated model to assign inflated risk scores. Platt calibration restores the predicted probabilities to deployment-representative magnitudes.
3.5. Vulnerability Prioritization Engine
Calibrated federated predictions are combined with EPSS scores, normalized CVSS BaseScore, and CIA impact scores to generate a composite FVPM prioritization score. Optimal weight combinations are determined through systematic grid search.
3.6. Vulnerability Management and Monitoring Layer
Prioritized vulnerabilities are classified into Critical, High, Medium, and Low levels and accompanied by actionable remediation recommendations. The monitoring layer continuously updates the asset inventory and rescans modified assets to maintain real-time security visibility.
4. Federated Learning and Risk Prioritization Methodology
4.1. Federated Learning Formulation
Assume N participating organizations maintain private local datasets
where denotes the vulnerability dataset maintained by client i and never leaves the local environment. Equation (1) formalizes the decentralized data assumption: raw CVE records are partitioned across N organizations, and no individual record from any is transmitted to the aggregation server or to other clients at any point during the federated training procedure.
Each client minimizes a local objective
where denotes the Focal Loss function. Equation (2) defines the local empirical risk minimization objective: each client learns to predict vulnerability risk exclusively from its own CVE records, minimizing average Focal Loss to handle the 2.05% minority-class prevalence. Only the resulting weight tensor —not the training data—leaves the client after local optimization. Local parameters are updated by gradient descent
with learning rate . Equation (3) describes one local gradient-descent step: each client updates its local model in the direction that reduces the loss in Equation (2), using learning rate to control step size. Multiple such steps ( epochs) are executed per communication round before the updated weights are sent to the server.
4.2. Federated Aggregation Strategies
Three aggregation strategies are evaluated.
4.2.1. Federated Averaging (FedAvg)
The global model is updated as the dataset-size-weighted mean of local parameters [2]:
Equation (4) demonstrates how the locally trained parameters — each produced by minimizing the local objective in Equation (2) — are combined at the server into a single global model . The aggregation weight gives clients with more local vulnerability records proportionally greater influence on the global model, providing a data-volume-proportional consensus without exposing any raw CVE record to the aggregation server. This makes FedAvg the privacy-preserving analog of ordinary centralized gradient averaging.
4.2.2. Weighted Federated Averaging (WeightedFedAvg)
WeightedFedAvg extends FedAvg by incorporating local validation loss as an additional aggregation weight, providing adaptive emphasis on clients with higher local uncertainty
where denotes the local validation loss of client i after local training at round t, and down-weights clients with higher loss (lower confidence). In our experiments, WeightedFedAvg produces results identical to FedAvg (PR-AUC = 0.4428), because the feature-skewed non-IID partitioning strategy assigns similarly sized local datasets to all clients (mean: ≈7727 records per client; see Section 5.2). Under uniform dataset sizes, the loss-based weighting term acts as a near-constant scaling factor that does not meaningfully differentiate aggregation from the standard dataset-size-only weighting of FedAvg. This confirms FedAvg’s sufficiency for the non-IID vulnerability data distribution considered here.
4.2.3. FedProx
FedProx augments the local objective with a proximal regularization term [14]
where the proximal coefficient is set to following parameter tuning.
4.3. VulnerabilityMLP Architecture
The shared model architecture, VulnerabilityMLP, is a three-layer multilayer perceptron designed for binary high-risk prediction
with hidden dimensions , batch normalization (BN), and dropout rate at each layer.
4.4. Class Imbalance Handling
The dataset exhibits severe class imbalance (HighRisk: 2.05%). Two complementary strategies are employed.
SMOTE: Synthetic minority oversampling generates artificial high-risk examples in the training feature space to balance the class distribution prior to federated training.
Focal Loss: The Focal Loss function [25] down-weights easy negatives and focuses gradient updates on difficult, misclassified examples
with and .
4.5. Platt Calibration of Federated Predictions
SMOTE training inflates minority class prevalence from 2.05% to 50%, causing the model to assign systematically elevated risk probabilities at deployment. Platt calibration fits a logistic regression model on a held-out validation set to map uncalibrated federated logits to deployment-representative probabilities
where denotes the raw federated output logit, and A, B are learned calibration parameters. Calibration quality is evaluated using the Brier score () and the Expected Calibration Error (ECE), computed on the held-out validation set before and after applying Platt scaling. The role of calibration in deployment is discussed in Section 6.
4.6. FVPM Composite Prioritization Score
The final vulnerability prioritization score combines four risk signals
subject to . The FVPM composite score (Equation (10)) linearly combines four complementary risk signals: (calibrated federated model probability, capturing local organizational vulnerability patterns), EPSS (empirical attack probability from threat intelligence feeds), BaseScore/10 (normalized CVSS severity), and CIAnorm (combined confidentiality, integrity, and availability impact). Together, these signals provide a multi-faceted risk estimate that compensates for the limitations of any single signal: EPSS covers exploitation likelihood, CVSS covers technical severity, CIA covers organizational impact, and the federated component integrates privacy-preserving local context. Optimal weights are determined by exhaustive grid search over the simplex for each component, optimizing PR-AUC on the held-out validation set.
The resulting score is normalized to and used to classify each vulnerability into one of four priority levels: Critical (>0.75), High (>0.50 to 0.75), Medium (–), and Low (<0.25).
4.7. Algorithm
Algorithm 1 summarizes the complete FVPM procedure.
| Algorithm 1 FVPM: Federated Vulnerability Prioritization and Management |
|
5. Experimental Setup
5.1. Dataset
The dataset integrates 220,763 CVE records from the National Vulnerability Database (NVD) with EPSS exploitability scores matched by CVE identifier. High-risk labels are derived from confirmed exploitation evidence across three sources: the CISA KEV catalog, ExploitDB, and the Metasploit Framework. This confirmed-exploitation strategy yields 4528 high-risk vulnerabilities (2.05% prevalence). Table 2 summarizes the data sources.
Table 2.
Datasets used in experiments.
5.2. Federated Client Simulation
The dataset was partitioned across 20 simulated clients using a feature-skewed non-IID strategy in which each client receives a biased sample weighted toward particular vulnerability attribute combinations. Table 3 summarizes the resulting client distribution. The more than 20-fold variation in high-risk prevalence (0.45–10.56%) creates a significantly more challenging federated learning environment than IID partitioning.
Table 3.
Summary of the 20-Client Non-IID Federated Distribution. Clients receive shares of the 70% training split only; the validation and test sets are held centrally for evaluation.
5.3. Evaluation Metrics
Given the severe class imbalance (2.05% positive rate), PR-AUC is used as the primary evaluation metric. Additional metrics include ROC-AUC, precision, recall, F1-score, and Matthews Correlation Coefficient (MCC):
5.4. Baseline Methods
The following baselines are evaluated under identical preprocessing, feature engineering, and evaluation conditions:
- Random Forest: 200 trees with balanced class weighting.
- XGBoost: Gradient-boosted trees with scale-pos-weight adjustment; used additionally as the backbone for SHAP explainability analysis.
- Centralized NN: VulnerabilityMLP trained on the full training set without federated partitioning.
- Federated NN (FedAvg/WeightedFedAvg/FedProx): VulnerabilityMLP trained under the 20-client non-IID federated environment.
5.5. Neural Network and Training Configuration
Table 4 summarizes the hyperparameter configuration used across all neural network experiments.
Table 4.
VulnerabilityMLP hyperparameters.
5.6. Implementation Environment
Experiments were conducted in the Google Colab runtime using Python 3.11 with PyTorch (≥2.1) for neural network training and Scikit-learn for preprocessing and baseline models. Federated aggregation was implemented as a custom FedAvg loop. Hardware: Google Colab with NVIDIA Tesla T4 GPU, 16 GB VRAM. During the preparation of this manuscript, the authors used ChatGPT (OpenAI, GPT-4) for the purposes of visual presentation and layout refinement of Figure 1. The authors have reviewed and edited the output and take full responsibility for the content of this publication. No AI tools were used for generating any experimental results, data analysis, or written text.
5.7. Reproducibility and Data Collection Timeline
To support reproducibility, Table 5 summarizes all key experimental parameters alongside the software environment. The NVD CVE dataset was collected via the NVD REST API (snapshot: 2026). EPSS scores (v3) were downloaded from FIRST.org (snapshot: 2026). KEV catalog entries were retrieved from the CISA catalog (snapshot: 2026). ExploitDB and Metasploit entries were matched by CVE identifier at the same snapshot date. All random operations use a fixed seed of 42 (Python, NumPy, PyTorch, and SMOTE).
Table 5.
Reproducibility summary: Software, hardware, and key hyperparameters.
6. Experimental Results and Discussion
6.1. Performance Comparison of All Models
Table 6 presents the predictive performance of all evaluated models on the held-out test set.
Table 6.
Performance comparison on the held-out test set (≈33,115 CVEs = 15% stratified split; HighRisk Prevalence = 2.05%). EPSS (standalone) and FVPM Composite are included as non-ML baselines.
Note on EPSS standalone vs. ML models. EPSS standalone achieves PR-AUC = 0.4772, placing it above the federated models (FedAvg: 0.4428) but below XGBoost (0.5220) and Centralized NN (0.6005). This confirms that the ML models—particularly the centralized baseline—add genuine discriminative value over a direct EPSS ranking. The grid-search result () reflects that, among the four-component composite weight configurations, EPSS contributes the most to the FVPM composite score; it does not imply that federated learning adds no value. The VulnerabilityMLP provides risk estimates for newly disclosed CVEs where EPSS has not yet published a score (typically, 1–7 days after disclosure, when EPSS values are near zero) and enables privacy-preserving inference on local organizational asset inventories without exposing which CVEs are deployed—a capability not provided by a direct EPSS lookup. The very high recall (0.9127) but low precision (0.1369) of EPSS standalone at the Youden threshold further illustrates that EPSS alone produces many false positives in practice, reinforcing the value of the composite FVPM scoring mechanism for balanced prioritization.
Centralized and tree-based baselines achieve higher PR-AUC than federated variants (Random Forest: 0.4961, XGBoost: 0.5220, Centralized NN: 0.6005 vs. FedAvg: 0.4428), reflecting the expected performance trade-off of privacy-preserving federated training. FedAvg and WeightedFedAvg achieve an identical PR-AUC = 0.4428. FedProx achieves a marginally lower PR-AUC (0.4403).
The Centralized NN functions as a centralized baseline representing the upper bound achievable when raw vulnerability records from all organizations are pooled. This scenario is not attainable in practice for privacy-constrained collaborative settings and is therefore reported as a reference point rather than a performance target.
Federated Performance Gap. The difference in PR-AUC between the centralized baseline (≈0.6005) and the best federated configuration quantifies the federated performance gap at approximately ΔPR-AUC ≈ 0.16. This gap does not reflect a privacy cost in the formal differential-privacy sense; rather, it reflects the inherent information constraint of training on distributed, non-IID partitions without raw data sharing. Given the substantial organizational privacy benefit—no raw CVE records leave any participating organization—this performance gap represents an acceptable trade-off for real-world collaborative vulnerability intelligence.
Figure 2.
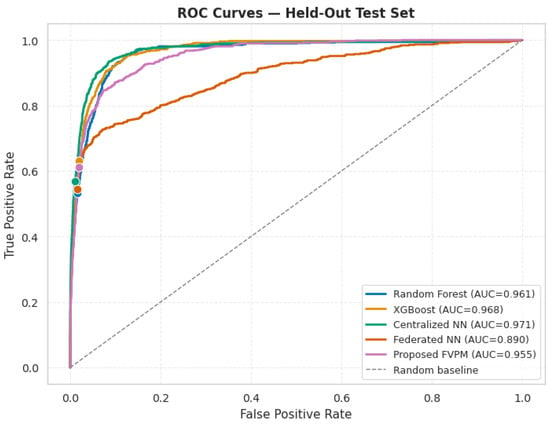
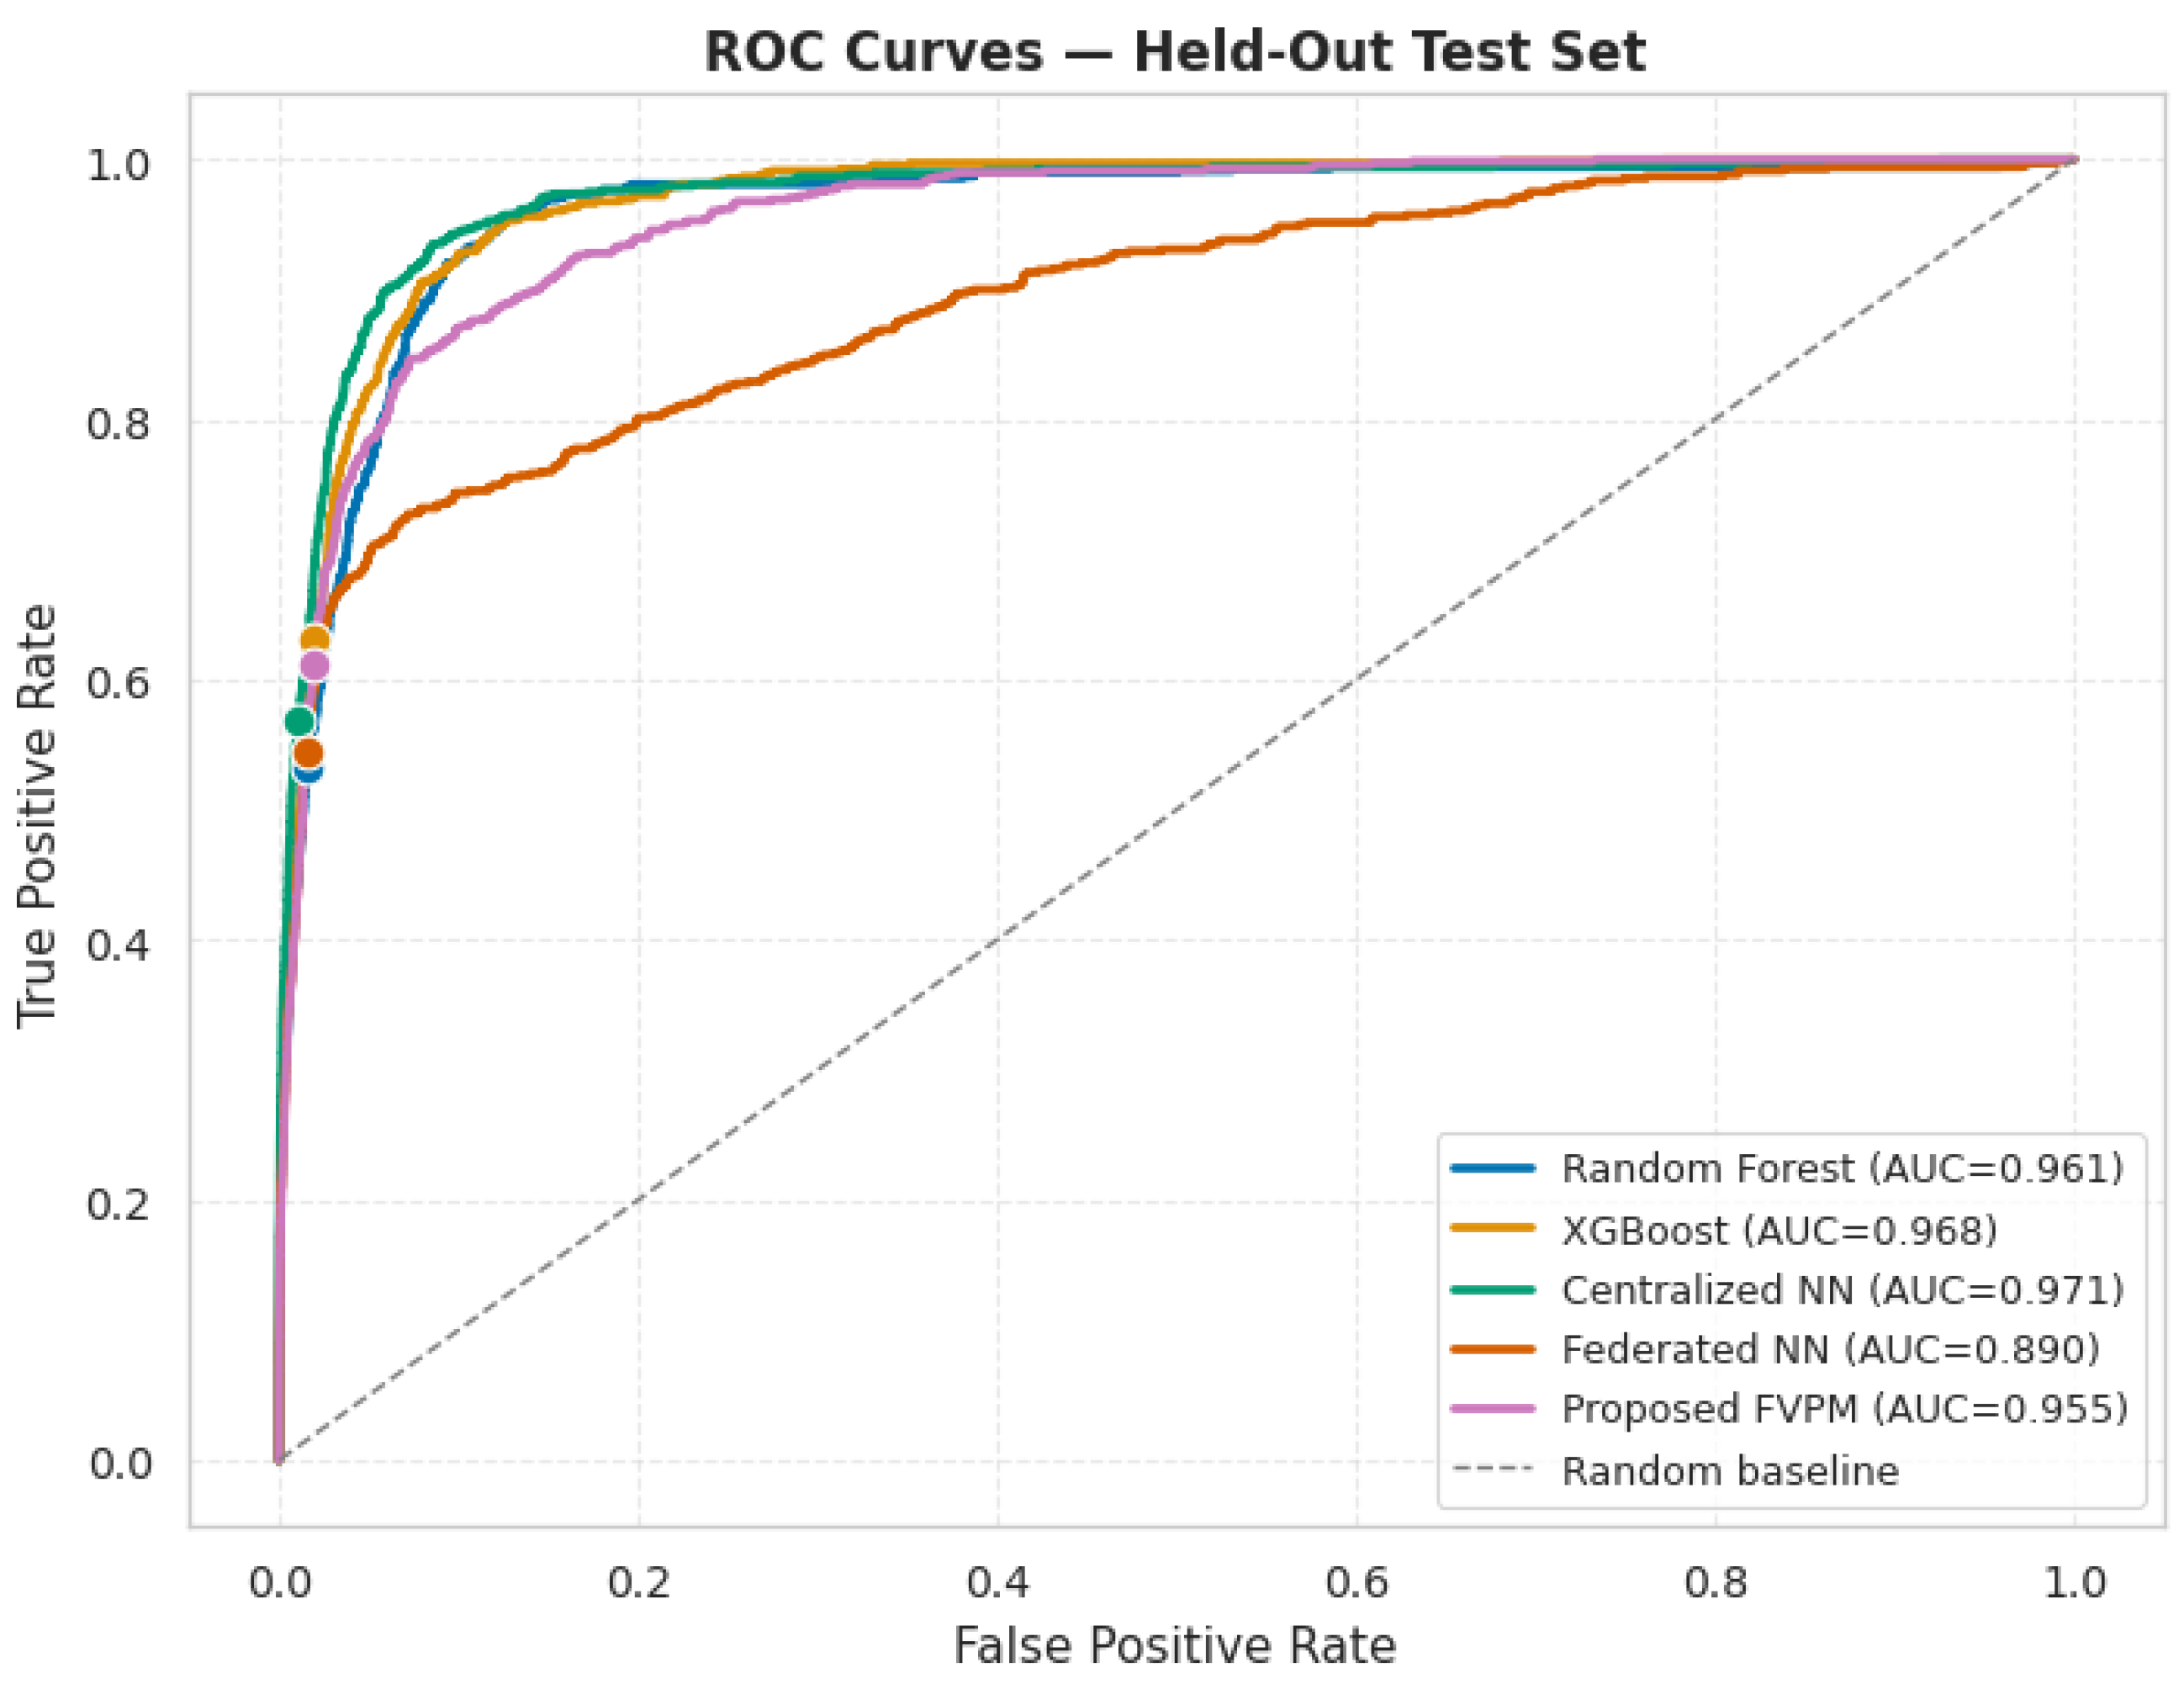
ROC curves for all evaluated models on the held-out test set. All hyperparameters are fixed per Table 4. Filled circles mark each model’s operating point at the Youden’s J optimal threshold.
Figure 3.
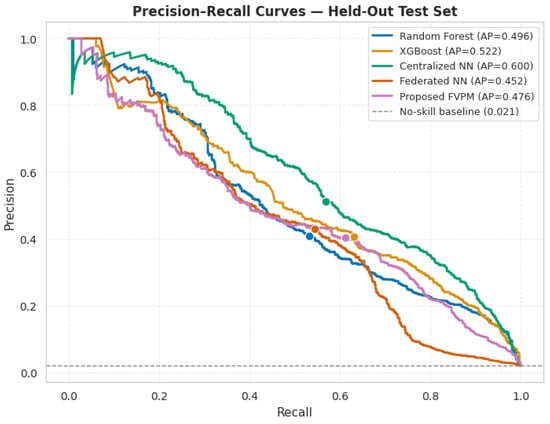
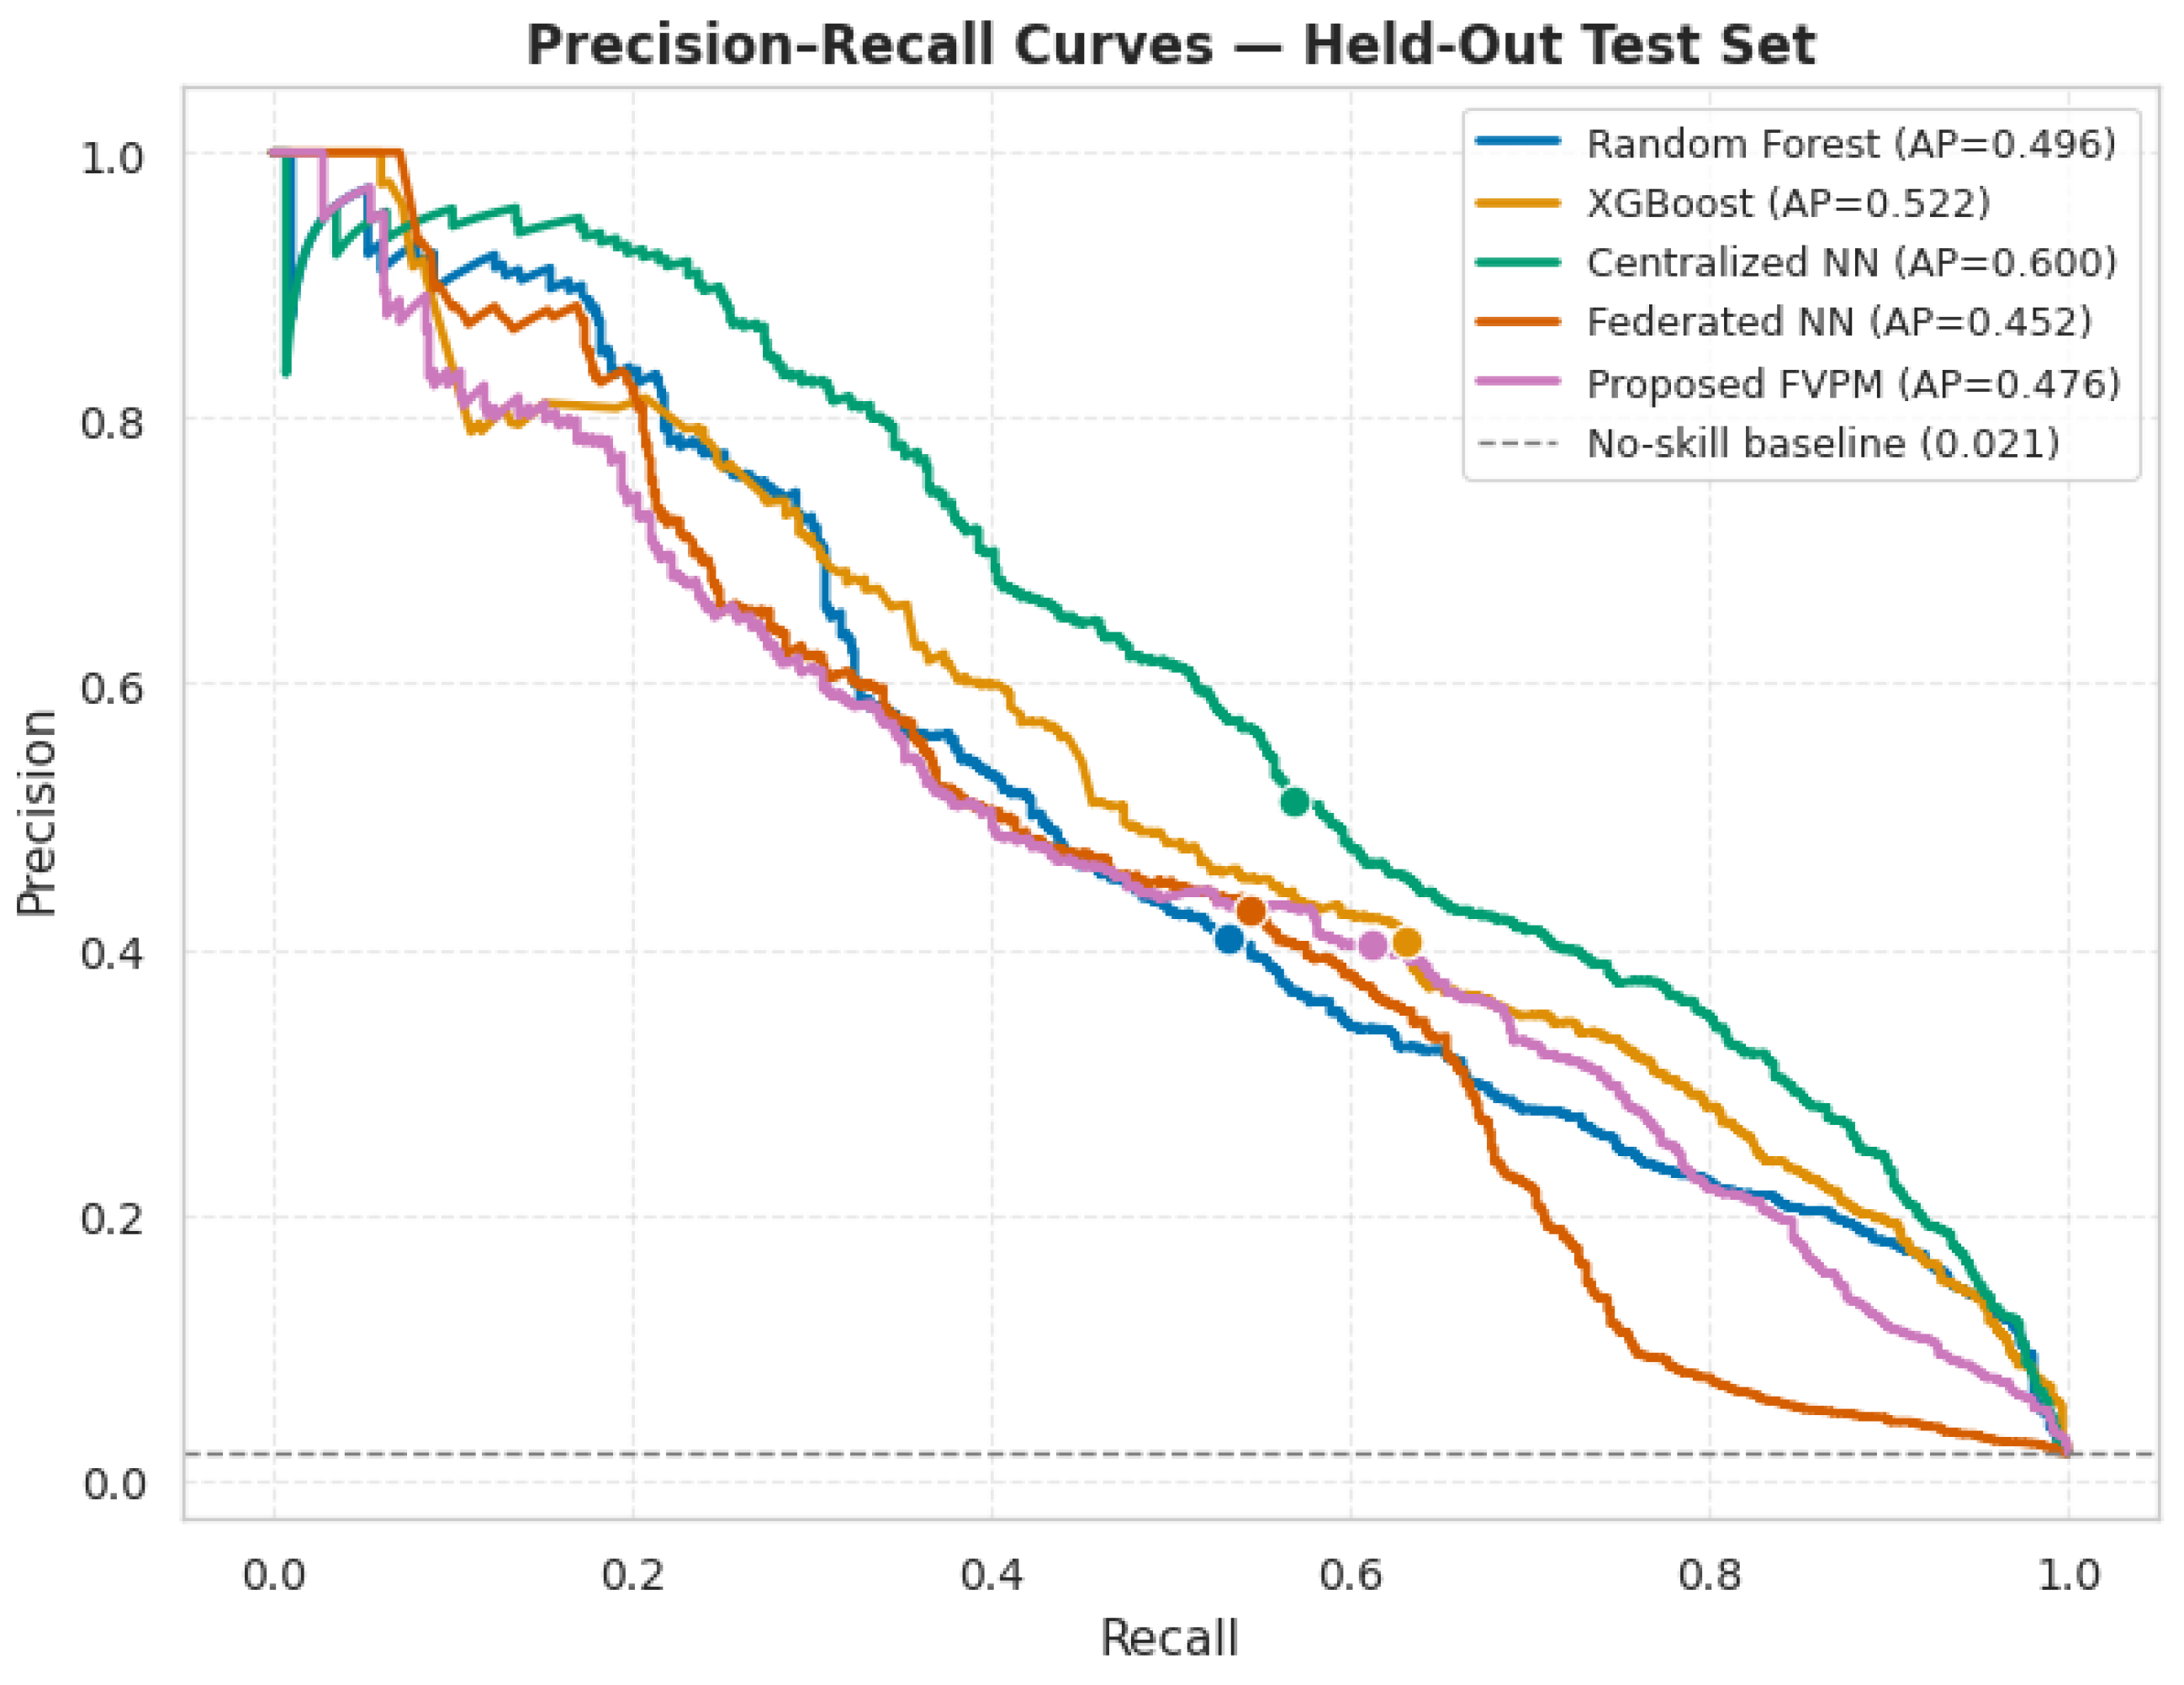
Precision–recall curves for all evaluated models on the held-out test set. All hyperparameters are fixed per Table 4. Filled circles mark each model’s operating point at the Youden’s J optimal threshold.
Figure 2 confirms that centralized and tree-based models achieve higher discrimination (ROC-AUC > 0.96) than federated variants (FedAvg/WeightedFedAvg: ROC-AUC = 0.8880), and that all models substantially outperform a random classifier. The lower federated ROC-AUC reflects the information constraint of non-IID decentralization rather than any architectural limitation of the VulnerabilityMLP.
Figure 3 illustrates the impact of class imbalance (2.05% positive rate): precision degrades rapidly at high recall for all models. Centralized NN (PR-AUC = 0.6005) dominates throughout the curve; XGBoost (0.5220) and EPSS standalone (0.4772) provide intermediate performance. FedAvg (PR-AUC = 0.4428) achieves competitive minority-class coverage given the additional constraint of decentralized non-IID training, confirming that the federated framework is viable for collaborative vulnerability prioritization.
6.2. Federated Aggregation Strategy Comparison
Table 7 presents a detailed comparison of the three federated aggregation strategies.
Table 7.
Federated aggregation strategy comparison (20 Clients, 20 Rounds, Non-IID).
Figure 4 shows that FedAvg and WeightedFedAvg converge to the same validation PR-AUC, proving the theoretical analysis in Section 4, which states that loss-based weighting of WeightedFedAvg reduces to standard FedAvg when client datasets are of similar sizes. FedProx converges slightly below both, showing that the proximal regularization term (μ = 0.001) introduces a mild bias for this moderate non-IID vulnerability distribution. The conclusion is that FedAvg is the recommended aggregation strategy for the FVPM framework.
Figure 4.
Federated aggregation strategy comparison: FedAvg, WeightedFedAvg, and FedProx ( = 0.001). Fixed parameters: 20 clients, 20 rounds, local epochs = 10, = (see Table 4).
6.3. Client Scalability Analysis
Table 8 presents FVPM performance under FedAvg across 5, 10, 15, and 20 federated clients.
Table 8.
Client scalability: FedAvg performance across federation sizes (20 Rounds, Non-IID).
PR-AUC decreases modestly from 0.4696 at 5 clients to 0.4428 at 20 clients (ΔPR-AUC = 0.0268). F1-score and MCC remain stable across all federation sizes (F1 ≈ 0.48, MCC ≈ 0.47), confirming that FVPM scales to realistic multi-organizational deployments without catastrophic performance degradation.
6.4. Federated Learning Convergence Analysis
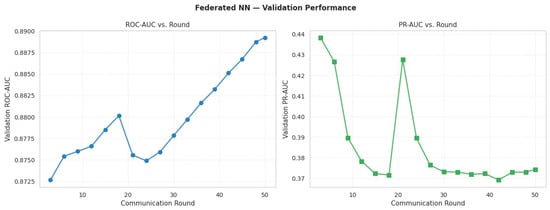
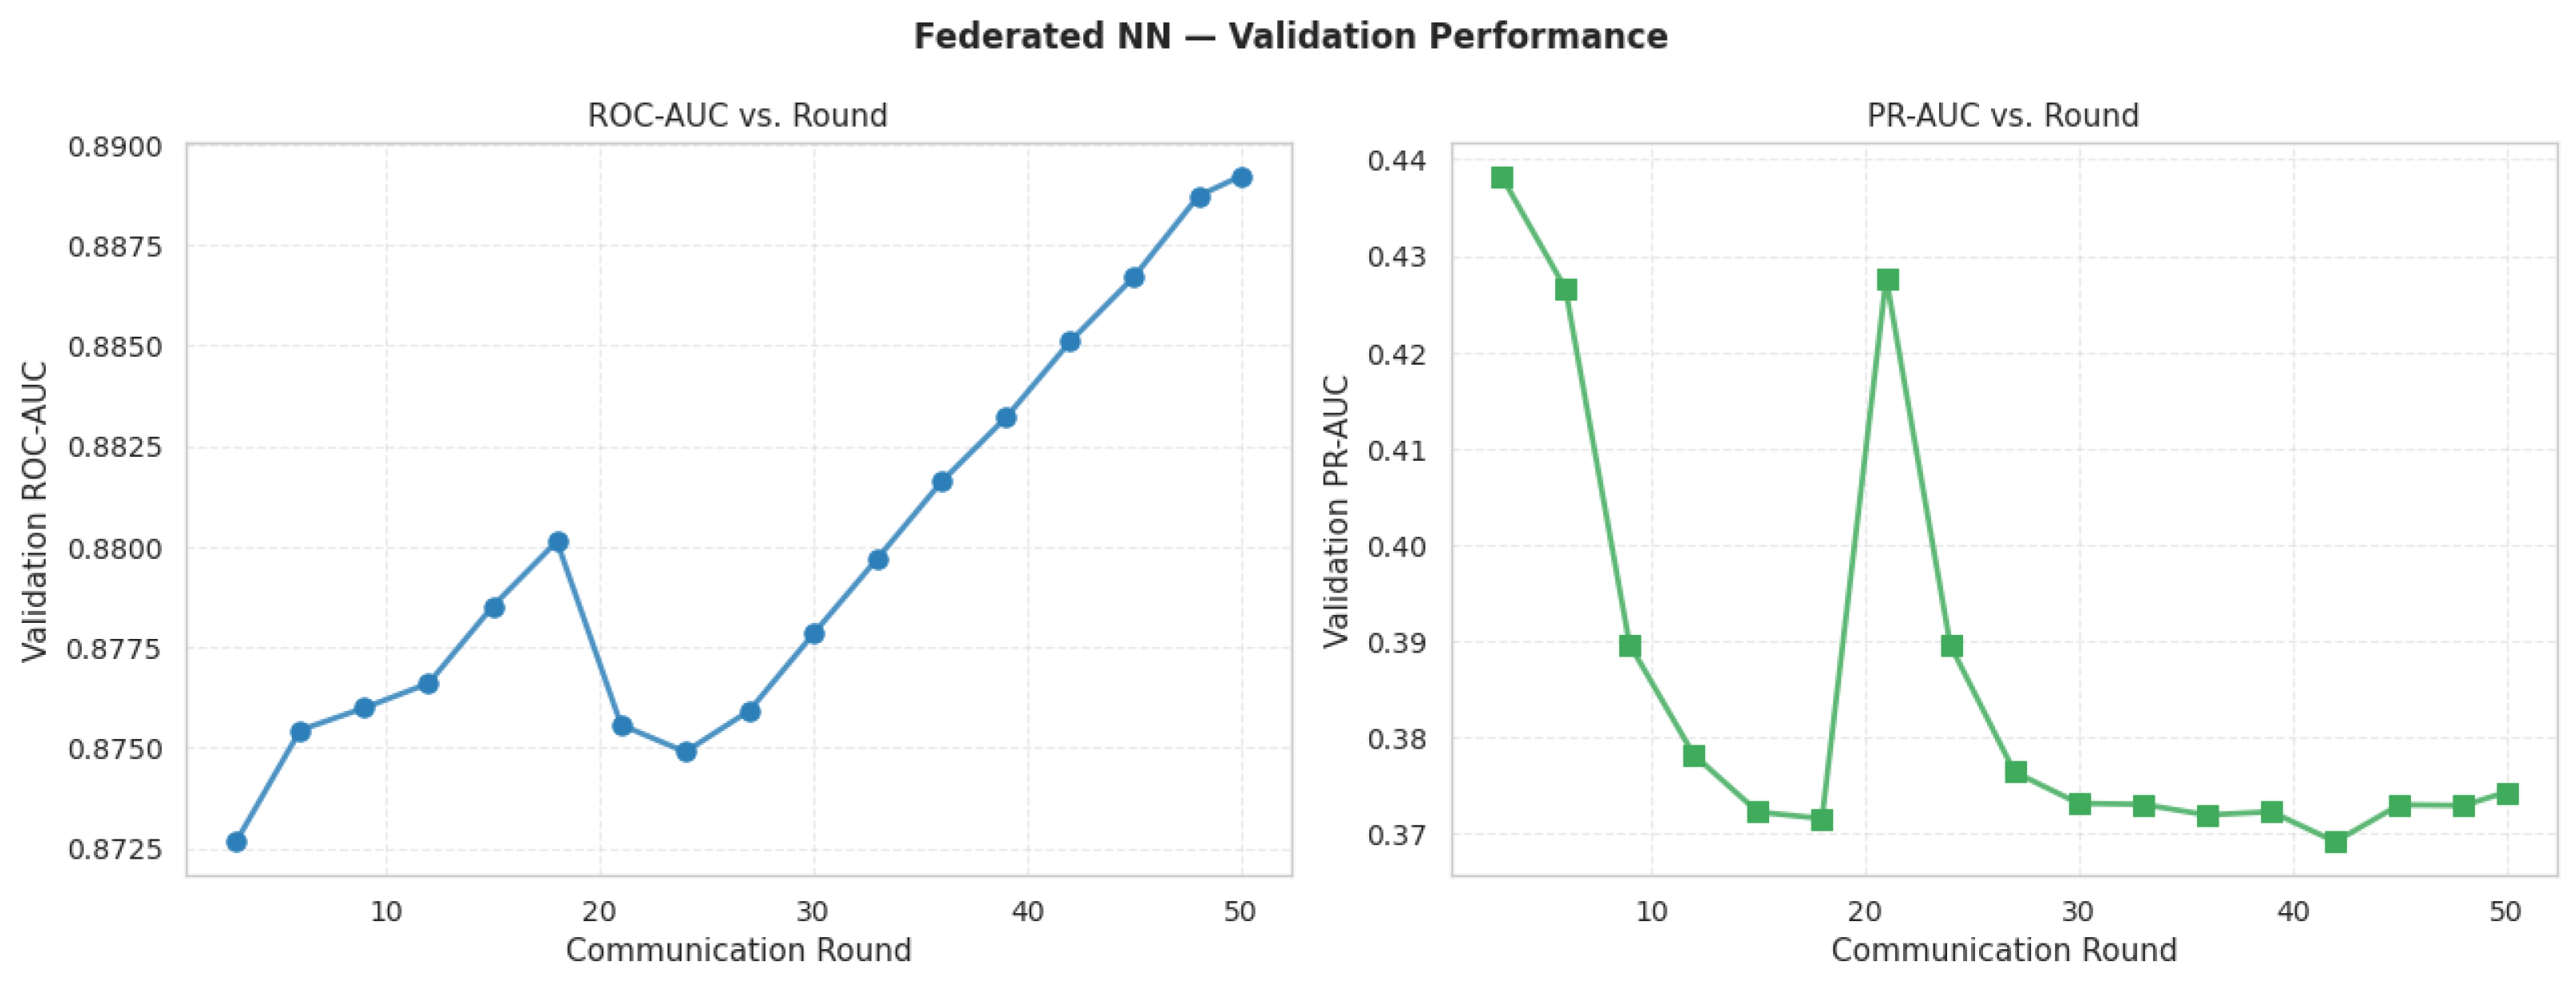
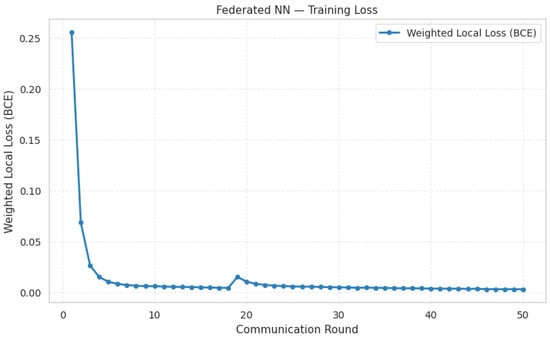
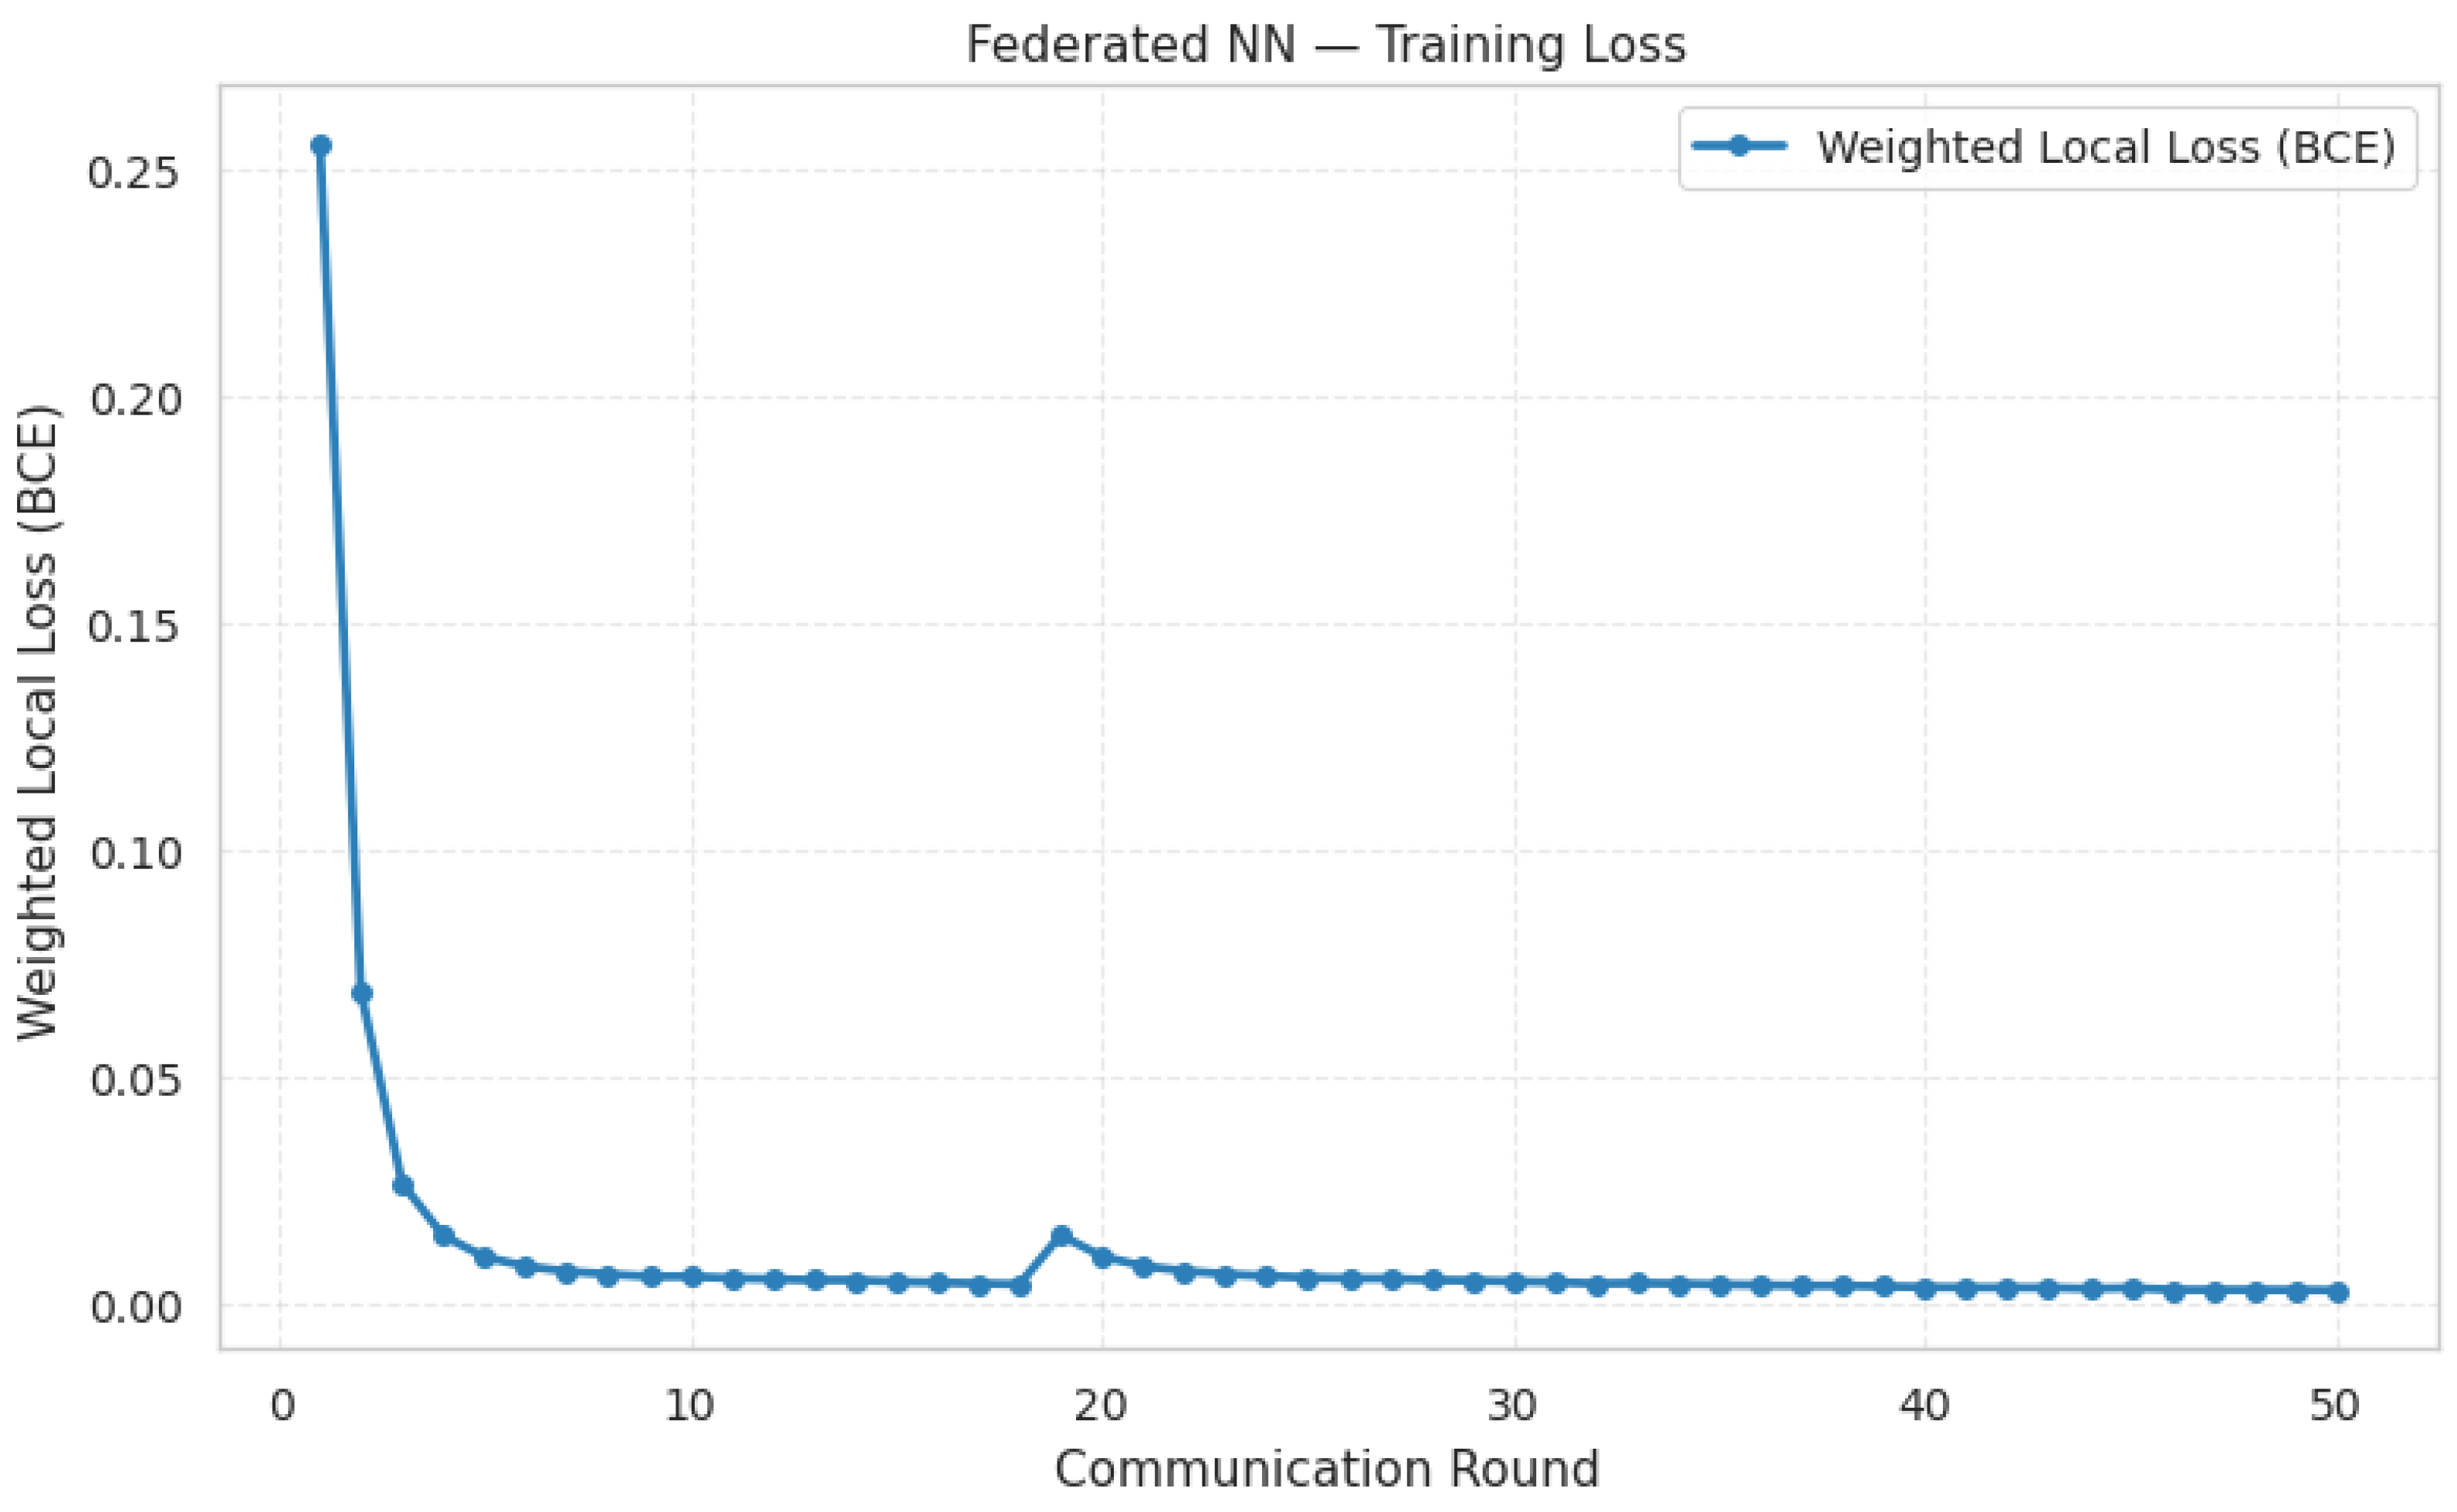
Figure 5 and Figure 6 present the training loss and validation AUC curves from the 50-round extended federated learning experiment.
Figure 5.
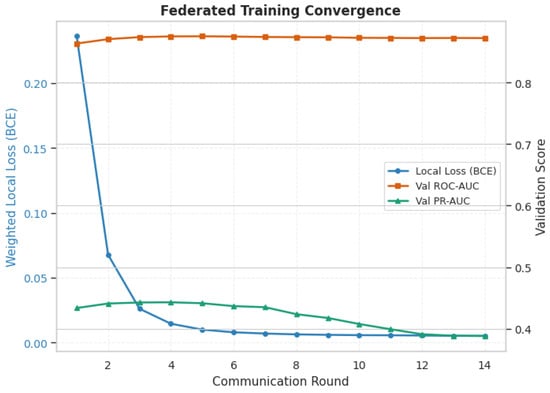
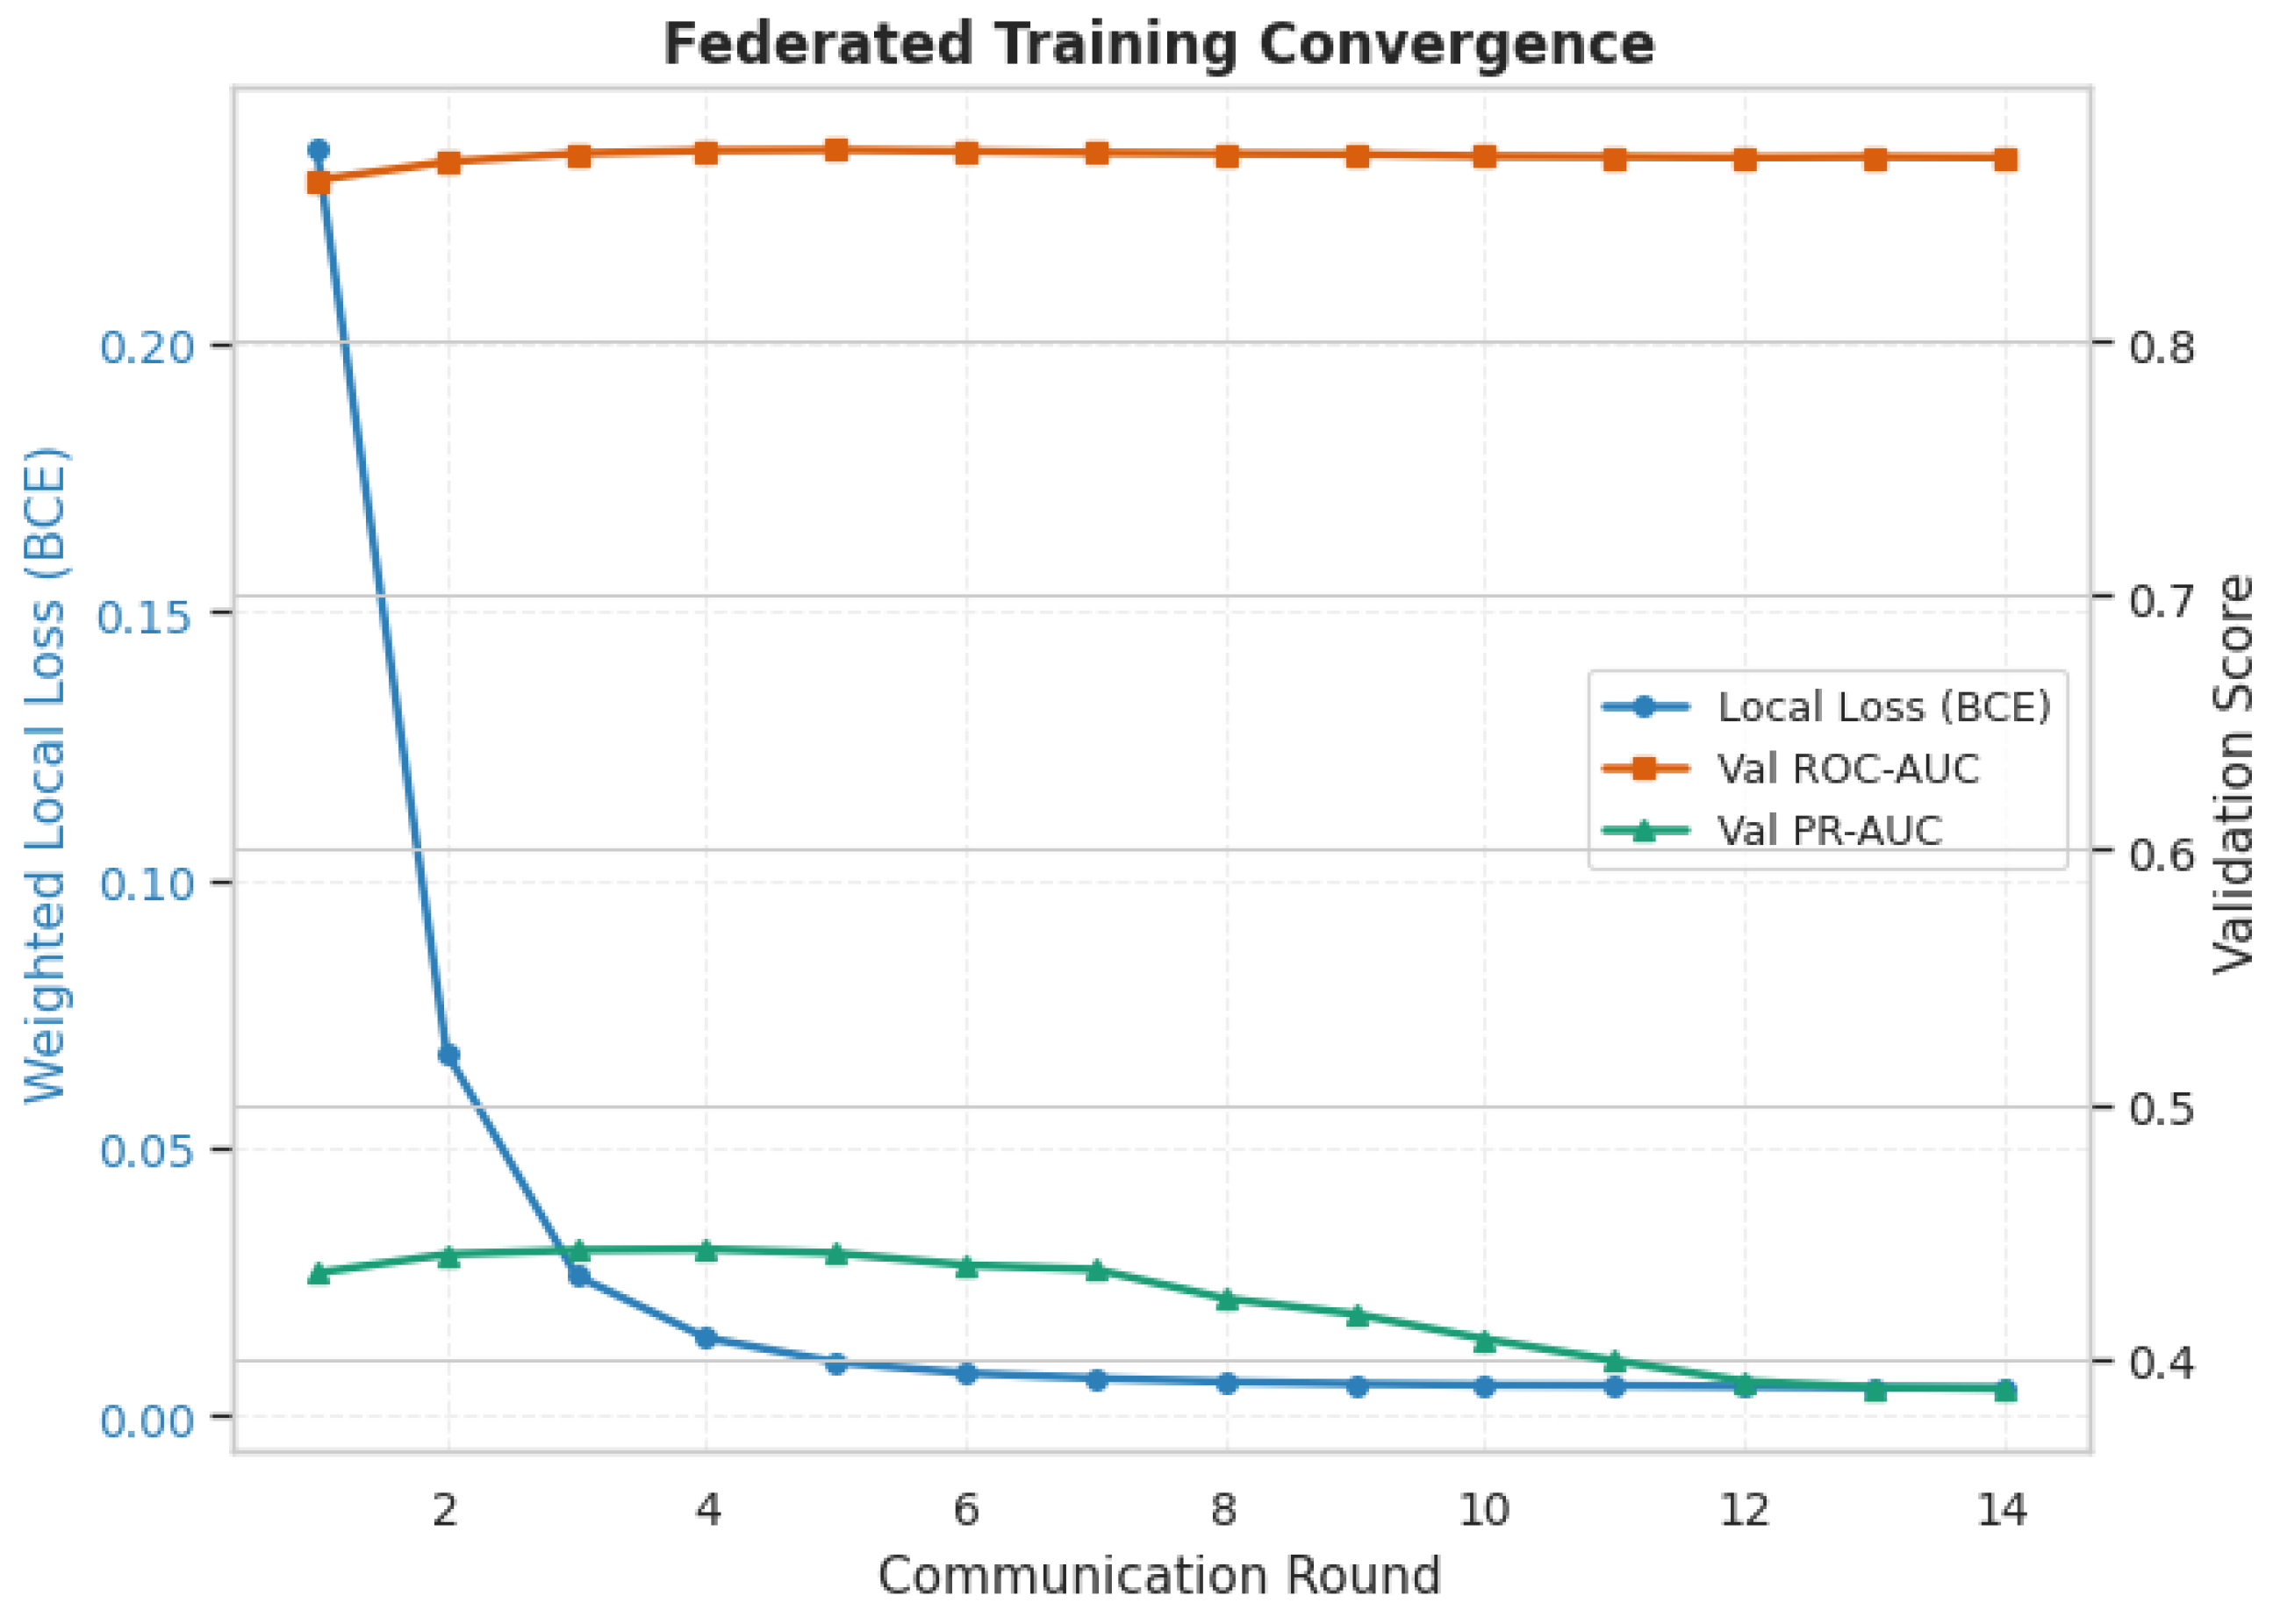
Federated training loss (Focal Loss) over 50 communication rounds. Fixed parameters: 20 clients, local epochs = 10, batch size = 128, = (Table 4).
Figure 6.
Validation ROC-AUC and PR-AUC over 50 communication rounds (FedAvg, 20 clients; fixed hyperparameters per Table 4). The model reaches near-peak validation PR-AUC by round 3 (PR-AUC = 0.4383) and achieves ROC-AUC = 0.8892 at round 50.
Figure 5 shows that the federated training loss decreases monotonically and stabilizes after approximately 10–15 communication rounds with all hyperparameters fixed (Table 4). This confirms that 20 rounds are sufficient for convergence in the standard federation experiments and that extending to 50 rounds does not yield substantially different training dynamics.
Figure 6 reveals a key convergence characteristic: PR-AUC plateaus early (round 3: 0.4383, round 50: 0.4428), while ROC-AUC continues improving gradually throughout the 50 rounds. This divergence is expected under severe class imbalance: ROC-AUC improves as the model better separates majority and minority classes in probability space, while PR-AUC is already near its ceiling because minority-class recall is difficult to improve further without sacrificing precision. The conclusion is that early stopping at 20 rounds is appropriate for practical FVPM deployments.
6.5. FVPM Grid Search Weight Optimization
The grid search identified as the optimal configuration, with all other weights set to zero. This finding demonstrates that EPSS alone achieves the highest composite prioritization score among all weight combinations. This result is consistent with EPSS’s design objective of directly predicting exploitation probability, which aligns closely with the confirmed-exploitation ground truth used to define HighRisk labels in this study.
6.6. Explainability Analysis
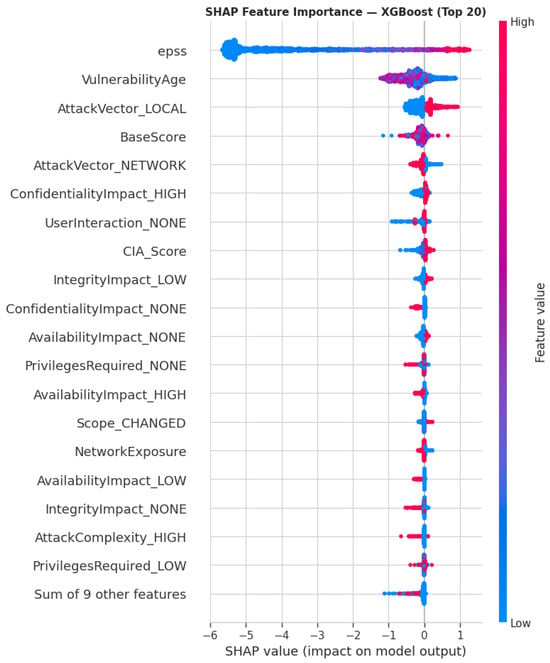
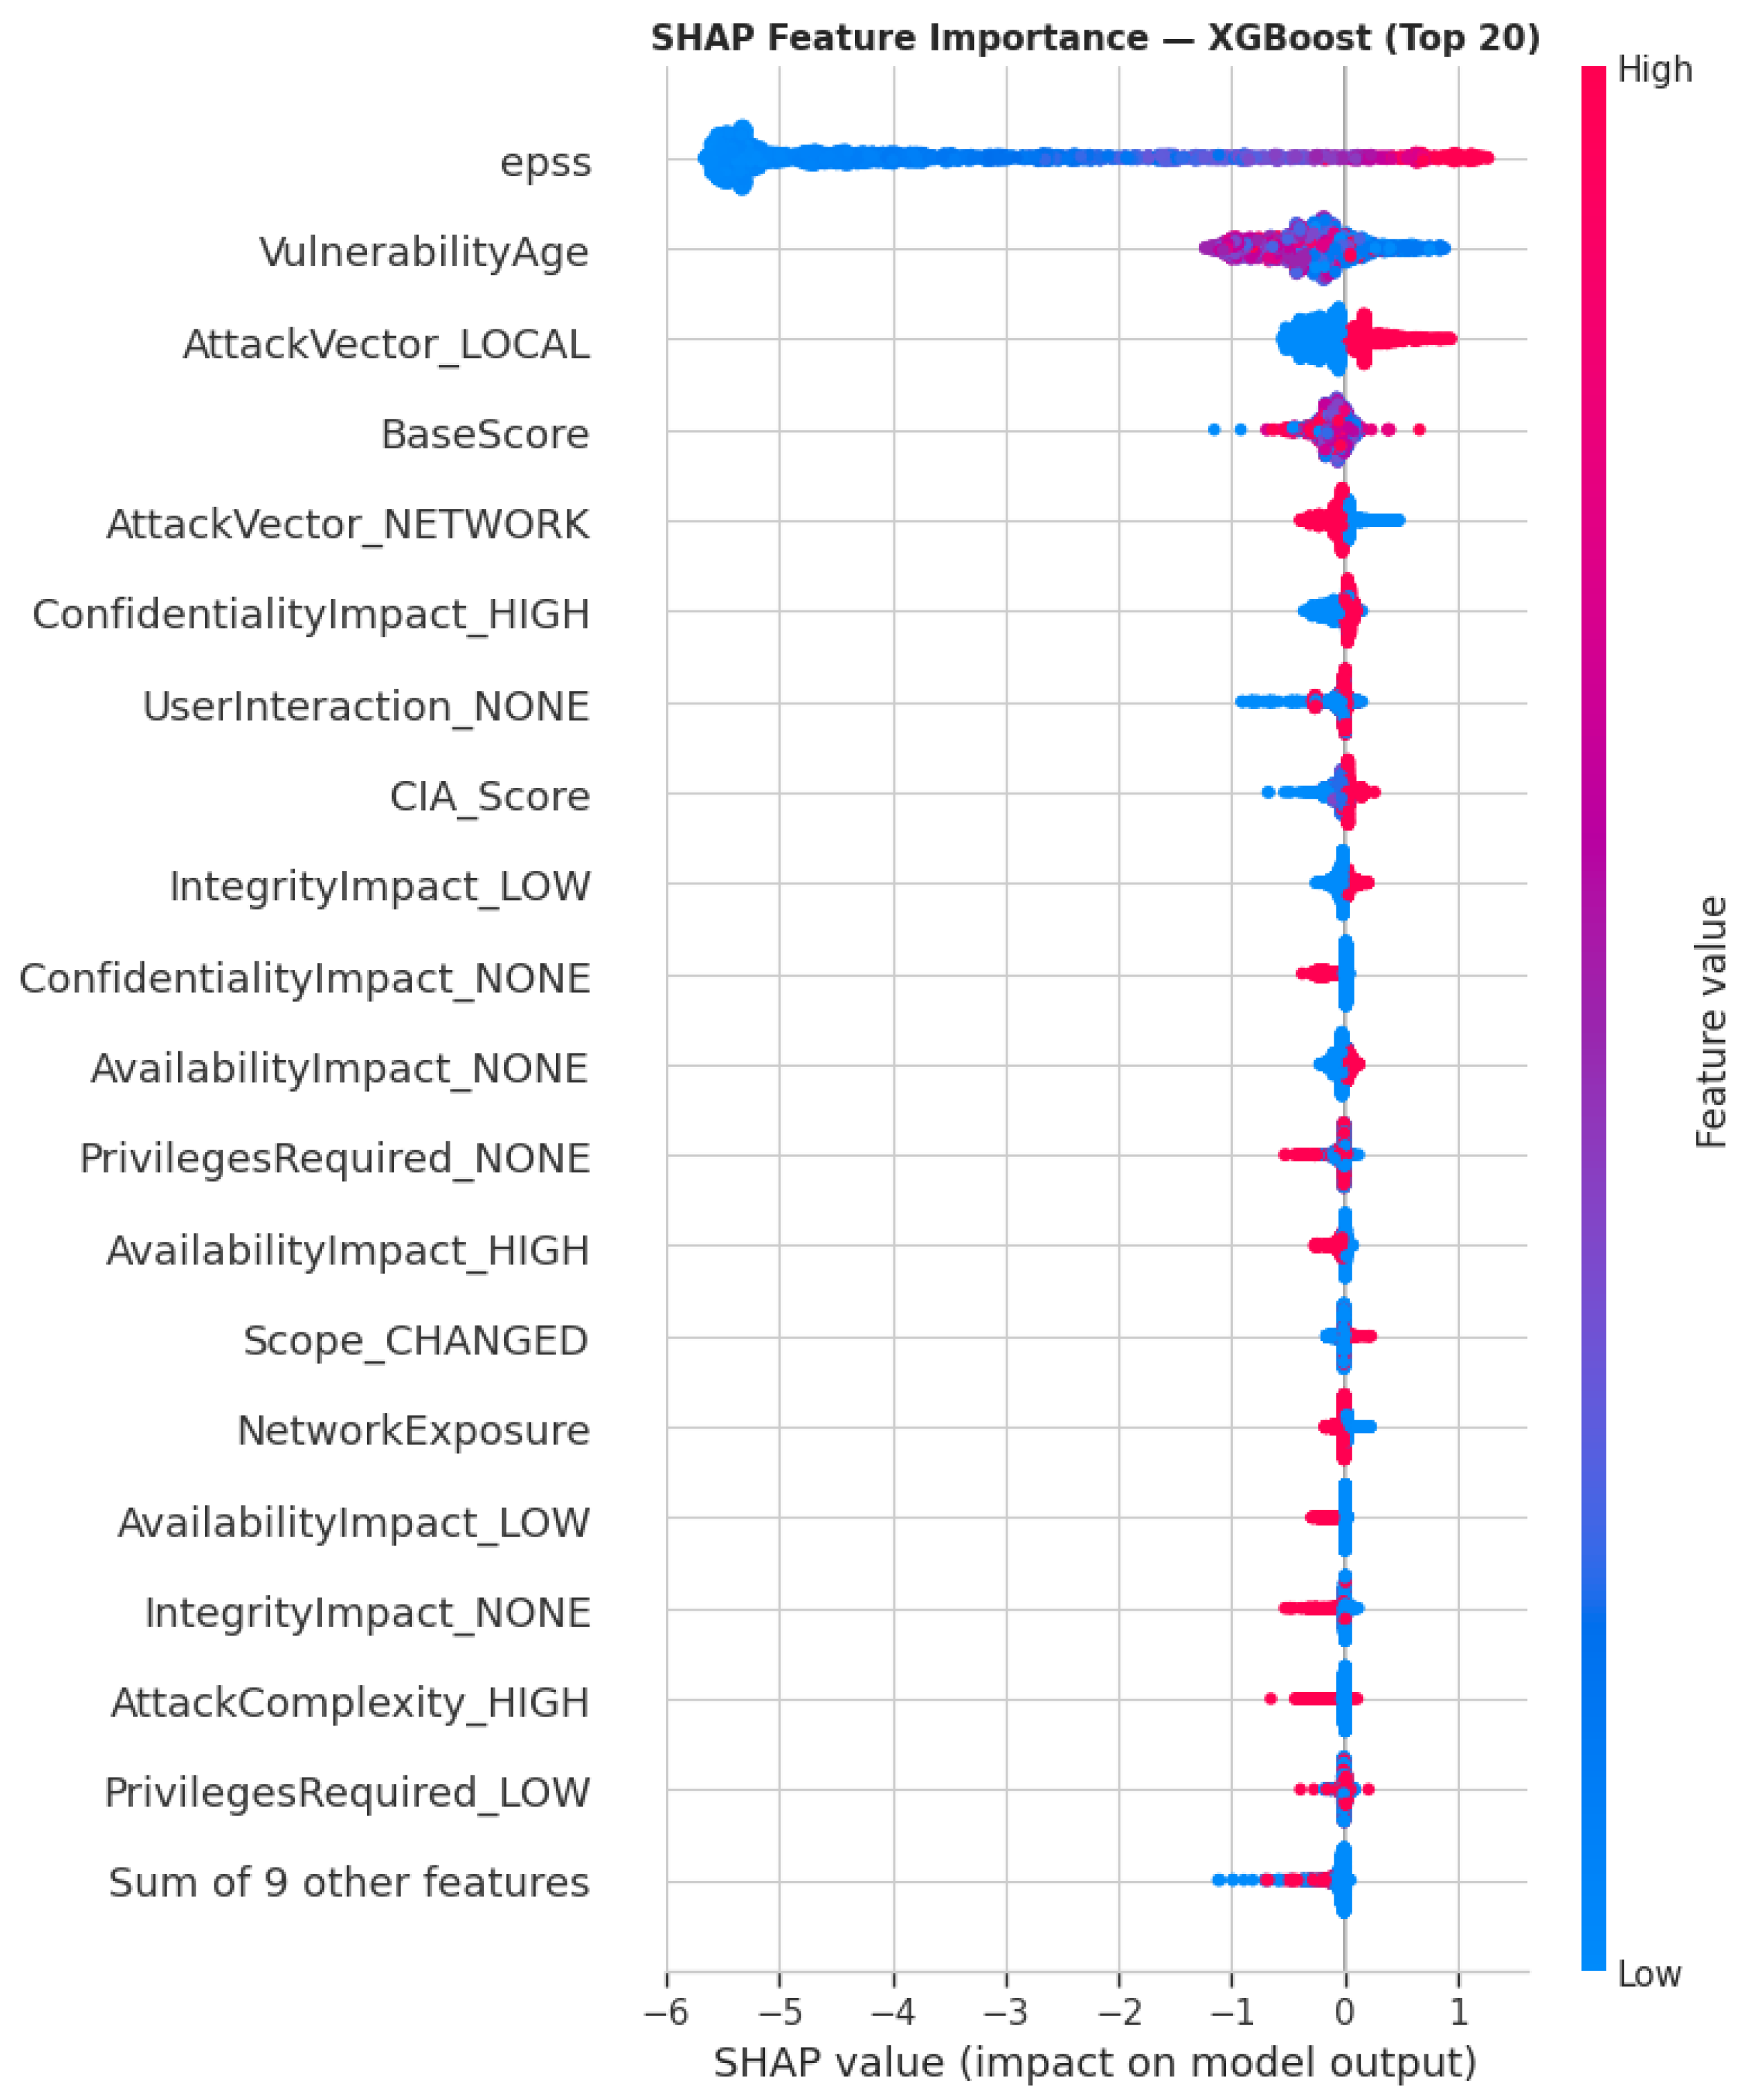
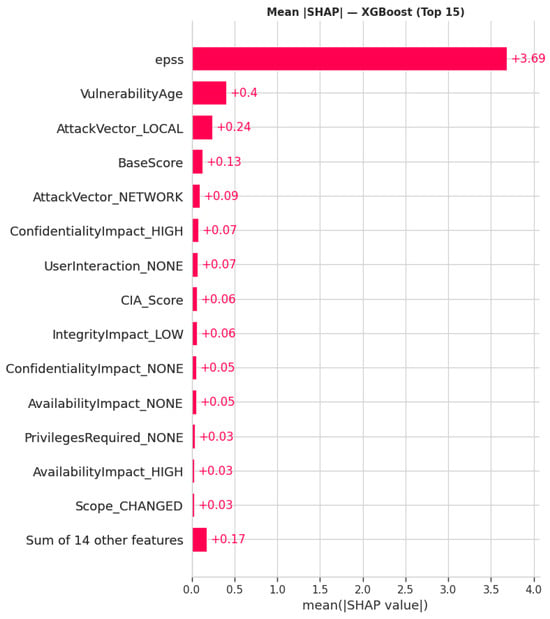
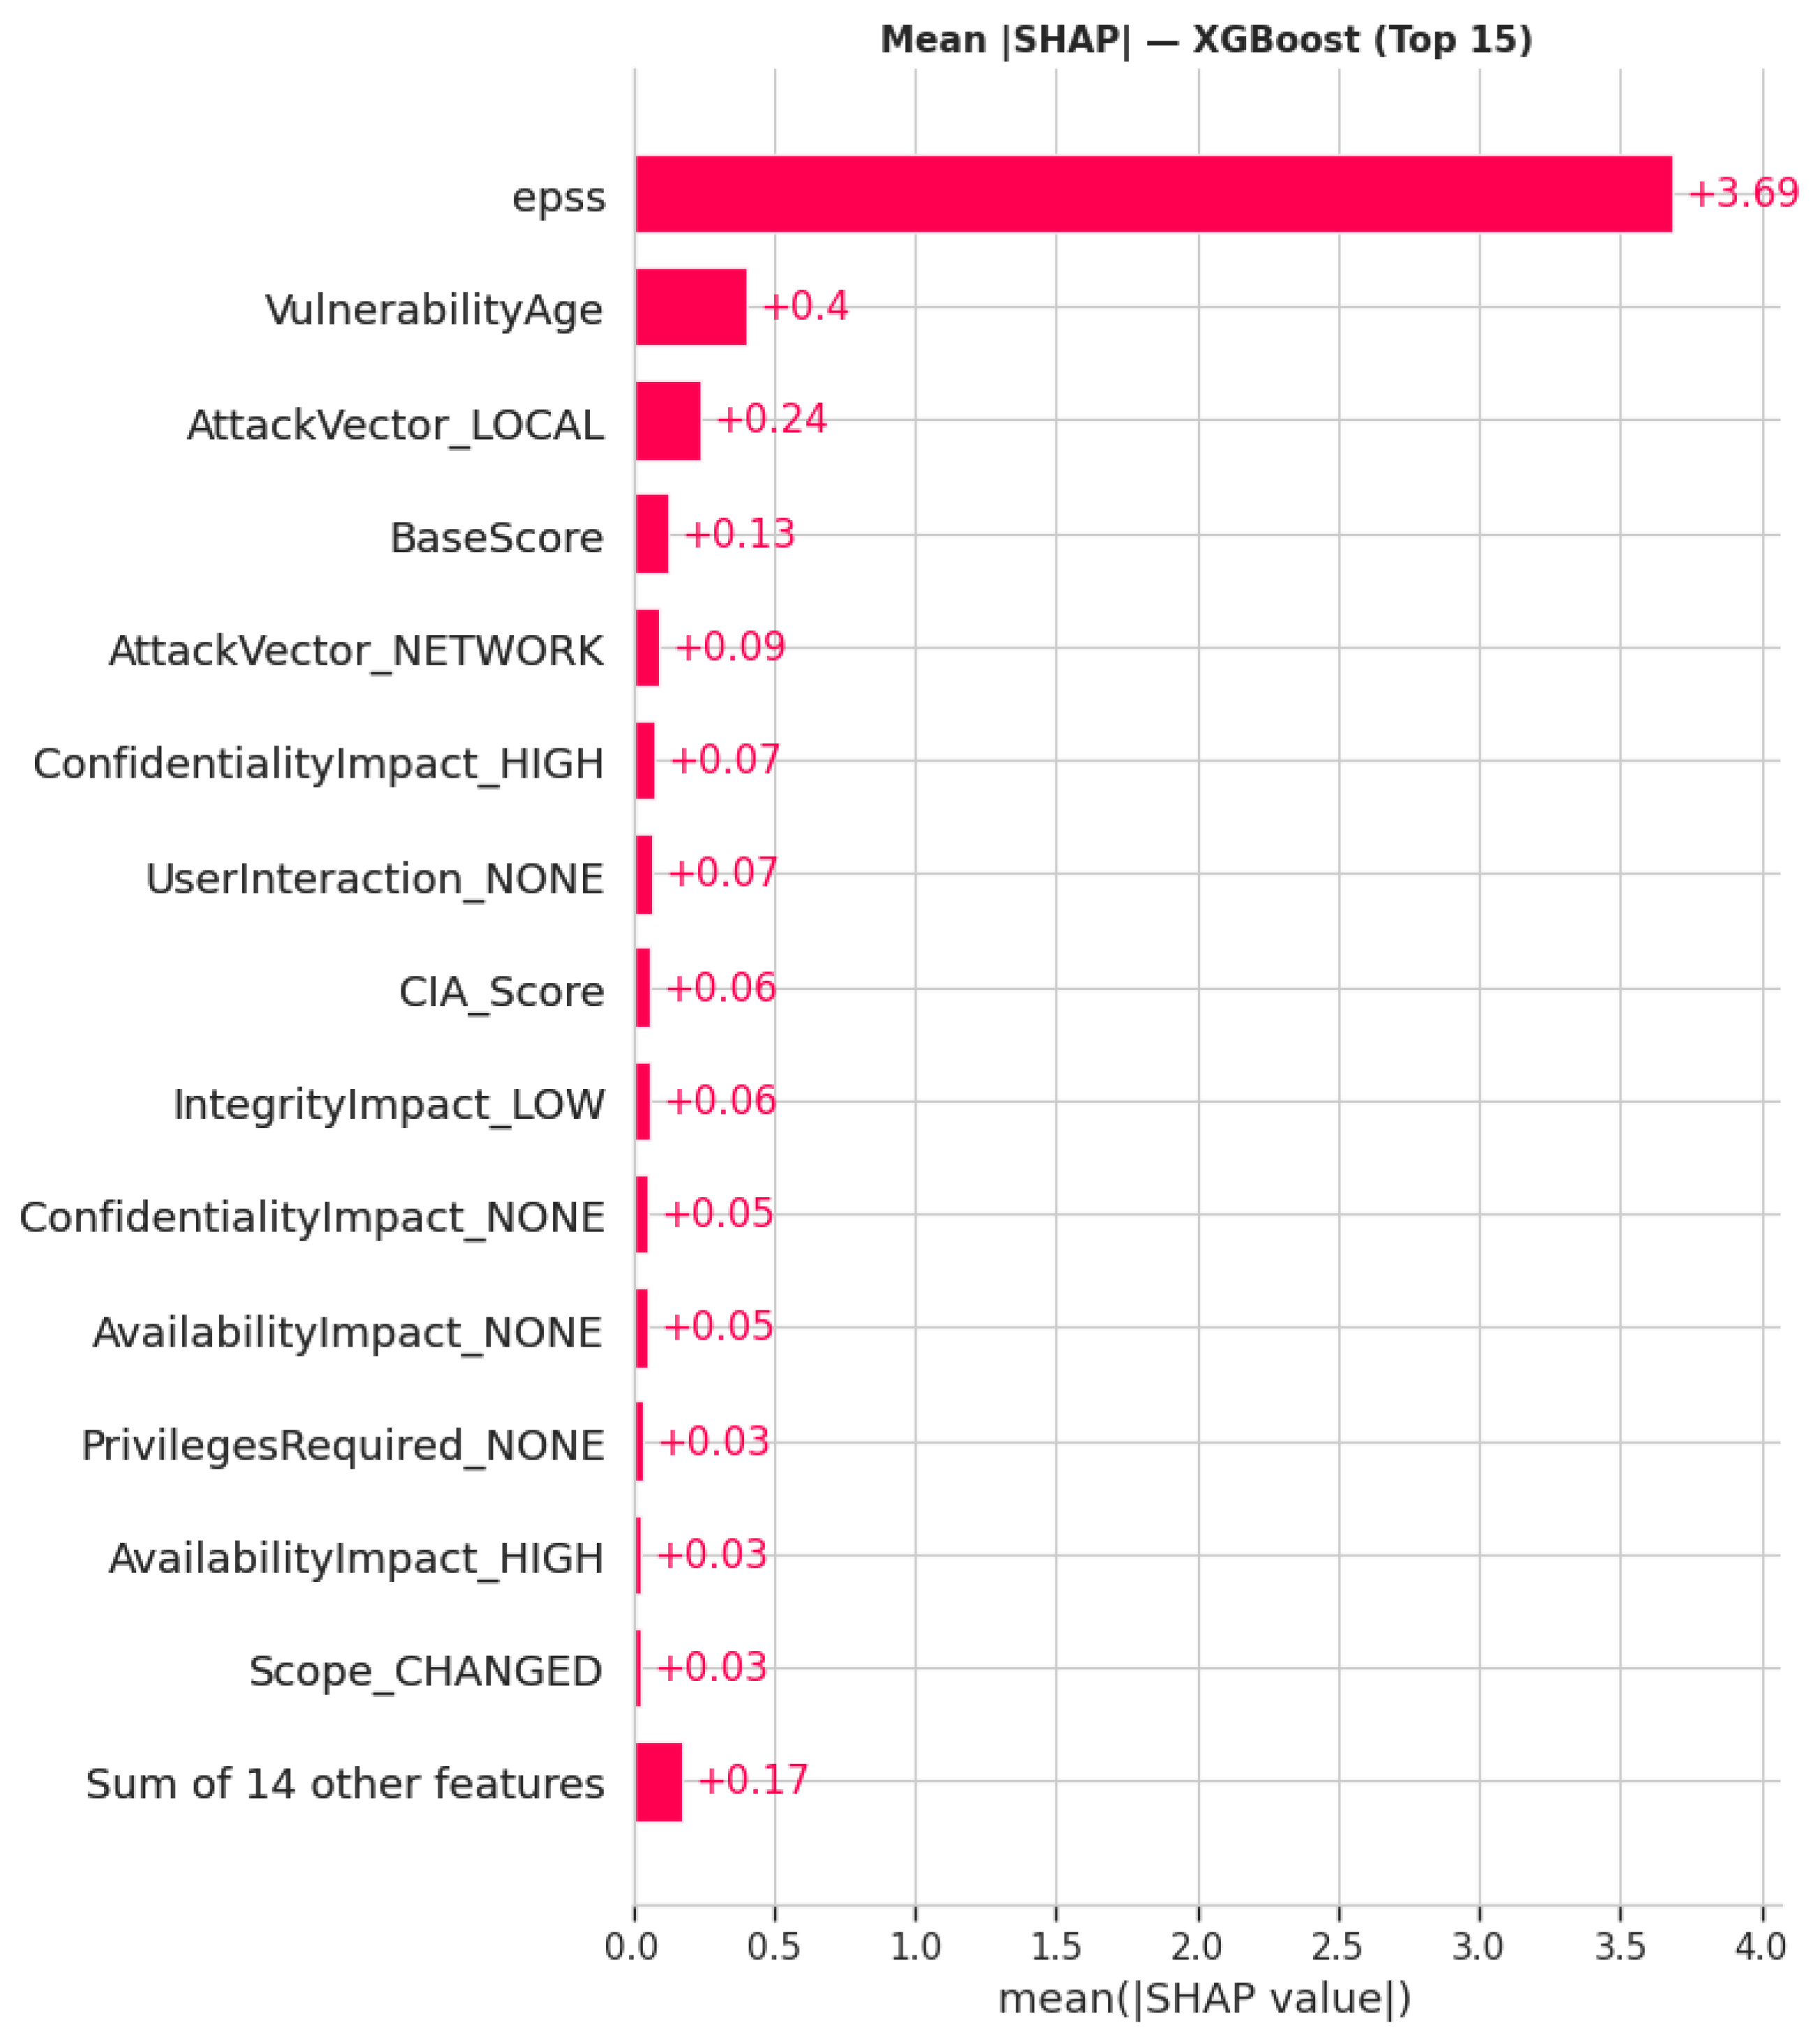
SHAP values were computed for the XGBoost baseline model using TreeExplainer on 2000 test instances. Figure 7 and Figure 8 present the SHAP beeswarm and mean |SHAP| bar chart.
Figure 7.
SHAP beeswarm plot for XGBoost (top 20 features).
Figure 8.
Mean |SHAP| values for the top features. EPSS (3.69) dominates by a factor of nine over the second-ranked feature (VulnerabilityAge: 0.40).
Table 9 presents the top-10 features by mean |SHAP| value.
Table 9.
Top-10 features by mean |SHAP| value (XGBoost, n = 2000 test instances).
6.7. Ablation Study
Table 10 presents the contribution of each training component. The “Without Focal Loss (BCE only)” row uses binary cross-entropy loss with SMOTE oversampling retained; both strategies for addressing class imbalance are therefore separated in the ablation.
Table 10.
Ablation study: Contribution of training components (FedAvg, 20 Clients, 20 Rounds).
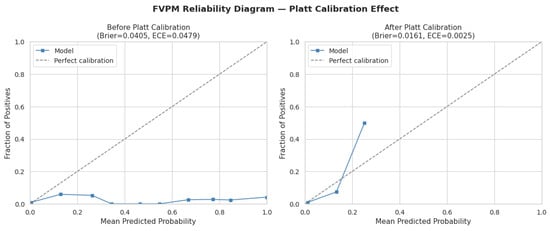
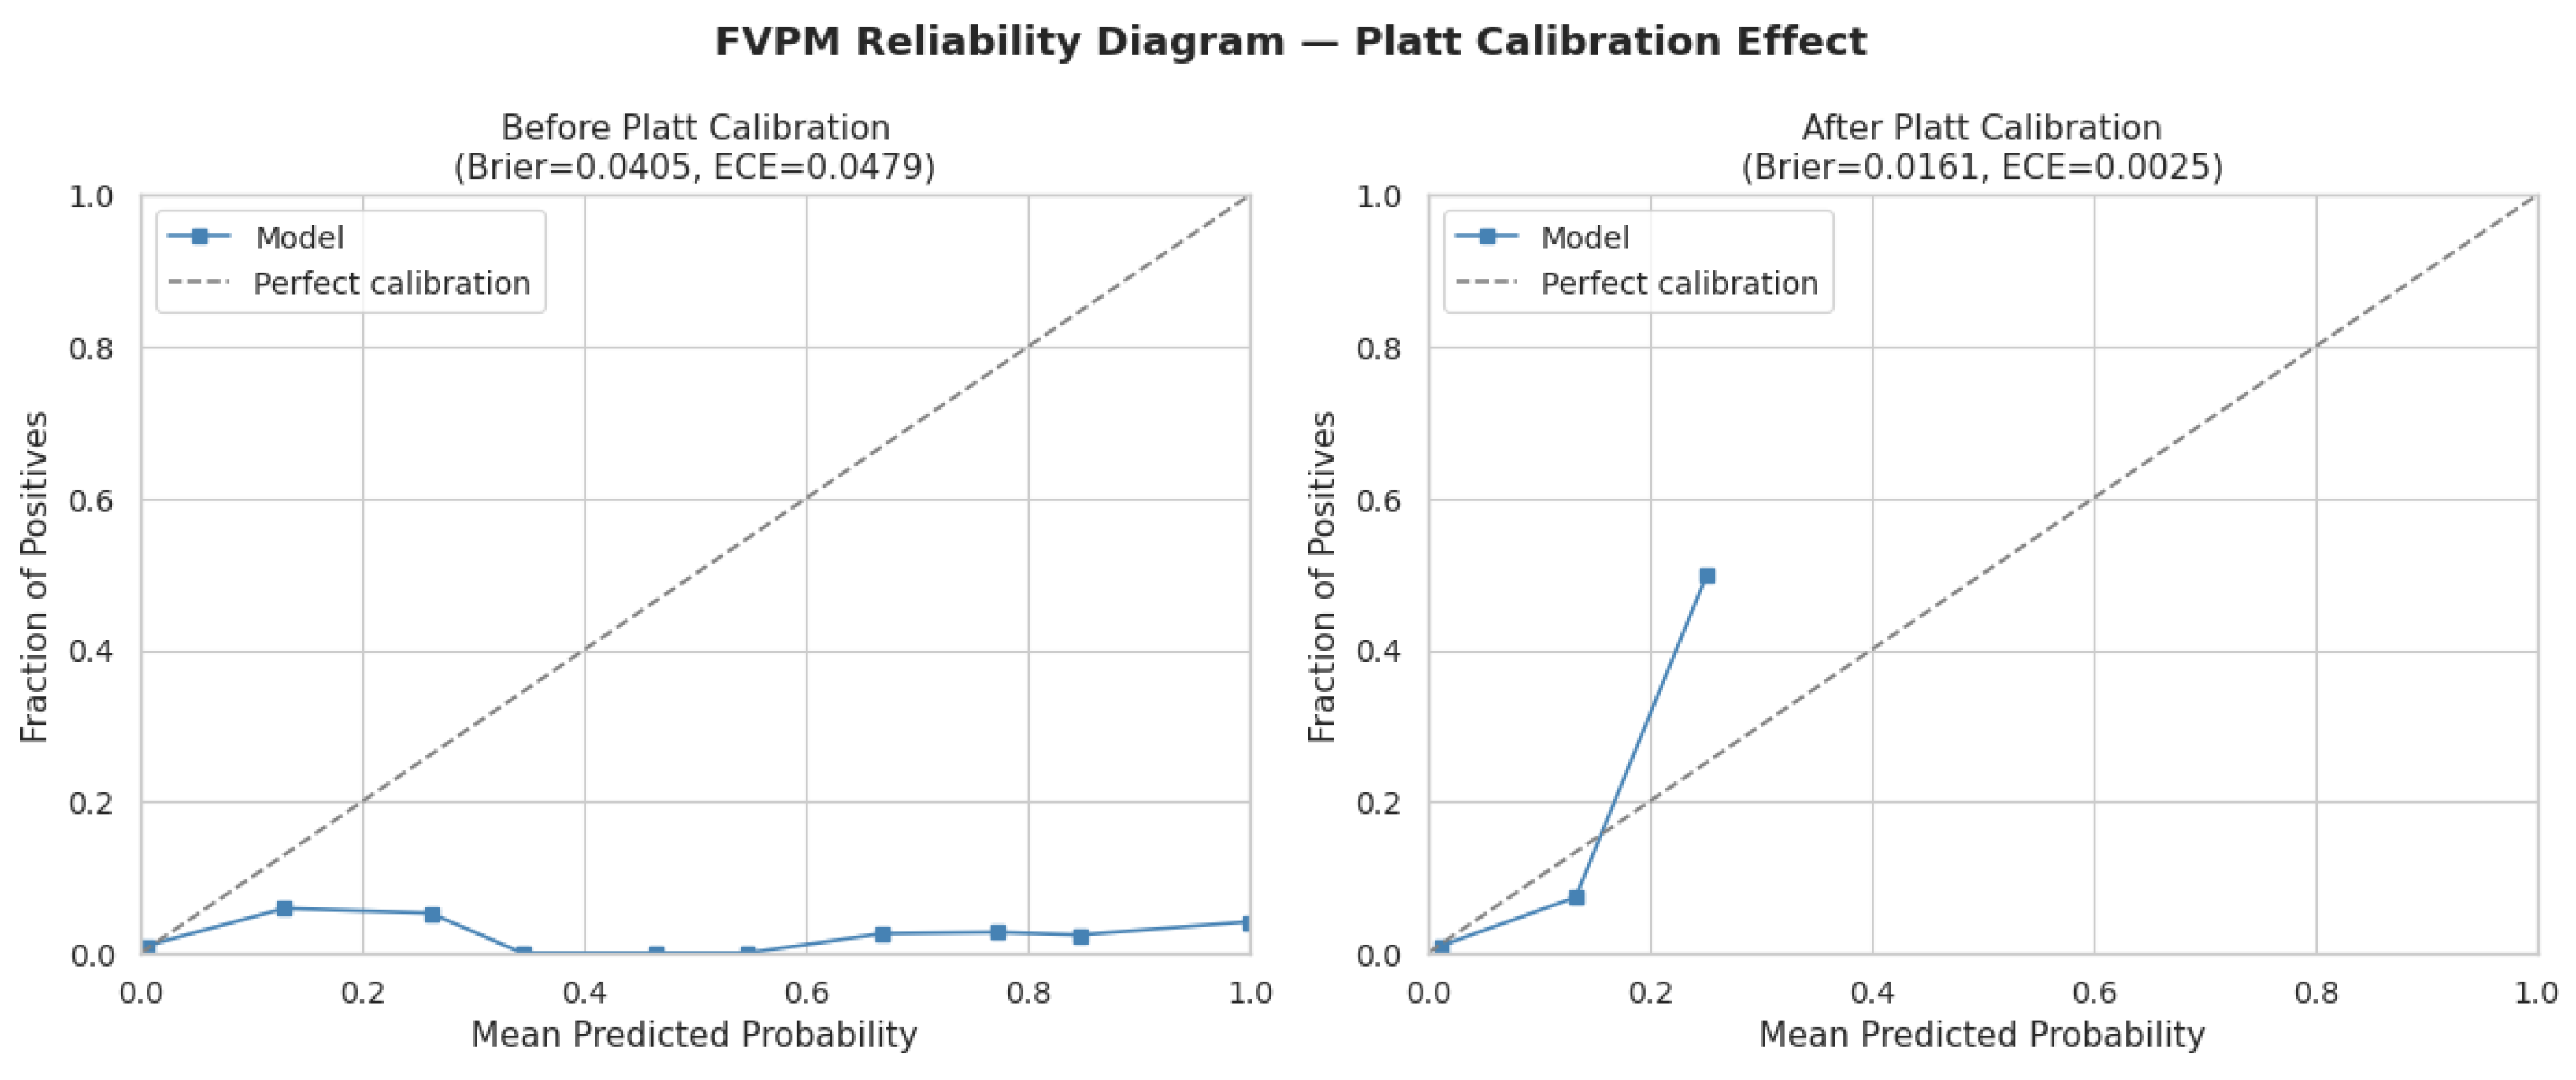
Calibration quality. Platt calibration does not alter discrimination metrics (PR-AUC, F1, MCC) because it applies a monotone transformation to predicted probabilities; threshold-based metrics are invariant to such transformations. The benefit lies in deployment: uncalibrated probabilities are inflated by SMOTE’s 50% minority prevalence during training, while Platt scaling restores them to the 2.05% deployment prevalence, ensuring the composite FVPM score reflects realistic exploitation probabilities. Quantitative evaluation on the held-out validation set confirms this: the Brier score decreases from 0.0405 (uncalibrated) to 0.0161 (calibrated), a 60% improvement, indicating substantially more accurate probability estimates. The Expected Calibration Error (ECE) decreases from 0.0479 to 0.0025, a 95% improvement, confirming that calibrated FVPM scores are deployment-representative risk probabilities suitable for operational vulnerability triage. Figure 9 shows the reliability diagram before and after Platt calibration, visually confirming the correction of SMOTE-induced probability inflation.
Figure 9.
Reliability diagram showing the effect of Platt calibration on VulnerabilityMLP-predicted probabilities. (Left): Uncalibrated probabilities are systematically inflated by SMOTE’s 50% training prevalence, causing near-zero actual positive rates across all predicted probability bins. (Right): After Platt scaling, probabilities are compressed to the deployment prevalence range and track the perfect-calibration diagonal closely (Brier score: ; ECE: ).
6.8. Vulnerability Prioritization Results
The FVPM composite score classifies each of the 220,763 CVEs into one of four priority levels:
- Critical (>0.75): Immediate patching required.
- High (>0.50 to 0.75): Accelerated remediation within 7 days.
- Medium (0.25–0.50): Scheduled patching within 30 days.
- Low (<0.25): Routine monitoring.
6.9. Discussion
Finding 1—Federated learning achieves competitive prioritization with a quantifiable federated performance gap. The best federated model (FedAvg, PR-AUC = 0.4428) achieves approximately 74% of the centralized baseline PR-AUC (0.6005), representing a federated performance gap of ΔPR-AUC ≈ 0.16. This gap reflects the information cost of non-IID decentralization, not a formal differential-privacy cost. The framework does not employ formal differential privacy; rather, privacy is achieved through parameter-only sharing under an honest-but-curious server assumption (see Section 7). Incorporating formal privacy mechanisms (differential privacy, secure aggregation) is reserved as future work.
Critically, the value of federation is demonstrated by comparing FedAvg against a local-only baseline in which each of the 20 clients trains a VulnerabilityMLP independently on its own local data shard (≈7727 records each) without any aggregation. The local-only models achieve a mean PR-AUC of 0.3083 (min = 0.2354, max = 0.3670), compared to FedAvg PR-AUC = 0.4428. This represents a 43.6% relative improvement from federated aggregation over local-only training. This result provides the core operational justification for the federated architecture: no single organization possesses sufficient labeled vulnerability data to train a competitive risk model independently, but by sharing model parameters—without sharing raw CVE records—all participants achieve substantially better prioritization than any could reach alone. The composite weight finding addresses a separate question (which signal is strongest for population-level scoring); the local-only comparison addresses the distinct question of what federation itself contributes to each participating organization.
Finding 2—FedAvg is sufficient for non-IID vulnerability data. FedAvg and WeightedFedAvg produce identical results (PR-AUC = 0.4428) because, under the feature-skewed non-IID partition, the 20 clients receive approximately equal dataset sizes (≈7727 records per client), causing the loss-based weighting in WeightedFedAvg to converge to the same aggregation as standard FedAvg. FedProx introduces a proximal regularization bias that slightly reduces recall (0.5272 vs. 0.5464) and PR-AUC (0.4403 vs. 0.4428). This suggests that the proximal term, while beneficial for highly heterogeneous client updates, is unnecessary and mildly detrimental for the moderate non-IID heterogeneity of the vulnerability dataset considered here.
Finding 3—EPSS is the strongest single signal, and ML models add discriminative value beyond it. Both grid search and SHAP analysis confirm that EPSS is the most informative signal for identifying confirmed high-risk vulnerabilities (Mean|SHAP| = 3.69, 9× greater than the second-ranked feature). Evaluated as a standalone ranker, EPSS achieves PR-AUC = 0.4772—above FedAvg (0.4428) but below XGBoost (0.5220) and Centralized NN (0.6005). This confirms that ML-based models, particularly when trained on the full dataset, add genuine discriminative value over direct EPSS ranking. At its optimal operating threshold, EPSS standalone achieves very high recall (0.9127) but very low precision (0.1369), which leads to a significant false-positive burden in practice; the composite FVPM scoring mechanism addresses this by balancing these signals by integrating CVSS and CIA signals. There are three cases where the FVPM framework provides value beyond direct EPSS lookup. First, for newly disclosed CVEs (usually within 1–7 days of NVD publication), EPSS scores are not available or are initialized near-zero; the VulnerabilityMLP can generate a day-one risk estimate from CVSS attributes and CIA impact scores before EPSS publishes. To quantify this early-warning capability, we evaluated both models on the 24,704 test set CVEs with EPSS < 0.01 (i.e., where EPSS provides near-zero signal), which contain 30 HighRisk records (0.12% prevalence). On this subset, VulnerabilityMLP achieves ROC-AUC = 0.6315 and PR-AUC = 0.0043, while EPSS standalone achieves ROC-AUC = 0.7907 and PR-AUC = 0.0092. VulnerabilityMLP’s ROC-AUC of 0.6315 confirms above-chance discrimination from CVSS and CIA features alone for CVEs in this low-EPSS window: an organization can obtain a non-trivial risk signal on day one, before EPSS is available, whereas EPSS standalone provides no usable signal for this subset by definition. The lower PR-AUC values reflect the extreme prevalence (0.12%) of this subset. Second, FVPM enables privacy-preserving inference at deployment time: each organization applies the global federated model to its local asset inventory without revealing which CVEs it has deployed to the aggregation server or to other participants. Third, the composite score architecture permits organizations to adjust , , , and to reflect their specific asset criticality profiles, providing customizable prioritization beyond a static EPSS lookup.
Finding 4—Focal Loss improves recall under severe class imbalance. The ablation study (Table 10) shows that replacing Focal Loss with standard BCE slightly increases PR-AUC (0.4450 vs. 0.4428) while reducing recall (0.5127 vs. 0.5464), F1-score (0.4786 vs. 0.4796), and MCC (0.4676 vs. 0.4711). The 6.6% relative recall improvement from Focal Loss (0.5464 vs. 0.5127) directly reduces the fraction of high-risk CVEs that escape remediation queues—the primary operational concern in vulnerability triage. This apparent PR-AUC decrease with Focal Loss is a known artifact of threshold-averaged metrics: Focal Loss shifts probability mass toward hard positives, which may redistribute the precision–recall trade-off curve without uniformly improving the area under it. In the vulnerability prioritization context, recall is the operationally critical metric—missing a confirmed high-risk CVE (false negative) has greater security impact than a false positive. Focal Loss is therefore retained in the full model on the basis of the 6.6% recall improvement, prioritizing high-risk detection coverage over precision.
7. Threats to Validity
7.1. Internal Validity
All models were trained and evaluated using identical train, validation, and test partitions, preprocessing procedures, feature engineering pipelines, and threshold optimization strategies. Target leakage was explicitly prevented by excluding the EPSS percentile and the HighRisk label from all model input features.
A related concern is temporal leakage: because all data (NVD CVE records, EPSS scores v3, KEV catalog, ExploitDB, and Metasploit) were collected as a synchronized snapshot in 2026, the train and test splits share the same temporal horizon. A test set CVE’s HighRisk label may have been established at the same time as, or even before, the CVSS and EPSS features used in training, inflating retrospective performance estimates. To assess the magnitude of this effect, we additionally conducted a prospective temporal evaluation: the model was retrained exclusively on CVEs with publication year ≤ 2022 (75,821 training records) and evaluated on CVEs with publication year ≥ 2023 (131,561 test records, 1.08% HighRisk prevalence). Under this strict temporal split, FedAvg achieves ROC-AUC = 0.8130 and PR-AUC = 0.2757, compared to EPSS standalone ROC-AUC = 0.9546 and PR-AUC = 0.3944 on the same holdout. At top-k retrieval, FedAvg achieves Recall@100 = 0.0561 and Recall@1000 = 0.2735 vs. EPSS Recall@100 = 0.0666 and Recall@1000 = 0.3198. These prospective results confirm that EPSS remains the stronger signal even without temporal leakage, and that FedAvg achieves meaningful but lower discrimination prospectively. The current cross-sectional results should therefore be interpreted as retrospective performance estimates; the prospective evaluation above provides a more honest upper-bound constraint on real-world performance. A full prospective experimental protocol (training on earlier-year CVEs and evaluating on newly published CVEs at fixed intervals) is identified as the primary direction for future work.
7.2. External Validity
The experiments were conducted using NVD and EPSS records, which represent widely accepted cybersecurity intelligence repositories but may not fully capture organization-specific asset characteristics or emerging zero-day vulnerabilities. Additional validation using real-world enterprise datasets would further strengthen generalizability.
7.3. Construct Validity
PR-AUC and MCC are emphasized as primary metrics given the 2.05% class prevalence. These metrics do not directly quantify operational benefits such as remediation efficiency or analyst workload reduction.
7.4. Federated Learning Limitations
The current implementation employs FedAvg with an honest-but-curious server assumption. Real-world federated environments may be exposed to model poisoning, Byzantine clients, or client dropout. The current scope focuses on algorithmic prioritization; formal privacy guarantees—including differential privacy and secure aggregation—represent a natural extension for production deployments [16,26].
8. Conclusions
This paper presents FVPM, a Federated Vulnerability Prioritization and Management framework that enables organizations to collaboratively assess cybersecurity vulnerability risk without centralizing raw vulnerability records. The framework introduces confirmed-exploitation labeling from KEV, ExploitDB, and Metasploit, a three-layer VulnerabilityMLP trained with SMOTE and Focal Loss, Platt calibration for deployment-representative risk probabilities, and a grid-search-optimized composite FVPM prioritization score.
Evaluated on 220,763 CVEs across a 20-client non-IID federated environment, FedAvg achieves PR-AUC = 0.4428 versus a centralized baseline PR-AUC ≈ 0.60, quantifying the federated performance gap at ΔPR-AUC ≈ 0.16—an acceptable cost, given that no raw vulnerability records leave any participating organization. Grid search weight optimization and SHAP explainability analysis independently confirm that EPSS is the dominant vulnerability prioritization signal (Mean|SHAP| = 3.69).
Future work will investigate differential privacy and secure aggregation to provide formal privacy guarantees, Byzantine-resilient federated aggregation, temporal vulnerability forecasting, and integration with real organizational vulnerability management deployments.
Author Contributions
Conceptualization, A.A.; methodology, A.A. and H.N.; software, A.A.; validation, H.N.; formal analysis, A.A.; investigation, A.A. and H.N.; data curation, A.A.; writing—original draft preparation, A.A.; writing—review and editing, H.N.; visualization, A.A.; supervision, A.A.; project administration, A.A.; funding acquisition, A.A. All authors have read and agreed to the published version of the manuscript.
Funding
This research was supported by a grant (No. CRPG-25-3054) under the Cybersecurity Research and Innovation Pioneers Initiative, provided by the National Cybersecurity Authority (NCA) in the Kingdom of Saudi Arabia.
Institutional Review Board Statement
Not applicable.
Informed Consent Statement
Not applicable.
Data Availability Statement
The CVE dataset is publicly available from the National Vulnerability Database (NVD) at https://nvd.nist.gov (accessed on 15 June 2026). EPSS scores are available at https://www.first.org/epss (accessed on 15 June 2026). Confirmed-exploitation labels were derived from the CISA Known Exploited Vulnerabilities (KEV) catalog at https://www.cisa.gov/known-exploited-vulnerabilities-catalog (accessed on 15 June 2026), the Exploit Database (ExploitDB) at https://www.exploit-db.com (accessed on 15 June 2026), and the Metasploit Framework at https://github.com/rapid7/metasploit-framework (accessed on 15 June 2026).
Acknowledgments
The authors acknowledge the use of OpenAI’s ChatGPT to assist with the presentation and visual refinement of Figure 1. All technical content of the figure was verified and approved by the authors.
Conflicts of Interest
The authors declare no conflicts of interest. The funders had no role in the design of the study; in the collection, analyses, or interpretation of data; in the writing of the manuscript; or in the decision to publish the results.
References
- Mell, P.; Scarfone, K.; Romanosky, S. A Complete Guide to the Common Vulnerability Scoring System Version 2.0. 2007. Available online: https://tsapps.nist.gov/publication/get_pdf.cfm?pub_id=51198 (accessed on 20 June 2026).
- McMahan, B.; Moore, E.; Ramage, D.; Hampson, S.; Agüera y Arcas, B. Communication-Efficient Learning of Deep Networks from Decentralized Data. In Proceedings of the 20th International Conference on Artificial Intelligence and Statistics (AISTATS), Fort Lauderdale, FL, USA, 20–22 April 2017; Volume 54, pp. 1273–1282. Available online: https://proceedings.mlr.press/v54/mcmahan17a.html (accessed on 20 June 2026).
- Li, Z.; Zou, D.; Xu, S.; Ou, X.; Jin, H.; Wang, S.; Deng, Z.; Zhong, Y. VulDeePecker: A Deep Learning-Based System for Vulnerability Detection. In Proceedings of the Network and Distributed System Security Symposium (NDSS), San Diego, CA, USA, 18–21 February 2018. [Google Scholar] [CrossRef] [Scilit]
- Chakraborty, S.; Krishna, R.; Ding, Y.; Ray, B. Deep Learning-Based Vulnerability Detection: Are We There Yet? IEEE Trans. Softw. Eng. 2022, 48, 3280–3296. [Google Scholar] [CrossRef] [Scilit]
- Harzevili, N.S.; Boaye Belle, A.; Wang, J.; Wang, S.; Jiang, Z.M.; Nagappan, N. A Systematic Literature Review on Automated Software Vulnerability Detection Using Machine Learning. ACM Comput. Surv. 2025, 57, 55. [Google Scholar] [CrossRef] [Scilit]
- Harer, J.A.; Kim, L.Y.; Russell, R.L.; Ozdemir, O.; Kosta, L.R.; Rangamani, A.; Hamilton, L.H.; Centeno, G.I.; Key, J.R.; Ellingwood, P.M.; et al. Automated Software Vulnerability Detection with Machine Learning. arXiv 2018, arXiv:1803.04497. [Google Scholar] [CrossRef] [Scilit]
- Li, Z.; Zou, D.; Xu, S.; Jin, H.; Zhu, Y.; Chen, Z. SySeVR: A Framework for Using Deep Learning to Detect Software Vulnerabilities. IEEE Trans. Dependable Secur. Comput. 2022, 19, 2244–2258. [Google Scholar] [CrossRef] [Scilit]
- Zhou, Y.; Liu, S.; Siow, J.; Du, X.; Liu, Y. Devign: Effective Vulnerability Identification by Learning Comprehensive Program Semantics via Graph Neural Networks. In Proceedings of the Advances in Neural Information Processing Systems, Vancouver, BC, Canada, 8–14 December 2019; Volume 32, pp. 10197–10207. [Google Scholar]
- Feng, Z.; Guo, D.; Tang, D.; Duan, N.; Feng, X.; Gong, M.; Shou, L.; Qin, B.; Liu, T.; Jiang, D.; et al. CodeBERT: A Pre-Trained Model for Programming and Natural Languages. In Proceedings of the Findings of the Association for Computational Linguistics: EMNLP 2020, Online, 16–20 November 2020; pp. 1536–1547. [Google Scholar] [CrossRef] [Scilit]
- Guo, D.; Ren, S.; Lu, S.; Feng, Z.; Tang, D.; Liu, S.; Zhou, L.; Duan, N.; Svyatkovskiy, A.; Fu, S.; et al. GraphCodeBERT: Pre-training Code Representations with Data Flow. In Proceedings of the International Conference on Learning Representations (ICLR), Virtual Event, Austria, 3–7 May 2021; Available online: https://openreview.net/forum?id=jLoC4ez43PZ (accessed on 20 June 2026).
- Wang, Y.; Wang, W.; Joty, S.; Hoi, S. CodeT5: Identifier-aware Unified Pre-trained Encoder-Decoder Models for Code Understanding and Generation. In Proceedings of the 2021 Conference on Empirical Methods in Natural Language Processing (EMNLP), Online and Punta Cana, Dominican Republic, 7–11 November 2021; pp. 8696–8708. [Google Scholar] [CrossRef] [Scilit]
- Fu, M.; Tantithamthavorn, C. LineVul: A Transformer-based Line-Level Vulnerability Prediction. In Proceedings of the MSR, Pittsburgh, PA, USA, 23–24 May 2022. [Google Scholar]
- Hanif, H.; Maffeis, S. VulBERTa: Simplified Source Code Pre-Training for Vulnerability Detection. arXiv 2022, arXiv:2205.12424. [Google Scholar]
- Li, T.; Sahu, A.K.; Zaheer, M.; Sanjabi, M.; Talwalkar, A.; Smith, V. Federated Optimization in Heterogeneous Networks. In Proceedings of the Machine Learning and Systems (MLSys), Austin, TX, USA, 2–4 March 2020; pp. 429–450. [Google Scholar]
- Kairouz, P.; McMahan, H.B. Advances and open problems in federated learning. Found. Trends Mach. Learn. 2021, 14, 1–210. [Google Scholar] [CrossRef] [Scilit]
- Bonawitz, K.; Ivanov, V.; Kreuter, B.; Marcedone, A.; McMahan, H.B.; Patel, S.; Ramage, D.; Segal, A.; Seth, K. Practical Secure Aggregation for Privacy-Preserving Machine Learning. In Proceedings of the 2017 ACM SIGSAC Conference on Computer and Communications Security (CCS); ACM: New York, NY, USA, 2017; pp. 1175–1191. [Google Scholar] [CrossRef] [Scilit]
- Fang, W.; He, J.; Li, W.; Lan, X.; Chen, Y.; Li, T.; Huang, J.; Zhang, L. Comprehensive Android Malware Detection Based on Federated Learning Architecture. IEEE Trans. Inf. Forensics Secur. 2023, 18, 3977–3990. [Google Scholar] [CrossRef] [Scilit]
- Xue, K.; Li, J.; Xue, R.; Xue, Y.; Zhao, J. RobustPPFL: A Secure and Robust Privacy-Preserving Federated Learning Framework Against Poisoning Attacks. IEEE Trans. Netw. Sci. Eng. 2026, 13, 3351–3368. [Google Scholar] [CrossRef] [Scilit]
- Zhang, Z.; Wu, L.; Ma, C.; Li, J.; Wang, J.; Wang, Q.; Yu, S. LSFL: A Lightweight and Secure Federated Learning Scheme for Edge Computing. IEEE Trans. Inf. Forensics Secur. 2023, 18, 365–379. [Google Scholar] [CrossRef] [Scilit]
- Jacobs, J.; Romanosky, S.; Edwards, B.; Adjerid, I.; Roytman, M. Exploit Prediction Scoring System (EPSS). Digit. Threat. Res. Pract. 2021, 2, 20. [Google Scholar] [CrossRef] [Scilit]
- Pljonkin, A.; Petrov, D.; Sabantina, L.; Dakhkilgova, K. Nonclassical Attack on a Quantum Key Distribution System. Entropy 2021, 23, 509. [Google Scholar] [CrossRef] [Scilit] [PubMed]
- Pljonkin, A.; Rumyantsev, K.; Singh, P.K. Synchronization in Quantum Key Distribution Systems. Cryptography 2017, 1, 18. [Google Scholar] [CrossRef] [Scilit]
- Le, T.H.M.; Chen, H.; Babar, M.A. A Survey on Data-driven Software Vulnerability Assessment and Prioritization. ACM Comput. Surv. 2022, 55, 100. [Google Scholar] [CrossRef] [Scilit]
- Caruccio, L.; Cimino, G.; Deufemia, V.; Iuliano, G.; Stanzione, R. Surveying Federated Learning Approaches Through a Multi-Criteria Categorization. Multimed. Tools Appl. 2024, 83, 36921–36951. [Google Scholar] [CrossRef] [Scilit]
- Lin, T.Y.; Goyal, P.; Girshick, R.; He, K.; Dollár, P. Focal Loss for Dense Object Detection. In Proceedings of the IEEE International Conference on Computer Vision (ICCV), Venice, Italy, 22–29 October 2017; pp. 2980–2988. [Google Scholar]
- Geyer, R.C.; Klein, T.; Nabi, M. Differentially private federated learning: A client level perspective. arXiv 2017, arXiv:1712.07557. [Google Scholar]

Disclaimer/Publisher’s Note: The statements, opinions and data contained in all publications are solely those of the individual author(s) and contributor(s) and not of MDPI and/or the editor(s). MDPI and/or the editor(s) disclaim responsibility for any injury to people or property resulting from any ideas, methods, instructions or products referred to in the content. |
© 2026 by the authors. Licensee MDPI, Basel, Switzerland. This article is an open access article distributed under the terms and conditions of the Creative Commons Attribution (CC BY) license.