Article

Research on a Degradation Identification Method for GIS UHF Partial Discharge Sensors Based on S-Parameters

1
Southern Power Grid Scientific Research Institute Co., Ltd., Guangzhou 510700, China
2
School of Electrical Engineering, China University of Mining and Technology, Xuzhou 221116, China
*
Author to whom correspondence should be addressed.
Sensors 2025, 25(22), 6860; https://doi.org/10.3390/s25226860
Submission received: 23 September 2025 / Revised: 5 November 2025 / Accepted: 6 November 2025 / Published: 10 November 2025

Abstract

The ultra-high-frequency (UHF) detection method is highly accurate and has a fault localization function. At present, most gas-insulated switchgear (GIS) installations are equipped with online UHF monitoring devices to detect partial discharges. In order to ensure the accuracy of the detection results, UHF sensors need to be verified regularly. UHF sensors used for online monitoring are usually installed at the handhole of the GIS and cannot be removed. Measuring the laboratory verification indexes (e.g., equivalent height, dynamic range, etc.) of the sensors directly is very difficult. However, it is easier to measure S11 of the sensor for verification and S21 between it and the neighboring sensors by injecting power signals. Accordingly, this paper proposes a degradation identification method for GIS UHF sensors using a cross-comparison of S-parameters. When sensor sensitivity decreases, S11 increases while S21 decreases, both serving as effective indicators of performance degradation. In this study, the equivalent S-parameter network and the variation mechanisms of S11 and S21 during sensor verification were first analyzed. Normal and typically degraded sensor models were then constructed and coupled in different GIS structures for electromagnetic simulation. The simulation and on-site verification results show that S11 is mainly affected by the sensor’s intrinsic performance and installation conditions at the inspection port, whereas S21 is predominantly influenced by sensor performance and the propagation characteristics of the GIS structure. Through cross-comparison of S11 and S21 at corresponding positions across three phases, sensor aging or failure can be effectively identified, enabling rapid on-site verification without removing the sensors. The proposed method was successfully validated on actual GIS equipment at the China Southern Power Grid Research Institute. It exhibits high accuracy, efficiency, and strong engineering applicability, enabling the early detection of degraded sensors and providing valuable support for condition assessment and maintenance decision-making in GIS online monitoring systems.

1. Introduction

In recent years, most gas-insulated switchgear (GIS) installations have been equipped with ultra-high-frequency (UHF) online monitoring systems for the detection of partial discharge (PD), enabling the prompt identification of potential insulation defects [1,2,3]. Some utilities like China Southern Power Grid Company Limited (CSG) will use partial discharge signals to trigger early warnings for protection, sound–light alarms, and other logical features of action in future development. Under the dual requirements of higher power supply reliability and enhanced system safety, early-warning schemes that employ partial discharge (PD) signals as the trigger logic—such as “PD + protection” and “PD + acoustic-optical alarm”—represent an inevitable trend for future development. The above tendency places higher demands on partial discharge UHF detection, especially on the accuracy and reliability of the UHF sensor, which is the main piece of equipment of the detection device [4,5,6]. For this reason, it is imperative to develop a new and effective sensitivity identification procedure for GIS UHF sensors [7,8].
In the early days, since there was no demand for online partial discharge monitoring, the main direction of research was offline UHF sensor verification [9,10]. So-called offline verification is carried out to remove the sensor from the GIS or other electrical equipment, and then it is incorporated into special laboratory verification equipment, which has more calibratable indicators [11,12]. Initially, off-line verification was used to test the effective height of the transducer using a TEM transmission line [13]. Subsequently, coaxial chambers were also used as a test environment for the sweep verification of UHF transducers. Currently, more applications are based on the use of GTEM chambers to calibrate the effective height of UHF transducers and the sensitivity and dynamic range of UHF detection systems. This laboratory verification program is now widely used for UHF detection devices loaded into GIS for the first time [14,15]. However, the sensors used for online monitoring are usually built-in and fixed at the handholes inside the GIS, which makes them difficult to dismantle. As a result, offline calibration often introduces significant errors, since it fails to account for the complex structural characteristics of GIS and the actual operating conditions of sensors within the handhole [16,17]. Under the new requirements for the online monitoring of local discharge signals and protection action, it is imperative to adopt more accurate and faster on-site verification methods for UHF sensors [18,19,20].
Currently, a major predicament in GIS partial discharge sensor monitoring verification is the scarcity of on-site verification indicators [21]. Therefore, there is an urgent need to enhance the on-site verification indicators of GIS UHF sensors to improve accuracy [22,23]. The CIGRE TF15/33.03.05 working group recommended an equivalent 5pC verification method, which was written into the IEC guidelines. Some scholars connected an extended cavity externally on the GIS and pressurized the cavity to induce discharge and verify the monitoring system [24,25]; there is also related research that has been conducted to quantitatively verify disk sensors, ring sensors, and media window sensors of GIS through the correspondence between UHF signals and discharges [26,27]. Universities and scholars have developed various kinds of high-performance UHF sensors and have analyzed the effect of noise interference on local discharge detection [28] and the influence of GIS structure on the propagation characteristics of UHF electromagnetic waves [29]. On this basis, two types of on-site verification programs have been proposed, with certain applications. One is the artificial pulse injection verification method based on the equivalent field strength, which injects the equivalent pulse simulating the local discharge signal into the GIS and verifies the sensitivity of the sensor according to its output response [30]. The other is to measure the S21 parameter between two sensors and verify the UHF sensor according to the change in S21. S21 is the frequency-domain transfer function (frequency response curve) between the two UHF sensors of the GIS. However, just relying on S21 alone is not sufficient for verifying UHF sensors, especially in complex field working conditions. S11 is an inherent parameter that characterizes the coupling properties of UHF sensors within the handhole. It represents the fundamental cause of sensor performance variations and exhibits high sensitivity, thereby making it a suitable evaluation metric for on-site calibration. The S11 parameter can be measured simultaneously with S21 without adding any extra workload. The GIS ultra-high-frequency (UHF) sensor calibration method based on the comparative analysis of S11 and S21 is conducted by additionally measuring the S11 parameter and subsequently comparing the mean values of S11 and S21 for sensors located at corresponding positions in different phases within the detection frequency band. This approach effectively reveals sensor defects that cannot be identified through S21 measurements alone, thereby enhancing both the accuracy and sensitivity of the calibration results.
In this paper, we first studied the theory for the S11 parameter of a UHF sensor and the S21 parameter between UHF sensors in GIS and proposed a verification scheme based on a cross-comparison of S11 and S21. Then, the UHF sensor model and the typically degraded UHF sensor model were established through simulation, and the change rule of the UHF sensor’s S11 and its adjacent sensor’s S21 in the GIS was verified when the sensitivity of the UHF sensor was degraded. Finally, validation was completed on the GIS in the 500 kV substation of State Grid Ningxia Power Co. Ltd., Ningxia, China. proving the validity and feasibility of the joint cross-comparison of S11 and S21.

2. Material and Methods

2.1. S-Parameter Network

As shown in Figure 1, the S-parameter network is a network of scattering parameters defined at each port connected to a matched load to describe the frequency-domain characteristics of a transmission channel. The S-parameters comprise S11 (i.e., the reflection parameter), S22 (i.e., the single-ended loss of the output port), S21 (i.e., the double-ended insertion loss), and S12 (i.e., the double-ended insertion loss).
According to the electromagnetic wave theory, we have
b 1 b 2 = S 11 S 21 S 12 S 22 a 1 a 2
In Equation (1), a1 is the refraction of the normalized incident wave; a2 is the reflection of the normalized incident wave; b1 is the reflection of the normalized transmitted wave; and b2 is the refraction of the normalized transmitted wave.
When port 2 is connected to the matched load, a2 is 0. Equation (1) can be transformed into
S 11 = b 1 a 1 S 21 = b 2 a 1
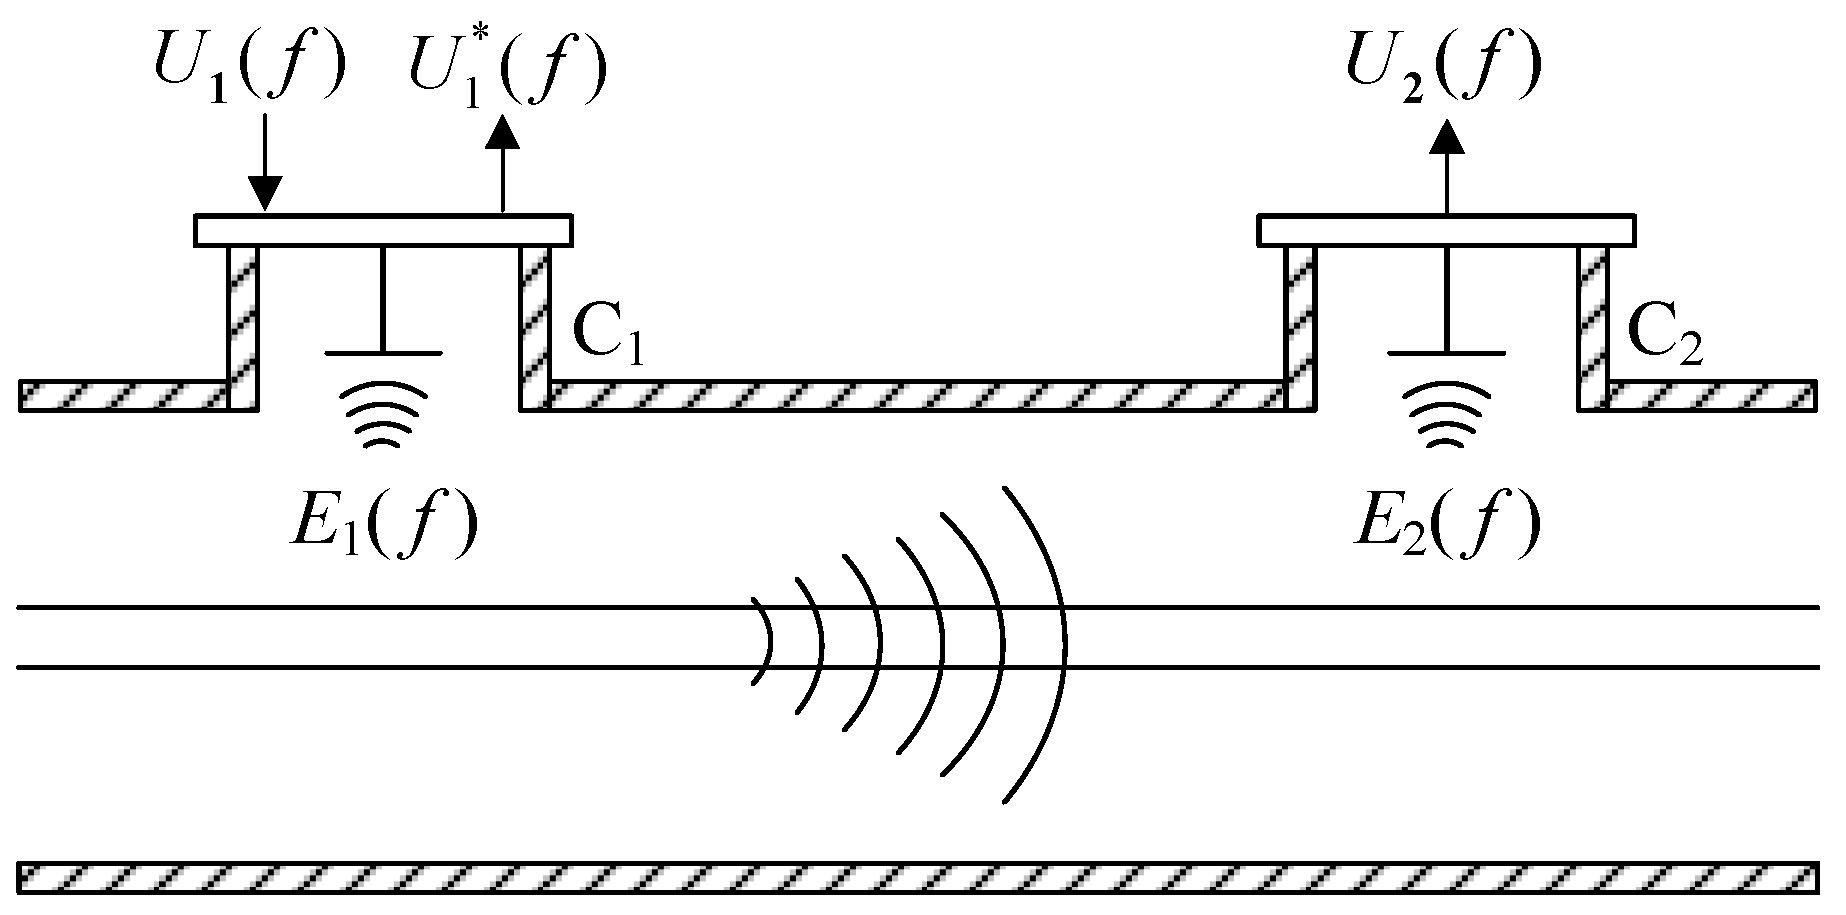
UHF sensors used for online monitoring are often coupled inside the handhole in a built-in manner. Taking sensors C1 and C2 as an example, the wave process during on-site verification of UHF sensors in GIS is shown in Figure 2. Antennas are reciprocal, i.e., the same antenna can either inject power signals to excite UHF electromagnetic waves or inject UHF electromagnetic waves to couple power signals. Therefore, sensor C1 may be used as a transmitting sensor and sensor C2, adjacent to C1, may be used as a receiving sensor for verification.
After injecting the power signal U1(f) into C1, C1 will excite a UHF electromagnetic wave E1(f). Part of E1(f) forms a standing wave at the handhole, and the other part of E1(f) is a traveling wave propagating in the GIS cavity. Sensor C1 receives the standing wave of its own excitation and outputs the reflected signal U 1 ( f ) . The traveling wave propagates in the GIS cavity with many refractions, reflections, and superposition and reaches the receiving sensor C2 when it has been attenuated into E2(f). C2 receives the attenuated electromagnetic wave E2(f) and then outputs the voltage U2(f).
The above wave process can be equated to the S-parameter network of Figure 1. In Figure 2, the feed terminal of the injecting sensor C1 is equivalent to port 1 in Figure 1; U1(f) is considered a1; U 1 ( f ) is considered b1; the feed terminal of the receiving sensor C2 is port 2; and U2(f) is considered b2. Then, from Equation (2), the defining equations for the real parts of S11 and S21 of C1 at the time of verification of the GIS UHF sensor are
S 11 = 20 lg U 1 ( f ) U 1 ( f ) S 21 = 20 lg U 2 ( f ) U 1 ( f )
In Equation (3), U1(f) is the voltage injected into the sensor C1; U 1 ( f ) is the voltage reflected from the injecting sensor C1; and U2(f) is the voltage output from the receiving sensor C2.

2.2. S11 and S21 Change Mechanism

Disregarding the signal leakage and energy loss, the UHF electromagnetic wave incident in the GIS cavity should be equal to the sum of the reflected and radiated phases. Therefore, the S11 phase quantity representing the reflection characteristics and the S21 phase quantity representing the radiation characteristics have the following relationship in the frequency domain:
S 11 2 + S 21 2 = 1
The S-parameters tested during field verification are similar to the transfer functions in the frequency domain, and they all reflect only the intrinsic properties of the object. S11 is related only to the performance of the sensor itself and the size of the handhole, determined by the standing waves of the electromagnetic wave, reflecting the operating performance of the UHF sensor after it is mounted in a narrow space within the handhole. S21 is related only to the characteristics of the sensor itself and the structure of the GIS cavity, determined by the traveling waves of electromagnetic waves, reflecting the performance of the sensor in receiving the UHF signals propagating over the far end of the cavity. Since it is unlikely that the handhole and chamber structure will change during verification, the only reason for the change in S11 and S21 during the actual verification is a degradation in sensor performance.
If the performance of the sensor degrades, the amount of reflection will increase and the amount of radiation will decrease when a signal is injected into this sensor. Thus, its S11 in the free space will increase to varying degrees, which in turn will lead to an increase in S11 tested during the calibration at the handhole. From Equation (4), it can be seen that its S21 will decrease at the same time.
The S-parameter is a phase quantity written in complex form, while the S11 and S21 spectra obtained from the actual verification using the network analyzer are both given in terms of their real parts. Therefore, when only S21 is tested with the network analyzer, it is possible that the variation in the imaginary part is large while the variation in the real part is not large and thus the results are not obvious, resulting in missed detection. Therefore, it is necessary to measure both the S11 of a sensor and the S21 of this sensor and its adjacent sensors and then make a comprehensive judgment.

2.3. Verification Method Based on Cross-Comparison of S11 and S21

The core feature of the joint cross-comparison verification method based on S11 and S21 is the three-phase symmetry of the UHF sensors installed on the GIS. Since the A, B, and C phases of the GIS are three-phase-symmetric, if the sensors are normal, the measured S11 and S21 curves of three-phase sensors at the corresponding positions are similar, and the calculated mean values are also similar. However, if there is a sensor with degraded performance, according to the theory of change of the S-parameter analyzed above, either S11 and S21 of this sensor, or both, will change significantly compared to the corresponding position sensors of the other two phases.
Prior to the initiation of the measurement procedure, the network analyzer was calibrated to a reference power level of 0 dBm. An RF cable is used to connect the network analyzer, the sensor to be verified, and the sensor adjacent to the sensor to be verified. A power signal is injected into the sensor to be verified, and the S11 of that sensor and the S21 between the two sensors are measured. After completing this test phase, the equipment is rewired to measure S11 and S21 at the other corresponding positions for each phase, and the mean values of S11 and S21 are calculated from Equations (5) and (6). Finally, S 11 ¯ and S 21 ¯ are compared with each other between phases A, B, and C. A flowchart of this verification method is shown in Figure 3.
S 11 ¯ = 1 f max f min f min f max S 11
S 21 ¯ = 1 f max f min f min f max S 21
In Equations (5) and (6), fmin is the lowest frequency point of the frequency sweep during verification and fmax is the highest frequency point of the frequency sweep.

3. Simulations

In order to verify the feasibility of the above joint cross-comparison verification based on the S11 and S21 parameters, UHF sensor and degradation sensor models were established in CST, the simulated sensors were coupled in built-in form at the handhole of the straight-cavity GIS, and the simulation results of each UHF sensor’s verification in GIS were analyzed by cross-comparison.

3.1. Modeling of the UHF Sensor

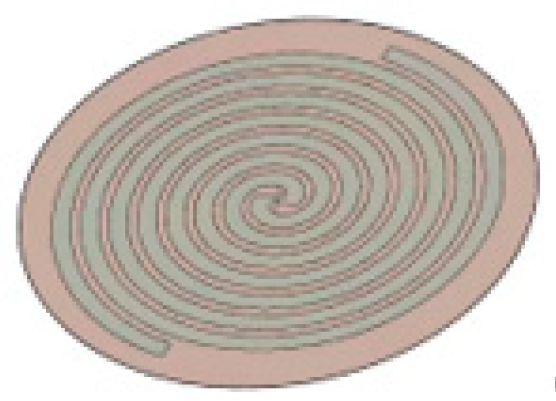
The UHF sensor is an ultra-wideband antenna with a frequency band range of approximately 0.3–1.8 GHz. The antenna receives electromagnetic waves in that band and converts them into voltage signals. In this paper, UHF sensors were modeled with an Archimedes spiral antenna commonly used in engineering, which is small, simple, and has unique advantages in fault location. The established model A planar Archimedean spiral antenna is shown in Figure 4. The material of antenna A’s wire arm was set to be PEC and the substrate was set to be PTFE. The wire arm consists of two Archimedean solenoids whose sagittal length increases linearly with increasing angle. Its mathematical model is
r 1 = r 0 + α φ r 2 = r 1 + α φ
In Equation (7), r0 is the distance between the helix starting point and the coordinate center, i.e., the inner diameter; r1 and r2 are the distances from any point on the line arm to the coordinate center; α is the helix rate; and φ is the angle at which the helix is turned.
According to the radiation characteristics of the Archimedean spiral antenna, the inner radius r0 is determined by the highest operating frequency (corresponding to the minimum wavelength), while the outer radius rM is determined by the lowest operating frequency (corresponding to the maximum wavelength). The typical selection criteria are as follows:
2 r 0 < λ min / 4 2 π r M > 1.25 λ max
Considering the miniaturization requirements of built-in antennas in GIS, the outer radius of the antenna was reduced on the basis of Equation (8). Both the inner and outer radii influence the impedance characteristics of the antenna as well as the installation of the feed balloon. Therefore, the inner and outer radii were determined through simulation-based tuning and optimization. Furthermore, the linewidth W, number of turns N, and other parameters were derived according to the relational expressions of the Archimedean spiral antenna’s radiation surface. Based on the parameters listed in Table 1, the model C1 UHF sensor was established, with its simulation structure shown in Figure 4.
Extensive testing of ultra-high-frequency (UHF) sensors with significant performance degradation has revealed that the primary causes of deterioration include aging, corrosion, and functional failure. Among these, aging is identified as the predominant factor, which is mainly manifested by changes in the physicochemical properties of the antenna after prolonged operation. The corresponding simulation approach involves increasing the helical structure of the antenna and the relative dielectric constant of the substrate to mimic the deterioration of electrical characteristics caused by thermal effects. In a smaller proportion of sensors, corrosion occurs in the antenna helix, which adversely affects the impedance characteristics and operating frequency band. This phenomenon can be simulated by adjusting the linewidth and number of turns of the helix, thereby representing the loss of functionality due to corrosion. Furthermore, sensor failure leads to insufficient current passing through the feed port, making it difficult to generate adequate electromagnetic waves. Such failures can be equivalently modeled by disconnecting the feed port of the antenna.
Based on the aforementioned simulation methods of degraded ultra-high-frequency (UHF) sensors and the characteristic parameters observed in practically deteriorated devices, sensor A was employed as the reference model. By increasing the relative permittivity, increasing the conductivity, reducing the linewidth of the Archimedean screw, reducing the number of turns, and disconnecting the antenna feed ports, the degraded UHF sensor models B, C, and D were created. The specific parameter modifications for each degraded sensor are summarized in Table 2.
Based on the aforementioned model, the antenna feed port was set as a wave port. Since the energy density is mainly concentrated below 1.5 GHz, the simulation frequency range was defined as 0.3–1.5 GHz. The S11 curves of antennas C1, C2, C3, and C4 simulated in free space are shown in Figure 5.
As illustrated in Figure 5, the S11 responses exhibit considerable variation across different frequency points, accompanied by noticeable oscillations. This behavior is primarily attributed to the frequency-dependent characteristics of UHF sensors. Each S11 curve demonstrates a minimum point, which corresponds to the resonant frequency of the sensor.
For antenna C1, the S11 values remain below −10 dB at frequencies above 0.65 GHz, indicating that its performance satisfies engineering application requirements. In contrast, the adjustment of the local relative permittivity of antenna C2 prevented the generation of equal but opposite-phase currents, resulting in insufficient excitation of electromagnetic waves and an overall inferior performance compared with C1. For antenna C3, the reduction in coil turns altered the effective operating frequency band, leading to a significant increase in S11 within the detection range. For antenna C4, the disconnection of the feed port caused a severe decline in feeding performance, drastically reducing the radiated electromagnetic energy across the entire frequency band. The average values of S11 within the detection band, calculated according to Equation (5), are summarized in Table 3.
As shown in Table 3, the increase in the S11 curves of the degraded sensors inevitably leads to an increase in their average values. This average value can therefore serve as a characteristic parameter for identifying sensor performance.

3.2. GIS UHF Sensor Verification Model

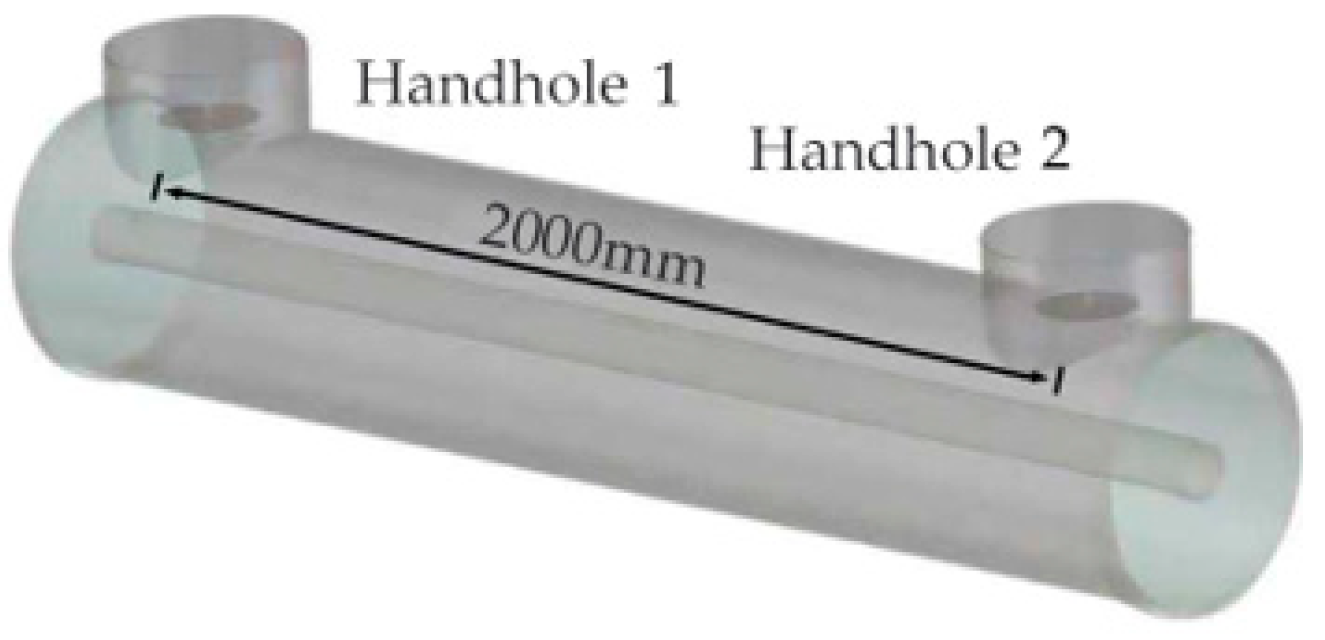
The model simulated the most common straight-cavity structure in 500 kV GIS. In order to reduce the electromagnetic wave leakage, insulated basins were set at both ends of the GIS to close the cavity. Handholes A and B were punched through the outer wall of the GIS and the sensors were coupled at the handholes, with the requirement that the receiving side of the sensors face the GIS cavity. In order to not distort the original electric field of the cavity, the sensor’s receiving surface should not be smaller than the outer wall of the GIS.
The inner diameter of the GIS high-voltage conductor was set to 100 mm, the outer diameter was set to 500 mm, the thickness of the outer shell was set to 10 mm, and the distance between both sensors in the GIS was 2000 mm. The material of both the shell and inner conductor was set to PEC, and the relative dielectric constant of the tub insulator was set to 4.6. The port was set to a wave port, the simulation frequency was set to 0.3–1.5 GHz, the boundary conditions were set to an open boundary, and time-domain full-wave simulation was used. The simulation model is shown in Figure 6.
Four different GIS UHF sensor verification models can be obtained by always placing the above-modeled UHF sensor C1 at handhole 1 and placing C1 and the degraded sensors C2, C3, and C4 at handhole 2, respectively. The same power signal was injected into handhole 2, and the S11 of the sensor at handhole 2 and the S21 between the two sensors were tested for the four models.

3.3. Analysis of Simulation Results

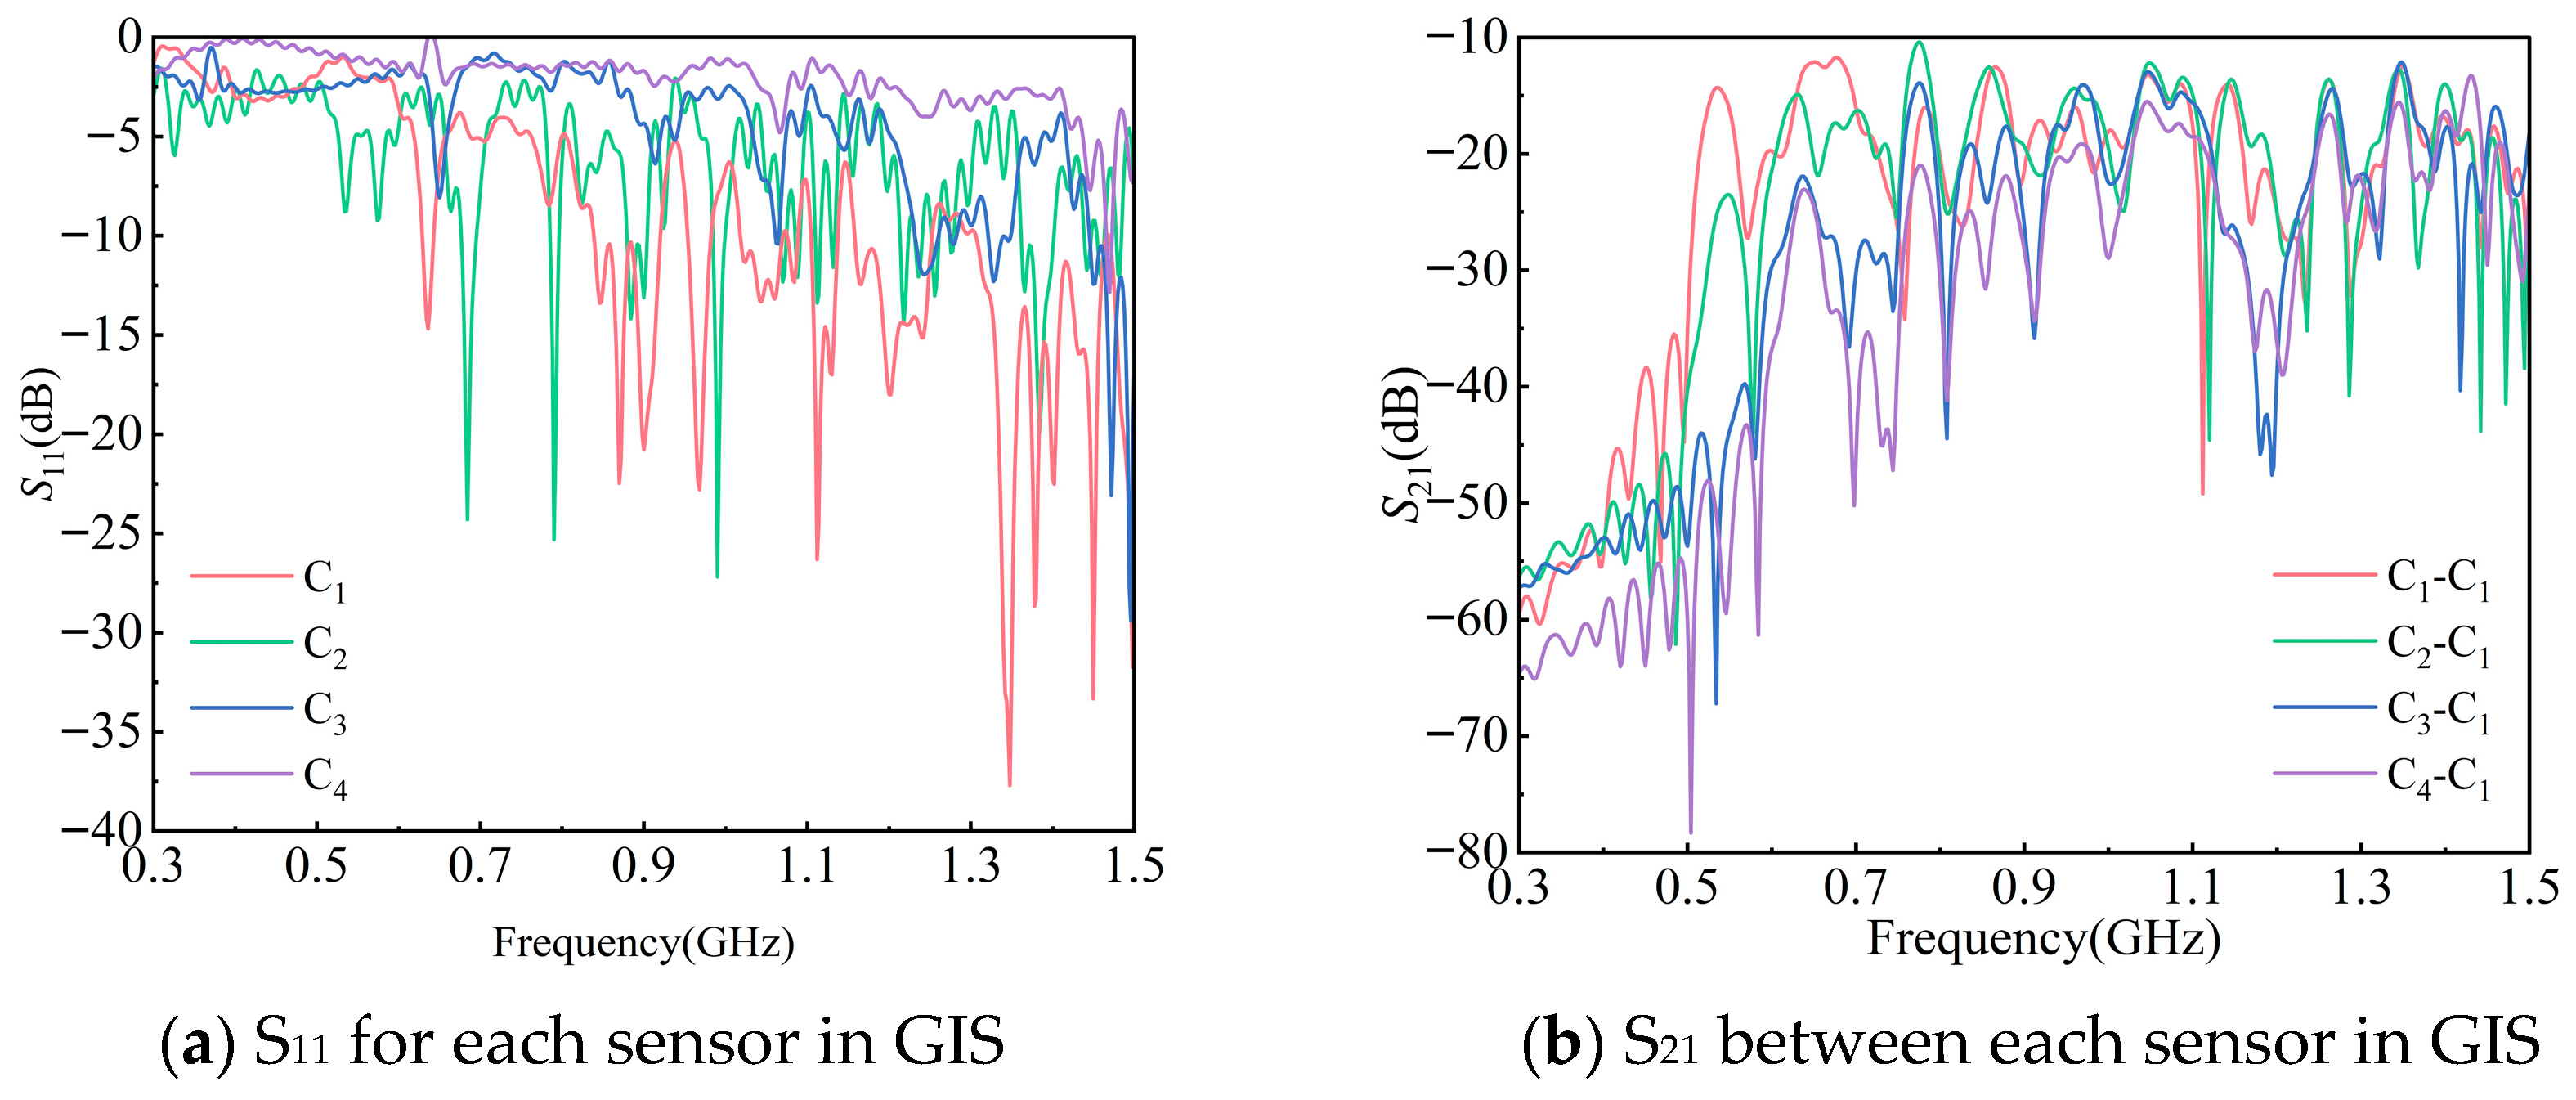
Due to the different performances of each sensor, the excited traveling waves have different wave processes within the GIS. Each model can be obtained as the S11 curve for each degraded sensor and the S21 curve between the normal sensor and each degraded sensor, respectively. Among them, the S11 for sensors C1, C2, C3, and C4 at GIS handhole 2 is shown in Figure 7a. The S21 between two sensors, C1-C1, C2-C1, C3-C1, and C4-C1, of the GIS is shown in Figure 7b.
S11 and S21 in Figure 6 are calculated as Equations (5) and (6) for the mean values in the detection band range, and the results of the calculations are summarized in Table 4.
The data calculated in Table 4 were analyzed:
(1) When UHF sensors for online monitoring are coupled to the handhole, the handhole is approximately equivalent to a circular waveguide, which has a ‘high-pass’ characteristic for S11, and the low-frequency band rises significantly when the low-frequency band is repeatedly refracted within the handhole. Compared to free space, the low-frequency band performance decreases when the sensor is operated inside the handhole.
(2) When the performance of a UHF sensor is degraded, the sensor’s ability to effectively radiate the signal is diminished and the reflected signal increases. This sensor’s S 11 ¯ in free space rises, which leads to a rise in its S 11 ¯ in the handhole. S11 can be used as an indicator for on-site verification.
When the performance of a UHF sensor is degraded, the S 21 ¯ between that sensor and its adjacent sensors is bound to drop due to the limitations of the passive reciprocal S-parameter network. S21 can be used as an indicator for on-site verification.

4. Experiments

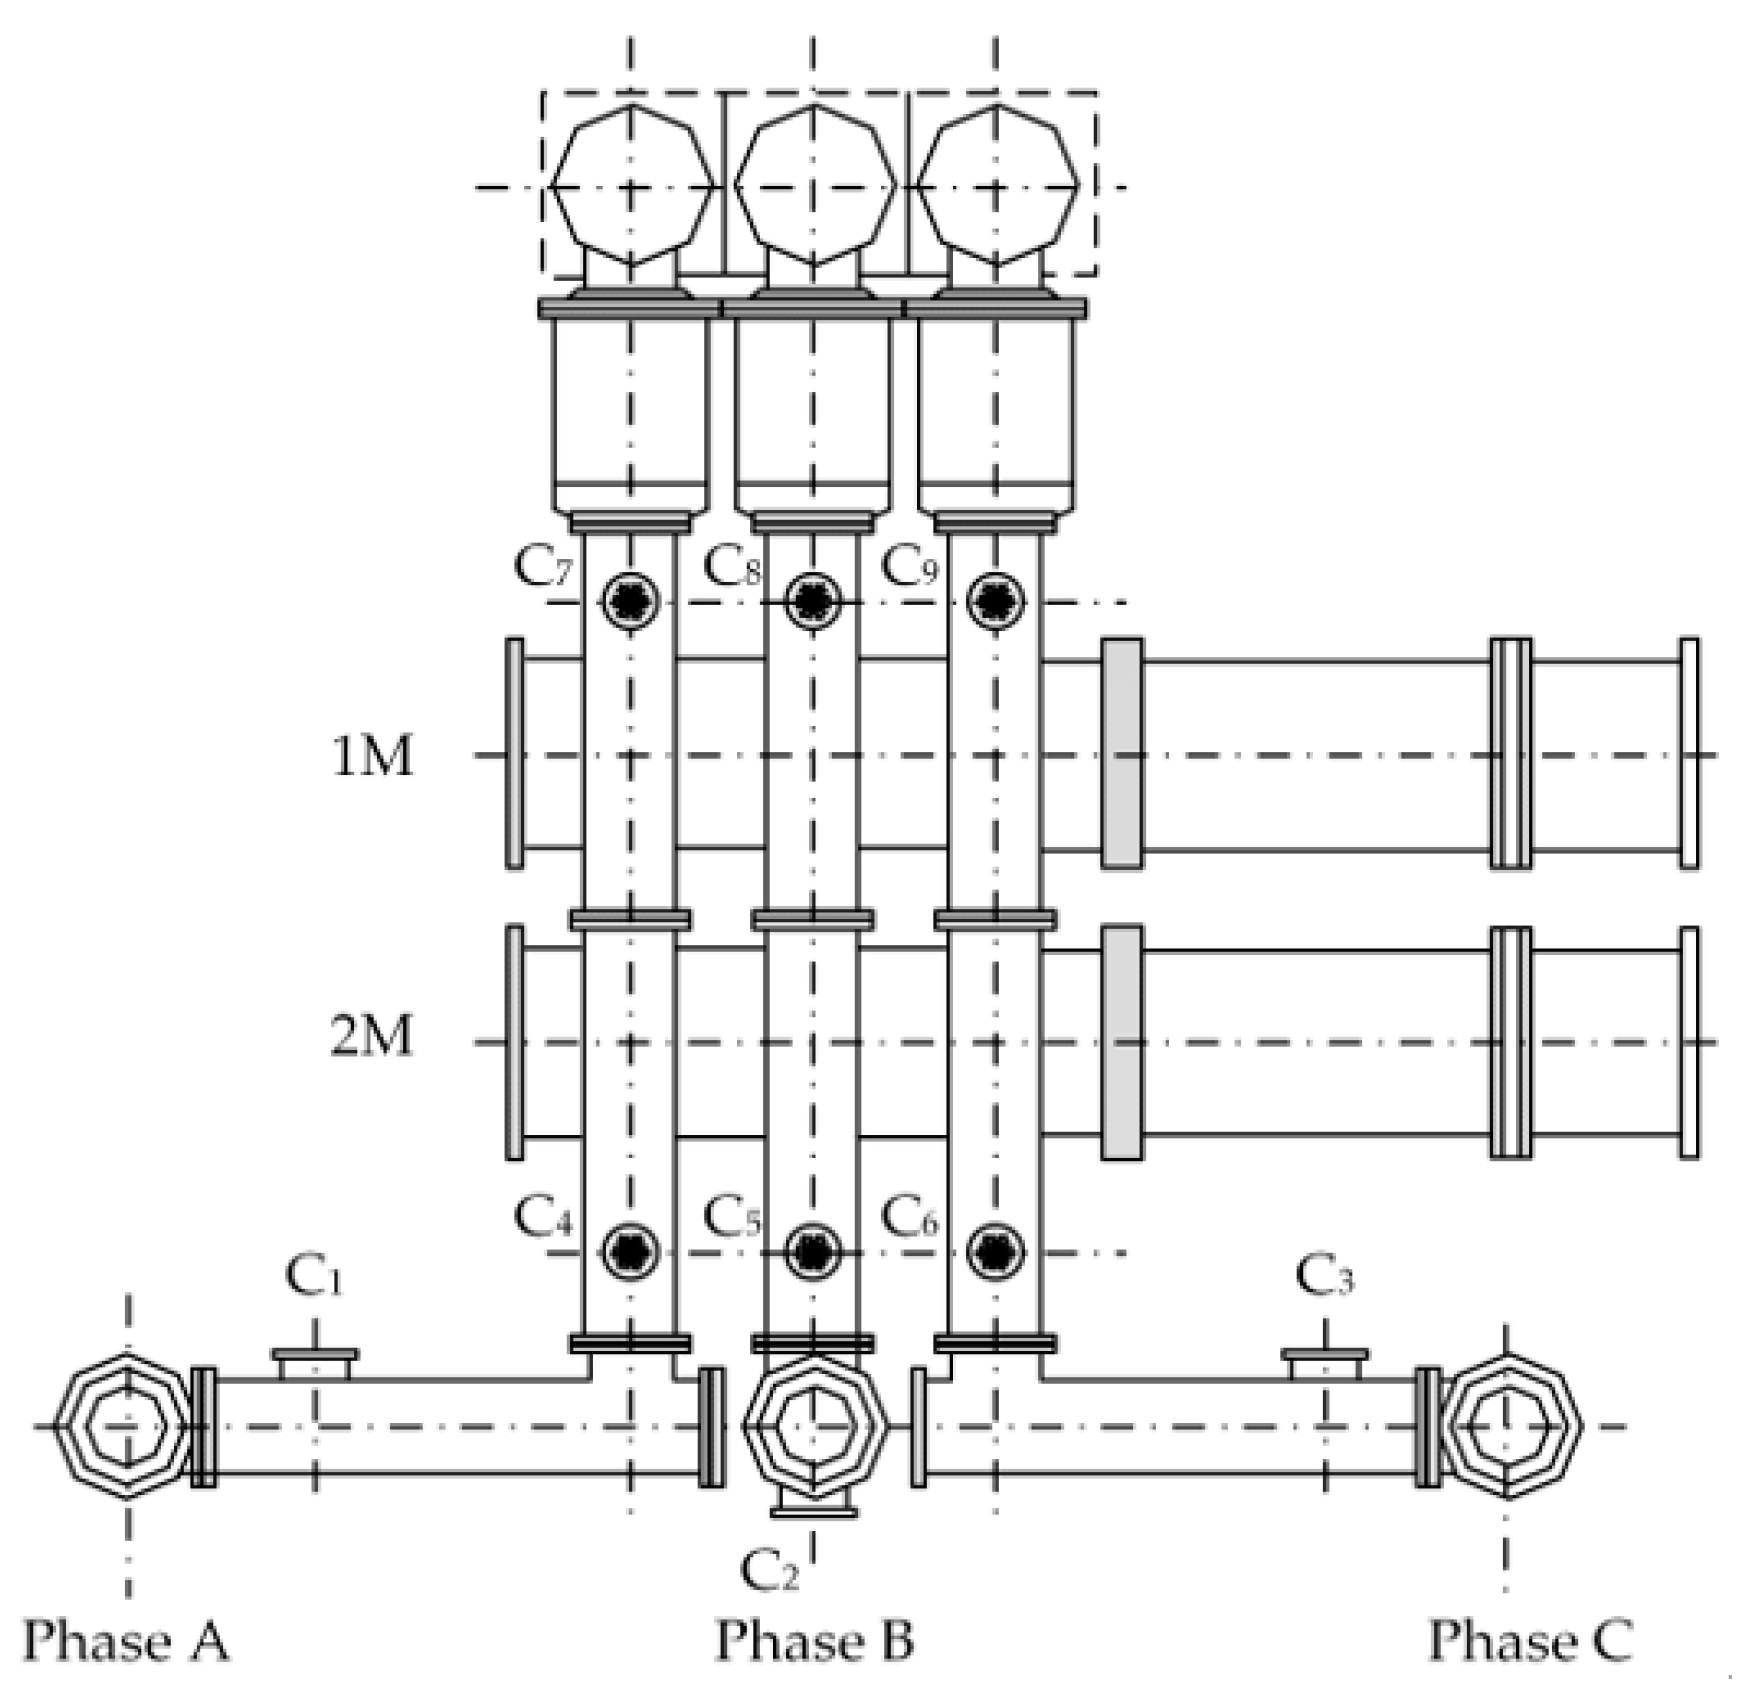
To verify the correctness of the proposed GIS UHF sensor verification method based on S11 and S21, we conducted on-site verification of UHF sensors of 500 kV GIS at a substation of Southern Power Grid Scientific Research Institute Co., Ltd., Guangzhou, China. This GIS structure is shown in Figure 8, containing typical gas chambers such as a straight-axis chamber, an L-shaped chamber, and an insulator structure, and the sensor numbering for this section is also shown in Figure 8. Field verification requires test instruments, including a network analyzer, an RF cable, an N-adapter, and a multimeter. The specific parameters of the test instruments are listed in Table 5.

4.1. Verification Process

The verification process is shown in Figure 3. The following is an example of cross-comparison verification for C1, C2, and C3, which illustrates the specific experimental method of UHF sensor verification.
Firstly, the UHF sensor C1 is verified in phase A. Port 1 of the network analyzer is connected to the port of sensor C1 using an RF cable, and port 2 is connected to the port of sensor C4 adjacent to C1. To measure the S11 of sensor C1, the S11 test option is selected in the network analyzer to sweep and save the data. To measure the S21 between C1 and C4, the S21 or S12 test option is selected in the network analyzer for sweeping and data saving. Next, sensor C2 of phase B is verified according to the wiring method described above, and then the S11 of C2 and S21 of C2-C5 are measured in turn. Finally, sensor C3 of phase C is verified in the same way, and S11 of C3 and S21 of C3-C6 are measured in turn. The mean value of the above curves is then calculate after the S-parameter curves of the three phases have been measured.
The GIS has a three-phase symmetrical structure, and the positions of the three-phase UHF sensors correspond to each other. For sensors at corresponding positions of different phases, both the S 11 ¯ of the sensors and the S 21 ¯ between the sensors should be essentially equivalent under normal conditions. Therefore, S 11 ¯ should be essentially equal for C1, C2, and C3, and S 21 ¯ should be essentially equal for C1-C4, C2-C5, and C3-C6. If the S 11 ¯ of a sensor is significantly higher than that of the other sensors or the S 21 ¯ between an adjacent sensor is significantly lower than that of the sensor at its corresponding position, it can be judged that the performance of that sensor is degraded.

4.2. Analysis of Experimental Results

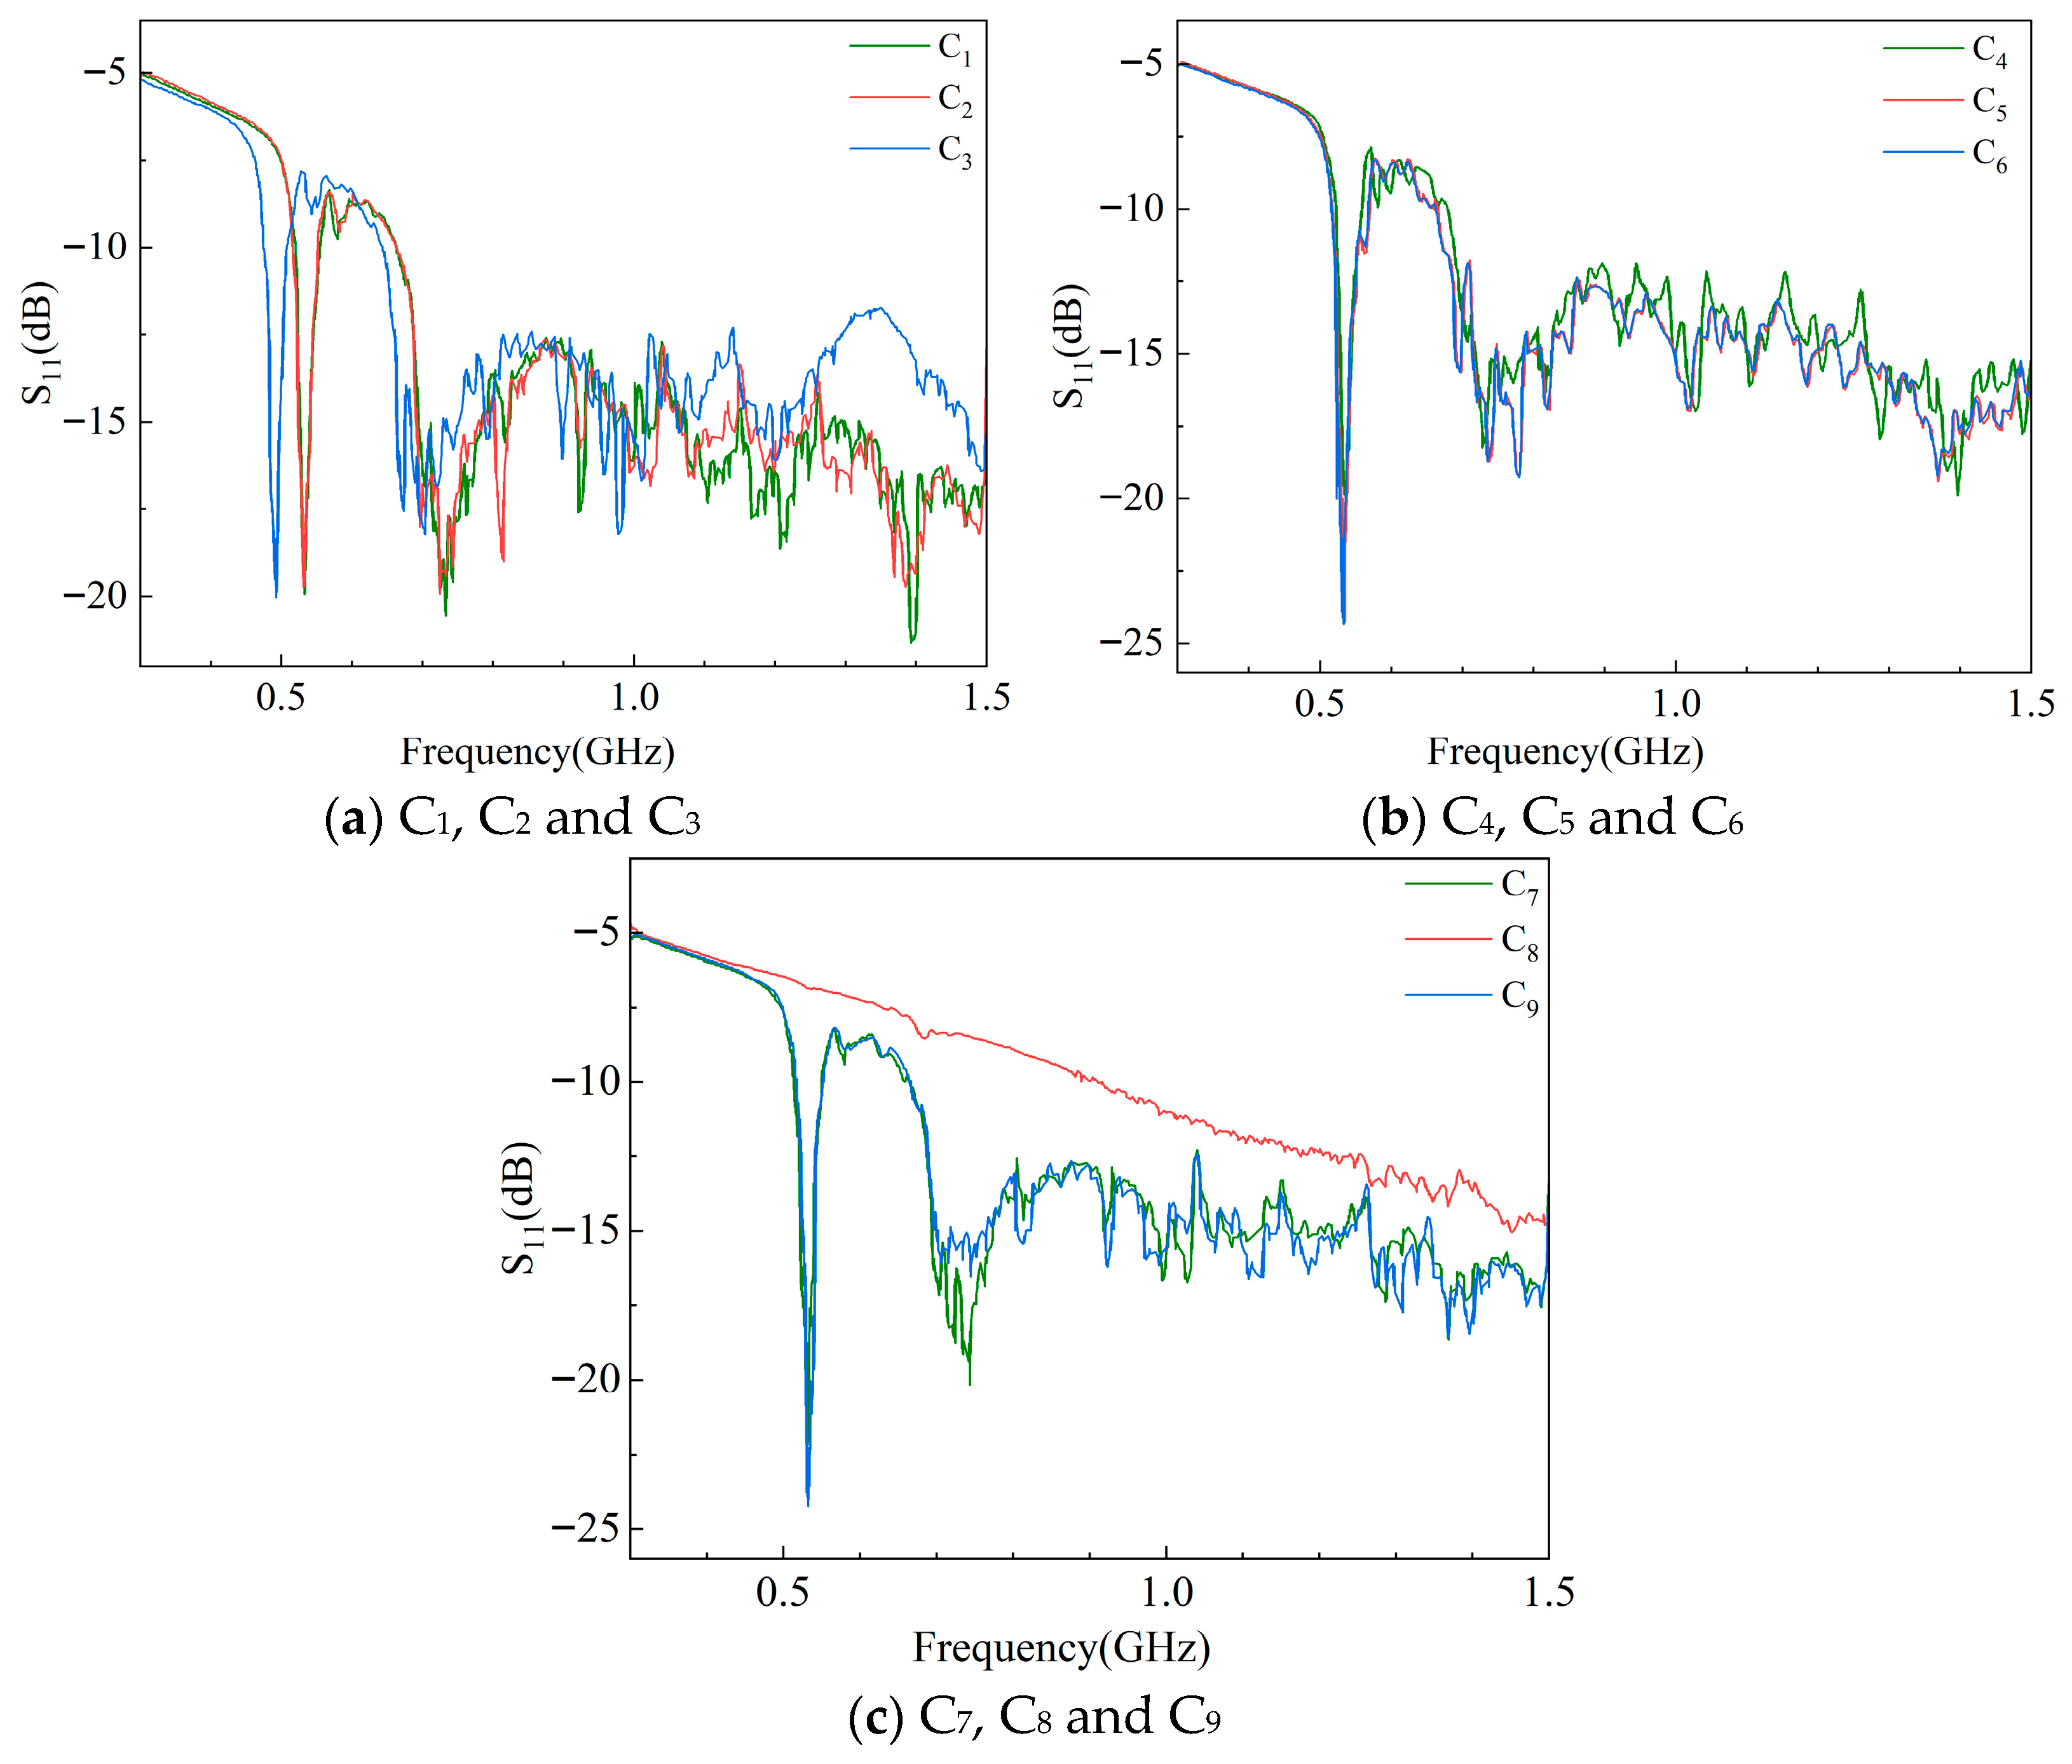
According to the above verification process, the measured S11 and S21 curves of the 500 KV GIS UHF sensor are shown in Figure 9 and Figure 10.
The measured S11 and S21 are basically similar to the waveforms obtained from simulation, but the curves oscillate more violently due to the large electromagnetic interference in the field. S11 has poor performance in the low-frequency band and has the lowest resonance point; S21 is small in the low-frequency band, increases with frequency, reaches its highest point, and then begins to decline and oscillate continuously. The reason for the overall lower S21 is that the two adjacent sensors of the actual GIS are farther apart and the double-ended insertion loss is greater.
The measured S 11 ¯ of each sensor and the S 21 ¯ between sensors can be obtained after calculation using Equations (5) and (6). In order to qualitatively describe the variation in S 11 ¯ and S 21 ¯ during the on-site verification of the GIS UHF sensors, the concept of percentage deviation was introduced. The defining equations for percentage deviation are
σ 11 = S 11 ¯ S b ¯ S b ¯
σ 21 = S 21 ¯ S b ¯ S b ¯
In Equations (9) and (10), S b ¯ is the S 11 ¯ or S 21 ¯ of the reference phase, and the phase in which the sensor has the best verification index at the corresponding positions of the three phases is selected as the reference phase. Therefore, the reference phase of σ 11 is the phase with the smallest S 11 ¯ at the corresponding three-phase position, and the reference phase of σ 21 is the phase with the largest S 21 ¯ at the corresponding three-phase position.
The results of the above calculations and analyses are summarized in Table 6 and Table 7. The S 11 ¯ of sensors C1, C2, and C3, the S 11 ¯ of sensors C4, C5, and C6, and the S 11 ¯ of sensors C7, C8, and C9 are compared. The S 21 ¯ between sensors C1-C4, C2-C5, and C3-C6 and the S 21 ¯ between sensors C4-C7, C5-C8, and C6-C9 are also compared.
Since the substation is a strong electromagnetic interference environment, the measured S11 and S21 of the three-phase sensors with good performance at their corresponding positions will have a small deviation from each other, which will lead to a minor deviation for the calculated mean value. When the deviation amount of S11 or the deviation amount of S21 exceeds 10%, it is considered that the S-parameter of this sensor has a larger deviation than the other two phases. This is mainly because a 10% deviation is already much more than the deviation due to random disturbances on-site. Thus, the performance of this sensor may be degraded and needs to be further checked with a multimeter.
The data calculated in Table 6 and Table 7 were analyzed:
(1) The difference between the S 11 ¯ of sensors C1 and C2 was very small, while the S 11 ¯ of C3 rose by 11.78% compared to C1, and the percentage deviation of S 11 ¯ was larger, exceeding 10%. The difference between the S 21 ¯ of C1-C4 and C2-C5 was smaller, while the S 21 ¯ of C3-C6 also decreased by 26.81% compared to the smallest value for C2-C5 at the corresponding position. As a result, UHF sensor C3 may have undergone performance degradation. After disassembly and further inspection, C3 was found to have deteriorated due to long-term high-temperature operation.
(2) The S 11 ¯ of C7 and C9 were closer, while the S 11 ¯ of C8 increased by 26.60% over C7. The difference in S 21 ¯ between C4-C7 and C6-C9 was very small, while the S 21 ¯ of C5-C8 decreased by 20.71% compared to C6-C9. Compared to the sensors at the corresponding positions in phases A and C, both S 11 ¯ and S 21 ¯ of C8 underwent significant deviations. By using a multimeter to measure the resistance of sensor C8, it could be found that its resistance value was close to 0. A short-circuit fault may have occurred inside this sensor.
(3) Apart from sensors C3 and C8, the other UHF sensors in Figure 8 did not show significant deviations while verifying S 11 ¯ and S 21 ¯ , indicating that these sensors performed well overall and did not undergo significant degradation.
(4) S-parameters are phase quantities, and the S11 and S21 measured during verification were given as their real parts. If S11 or S21 is used alone as a verification index, when the performance of a UHF sensor decreases, there may be a situation in which the real part does not change much, which in turn affects the accuracy of the verification results. In addition, S11 has better interference immunity compared to S21. Therefore, the S 11 ¯ and S 21 ¯ of the sensors corresponding to the structure of the three phases A, B, and C of the GIS should be compared with each other at the same time during verification. When one of the deviation percentages of S 11 ¯ or S 21 ¯ exceeds 10%, the sensor should be further checked even if the other S-parameter indicator does not change too much.

5. Conclusions

Although the proposed verification method demonstrated good performance in distinguishing between various types of sensor degradation, the influence of sensor sensitivity on the accuracy of S-parameter assessment was not quantitatively analyzed in this study. The sensitivity of UHF sensors may vary with installation conditions, aging level, and signal coupling efficiency, which could introduce additional uncertainty into the verification results. A detailed sensitivity analysis and quantitative evaluation will therefore be included in our future research work.
The simulation model developed in this study verified the fundamental characteristics of S11 and S21 during the calibration of GIS ultra-high-frequency (UHF) sensors. When the performance of the UHF sensor decreases, its ability to radiate an effective signal decreases and the amount of reflection increases, which can result in a rise in S11 measured at the handhole for that sensor as well as a fall in S21 between adjacent sensors. When the performance of the sensor is degraded, in some cases S21 may not change much. The S11 of the sensor to be verified and its S21 with the adjacent sensors should be measured at the same time, and a judgment should be made by combining the changes in S11 and S21 to improve the accuracy of the verification results.
GIS is a three-phase symmetry. When the sensor is normal, the S11 and S21 of the three-phase sensor corresponding to its position should be similar, and the average value of S11 and S21 should be close. When the performance of the sensor is degraded, there is an S 11 ¯ rise or S 21 ¯ fall compared to the other sensors in their corresponding positions. In this paper, the degraded sensors were modeled, and they were coupled in GIS to simulate the real situation of on-site verification, which verified the correctness of the proposed theory of S11 and S21 changes. Based on the simulation, the S11 of the sensor and the S21 between the sensors were measured on the 500 kV GIS of the Southern Power Grid Scientific Research Institute Co., Ltd., and then analyzed according to the cross-comparison method. The comparative analysis of S11 and S21 has been demonstrated to be an effective method for verifying the performance of on-site ultra-high-frequency (UHF) sensors [31,32]. Furthermore, the proposed simulation model exhibits high accuracy and reliability, providing a solid foundation for subsequent studies on the calibration of GIS UHF sensors.

Author Contributions

Author Contributions: T.C. conceived the presented idea. Y.C. and W.L. developed the simulation model. F.Z. and K.L. conducted the on-site experiment. X.C. and L.W. calculated and checked all data. H.T. wrote this article. All authors have read and agreed to the published version of the manuscript.

Funding

This work was funded by the grant number SEPRI-K243003 of Southern Power Grid Scientific Research Institute Co., Ltd.

Data Availability Statement

Data are contained within the article.

Acknowledgments

We sincerely thank Lujia Wang and graduate student Chunxu Fang of China University of Mining and Technology for providing theoretical research and simulation support for this article during the research and writing process.

Conflicts of Interest

Authors Tienan Cao, Yufei Cui, Haotian Tan, Wei Lu, Fuzeng Zhang, Kai Liu and Xiaoguo Chen were employed by the Southern Power Grid Scientific Research Institute Co., Ltd. company. The remaining authors declare that the research was conducted in the absence of any commercial or financial relationships that could be construed as a potential conflict of interest. The funding sponsors had no role in design of the study; in the collection, analyses or interpretation of data; in the writing of the manuscript; or in the decision to publish the results.

References

  1. Schichler, U.; Koltunowicz, W.; Gautschi, D.; Girodet, A.; Hama, H.; Juhre, K.; Lopez-Roldan, J.; Okabe, S.; Neuhold, S.; Neumann, C.; et al. UHF Partial Discharge Detection System for GIS: Application Guide for Sensitivity Verification. In VDE High Voltage Technology 2016; ETG-Symposium: Berlin, Germany, 2016; pp. 1–9. [Google Scholar]
  2. Metwally, I. Status review on partial discharge measurement techniques in gas-insulated switchgear/lines. Electr. Power Syst. Res. 2004, 69, 25–36. [Google Scholar] [CrossRef]
  3. Chai, H.; Phung, B.; Mitchell, S. Application of UHF Sensors in Power System Equipment for Partial Discharge Detection: A Review. Sensors 2019, 19, 1029. [Google Scholar] [CrossRef] [PubMed]
  4. Behrmann, G.J.; Gross, D.; Neuhold, S. Limitations of Attempting Calibration of Partial Discharge Measurements in VHF and UHF Ranges. In Proceedings of the 2020 IEEE Conference on Electrical Insulation and Dielectric Phenomena (CEIDP), East Rutherford, NJ, USA, 18–30 October 2020; pp. 155–159. [Google Scholar]
  5. Escurra, C.M. VHF Magnetic and Electric Sensors for Partial Discharge Measurements in GIS. Ph.D. Thesis, Delft University of Technology, Delft, The Netherlands, 2024. [Google Scholar]
  6. Xavier, G.V.R.; Silva, H.S.; da Costa, E.G.; Serres, A.J.R.; Carvalho, N.B.; Oliveira, A.S.R. Detection, Classification and Location of Sources of Partial Discharges Using the Radiometric Method: Trends, Challenges and Open Issues. IEEE Access 2021, 9, 110787–110810. [Google Scholar] [CrossRef]
  7. Ishak, A.M.b. Calibration and Design of UHF Partial Discharge Sensors Using Finite-Difference Time-Domain Modelling. Ph.D. Thesis, University of Strathclyde, Glasgow, UK, 2013. [Google Scholar]
  8. Pan, J.; Gao, Q.; Liu, Q.; Guo, Z.; Yuan, F.; Pan, F. Field Calibration Method of GIS Partial Discharge UHF Sensor Based on Network Analyzer. In Proceedings of the 2017 International Conference on Computer Technology, Electronics and Communication (ICCTEC), Dalian, China, 19–21 December 2017; pp. 834–838. [Google Scholar]
  9. Tang, J.; Xu, Z.; Zhang, X.; Sun, C. GIS partial discharge quantitative measurements using UHF microstrip antenna sensors. In Proceedings of the 2007 Annual Report—Conference on Electrical Insulation and Dielectric Phenomena, Vancouver, BC, Canada, 14–17 October 2007; pp. 116–119. [Google Scholar]
  10. Hussain, G.A.; Hassan, W.; Mahmood, F.; Shafiq, M.; Rehman, H.; Kay, J.A. Review on Partial Discharge Diagnostic Techniques for High Voltage Equipment in Power Systems. IEEE Access 2023, 11, 51382–51394. [Google Scholar] [CrossRef]
  11. Siegel, M.; Coenen, S.; Beltle, M.; Tenbohlen, S.; Weber, M.; Fehlmann, P.; Hoek, S.M.; Kempf, U.; Schwarz, R.; Linn, T.; et al. Calibration Proposal for UHF Partial Discharge Measurements at Power Transformers. Energies 2019, 12, 3058. [Google Scholar] [CrossRef]
  12. BHabib, B.; Al Zaabi, O.; Harid, N.; Al Hosani, K.; Alkhatib, M. Condition Monitoring Based on Partial Discharge Diagnostics Using UHF Sensors: A Comprehensive State-of-the-Art Review. IEEE Trans. Dielectr. Electr. Insul. 2024, 31, 2860–2873. [Google Scholar]
  13. Roslizan, N.D.; Rohani, M.N.K.H.; Wooi, C.L.; Isa, M.; Ismail, B.; Rosmi, A.S.; Mustafa, W.A. A Review: Partial Discharge Detection using UHF sensor on High Voltage Equipment. J. Phys. Conf. Ser. 2020, 1432, 012003. [Google Scholar] [CrossRef]
  14. Chen, H.; Wang, H.; Zhang, Z.; Guo, R.; Han, X.; Zhang, X.; Li, J. A Novel Composite Sensor for UHF Partial Discharge and Gas State Measurement in GIS. IEEE Trans. Instrum. Meas. 2024, 73, 1501410. [Google Scholar] [CrossRef]
  15. Mor, A.R.; Heredia, L.C.C.; Muñoz, F.A. A Novel Approach for Partial Discharge Measurements on GIS Using HFCT Sensors. Sensors 2018, 18, 4482. [Google Scholar] [CrossRef] [PubMed]
  16. Darwish, A.N.A. Design and Modeling of UHF Partial Discharge Sensors: FE-Based PD Signal Propagation in High Voltage Systems. Ph.D. Thesis, Texas A&M University, College Station, TX, USA, 2021. [Google Scholar]
  17. Zhou, L.; Tan, X.; Yan, J.; Shaoquan, Z. GIS UHF Partial Discharge On-line Monitoring Device Evaluation. IOP Conf. Ser. Mater. Sci. Eng. 2018, 439, 052026. [Google Scholar] [CrossRef]
  18. Mahdi, A.S.; Abdul-Malek, Z.; Arshad, R.N. SF6 Decomposed Component Analysis for Partial Discharge Diagnosis in GIS: A Review. IEEE Access 2022, 10, 27270–27288. [Google Scholar] [CrossRef]
  19. Shu, S.; Chen, J.; Chen, B.; Huang, H.; Ye, Z.; Chen, M.; Liu, C. A field calibration method based on forward transport coefficient for UHF partial discharge detection sensors in GIS. In Proceedings of the 2016 IEEE International Conference on High Voltage Engineering and Application (ICHVE), Chengdu, China, 19–22 September 2016; pp. 1–4. [Google Scholar]
  20. Birla, R.; Mohammad, S.; Hashmi, G.; Zahrani, M. Partial Discharge Monitoring to Predict Failures in 230 kV GIS Substation using UHF and Ultrasonic Sensors. In Proceedings of the 2024 IEEE Electrical Insulation Conference (EIC), Minneapolis, MN, USA, 2–5 June 2024; pp. 112–116. [Google Scholar]
  21. Liang, R.; Wu, S.; Chi, P.; Peng, N.; Li, Y. Optimal Placement of UHF Sensors for Accurate Localization of Partial Discharge Source in GIS. Energies 2019, 12, 1173. [Google Scholar] [CrossRef]
  22. Álvarez, F.; Garnacho, F.; Ortego, J.; Sánchez-Urán, M.Á. Application of HFCT and UHF Sensors in On-Line Partial Discharge Measurements for Insulation Diagnosis of High Voltage Equipment. Sensors 2015, 15, 7360–7387. [Google Scholar] [CrossRef] [PubMed]
  23. Yadam, Y.R.; Sarathi, R.; Arunachalam, K. Numerical and Experimental Investigations on Influence of Internal Defect Parameters on Partial Discharge Induced UHF Signals in Gas Insulated Switchgear. IEEE Access 2022, 10, 110785–110795. [Google Scholar] [CrossRef]
  24. Shao, X.; He, W.; Xu, J.; Zhu, M.; Zhang, G. Partial discharge detection by extracting UHF signal from inner grading electrode of insulating spacer in GIS. IET Sci. Meas. Technol. 2018, 12, 90–97. [Google Scholar] [CrossRef]
  25. Mier, C.; Mor, A.R.; Castro, L.; Vaessen, P. Magnetic and electric antennas calibration for partial discharge charge estimation in gas-insulated substations. Int. J. Electr. Power Energy Syst. 2022, 141, 108226. [Google Scholar] [CrossRef]
  26. Rao, M.M.; Kumar, M. Ultra-High Frequency (UHF) Based Partial Discharge Measurement in Gas Insulated Switchgear (GIS). In Proceedings of the 2019 International Conference on High Voltage Engineering and Technology (ICHVET), Hyderabad, India, 7–8 February 2019; pp. 1–5. [Google Scholar]
  27. Escurra, C.M.; Khamlichi, A.; Dalstein, M.; Vidal, J.R.; Garnacho, F.; Mor, A.R.; Vu-Cong, T. Methods for Partial Discharge Calibration in Gas-Insulated Substations for HVDC Power Grids and Charge Evaluation Uncertainty. IEEE Sens. J. 2023, 23, 23486–23493. [Google Scholar] [CrossRef]
  28. Ahmed, R.; Abd-Rahman, R.; Ullah, Z.; Ullah, R.; Yousof, M.F.M.; Ullah, K. Partial Discharge Characterization of HFO(E) Gas Using Ultra-High Frequency (UHF) Antenna for Medium Voltage Switchgear Application. IEEE Access 2024, 12, 81196–81205. [Google Scholar] [CrossRef]
  29. Zhang, K.; Reid, A.; Clark, D.; Michelarakis, M.; Haddad, A.M. Diagnostics of Partial Discharge Measurements Utilizing Multi-Sensor Temporal Pulse Sequence Analysis. IEEE Access 2024, 12, 88992–89001. [Google Scholar] [CrossRef]
  30. Wu, X.; Han, X.; Zhang, L.; Li, X.; Ma, Y.; Li, J. Study on PD detection method in GIS under oscillating impulse voltage based on UHF method. In Proceedings of the 2017 1st International Conference on Electrical Materials and Power Equipment (ICEMPE), Xi’an, China, 14–17 May 2017; pp. 305–308. [Google Scholar] [CrossRef]
  31. Xu, H.; Yuan, C.; Ding, X.; Xu, Z.; Zhu, L. Simulation study of partial discharge UHF signal propagation characteristics in GIS. J. Phys. Conf. Ser. 2023, 2661, 012021. [Google Scholar] [CrossRef]
  32. Wang, S.; Xu, P.; Ren, M.; Li, S.; Ji, Y. Propagation Characteristics of UHF Partial Discharge Signals in GIS. In Proceedings of the 2023 8th Asia Conference on Power and Electrical Engineering (ACPEE), Tianjin, China, 14–16 April 2023; pp. 1470–1474. [Google Scholar] [CrossRef]
Figure 1. S-parameters network.
Sensors 25 06860 g001
Figure 2. Wave process during GIS verification.
Sensors 25 06860 g002
Figure 3. UHF sensor verification process based on S11 and S21 cross-comparison.
Sensors 25 06860 g003
Figure 4. UHF antenna simulation model.
Sensors 25 06860 g004
Figure 5. S11 of sensors with different performances.
Sensors 25 06860 g005
Figure 6. GIS verification model for each UHF sensor.
Sensors 25 06860 g006
Figure 7. S-parameter curves from simulation.
Sensors 25 06860 g007
Figure 8. Schematic diagram of the GIS structure for verification.
Sensors 25 06860 g008
Figure 9. S11 curves of sensors measured on-site.
Sensors 25 06860 g009
Figure 10. S21 curves between sensors measured on-site.
Sensors 25 06860 g010
Table 1. Parameter setting for sensor C1.
ParameterAssigned Value
Spiral inner diameter 2 r0/mm10
Spiral outer diameter rm/mm166
Spiral linewidth W/mm7.7
Number of turns N3.7
Spiral thickness D/mm0.035
Substrate radius r/mm90
Substrate thickness d/mm0.15
Substrate relative permittivity εr4.6
Table 2. Parameter adjustment for each typical deteriorated sensor.
Sensor IDParameter Adjustment
C2Local relative permittivity εr increased to 6
C3coil turns; N reduced to 1.7
C4Antenna feed port disconnected
Table 3. S 11 ¯ for each sensor model.
Calibration IndexC1C2C3C4
S 11 ¯ −11.343−6.607−5.459−2.315
Table 4. Data analysis for each sensor.
Sensor Number S 11 ¯ /dB S 21 ¯ /dB
C1−9.264−24.513
C2−6.382−25.681
C3−4.610−29.520
C4−2.052−33.441
Table 5. UHF verification equipment and its parameters.
SerialNamePerformance Parameters
1multimeterThe maximum rated voltage should be no less than 800 V AC
2N-type adapterL-shaped 2 pieces (male connects to female), T-shaped 2 pieces (1 male connector and 2 female connectors)
3RF cableThe attenuation characteristic should not exceed 3 dB
4network analyzerS11, S21 parametric test function
frequency range: 1 MHz to 6.5 GHz
test frequency interval not greater than 2 MHz
5UHF sensorfrequency range: 500 MHz to 1500 MHz
sensitivity: −70 dBm
gain: 20 dBm
Table 6. S 11 ¯ analysis for each sensor.
Sensor Number S 11 ¯ /dB σ 11 /%Qualified
C1−15.3090yes
C2−14.4715.47yes
C3−13.50511.78no
C4−13.7554.91yes
C5−14.3350.90yes
C6−14.4650yes
C7−14.0771.08yes
C8−10.44526.60no
C9−14.2310yes
Table 7. S 21 ¯ analysis between each sensor.
Sensor Number S 11 ¯ /dB σ 21 /%Qualified
C1-C4−72.1297.72yes
C2-C5−66.9590yes
C3-C6−84.91526.81no
C4-C7−73.2173.96yes
C5-C8−85.01820.71no
C6-C9−70.4300yes
Disclaimer/Publisher’s Note: The statements, opinions and data contained in all publications are solely those of the individual author(s) and contributor(s) and not of MDPI and/or the editor(s). MDPI and/or the editor(s) disclaim responsibility for any injury to people or property resulting from any ideas, methods, instructions or products referred to in the content.