


Abstract
Urban small wetlands face eutrophication. Using 15 small wetlands in Jinan, China, we analyzed phytoplankton community and trait responses to eutrophication. Based on autumn TLI (2020–2022), wetlands were classified into oligotrophic (3), mesotrophic (6), and lightly eutrophic (6). We evaluated functional α/β-diversity, phytoplankton standing biomass (a proxy for productivity), and resource use efficiency (RUE, biomass/TP). Total nitrogen, total phosphorus, and Chl-a increased with eutrophication, reaching 6.83, 0.14, and 0.03 mg/L in lightly eutrophic sites. Species richness, Shannon, and Simpson indices were highest in lightly eutrophic sites (25, 2.75, and 0.71, respectively), whereas functional richness was highest in oligotrophic sites (0.14). Taxonomic β-diversity was dominated by turnover components (63.7–73.7%), while functional β-diversity was dominated by nestedness components (79.7–97.1%). Mean phytoplankton standing biomass and RUE increased with eutrophication, reaching 44.79 mg/Land 350.64 in lightly eutrophic conditions. Biodiversity–ecosystem function relationships were gradient-dependent. Species richness positively correlated with standing biomass in mesotrophic and lightly eutrophic sites (p < 0.05), while evenness negatively correlated with standing biomass and RUE across all trophic grades (p < 0.05). Overall, these results reveal complex responses of phytoplankton community structure and function to eutrophication in small urban wetlands. The nestedness-dominated functional β-diversity reflects differences that arise mainly through nestedness rather than species turnover. We recommend incorporating these small wetlands into routine monitoring frameworks and prioritizing functional diversity in ecological health assessments.
1. Introduction
Urban wetlands are indispensable components of urban ecosystems and deliver irreplaceable ecological services, including biodiversity conservation, water purification, hydrological regulation and landscape recreation [1]. Nevertheless, rapid urbanization has led to excessive nitrogen (N) and phosphorus (P) loading in urban waterbodies, making eutrophication the dominant environmental stressor that impairs the ecological integrity and health of urban wetlands [2]. Among various urban aquatic habitats, small wetlands (generally defined as having an area below 8 ha) are highly sensitive and pivotal components of urban aquatic ecosystems. Their large number, wide distribution and close spatial overlap with human activities jointly determine their ecological importance [3]. Previous studies have shown that small wetlands have a high perimeter-to-area ratio, a structural characteristic that promotes intense material and energy exchange with surrounding environments. Accordingly, these small waterbodies respond faster and more intensely to external nutrient loading than larger aquatic ecosystems [4,5]. Studies have reported that small wetlands remove nitrogen and phosphorus three to five times more efficiently than large waterbodies and exhibit a substantially higher dissolved oxygen consumption rate. These inherent characteristics make small aquatic systems key hotspots of nutrient retention and greenhouse gas emissions, and systematic research on eutrophication in urban small wetlands possesses important scientific value and practical implications [6]. This research helps reveal the degradation mechanisms of urban aquatic ecosystems and provides a basis for targeted restoration measures.
As key primary producers in aquatic ecosystems, phytoplankton have short generation cycles and are highly sensitive to environmental changes. Their community structure and functional traits respond rapidly to shifts in trophic conditions, making them excellent bioindicators for assessing aquatic environmental quality [7,8,9]. With the development of eutrophication, phytoplankton show distinct variations in species composition, dominant assemblages, biomass and biodiversity [2]. In recent years, analytical frameworks based on functional traits and functional diversity have offered new insights into the adaptation of phytoplankton to eutrophication stress [3,10,11]. Classifying phytoplankton based on morphological traits and ecophysiological strategies can effectively clarify the ecological relationships between phytoplankton communities and environmental factors and overcome the limitations of traditional taxonomic analyses [12]. Functional group classification is widely used in ecological studies of lakes and rivers [13,14]. Nevertheless, few relevant studies have focused on urban small wetlands, unique but understudied aquatic ecosystems.
Known as the “City of Springs”, Jinan has numerous urban wetlands that are increasingly affected by eutrophication [15]. Previous studies indicated that typical local waterbodies, such as Daming Lake [16], Jixi Wetland [17], and the Xiaoqing River [18], range from being mesotrophic to lightly eutrophic, thus forming a continuous nutrient gradient from oligotrophy to eutrophy. This natural gradient provides an ideal research scenario for exploring ecological responses to varying nutrient concentrations.
The responses of phytoplankton communities and their functional traits to eutrophication gradients in urban small wetlands remain poorly understood, and this major knowledge gap arises from two main factors. Restricted by small catchment areas, low natural self-purification capacity and intense human disturbance, small wetlands are inherently environmentally vulnerable and ecologically sensitive [19]. However, most existing phytoplankton surveys focus on medium and large water bodies, and small wetland ecosystems remain largely understudied. Second, while functional group classification can explain phytoplankton patterns well in large aquatic ecosystems [20,21,22], it has rarely been applied to small wetlands. Field validation is, therefore, urgently required to clarify its applicability and response trends in these unique habitats.
To fill these research gaps, we investigated 15 urban small wetlands across Jinan. With the comprehensive trophic level index applied to quantify water trophic status, we systematically characterized the shifts in phytoplankton community composition, taxonomic α/β-diversity, functional α/β-diversity, phytoplankton standing biomass (a proxy for productivity) and resource-use efficiency along eutrophication gradients. We further disentangled the correlations between multi-faceted phytoplankton biodiversity and ecosystem functioning. Three core research questions were formulated: (1) How does eutrophication affect phytoplankton community structure and function? (2) What environmental variables are associated with phytoplankton community change along eutrophication gradients? (3) How can we manage and restore urban small wetlands to improve water quality and ecosystem function?
2. Materials and Methods
2.1. Study Area
The study was conducted across Jinan City, Shandong Province, China (36°01′–37°32′ N, 116°11′–117°44′ E). This area has a warm temperate semi-humid continental monsoon climate, with a mean annual temperature of 13.6 °C and annual precipitation of approximately 650 mm [23,24].
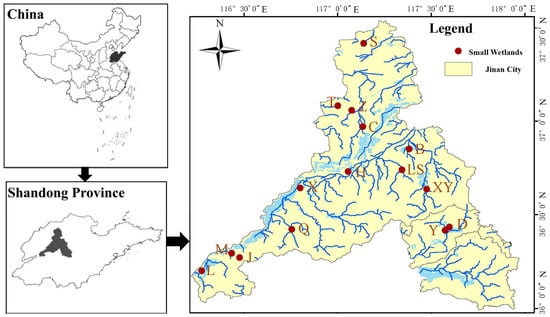
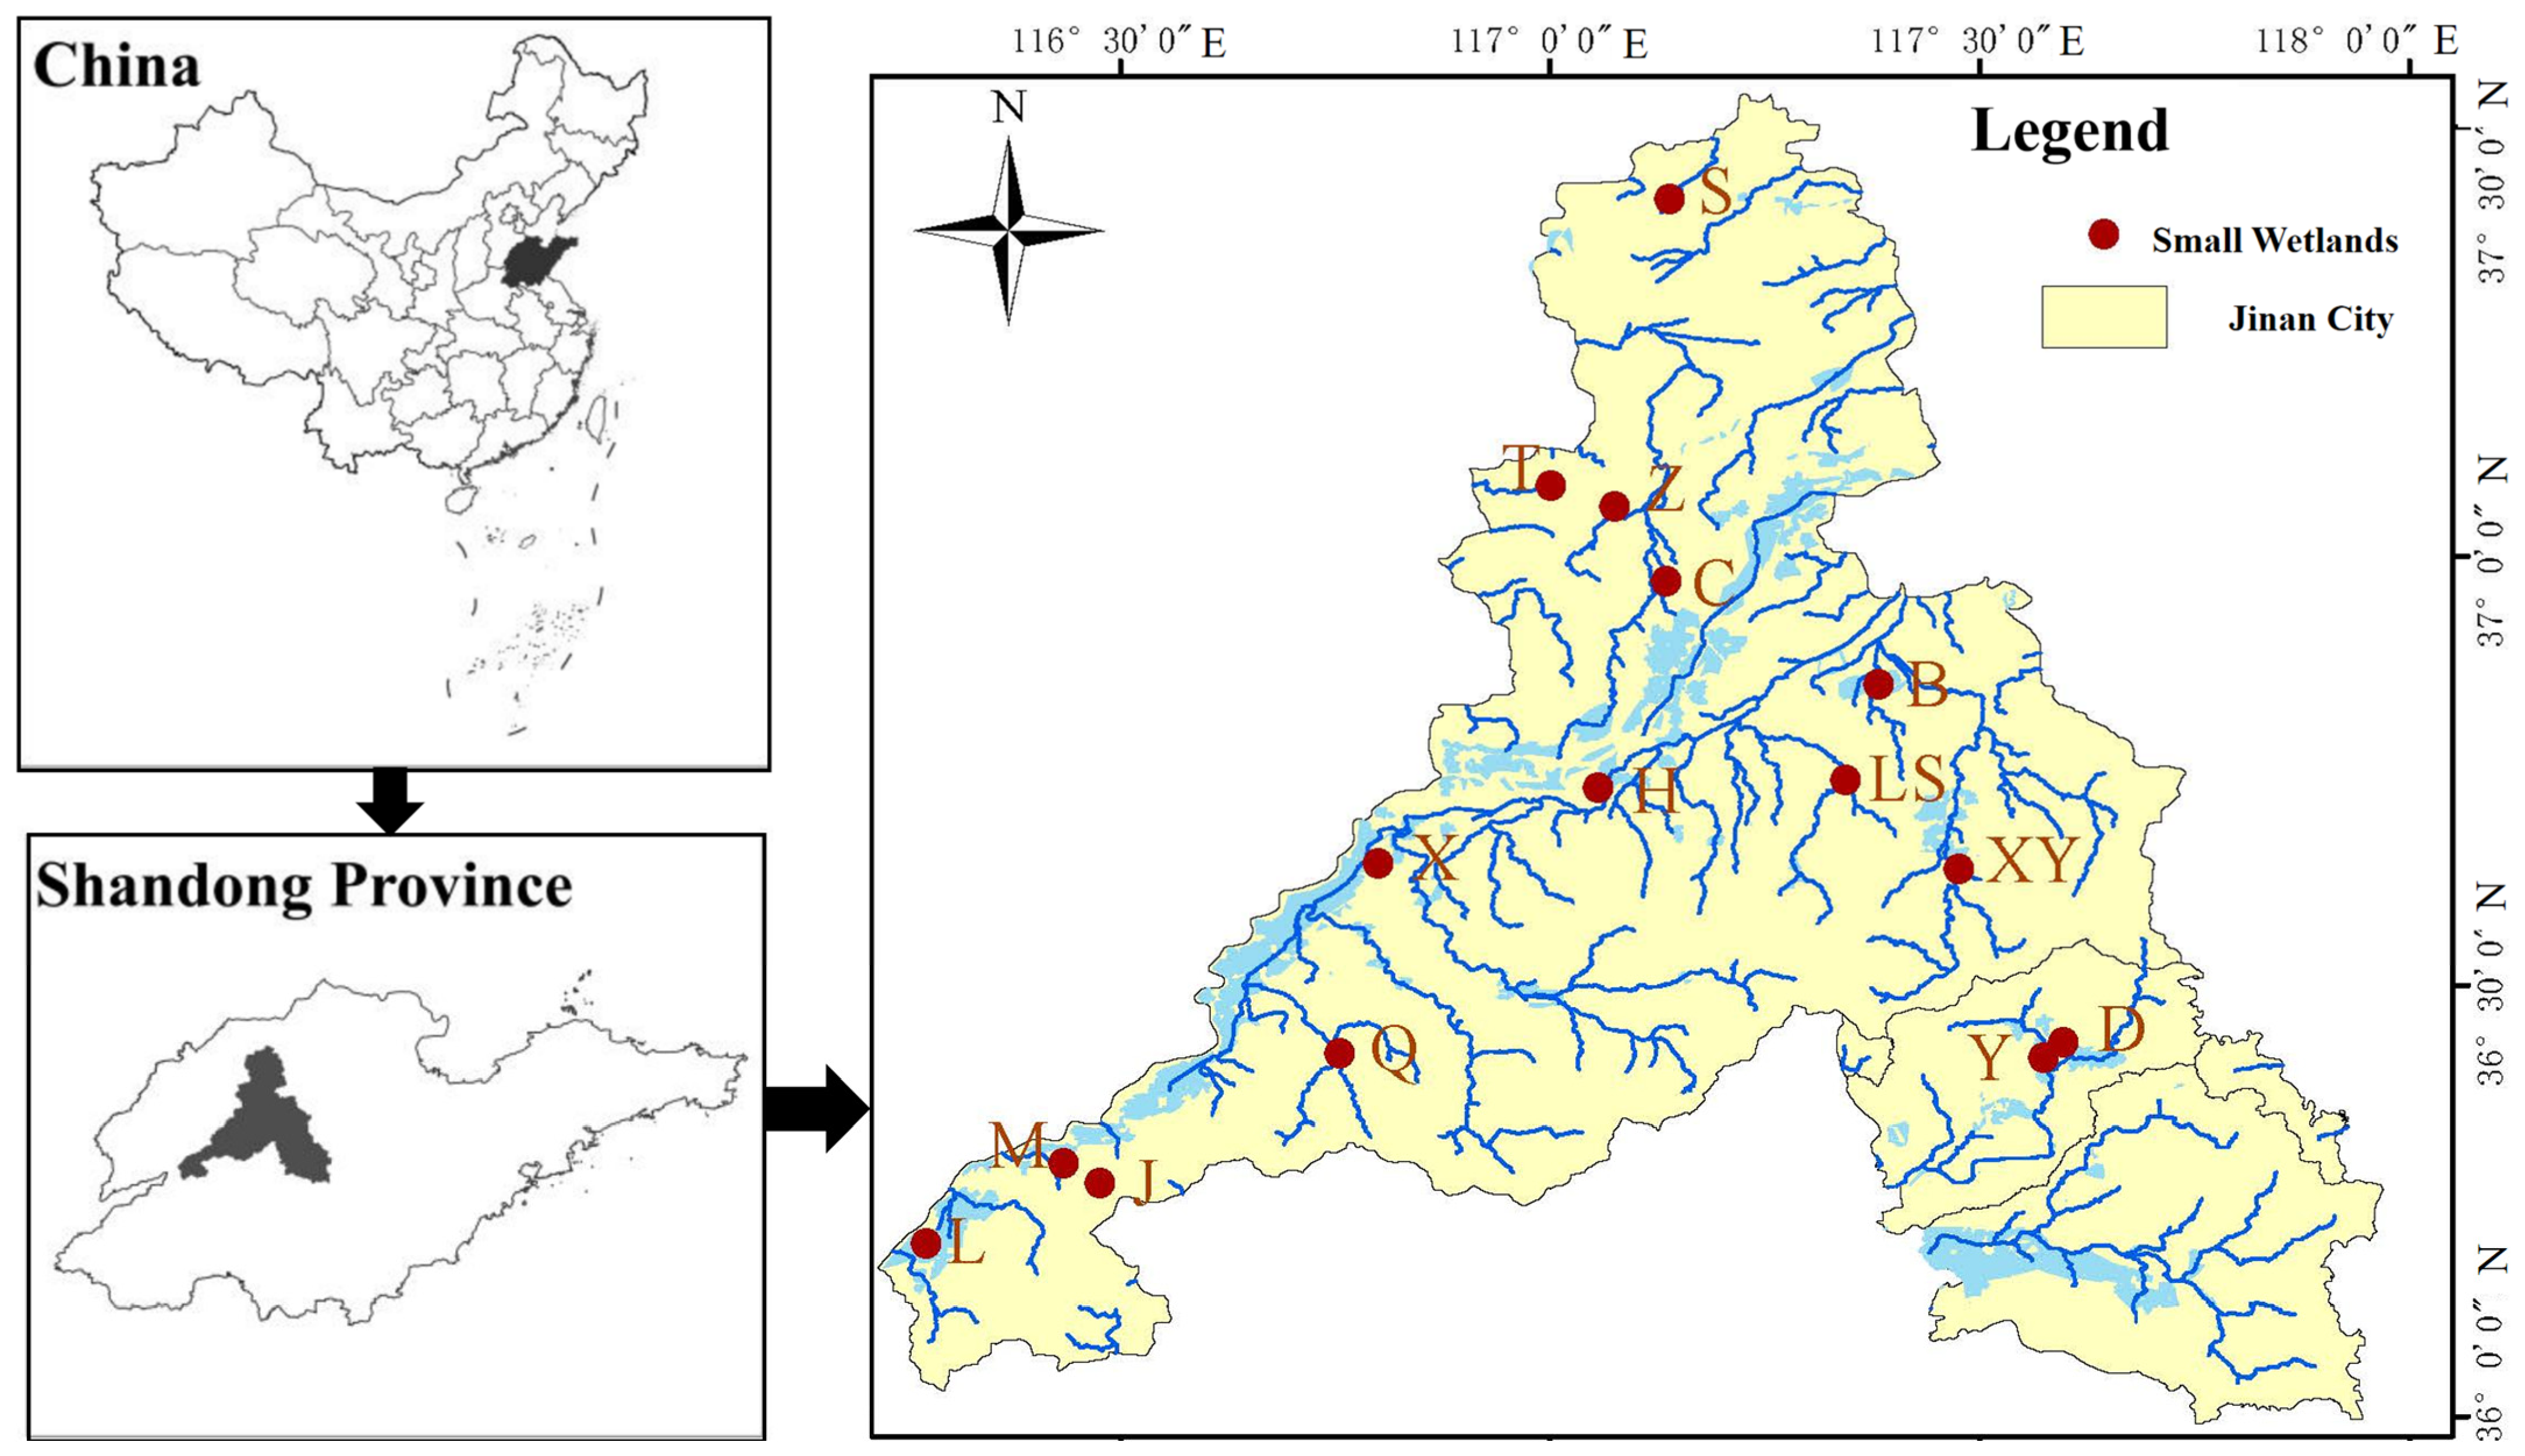
Fifteen small urban wetlands distributed within Jinan’s administrative scope were chosen as sampling sites, including Dasha River, Tuma River, Yanziwan Wetland, Chengbo Lake, Baiyun Lake, Huashan Lake, Longshan Lake, Jixi Wetland, Xiuyuan River, Wangjiafang Wetland, Xueye Lake, Dawen River, Meigui Lake, Jinshui River, and Langxi River (Figure 1). These wetlands vary in their origin and morphology: some are natural water bodies (e.g., Baiyun Lake, Xueye Lake) that have been incorporated into the urban landscape during city expansion, while others are artificial or semi-artificial systems constructed for flood control, landscape enhancement, or recreational purposes (e.g., Yanziwan Wetland, Huashan Lake).
Figure 1.
Study area. Note: Dasha River (S), Tuma River (T), Yanziwan Wetland (Z), Chengbo Lake (C), Baiyun Lake (B), Huashan Lake (H), Longshan Lake (LS), Jixi Wetland (X), Xiuyuan River (XY), Wangjiafang Wetland (Q), Xueye Lake (Y), Dawen River (D), Meigui Lake (M), Jinshui River (J), Langxi River (L).
Most of these wetlands are semi-isolated and not directly interconnected by natural channels, although some river-type wetlands (e.g., Dasha River, Tuma River, Dawen River) form part of the broader fluvial network. The primary sources of eutrophication in these urban wetlands include non-point source runoff from surrounding residential and green spaces, atmospheric deposition, and occasional indirect discharges of treated wastewater; direct wastewater discharge is prohibited by local environmental regulations. Riparian buffer zones of varying widths (typically 5–30 m) surround most wetlands, consisting of mixed vegetation including trees, shrubs, and herbaceous plants, which provide partial nutrient retention and habitat functions.
Six sampling sites were set up in each wetland according to wetland size and topography, resulting in a total of 90 sampling points. Field coordinates were recorded using a Magellan eXplorist 200 GPS unit (Magellan Navigation, San Dimas, CA, USA), and the study area distribution map was produced with ArcMap 10.8 (Esri, Redlands, CA, USA).
2.2. Field Sampling
Key water-quality parameters, including total nitrogen (TN), total phosphorus (TP), chlorophyll a (Chla) and permanganate index (CODMn), were analyzed following the standard protocols specified in the Standard Methods for the Monitoring and Analysis of Water and Wastewater [25] (which are largely consistent with the APHA Standard Methods for the Examination of Water and Wastewater). Specifically, TN was determined using the alkaline potassium persulfate digestion UV spectrophotometric method (UV–Vis spectrophotometer, Shimadzu UV-1800, Kyoto, Japan), TP was measured by the ammonium molybdate spectrophotometric method (visible spectrophotometer [brand, city, country]), Chla was quantified spectrophotometrically after acetone extraction (spectrophotometer [brand, city, country]), and CODMn was analysed via the acid potassium permanganate titration method. These well-established analytical approaches ensure the comparability of our water quality data with international studies.
For phytoplankton quantification, 1 L subsamples were retrieved at 0.5 m depth with a plexiglass water sampler and immediately preserved in situ using 1% (v/v) Lugol’s iodine solution. Upon arrival at the laboratory, samples were allowed to settle for 48 h and then concentrated to 100 mL via siphoning. Species identification and cell enumeration were performed under an inverted optical microscope (Olympus IX71, Tokyo, Japan) equipped with phase-contrast optics. Before microscopic counting, concentrated suspensions were fully homogenized. A 0.1 mL subsample was loaded into a plankton counting chamber, and no fewer than 100 random microscopic fields were inspected for cell counts. Phytoplankton were identified to the species or genus level according to taxonomic monographs, mainly Freshwater Algae of China: Systematics, Taxonomy and Ecology [26].
For phytoplankton functional grouping, five key functional traits were screened following the classification frameworks proposed by Padisák et al. [27], Reynolds et al. [28] and Hu et al. [29]. The selected traits cover habitat preference, flagellar possession, mucilaginous envelope occurrence, overall cell morphology, and siliceous cell wall development (Table 1).
Table 1.
Functional groups of phytoplankton divided by five species traits.
2.3. Data Analyses
Wetland trophic status was quantified via the comprehensive trophic level index (TLI) approach [30]. Five water-quality variables were incorporated into the TLI calculation: total nitrogen (TN, mg/L), total phosphorus (TP, mg/L), chlorophyll a (Chl a, mg/L), permanganate index (CODMn, mg/L), and Secchi depth (SD, m). TLI values were computed according to the empirical formula outlined in reference [31]:
where TLI(Σ) represents the comprehensive trophic level index, wj is the relative weight assigned to the trophic level index of the j-th parameter, and TLI(j) is the trophic level index of the j-th parameter. The trophic status was classified according to the following criteria [32]: 0 < TLI(Σ) ≤ 30, oligotrophic; 30 < TLI(Σ) ≤ 50, mesotrophic; 50 < TLI(Σ) ≤ 60, lightly eutrophic; 60 < TLI(Σ) ≤ 70, moderate eutrophic; 70 < TLI(Σ) ≤ 100, hypereutrophic. Note that the TLI(Chl-a) equation is parameterized for Chl-a expressed in mg/m3 (equivalent to μg/L); the Chl-a concentrations reported in mg/L elsewhere in this manuscript were converted accordingly before entering the TLI calculation. The TLI was used strictly as a classification tool to assign each wetland to a trophic category. Because the five constituent variables (TN, TP, Chl-a, CODMn, and SD) jointly define the TLI, their among-group differences are expected by construction and are, therefore, reported descriptively (Section 3.1) rather than as independent evidence of ecological responses to trophic status.
To unravel eutrophication impacts on phytoplankton community structure, as well as taxonomic and paired α/β-diversity gradients among Jinan wetlands spanning distinct trophic levels, a suite of ecological indices was calculated in this study. Taxonomic α-diversity was evaluated via three classic metrics: the Shannon–Wiener index, Pielou’s evenness index, and Simpson’s diversity index. For functional α-diversity (FD), three core components, including functional richness (FRic), functional evenness (FEve), and functional divergence (FDiv), were quantified accordingly.
Taxonomic β-diversity (βsor) across wetlands with divergent trophic status was quantified via the Sørensen dissimilarity index and further partitioned into species turnover (βsim) and nestedness-resultant (βsne) fractions. For functional β-diversity, a Gower dissimilarity matrix was built from the compiled functional trait dataset, and total functional β-diversity was analogously split into turnover and nestedness constituents.
Functional traits were compiled into a species-by-trait matrix, in which the five categorical traits (habitat preference, flagellar possession, mucilaginous-envelope occurrence, life form, and siliceous-cell-wall development; Table 1) were coded for each of the identified taxa. Trait states were assigned on the basis of taxonomic monographs [26] and published trait compilations; taxa for which a trait state could not be reliably assigned were excluded only from the trait-based analyses and are listed in the trait matrix (Appendix A). All five traits were weighted equally. A Gower dissimilarity matrix, which accommodates mixed categorical variables, was computed from the trait matrix and used to derive functional richness (FRic), functional evenness (FEve), and functional divergence (FDiv) with the FD package. Because habitat preference and life form may overlap conceptually with the trophic gradient, a sensitivity analysis was performed in which these two traits were removed, and all of the functional diversity indices were recomputed. The results were qualitatively unchanged.
In aquatic ecological systems, primary productivity is commonly characterized by instantaneous phytoplankton standing biomass [33]. Accordingly, phytoplankton standing biomass (SB) in this study was determined from field measurements of phytoplankton standing biomass; SB, therefore, represents standing biomass (a proxy for productivity), not a directly measured production rate. Phytoplankton biomass was calculated following the formula below:
where Bio(Phyto) denotes phytoplankton biomass (mg/L), B′ represents the average wet weight of each type of algae, and N represents the quantity of each type of algae.
To identify the dominant phytoplankton taxa for the RDA analysis, we calculated the species dominance index (Y) for each species:
where ni represents the cell density of species i, N represents the total cell density of all species in the sample, and f represents the occurrence frequency of species i across all sampling sites within a specific wetland. For each wetland, the index was calculated by aggregating all sampling sites (n = 6) over the three-year study period (2020–2022). Species with a mean dominance index greater than 0.02 across the wetlands in the same trophic level were defined as common species.
Phytoplankton resource-use efficiency (RUEpp) was calculated as the ratio of phytoplankton biomass to total phosphorus concentration [34], following the formula below:
where Bio(Phyto) denotes phytoplankton biomass (mg/L), and TP represents the total phosphorus concentration (mg/L).
All data were first tested for normality (Shapiro–Wilk test) and homogeneity (F test) of variances before statistical analysis. Because trophic status is assigned at the wetland level, the 15 wetlands rather than the 90 sampling sites were treated as the independent unit for between-group comparisons. Wetland-level means (averaged over the six sites and the 2020–2022 sampling period) were, therefore, computed for each variable, and the differences among trophic categories were tested using one-way ANOVA followed by LSD post-hoc tests (α = 0.05). For the biodiversity-standing biomass and biodiversity–RUE relationships, site-level observations were retained, but the non-independence of sites within wetlands was accounted for using linear mixed-effects models (LMMs) fitted with the lme4 package, with wetland as a random effect. To test whether these relationships differed among trophic groups, diversity–trophic group interaction terms were fitted in a single model for each diversity metric rather than being inferred from separate within-group regressions. All datasets were standardized (Z-Score) to eliminate dimensional disparities across divergent indicators prior to regression modeling. A sensitivity analysis based on wetland-level means (n = 15) was additionally performed to assess the robustness of the principal conclusions.
Calculations of phytoplankton functional diversity were completed via the vegan [35], FD [36] and ade [37] packages within R version 4.3.2. IBM SPSS Statistics 26.0 was used for statistical computations, Origin 2023 for graphic plotting, and Canoco 4.5 for redundancy analysis (RDA) was used to reveal the relationship between the common species of phytoplankton and environmental factors. Mixed-effects models were fitted in R version 4.4.1 using the lme4 package (version 1.1-35.4).
3. Results
3.1. Wetland Trophic Status and Water Environment Characteristics
Using the five screened environmental variables (Table 2), the comprehensive trophic level index (TLI) was computed for all sampled wetlands (Table 3). According to the resultant TLI scores, the 15 wetlands fell into three trophic categories. Three sites, namely Huashan Lake (H), Chengbo Lake (C) and Meigui Lake (M), were oligotrophic, with the TLI spanning 23.93–29.11. Six wetlands, including Xueye Lake (Y), Dasha River (S), Yanziwan Wetland (Z), Tuma River (T), Dawen River (D) and Baiyun Lake (B), were categorized as mesotrophic (TLI: 31.41–47.47). The remaining six sites (Longshan Lake (LS), Xiuyuan River (XY), Wangjiafang Wetland (Q), Jinshui River (J), Langxi River (L), and Jixi Wetland (X)) belonged to the lightly eutrophic group, with TLI values ranging from 52.72 to 57.52.
Table 2.
Calculation formulas, weights [38], mean values, and difference analysis of five environmental indicators for the trophic level index (TLI).
Table 3.
Comprehensive trophic level index (TLI), community composition and common species of 15 urban small wetlands in Jinan City.
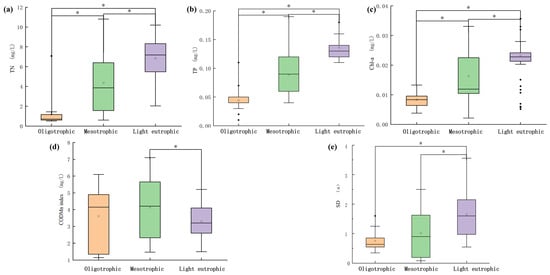
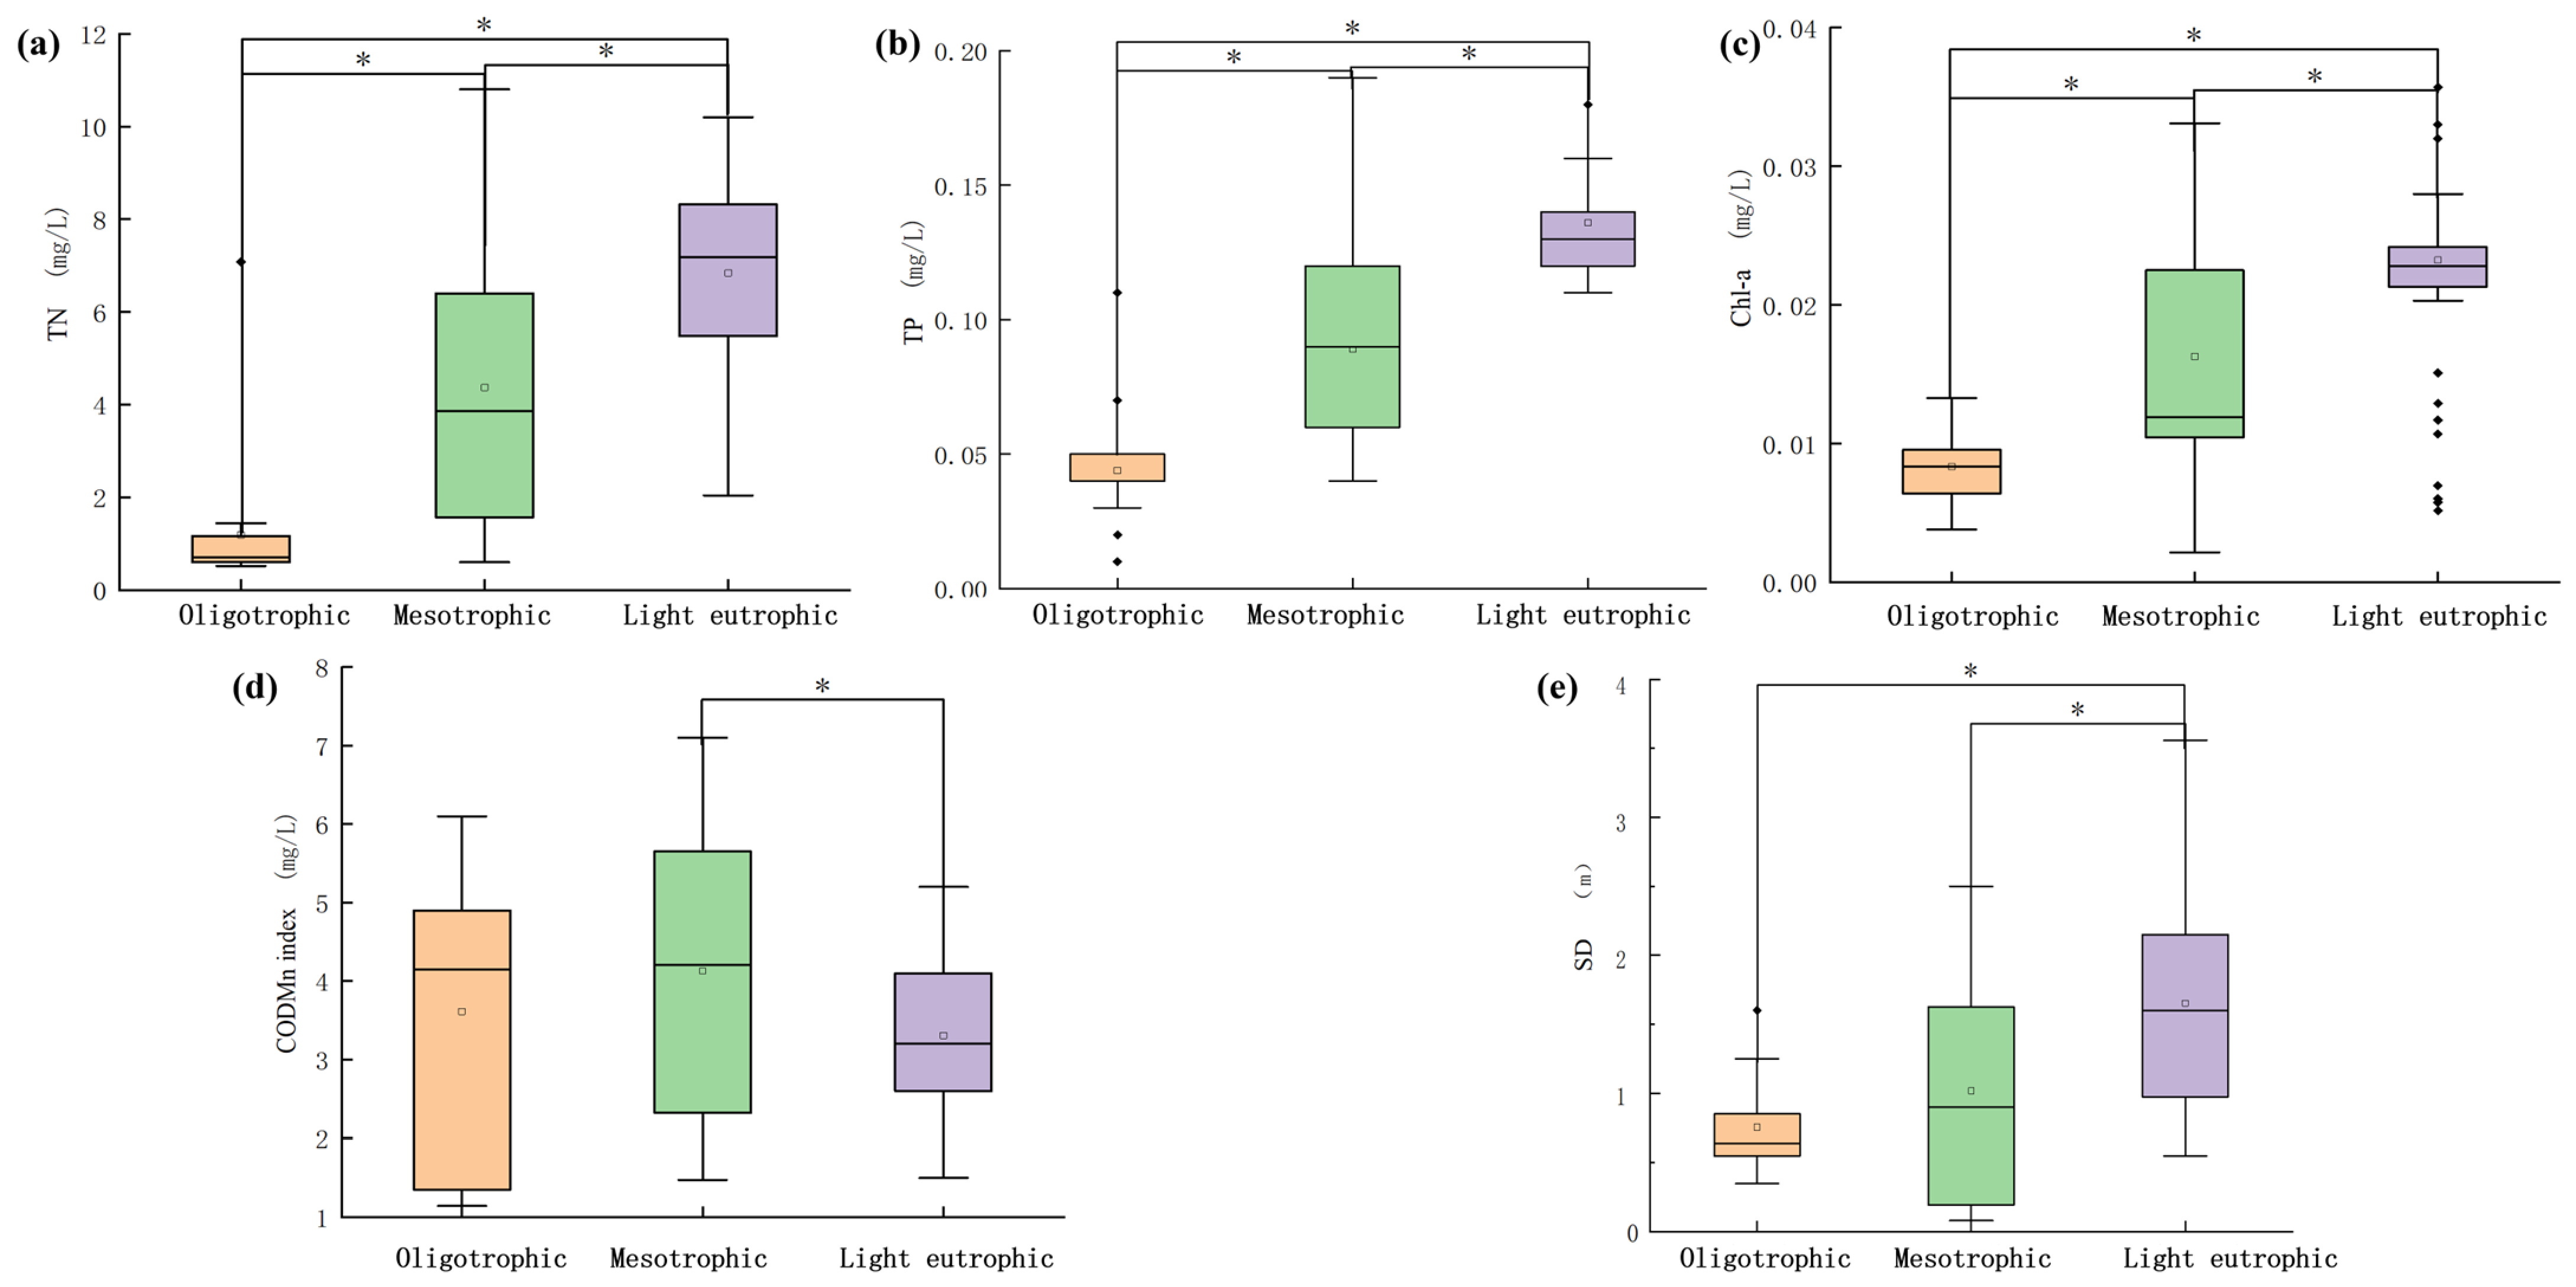
The five variables used to construct the TLI (TN, TP, Chl-a, CODMn, and SD) differed among the three trophic categories (Table 2, Figure 2). Because these variables jointly define the TLI, their among-group differences are expected by construction and are, therefore, reported descriptively to characterize the classification rather than as independent evidence of ecological responses to trophic status. The concentrations of TN, TP, and Chl-a increased gradually with the rising trophic status, peaking in lightly eutrophic wetlands at mean values of 6.83 mg/L, 0.14 mg/L, and 0.03 mg/L, respectively. Permanganate index (CODMn) was highest in mesotrophic wetlands (mean 4.12 mg/L), and Secchi depth (SD) attained its maximum mean (1.65 m) in lightly eutrophic sites.
Figure 2.
The five variables used to construct the TLI: (a) TN, (b) TP, (c) Chl0a, (d) CODMn and (e) SD. Differences in five assessment indicators of TLI in different trophic levels of wetlands in Jinan. Note: “*” means significant difference, p < 0.05; “-” means the maximum value (top) and minimum value (bottom); “—” means median; “□” means average, similar below; Total nitrogen (TN, mg/L), total phosphorus (TP, mg/L), chlorophyll a (Chl a, mg/L), permanganate index (CODMn, mg/L), and Secchi depth (SD, m).
3.2. Phytoplankton Community Composition and Factors Influencing Dominant Species
Across the 15 investigated small urban wetlands in Jinan, 288 phytoplankton taxa (species and varieties) were taxonomically identified (Appendix A). Chlorophyta (green algae) and Bacillariophyta (diatoms) dominated species richness, containing 93 and 92 species (32.29%, 31.94%), followed by Cyanobacteria (blue–green algae, 44 species, 15.28%) and Euglenophyta (42 species, 14.58%). The remaining phyla were represented as follows: Dinophyta (10 species, 3.47%), Cryptophyta (three species, 1.04%) and Chrysophyta and Xanthophyta were both two species, both accounting for 0.69%. Oligotrophic, mesotrophic and lightly eutrophic wetlands hosted 96, 191 and 121 phytoplankton species, respectively.
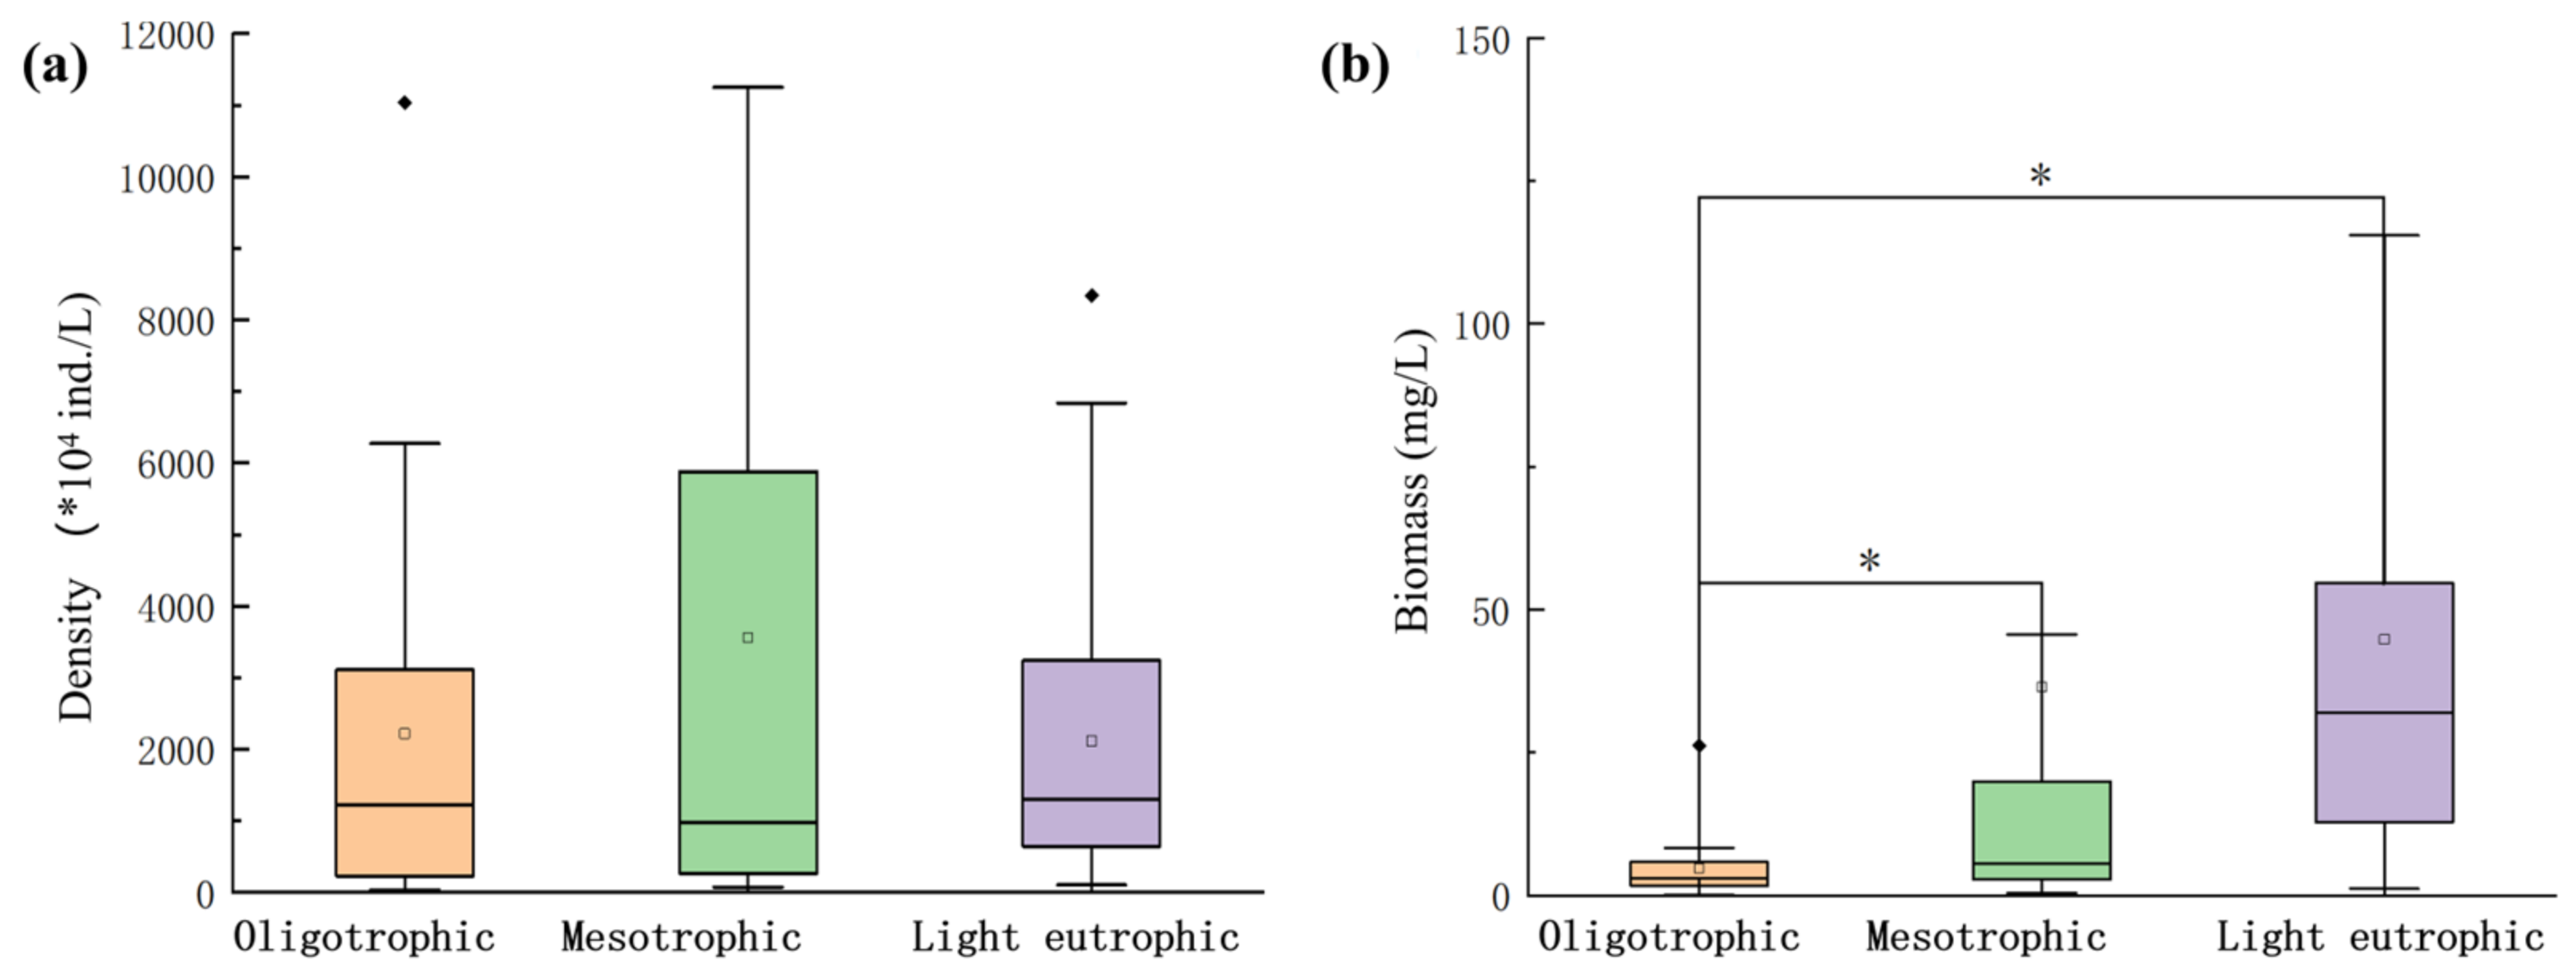
Community structure analysis (Figure 3) showed no significant differences in phytoplankton density among the three trophic groups (p = 0.207), with the average densities ranging from 2.115 × 10⁷ to 3.560 × 10⁷ cells/L. By contrast, phytoplankton biomass varied markedly among trophic categories (p = 0.046). Lightly eutrophic wetlands attained the maximum average biomass (44.79 mg/L), which was significantly higher than the corresponding values measured in oligotrophic (4.74 mg/L) and mesotrophic wetlands (36.44 mg/L).
Figure 3.
Distribution of phytoplankton community structure in different trophic levels of wetlands in Jinan. (a) Phytoplankton density; (b) phytoplankton standing biomass. Boxes represent the interquartile range (IQR), horizontal lines indicate medians, whiskers extend to 1.5 × IQR, □ represents the mean, and * indicates a significant difference (p < 0.05).
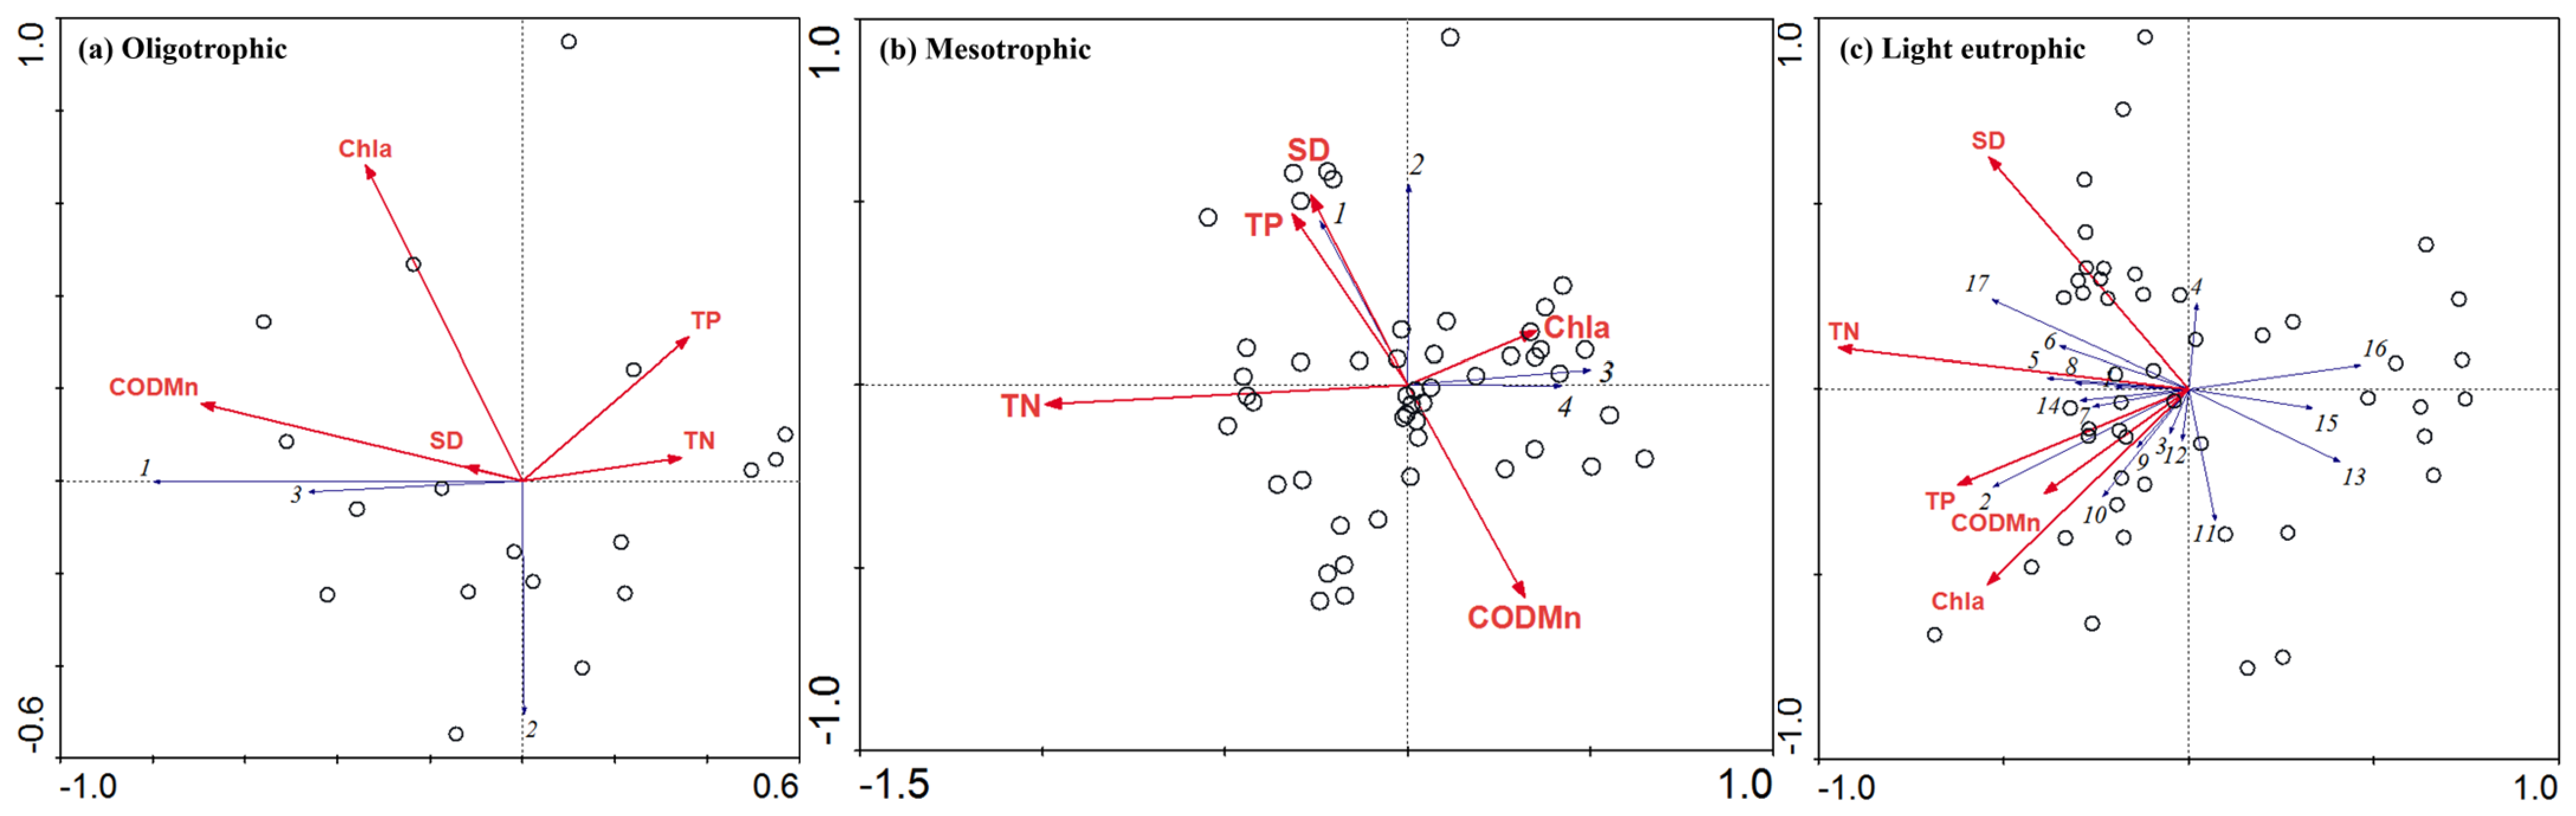
Redundancy analysis (RDA) quantified species–environment associations between dominant phytoplankton taxa and ambient water variables along the three trophic gradients of Jinan’s wetlands (Figure 4). For oligotrophic sites (Figure 4a), Phormidium parvulum and Scenedesmus bijugus were predominantly influenced by CODMn and Chl-a, whereas Cryptomonas erosa displayed negative correlations with TN, TP, CODMn and Chl-a. Within mesotrophic wetlands (Figure 4b), Chl-a was most strongly associated with Scenedesmus quadricauda and Scenedesmus bijugus, while Secchi depth (SD) and TP jointly shaped the distribution of Chlorella vulgaris and Ankistrodesmus falcatus. In lightly eutrophic habitats (Figure 4c), Chl-a, CODMn and TP were most strongly associated with Aphanizomenon flosaquae and Nitzschia palea, whereas TN and SD were the principal environmental predictors for Synedra ulna, Synedra minutissima and Closterium aciculare.
Figure 4.
Redundancy analysis (RDA) ordination triplot illustrating the relationships among phytoplankton community composition, environmental variables, and sampling sites across three trophic levels: (a) oligotrophic, (b) mesotrophic, and (c) lightly eutrophic. The hollow circles represent the 90 individual sampling sites (6 sites per wetland), with species biomass and environmental data used for RDA representing the 3-year average (2020–2022) of each site. Red arrows indicate environmental factors (CODMn, Chl-a, SD, TN, and TP), and blue arrows represent the 17 dominant phytoplankton taxa selected based on the species dominance index (Y). The species numbers in the figure are consistent with those in Table 3.
3.3. Responses of Functional Diversity to Eutrophication
3.3.1. Alpha Diversity
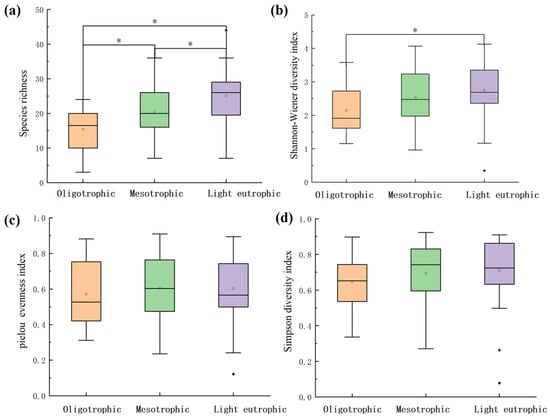
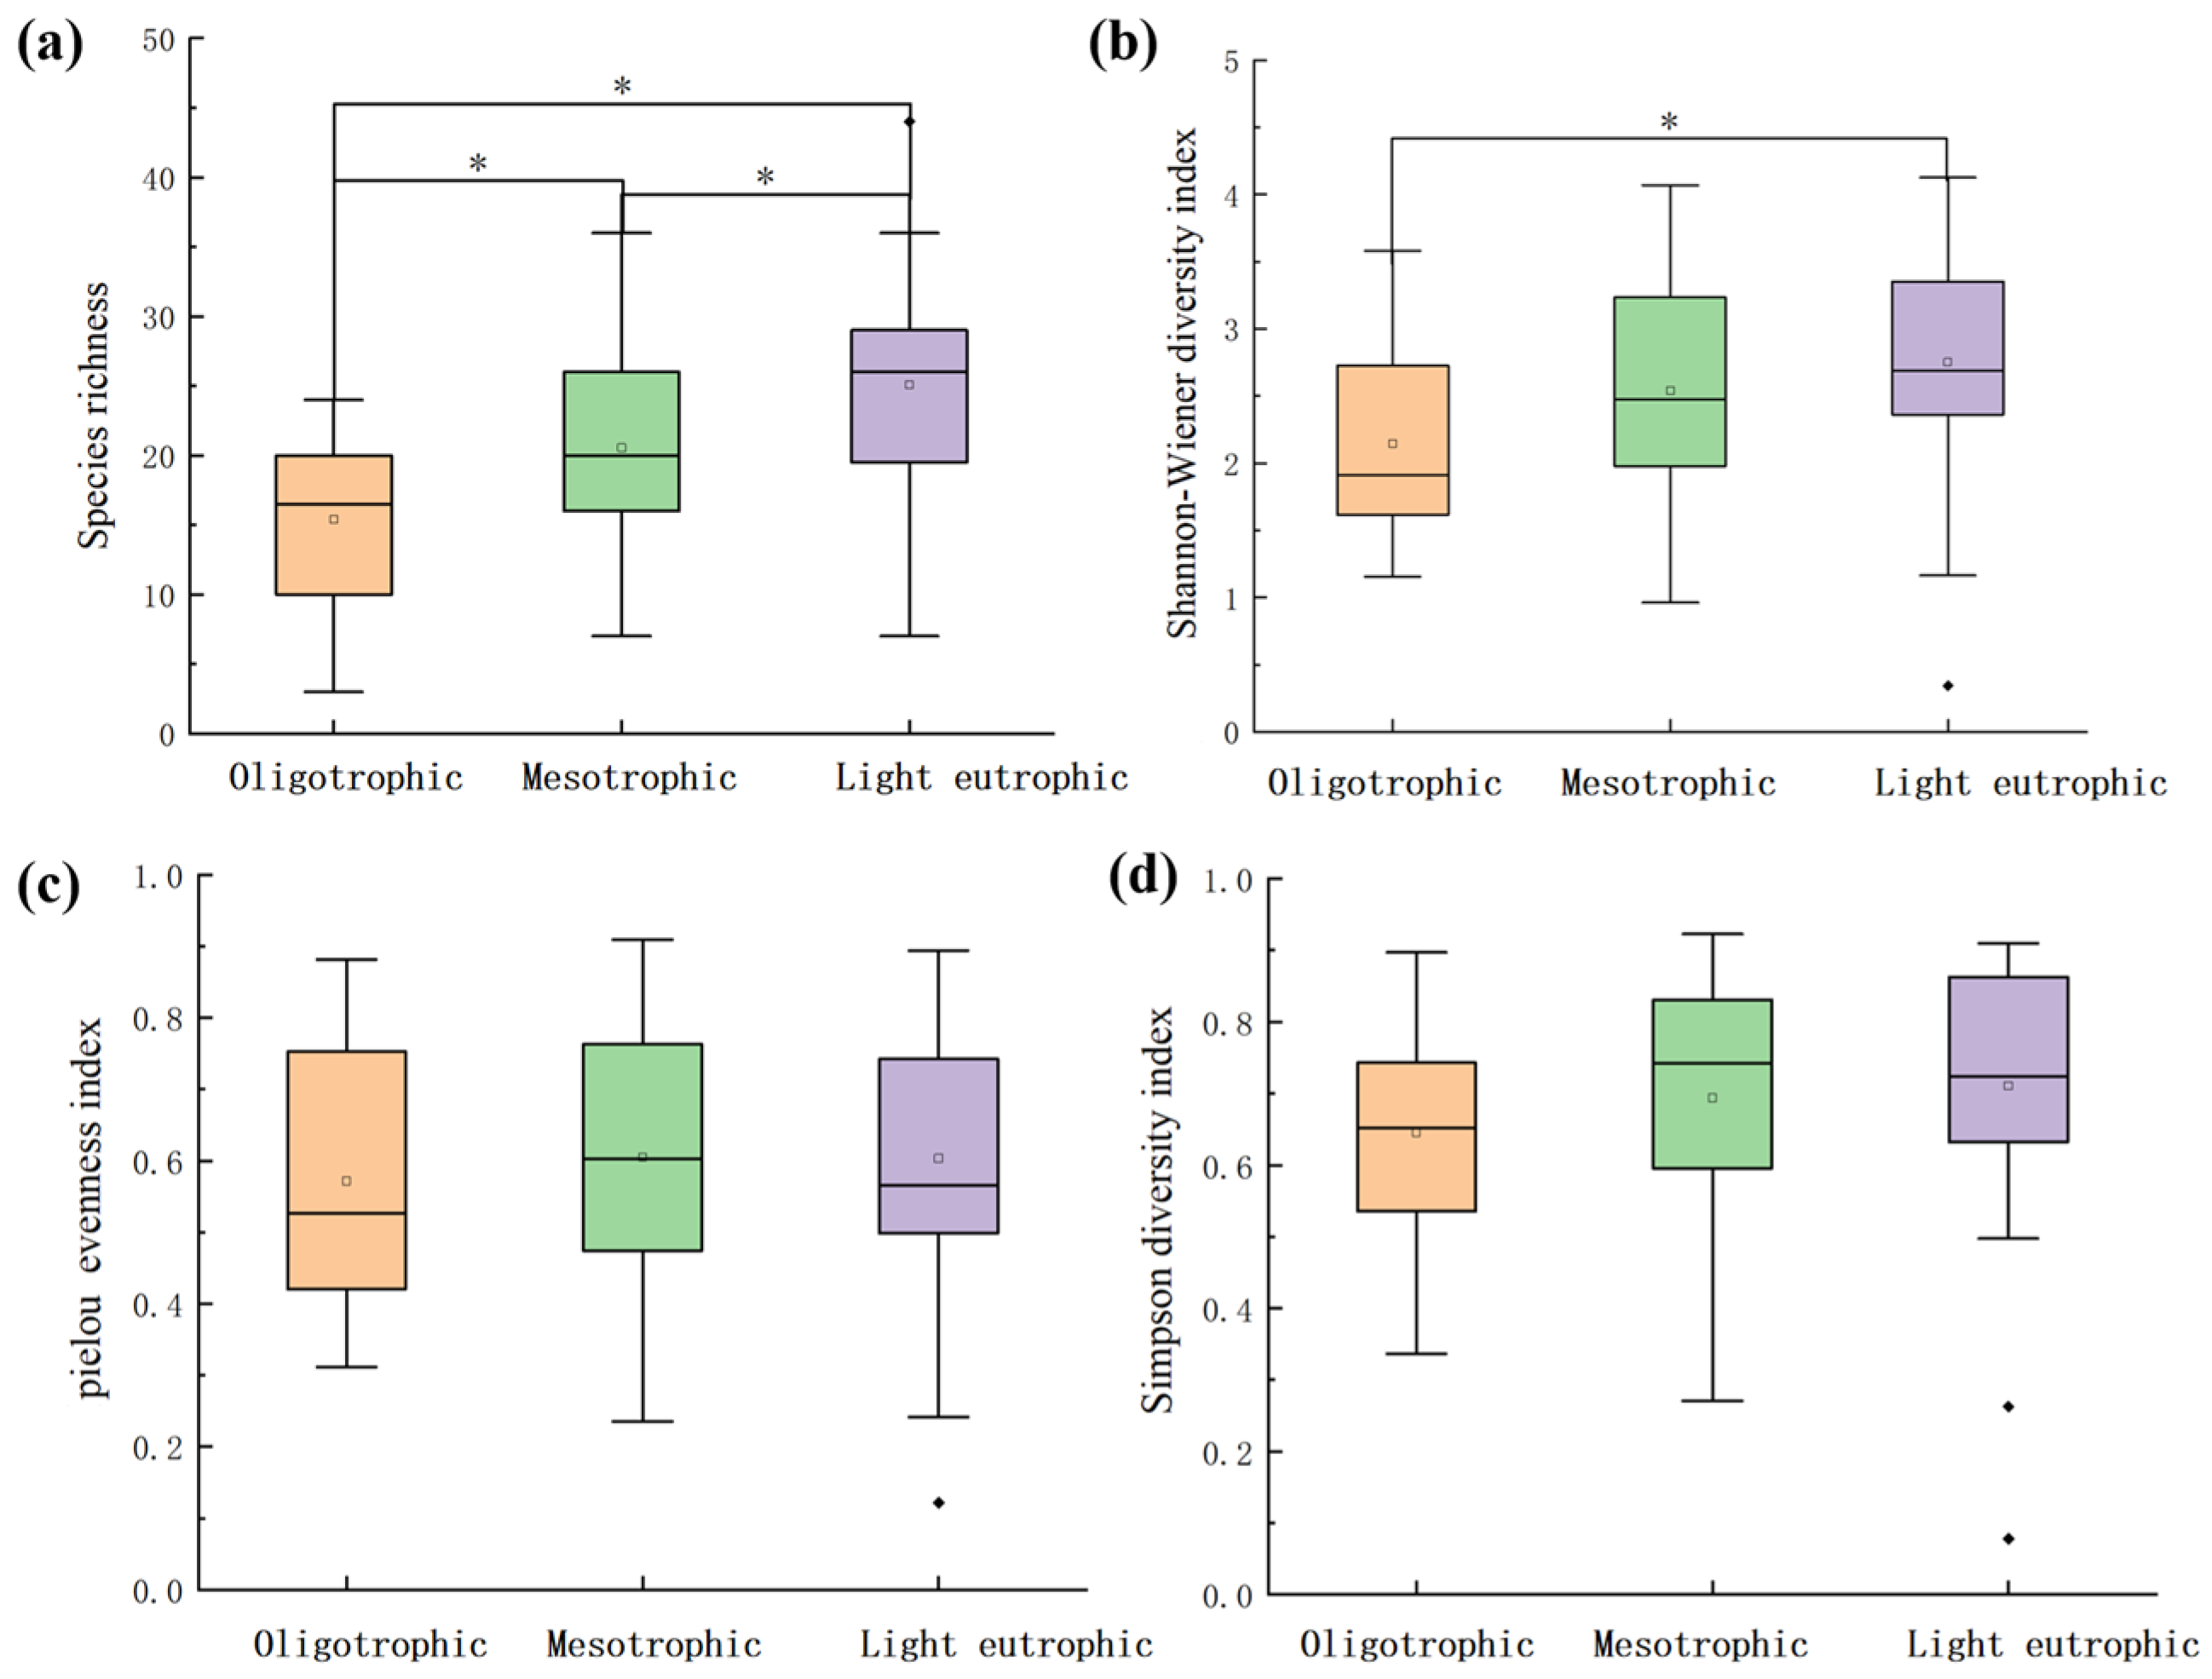
Species richness (Figure 5a) and Shannon–Wiener diversity index (Figure 5b) increased steadily across the eutrophication gradient in the order: oligotrophic < mesotrophic < lightly eutrophic. Pairwise comparisons indicated significant intergroup disparities in species richness among all three trophic levels (p < 0.05). The Shannon index was markedly higher in lightly eutrophic wetlands relative to oligotrophic counterparts (p < 0.05). By contrast, Pielou’s evenness (Figure 5c) peaked at the mesotrophic stage, conforming to a unimodal distribution pattern. No statistically significant intergroup differences were detected for the Pielou evenness index and Simpson diversity index across all pairwise trophic comparisons (p > 0.05).
Figure 5.
Alpha-diversity index of phytoplankton classification in different trophic levels of wetlands in Jinan. (a) Species richness; (b) Shannon–Wiener diversity index; (c) Pielou’s evenness index; (d) Simpson diversity index. Boxes represent the interquartile range (IQR), horizontal lines indicate medians, whiskers extend to 1.5 × IQR, □ represents the mean, and * indicates a significant difference (p < 0.05).
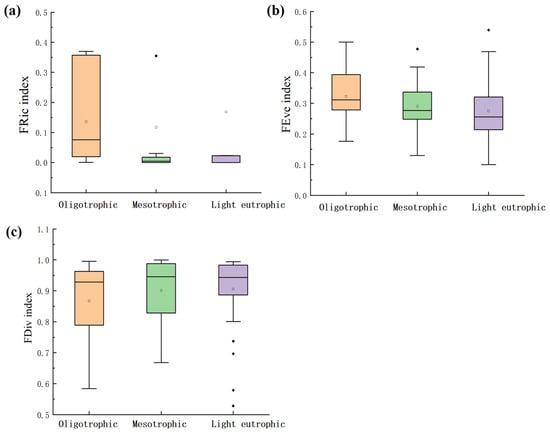
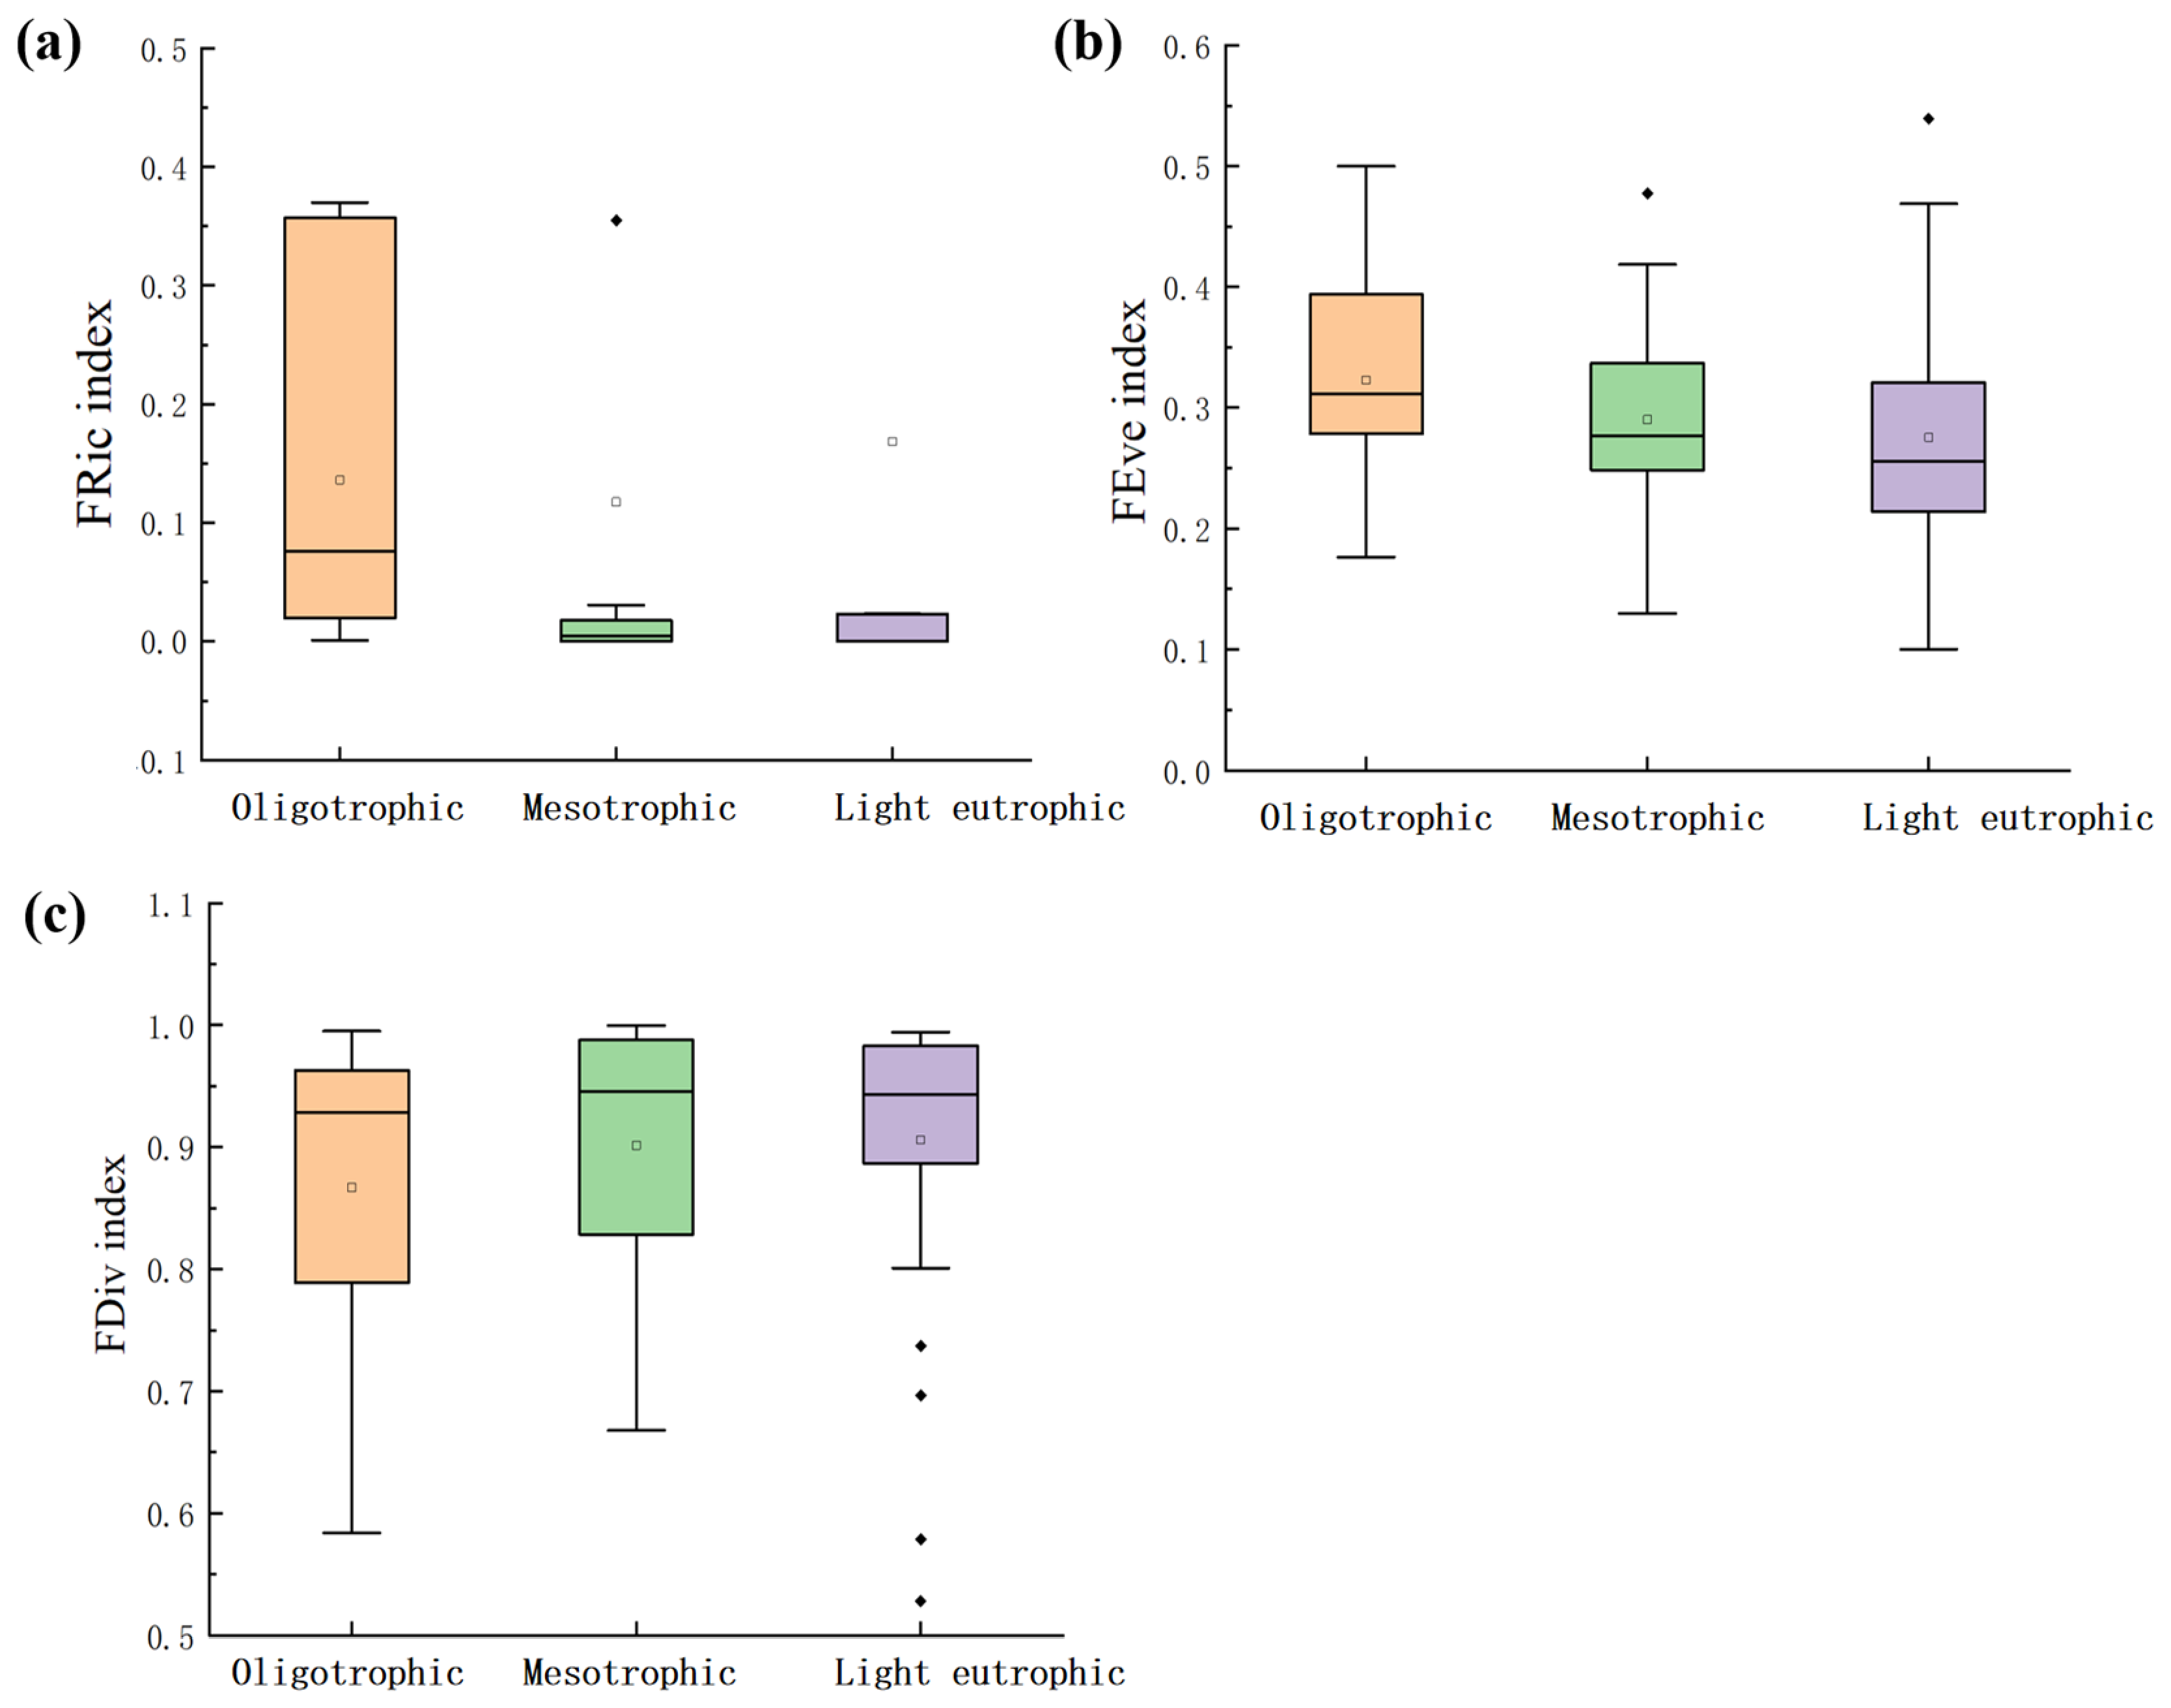
None of the three functional α-diversity metrics differed significantly across the three trophic levels (p > 0.05). Functional richness (FRic) exhibited a humped trend along the eutrophication gradient, rising to a maximum value of 0.14 in oligotrophic wetlands (Figure 6a). Functional evenness (FEve) declined monotonically with increasing trophic status, with its peak (0.32) observed in oligotrophic sites (Figure 6b). By contrast, functional divergence (FDiv) rose gradually as eutrophication intensified, with the highest value (0.91) recorded in lightly eutrophic wetlands (Figure 6c).
Figure 6.
Alpha functional diversity of phytoplankton in different trophic levels of wetlands in Jinan. (a) Functional richness (FRic); (b) functional evenness (FEve); (c) functional divergence (FDiv). Boxes represent the interquartile range (IQR), horizontal lines indicate medians, whiskers extend to 1.5 × IQR, □ represents the mean.
3.3.2. Beta Diversity
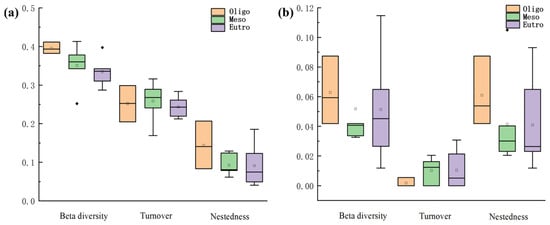
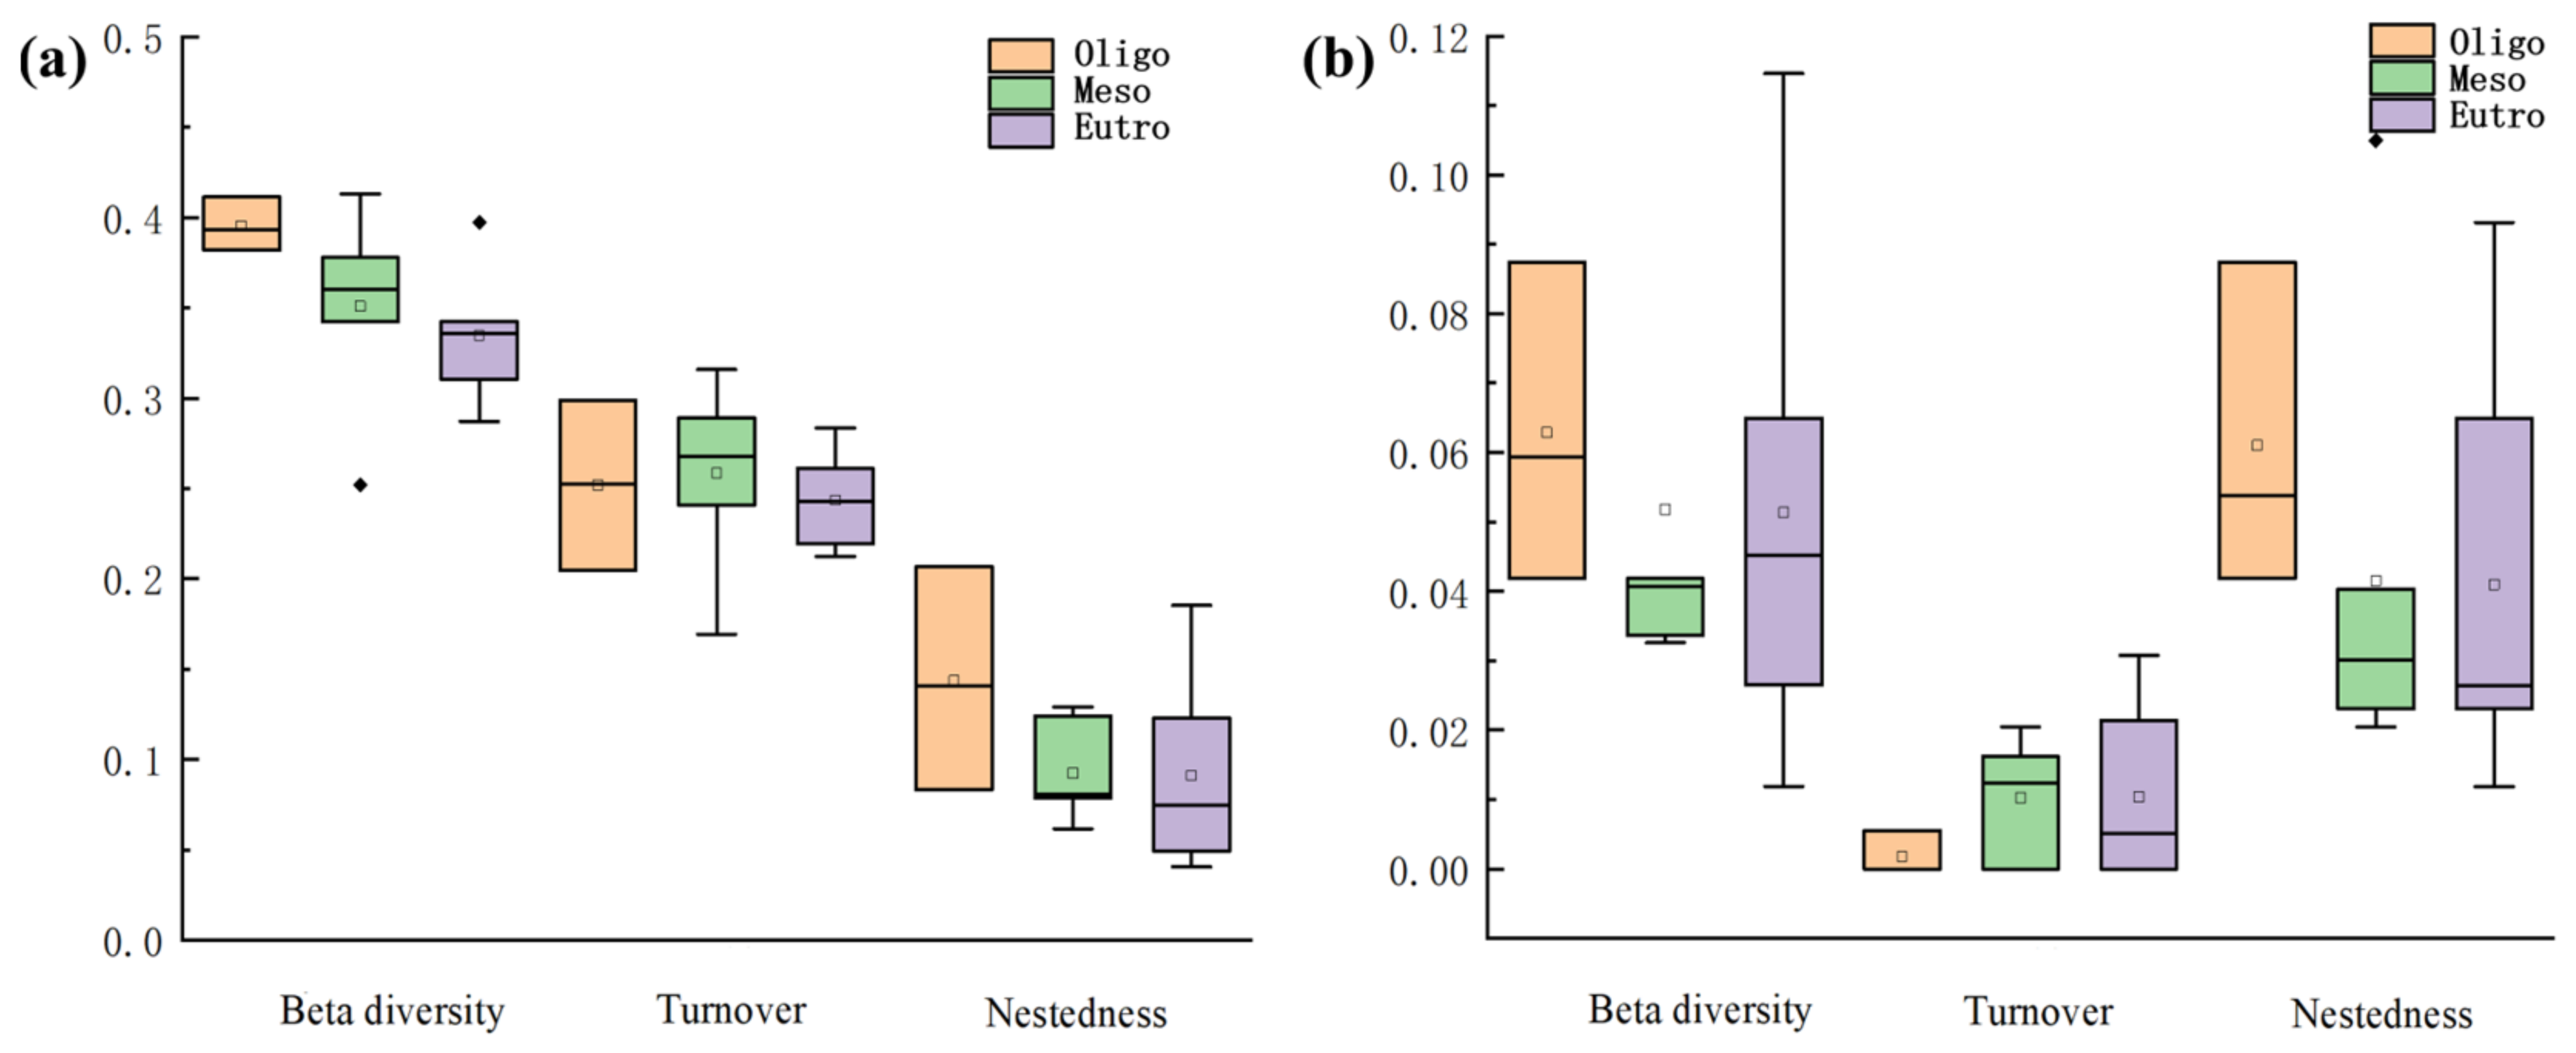
Taxonomic β-diversity did not vary significantly along the eutrophication gradients (p > 0.05), with the highest value (0.396) recorded in oligotrophic wetlands. The turnover fraction predominated across all trophic groups, contributing 63.72% for oligotrophic wetlands, 73.65% for mesotrophic wetlands, and 72.77% for lightly eutrophic wetlands (Figure 7a). Similarly, functional β-diversity exhibited no notable intergroup differences (p > 0.05), but was dominated by the nestedness component, which accounted for 97.06%, 80.16% and 79.74% of the three trophic categories, respectively (Figure 7b). This pattern suggests that functional β-diversity was primarily determined by species nestedness, rather than turnover-driven species replacement.
Figure 7.
Beta diversity of phytoplankton in different trophic levels of wetlands in Jinan. (a) Taxonomic beta diversity and (b) functional beta diversity, partitioned into turnover and nestedness components. Boxes represent the interquartile range (IQR), horizontal lines indicate medians, whiskers extend to 1.5 × IQR, and points denote outliers. Oligo, oligotrophic; Meso, mesotrophic; Eutro, lightly eutrophic.
3.4. Relationship Between Phytoplankton Diversity and Ecosystem Functioning
3.4.1. Phytoplankton Standing Biomass (Productivity Proxy)
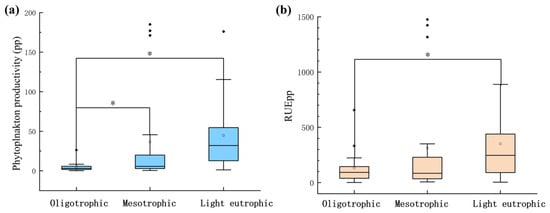
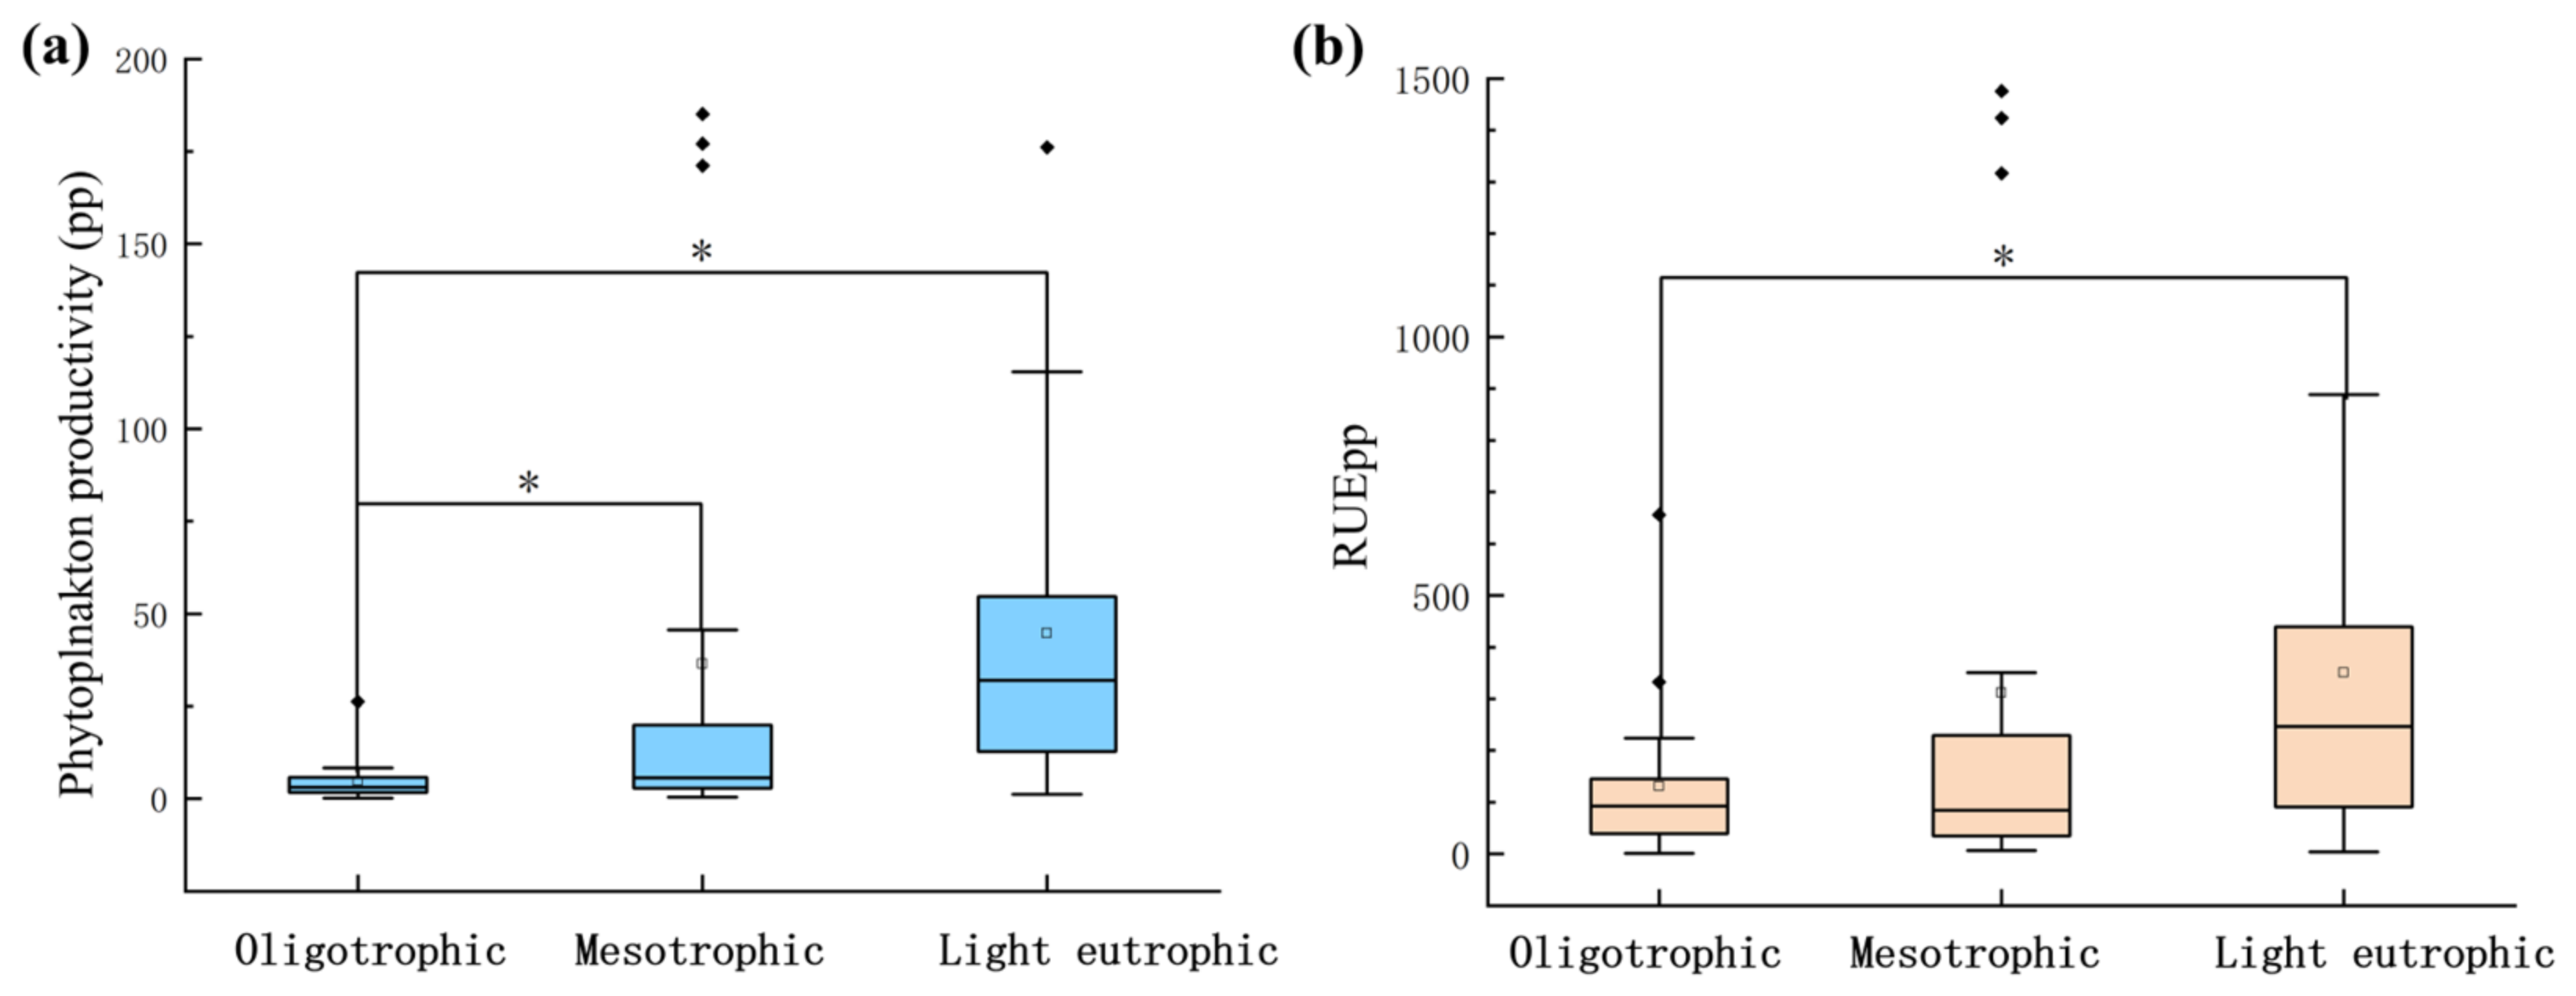
Phytoplankton standing biomass rose with increasing eutrophication (Figure 8a), with wetland-level mean values of 4.74 mg/L, 36.44 mg/L and 44.79 mg/L for oligotrophic, mesotrophic and lightly eutrophic wetlands, respectively. One-way ANOVA on wetland-level means confirmed a significant difference among the three trophic categories (p = 0.04). Post-hoc tests further indicated that standing biomass in mesotrophic and lightly eutrophic wetlands was significantly higher than that in oligotrophic wetlands (p = 0.03).
Figure 8.
Phytoplankton standing biomass and utilization efficiency in different trophic levels of wetlands in Jinan. Boxplots of phytoplankton standing biomass (a) and photosynthetic resource use efficiency (RUEpp) (b) across oligotrophic, mesotrophic and lightly eutrophic sites. Asterisks denote significant differences between paired groups. Note that phytoplankton standing biomass was estimated based on standing phytoplankton biomass. Thus, the standing biomass results shown in Figure 8a are derived from the same dataset as phytoplankton biomass in Figure 3b, and these two metrics should not be regarded as independent evidence.
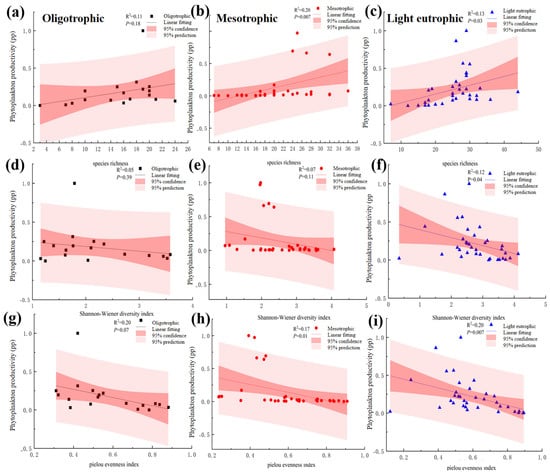
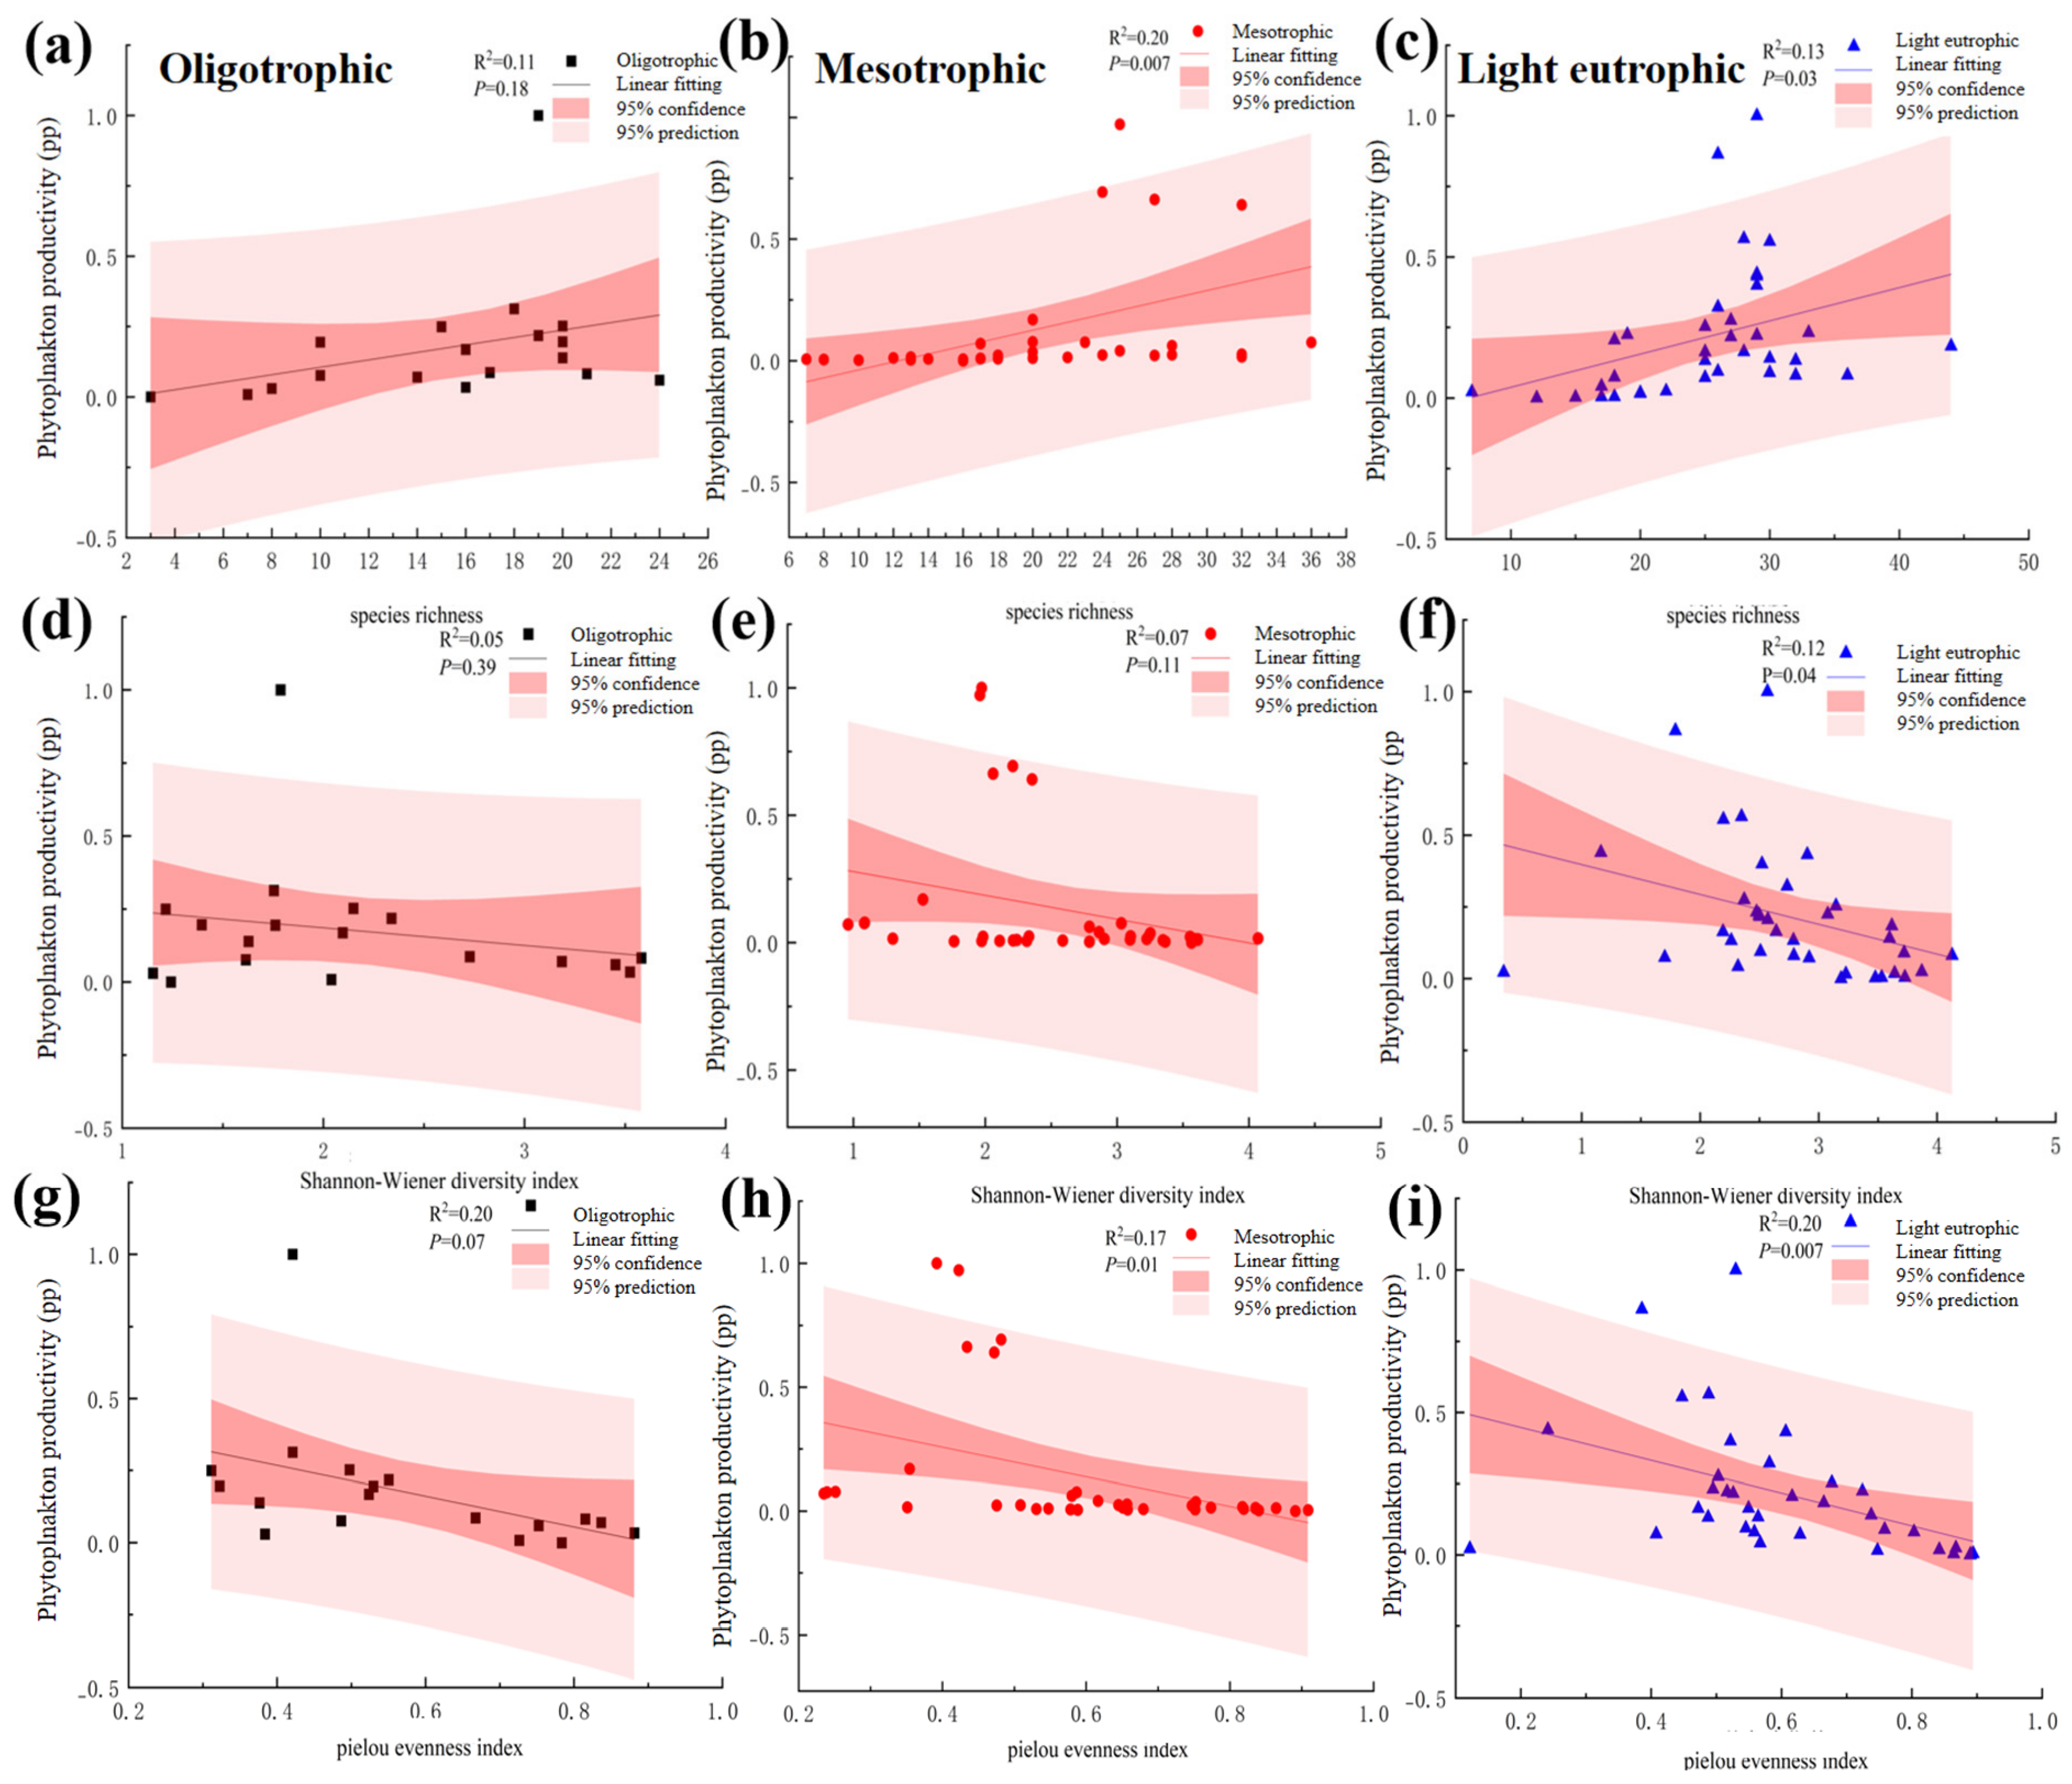
Across all sites, a linear mixed-effects model with wetland as a random effect revealed a positive association between species richness and standing biomass (p = 0.02). The species richness–trophic group interaction was significant (p = 0.01), indicating that the richness–standing biomass relationship differed among trophic categories. Consistent with this, no significant within-group association was found in oligotrophic wetlands (p = 0.18), whereas significant positive relationships emerged in mesotrophic (slope = 0.02, p = 0.007) and lightly eutrophic (slope = 0.01, p = 0.03) wetlands (Figure 9a–c).
Figure 9.
Relationship between phytoplankton diversity and standing biomass in different trophic levels of wetlands in Jinan. (a–c) Species richness, (d–f) Shannon–Wiener diversity index, and (g–i) Pielou’s evenness index versus standing biomass in oligotrophic (a,d,g), mesotrophic (b,e,h), and lightly eutrophic (c,f,i) wetlands. Boxes represent the interquartile range (IQR), horizontal lines indicate medians, whiskers extend to 1.5 × IQR, □ represents the mean.
For the Shannon index, the overall mixed-effects association with standing biomass was significant (p = 0.04), and the Shannon × trophic-group interaction was significant (p = 0.02), indicating that the relationship between Shannon diversity and standing biomass differed among trophic groups. No significant within-group association was found in oligotrophic (p = 0.39) or mesotrophic (p = 0.11) wetlands, whereas a significant negative association emerged in lightly eutrophic wetlands (slope = −0.10, p = 0.04) (Figure 9d–f).
For Pielou’s evenness, the overall mixed-effects association with standing biomass was negative (p = 0.046), and the evenness–trophic group interaction was significant (p < 0.05). Within-group, significant negative associations were detected in mesotrophic (slope = −0.60, p = 0.01) and lightly eutrophic (slope = −0.57) wetlands, whereas the association was non-significant in oligotrophic wetlands (p = 0.07) (Figure 9g–i).
3.4.2. Resource-Use Efficiency
Phytoplankton resource-use efficiency (RUE) rose with increasing eutrophication (Figure 8b), with wetland-level mean values of 130.51, 311.56 and 350.64 for oligotrophic, mesotrophic and lightly eutrophic wetlands, respectively. One-way ANOVA on wetland-level means confirmed a significant difference among trophic categories (p = 0.02). Post-hoc tests further showed that RUE was significantly higher in lightly eutrophic than in oligotrophic wetlands (p = 0.04).
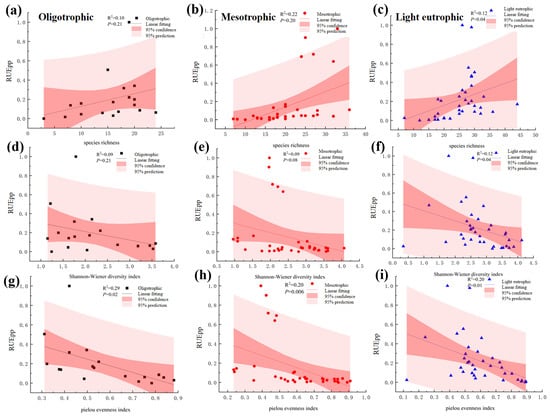
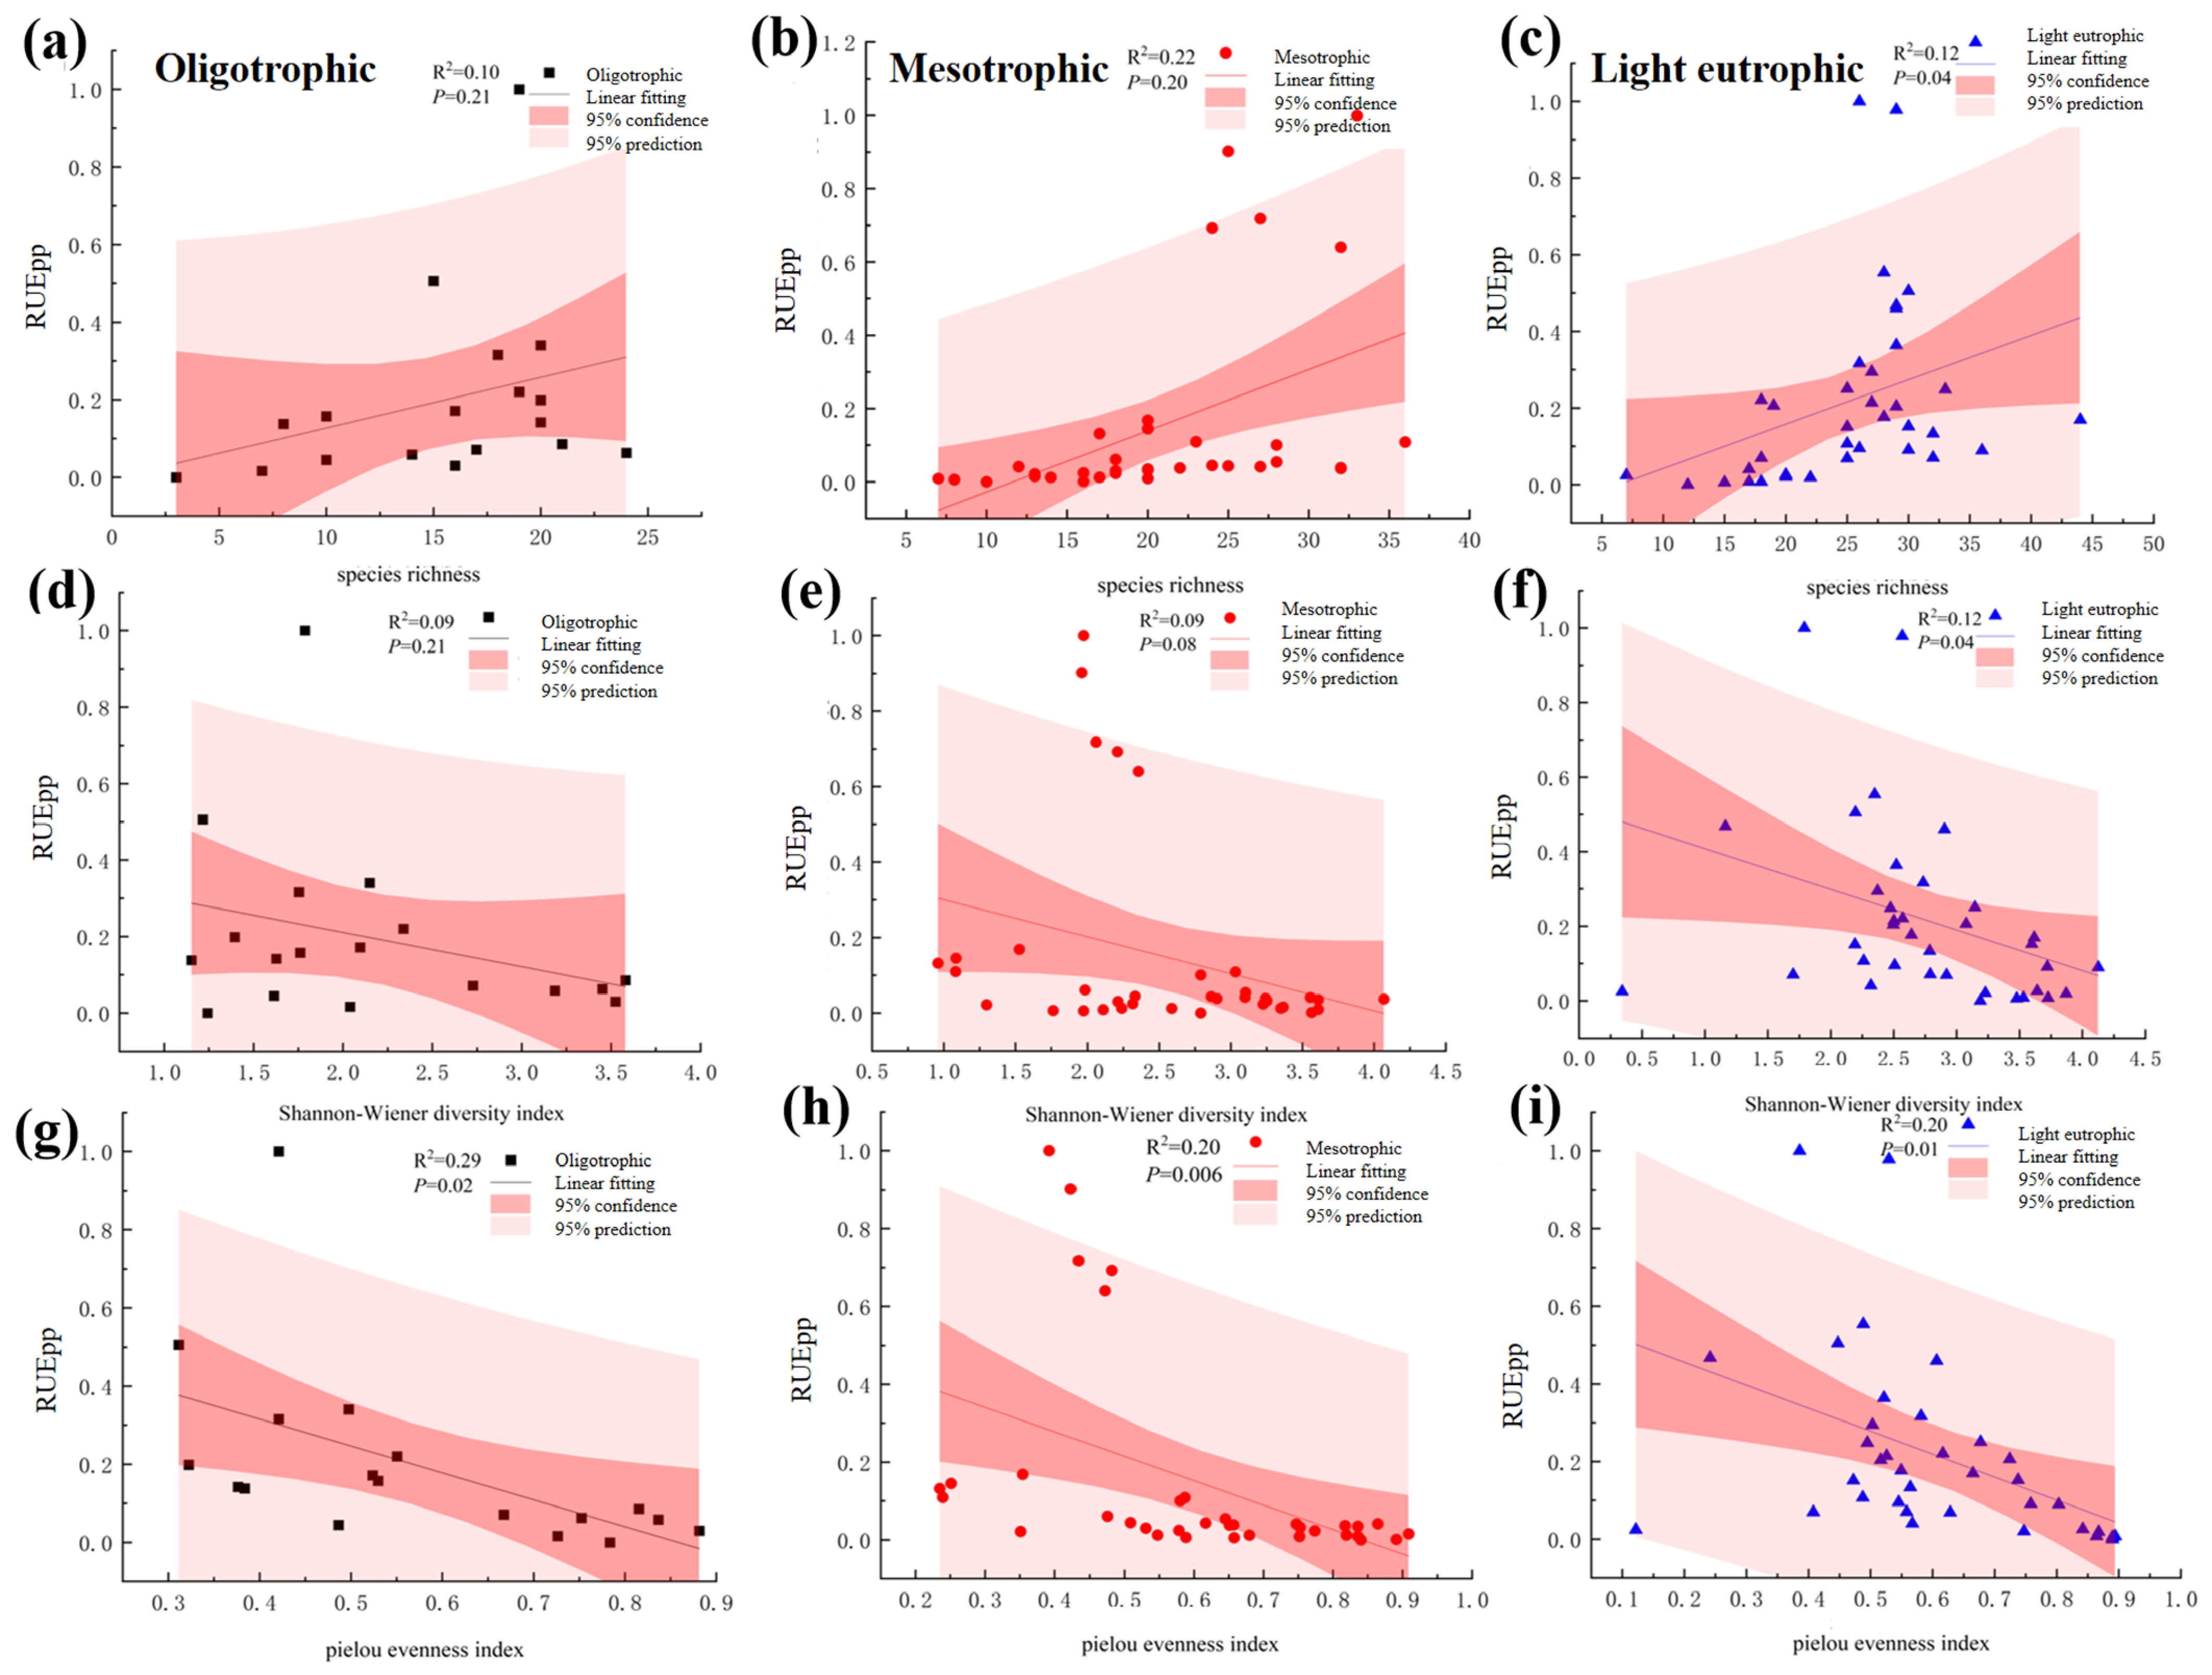
A linear mixed-effects model (wetland as a random effect) showed a significant association between species richness and RUE across all sites (p = 0.03), and the richness–trophic group interaction was significant (p = 0.02). Within-group, a significant positive association was observed only in lightly eutrophic wetlands (slope = 0.01, p = 0.04); no significant association was detected in oligotrophic (p = 0.21) or mesotrophic (p = 0.20) wetlands (Figure 10a–c).
Figure 10.
Relationship between phytoplankton diversity and resource use efficiency in different trophic levels of wetlands in Jinan. (a–c) Species richness, (d–f) Shannon–Wiener diversity index, and (g–i) Pielou’s evenness index versus resource use efficiency in oligotrophic (a,d,g), mesotrophic (b,e,h), and lightly eutrophic (c,f,i) wetlands. Boxes represent the interquartile range (IQR), horizontal lines indicate medians, whiskers extend to 1.5 × IQR, □ represents the mean.
For the Shannon index, the overall mixed-effects association with RUE was significant (p = 0.03), and the Shannon–trophic group interaction was significant (p = 0.02). Within-group, a significant negative association was found in lightly eutrophic wetlands (slope = −0.11, p = 0.04), whereas no significant association was detected in oligotrophic (p = 0.21) or mesotrophic (p = 0.08) wetlands (Figure 10d–f).
For Pielou’s evenness, the overall mixed-effects association with RUE was negative (slope = −0.47, p = 0.03), and the evenness–trophic group interaction was significant (p = 0.02). Within-group, significant negative associations were observed in all three trophic categories (oligotrophic: slope = −0.69, p = 0.02; mesotrophic: slope = −0.63, p = 0.006; lightly eutrophic: slope = −0.59, p = 0.01) (Figure 10g–i).
A sensitivity analysis based on wetland-level means (n = 15) yielded conclusions consistent with the mixed-effects results. The directions of the diversity–standing biomass and diversity–RUE associations and their gradient dependence were unchanged, supporting the robustness of the principal conclusions to the choice of analytical unit.
Note that raw pooled species richness across sites within each trophic group is presented only for descriptive purposes. Owing to unequal sampling effort among groups, pooled richness is not used for cross-group comparison. Trend analysis of diversity along the eutrophication gradient relies on per-site alpha richness.
In addition, our sampling sites are nested within independent wetlands, rather than fully randomized replicate samples. Random rarefaction of sampling sites risks removing entire wetlands from the dataset, which distorts the representation of wetland communities under each trophic state.
4. Discussion
4.1. Gradient Effects of Eutrophication on Water Environment and Phytoplankton Communities in Urban Small Wetlands
Based on the trophic-level index (TLI), we established a continuous trophic gradient from oligotrophic to lightly eutrophic status across the 15 urban small wetlands in Jinan. This dataset provides an ideal natural platform for investigating how phytoplankton communities respond to eutrophication. Relative to large water bodies, small wetlands are more susceptible to external nutrient loading, a pattern closely associated with the spatial variation in the intensity of human activities across Jinan’s administrative districts [39]. In this study, lightly eutrophic wetlands were mainly located in areas with intense anthropogenic disturbance and received considerable allochthonous nitrogen and phosphorus inputs [40]. Their mean TN (6.83 mg L−1) and TP (0.14 mg L−1) concentrations approached or even exceeded the thresholds for moderate eutrophication defined for conventional lakes, while their overall TLI values still fell within the lightly eutrophic category. Such inconsistency likely stems from the rapid hydrological exchange and strong self-purification capacity of small wetlands [41]. Additionally, it suggests potential limitations of the existing TLI criteria when applied to small urban waterbodies [42].
Contrary to conventional eutrophication patterns, mesotrophic wetlands exhibited higher nutrient and permanganate index (CODMn) concentrations than lightly eutrophic wetlands, deviating from the typical trend of increased pollutant accumulation under intensified eutrophication [11]. This anomalous observation was closely associated with surrounding agricultural activities and livestock breeding [43]. Extensive cropland coverage and intensive anthropogenic interference in the upstream catchments of mesotrophic wetlands aggravated agricultural non-point source pollution [44]. These findings indicate that wetlands with moderate TLI trophic levels can still accumulate disproportionately high concentrations of individual water quality parameters [45].
The mean Chl-a concentration reached its maximum (0.03 mg L−1) in lightly eutrophic wetlands, where external nitrogen and phosphorus inputs promoted algal growth under elevated trophic conditions [46]. Unlike the general trend of declining water transparency with worsening eutrophication, the Secchi depth peaked at 1.65 m in lightly eutrophic sites. This unexpected pattern likely occurred because these wetlands were still in the early stage of slight eutrophication. Phytoplankton grew actively, yet the total biomass had not reached the threshold for algal blooms [47]. The reason for this phenomenon may be that the sampling may have missed the peak period of algal blooms [48]. Dense phytoplankton rapidly assimilated phosphate and ammonium, lowering dissolved nutrient levels in the water column and driving nutrient transfer from the water phase to algal biomass [49]. Furthermore, field sampling was carried out in autumn, when lower ambient temperatures restrained excessive algal proliferation. This evidence suggests that small urban wetlands exhibit non-linear responses to eutrophication [50]. Therefore, trophic evaluation based solely on physicochemical variables may not fully capture the ecological condition of such habitats. Independent biological indicators, including phytoplankton community structure and standing biomass, may provide complementary information for ecological assessment, and long-term continuous monitoring is needed to validate these findings.
4.2. Asynchronous Responses of Taxonomic and Functional Diversity to Eutrophication
This result, however, seems to contradict classical eutrophication theory. The theory posits that rising nutrient concentrations reduce species diversity, driven by strong environmental filtering associated with intensive cyanobacterial blooms [51]. In our study, no single species achieved extreme dominance in lightly eutrophic wetlands. The resource heterogeneity hypothesis holds that moderate nutrient enrichment facilitates species coexistence [52]. Additionally, frequent hydrological disturbances within these small wetlands hindered any competitively dominant species from gaining absolute predominance, thereby sustaining high diversity [53].
Functional divergence (FDiv) increased along with the trophic gradient, reflecting enhanced niche complementarity and reduced interspecific competition. This pattern likely resulted from sufficient resource availability in eutrophic environments, which strengthens niche differentiation and alleviates competitive exclusion among phytoplankton species [54]. In contrast, oligotrophic wetlands exhibited the highest functional evenness (FEve), representing the most thorough and efficient utilization of limited resources [55].
More importantly, taxonomic and functional β-diversity exhibited asynchronous responses to eutrophication, with both metrics peaking in oligotrophic wetlands. This finding indicates that phytoplankton communities in oligotrophic wetlands possessed low similarity in both species composition and functional trait configuration. No significant differences in taxonomic β-diversity were observed across the three trophic groups. The total taxonomic β-diversity was overwhelmingly dominated by the turnover component, which accounted for 63.72–73.65% of the total variation. This pattern demonstrates that inter-site dissimilarity in species composition was primarily attributable to species replacement arising from spatial environmental heterogeneity, rather than differences in trophic status [56]. In contrast, functional β-diversity was dominated by the nestedness component (79.74–97.06%), with its relative contribution decreasing from oligotrophic to lightly eutrophic wetlands. Accordingly, variations in phytoplankton functional traits across trophic levels mainly stemmed from species nestedness rather than species turnover processes [57].
Eutrophication was associated with some functional trait turnover. This evidence demonstrates that taxonomic and functional diversity reflect distinct ecological processes. Taxonomic turnover reflects environmental filtering and spatial species substitution, whereas the predominance of functional nestedness indicates that differences in functional composition arise mainly through species loss (nestedness), rather than replacement within each trophic group. For the management of small urban wetlands, the predominance of functional nestedness implies that conservation strategies should prioritize the protection of functionally unique wetlands, instead of indiscriminately safeguarding every individual site. Under nested assembly processes, the persistence of functional diversity largely relies on core wetlands harboring high species richness.
4.3. Trophic Gradient Modulates the Biodiversity–Ecosystem Functioning Relationship
In this study, the relationships of phytoplankton diversity with standing biomass and resource use efficiency were strongly dependent on the trophic gradient. Positive, negative, and nonsignificant relationships cooccurred across different nutrient levels, supporting the emerging ecological consensus that biodiversity–ecosystem functioning (BEF) associations are highly context-dependent [34]. These gradient-dependent patterns were tested explicitly using diversity–trophic group interaction terms within single mixed-effects models (Section 3.4), rather than being inferred from separate within-group regressions.
Under oligotrophic conditions, most diversity–function relationships were non-significant. This indicates that standing biomass under resource-limited environments was primarily constrained by environmental carrying capacity, resulting in a negligible marginal contribution of diversity [58]. In addition, under mesotrophic conditions, species richness was positively correlated with standing biomass. Moderate nutrient availability enabled species with diverse functional traits to occupy differentiated ecological niches, thereby improving overall community standing biomass [59]. In contrast, lightly eutrophic conditions yielded a more complex relationship pattern. While species richness remained positively correlated with standing biomass, both the Shannon diversity and Pielou’s evenness displayed negative standing biomass correlations. This indicates that the selection effect driven by a few high-biomass dominant species outweighed the positive diversity contribution [60]. Under nutrient-enriched scenarios, increased species richness primarily stemmed from the colonization of generalist r-strategists with high functional redundancy. The establishment of these subordinate species diluted the relative abundance of highly efficient resource-utilizing taxa, thereby lowering overall standing biomass at higher community evenness, despite elevated species richness.
Furthermore, Pielou’s evenness exhibited consistent negative correlations with resource use efficiency across all three trophic levels. Under phosphorus-replete conditions, communities dominated by a small number of highly efficient taxa exhibited superior phosphorus-to-biomass conversion efficiency compared to highly even assemblages [61].
4.4. Limitations
Several limitations should be acknowledged. First, the three trophic groups were defined using the same water-quality variables that were subsequently compared among groups; we have, therefore, reframed the group-level comparisons of these variables as descriptive characterization of the classification (Section 3.1) rather than as independent tests of trophic effects. Second, the six sampling sites within each wetland are not independent; we have accounted for this by treating wetland as a random effect in mixed-effects models and by using wetland-level summaries for between-group comparisons, although the number of independent wetlands (n = 15) remains modest. Third, this is an observational study restricted to autumn sampling, so the associations reported here do not establish causation. Fourth, “productivity” was approximated by standing biomass and should not be equated with a directly measured production rate. We have moderated causal wording and management recommendations throughout the manuscript accordingly.
5. Conclusions
This study shows that phytoplankton community assembly and ecosystem functioning in small urban wetlands varied along the trophic gradient. While species turnover in taxonomic beta diversity reflects spatial environmental heterogeneity, the nestedness-dominated pattern of functional beta diversity suggests that eutrophication differences in functional composition arose mainly through species loss (nestedness) rather than trait substitution. Furthermore, the biodiversity–ecosystem functioning (BEF) relationships were strongly context-dependent, as assessed by diversity–trophic group interaction terms (Section 3.4). Species richness was positively associated with standing biomass under moderate nutrient enrichment, yet high community evenness was consistently negatively associated with standing biomass and resource use efficiency across all trophic states. These findings suggest that simply increasing species diversity may be insufficient to optimize ecosystem functions, and that managing functional trait composition and preserving keystone functional groups may be important.
Based on these results, we suggest tentative, differentiated management directions. For oligotrophic wetlands, habitat improvement may facilitate colonization. In mesotrophic systems, our correlational results are consistent with the idea that maintaining species richness may be associated with higher standing biomass. For lightly eutrophic wetlands, management may consider regulating community structure and conserving core functional groups. However, because this study is observational and restricted to autumn, these suggestions require validation with experimental or long-term monitoring data before being adopted.
It should be noted that our sampling campaign was conducted exclusively in autumn, with effectively one sampling occasion per wetland. Consequently, the trophic classification of the wetlands (oligotrophic, mesotrophic, and lightly eutrophic) is based solely on the physico-chemical data collected during this specific snapshot. Nutrient levels and algal biomass in temperate wetlands are known to experience pronounced seasonal fluctuations (e.g., summer algal blooms or spring runoff). Therefore, the current trophic designations primarily reflect the autumnal environmental conditions of these wetlands. A multi-seasonal sampling regime is required in future studies to fully capture the annual dynamics and to confirm the representativeness of the present trophic classification.
Author Contributions
Conceptualization, X.S. and G.L.; methodology, Y.G., J.L. and X.Y.; software, D.Y. and J.L.; validation, C.L., and Y.L.; formal analysis, S.C., Z.W. and Z.L.; investigation, Y.G., and J.L.; resources, G.L.; data curation, D.Y., C.L. and Y.L.; writing—original draft, Y.G. and X.Y.; writing—review and editing, X.S.; visualization, C.L. and Y.L.; supervision, G.L.; project administration, S.C., Z.W. and X.Y.; funding acquisition, X.Y. All authors have read and agreed to the published version of the manuscript.
Funding
This research was funded by the National Natural Science Foundation of China, grant number 41977193.
Institutional Review Board Statement
Not applicable.
Informed Consent Statement
Not applicable.
Data Availability Statement
Data will be made available upon request.
Acknowledgments
The authors are grateful to the people who helped with all aspects of the fieldwork.
Conflicts of Interest
The authors declare no conflicts of interest.
Abbreviations
The following abbreviations are used in this manuscript:
| S | Dasha River |
| T | Tuma River |
| Z | Yanziwan |
| C | Chengbo Lake |
| B | Baiyun Lake |
| H | Huashan Lake |
| LS | Longshan Lake |
| X | Jixi Wetland |
| XY | Xiuyuan River |
| Q | Wangjiafang Wetland |
| Y | Xueye Lake |
| D | Dahe River |
| M | Meigui Lake |
| J | Jinshui River |
| L | Langxi River |
| SD | Water transparency |
| TN | Total nitrogen |
| TP | Total phosphorus |
| Chla | Chlorophyll a |
| CODMn | Permanganate index |
| Hab1 | Oligotrophic |
| Hab2 | Mesotrophic |
| Hab3 | Eutrophic |
| Fla1 | With flagella |
| Fla2 | Without flagella |
| Col1 | With mucilaginous envelope |
| Col2 | Without mucilaginous envelope |
| Form1 | Single cell |
| Form2 | Group or filamentous body |
| Sil1 | With siliceous cell wall |
| Sil2 | No siliceous scell wall |
| TLI | Comprehensive trophic level index |
| FD | Functional α-diversity |
| FRic | Functional richness |
| FDiv | Functional divergence |
| FEve | Functional evenness |
| βsor | Taxonomic β-diversity |
| βsim | Species turnover |
| βsne | Nestedness-resultant |
| PP | Phytoplankton standing biomass |
| RUEpp | Phytoplankton resource use efficiency |
| Bio (Phyto) | Phytoplankton biomass |
Appendix A
Table A1.
List of phytoplankton in different trophic levels of small wetlands. Note: + indicates the presence of the species in the corresponding trophic level.
References
- Jiang, H.; Lu, A.; Li, J.; Ma, M.; Meng, G.; Chen, Q.; Liu, G.; Yin, X. Effects of aquatic plant coverage on diversity and resource use efficiency of phytoplankton in urban wetlands: A case study in Jinan, China. Biology 2024, 13, 44. [Google Scholar] [CrossRef] [Scilit] [PubMed]
- Zhu, P.; Ma, M.; Jin, Y.; Yin, X.W.; Zhu, Z.; Wang, S.; Shang, S.Q. Nutrient enrichment modulates phytoplankton biodiversity-resource use efficiency relationships in temperate lentic ecosystems of Northern China. Hydrobiologia 2026, 853, 1937–1950. [Google Scholar] [CrossRef] [Scilit]
- Chen, Q.; Zhang, J.; Liu, Y.; Jiang, H.J.; Liu, G.; Yin, X.W. Nutrient-driven shifts in zooplankton structural-functional dynamics across different freshwaters. Water Biol. Secur. 2026, 5, 100449. [Google Scholar] [CrossRef] [Scilit]
- Hu, W.; Zhang, Z.; Mu, G. Revealing the ecological transitions and driving mechanisms in plateau lake wetlands conservation through a three-decade landscape ecology analysis. J. Clean. Prod. 2025, 495, 145066. [Google Scholar] [CrossRef] [Scilit]
- Wang, B.; Yin, X. Homogenization of functional diversity of rotifer communities in relation to eutrophication in an urban river of north China. Biology 2023, 12, 1488. [Google Scholar] [CrossRef] [Scilit] [PubMed]
- Brambilla, M.; Rizzolli, F.; Franzoi, A.; Caldonazzi, M.; Zanghellini, S.; Pedrini, P. A network of small protected areas favoured generalist but not specialized wetland birds in a 30-year period. Biol. Conserv. 2020, 248, 108699. [Google Scholar] [CrossRef] [Scilit]
- Ma, M.; Li, J.; Lu, A.; Zhu, P.; Yin, X. Effects of phytoplankton diversity on resource use efficiency in a eutrophic urban river of Northern China. Front. Environ. Sci. 2024, 12, 1389220. [Google Scholar] [CrossRef] [Scilit]
- Brennan, G.L.; Colegrav, N.; Collins, S. Evolutionary consequences of multidriver environmental change in an aquatic primary producer. Proc. Natl. Acad. Sci. USA 2017, 114, 9930–9935. [Google Scholar] [CrossRef] [Scilit] [PubMed]
- Huang, H.; Luo, D.; Zhou, R.; Liu, P.F.; Li, L. Increased allochthonous dissolved organic carbon provides a competitive advantage for planktonic over benthic primary producers in shallow lakes. Hydrobiologia 2026, 853, 1135–1150. [Google Scholar] [CrossRef] [Scilit]
- Liu, Y.; Mao, F.; Zhang, S.; Song, Y.; Jiang, M.; Wang, H.; Yin, X.W. Effects of ice cover on diversity and community assembly of benthic algae in a stream system of northern china. Aquat. Ecol. 2026, 60, 24. [Google Scholar] [CrossRef] [Scilit]
- Zhang, J.; Liu, Y.; Chen, Q.; Yin, X.W. Biodiversity and functional redundancy of fish assemblages in relation to nutrient enrichment: A case study in a boreal river of China. Hydrobiologia 2025, 852, 2993–3004. [Google Scholar] [CrossRef] [Scilit]
- Chen, Y.B.; Liang, S.; Han, B.; Li, J.J.; Zhang, F.S.; Wen, D.P.; Wang, H.; Zhang, H.H. Characteristics and driving factors of phytoplankton functional groups in Zhaling Lake and Eling Lake. J. Hydroecology 2026, 1–13, (In Chinese with English Abstract). [Google Scholar] [CrossRef]
- Sun, P.Y.; Hu, R.; Ou, L.J.; Yang, Y.F.; Wang, Q. Characteristics of phytoplnakton functional groups and their responses to environmental factors in the connected river-lake system of Guangzhou Haizhu National Wetland Park. Chin. J. Ecol. 2023, 42, 2655–2664, (In Chinese with English Abstract). [Google Scholar] [CrossRef]
- Zhang, Q.Q.; Zeng, J.; Yin, Z.; Feng, J.; Liu, J.; Xiu, Y.X.; Liu, G.; Xu, C.Y. Phytoplankton community structure, diversity, and functional groups in urban river under different black and odorous levels. Environ. Sci. 2023, 44, 4965–4976, (In Chinese with English Abstract). [Google Scholar] [CrossRef] [Scilit] [PubMed]
- Shen, H.L.; Xu, H.; Zhang, X.R.; Chen, J.; Zhu, T.S.; Jiang, W.X.; Fu, Y. Characteristics of phytoplankton functional groups and ecological health assessment in spring type urban lakes: A case study in Lake Daming, Jinan City. J. Lake Sci. 2024, 36, 1036–1046, (In Chinese with English Abstract). [Google Scholar] [CrossRef] [Scilit]
- Zhu, Z.Z.; Guo, Y.N.; Sun, X.; Li, Y.G.; Jia, L.; Han, X.; Tan, L.; Li, S.J.; Wang, S.S.; Shang, S.Q.; et al. Seasonal variation characteristics of phytoplankton community structure in urban lakes—A case study of Daming Lake in Jinan City. Appl. Ecol. Environ. Res. 2026, 24, 4193–4211. [Google Scholar] [CrossRef] [Scilit]
- Wand, S.S.; Xiang, H.; Zhu, Z.Z.; Tian, S.; Shang, S.Q.; Zhao, C.S. Phytoplankton community structure and water quality response in Jixi National Wetland. Environ. Monit. Forewarn. 2024, 16, 124–130, (In Chinese with English Abstract). [Google Scholar]
- Yang, Q.; Tand, H.Q.; Zhang, S.Y.; Liu, J.J.; Tian, Y.; Zheng, L.L.; Xue, F. Variation of Phytoplankton Community and Water Quality AssessmentBefore and After Pollution Control in the Upper Reaches of XiaoqingRiver. Environ. Monit. China 2024, 40, 151–164, (In Chinese with English Abstract). [Google Scholar] [CrossRef]
- Si, G.C.; Xue, X.D.; Zhao, W.; Zhao, C.F.; Yan, T.; Wei, D. Bacterium-Algae diversity and association relationship in northern scenic lake in summer. J. Univ. Jinan (Sci. Technol.) 2023, 37, 34–38+47, (In Chinese with English Abstract). [Google Scholar] [CrossRef]
- Shang, S.Q.; Jia, L.; Wang, S.S.; Yin, X.W.; Bai, H.F. Zooplankton functional groups and their response to water physiochemical factors in Jixi Wetland Park in Jinan. J. Hydroecology 2023, 44, 113–121, (In Chinese with English Abstract). [Google Scholar] [CrossRef]
- Huang, Y.Q.; Zhang, X.Y.; Yu, H.; Shen, M.Y.; Li, S.Y.; Li, R.; Zhang, J.; Yan, S.; Zhang, W.G.; Zhang, X.D. Landscape pattern changes and driving mechanisms of small wetlandsin western Jilin. Chin. J. Ecol. 2026, 45, 434–447, (In Chinese with English Abstract). [Google Scholar] [CrossRef]
- Wei, F.K.; Xu, L.G.; Li, W.X.; Song, T. Spatiotemporal variations and influencing factors of phytoplanktonfunctional groups in the urban water network of Suzhou, China. Chin. J. Appl. Ecol. 2026, 37, 1675–1684, (In Chinese with English Abstract). [Google Scholar] [CrossRef] [Scilit] [PubMed]
- Ding, L.Q.; Zhou, Y.F.; Chen, Y.J. Succession characteristics of phytoplankton functional groups in theSonghua Lake and their influencing environmental factors. Wetl. Sci. 2025, 23, 774–782, (In Chinese with English Abstract). [Google Scholar] [CrossRef]
- Yang, Q.L.; Ren, J.M.; Peng, X.Y.; Xie, Y.X.; Yu, L.; Lu, H.Y. Succession characteristics of phytoplankton functional groups andwater quality assessment in the middle-lower reaches of the Yarkant River. Acta Sci. Circumstantiae 2026, 46, 420–430, (In Chinese with English Abstract). [Google Scholar] [CrossRef]
- State Environmental Protection Administration. Shui He Feishui Jiance Fenxi Fangfa, 4th ed.; China Environmental Science Press: Beijing, China, 2002. (In Chinese)
- Hu, H.J.; Wei, Y.X. The Freshwater Algae of China-Systematics, Taxonomy and Ecolgy; Science Press: Beijing, China, 2006. (In Chinese) [Google Scholar]
- Padisák, J.; Crossetti, L.O.; Naselli-Flores, L. Use and misuse in the application of the phytoplankton functional classification: A critical review with updates. Hydrobiologia 2009, 621, 1–19. [Google Scholar] [CrossRef] [Scilit]
- Reynolds, C.S.; Huszar, V.; Kruk, C.; Naselli-Flores, L.; Melo, S. Towards a functional classification of the freshwater phytoplankton. J. Plan. Res. 2002, 24, 417–428. [Google Scholar] [CrossRef] [Scilit]
- Hu, R.; Lan, Y.Q.; Xiao, L.J.; Han, B.P. The concepts, classification and application of freshwaterphytoplankton functional groups. J. Lake Sci. 2015, 27, 11–23, (In Chinese with English Abstract). [Google Scholar] [CrossRef] [Scilit] [PubMed]
- Li, J.; Ma, M.; Wang, L.; Jin, Y.; Liu, Y.; Yin, X.; Liu, G.; Song, J. Ecological drivers of taxonomic, functional, and phylogenetic beta diversity of macroinvertebrates in Wei river basin of northwest China. Front. Ecol. Evol. 2024, 12, 1410915. [Google Scholar] [CrossRef] [Scilit]
- Huang, X.F. Ecological Investigation, Observation, and Analysis of Lakes; China Standard Press: Beijing, China, 1999. (In Chinese) [Google Scholar]
- Environmental Monitoring of China. Evaluation Method and Grading Regulations for Eutrophication of Lakes (Reservoirs); Environmental Monitoring of China: Beijing, China, 2001. (In Chinese)
- Siegfried, C.A.; Bloomfield, J.A.; Sutherland, J.W. Acidity status and phytoplankton species richness, standing crop, and community composition in Adirondack, New York, U.S.A. lakes. Hydrobiologia 1989, 175, 13–32. [Google Scholar] [CrossRef] [Scilit]
- Filstrup, C.T.; Hillebrand, H.; Heathcote, A.J.; Harpole, W.S.; Downing, J.A. Cyanobacteria dominance influences resource use efficiency and community turnover in phytoplankton and zooplankton communities. Ecol. Lett. 2014, 17, 464–474. [Google Scholar] [CrossRef] [Scilit] [PubMed]
- Oksanen, J.; Simpson, G.L.; Blanchet, F.G.; Kindt, R.; Legendre, P.; Minchin, P.R.; O’Hara, R.B.; Solymos, P.; Stevens, M.H.H.; Szoecs, E.; et al. Vegan: Community Ecology Package. R Package Version 2.6-8. Available online: https://CRAN.R-project.org/package=vegan (accessed on 20 June 2026).
- Laliberté, E.; Legendre, P.; Shipley, B. FD: Measuring Functional Diversity from Multiple Traits, and Other Tools for Functional Ecology. R Package Version 1.0-12.2. Available online: https://CRAN.R-project.org/package=FD (accessed on 20 June 2026).
- Dray, S.; Dufour, A.B. Ade4: Analysis of Ecological Data: Exploratory and Euclidean Methods in Environmental Sciences. R Package Version 1.7-22. Available online: https://CRAN.R-project.org/package=ade4 (accessed on 20 June 2026).
- Liu, J.; Sun, D.Y.; Zhang, Y.L.; Li, Y.M. Pre-classification improves relationships between water clarity, light attenuation, and suspended particulates in turbid inland waters. Hydrobiologia 2013, 711, 71–86. [Google Scholar] [CrossRef] [Scilit]
- Feng, L.; Hou, X.; Zheng, Y. Monitoring and understanding the water transparency changes of fifty large lakes on the Yangtze Plain based on long-term MODIS observations. Remote Sens. Environ. 2019, 221, 675–686. [Google Scholar] [CrossRef] [Scilit]
- Tian, S.; Yin, X. Intermediate disturbance hypothesis explains eutrophication and biodiversity pattern in a boreal river basin, China. Hydrobiologia 2022, 849, 3389–3399. [Google Scholar] [CrossRef] [Scilit]
- Harris, T.D.; Reinl, K.L.; Azarderakhsh, M.; Berger, S.A.; Berman, M.C.; Bizic, M.; Bhattacharya, R.; Burnet, S.H.; Cianci-Gaskill, J.A.; Domis, L.N.D.S.; et al. What makes a cyanobacterial bloom disappear? A review of the abiotic and biotic cyanobacterial bloom loss factors. Harmful Algae 2024, 133, 102599. [Google Scholar] [CrossRef] [Scilit] [PubMed]
- Lürling, M.; Kang, L.; Mucci, M.; Oosterhout, F.V.; Noyma, N.P.; Miranda, M.; Huszar, V.L.M.; Waajen, G.; Marinho, M.M. Coagulation and precipitation of cyanobacterial blooms. Ecol. Eng. 2020, 158, 106032. [Google Scholar] [CrossRef] [Scilit]
- Duré, G.A.V.; Simões, N.R.; Braghin, L.S.M.; Ribeiro, S.M.M.S. Effect of eutrophication on the functional diversity of zooplankton in shallow ponds in Northeast Brazil. J. Plankton Res. 2021, 43, 894–907. [Google Scholar] [CrossRef] [Scilit]
- Ma, J.; Yin, X.; Liu, G.; Song, J. Intensification of human land use decreases taxonomic, functional, and phylogenetic diversity of macroinvertebrate community in Weihe river basin, China. Diversity 2024, 16, 513. [Google Scholar] [CrossRef] [Scilit]
- Soininen, J.; Heino, J.; Wang, J. A meta-analysis of nestedness and turnover components of beta diversity across organisms and ecosystems. Glob. Ecol. Biogeogr. 2018, 27, 96–109. [Google Scholar] [CrossRef] [Scilit]
- Barros, F.; Blanchet, H.; Hammerstrom, K.; Sauriau, P.G.; Oliver, J. A framework for investigating general patterns of benthic β-diversity along estuaries. Estuar. Coast. Shelf Sci. 2014, 149, 223–231. [Google Scholar] [CrossRef] [Scilit]
- Bottero, M.A.S.; Jaubet, M.L.; Llanos, E.N.; Becherucci, M.E.; Elías, R.; Garaffo, G.V. Spatial-temporal variations of a SW Atlantic macrobenthic community affected by a chronic anthropogenic disturbance. Mar. Pollut. Bull. 2020, 156, 111189. [Google Scholar] [CrossRef] [Scilit] [PubMed]
- Ptacnik, R.; Solimini, A.G.; Andersen, T.; Tamminen, T.; Brettum, P.; Lepistö, L.; Willén, E.; Rekolainen, S. Diversity predicts stability and resource use efficiency in natural phytoplankton communities. Proc. Natl. Acad. Sci. USA 2008, 105, 5134–5138. [Google Scholar] [CrossRef] [Scilit] [PubMed]
- McGrady-Steed, J.; Harris, P.M.; Morin, P.J. Biodiversity regulates ecosystem predictability. Nature 1997, 390, 162–165. [Google Scholar] [CrossRef] [Scilit]
- Schmidtke, A.; Gaedke, U.; Weithoff, G. A mechanistic basis for under-yielding in phytoplankton communities. Ecology 2010, 91, 212–221. [Google Scholar] [CrossRef] [Scilit] [PubMed]
- Okogwu, O.I.; Ugwumba, A.A. Response of phytoplankton functional groups to fluctuating water level in two shallow floodplain lakes in Cross River, Nigeria. Inland Waters 2012, 2, 37–46. [Google Scholar] [CrossRef] [Scilit]
- Tang, X.; Li, R.; Han, D.; Scholz, M. Response of eutrophication development to variations in nutrients and hydrological regime: A case study in the Changjiang River (Yangtze) basin. Water 2020, 12, 1634. [Google Scholar] [CrossRef] [Scilit]
- Santos, G.D.S.; Silva, E.E.C.; Diniz, L.P.; Calvi, R.X.; de Oliveira, D.M.; Delfim, B.L.; De Paula, T.L.T.; Eskinazi-Sant’ANna, E.M. Deep lakes support higher zooplankton functional diversity than shallow lakes: A case study in lacustrine environments affected by mining tailings (Lower Doce River basin, Brazil). Freshw. Biol. 2024, 69, 945–958. [Google Scholar] [CrossRef] [Scilit]
- Titocci, J.; Fink, P. Disturbance alters phytoplankton functional traits and consequently drives changes in zooplankton life-history traits and lipid composition. Hydrobiologia 2024, 851, 161–180. [Google Scholar] [CrossRef] [Scilit]
- Gauthier, M.; Launay, B.; Goff, G.L.; Pella, H.; Douady, C.J.; Datry, T. Fragmentation promotes the role of dispersal in determining 10 intermittent headwater stream metacommunities. Freshw. Biol. 2020, 65, 2169–2185. [Google Scholar] [CrossRef] [Scilit]
- Fernandez-Fournier, P.; Avilés, L. Environmental filtering and dispersal as drivers of metacommunity composition: Complex spider webs as habitat patches. Ecosphere 2018, 9, e02101. [Google Scholar] [CrossRef] [Scilit]
- Rychteck, P.; Znachor, P. Spatial heterogeneity and seasonal succession of phytoplankton along the longitudinal gradient in a eutrophic reservoir. Hydrobiologia 2011, 663, 175–186. [Google Scholar] [CrossRef] [Scilit]
- Pereira, A.L.A.; Dos, S.S.M.; De, S.C.A.; Dos, S.C.R.A.; Bortolini, J.C. Local contribution of taxonomic and functional beta diversity of phytoplankton and its relationships with environmental heterogeneity in a tropical reservoir. Hydrobiologia 2026, 853, 1873–1890. [Google Scholar] [CrossRef] [Scilit]
- Xiong, C.; Lu, C.; Jia, H.; Liu, T.; Yang, Z.; Deng, W.; Guo, Z.; Huang, Y.; Zhong, Y.; Li, T. Impact of environmental selection on spatial heterogeneity of summer phytoplankton community in Pearl River Estuary, China. Ecohydrol. Hydrobiol. 2025, 25, 100695. [Google Scholar] [CrossRef] [Scilit]
- Faraji, M.S.; Rahman, M.M.; Sarker, M.M.; Hasan, M.M.; Jaman, A.; Baek, H.J.; Arai, T.; Ngah, N.; Hossain, M.B. Diversity, community assemblage, and environmental determinants of phytoplankton in a subtropical transboundary coastal river. Ecol. Evol. 2025, 15, e72787. [Google Scholar] [CrossRef] [Scilit] [PubMed]
- Chen, Y.; Cai, H.; Gong, Y.; Lu, K.; Mao, J.; Chen, W.; Wang, K.; Gao, H.; Tian, M. Diurnal distribution of phytoplankton in large shallow lakes based on time series clustering. Ecol. Inform. 2025, 90, 103250. [Google Scholar] [CrossRef] [Scilit]

Disclaimer/Publisher’s Note: The statements, opinions and data contained in all publications are solely those of the individual author(s) and contributor(s) and not of MDPI and/or the editor(s). MDPI and/or the editor(s) disclaim responsibility for any injury to people or property resulting from any ideas, methods, instructions or products referred to in the content. |
© 2026 by the authors. Licensee MDPI, Basel, Switzerland. This article is an open access article distributed under the terms and conditions of the Creative Commons Attribution (CC BY) license.