


Abstract
The Yangtze, Asia’s longest river, supports ecosystems and people, but rising stress from development is degrading water quality and altering algae. Using 2016–2021 water quality data from 83 sites and 2021 phytoplankton (55 sites) and periphyton (44 sites) surveys, this study analyzes the spatiotemporal variations in water quality and algal communities in the Yangtze River mainstream and the driving mechanisms via Mann–Kendall trends, random forest modeling, and hierarchical partitioning. The results revealed significant long-term declines in TN, TP, ammonia nitrogen, and permanganate indices, with a rising water quality index (WQI), reflecting effective basin-wide pollution control. Spatially, the Jinsha River segment maintains a high WQI and low nutrient content, whereas the downstream reaches present increasing TN, TP, and ammonia nitrogen along the longitudinal gradient in 2021, reflecting the cumulative effects of intensified anthropogenic activities from the headwaters to the estuary. Phytoplankton density increases downstream and is correlated with nutrient enrichment, with cyanobacteria/Chlorophyta dominance in the middle–lower reaches. The periphyton density peaks in the middle reaches (1.76 × 10⁸ cells/cm2), which is driven by the optimal temperature, nutrients, and substrates. Integrated ecological assessment via random forest models classified 85% of the sites as “good” or “excellent,” but 15% of the lower-reach sites were rated “moderate,” highlighting nutrient-induced ecological stress. Mantel tests and hierarchical partitioning identified TN as the primary driver of phytoplankton community composition, whereas water temperature emerged as the key factor shaping periphyton distribution. These findings underscore the necessity of differentiated management strategies: strict conservation of upstream pristine habitats and enhanced nitrogen–phosphorus control in downstream industrialized zones.
1. Introduction
The Yangtze River, a vital artery in Asia and the world’s third-longest river, plays a crucial role in supporting diverse ecosystems and human activities. Originating from the Tanggula Mountains on the Qinghai–Tibet Plateau and stretching approximately 6300 km through 11 provincial administrative regions in China, it is a complex and dynamic aquatic ecosystem [1]. In recent decades, rapid industrialization, urbanization, and agricultural expansion along the Yangtze River have posed significant challenges to its water quality and ecological health [2,3]. The intensification of human activities has led to increased inputs of pollutants, such as nitrogen and phosphorus compounds, which can cause eutrophication and affect the growth and distribution of aquatic organisms [4,5]. Understanding the ecological status of the Yangtze River is essential for formulating effective management strategies to ensure its sustainable development.
Water quality and algal communities are two key aspects in assessing the ecological health of rivers. Water quality indicators reflect the overall environmental conditions of a water body [6], whereas phytoplankton and periphyton, as primary producers in aquatic ecosystems, are sensitive to environmental changes [7,8]. To assess the changes in the status of aquatic ecosystems in the Yangtze River Basin, numerous studies have focused on the correlations between phytoplankton and environmental factors. As altitude varies, human activity intensity, climate, and geographical environment all significantly differ, which in turn affects the composition of phytoplankton communities. Among these factors, human activity intensity is a key environmental factor influencing phytoplankton communities in headwater regions [9]. In studies along the main stream of the Yangtze River, the composition of phytoplankton communities significantly varies with season and spatial location. Water temperature, dissolved oxygen, chemical oxygen demand, nitrite, and ammonia nitrogen are important environmental factors affecting the composition of phytoplankton communities in the main stream [10]. Data from the Yangtze River estuary over the past 50 years indicate that human activities and climate change have altered the physicochemical factors in the estuary. For example, there have been increases in nitrogen and phosphorus concentrations and ratios, rising water temperatures, and decreasing turbidity. These changes in environmental conditions have had profound impacts on the composition of phytoplankton communities [7].
Periphyton, which attaches to various substrates, is a vital primary producer in aquatic ecosystems and integrates physical and chemical disturbances into the water body through photosynthesis [11]. Periphyton responds rapidly to human disturbances and environmental changes, such as habitat destruction, eutrophication, metal pollution, herbicide contamination, and acidification. Moreover, the redistribution of periphyton following disturbances typically occurs more swiftly than that of other organisms. Therefore, the community composition of periphyton can effectively serve as an indicator of changes in the ecological environment [12]. Their diversity and density can serve as important ecological indicators, providing insights into the stability and functionality of the ecosystem [13]. However, previous studies on the Yangtze River have often focused on specific regions or limited parameters, lacking a comprehensive understanding of the ecological status from the headwaters to the estuary.
Since 2016, the Chinese government has implemented a series of basin-scale management policies aimed at curbing pollution and restoring the ecological integrity of the Yangtze River. These policies have established regulatory frameworks for discharge control, agricultural runoff reduction, and water quality monitoring, providing an important background for interpreting the observed spatiotemporal trends in water quality and algal communities along the mainstream. This study aims to fill this knowledge gap by conducting a comprehensive assessment of the ecological status of the Yangtze River mainstream. We analyzed the spatiotemporal variation trends of water quality indicators, the spatial variations in phytoplankton and periphyton, and the driving mechanisms of the comprehensive ecological assessment. By integrating water quality data, algal diversity, and density information, we seek to provide a more in-depth understanding of the Yangtze River’s ecological status and offer a scientific basis for targeted management strategies to protect and improve its ecological environment.
2. Materials and Methods
2.1. Study Area
The Yangtze River originates from the Tanggula Mountains on the Qinghai–Tibet Plateau. Its main stem stretches approximately 6300 km and flows eastward through 11 provincial administrative regions in China. Under the influence of the monsoon climate, runoff is unevenly distributed within the year, with the flood season (May–October) accounting for more than 70% of the annual water volume. Several large hydraulic projects, including the Three Gorges, Gezhouba, and Xiluodu reservoirs, have been built along the mainstream, which significantly regulate the runoff processes and alter the natural seasonal distribution of discharge. Based on geographical and hydrological attributes, the mainstream is divided into four sections:
(1) Jinsha River section (from the source to Yibin, Sichuan): This section includes sampling sites from Qinghai (QH) and the upper part of Yunnan (YN). Flowing through high mountains and deep gorges, the riverbed gradient is steep, the flow is turbulent, and hydropower resources are abundant. This section contains multiple cascade reservoirs that regulate upstream inflow, although the total runoff remains relatively small compared with downstream reaches.
(2) Upper reach (from Yibin to Yichang, Hubei): This section includes sampling sites from the lower part of Yunnan (YN), Sichuan (SC), and Chongqing (CQ). Entering the Sichuan Basin, the riverbed gradually widens, the gradient decreases, and the flow velocity markedly slows down relative to the Jinsha River section. After receiving major tributaries such as the Tuojiang, Jialing, and Wu rivers, the discharge increases substantially; however, near Yichang, the flow velocity is further reduced due to the backwater effect of the Three Gorges Reservoir.
(3) Middle reach (from Yichang to Hukou, Jiangxi): This section includes sampling sites from Hubei (HB), Hunan (HN), and Jiangxi (JX). Flowing through the Jianghan Plain and the Dongting and Poyang Lake regions, the channel meanders with a smaller gradient and even lower velocity. This section is notably affected by the release regulation of the Three Gorges Reservoir, so that water levels and discharge exhibit artificially regulated patterns. Meanwhile, frequent water exchanges with numerous lakes and tributaries occur; during flood periods, the velocity increases slightly, but overall, the flow remains gentle.
(4) Lower reach (from Hukou to the estuary): This section includes sampling sites from Anhui (AH), Jiangsu (JS), and Shanghai (SH). The terrain is low and flat, the channel is wide and straight, and the flow velocity is stable and relatively low. Owing to tidal backwater, the velocity in the estuarine section varies periodically, but overall the flow is steady, providing excellent navigation conditions and supporting a core economic zone within the Yangtze River Belt.
2.2. Data Collection
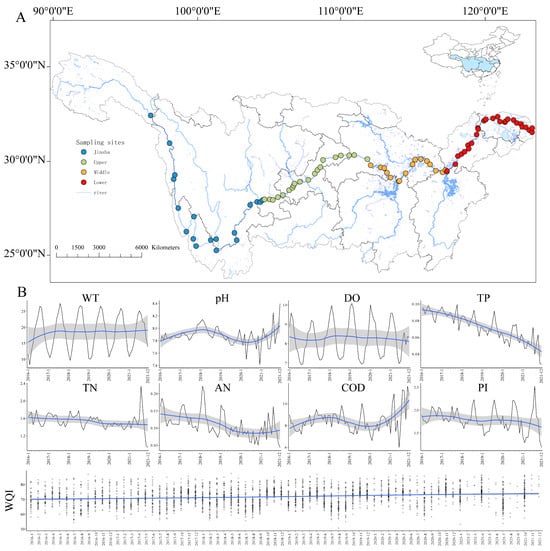
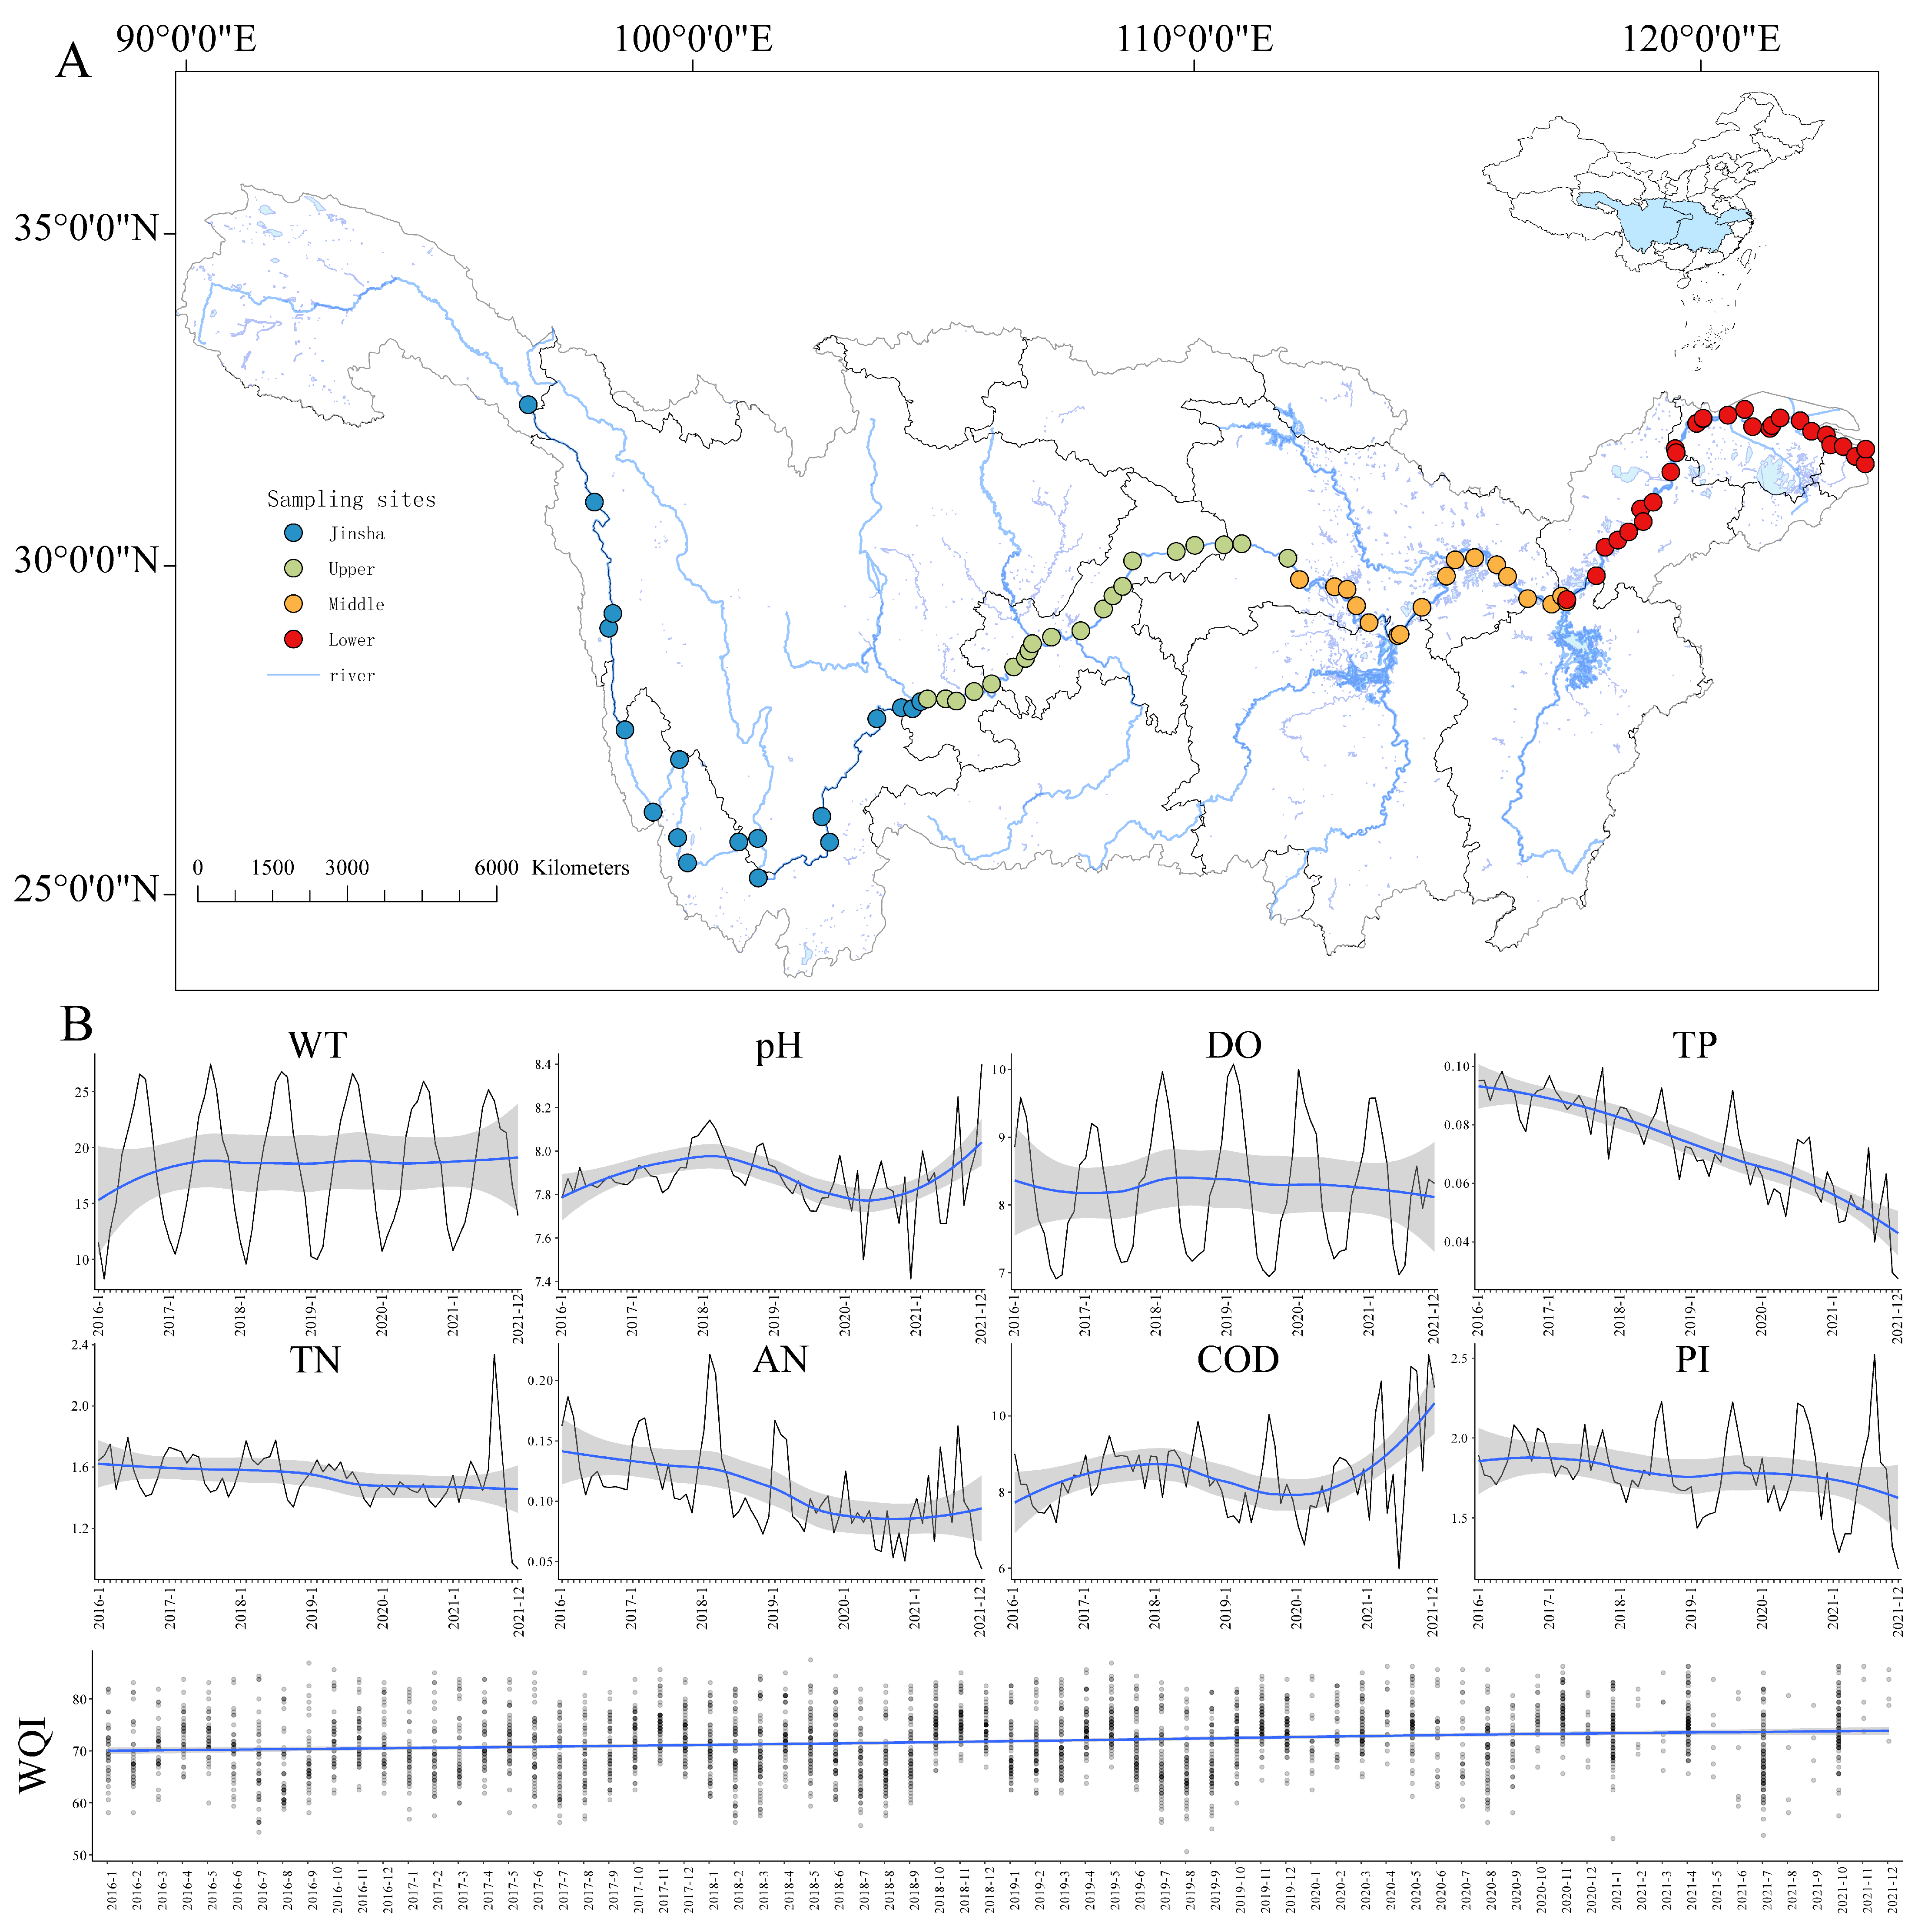
In this study, monthly water quality data from 83 monitoring sites in the main stream of the Yangtze River from January 2016 to December 2021 were collected (Figure 1A), including 18 sites in the Jinsha River Basin (Jinsha), 20 sites in the upper reach (upper), 17 sites in the middle reach (middle), and 28 sites in the lower reach (lower). The water quality parameters measured included water temperature (WT), pH, dissolved oxygen (DO), total phosphorus (TP), total nitrogen (TN), ammonia nitrogen (AN), chemical oxygen demand (COD), and the permanganate index (PI). All the parameters were determined according to the Water and Wastewater Monitoring and Analysis Standard Methods [14].
Figure 1.
Spatial distribution of water-quality monitoring sites in the Yangtze River mainstream and temporal trends of water-quality indicators. (A) Spatial distribution of water-quality monitoring sites along the Yangtze River mainstream. Blue dots denote sampling sites in the Jinsha River reach; green dots represent sites in the upper Yangtze reach; orange dots indicate sites in the middle Yangtze reach; red dots stand for sites in the lower Yangtze reach. The base map includes river systems and administrative boundaries, and the small inset map in the upper-right corner shows the geographic location of the study area within China. (B) Temporal variations in water-quality indicators and water quality index for the Yangtze River mainstream from January 2016 to December 2021. Monthly mean values of each indicator were calculated using datasets from all mainstream monitoring sites. A generalized additive model was applied to fit the temporal trends of water temperature (WT), pH, dissolved oxygen (DO), total phosphorus (TP), total nitrogen (TN), ammonia nitrogen (AN), chemical oxygen demand (COD), pollution index (PI), and WQI. The blue lines represent model-fitted trends; the gray shaded areas indicate 95% confidence intervals; scattered points correspond to the actual monthly observational data.
In the 2021 biological surveys, a total of 55 sites were sampled for phytoplankton (Table S1) and 44 sites for periphyton (Table S2), of which 39 sites had simultaneous sampling for both groups with corresponding water quality data (Figure S1). Phytoplankton samples were collected at all 55 mainstream sites, providing continuous spatial coverage from the headwaters to the estuary; however, at a few sites with high turbidity, sample collection was particularly difficult, and in some cases no phytoplankton samples were eventually obtained. Periphyton sampling was limited to 44 sites because this group requires stable natural substrates (e.g., coarse gravel, cobblestones, or submerged tree trunks) for attachment; in certain alluvial reaches where the riverbed consists mainly of silt and fine sand, hard substrates were lacking, preventing representative periphyton collection. Consequently, the two datasets are not fully consistent in terms of site coverage.
For phytoplankton collection, 1.5 L of surface water was sampled at each site via an organic glass water sampler, fixed with 1.5% Lugol’s solution, and transported to the laboratory. After settling and concentration, the samples were adjusted to a final volume of 30 mL. For periphyton sampling, sampling areas were selected near the low-tide line or the 0.3 m isobath along the riverbank. At each site, six different substrates (coarse gravel, cobblestones, large bedrock, tree trunks/logs, aquatic macrophytes/moss, and sand/silt/clay) were randomly collected. Using knives, tweezers, toothbrushes and other tools, periphyton within a 10 cm × 10 cm area was scraped from the surface of each substrate into a sample bottle. Tools were rinsed with distilled water, and the rinsate was collected together with the sample. Given the uniform scraping area (10 cm × 10 cm) applied to all substrates, algal density was normalized by area (cells/cm2), independent of substrate type or mass. Samples were fixed with 1.5% Lugol’s solution and transported to the laboratory, then concentrated, settled, and adjusted to a final volume of 30 mL. For both groups, 0.1 mL of homogenized, concentrated sample was transferred to a plankton counting chamber and observed under an Olympus BX53 microscope (Olympus Corporation, Tokyo, Japan) at 10 × 40 magnification. Cell counts were performed under the microscope. Taxonomic identification was conducted to the lowest feasible taxonomic level (species or genus) via established taxonomic references [15,16,17], followed by quantitative analysis of the algal communities.
2.3. Data Analysis
This study utilizes the Mann–Kendall trend test with the “pymannkendall” v1.4.3 library in Python v 3.14.6 to analyze the changing trends of the time series of the average values of various water quality indicators at all the sampling sites. The “stl” function from the R package “stats” v4.4.2 was used to decompose the time series of the water quality indicators. The rank sum test, implemented through the “ggsignif” package v0.6.4 in R, was employed to compare differences in water quality concentrations, diversity indices, and densities. For the changes in water quality factor concentrations and phytoplankton and periphyton densities, the “stat_smooth” function in “ggplot2” v3.5.1 of R was used to perform regression fitting via the generalized additive model (GAM). Mantel test analysis between environmental factors and phytoplankton/periphyton was conducted via “ggcor” v0.9.8.1 in R. The hierarchical partitioning method in the R package “rdacca.hp” v1.1.1 was applied to quantitatively evaluate the contributions of multiple water quality factors to density changes in phytoplankton and periphyton. In accordance with the relevant literature [18], we calculated the water quality index (WQI) using a weighted summation approach. The indicators involved in the calculation included WT, pH, DO, TP, TN, AN, and PI. For each indicator, the measured value was first converted into a sub-index (Ci, on a scale of 0–100) using a piecewise scoring function, and then different weighting coefficients were assigned: WT and pH received a weight of 1, DO received 4, TN received 2, AN received 3, TP received 1, and PI received 3. The final WQI value was calculated as the sum of the weighted scores of all indicators divided by the total weight (total weight = 15), according to the formula: WQI = Σ (Ci × Wi)/ΣWi.
To identify the dominant species in the communities, we calculated the dominance index (Y) for each species. The dominance index was calculated using the formula: Y = (ni/N) × fi, where ni is the total individual count (or total density sum) of a given species across all sampling sites, N is the total individual count (or total density sum) of all species across all sites, and fi is the frequency of occurrence of that species (i.e., the proportion of sites where the species was present out of the total number of sites). A species with Y ≥ 0.02 was considered a dominant species. For both phytoplankton and periphyton, the dominance index was computed for all species using the above formula, and the values were sorted in descending order. The three species with the highest dominance indices at each site were then selected as the representative dominant species for that site.
The random forest regression model from the R package “randomForest” v4.7.1.1 was employed for the ecological assessment. Specifically, the Shannon–Wiener index, Pielou index, Margalef index, and density were used to evaluate phytoplankton and periphyton. For a comprehensive aquatic ecological assessment, TN, TP, AN, PI, and WQI, along with the Shannon–Wiener index, Pielou index, Margalef index, and density of phytoplankton and periphyton, were utilized. The values of the Shannon–Wiener index, Pielou index, Margalef index, and WQI were classified into five grades with reference to the relevant literature [11,18,19]. The algal density was categorized into five grades according to the Technical Specifications for Remote Sensing and Ground Monitoring Evaluation of Algal Blooms [20]. TN, TP, AN, and PI were divided into five grades according to the Environmental Quality Standards for Surface Water [21]. For each assessment criterion, 1000 dataset groups were randomly generated, resulting in a total of 5000 dataset groups for the five criteria. To develop the random forest model, 3500 dataset groups were randomly selected as training samples, and 1500 groups were chosen as test samples. The results of this study were then input into the model to determine the aquatic ecological health status of each region.
3. Results
3.1. Temporospatial Variation Trends of Water Quality Indicators
Using the average water quality values from 83 monitoring sites, the GAM was applied to fit the data from January 2016 to December 2021, revealing the temporal variation trends of various water quality indicators (Figure 1B). WT, pH, and DO exhibited distinct seasonal fluctuation patterns (Figure S2). However, their mean time series showed no significant change trends (MK trend test, p > 0.05). The TP demonstrated a significant downward trend over time (MK trend test for the mean, p < 0.05; Figure S2). Both TN and AN displayed more pronounced fluctuations, and the fitted curves exhibited a significant long-term decreasing trend (MK trend test for the mean, p < 0.05; Figure S2). The COD has shown an increasing trend since 2020, with the GAM-fitted curve gradually increasing, but the MK trend test for its mean time series revealed no significant change (p > 0.05). The PI remained relatively stable with some fluctuations, and its mean time series showed a significant decrease (p < 0.05), as determined by the MK trend test. The WQI was calculated on the basis of the above indicators, and its GAM-fitted curve exhibited an increasing trend, which was consistent with the findings from the time series decomposition (Figure S3). The MK trend test further confirmed a significant upward trend in the mean time series (p < 0.05), highlighting an improvement in the water quality (mainly TP, TN, AN and PI) of the Yangtze River mainstream.
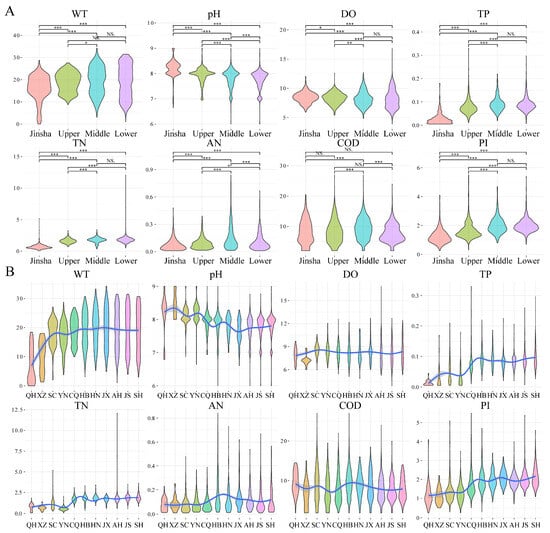
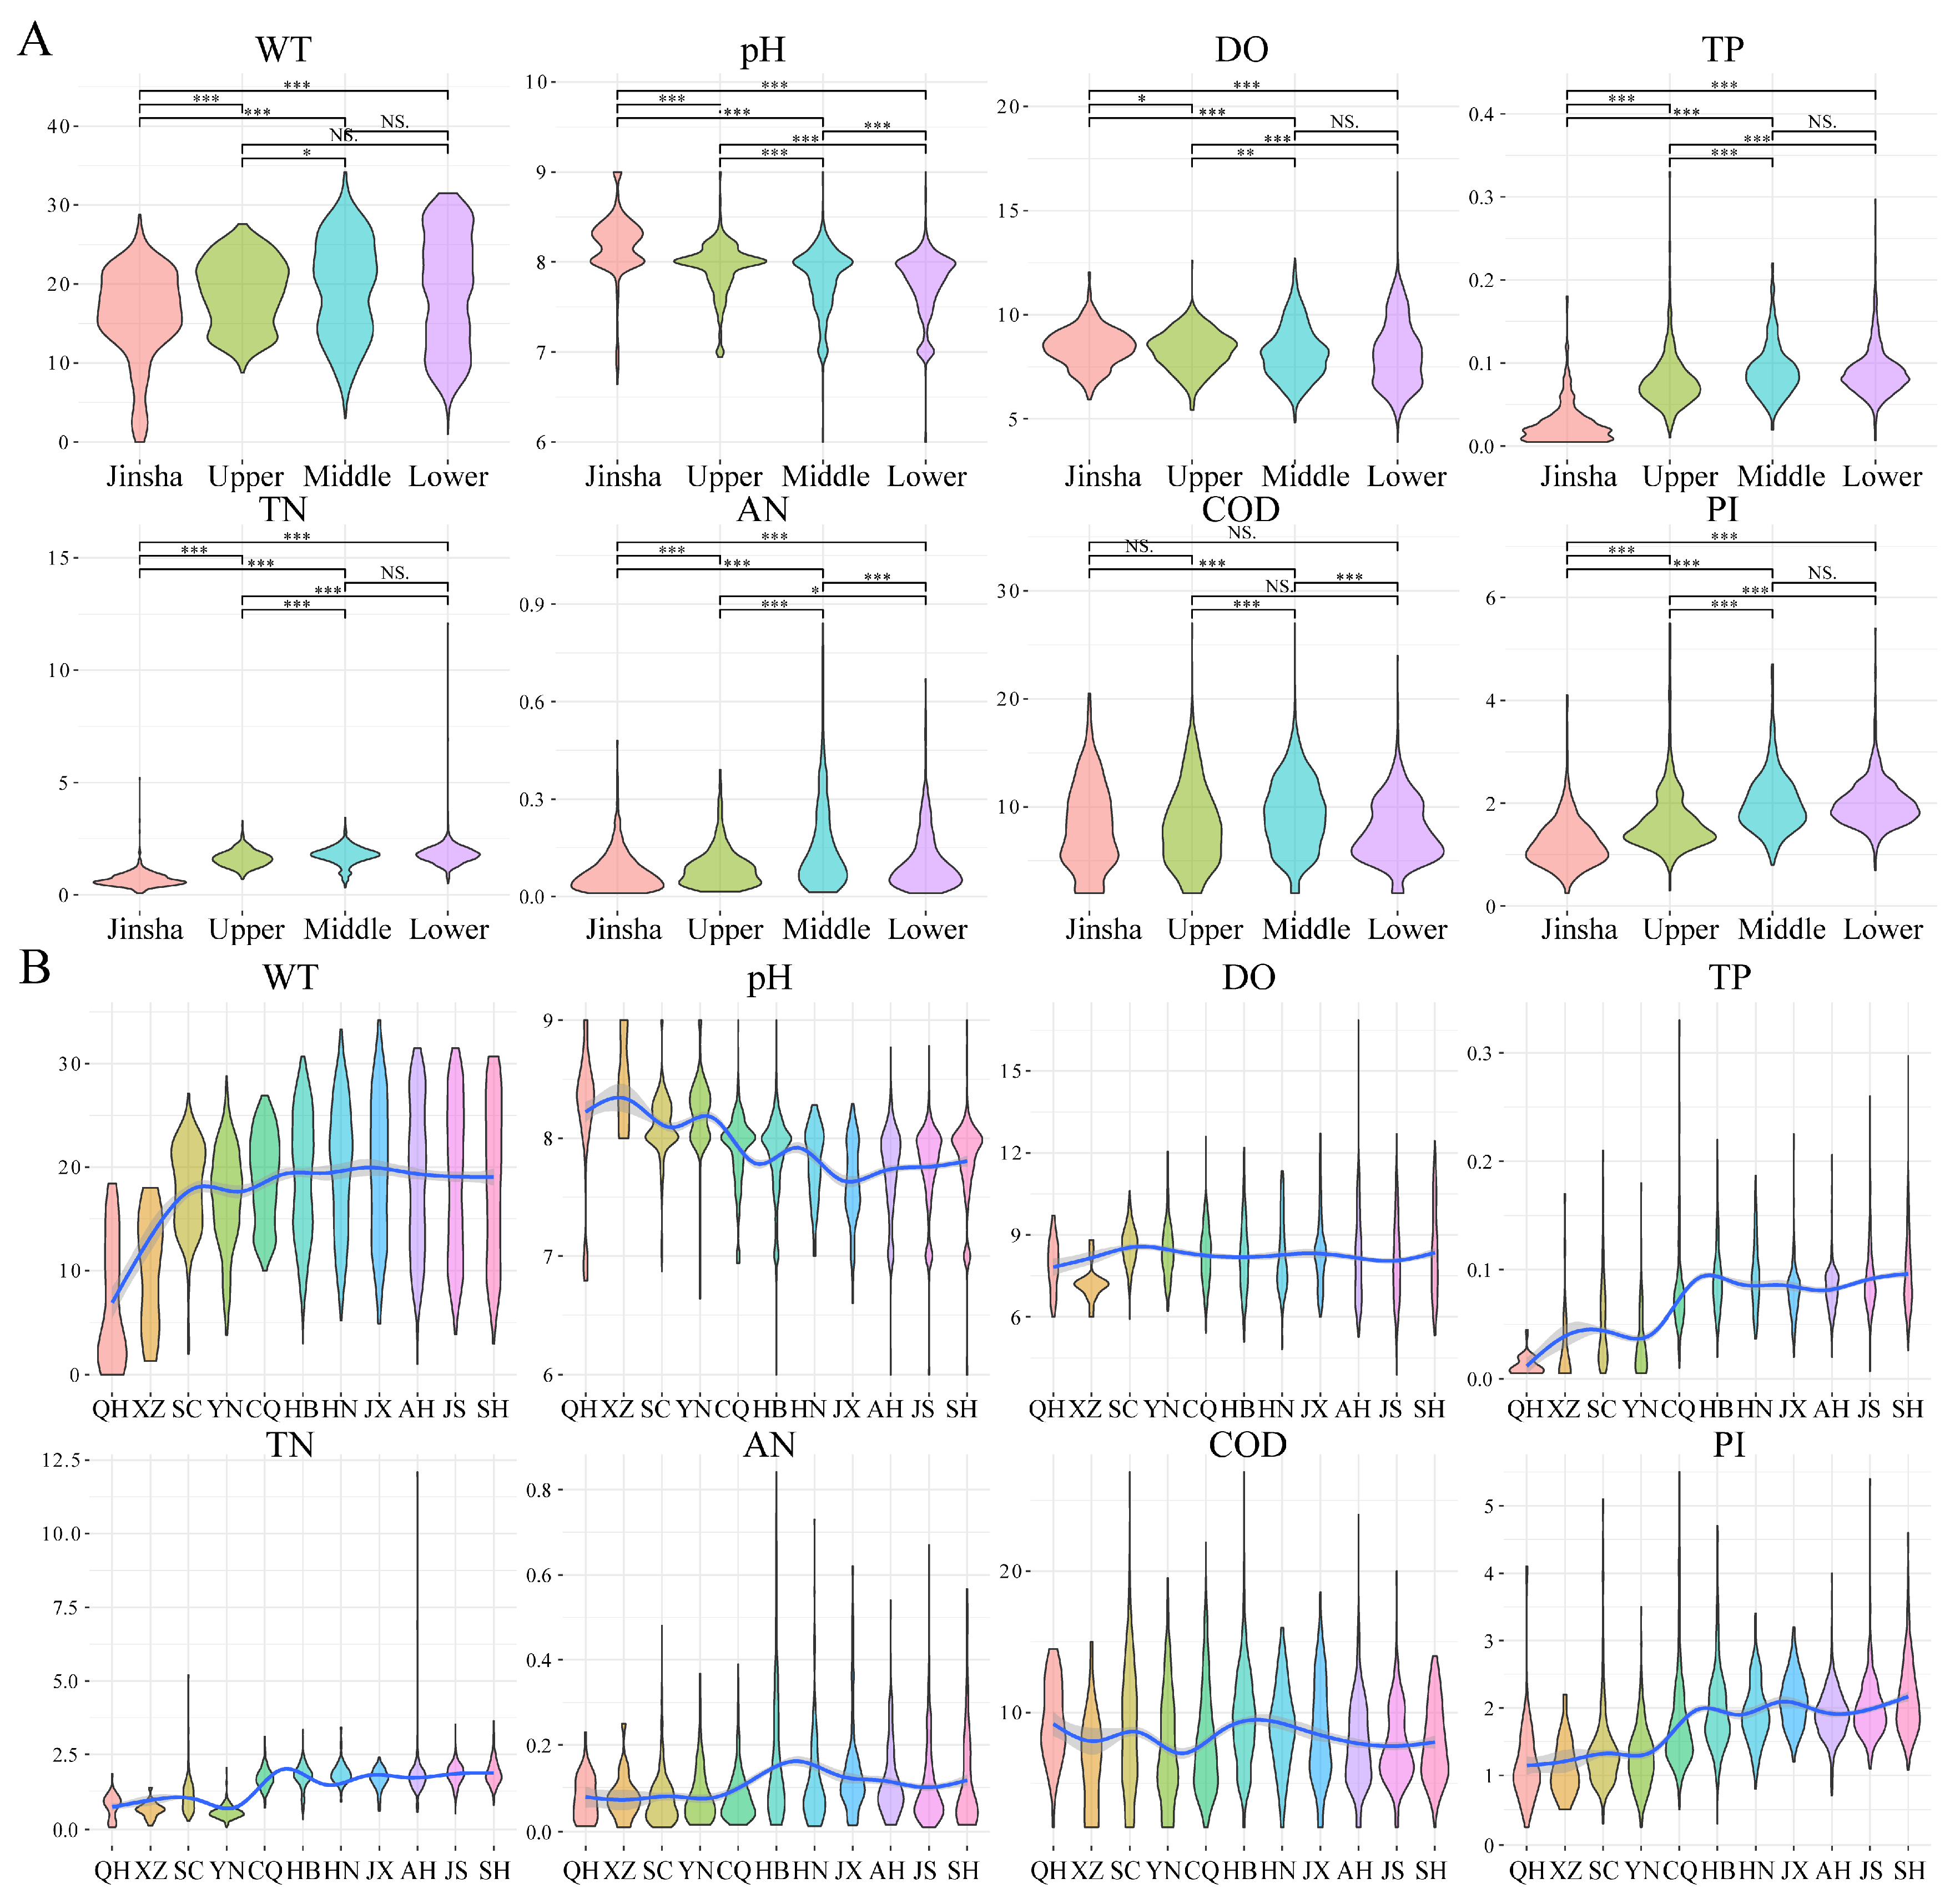
Using the rank-sum test, we analyzed the spatial variation trends of water quality indicators across different regions (Jinsha, upper, middle, and lower) of the Yangtze River mainstream (Figure 2A). The WT in Jinsha and Upper China was significantly lower than that in Middle China and Lower China, reflecting the latitudinal thermal gradient along the river. The pH values gradually decreased from Jinsha to lower altitudes, indicating a shift in water chemistry from alkaline headwater conditions to more circumneutral environments downstream. The DO content was highest in Jinsha and gradually decreased from the source to the estuary, indicating a general decreasing trend from the headwaters to the estuary at the regional level and reflecting progressively increasing oxygen consumption along the river; however, provincial-scale variations were also evident (Figure 2B), with relatively lower values observed in XZ and higher values in AH. The TP in Jinsha was notably lower than that in the other regions, highlighting the progressive phosphorus enrichment associated with anthropogenic inputs downstream. Both the TN and AN in Jinsha Reservoir were significantly lower than those in the middle and lower reaches, underscoring the substantial nitrogen loading from urban and agricultural sources in the downstream regions. The COD in the middle region was significantly higher than that in the other regions, suggesting elevated organic pollution levels in this section. The PI in Jinsha was distinctly lower than that in the upper, middle, and lower reaches, indicating lower levels of oxidizable organic matter in the headwater region. On the basis of the results of the rank-sum test for the WQI in each region across different years (Figure S4), the spatial differentiation characteristics of the WQI remained stable from 2016–2021. The WQI in the Jinsha region was significantly higher than that in the upper, middle, and lower regions (p < 0.05) each year, reflecting that the water quality in Jinsha was relatively better. The WQI in the lower region was relatively low, indicating relatively poor water quality conditions. In summary, the water quality of different regions in the Yangtze River mainstream showed obvious spatial variation trends each year, with Jinsha having better overall water quality and the lower region being relatively poorer.
Figure 2.
Violin plots of spatial differences in water quality indicators. (A) Water quality monitoring sites were grouped into Jinsha River upstream, midstream, and downstream sites, and the concentration differences in each water quality indicator among the different groups were compared via rank-sum tests. (B) Sites were grouped by province and sorted from left to right according to the order from the source to the estuary of the Yangtze River, and generalized additive models were used for regression fitting. The x-axis represents the abbreviations of provinces traversed by the Yangtze River mainstream from upstream to downstream, namely Qinghai (QH), Xizang (XZ), Sichuan (SC), Yunnan (YN), Chongqing (CQ), Hubei (HB), Hunan (HN), Jiangxi (JX), Anhui (AH), Jiangsu (JS), and Shanghai (SH). * p < 0.05, ** p < 0.01, *** p < 0.001, NS. not significant.
For the spatial variation trends of the water quality indicators across different provinces (sorted from lower to higher longitude, Figure 2B), distinct gradient-change patterns were observed. The WT values generally increased along the downstream direction, reflecting the latitudinal climate gradient rather than longitude as a causal factor. The pH showed a fluctuating trend, being relatively high at QH and then changing, suggesting complex influences from regional environmental factors. DO and COD exhibited fluctuating trends, without a uniform increase or decrease but with region-specific variations. The TP, TN, AN, and PI showed obvious upward trends from lower to higher longitudes, indicating that the overall water quality conditions might deteriorate in regions with higher longitudes. Analysis of the WQI in provinces from lower to higher longitudes (Figure S5) revealed that the WQI in the QH, XZ, SC, and YN regions was relatively high, whereas starting from the HB in the middle reaches of the Yangtze River, the overall WQI presented a downward trend, implying potential accumulation of nutrients or input changes in downstream areas.
3.2. Spatial Variation in Phytoplankton in the Yangtze River Mainstream
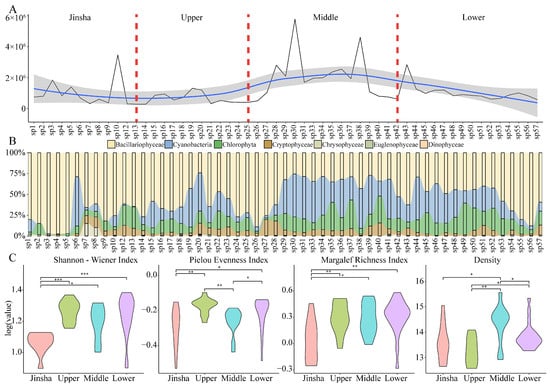
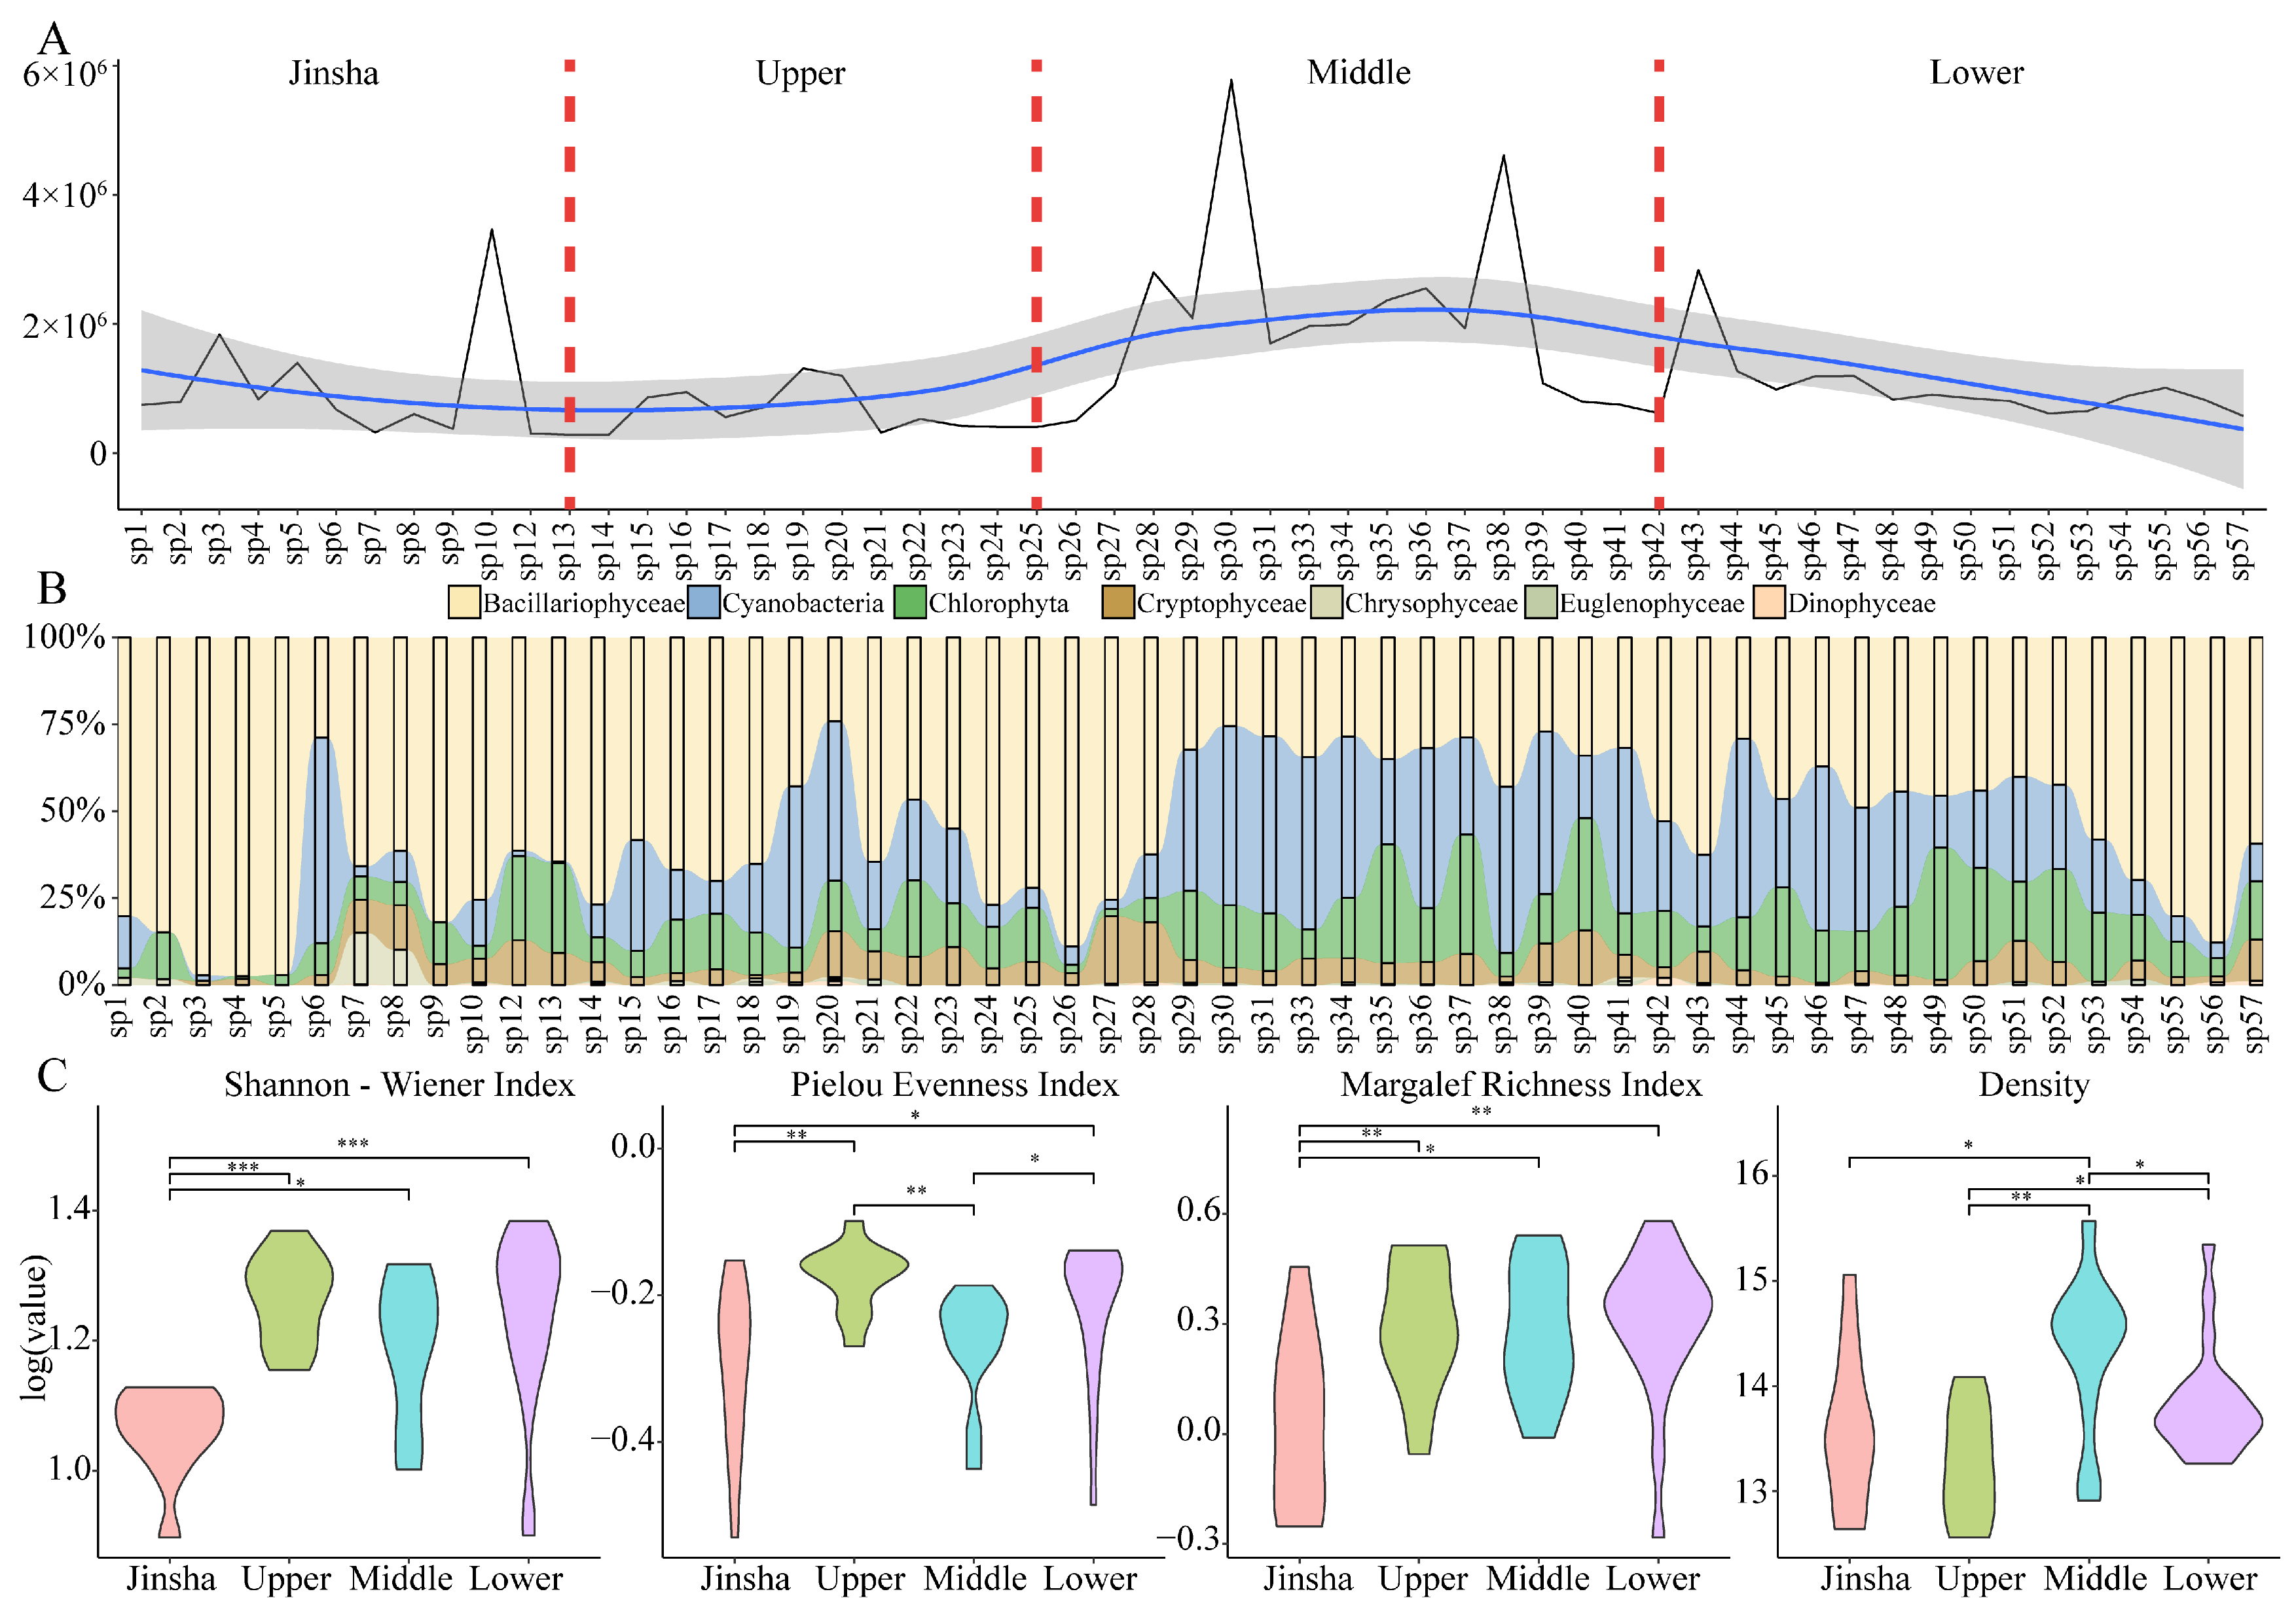
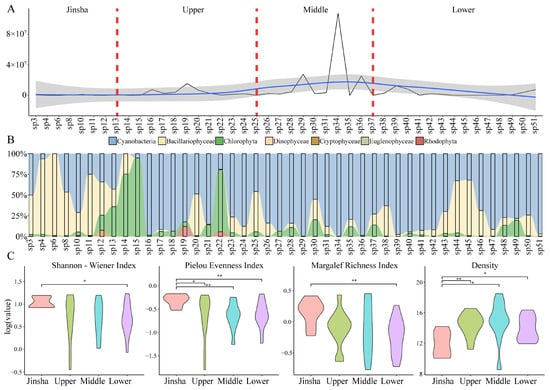
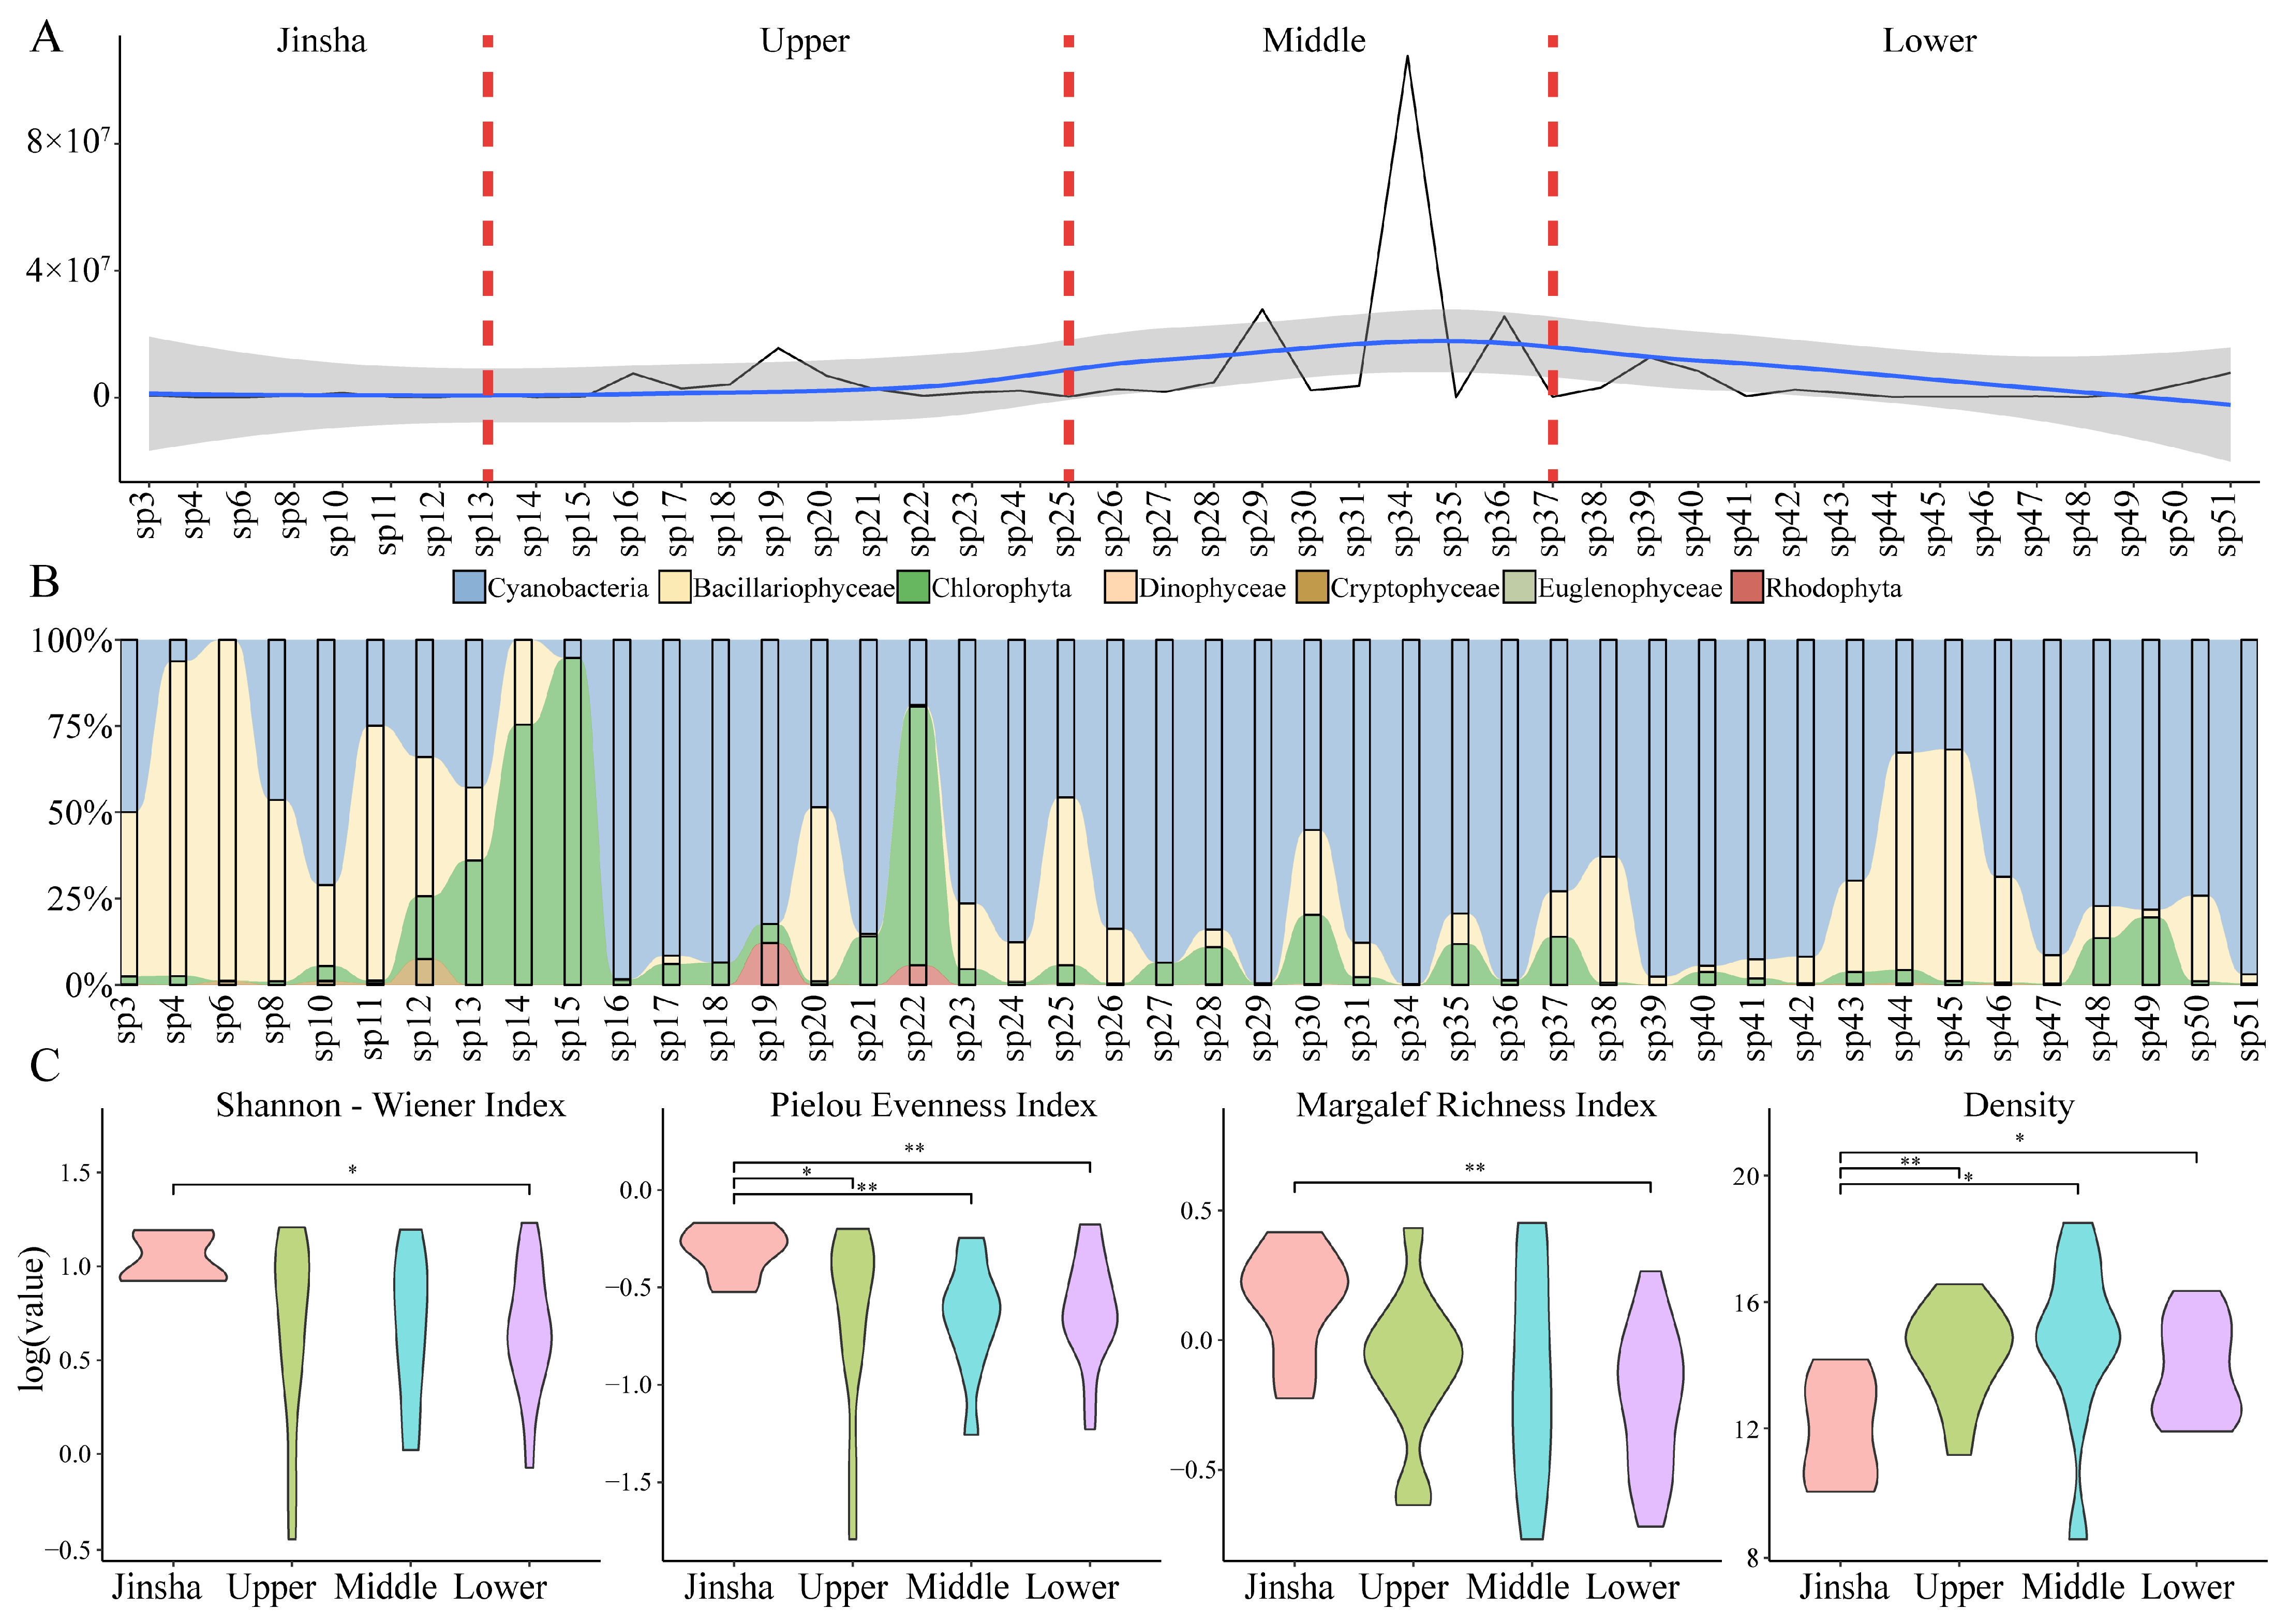
Analysis of phytoplankton density and community composition at distinct sites along the Yangtze River mainstream revealed pronounced spatial variation trends. Phytoplankton density exhibited a distinct gradient alteration from the headwaters (Qinghai) to the estuary (Shanghai) along the downstream direction (Figure 3A). The mean phytoplankton density was 1.14 × 10⁷ cells/L in the Jinsha region, 7.84 × 10⁶ cells/L in the upper region, 2.08 × 10⁷ cells/L in the middle region, and 2.76 × 10⁷ cells/L in the lower region, indicating a progressive increase from the upper to lower reaches. With respect to the phytoplankton composition (Figure 3B), Bacillariophyceae dominated at most sites, particularly at certain upper- and middle-reach sites. At sites characterized by higher phytoplankton density in the middle and lower reaches, the proportions of cyanobacteria and Chlorophyta increased remarkably, reflecting their superior adaptability to mid-lower-reach environments. Chrysophyceae, Euglenophyceae, and Dinophyceae were present in relatively minor and fluctuating proportions at each site. Meanwhile, the species with the highest dominance were mainly Cyclotella sp., Synedra sp., and Navicula sp. The dominance indices of these three genera all exceeded 0.02, qualifying them as widespread dominant taxa at the whole-mainstream scale. This result indicates that, from the overall basin perspective, diatoms remain the dominant group at the genus level. Thus, although cyanobacteria and chlorophytes contribute substantially to the elevated densities observed in the middle and lower reaches, the consistent dominance of diatoms at the genus level suggests that the Yangtze mainstream has not yet shifted to a cyanobacteria-dominated steady state, reflecting its character as a large, flowing water body.
Figure 3.
Phytoplankton community composition and diversity. (A) Phytoplankton monitoring sites were sorted from left to right according to the order from the source to the estuary of the Yangtze River to show their density, with regression fitting via generalized additive models. (B) Changes in the phytoplankton community composition from the source to the estuary of the Yangtze River. (C) Rank-sum tests were used to compare the differences in the diversity and density of phytoplankton among the Jinsha River, upstream, midstream, and downstream regions. * p < 0.05, ** p < 0.01, *** p < 0.001.
On the basis of the rank-sum test, conspicuous disparities in the phytoplankton diversity indices and density were discerned across regions (Figure 3C). The Shannon–Wiener index revealed reduced species richness and evenness of phytoplankton in the Jinsha River relative to other regions; the Pielou evenness index indicated a more uniform phytoplankton–species distribution in the upper region; and the Margalef richness index revealed the highest species richness in the lower region. In terms of phytoplankton density, the density in the middle and lower reaches exceeded that in the upper region and Jinsha. Phytoplankton along the Yangtze River mainstream manifested distinct spatial heterogeneity, mirroring the differential influences of regional ecological settings on phytoplankton community structure and abundance.
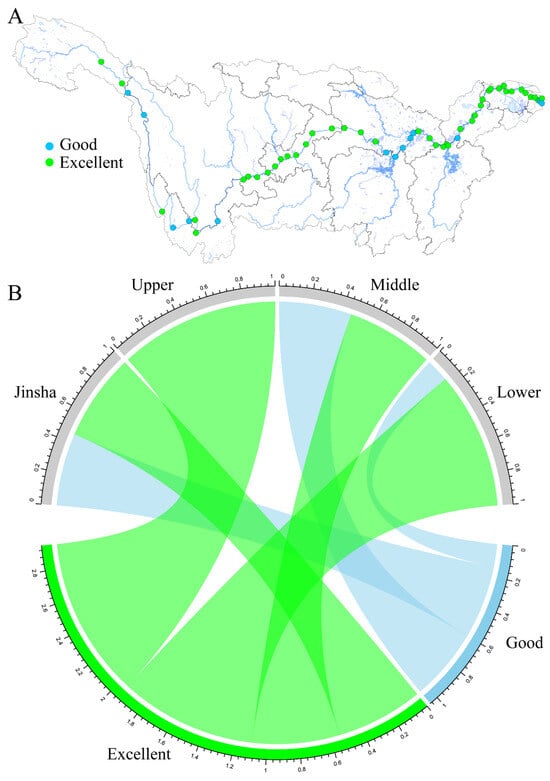
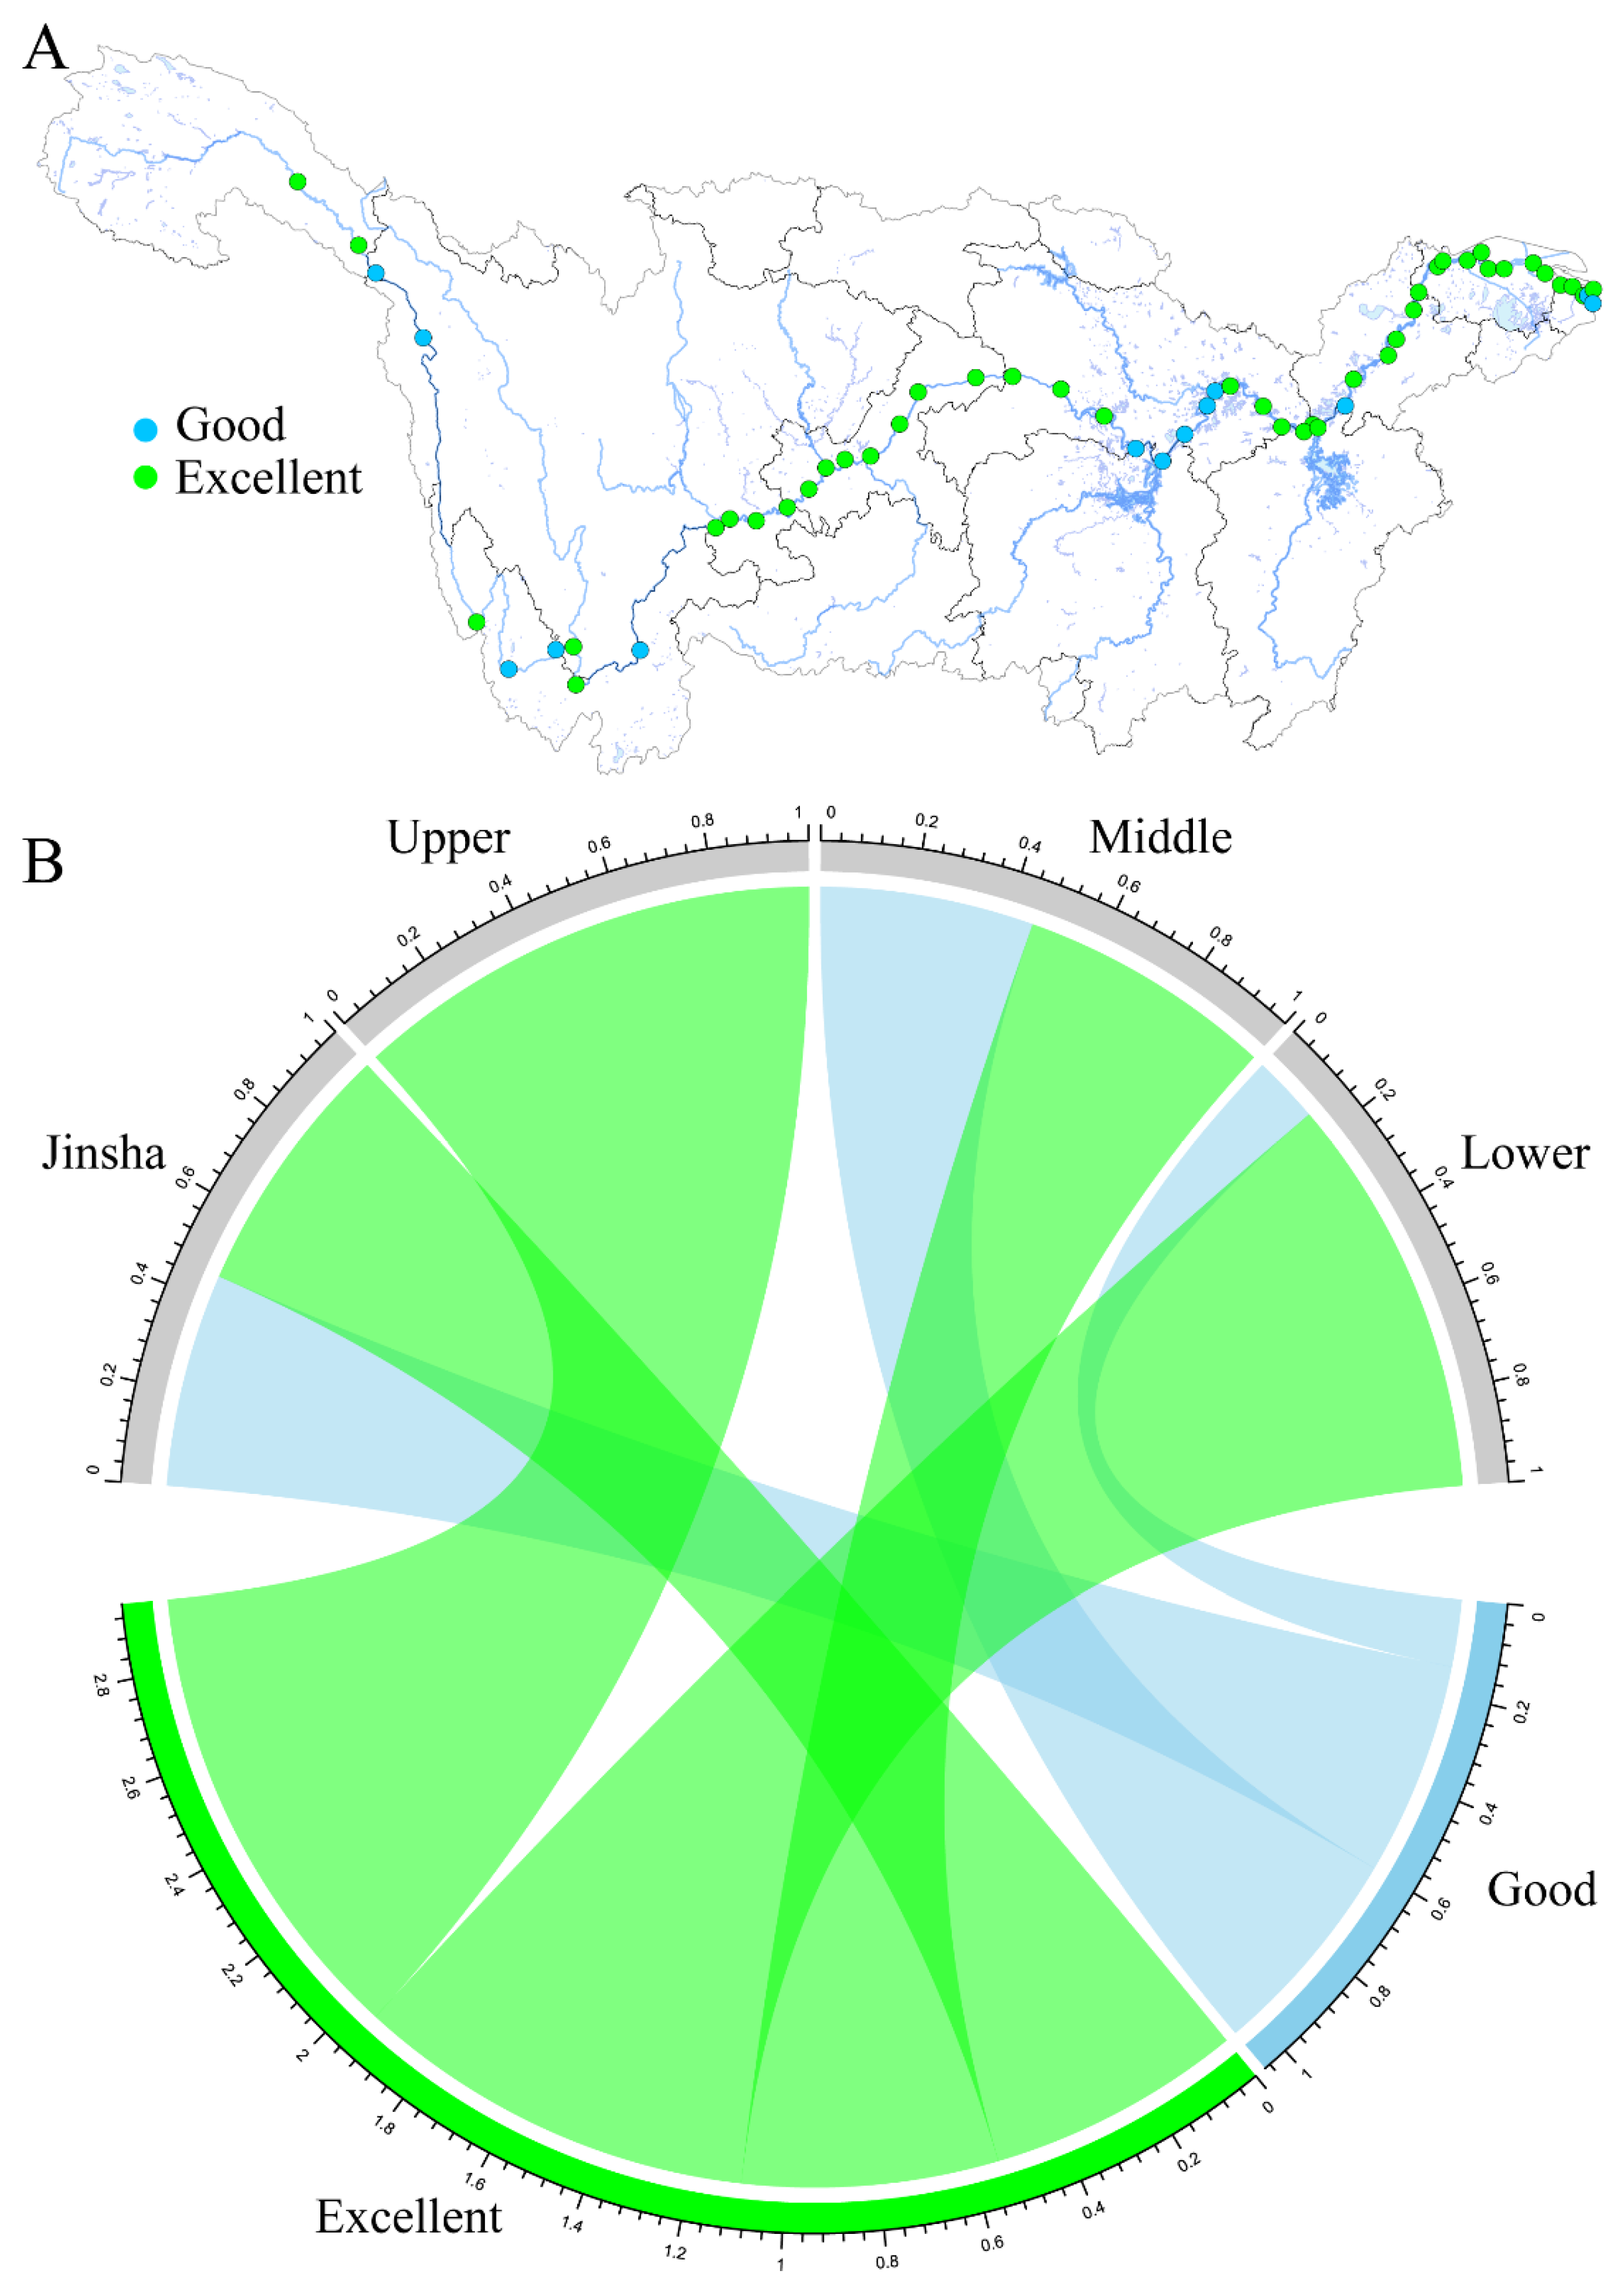
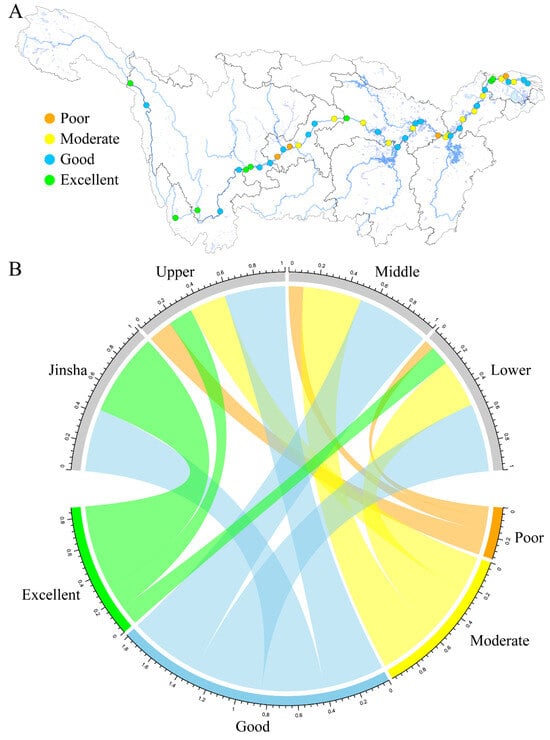
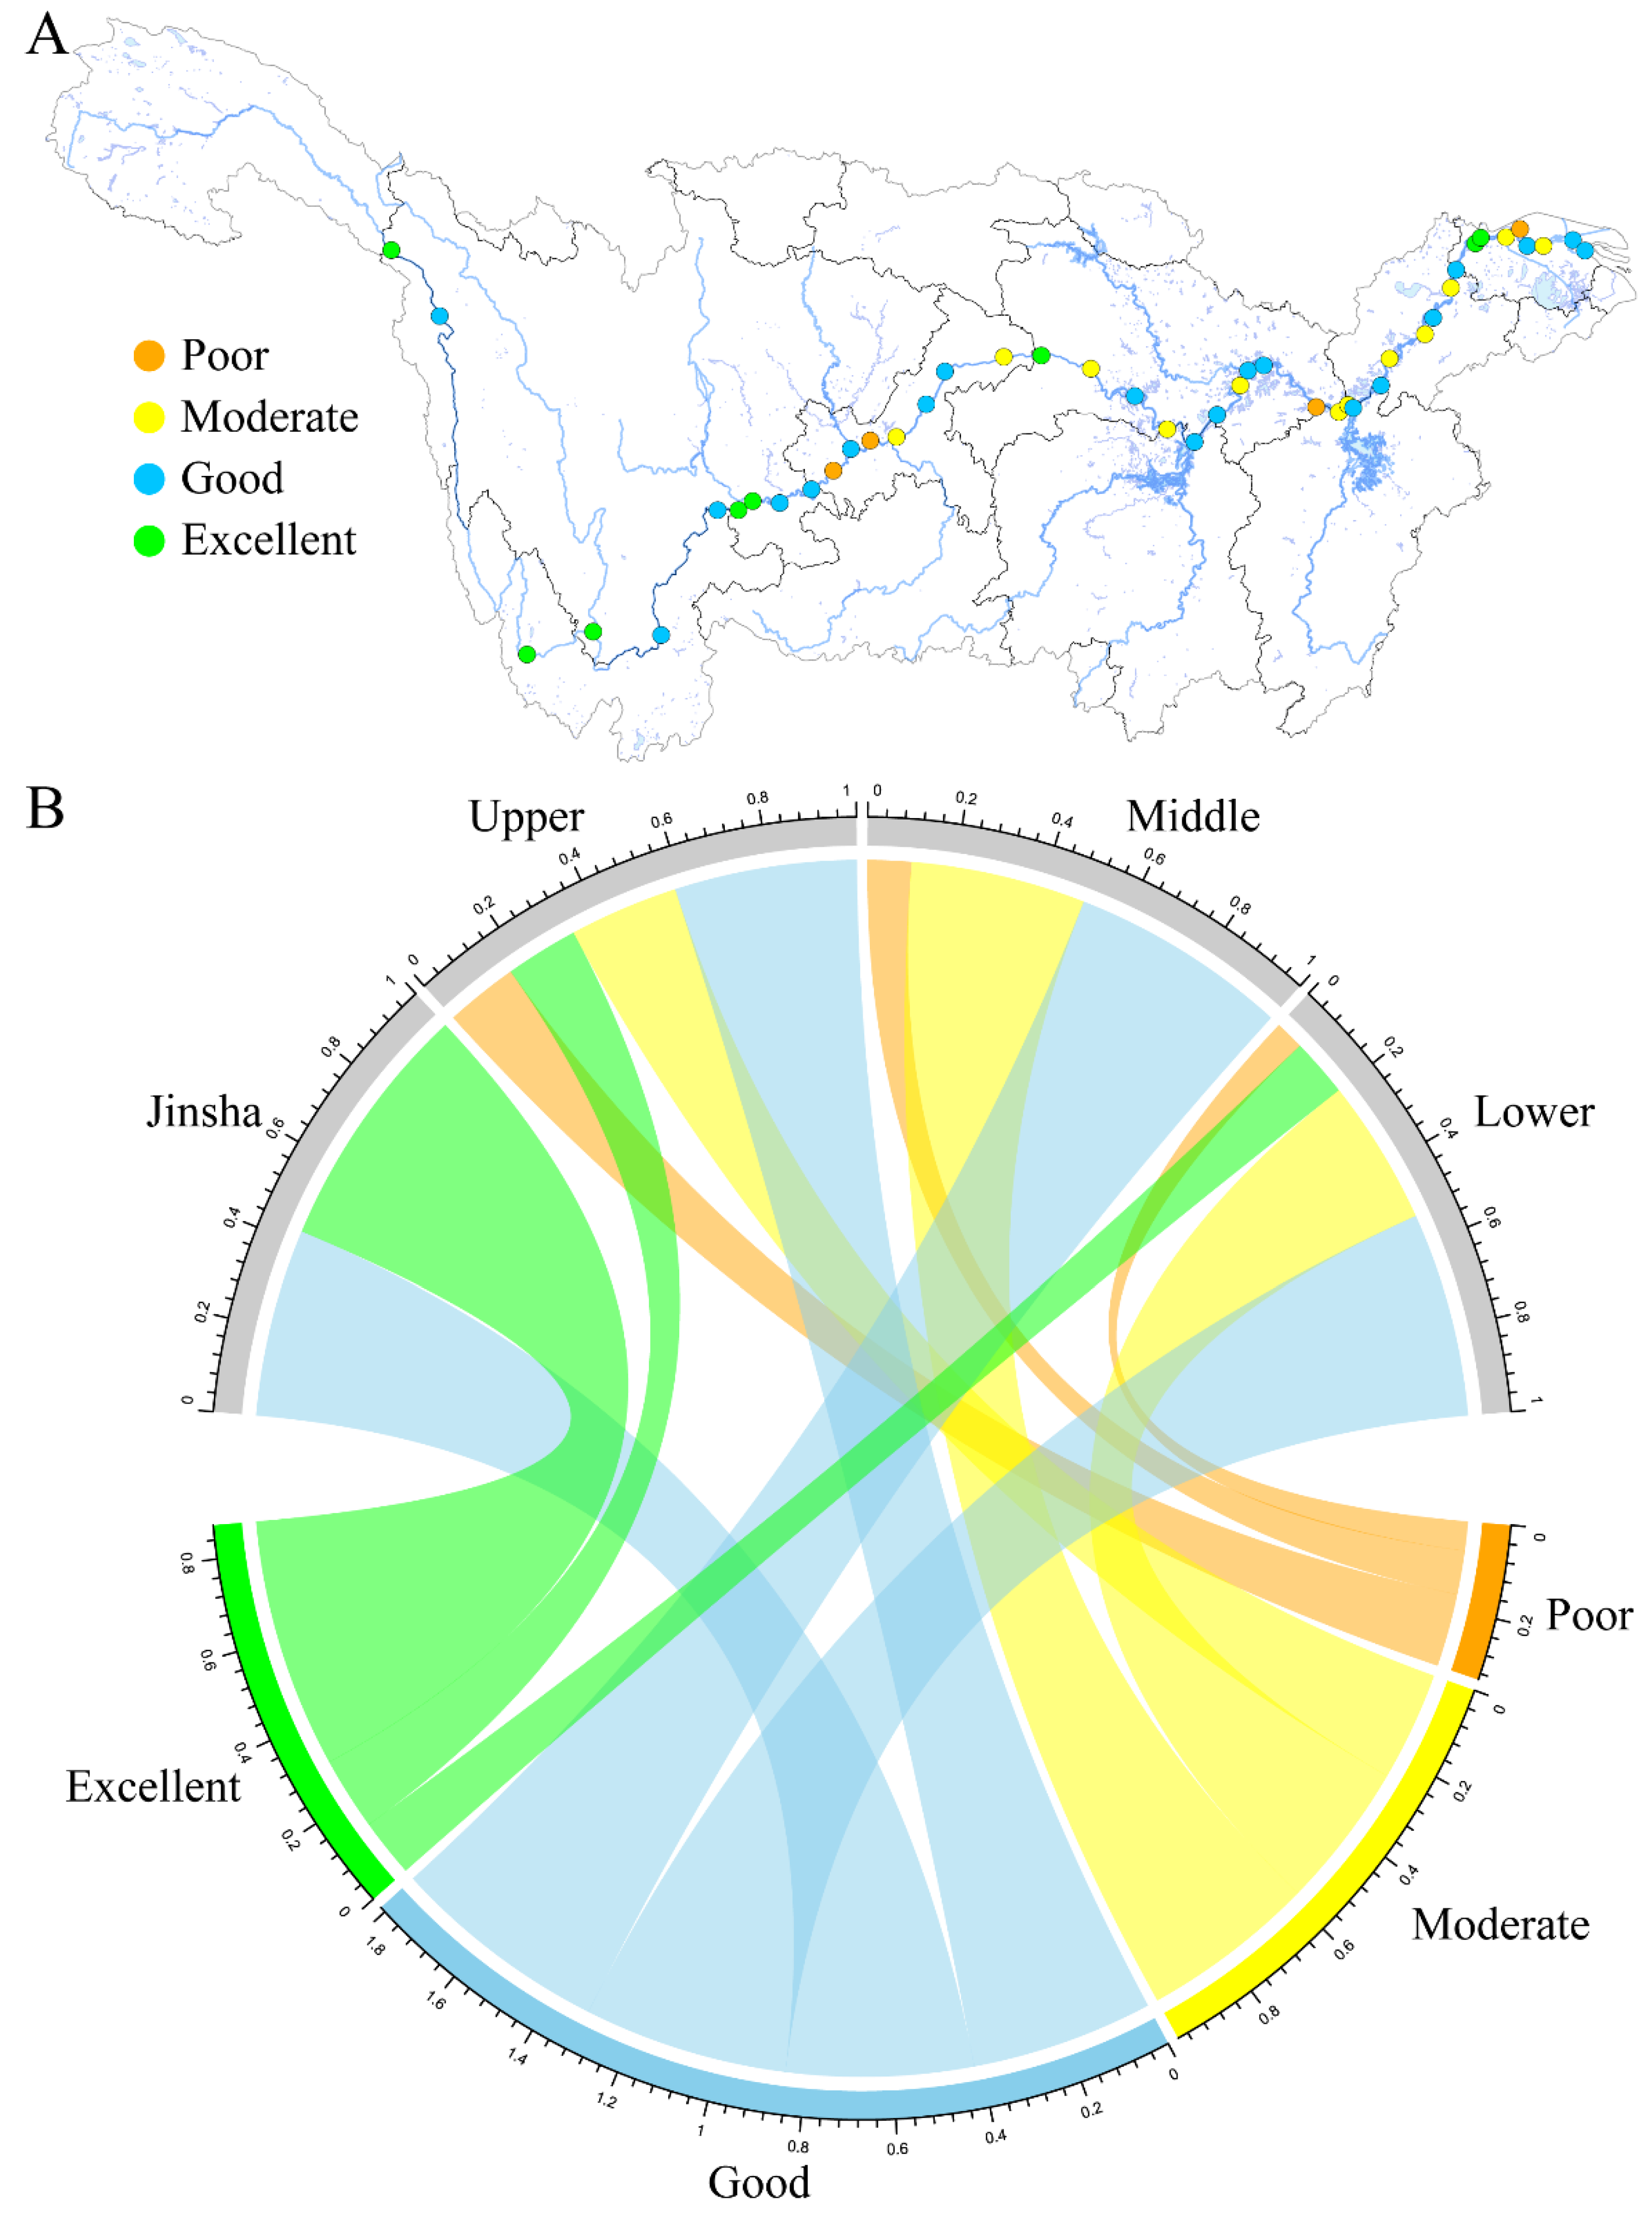
Using the random forest model, phytoplankton were evaluated on the basis of the Shannon–Wiener index, Pielou index, Margalef index, and density. This spatial visualization reveals that “excellent” monitoring sites are extensively distributed along the Yangtze River mainstream (Figure 4A). Among the 55 monitoring sites, 42 (accounting for approximately 76.4%) were rated “excellent”, and 13 (approximately 23.6%) were rated “good” (Figure 4B). The high-level evaluations indicate that the phytoplankton community structure in the Yangtze River mainstream is complex and stable. The environmental conditions at these monitoring sites favor phytoplankton growth, free from abnormal community structures or density imbalances induced by pollution or environmental stress, thereby exerting a positive impact on the stability and functional maintenance of the entire river ecosystem.
Figure 4.
Results of the ecological assessment of phytoplankton. (A) Ecological assessment results of phytoplankton at each site along the main stream of the Yangtze River. (B) Circular chord diagrams of the proportion of assessment results in different regions, with the width of each region’s band proportional to its proportion in each assessment result.
3.3. Spatial Variation in Periphyton in the Yangtze River Mainstream
Analysis of periphyton density and community composition at different sites along the Yangtze River mainstream revealed pronounced spatial variation trends. From the headwaters (Qinghai) to the estuary (Shanghai), periphyton density exhibited distinct regional disparities along the downstream gradient (Figure 5A). The average density in the Jinsha region was 2.83 × 10⁶ cells/cm2, with 4.50 × 10⁷ cells/cm2 in the upper region, sharply increasing to 1.76 × 10⁸ cells/cm2 in the middle region, and decreasing to 4.29 × 10⁷ cells/cm2 in the lower region, demonstrating that the density in the middle region was far greater than that in the other regions. In terms of community composition (Figure 5B), the proportions of different phyla underwent dynamic changes over the course of the study. Cyanobacteria and Bacillariophyceae were the dominant groups. In particular, at some middle-reach sites, the proportion of cyanobacteria increased significantly, reflecting its adaptability to the middle-reach environment. Chlorophyta also had a relatively high proportion at some sites, while the proportions of Dinophyceae, Chrysophyceae, Euglenophyceae, and Rhodophyta were relatively small and fluctuated obviously. The dominant species of periphyton along the entire Yangtze mainstream were mainly Lyngbya sp., Oscillatoria sp., and Microcystis sp. All three belong to the cyanobacteria group. Thus, the middle reach emerges as a hotspot for periphyton proliferation, where the combination of reduced flow velocity, stable substrates, and nutrient accumulation promotes not only high densities but also the predominance of cyanobacteria at both phylum and genus levels, highlighting the ecological significance of this region.
Figure 5.
Periphyton community composition and diversity. (A) Periphyton monitoring sites were sorted from left to right according to the order from the source to the estuary of the Yangtze River to show their density, with regression fitting via generalized additive models. (B) Changes in the periphyton community composition from the source to the estuary of the Yangtze River. (C) Rank-sum tests were used to compare the differences in the diversity and density of periphyton among the Jinsha River Basin and the upstream, midstream, and downstream regions. * p < 0.05, ** p < 0.01.
The diversity indices and density of periphyton in different regions of the Yangtze River mainstream were analyzed via the rank-sum test (Figure 5C). All of the Shannon–Wiener indices, Pielou evenness indices, and Margalef richness indices revealed that, compared with those in the upper, middle, and lower reaches, the species richness and evenness of periphyton in Jinsha were significantly greater. Conversely, the periphyton diversity index in the lower reach was significantly lower than those in the other regions. In terms of density, the density in the middle reach was significantly greater than that in Jinsha, the upper, and lower reaches, indicating that the quantity of periphyton in the middle reach was much greater than that in the other regions. Overall, there were obvious spatial differences in periphyton diversity and density among the different regions of the Yangtze River mainstream. Jinsha stood out in terms of the diversity indices, while the middle reach had a significant advantage in density.
On the basis of the random forest model, the evaluation of periphyton in the Yangtze River mainstream, which incorporates the Shannon–Wiener index, Pielou index, Margalef index, and density, revealed significant spatial heterogeneity in the ecological conditions across regions (Figure 6A). Among the 44 sites, 18% were rated “excellent”, 45% “good”, 27% “moderate”, and 9% “poor”. Among them, the Jinsha region demonstrated the optimal overall performance, dominated by “excellent” and “good” ratings. The middle and lower reaches were characterized primarily by “good” and “moderate” ratings, with no sites rated “excellent” in the middle reach (Figure 6B). This spatial discrepancy indicates significant differences in the impacts of the ecological environments in different regions of the Yangtze River mainstream on the comprehensive conditions of periphyton.
Figure 6.
Results of the ecological assessment of periphyton. (A) Ecological assessment results of periphyton at each site along the main stream of the Yangtze River. (B) Circular chord diagrams of the proportion of assessment results in different regions, with the width of each region’s band proportional to its proportion in each assessment result.
3.4. Integrated Ecological Assessment of the Yangtze River Mainstream
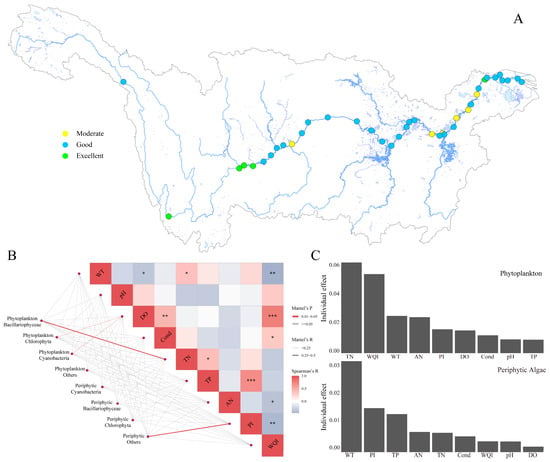
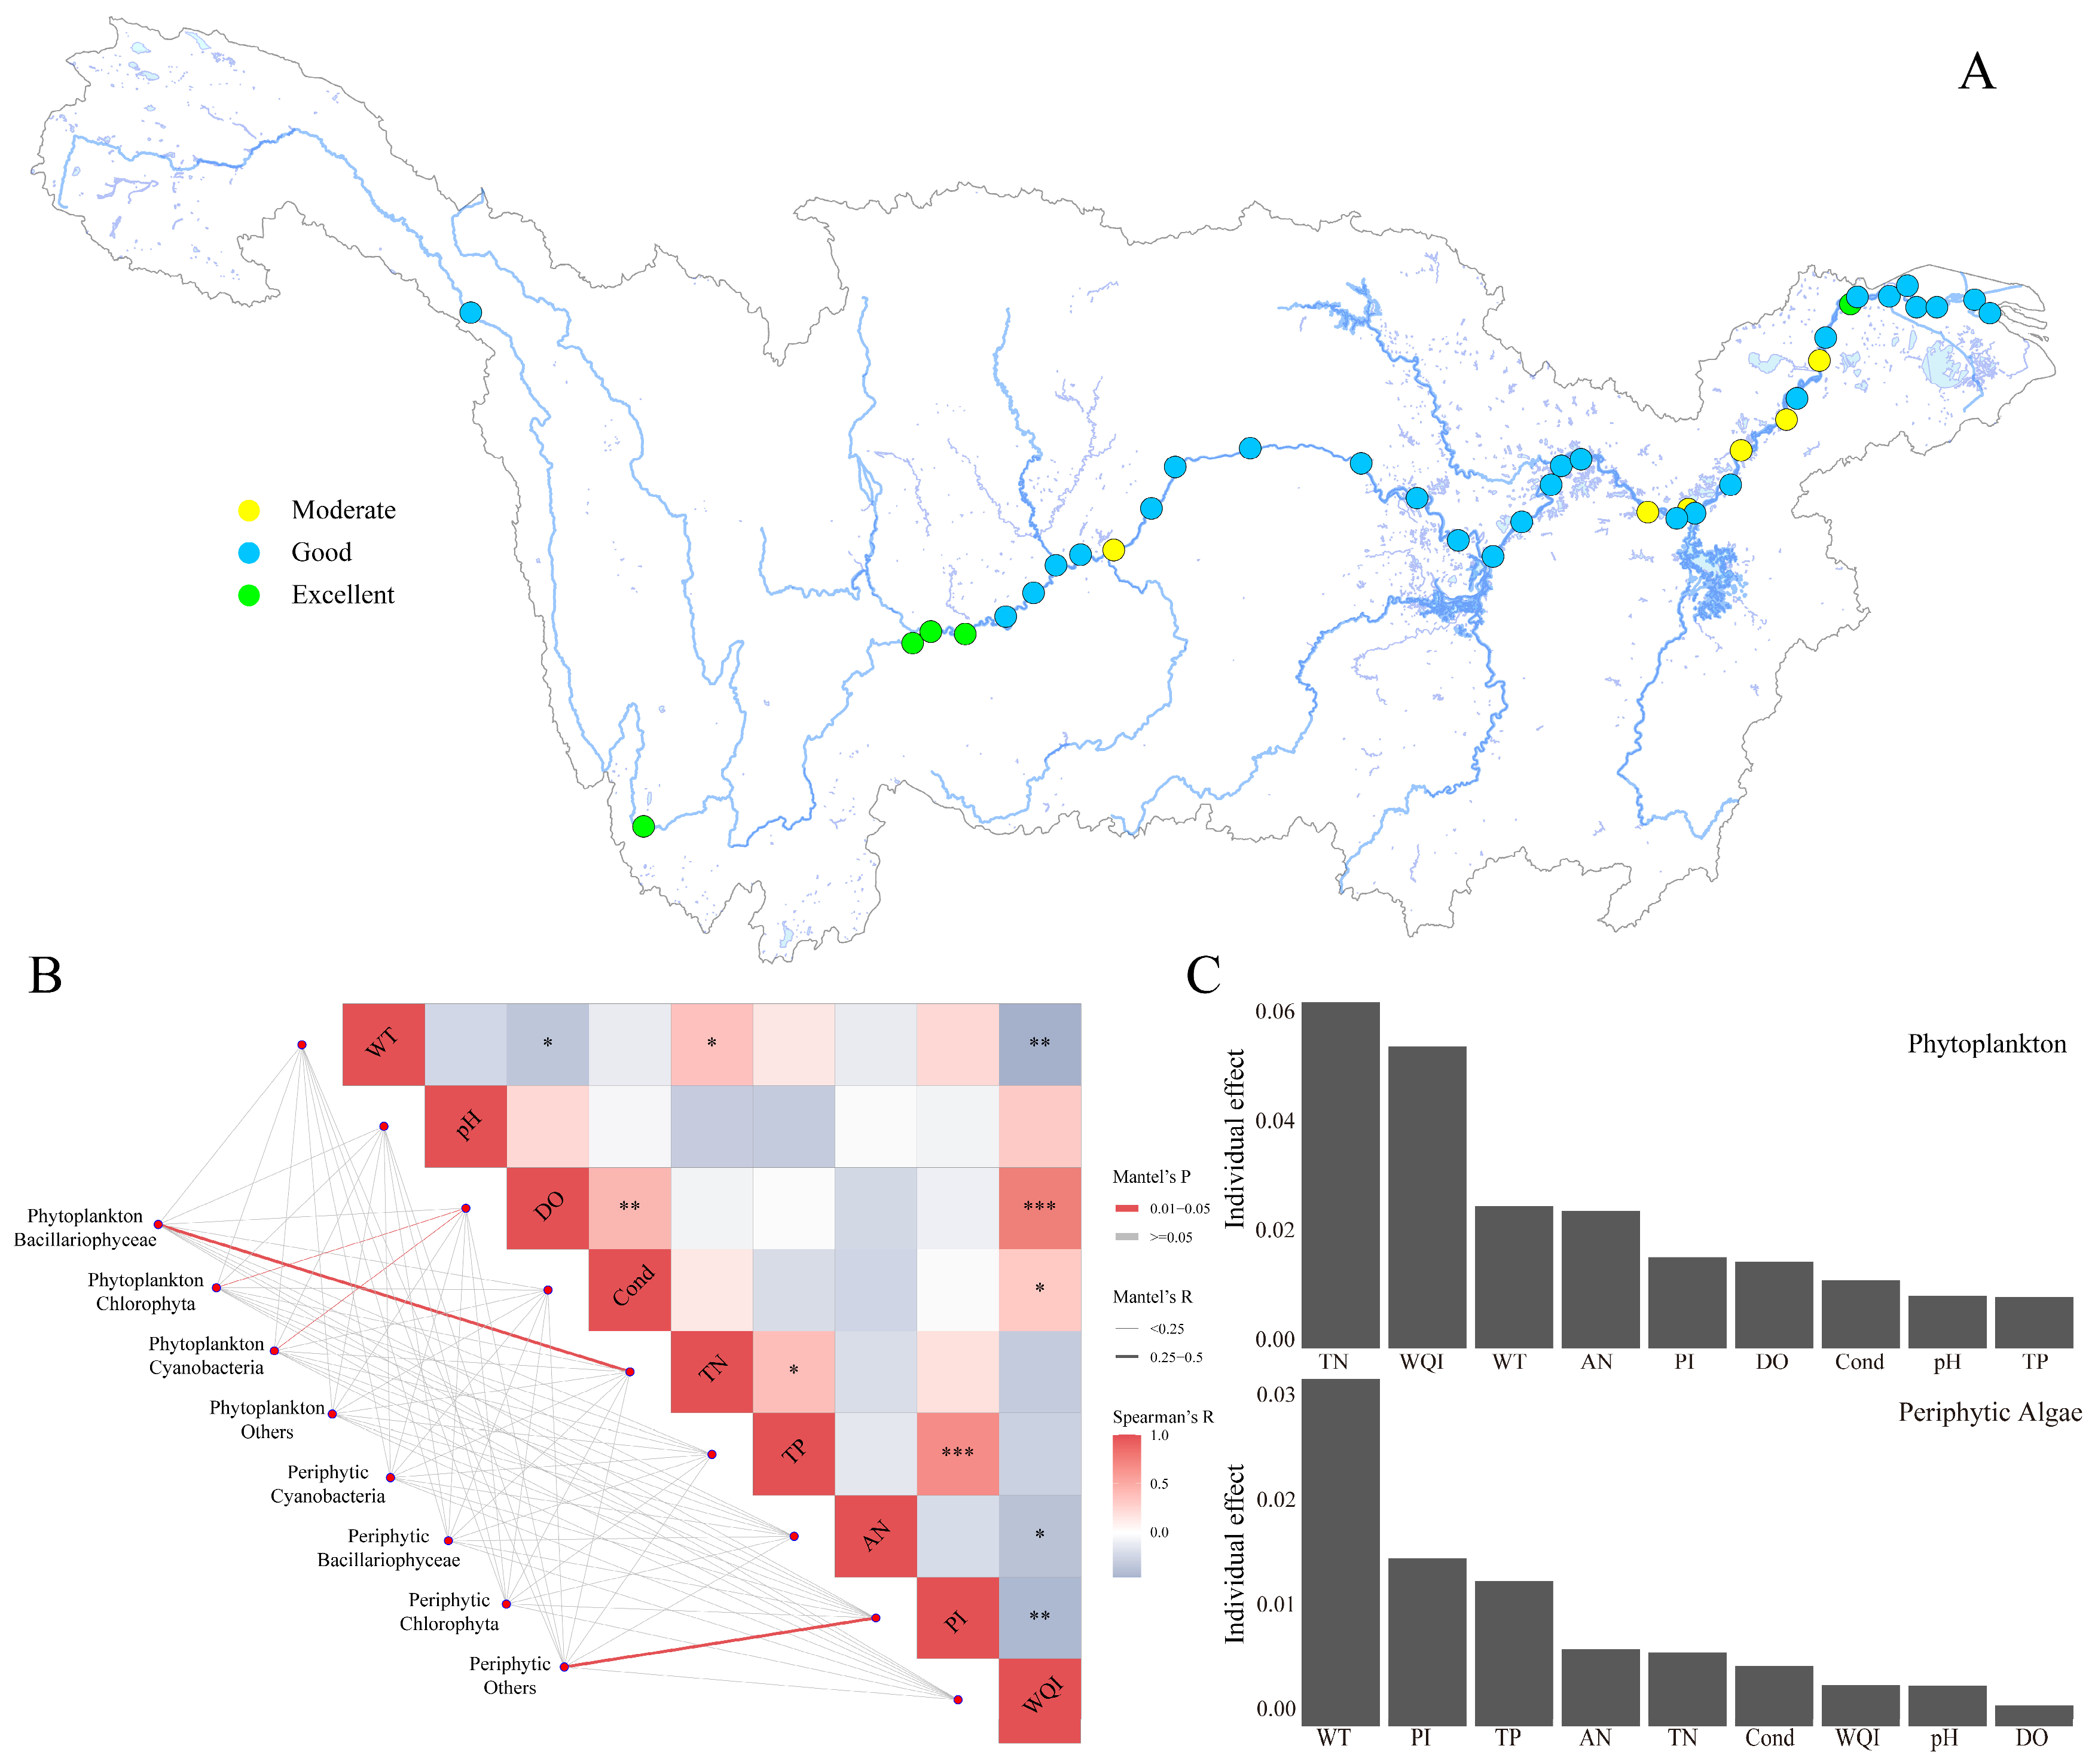
The integrated assessment included only sites with the complete set of required water-quality and algal indicators. A comprehensive assessment of aquatic ecology was conducted using TN, TP, AN, PI, and WQI, as well as the Shannon–Wiener index, Pielou index, Margalef index, and density of phytoplankton and periphyton. The results revealed that 13% of the sites were rated as “excellent,” 72% as “good,” and 15% as “moderate” (Figure 7A).
Figure 7.
(A) Comprehensive ecological assessment results at each site along the mainstream of the Yangtze River. Green dots represent excellent grade, blue dots represent good grade, and yellow dots represent moderate grade. (B) Mantel test showing the relationships between water-quality factors and the community composition (density variations) of major phytoplankton and periphyton phyla. Line colors represent Mantel’s p-values, with red lines indicating significant correlations (p < 0.05); line thickness corresponds to the magnitude of Mantel’s R correlation coefficients. Colored squares represent pairwise Spearman correlation coefficients among water-quality variables. Asterisks denote significance levels (* p < 0.05, ** p < 0.01, *** p < 0.001). (C) Hierarchical partitioning analysis showing the individual explanatory contributions of different water-quality variables to the community composition (density variations) of phytoplankton and periphyton.
Spatially, “good”-rated sites were widely distributed across the Yangtze River mainstream, whereas “excellent”-rated sites were predominantly located in the upper reaches and the Jinsha River region. In contrast, “moderate”-rated sites, which accounted for a certain proportion of all sites, were situated mainly in the lower reaches. These findings indicate that the overall aquatic ecological conditions of the Yangtze River mainstream area are relatively favorable, with most sites achieving a “good” or higher rating. However, the presence of “moderate”-rated sites highlights the spatial heterogeneity in aquatic ecology, suggesting that further improvements are needed in the lower reaches to enhance the overall ecological status of the region.
Mantel tests were conducted to analyze the correlations between different algal phyla of phytoplankton and periphyton and water quality factors (Figure 7B). The results revealed distinct relationships. Bacillariophyceae in phytoplankton were significantly positively correlated with TN, whereas Chlorophyta and cyanobacteria were significantly positively correlated with DO. For periphyton, algae other than cyanobacteria and Bacillariophyceae were significantly positively correlated with the PI. Moreover, TN, TP, AN, and PI were negatively correlated with the WQI, with AN and PI showing significant correlations, indicating that increases in these indicators could lead to water quality deterioration.
Hierarchical partitioning was employed to quantitatively assess the contributions of various water-quality factors to the community compositions of phytoplankton and periphyton (Figure 7C). For phytoplankton, TN contributed the most, followed by WQI, WT, AN, and others, in sequence. In contrast, for periphyton, WT made the greatest contribution, with PI and TP following closely. These results indicate that different water quality factors play distinct roles in shaping the community compositions of phytoplankton and periphyton. Specifically, TN is a primary influencing factor for phytoplankton, whereas WT is crucial for periphyton.
4. Discussion
4.1. Temporospatial Water Quality Trends and Management Implications
The temporal trends of the water quality indicators (Figure 1B and Figure S2) revealed significant declines in TN, TP, AN and PI over time. The remarkable improvement in the water quality of the Yangtze River mainstream in recent years can be attributed to a series of systematic policies and comprehensive governance measures implemented by the Chinese government. In 2016, the Development Plan Outline for the Yangtze River Economic Belt was issued, which for the first time proposed the strategic guideline of “jointly promoting large-scale protection and refraining from large-scale development.” This guideline emphasized the prioritization of water resource conservation and ecological restoration [22]. Subsequently, the Plan for the Prevention and Control of Water Pollution in Key River Basins (2016–2020) further specified pollution control targets for industrial, agricultural, and urban sources, thereby promoting coordinated basin-wide governance [23].
The formal implementation of the Yangtze River Protection Law of the People’s Republic of China in 2021 marked a pivotal milestone. As the first specialized legislation for a river basin in China, this law legally reinforced the red lines for water resource utilization, the pollutant discharge permit system, and the ecological compensation mechanism, thereby ushering in a new era of legalized Yangtze River governance [24]. To effectively implement these policy objectives, a series of targeted actions were initiated. For example, the Action Plan for Tackling Key Battles in the Protection and Restoration of the Yangtze River, launched in 2018, carried out special rectification efforts targeting pollution outlets, industrial parks, and drinking water sources [25]. The comprehensive implementation of the River Chief System, which integrated water environment governance responsibilities into the assessment and promotion system of local officials, significantly enhanced the efficiency of water pollution control [26]. The increasing trend in the WQI further corroborates the overall improvement in water quality, which is essential for maintaining the health of aquatic ecosystems.
Spatially, the results (Figure 2A) highlight the distinct water quality characteristics across different regions. The excellent water quality in the Jinsha River area, characterized by a high WQI and low levels of TP, TN, AN and PI, can likely be attributed to its relatively pristine environment and limited human activities. Specifically, the region has experienced sparse industrial development and low population density. In contrast, the inferior water quality in the downstream regions can be predominantly attributed to the intensification of human activities, including industrial production, urbanization, and agricultural runoff, all of which contribute to elevated pollutant loads [27,28]. The gradient-change pattern across provinces (Figure 2B) further corroborates this assertion. The increases in TP, TN, AN, and PI from upstream to downstream indicate that regions in the lower reaches face more substantial challenges in water quality management, which is attributed to the cumulative effects of anthropogenic activities rather than to longitude as a causal factor [1,27]. This spatial pattern underscores the necessity of implementing targeted water quality management strategies, particularly stringent regulations and enhanced pollution control measures in downstream regions.
In summary, our findings offer a comprehensive understanding of the temporal and spatial variation trends of water quality indicators in the mainstream Yangtze River. The improvements observed in the temporal trends underscore the success of environmental policies, whereas the spatial disparities emphasize the need for region-specific management approaches. These results not only contribute to a broader understanding of the dynamic changes in river ecosystems but also provide critical insights for the sustainable management of water resources in the mainstream Yangtze River.
4.2. Algal Diversity and Its Ecological Evaluation
The spatial distribution patterns and diversity characteristics of phytoplankton and periphyton reveal differential response mechanisms of algal communities to environmental gradients in different regions of the Yangtze River mainstream. Phytoplankton density gradually increased from the upstream region to the downstream region (Figure 3A), with significantly greater proportions of cyanobacteria and Chlorophyta in the middle and lower reaches, which was closely related to their strong adaptability to eutrophic environments (Figure 3B). This trend aligns with the increasing concentrations of TN, TP, and AN from upstream to downstream, indicating that nutrient enrichment is a key driver of changes in the phytoplankton community structure [29]. In contrast, the periphyton density peaked in the middle reaches (1.76 × 10⁸ cells/cm2), which was significantly greater than that in the upstream and downstream areas (Figure 5A). It should be noted, however, that the peak density in the middle reaches cannot be fully explained by nutrient levels alone, since TN, TP, and AN concentrations in this region are not the highest along the mainstream (Figure 2). Instead, the reduced flow velocity, increased channel stability, and abundant hard substrates (e.g., gravel and cobbles) in the middle reaches likely play a more critical role in promoting periphyton attachment and accumulation, highlighting the importance of hydrodynamic and geomorphic factors for benthic algal communities [30].
In terms of diversity indices, the two algal groups presented distinct regional characteristics: the Margalef richness index of phytoplankton was highest in the downstream region, suggesting that the complex habitat and resource diversity in this area support the coexistence of more species. In contrast, the Shannon–Wiener index and Pielou evenness index of periphyton were significantly greater in the Jinsha River region than in other areas (Figure 5C), indicating greater species evenness and stability of periphytic algal communities in pristine upstream habitats, which may be directly related to lower human disturbance and cleaner water quality (e.g., low PI and TN) [31,32]. The decline in periphyton diversity in the middle and lower reaches may be associated with the overgrowth of dominant species (e.g., cyanobacteria) due to excessive nutrients, which suppress the growth of other taxa.
These results suggest that algal biodiversity indices can serve as comprehensive ecological indicators for assessing waterbody ecological status [33]. The ecological assessment results further highlighted regional disparities between the two algal groups: phytoplankton were rated “excellent” at 76.4% of the monitoring sites (Figure 4B), reflecting a stable overall community structure with minimal pollution stress. In contrast, only 18% of the periphyton sites received an “excellent” rating, with no such ratings in the middle reaches (Figure 6B), indicating that periphyton are more sensitive to regional environmental changes [11]. The combined environmental impacts in the middle and lower reaches may lead to simplified community structures. Notably, the adaptive differentiation of dominant taxa (e.g., Bacillariophyceae in phytoplankton and cyanobacteria in periphyton) across regions suggests distinct roles in material cycling and energy flow, such as the efficient utilization of oligotrophic upstream environments by Bacillariophyceae [9,34] and the rapid response of cyanobacteria to eutrophic conditions in the middle and lower reaches [35,36].
The spatial heterogeneity of algal diversity and ecological assessment results arises from the combined effects of regional environmental factors (nutrient levels, hydrodynamic conditions, and human activities) and biological adaptability. Although phytoplankton communities generally appear healthy, the “moderate” and “poor” ratings for periphyton in the middle and lower reaches indicate potential environmental degradation risks in these regions, which warrants attention.
4.3. Driving Mechanism of Comprehensive Ecological Assessment
Several studies have demonstrated that both ecological status and water quality are integral components of aquatic ecosystems. Only by integrating the results of these two aspects can a more comprehensive evaluation of the status of aquatic ecosystems be achieved. The random forest algorithm, an algorithm in machine learning, is a more objective approach that is less prone to overfitting, even when dealing with many variables. This method has been widely applied in hydrology, aquatic ecology, and environmental remote sensing to predict various variables that are difficult to forecast via traditional statistical methods [37,38]. Therefore, in this study, we employed the random forest method to integrate and evaluate both the ecological and water quality indicators. The comprehensive ecological assessment of the Yangtze River mainstream, which integrated water quality chemical indicators (TN, TP, AN, PI, WQI) with the diversity and density parameters of phytoplankton and periphyton, revealed significant spatial heterogeneity and driving mechanisms (Figure 7A). Approximately 72% of the monitoring sites were rated “good” or higher (13% “excellent”), indicating a generally favorable aquatic ecological status, which is closely associated with the effectiveness of pollution control measures in the basin [23]. However, 15% of the “moderate” sites concentrated in the downstream region reflect ecological stress caused by nutrient enrichment (e.g., elevated TN, TP, and AN concentrations) [39], potentially leading to imbalances in the algal community structure (e.g., reduced periphyton diversity). Spatially, “excellent” sites were primarily distributed in the upstream and Jinsha River regions, benefiting from low human disturbance, high water transparency, and stable habitats. This ecological consistency with the high diversity indices of periphyton in these areas (Figure 5C) underscores the importance of protecting headwater regions.
The Yangtze River spans approximately 6300 km and flows eastward from the Qinghai–Tibet Plateau through 11 provinces and cities before emptying into the ocean. Along this downstream gradient, anthropogenic activities increase progressively, creating distinct ecological and water quality characteristics in different regions, resulting in various key environmental factors influencing phytoplankton communities [40]. Mantel tests revealed specific correlations between algal taxa and water quality factors (Figure 7B). Among the phytoplankton, Bacillariophyceae was significantly positively correlated with TN, a key nutrient for algal growth whose concentration dynamics drive changes in community structure and contribute to eutrophication [41]. Cyanobacteria and Chlorophyta are positively correlated with DO, as their metabolic activities (photosynthesis and respiration) directly influence oxygen levels [42]. For periphyton, taxa other than cyanobacteria and Bacillariophyceae were positively correlated with the PI, suggesting tolerance to organic pollution. The negative correlations between TN, TP, AN, and WQI (notably AN and PI) confirm that nitrogen and phosphorus accumulation is a core driver of ecological degradation, aligning with the observed “high density, low diversity” pattern of periphyton in the middle and lower reaches—excessive nutrients enable dominant species to monopolize resources, suppressing community diversity.
Hierarchical partitioning analysis quantified the differential impacts of water quality factors on algal communities (Figure 7C): TN emerged as the primary driver of phytoplankton community composition, reflecting their high nitrogen dependence [41]. Periphyton responded most strongly to WT, likely because their attachment-dependent growth is relatively sensitive to microhabitat conditions (e.g., temperature and light), which directly regulate metabolic processes [11]. This prominent role of WT is likely attributable to the shallow-water sampling protocol (0.3 m depth), where solar radiation causes rapid and pronounced diel and seasonal thermal fluctuations. Such high thermal variability in the littoral zone exerts strong selective pressure on attached algae, regulating their metabolic rates, nutrient assimilation efficiency, and species-specific thermal optima [43,44]. TP and PI contributed secondarily to periphyton dynamics, explaining the peak densities in the middle reaches—the optimal temperature, phosphorus availability, and stable substrates synergistically promoted proliferation.
These findings provide a scientific basis for basin management: maintaining ecological integrity in the upstream and Jinsha River regions requires strict control of human activities; the middle and lower reaches should prioritize advanced nitrogen and phosphorus treatment while considering the indirect impacts of temperature changes on periphyton. The incorporation of algal diversity indices into comprehensive assessments can sensitively reflect ecological health, particularly for long-term monitoring of “moderate” sites. In summary, spatial gradients in the ecological status of the Yangtze River arose from interactions among nutrients, temperature, and algal adaptability. Targeted management strategies focusing on key factors (water quality protection upstream and nutrient control downstream) are essential for holistic basin ecological optimization.
Although this study has provided a relatively systematic understanding of the spatial gradients in water quality and the responses of algal communities along the Yangtze River mainstream, certain limitations remain. In terms of pollution source apportionment, we did not further distinguish the relative contributions of point sources and diffuse sources to water quality across different river reaches and provinces. This is primarily because relevant high-resolution emission inventory data, land-use information, and discharge permit records are not readily available for comprehensive acquisition and integration at the basin scale. Future studies could combine pollution source census data, remotely sensed land-use types, and high-frequency online water quality monitoring data to attempt to quantify the proportional contributions of point and diffuse sources, thereby providing a more specific scientific basis for targeted pollution control and differentiated management strategies.
5. Conclusions
This study integrated water quality and algal community data to comprehensively assess the ecological status of the Yangtze River mainstream, uncovering its ecological features and underlying mechanisms. Water quality significantly improved with respect to TN, TP, AN, and PI, which was attributed to China’s environmental policies and governance. Spatially, the Jinsha River area had the best water quality, while downstream regions faced more challenges due to human activities. This spatial–temporal pattern guides region-specific water quality management.
The algal communities, including the phytoplankton and periphyton communities, had distinct spatial distributions. The phytoplankton density increased downstream, which was linked to nutrient enrichment, whereas the periphyton density peaked in the middle reaches. Their diversity indices varied regionally, with the downstream region having the highest phytoplankton species richness and the Jinsha River region having the most stable periphytic algal community. Algal biodiversity indices can reflect water body ecological status, and periphyton are more sensitive to environmental changes. The comprehensive ecological assessment indicated that most of the Yangtze River mainstream area had a favorable ecological status, but “moderate”—rated sites downstream signal potential risks. Mantel tests and hierarchical partitioning analysis identified key water quality factors: TN for phytoplankton and WT for periphyton.
In summary, this study enhances our understanding of the ecology of the Yangtze River. To improve its ecological environment, strict protection upstream, especially in the Jinsha River area, and advanced nitrogen and phosphorus treatment in the middle and lower reaches are essential. Monitoring algal diversity indices can help detect ecological issues, providing a basis for sustainable Yangtze River Basin management.
Supplementary Materials
The following supporting information can be downloaded at https://www.mdpi.com/article/10.3390/d18090573/s1, Figure S1. Algal survey sites along the Yangtze River main stream. Blue indicates Jinsha River sites, green for upstream sites, orange for midstream sites, and red for downstream sites. Triangles represent periphyton survey sites, while circles represent phytoplankton survey sites. The color gradient from red to green shows the elevation gradient from low to high across the Yangtze River Basin. Figure S2. Time series decomposition of water quality indicators. The mean values of water quality indicators from all main stream sites were used. The time series decomposition is shown as: the first row represents the raw data, the second row the seasonal trend, the third row the long-term trend, and the fourth row the residuals. Figure S3. Time series decomposition of the Water Quality Index (WQI). The mean values of WQI from all main stream sites were used. The time series decomposition is shown as: the first row represents the raw data, the second row the seasonal trend, the third row the long-term trend, and the fourth row the residuals. Figure S4. Violin plots showing the distribution of the WQI index across different years. Rank-sum tests were used for comparisons between groups, with significance levels indicated as * p < 0.05, ** p < 0.01, *** p < 0.001, and NS.: Not Significant. Figure S5. Violin plots showing the distribution of the WQI index across different provinces. Provinces are sorted from left to right according to the order from the source to the estuary of the Yangtze River. Table S1. Phytoplankton sampling sites: longitude, latitude, province, and river reach. Table S2. Periphyton sampling sites: longitude, latitude, province, and river reach.
Author Contributions
Study design: Z.Z.; data collection: J.Z., W.L., T.L., S.P., Y.W. and Z.Z.; data tabulation: J.Z. and Z.Z.; data analysis: J.Z. and Z.Z.; manuscript writing: J.Z. and Z.Z.; supervision and validation of manuscript and project: J.Z., W.L., T.L., S.P., Y.W. and Z.Z. All authors have read and agreed to the published version of the manuscript.
Funding
This research was funded by Science and Technology Major Project of Hubei Province, China (2023BCA003).
Data Availability Statement
The data are available from the corresponding author upon reasonable request.
Acknowledgments
We reserve our final and most profound acknowledgment for Hu Yuxin. His intellectual stewardship permeated every facet of this investigation—from hypothesis formulation, sample acquisition, and rigorous data interrogation, to the final drafting and repeated enhancement of the text. It is no exaggeration to state that the successful completion of this work is inseparably tied to his relentless encouragement and incisive critiques throughout the entire research cycle. We extend our utmost respect and gratitude to him.
Conflicts of Interest
Author Yajie Wu was employed by the company Huaneng Lancang River Hydropower Co., Ltd. The remaining authors declare that the research was conducted in the absence of any commercial or financial relationships that could be construed as a potential conflict of interest.
References
- Hu, Y.; Zhang, J.; Wang, Y.; Hu, S. Distinct Mechanisms Shape Prokaryotic Community Assembly across Different Land-Use Intensification. Water Res. 2023, 245, 120601. [Google Scholar] [CrossRef] [Scilit]
- Ji, K.; Li, W.; Hao, X.; Ouyang, W.; Zhang, Y. Transport Dynamics of Watershed Discharged Diffuse Phosphorus Pollution Load to the Lake in Middle of Yangtze River Basin. Environ. Pollut. 2024, 344, 123221. [Google Scholar] [CrossRef] [Scilit]
- Wu, W.; Wang, J.; Wang, H.; Liu, J.; Yao, Q.; Yu, Z.; Ran, X. Trends in Nutrients in the Changjiang River. Sci. Total Environ. 2023, 872, 162268. [Google Scholar] [CrossRef] [Scilit]
- Cui, M.; Guo, Q.; Wei, R.; Tian, L. Human-Driven Spatiotemporal Distribution of Phosphorus Flux in the Environment of a Mega River Basin. Sci. Total Environ. 2021, 752, 141781. [Google Scholar] [CrossRef] [Scilit]
- Hu, Y.; Su, H.; Song, H.; Xiong, Q.; Zhou, Z.; Huang, B.; Wang, X.; Xiao, N.; Yu, M. Synergistic Impacts of Anthropogenic and Climatic Drivers on Total Phosphorus Dynamics in a Mega River Basin. Environ. Technol. Innov. 2025, 39, 104259. [Google Scholar] [CrossRef] [Scilit]
- Li, Y.; Mi, W.; Ji, L.; He, Q.; Yang, P.; Xie, S.; Bi, Y. Urbanization and Agriculture Intensification Jointly Enlarge the Spatial Inequality of River Water Quality. Sci. Total Environ. 2023, 878, 162559. [Google Scholar] [CrossRef] [Scilit]
- Jiang, Z.; Liu, J.; Chen, J.; Chen, Q.; Yan, X.; Xuan, J.; Zeng, J. Responses of Summer Phytoplankton Community to Drastic Environmental Changes in the Changjiang (Yangtze River) Estuary during the Past 50 Years. Water Res. 2014, 54, 1–11. [Google Scholar] [CrossRef] [Scilit]
- Lu, H.; Feng, Y.; Wang, J.; Wu, Y.; Shao, H.; Yang, L. Responses of Periphyton Morphology, Structure, and Function to Extreme Nutrient Loading. Environ. Pollut. 2016, 214, 878–884. [Google Scholar] [CrossRef] [Scilit]
- Han, X.; Pan, B.; Zhao, G.; Li, D.; Sun, H.; Zhu, P.; Lu, Y. Local and Geographical Factors Jointly Drive Elevational Patterns of Phytoplankton in the Source Region of the Yangtze River, China. River Res. Appl. 2021, 37, 1145–1155. [Google Scholar] [CrossRef] [Scilit]
- Liu, Y.; Xu, X.; Wang, T.; Ni, J. Microscopic View of Phytoplankton along the Yangtze River. Sci. China Technol. Sci. 2019, 62, 1873–1884. [Google Scholar] [CrossRef] [Scilit]
- Hu, Y.; Zhang, J.; Huang, J.; Hu, S. Environmental Drivers and Aquatic Ecosystem Assessment of Periphytic Algae at Inflow Rivers in Six Lakes over the Yangtze River Basin. Water 2022, 14, 2184. [Google Scholar] [CrossRef] [Scilit]
- Stevenson, J. Ecological Assessments with Algae: A Review and Synthesis. J. Phycol. 2014, 50, 437–461. [Google Scholar] [CrossRef] [Scilit]
- Borics, G.; Görgényi, J.; Grigorszky, I.; László-Nagy, Z.; Tóthmérész, B.; Krasznai, E.; Várbíró, G. The Role of Phytoplankton Diversity Metrics in Shallow Lake and River Quality Assessment. Ecol. Indic. 2014, 45, 28–36. [Google Scholar] [CrossRef] [Scilit]
- Editorial Committee of ‘Water and Wastewater Monitoring and Analysis Methods’, State Environmental Protection Administration. Water and Wastewater Monitoring and Analysis Standard Methods; Editorial Committee of ‘Water and Wastewater Monitoring and Analysis Methods’, State Environmental Protection Administration: Beijing, China, 2002; ISBN 978-7-80163-400-9-01.
- Hu, H.; Wei, Y. The Freshwater Algae of China: Systematics, Taxonomy and Ecology; Science Press: Beijing, China, 2006. [Google Scholar]
- Lee, R.E. Phycology; Cambridge University Press: Cambridge, UK, 2018. [Google Scholar]
- Wehr, J.D.; Sheath, R.G.; Kociolek, J.P. Freshwater Algae of North America: Ecology and Classification; Elsevier: Amsterdam, The Netherlands, 2015. [Google Scholar]
- Pesce, S.F.; Wunderlin, D.A. Use of Water Quality Indices to Verify the Impact of Córdoba City (Argentina) on Suquía River. Water Res. 2000, 34, 2915–2926. [Google Scholar] [CrossRef] [Scilit]
- Ren, L.; Zhang, Z.; Zeng, X.; Ma, Y.; Zeng, Y.; Zhou, C. Community Structure of Zooplankton and Water Quality Assessment of Jialing River in Nan Chong. Procedia Environ. Sci. 2011, 10, 1321–1326. [Google Scholar] [CrossRef] [Scilit]
- HJ 1098–2020; Technical Specifications for Remote Sensing and Ground Monitoring Evaluation of Algal Blooms. Ministry of Ecology and Environment of the People’s Republic of China: Beijing, China, 2020.
- GB 3838–2002; Environmental Quality Standards for Surface Water. State Environmental Protection Administration of China and General Administration of Quality Supervision, Inspection and Quarantine: Beijing, China, 2002.
- Wu, J.; Sun, W. Regional Integration and Sustainable Development in the Yangtze River Delta, China: Towards a Conceptual Framework and Research Agenda. Land 2023, 12, 470. [Google Scholar] [CrossRef] [Scilit]
- Wu, J.; Chang, I.-S. Environmental Management in China: Policies and Institutions; Springer: Singapore, 2020. [Google Scholar]
- Qiu, Q.; Dai, L.; Van Rijswick, H.F.; Tu, G. Improving the Water Quality Monitoring System in the Yangtze River Basin—Legal Suggestions to the Implementation of the Yangtze River Protection Law. Laws 2021, 10, 25. [Google Scholar] [CrossRef] [Scilit]
- Jinnan, W.; Hongliang, S.; Yue, Z.; Yanxue, X.; Bingchao, Y.; Jingjing, Y. Fighting against the Battle of Protection and Restoration of the Yangtze River Basin to Start a New Chapter of Ecological-Oriented and Green Development. J. Environ. Eng. Technol. 2022, 12, 329–335. [Google Scholar]
- Yang, C.; Song, T. River Chief Governance in China: Trends and Outlooks. Front. Environ. Sci. 2024, 12, 1396196. [Google Scholar] [CrossRef] [Scilit]
- Xie, Z.; Du, Y.; Zeng, Y.; Yan, M.; Zhu, C. Accelerated Human Activities Affecting the Spatial Pattern of Temperature in the Yangtze River Delta. Quat. Int. 2010, 226, 112–121. [Google Scholar] [CrossRef] [Scilit]
- Yin, S.; Yi, Y.; Liu, Q.; Luo, Q.; Chen, K. A Review on Effects of Human Activities on Aquatic Organisms in the Yangtze River Basin since the 1950s. River 2022, 1, 104–119. [Google Scholar] [CrossRef] [Scilit]
- Jia, J.; Gao, Y.; Wang, S.; Wu, F.; Lu, Y.; Ha, X. Feedbacks between Phytoplankton and Global Changes in a Riverine Source-Mainstem-Estuary Continuum. Water Res. 2025, 268, 122746. [Google Scholar] [CrossRef] [Scilit]
- Horner, R.R.; Welch, E. Stream Periphyton Development in Relation to Current Velocity and Nutrients. Can. J. Fish. Aquat. Sci. 1981, 38, 449–457. [Google Scholar] [CrossRef] [Scilit]
- Filstrup, C.T.; Hillebrand, H.; Heathcote, A.J.; Harpole, W.S.; Downing, J.A. Cyanobacteria Dominance Influences Resource Use Efficiency and Community Turnover in Phytoplankton and Zooplankton Communities. Ecol. Lett. 2014, 17, 464–474. [Google Scholar] [CrossRef] [Scilit]
- Hu, Y.; Liu, X.; Xing, W.; Hu, Z.; Liu, G. Marker Gene Analysis Reveals the Spatial and Seasonal Variations in the Eukaryotic Phytoplankton Community Composition in the Yangtze River, Three Gorges Reservoir, China. J. Plankton Res. 2019, 41, 835–848. [Google Scholar] [CrossRef] [Scilit]
- Yang, B.; Jiang, Y.-J.; He, W.; Liu, W.-X.; Kong, X.-Z.; Jørgensen, S.E.; Xu, F.-L. The Tempo-Spatial Variations of Phytoplankton Diversities and Their Correlation with Trophic State Levels in a Large Eutrophic Chinese Lake. Ecol. Indic. 2016, 66, 153–162. [Google Scholar] [CrossRef] [Scilit]
- Carapunarla, L.; Baumgartner, D.; Rodrigues, L. Community Structure of Periphytic Algae in a Floodplain Lake: A Long-Term Study. Acta Sci. Biol. Sci. 2014, 36, 147–154. [Google Scholar] [CrossRef] [Scilit]
- Xu, H.; Qin, B.; Paerl, H.W.; Peng, K.; Zhang, Q.; Zhu, G.; Zhang, Y. Environmental Controls of Harmful Cyanobacterial Blooms in Chinese Inland Waters. Harmful Algae 2021, 110, 102127, Corrigendum to Harmful Algae 2022, 113, 102190. [Google Scholar] [CrossRef] [Scilit]
- Zong, J.-M.; Wang, X.-X.; Zhong, Q.-Y.; Xiao, X.-M.; Ma, J.; Zhao, B. Increasing Outbreak of Cyanobacterial Blooms in Large Lakes and Reservoirs under Pressures from Climate Change and Anthropogenic Interferences in the Middle–Lower Yangtze River Basin. Remote Sens. 2019, 11, 1754. [Google Scholar] [CrossRef] [Scilit]
- Woo, S.Y.; Jung, C.G.; Lee, J.W.; Kim, S.J. Evaluation of Watershed Scale Aquatic Ecosystem Health by SWAT Modeling and Random Forest Technique. Sustainability 2019, 11, 3397. [Google Scholar] [CrossRef] [Scilit]
- Zhang, J.; Zhi, M.; Zhang, Y. Combined Generalized Additive Model and Random Forest to Evaluate the Influence of Environmental Factors on Phytoplankton Biomass in a Large Eutrophic Lake. Ecol. Indic. 2021, 130, 108082. [Google Scholar] [CrossRef] [Scilit]
- Chen, S.; He, L.; Lin, L.; Fang, D.; Zhang, F. Change Trends of Surface Water Quality in the Mainstream of the Yangtze River during the Past Four Decades. Res. Environ. Sci. 2020, 33, 1119–1128. [Google Scholar]
- Zhang, S.; Xu, H.; Zhang, Y.; Li, Y.; Wei, J.; Pei, H. Variation of Phytoplankton Communities and Their Driving Factors along a Disturbed Temperate River-to-Sea Ecosystem. Ecol. Indic. 2020, 118, 106776. [Google Scholar] [CrossRef] [Scilit]
- Zhou, M.; Shen, Z.; Yu, R. Responses of a Coastal Phytoplankton Community to Increased Nutrient Input from the Changjiang (Yangtze) River. Cont. Shelf Res. 2008, 28, 1483–1489. [Google Scholar] [CrossRef] [Scilit]
- Hu, Y.-X.; Cao, L.; Qu, R.-C.; Huang, J.; Hu, S.; Zhou, Z.; Wang, Y.-C.; Zhang, J. Community Composition and Assessment of the Aquatic Ecosystem of Periphytic Algae in the Yangtze River Basin. Environ. Sci. 2022, 43, 3998–4007. [Google Scholar] [CrossRef] [Scilit]
- Mahdy, A.; Hilt, S.; Filiz, N.; Beklioğlu, M.; Hejzlar, J.; Özkundakci, D.; Papastergiadou, E.; Scharfenberger, U.; Šorf, M.; Stefanidis, K.; et al. Effects of Water Temperature on Summer Periphyton Biomass in Shallow Lakes: A Pan-European Mesocosm Experiment. Aquat. Sci. 2015, 77, 499–510. [Google Scholar] [CrossRef] [Scilit]
- Tang, X.; He, H.; Qin, Q.; Xu, F.; Liu, F.; Zhang, F. Seasonal Variation in the β-Diversity of Periphytic Algae and Its Response to Landscape Patterns in the Chishui River, a Naturally Flowing Tributary of the Upper Yangtze River. Ecol. Evol. 2025, 15, e70976. [Google Scholar] [CrossRef] [Scilit]
Disclaimer/Publisher’s Note: The statements, opinions and data contained in all publications are solely those of the individual author(s) and contributor(s) and not of MDPI and/or the editor(s). MDPI and/or the editor(s) disclaim responsibility for any injury to people or property resulting from any ideas, methods, instructions or products referred to in the content. |
© 2026 by the authors. Licensee MDPI, Basel, Switzerland. This article is an open access article distributed under the terms and conditions of the Creative Commons Attribution (CC BY) license.